phase transitions and interrelated instabilities in pbhfo3 single crystals
TRANSCRIPT

This content has been downloaded from IOPscience. Please scroll down to see the full text.
Download details:
IP Address: 210.115.228.234
This content was downloaded on 25/02/2015 at 02:23
Please note that terms and conditions apply.
Phase transitions and interrelated instabilities in PbHfO3 single crystals
View the table of contents for this issue, or go to the journal homepage for more
2015 J. Phys.: Condens. Matter 27 105901
(http://iopscience.iop.org/0953-8984/27/10/105901)
Home Search Collections Journals About Contact us My IOPscience
Journal of Physics: Condensed Matter
J. Phys.: Condens. Matter 27 (2015) 105901 (12pp) doi:10.1088/0953-8984/27/10/105901
Phase transitions and interrelatedinstabilities in PbHfO3 single crystals
Annette Bussmann-Holder1, Tae Hyun Kim2, Byoung Wan Lee2,Jae-Hyeon Ko2, Andrzej Majchrowski3, Andrzej Soszynski4 andKrystian Roleder4
1 Max-Planck-Institut fur Festkorperforschung, Heisenbergstr. 1, D-70569 Stuttgart, Germany2 Department of Physics, Hallym University, Chuncheon, Gangwondo 200-702, Korea3 Institute of Applied Physics, Military University of Technology, ul. Kaliskiego 2, 00-908 Warsaw,Poland4 Institute of Physics, University of Silesia, ulica Uniwersytecka 4, PL-40-007 Katowice, Poland
E-mail: [email protected], [email protected] and [email protected]
Received 7 October 2014, revised 27 January 2015Accepted for publication 3 February 2015Published 24 February 2015
AbstractPbHfO3 is investigated theoretically and experimentally with respect to possible precursoreffects starting in the paraelectric phase far above the cubic to tetragonal phase transitiontemperature. The theoretical modeling within the polarizability model predicts a giant softnessof the system with spatially large polar and antiferrodistortive domain formation whichcompete with each other. These predictions are substantiated by the experiments, where thesoftness and the precursor effects are confirmed by birefringence, dielectric permittivitymeasurements and elastic properties by Brillouin scattering. The intermediate phase is foundto have the polar nature confirmed by P –E hysteresis loop measurements, which is anothermanifestation of the competition between interrelated instabilities, namely a polar one and anantiferroelectric one.
Keywords: antiferroelectric, PbHfO3, precursor effect, perovskite, phase transition
(Some figures may appear in colour only in the online journal)
1. Introduction
Renewed interests in the antiferroelectric perovskite oxidesare due to the high applicability of these systems in variousfields, as well as its relation to the fundamental physicsof phase transitions [1, 2]. The most intensively studiedantiferroelectric oxide may be the lead zirconate, PbZrO3,the lattice dynamics of which has recently been studiedintensively with respect to the nature of its antiferroelectricphase transition [3–6]. The interplay between the polar zone-center modes and antiferrodistortive zone-boundary modesduring the phase transition of PbZrO3 and the resulting latticeinstabilities along with incipient precursor phenomena havebeen discussed from different theoretical and experimentalpoints of view. These latest studies have given rise to newsurge of interest in this archetypical antiferroelectric material.
Another interesting antiferroelectric perovskite oxide islead hafnate, PbHfO3, which has, however, been studied much
less as compared to PbZrO3. Since its discovery in 1953 [7],there have been several investigations on this compound,for example, by dielectric spectroscopy [8, 9], Mossbauerspectroscopy [10], x-ray and neutron diffraction [11–18],Raman/Brillouin spectroscopy [19–21], acoustic emissionmeasurement [22], and heat capacity measurement [23].Crystallographic and dielectric studies suggested that,analogous to PbZrO3, the low-temperature phase of PbHfO3 isalso antiferroelectric with space group Pbam, where the cubichigh-temperature Pm3m structure changes at TC � 476 K totetragonal followed by a second transition at ∼433 K to anorthorhombic phase. However, the nature of the intermediatephase between the ferroelectric and antiferroelectric phases hasremained controversial. Pressure-dependent dielectric data onPbHfO3 showed that the intermediate phase may be split intotwo different phases [8].
The large dielectric constants observed in both PbZrO3
and PbHfO3 at the phase transition temperature [4, 8, 9] are
0953-8984/15/105901+12$33.00 1 © 2015 IOP Publishing Ltd Printed in the UK

J. Phys.: Condens. Matter 27 (2015) 105901 A Bussmann-Holder et al
reminiscent of a ferroelectric instability. Interestingly, avariety of recent data suggest the softening of a transverseoptic (TO) mode in PbZrO3 with decreasing temperature whichincreases below the phase transition temperature [24]. Eventhough complete softening has not been observed, these dataprovide a strong indication that some sort of polar order occursin this nominally antiferroelectric perovskite. In addition,lattice dynamic calculations evidenced that an incipient polarinstability exists in the paraelectric phase of PbZrO3 [3]. Inlatest experimental results, the origin of the antiferroelectricityof PbZrO3 has been attributed either to a single soft latticemode at the � point via the flexoelectric coupling effect [5] orto multiple soft-mode vibrations over a soft acoustic branch [6].
Besides of this already rather complex behavior, it hasbeen shown that the paraelectric-to-antiferroelectric phasetransition is preceded by precursor dynamics which set infar above the actual instability [3, 4] and become apparentthrough a central peak in the light scattering spectrum, finitebirefringence, and a finite piezoelectric coefficient above thestructural instability [4]. Since similar precursor effectshave been observed in other perovskites, ferroelectric andantiferrodistortive ones [25, 26], it is interesting to address thisissue in connection with PbHfO3 which is much less studiedthan PbTiO3 and PbZrO3. Especially the finding of similarprecursor dynamics in PbZrO3, as seen in [3, 4] and predictedto be universal and intrinsic to polar perovskites [25, 26], wouldestablish that antiferroelectric compounds may also follow thisuniversal behavior.
Our paper is organized in the following way: in thefirst paragraph we provide theoretically derived evidences forprecursor effects in PbHfO3 and show that dynamical polarand antiferrodistortive spatially limited regions coexist. Inthe following paragraphs, experimental details follow whichare discussed in the subsequent section. Finally the modelpredictions are compared with the experiment followed byconclusions.
2. Theoretical background
It is well established that the lattice dynamics of polarand antiferrodistortive perovskite oxides can be excellentlymodeled within the polarizability model [27–29] whereespecially temperature-dependent properties are in quantitativeagreement with experiment. The model is based onthe nonlinear polarizability of the oxygen ion [30] whichintroduces dynamical covalency between the transition metald and oxygen ion p electronic states. Small changes in theionic displacements are thus reflected in giant changes in theoxygen ion polarizability. In Pb-containing perovskites notonly the oxygen ion polarizability has to be taken into accountbut also the one of the Pb ions has to be included explicitly.This modifies the polarizability model Hamiltonian to
H = T + V + Vanh
T = 1
2
[ ∑i=1,2,n
Miu2in + meiv
2in
]
V = 1
2
[ ∑n
{f ′(u1n+1 − u1n)2 + f ′′(u2n+1 − u2n)
2
+f [(v1n+1 − v2n)2 + (v1n − v2n)
2]}]
Vanh = 1
2
[ ∑n
{g2(v1n − u1n)2 +
1
2g4(v1n − u1n)
4
+gx(v2n − u2n)2}
](1)
where Mi, mei are core and shell masses of ion i, uin, vintheirdisplacements in the nth cell, and f, f ′, f ′′, g2, gx the shell–shell, core–core and internal core–shell harmonic couplingconstants. g4 is the anharmonic core–shell coupling coefficientwhich accounts for the nonlinear polarizability of the oxygenion. Note that a two-sublattice approximation has beenchosen, where M1 refers to the HfO3 cluster mass and M2
represents the Pb mass. The relative core–shell displacementcoordinates win = vin − uin define effective polarizabilitiesof the two sublattices with the one at site M1being nonlinear.Using the adiabatic approximation the equations of motionare derived. In addition, the cubic term proportional to g4
is replaced by its cumulant: g4w41n = 3g4w1n
⟨(w1n)
2⟩T
,
where⟨(w1n)
2⟩T
= ∑q,j
�
2Mωq,jW 2
1 (q, j) coth(
�ωq,j
2kBT
)contains
the dynamical information through the momentum q andbranch j dependent eigenvalues ω and eigenvectors W .Defining gT = (g2 +3g4
⟨(w1n)
2⟩T) the temperature-dependent
dispersion curves of the lowest TO and acoustic modes arecalculated self-consistently. The results for PbHfO3 havebeen presented in our recent paper [31], where we showed thecalculated temperature dependence of the long-wavelength TOand zone-boundary-related transverse acoustic (TA) squaredfrequencies. While the zone-boundary TA mode exhibitedcomplete softening as expected for the antiferrodistortivetransition, the long-wavelength TO mode frequency alsoshowed pronounced softening, however remaining incomplete.
The softening of the TO mode is stronger than theone of the TA mode where both modes follow almostperfectly a mean-field behavior. Upon approaching thephase transition temperature their frequencies draw closerto each other near the zone center, which leads to strongmode–mode coupling in the long-wavelength limit. Thisnonlinear temperature and momentum dependent coupling isbest evidenced by normalizing the frequencies with respectto their high temperature limits where the coupling is absent(inset to figure 1). In addition their derivatives with respect tomomentum are formed. The results are displayed in figure 1.
Both normalized mode derivatives exhibit giant anomaliesin the long-wavelength limit with an onset momentum atqTA < 0.35 for the acoustic mode and qTO < 0.5 for theoptic mode. In addition an appreciable dispersion below thesewave vectors is seen moving to lower q-values with decreasingtemperature. These anomalies correspond to polar and elasticclusters with slowing down dynamics, and their length scalesare determined by the momentum at which the minimum andmaximum is observed, respectively.
Both data sets are shown in figure 2 where substantialdifferences between the two anomalies are evident. This result
2

J. Phys.: Condens. Matter 27 (2015) 105901 A Bussmann-Holder et al
0.00 0.25 0.50 0.75 1.00
-8
-7
-6
-5
-4
-3
-2
-1
0
0.00 0.25 0.50 0.75 1.000.0
0.2
0.4
0.6
0.8
1.0
ωT
A (
q,T
)/ω
TA(q
,T=
1300
K)=
ωT
A-n
orm
q (110)
650K640K630K620K610K600K590K580K570K560K550K540K530K520K510K500K490K
dωT
A-n
orm/d
q
q (110)
0.00 0.25 0.50 0.75 1.000
1
2
3
4
0.00 0.25 0.50 0.75 1.00
0.2
0.4
0.6
0.8
1.0
q (110)
ωT
O (
q,T
)/ω
TO(q
,T=
1300
K)=
ωT
O-n
orm
650K640K630K620K610K600K590K580K570K560K550K540K530K520K510K500K490Kdω
TO
-nor
m/d
q
q
(a)
(b)
Figure 1. (a) Momentum derivative of the normalized TO mode dispersion, which is shown in the inset to the figure, for varioustemperatures. (b) The same as the left, however for the TA mode frequency. Part of the data in (a) were taken from [31].
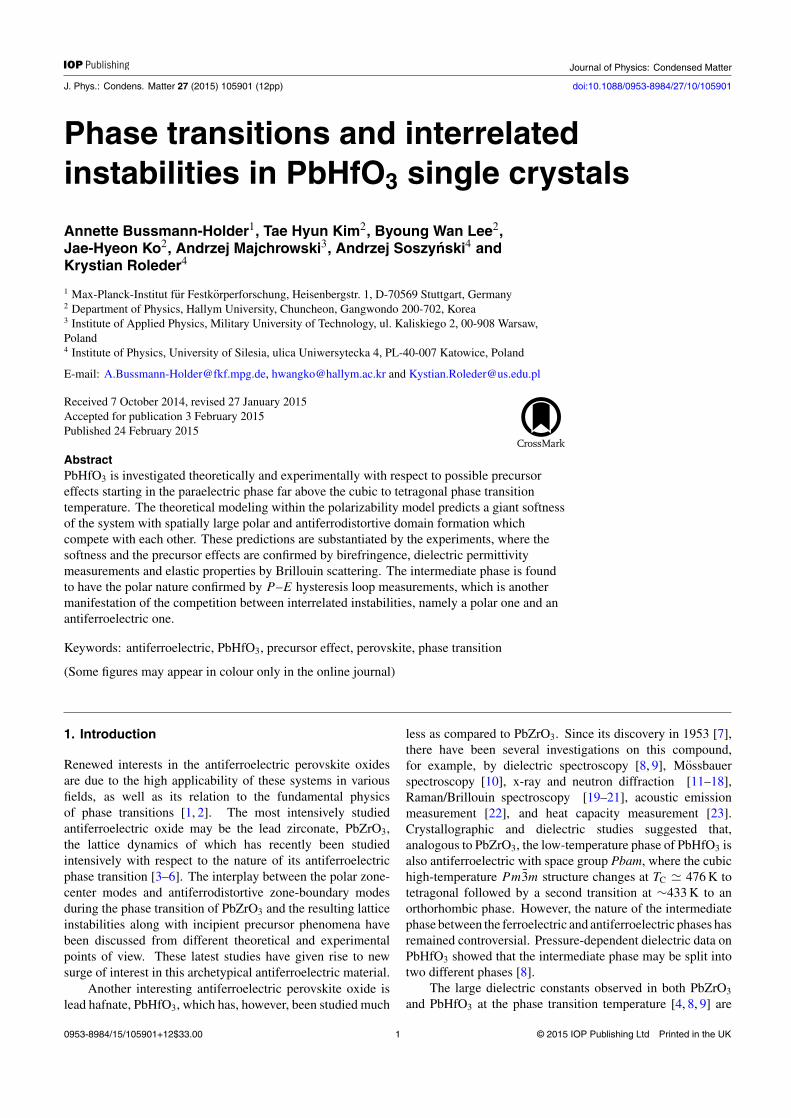
was included in our previous paper [31], which is presentedhere in order to put stress on the characteristic temperaturerange described below in the paraelectric phase. First, thelength scale of the elastic clusters is strongly enhanced ascompared to the polar ones. Second, both cluster types showan enhanced spatial increase above the actual instability i.e.the elastic and polar ones start growing rapidly around 1.1TC.Third, above these threshold temperatures the polar clustersgrow very slowly as compared to the elastic ones whichhave a steep size dependence with decreasing temperature.In comparison to other perovskites, the spatial extensions ofboth clusters are much larger suggesting enhanced nonlinearityand anharmonicity. An even stronger evidence for thislatter conclusion can be drawn from the investigation of theelastic constants or sound velocities, which are readily derivedfrom the above results. Especially these are experimentallyaccessible, whereas the precursor dynamics can only indirectly
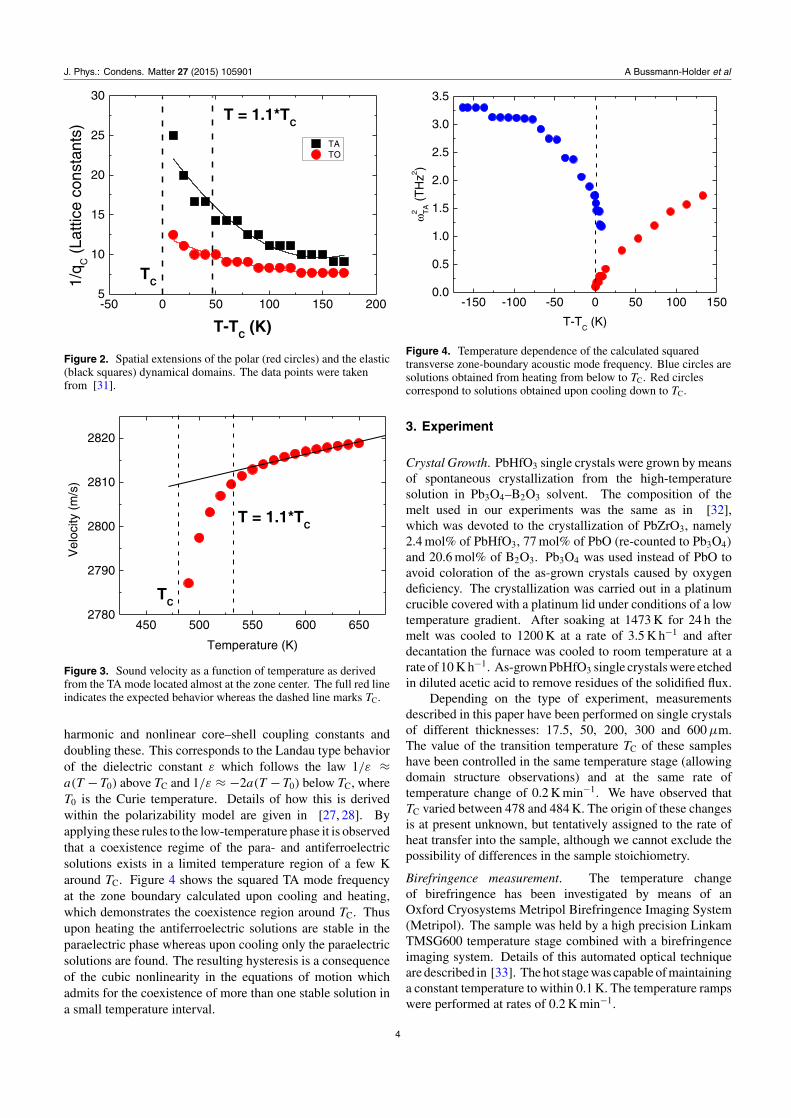
be obtained by experiments. The temperature dependence ofthe sound velocity corresponding to the zone-center TA modealong the [1 1 0] direction is shown in figure 3. As is obviousin this figure, the sound velocity decreases linearly from hightemperatures to a temperature of approximately 1.1TC wherea sharp nonlinear decrease sets in. This temperature range isthe same as observed in the onset of elastic dynamic precursorclusters. As compared to PbTiO3 and PbZrO3 the system ismuch softer and exhibits huge anharmonicity. Especially theonset of precursor dynamics is well marked and accompaniedby a pronounced softness. The temperature dependence ofthe sound velocity of the TA mode near the zone center canbe obtained from Brillouin spectroscopy, and the comparisonbetween the experiment and the calculation results will begiven in the following section.
Below the phase transition temperature the TA modecan be derived from the model by changing the signs of the
3
J. Phys.: Condens. Matter 27 (2015) 105901 A Bussmann-Holder et al
-50 0 50 100 150 2005
10
15
20
25
30
TC
TATO
1/q C
)stnatsnocecittaL(
T-TC (K)
T = 1.1*TC
Figure 2. Spatial extensions of the polar (red circles) and the elastic(black squares) dynamical domains. The data points were takenfrom [31].
450 500 550 600 6502780
2790
2800
2810
2820
TC
T = 1.1*TC
)s/m(
y ticoleV
Temperature (K)
Figure 3. Sound velocity as a function of temperature as derivedfrom the TA mode located almost at the zone center. The full red lineindicates the expected behavior whereas the dashed line marks TC.
harmonic and nonlinear core–shell coupling constants anddoubling these. This corresponds to the Landau type behaviorof the dielectric constant ε which follows the law 1/ε ≈a(T −T0) above TC and 1/ε ≈ −2a(T −T0) below TC, whereT0 is the Curie temperature. Details of how this is derivedwithin the polarizability model are given in [27, 28]. Byapplying these rules to the low-temperature phase it is observedthat a coexistence regime of the para- and antiferroelectricsolutions exists in a limited temperature region of a few Karound TC. Figure 4 shows the squared TA mode frequencyat the zone boundary calculated upon cooling and heating,which demonstrates the coexistence region around TC. Thusupon heating the antiferroelectric solutions are stable in theparaelectric phase whereas upon cooling only the paraelectricsolutions are found. The resulting hysteresis is a consequenceof the cubic nonlinearity in the equations of motion whichadmits for the coexistence of more than one stable solution ina small temperature interval.
-150 -100 -50 0 50 100 1500.0
0.5
1.0
1.5
2.0
2.5
3.0
3.5
ω2 T
A(T
Hz2 )
T-TC (K)
Figure 4. Temperature dependence of the calculated squaredtransverse zone-boundary acoustic mode frequency. Blue circles aresolutions obtained from heating from below to TC. Red circlescorrespond to solutions obtained upon cooling down to TC.
3. Experiment
Crystal Growth. PbHfO3 single crystals were grown by meansof spontaneous crystallization from the high-temperaturesolution in Pb3O4–B2O3 solvent. The composition of themelt used in our experiments was the same as in [32],which was devoted to the crystallization of PbZrO3, namely2.4 mol% of PbHfO3, 77 mol% of PbO (re-counted to Pb3O4)
and 20.6 mol% of B2O3. Pb3O4 was used instead of PbO toavoid coloration of the as-grown crystals caused by oxygendeficiency. The crystallization was carried out in a platinumcrucible covered with a platinum lid under conditions of a lowtemperature gradient. After soaking at 1473 K for 24 h themelt was cooled to 1200 K at a rate of 3.5 K h−1 and afterdecantation the furnace was cooled to room temperature at arate of 10 K h−1. As-grown PbHfO3 single crystals were etchedin diluted acetic acid to remove residues of the solidified flux.
Depending on the type of experiment, measurementsdescribed in this paper have been performed on single crystalsof different thicknesses: 17.5, 50, 200, 300 and 600 µm.The value of the transition temperature TC of these sampleshave been controlled in the same temperature stage (allowingdomain structure observations) and at the same rate oftemperature change of 0.2 K min−1. We have observed thatTC varied between 478 and 484 K. The origin of these changesis at present unknown, but tentatively assigned to the rate ofheat transfer into the sample, although we cannot exclude thepossibility of differences in the sample stoichiometry.
Birefringence measurement. The temperature changeof birefringence has been investigated by means of anOxford Cryosystems Metripol Birefringence Imaging System(Metripol). The sample was held by a high precision LinkamTMSG600 temperature stage combined with a birefringenceimaging system. Details of this automated optical techniqueare described in [33]. The hot stage was capable of maintaininga constant temperature to within 0.1 K. The temperature rampswere performed at rates of 0.2 K min−1.
4

J. Phys.: Condens. Matter 27 (2015) 105901 A Bussmann-Holder et al
Figure 5. Birefringence calculated for an area 50 × 35 µm2 [2] on heating (red points) and cooling (blue points) of a single-domain PbHfO3
crystal of 17.5 µm thickness. Two antiferroelectric transitions are distinctly visible. A1,2 and P describe antiferroelectric and cubic phases,respectively. Because the point group of A1 phase is of the same symmetry as that in PbZrO3 (Pbam), the measured birefringence�n = nb − na was measured along the [0 0 1] axis of the orthorhombic symmetry.
Electric measurement. Dielectric permittivity measurementshave been performed on electroded single crystals of thickness50 µm. The P –E hysteresis loop was measured in analternating electric field of 200 Hz as a function of temperature.To determine the electric field induced strain x related withpolarization P a method based on the capacitance sensorwas used [34]. The sample deformation induced by analternating electric field E (165 Hz) was transferred via aquartz rod with one end placed on the sample surface andthe second one connected to the measurement condenserplate. Since the electrostrictive effect is the quadratic one,the electrostrictive deformation is detected at the doubledfrequency i.e. 330 Hz. In the cubic phase the electrostrictivestrain x1 can be described by x1 = M11E [2] and x1 =Q11P [2] where M11 and Q11 denotes the field-related andpolarization-related electrostrictive coefficients, respectively.
Brillouin scattering. A conventional tandem 6-pass Fabry–Perot interferometer (TFP-1, JRS Co.) was used for themeasurement of the Brillouin spectrum. The free spectralrange was 21.4 GHz with a mirror spacing of 7 mm. A diode-pumped solid state laser (Excelsior 532-300, SpectraPhysics)at a wavelength of 532 nm was used as an excitation source.A special forward, symmetric scattering geometry was usedto obtain the elastic constants without knowing the refractiveindex. The (1 0 0) crystal plate was set vertically in a smallfurnace. The laser beam was incident on the (1 0 0) planewith an incident angle 45◦, and the scattered light was collatedat the same angle from the other crystal surface. Thus thescattering angle of this geometry is 90.0±0.1◦. By rotating thecrystal plate in the vertical plane, the direction of the phononwavevector could be aligned along either 〈1 0 0〉 or 〈1 1 0〉crystallographic axis in the cubic coordinates. However, thealignment of the crystal in the small furnace could not be
carried out to a high accuracy, in particular, when the crystalhad to be inclined by 45◦ with respect to the furnace surface,and the phonon wavevector along the 〈1 1 0〉 direction wasapproximate.
4. Results and discussion
4.1. Birefringence
In order to test the model predictions, optical propertiesof single-domain PbHfO3 single crystal were measured inthe temperature range where phase transitions have beenexpected. Figure 5 shows the temperature dependence of thebirefringence of a single-domain PbHfO3 crystal of 17.5 µmthickness. While the high-temperature phase transition atabout 478 K suffers a small thermal hysteresis of the orderof 0.2 K, the difference in phase transition temperatures oncooling and heating between the two antiferroelectric phaseswas larger than 3 K. Difference in values of birefringenceinside the phase A2 during thermal cycle is connected witha slight change in domain orientation during the A1–A2 phasetransition (on heating).
When the birefringence is measured in a single domaininside the A2 phase only, a delicate difference between valueson cooling and heating was observed. A run of such ameasurement is shown in figure 6(a). It has to be stressed thatthis measurement has been performed in a single-domain state.Figure 6(b) is the difference in the birefringence between thecooling and the heating processes, which is denoted as δ(�n).As can be seen in figure 6(b), there is a thermal hysteresis in therange of 458–478 K. This suggests a diverse structure of theA2 phase, i.e. the A2 phase is not a homogeneous phase withantiferroelectric properties only, but consists of two phases,the first being antiferroelectric (438–458 K) and the second
5

J. Phys.: Condens. Matter 27 (2015) 105901 A Bussmann-Holder et al
440 445 450 455 460 465 470 475 4802.0
2.5
3.0
3.5
Temperature (K)
PbHfO3 single crystals - thickness 17.5 µm
Antiferroelectric phase Polar phase
on heating TC= 478.4 K
.∆n 103
on cooling TC= 478.2 K
A2(a)
440 445 450 455 460 465 470 475 480
-4
-2
0
2
4
6
8
PbHfO3 single crystals - thickness 17.5 µm
TC
Temperature (K)
.δ(∆n) 105
TC
Antiferroelectric phase
Polar phase
(b)
Figure 6. (a) Birefringence on cooling (blue line) and on heating(red line) measured inside the A2 phase for an area of 35 × 30 µm2
inside a single domain of PbHfO3 crystal of 17.5 µm thickness. (b)The difference in the birefringence between the cooling and theheating cycles.
possessing possible incommensurate character (458–478 K),inside which a weak ferroelectric hysteresis loop P(E) maybe induced (this is described in detail below).
In addition to measurements of birefringence below TC,we have conducted similar investigations of optical propertiesin the paraelectric phase. Analogous to ferroelectric bariumtitanate (BaTiO3) [35] and antiferroelectric PbZrO3 [4], wehave found that, in a wide temperature range above the Curiepoint, the PbHfO3 single crystal is weakly, but clearly visiblebirefringent as shown in figure 7. The birefringence in theparaelectric phase appeared already at a temperature TC +80 Kand starts to increase fast at TBH = 1.1TC upon approachingTC from the high-temperature side (figure 7). The temperatureTBH is in good agreement with the onset of precursor dynamicspredicted by theoretical calculation [26] and connected withthe appearance of static (stable) non-centrosymmetric clusters.
Thus an inflection point at about 537 K signals theappearance of a novel phase. In order to substantiate theuniversality of this observation, another single crystal ofdifferent thickness 130 µm has been measured. The resultswere very similar and, even though the birefringence started
480 500 520 540 560 580 600 620
0
1
2
3
4
.
Cubic phase
TBH
= 1.1xTC = 537 K
Temperature (K)
PbHfO3 single crystal - thickness 600 µm∆n 106
TC = 484 K
Figure 7. Birefringence calculated for an area 70×70 µm2 [2] onheating of a single crystal of PbHfO3 with thickness of 600 µm as afunction of temperature above TC. The dashed line at about 260 ◦Cindicates an inflection point marked as TBH.
at a slightly higher temperature, the inflection point for bothsamples was placed at TBH = 1.1TC. This proves that thebirefringence observed above TC is an intrinsic effect and isnot influenced by surface properties of samples.
4.2. Dielectric properties and P–E hysteresis loop
Dielectric permittivity measurements have been performedon electroded single crystals of thickness 50 µm. To avoiddefect creation at high temperatures we needed to placemetallic electrodes on the crystal surface, using silver paste.It was checked through the electric conductivity dispersionmeasurements that a metal-surface barrier was absent.
It is important to emphasize that in such experiments asingle-domain state cannot be obtained and thus below TC theresultant permittivity is an average value of permittivity tensorcoefficients. The experimental data (figure 8) are in agreementwith previous reports [7, 9], although the thermal hysteresis ofthe lowest phase transition is much smaller than in [1]. Thisdiscrepancy may be explained in terms of different heatingand cooling rates used in these two experiments. It is worthmentioning that except for a very narrow temperature rangebelow TC (see left insert in figure 8) no dielectric dispersionwas observed at frequencies lower than 2 MHz.
Unlike the birefringence data (figure 7), a few degreesbelow TC a new anomaly on the ε(T ) runs appears as alocal maximum with distinct thermal hysteresis. This novelpeculiarity is permanently seen in all measured samples. Inorder to find out the origin of these anomalies, measurements ofthe P(E) dependence in an alternating electric field of 200 Hzhave been performed as a function of temperature. For the firsttime for the lead hafnate single crystals the saturated hysteresisloop has been observed. Figure 9 shows the temperature rangein which this saturated hysteresis loop appears, measured inan ac electric field up to 10 kV cm−1 and with a coercive fieldof the order of 2 kV cm−1. In spite of the small values of the
6

J. Phys.: Condens. Matter 27 (2015) 105901 A Bussmann-Holder et al
380 400 420 440 460 480 500 520 540 5600
500
1000
1500
2000
2500
3000
3500
380 400 420 440 460 480 500 520 540 5600
500
1000
1500
2000
2500
3000
3500
Tcooling
A1-A2= 432.9 K
Tcooling
C= 478.3 K
Theating
A2-A1 = 435.2 K
ε1MHz
470 472 474 476 478
600
650
700
750
ε1MHz
Temperature (K)
Theating
C = 478.4 K
Temperature (K)
Figure 8. Dielectric permittivity ε as a function of temperature on heating (red points) and cooling (blue points) measured at a rate of1 K min−1 The insets show local maxima of ε(T ) runs and its frequency dependence below TC. The origin of this maximum is connectedwith domain boundary movements induced by measuring in an electric field in the polar phase indicated in figure 10.
472 474 476 4780.00
0.02
0.04
0.06
0.08
0.10
471 472 473 474 475 476 477 4780.00
0.02
0.04
0.06
0.08
0.10
Ps (µC/cm2)
Temperature (K)
Figure 9. Temperature dependence of the spontaneous polarizationPs calculated from the saturated ferroelectric hysteresis loop P(E)for single crystal PbHfO3 of 300 µm thickness. Measurements havebeen performed by means of Sawyer–Tower setup during cooling(blue cycles) and heating (red cycles). The coercive field was of theorder of 2 kV cm−1. The inset shows the saturated P(E) loopat 475.1 K.
spontaneous polarization (Ps), not larger than 0.1 µC cm−2, aclear thermal hysteresis of the P(E) dependence from the low-temperature side was detected. It has to be pointed out that upto the transition to the antiferroelectric A2 phase, the P(E)
dependencies were nonlinear. These shapes did not changetheir character up to 13 kV cm−1 strength of the applied acelectric field. It is worth emphasizing that the temperaturerange of the clear Ps existence is smaller than that wherethermal hysteresis of the birefringence for the single-domainstate has been observed (figure 6(b)). Incommensuration isnormally appearing at a microscopic level only and thus it
does not directly affect the optical properties. Consequently,a single-domain state could optically be observed and thethermal hysteresis is just the characteristic feature of theincommensuration.
At the same time we have to stress that the temperaturerange of clear ferroelectric P(E) run and the local ε(T )
maximum existence quite well coincides. It means that onecannot exclude that both these dependencies are connectedwith an induced effect of local internal strain fields in the crystalvolume leading to the appearance of multi-domain state whichmay easily be transformed to global polar phase under action ofexternal fields. It also means that the ferroelectric loops belowTC is of induced character. No anomaly in the temperaturedependence of birefringence in the whole A2 phase provesit. It is worth mentioning that in the case of PbZrO3, theintermediate phase has also been characterized by a strongpiezoelectric coefficient, evidencing the strong polar characterof this phase [4].
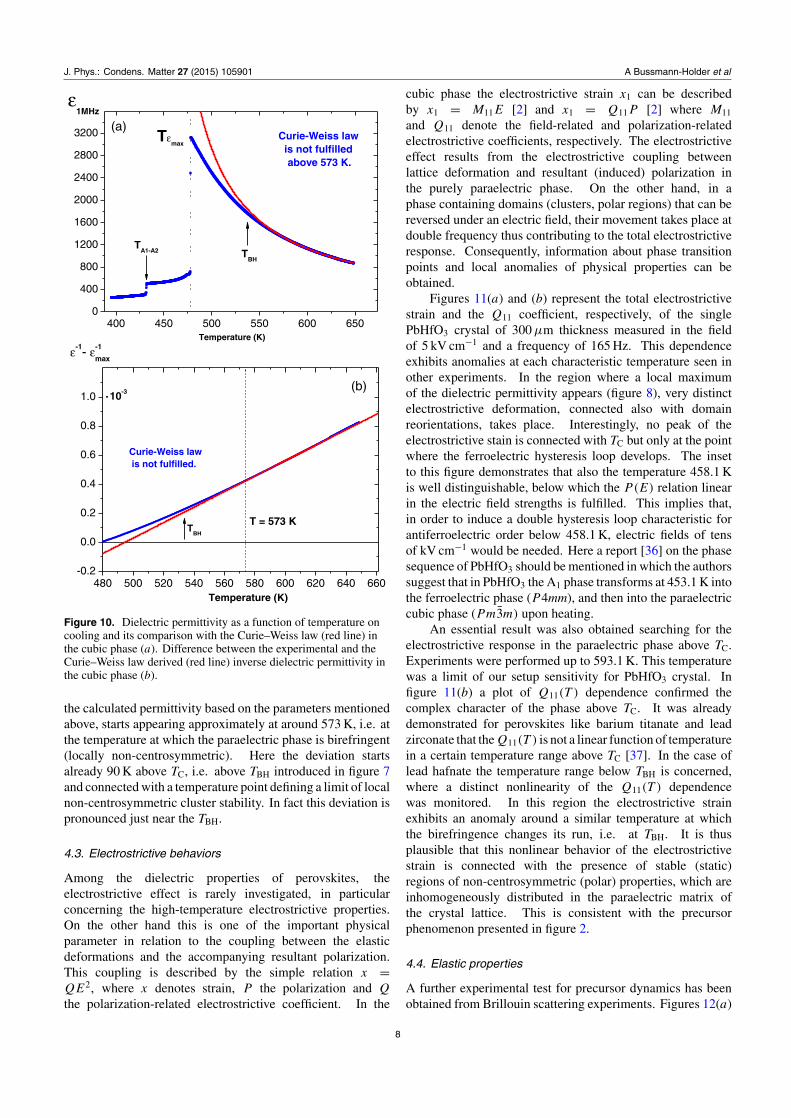
Since the birefringence has been detected in a ratherlarge temperature range above TC, we have investigated thedielectric permittivity in a broad temperature range, up to673 K. The purpose was to check whether the Curie–Weiss lawwas fulfilled in the paraelectric phase or not. It is importantmentioning that, in ferroelectric BaTiO3 and antiferroelectricPbZrO3, the ε(T ) run does not obey this law up to thetemperature point TBH = 1.1TC [4, 35]. It was checked that theε(T ) for lead hafnate also does not follow the Curie–Weiss lawin a similar T -range above TC. As shown in figure 10, the ε(T )
run can be considered as the one fulfilling the Curie–Weiss lawin a form of ε1 = C/(T − T0) + ε∞ only above a well-definedtemperature, estimated here to be 573 K. We have obtainedthe following parameters: C = 1.84×10⁵ K and T0 = 451 K.The value ε∞ = 5 has been introduced as being characteristicfor perovskites for optical frequencies. A distinct deviationbetween the two curves, representing the experimental data and
7
J. Phys.: Condens. Matter 27 (2015) 105901 A Bussmann-Holder et al
400 450 500 550 600 6500
400
800
1200
1600
2000
2400
2800
3200 Curie-Weiss law is not fulfilled
above 573 K.
Temperature (K)
Tεmax
ε1MHz
TA1-A2 T
BH
(a)
480 500 520 540 560 580 600 620 640 660-0.2
0.0
0.2
0.4
0.6
0.8
1.0
TBH
Temperature (K)
10-3
ε-1- ε-1
max
.
T = 573 K
Curie-Weiss law is not fulfilled.
(b)
Figure 10. Dielectric permittivity as a function of temperature oncooling and its comparison with the Curie–Weiss law (red line) inthe cubic phase (a). Difference between the experimental and theCurie–Weiss law derived (red line) inverse dielectric permittivity inthe cubic phase (b).
the calculated permittivity based on the parameters mentionedabove, starts appearing approximately at around 573 K, i.e. atthe temperature at which the paraelectric phase is birefringent(locally non-centrosymmetric). Here the deviation startsalready 90 K above TC, i.e. above TBH introduced in figure 7and connected with a temperature point defining a limit of localnon-centrosymmetric cluster stability. In fact this deviation ispronounced just near the TBH.
4.3. Electrostrictive behaviors
Among the dielectric properties of perovskites, theelectrostrictive effect is rarely investigated, in particularconcerning the high-temperature electrostrictive properties.On the other hand this is one of the important physicalparameter in relation to the coupling between the elasticdeformations and the accompanying resultant polarization.This coupling is described by the simple relation x =QE2, where x denotes strain, P the polarization and Q
the polarization-related electrostrictive coefficient. In the
cubic phase the electrostrictive strain x1 can be describedby x1 = M11E [2] and x1 = Q11P [2] where M11
and Q11 denote the field-related and polarization-relatedelectrostrictive coefficients, respectively. The electrostrictiveeffect results from the electrostrictive coupling betweenlattice deformation and resultant (induced) polarization inthe purely paraelectric phase. On the other hand, in aphase containing domains (clusters, polar regions) that can bereversed under an electric field, their movement takes place atdouble frequency thus contributing to the total electrostrictiveresponse. Consequently, information about phase transitionpoints and local anomalies of physical properties can beobtained.
Figures 11(a) and (b) represent the total electrostrictivestrain and the Q11 coefficient, respectively, of the singlePbHfO3 crystal of 300 µm thickness measured in the fieldof 5 kV cm−1 and a frequency of 165 Hz. This dependenceexhibits anomalies at each characteristic temperature seen inother experiments. In the region where a local maximumof the dielectric permittivity appears (figure 8), very distinctelectrostrictive deformation, connected also with domainreorientations, takes place. Interestingly, no peak of theelectrostrictive stain is connected with TC but only at the pointwhere the ferroelectric hysteresis loop develops. The insetto this figure demonstrates that also the temperature 458.1 Kis well distinguishable, below which the P(E) relation linearin the electric field strengths is fulfilled. This implies that,in order to induce a double hysteresis loop characteristic forantiferroelectric order below 458.1 K, electric fields of tensof kV cm−1 would be needed. Here a report [36] on the phasesequence of PbHfO3 should be mentioned in which the authorssuggest that in PbHfO3 the A1 phase transforms at 453.1 K intothe ferroelectric phase (P 4mm), and then into the paraelectriccubic phase (Pm3m) upon heating.
An essential result was also obtained searching for theelectrostrictive response in the paraelectric phase above TC.Experiments were performed up to 593.1 K. This temperaturewas a limit of our setup sensitivity for PbHfO3 crystal. Infigure 11(b) a plot of Q11(T ) dependence confirmed thecomplex character of the phase above TC. It was alreadydemonstrated for perovskites like barium titanate and leadzirconate that the Q11(T ) is not a linear function of temperaturein a certain temperature range above TC [37]. In the case oflead hafnate the temperature range below TBH is concerned,where a distinct nonlinearity of the Q11(T ) dependencewas monitored. In this region the electrostrictive strainexhibits an anomaly around a similar temperature at whichthe birefringence changes its run, i.e. at TBH. It is thusplausible that this nonlinear behavior of the electrostrictivestrain is connected with the presence of stable (static)regions of non-centrosymmetric (polar) properties, which areinhomogeneously distributed in the paraelectric matrix ofthe crystal lattice. This is consistent with the precursorphenomenon presented in figure 2.
4.4. Elastic properties
A further experimental test for precursor dynamics has beenobtained from Brillouin scattering experiments. Figures 12(a)
8
J. Phys.: Condens. Matter 27 (2015) 105901 A Bussmann-Holder et al
420 430 440 450 460 470 480 4900
1
2
3
4
430 440 450 460 4700.0
0.1
0.2
0.3
0.4
433.1 K
458.1 K
.xtotal
10-6
Temperature (K)
Antiferroelectric phase A
1
Reg
ion
of fe
rroe
lect
ric h
yste
resi
s lo
op e
xist
ence 477.1 K471.1 K
458.1 K
Region of non-linear P(E) dependence
Temperature (K)
xtotal
10-6.
TC= 480.1 K
Antiferroelectric phase A
2
433.1 K
(a)
480 500 520 540 5600.0
0.5
1.0
1.5
2.0
2.5
Temperature (K)
Q11
102 [C-2
m4].
x11
= Q11
P2
1
P1 = ε
0ε
11E2
1
Tc
TBH
(b)
Figure 11. (a) Total electrostrictive strain xtotal as a function oftemperature in the regions where structural phase transitions inPbHfO3 single crystal take place. (b) Electrostrictivepolarization-related Q11 coefficient as a function of temperatureabove TC. Strain x induced by the electric field E = 5 kV cm−1 with165 Hz detected at 330 Hz. To calculate the polarization P1 inducedby the ac electric field E the temperature dependence of the ε11 (T )measured at 1 kHz has been used.
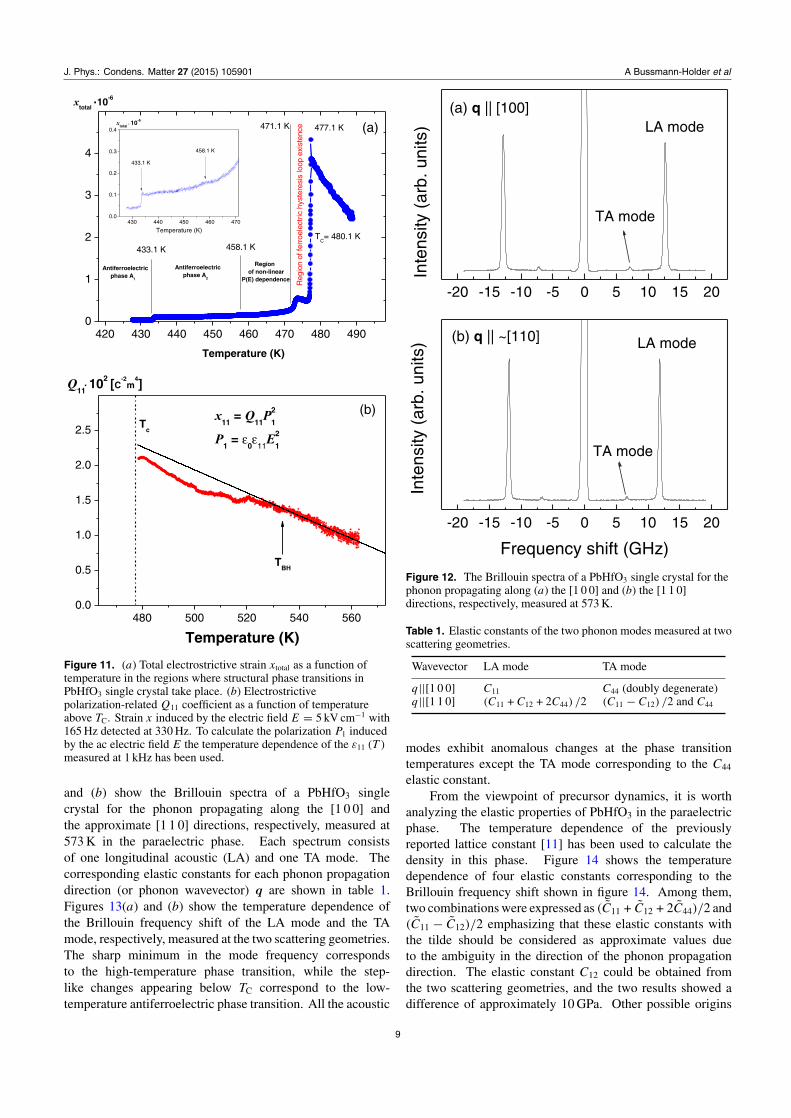
and (b) show the Brillouin spectra of a PbHfO3 singlecrystal for the phonon propagating along the [1 0 0] andthe approximate [1 1 0] directions, respectively, measured at573 K in the paraelectric phase. Each spectrum consistsof one longitudinal acoustic (LA) and one TA mode. Thecorresponding elastic constants for each phonon propagationdirection (or phonon wavevector) q are shown in table 1.Figures 13(a) and (b) show the temperature dependence ofthe Brillouin frequency shift of the LA mode and the TAmode, respectively, measured at the two scattering geometries.The sharp minimum in the mode frequency correspondsto the high-temperature phase transition, while the step-like changes appearing below TC correspond to the low-temperature antiferroelectric phase transition. All the acoustic
-20 -15 -10 -5 0 5 10 15 20
)stinu.bra(ytisnetnI
)stinu.bra(ytisnet nI
Frequency shift (GHz)
-20 -15 -10 -5 0 5 10 15 20
(b) q || ~[110]
TA mode
LA mode
TA mode
LA mode(a) q || [100]
Figure 12. The Brillouin spectra of a PbHfO3 single crystal for thephonon propagating along (a) the [1 0 0] and (b) the [1 1 0]directions, respectively, measured at 573 K.
Table 1. Elastic constants of the two phonon modes measured at twoscattering geometries.
Wavevector LA mode TA mode
q||[1 0 0] C11 C44 (doubly degenerate)q||[1 1 0] (C11 + C12 + 2C44) /2 (C11 − C12) /2 and C44
modes exhibit anomalous changes at the phase transitiontemperatures except the TA mode corresponding to the C44
elastic constant.From the viewpoint of precursor dynamics, it is worth
analyzing the elastic properties of PbHfO3 in the paraelectricphase. The temperature dependence of the previouslyreported lattice constant [11] has been used to calculate thedensity in this phase. Figure 14 shows the temperaturedependence of four elastic constants corresponding to theBrillouin frequency shift shown in figure 14. Among them,two combinations were expressed as (C11 + C12 + 2C44)/2 and(C11 − C12)/2 emphasizing that these elastic constants withthe tilde should be considered as approximate values dueto the ambiguity in the direction of the phonon propagationdirection. The elastic constant C12 could be obtained fromthe two scattering geometries, and the two results showed adifference of approximately 10 GPa. Other possible origins
9

J. Phys.: Condens. Matter 27 (2015) 105901 A Bussmann-Holder et al
Figure 13. The temperature dependence of the Brillouin frequencyshift of (a) the LA mode and (b) the TA mode measured at the twoscattering geometries.
of this discrepancy may be the imperfect parallelism of thetwo major surfaces of the crystal plate and the incompleteinformation of the temperature dependence of the latticeconstant in the paraelectric phase. The two elastic constantsshown in figure 14(a), derived from the two LA modes,exhibit comparable softening upon cooling, but the softeningof C11 is slightly more substantial. Interestingly, the softeningbecomes more remarkable upon cooling toward TC. Moreover,it may be recognized that both elastic constants soften fasterin the vicinity of temperature, below which the crystal wasbirefringent (see figure 7). In the centrosymmetric cubic phase,the acoustic mode softening arises from the electrostrictiveinteraction between the squared order parameter and the straincaused by the acoustic waves [38]. More substantial softeningnear TC is attributed to the existence of enlarged (and quasi-static) precursor polar clusters, the polarization of which iscoupled to the strain via the electrostrictive interaction.
On the other hand, the elastic constant C44 does notshow any appreciable change in the paraelectric phase, incontrast to (C11 − C12)/2 which exhibits significant softeningon approaching TC. Similar to the LA modes, (C11 − C12)/2displays more substantial softening at temperatures close toTC consistent with the theoretical predictions for the existence
Figure 14. The temperature dependence of the elastic constantscorresponding to (a) the LA mode and (b) the TA mode,respectively, in the paraelectric phase of PbHfO3.
of precursor dynamics [26]. Importantly, the temperaturedependence of (C11 − C12)/2 is qualitatively similar to thetheoretical estimation for the corresponding sound velocity asshown in figure 3. The temperature dependence of the fourelastic constants shown in figure 14 is similar to the results ofPbZrO3 [5]. There are three symmetrized elastic constants inthe cubic phase, C11 + 2C12, (C11 − C12)/2 and C44, whichcorrespond to the acoustic instabilities of the hydrostatic,tetragonal or orthorhombic, and rhombohedral deformation,respectively [39]. Since the ground state of PbHfO3 andPbZrO3 is the orthorhombic phase, it is expected that(C11 − C12)/2, instead of C44, would exhibit large softeningin the paraelectric phase upon cooling toward TC reflecting thecorresponding symmetry change.
Additional information about precursor dynamics can beobtained from the temperature dependence of the half-widthof the Brillouin doublet shown in figure 12, which is attributedto the acoustic damping in the hypersonic region. The mainorigin of the acoustic damping shown in the paraelectric phaseis the order parameter fluctuations [38], that is, the polarizationfluctuations in the precursor clusters. The half-width �B of theacoustic modes, which is not shown here, changes dramaticallyupon approaching the phase transition temperature and almost
10

J. Phys.: Condens. Matter 27 (2015) 105901 A Bussmann-Holder et al
diverges at TC. The only exception is given by the TA modepropagating along the [1 0 0] direction, the half-width of thismode being almost insensitive to temperature. The onset ofthe diverging behavior is most pronounced at temperaturesnear TC signifying that the polar clusters grow substantiallyin the paraelectric phase near TC, the size of which is largeenough to couple to the acoustic waves and to attenuatethem significantly. This large growth of precursor polarclusters is also responsible for the non-zero birefringence,the deviation of the dielectric constant from the Curie–Weiss law and anomalous behavior of the electrostrictivecoefficients.
4.5. Comparison between theory and experiment
Theoretically it is predicted that PbHfO3 exhibits competinginstabilities, one caused by polar mode softening, theother resulting from an elastically driven zone-boundaryinstability. While the latter is responsible for the structuralantiferroelectric phase transition, the former plays an importantrole for the huge dielectric constant observed in the paraelectricphase. The low-lying TO mode couples nonlinearly withthe acoustic mode and induces momentum- and temperature-dependent dynamical elastic precursors which are much morepronounced in the Hf compound as compared to the Zr andTi lead perovskites. Since the coupling occurs in a self-consistent way, a feedback from the elastic anomalies onthe TO mode sets in, which in turn causes polar precursors,however, on a much reduced length scale as compared to theelastic ones. The onset temperature for these ‘extra’ dynamicscorresponds to 1.1TC, i.e. the same temperature scale as alreadyobserved in [3, 4] and [25, 26]. In addition, the anharmonicmode–mode coupling is much stronger in PbHfO3 than inother perovskites and induces a pronounced softening of theelastic constants starting also at the onset of the precursordynamics. A rather novel feature relates to the regime aroundTC where para- and antiferroelectric solutions coexist leadingto a hysteretic behavior in the cooling and heating curves.Experimentally the theoretical results have been confirmed byvarious measurements where birefringence, dielectric constantdata and Brillouin scattering data have been taken. Aremarkable birefringence starts to develop at 1.1TC, i.e. deepin the paraelectric phase. Similarly deviations of the dielectricconstant from the Curie–Weiss law get very pronounced at thesame temperature scale. Both data demonstrate the hystereticbehavior around TC with an additional anomaly appearingin the dielectric constant slightly below TC with unknownorigin. In addition, the observation of a hysteresis loopin the polarization demonstrates the closeness between bothinstabilities, polar and antiferrodistortive ones. From theBrillouin scattering data a substantial softening of the elasticconstants above TC has been demonstrated. In particular, theapproximate (C11 −C12)/2 constant resembles closely the onepredicted theoretically for the corresponding TA-mode soundvelocity. Another dramatic change in the acoustic propertiesprobed by Brillouin scattering is the remarkable increase in thehalf-width of the acoustic modes, which broadens considerablyupon approaching the phase transition temperature. The large
softening of the acoustic mode frequencies and the steepincrease in the acoustic damping appearing near TC can beattributed to the striking growth of the precursor polar clusters.
5. Conclusion
Based on our previous work [3, 4, 25, 26] we have tested thepossibility of observing precursor dynamics theoretically andexperimentally in the antiferroelectric lead hafnate PbHfO3,which has been much less studied than PbZrO3. Both analysesclearly demonstrate that precursors are present also in thisperovskite. The non-zero birefringence, the deviation ofthe dielectric permittivity from the Curie–Weiss law, andthe anomalous changes in the electrostrictive and elasticproperties point to a specific temperature at which the non-centrosymmetric precursor polar clusters become long-livedand quasi-static. This leads us to conclude that they areintrinsic and universal to ferroelectrics, antiferroelectrics andantiferrodistortive systems. Their existence is beyond anyLandau type description of structural phase transitions and area consequence of strong nonlinearity and huge anharmonicityleading to momentum- and temperature-dependent mode–mode coupling. Due to this coupling a soft TA mode dragsa soft TO mode with it and vice versa. This leads toa competition between interrelated instabilities, namely thepolar and antiferroelectric ones. A further consequence of theanharmonicity is the hysteretic behavior in the vicinity of thephase transition temperature which allows for the coexistenceof para- and (anti)ferroelectric solutions. The observation of aP –E hysteresis loop below TC suggests that the intermediatephase has a polar character being an effect of coexisting polarclusters and antiferroelectric domains.
Acknowledgments
This work was supported by the National Center for Science(NCN) in Poland within the project 1955/B/H03/2011/40 andby the Basic Science Research Program through the NationalResearch Foundation of Korea (NRF) funded by the Ministry ofEducation, Science and Technology (2013R1A1A2006582).
References
[1] Rabe K M 2013 in Functional Metal Oxides: New Science andNovel Applications ed S B Ogale et al (Hoboken: Wiley)pp 221–44
[2] Liu H and Dkhil B 2011 Z. Kristallogr. 226 163[3] Bussmann-Holder A, Ko J-H, Majchrowski A, Gorny M and
Roleder K 2013 J. Phys.: Condens. Matter 25 212202[4] Ko J-H, Gorny M, Majchrowski A, Roleder K and
Bussmann-Holder A 2013 Phys. Rev. B 87 184110[5] Tagantsev A K et al 2013 Nature Commun. 4 2229[6] Hlinka J et al 2014 Phys. Rev. Lett. 112 197601[7] Shirane G and Pepinsky R 1953 Phys. Rev. 91 812[8] Samara G A 1970 Phys. Rev. B1 3777[9] Miga S and Dec J 1996 Phys. Status Solidi a 153 257
[10] Forker M, Hammesfahr A, Lopez-Garcıa A and Wolbeck B1973 Phys. Rev. B 7 1039
[11] Kwapulinski J, Pawełczyk M and Dec J 1994 J. Phys.:Condens. Matter 6 4655
11

J. Phys.: Condens. Matter 27 (2015) 105901 A Bussmann-Holder et al
[12] Corker D L, Glazer A M, Kaminsky W, Whatmore R W, Dec Jand Roleder K 1998 Acta Crystalloge. B 54 18
[13] Madigou V, Baudour J L, Bouree F, Favotto Cl, Roubin M andNihoul G 1999 Phil. Mag. A 79 847
[14] Fujishita H and Ishikawa Y 2002 Ferroelectrics 269 135[15] Kuroiwa Y, Fujiwara H, Sawada A, Aoyagi S, Nishibori E,
Sakata M, Takata M, Kawaji H and Atake T 2004 Japan. J.Appl. Phys. 43 6799
[16] Kuroiwa Y, Fujiwara H, Sawada A, Kawaji H and Atake T2005 J. Korean Phys. Soc. 46 296
[17] Fujishita H, Ogawaguchi A and Katano S 2008 J. Phys. Soc.Japan 77 064601
[18] Kupriyanov M F, Petrovich E V, Dutova E V andKabirov Yu V 2012 Crystallogr. Rep. 57 205
[19] Sharma S K, Jayaraman A, Chowdhury C P and Wang S Y1994 J. Raman Spectrosc. 25 331
[20] Jankowska-Sumara I, Kugel G E, Roleder K and Dec J 1995J. Phys.: Condens. Matter 7 3957
[21] Ko J-H, Roleder K, Majchrowski A and Bussmann-Holder A2014 J. Korean Phys. Soc. 64 1169
[22] Dul’kin E A, Gavrilyachenko V G and Fesenko O E 1997Phys. Solid State 43 654
[23] Yoshida T, Moriya Y, Tojo T, Kawaji H, Atake T andKuroiwa Y 2009 J. Therm. Anal. Calc. 95 675
[24] Ostapchuk T et al 2001 J. Phys.: Condens. Matter 13 2677[25] Roleder K, Bussmann-Holder A, Gorny M, Szot K and
Glazer A M 2011 Phase Transit. 85 939
[26] Bussmann-Holder A, Beige H and Volkel G 2009 Phys. Rev. B79 184111
[27] Bilz H, Benedek G and Bussmann-Holder A 1987 Phys.Rev. B 35 4840
[28] Bussmann-Holder A 2012 J. Phys.: Condens. Matter24 273202
[29] Bussmann-Holder A and Buttner H 1992 Nature 360 541[30] Bussmann-Holder A, Bilz H, Roenspiess R and Schwarz K
1980 Ferroelectrics 25 343[31] Bussmann-Holder A, Roleder K and Ko J-H 2014 J. Phys.:
Condens. Matter 26 275402[32] Dec J, Roleder K and Stroz K 1996 Solid State Commun.
99 157[33] Geday M A and Glazer A M 2004 J. Phys.: Condens. Matter
16 3303[34] Roleder K 1983 J. Phys. E: Sci. Instrum. 16 1157[35] Ko J-H, Kim T H, Roleder K, Rytz D and Kojima S 2011
Phys. Rev. B 84 094123[36] Kabirov Yu V, Kupriyanov M F, Petrovich E V,
Duimakaev Sh I and Ponomarenko V O 2011 Phys. SolidState 53 114
[37] Wieczorek K, Ziebinska A, Ujma Z, Szot K, Gorny M,Franke I, Koperski J Soszynski A and Roleder K 2006Ferroelectrics 336 61
[38] Rehwald W 1973 Adv. Phys. 22 721[39] Cowley R A 1976 Phys. Rev. B 13 4877
12