perception of adequacy of resources with a turkish sample
TRANSCRIPT

1624
Journal of Family IssuesVolume 30 Number 12
December 2009 1624-1650© 2009 Sage Publications
10.1177/0192513X09334915http://jfi.sagepub.com
hosted athttp://online.sagepub.com
Authors’ Note: Please address correspondence to Zeynep Copur, Department of Family and Consumer Sciences, Hacettepe University, Sihhiye Campus, ankara, Turkey; e-mail: [email protected].
Perception of Adequacy of Resources With a Turkish SampleZeynep CopurSükran Safakgünsel TerziogluHacettepe University, Ankara, TurkeyRichard a. DodderOklahoma State University, Stillwater
This study examines the validity and reliability of the Perceptions of adequacy of Resources inventory—developed for american society—in a sample from Turkey and determines the correlations between perceived adequacy of resources and selected socioeconomic and family composition characteristics in Turkey. Participants of this study consist of employees and students at the central campus of the Hacettepe University in ankara, Turkey. The sample size is determined using a random sampling method (n = 500). analysis of variance tests show significant differences (.05) in perceptions of adequacy of resources according to income, education, marital status, number of children, and family life stage. On the other hand, gender, age, family type, and length of marriage are not found to be significant. In addition, regres-sion analysis shows that the demographic variables of income, education, and marital status significantly predicted perceptions of adequacy of resources.
Keywords: family resources; resource management; perception; adequacy of resources; cross-cultural studies; Turkey
Historically, Turkey has been a geographical and cultural bridge between the east and the West, and this role of a mediator has had its
social and economic implications. In recent times, Turkey has undergone
at Hacettepe Univeristy on July 31, 2015jfi.sagepub.comDownloaded from

Copur et al. / Perception of adequacy of Resources 1625
rapid social and economic change. Particularly in the last decade, Turkey has experienced rapid urbanization, industrialization, and westernization influenced by large-scale exposure to european and North american cul-tures, primarily through the mass media. The current candidacy status of Turkey in the european Union has seemed to accelerate this movement (Yavuz, 2004).
Since the foundation of the Republic of Turkey in 1923, the population has grown considerably. It has undergone dramatic transitions and seen sig-nificant changes in its demographic structure. The last few decades in par-ticular have witnessed drastic changes (Yavuz, 2004). even with a fluctuating growth rate, the population has increased fivefold in the last 70 years. according to the 2000 census, Turkey has 67 million inhabitants, nearly evenly divided according to gender (50.7% males, 49.3% females), with 41% living in the countryside. Improvements in health services and in the standard of living have brought a steady decline in both child and adult mortality rates. as a result, the age structure of the population is rapidly changing, with a greater percentage in the older age brackets. Since the early 1950s, the country has experienced accelerated internal and external migration trends, and the extensive urbanization process, which is still profoundly changing the spatial distribution in the country, has shifted the population to be predominantly concentrated in urban settlements (Turkish Statistical Institute, 2003). The increase in the migration to urban areas and the problems of urban life, including the unfamiliar urban market economy, the expansion of the social security system to more and more sectors of the society, the increase in the influence of mass communication on the entire social stratum, and the increase in the incorporation of women into the work-force are thought to have had the greatest impact on the changes observed in family structure and functioning (Ilbars, 2000). Nevertheless, these transi-tions and demographic shifts have been less robust in the eastern regions of Turkey, and it is still uncertain if these regions will experience the same dynamics, only more slowly or at later periods of time (Yavuz, 2004).
In almost all societies, urbanization and industrialization have facilitated significant changes in the functions and structure of the family. Similar to observations in other countries, there has been a shift from the large, extended family toward a nuclear family in the Turkish society (Ilbars, 2000). Today, 80.7% of all families in Turkey are nuclear families (i.e., husband, wife, and unmarried children), whereas the traditional large fami-lies account for only 13.0% (Turkish Statistical Institute, 2006).
The contemporary family exists in a context with complex and rapid natu-ral, social, economic, and technological changes. as the environment becomes
at Hacettepe Univeristy on July 31, 2015jfi.sagepub.comDownloaded from

1626 Journal of Family Issues
more complicated and resources become increasingly varied, the family is faced with many responsibilities related to using these resources. Under these circumstances, resource management is extremely important for meeting demands and acquiring higher living standards (Terzioglu, 2000). Resources are potentially advantageous for individuals and families in achieving goals and therefore provide satisfaction as they are used. Changes in economic conditions, particularly worsening ones, frequently result in greater attention to resource management. Likewise, changes in the family structure have generated increased worries about the adequacy of resources for the protec-tion of the family (Rowland, Dodder, & Nickols, 1985).
The purposes of this study were to determine the validity and reliability of the Perceptions of adequacy of Resources (PaR) inventory—developed for the american society—in a sample from Turkey and to examine the correlations between perceived adequacy of resources and selected socio-economic and family composition characteristics in Turkey. Furthermore, we aimed to see if these correlations are the same in Turkey as have been reported in the West. Turkey has experienced various intensive social and economic changes in the 20th and 21st centuries. effective resource man-agement by families is especially important in developing countries because it is an indispensable component of improvement in the conditions of these countries. although Turkey is a developing country, there have not been any prior studies investigating perceived adequacy of resources.
Theoretical Foundation
There are various types of resources that can help achieve goals and thus lead to satisfaction. These resources are interrelated (gross, Crandall, & Knoll, 1980; Rowland et al., 1985; Terzioglu, 2000). a decision made about one kind of resource can affect other resources, and in certain circum-stances, resources sufficient for a given period of time might become scarce in later periods (Terzioglu, 2000). even though resources are interrelated with one another, each varies in its abilities to meet certain needs and demands (gross et al., 1980; Rowland et al., 1985). each resource also has unique properties. Therefore, families require a variety of resources. Resources have been classified in various ways, such as human–nonhuman; economic–noneconomic; and human, economic, and environmental (Deacon & Firebaugh, 1988; Rettig, Leichtentritt, & Danes, 1999; Rowland et al., 1985). among these, the human–nonhuman (material) classification is most widely used (Terzioglu, 1987). Human resources include the skills
at Hacettepe Univeristy on July 31, 2015jfi.sagepub.comDownloaded from

Copur et al. / Perception of adequacy of Resources 1627
and qualifications of the individual. It also involves cognitive, affective, and psychomotor properties influencing individuals’ effective use of resources, such as time and human energy. Nonhuman resources include material resources such as money or goods (Deacon & Firebaugh, 1988; Rettig et al., 1999; Rowland et al., 1985). Human resources are needed to use nonhuman resources efficiently (Rowland et al., 1985; Terzioglu, 1987).
Family economists have used the concept of perception in their studies and have examined how families perceive their adequacy of resources for income and how these perceptions affect their economic well-being (Hafstrom & Dunsing, 1973; Sumarwan & Hira, 1993; William, Nall, & Deck, 1976). Most studies on perception of adequacy of resources have focused on single resources, such as time, income, or human energy (Fitzsimmons, Hira, Bauer, & Hafstrom, 1993; Ormsby & Ted Fairchild, 1987; Rowland & Nickols, 1985). according to Deacon and Firebaugh (1988), the combina-tion of resources is important in the overall well-being of family members. Resources also have somewhat independent attributes of exchange and allo-cation. The exchanges are between and among family members and persons external to the family, such as employers and the community. The allocation involves alternative uses of resources such as time and energy for family work, earning money, personal interest, and spousal companionship (Hyun, Bauer, & Hogan, 1993).
Researchers working with samples of families with inadequate socio-economic resources have concluded that inadequate resources have nega-tive effects on the health and well-being of the family (enevoldsen, 1994; Lee, 2000; O’Neill, Xiao, Bristow, Brennan, & Kerbel, 2000; Voydanoff, 2004; Walson, 1992; Weigel & Weigel, 1990). Many researchers have particu-larly focused on financial issues while investigating resource management; very few have examined the interrelations between psychological elements such as perception, attitude, and control of money (Walker & garman, 1992).
Conceptual models of management propose that individuals’ percep-tions greatly influence management behavior, which in turn affects their perceptions of well-being. Perceptions determine how circumstances are viewed and evaluated with respect to demands and resources at hand. an individual views the number, frequency, intensity, duration, and priority of his or her demands compared to available resources. appropriate resource use decreases negative feelings and eases problem-solving efforts. Studies have consistently found a relationship between perception of resources and an individual’s problem-solving efforts. People with more resources, such as higher income, more friends, or a better job, are more likely to engage in problem-solving efforts and use more active, rather than avoidant,
at Hacettepe Univeristy on July 31, 2015jfi.sagepub.comDownloaded from

1628 Journal of Family Issues
adjusting strategies. Favorable appraisals of resources may also reduce negative emotions and facilitate problem solving (Rettig, 1993; Rettig et al., 1999). For example, studies indicate that (a) perception of economic loss is more important than assumed loss (Danes & Rettig, 1993; Rosenblatt & Keller, 1983) and (b) perception of the adequacy of income is more impor-tant than real income and is directly related to the well-being of the indi-vidual and family (Duncan, Volk, & Lewis, 1988; Fox & Chancey, 1998). Studies also report that the perceived adequacy of resources is higher for females than for males (Ptacek, Smith, & Dodge, 1994).
Measuring perceptions is based on the idea that some phenomenon, important in terms of behavior, is crucial in the way that it is perceived rather than in its existence in material reality. It is proposed that behavior is the result of the interaction between the person and the environment and is affected by subjective reality and perceptions (Rowland et al., 1985). earlier studies on the perceived quality of life concluded that the general perception of well-being is associated with the satisfaction provided by the resources, rather than with the real amount of resources (Campbell, Converse, & Rogers, 1976). When resources are high or perceived as adequate, on the other hand, individuals have one less burden to contend with; in addition, adequacy of resources may facilitate many features of their family life (Nicolas & Little, 1991). Measurement of perceived adequacy of resources makes it possible to compare families at different time stages and in different family categories (Rowland et al., 1985).
This study was guided by family resource management theory, which views the family as a critical resource exchange network (Deacon & Firebaugh, 1988). Deacon and Firebaugh (1988) developed this model with three components—input, throughput, and output. Input is human and non-human resources that enter the family system in various forms and affect the throughput process. The throughput process transforms input into out-put. Planning is a throughput element that intervenes between input and output. Output is the accomplishment of goals of managerial actions that can bring about satisfaction and fulfillment. The amount of resources in a household at any given time is fixed, so the household must allocate resources in such a way as to optimize their use, thus deriving the highest possible level of economic well-being and related satisfaction. Basic to the theory are two interrelated subsystems—managerial and personal. The main function of the managerial subsystem is to plan and to use resources needed to meet demands. The personal subsystem is concerned with the developmental and emotional needs of family members. Resource assess-ment is part of planning. Individuals may assess their resources both
at Hacettepe Univeristy on July 31, 2015jfi.sagepub.comDownloaded from

Copur et al. / Perception of adequacy of Resources 1629
objectively and subjectively. They may calculate these resources quantita-tively or subjectively and conclude whether these resources are more or less adequate to achieve their goals. Therefore, perceived resource adequacy can be considered as a subjective assessment of resources in the managerial process. Perceived adequacy of resources is thought to dramatically affect action sequencing in planning (Fitzsimmons et al., 1993; Hyun et al., 1993; Sumarwan & Hira, 1993).
Previous Research
Buehler and Hogan (1985) developed the Resource adequacy Perception Scale, which included subscales for money, time, and space. They con-cluded that respondents perceived having adequate time for their labor and market work. They also found that perceived adequacies of money were related to household income. The PaR inventory (Rowland et al., 1985) however had been used and examined more thoroughly. In testing psycho-metric properties of the PaR inventory, Burrell, Thompson, and Sexton (1995) found high reliability coefficients. Similar scores were found by Rowland et al. (1985) for this inventory. Results of concurrent validity test-ing and factor analysis by Burrel et al. (1995) showed that the PaR inven-tory is a measure with reasonable integrity. Consequently, the PaR inventory has been found to be acceptable for research with families in the West. Hafstrom and Dunsing (1973) found that homemakers’ perception of the adequacy of family income was the most important factor in explaining their satisfaction with their level of living. Hyun et al. (1993) examined resource adequacy and marital satisfaction of rural husbands and wives. They found that age was a significant predictor of perceived resource ade-quacy for both husbands and wives. Lee (2000) found no difference between males and females on adequacy of family resources. O’Neill et al. (2000) explored perceived resources and obstacles to successful financial goal attainment. Rettig et al. (1999) concluded that for both males and females, individual perceptions of financial and emotional resources were important determinants of perceived family well-being. Rommel (1989) examined the relationship of wives’ and husbands’ resource adequacy per-ception (RaP), conflict resolution style, and contextual variables (employ-ment status, family life stage, age, education, income, household composition, and years married) over time. This study, using a longitudinal design of married couples, concluded that the passage of time had a significant effect on overall RaP (i.e., increasing from 1983 to 1989). This was also true for
at Hacettepe Univeristy on July 31, 2015jfi.sagepub.comDownloaded from

1630 Journal of Family Issues
the subscales of time RaP, money RaP, and space RaP but not for the energy RaP subscale. Rommel concluded that gender was not a significant factor in the variance of RaP or its subscales. Positive relationships existed between RaP and the contextual variables of age, length of marriage, and family life stage. No significant relationship was found between income and money RaP. Rowland and Nickols (1985) compared perception of time resources adequacy in one- and two-parent families. They found that single parent mothers perceived their time resources as less adequate. Schram and Hafstrom (1986) reported that wives perceived financial resources as more adequate. Sumarwan and Hira (1993) examined relation-ships between selected socioeconomic characteristics, perceived income adequacy and satisfaction with financial status. Their results indicated that gender, age, and household income were significantly related to perceived income adequacy.
Researchers have used a variety of variables to measure individuals’ perceptions of resource adequacy. From this review of the literature, this study aimed at adapting the PaR inventory (Rowland et al., 1985) and examining the validity and reliability of a Turkish form of the instrument. after examining this inventory, the current research focused on determin-ing if the correlations reported in Western research between perceptions of adequacy of resources in individuals with various socioeconomic and fam-ily variables were the same in a non-Western context. With this in mind, answers to the following specific research questions were sought: (1) Does perceptions of adequacy of resources vary according to (a) gender, (b) age, (c) level of education, (d) income, (e) family type, (f) family life stage, (g) marital status, (h) length of marriage, and (i) number of children? (2) Do demographic and family structure variables have a significant effect on perceptions of adequacy of resources?
Method
Sample
Participants of this study consisted of employees and students at the central campus of Hacettepe University, ankara. a complete list of employ-ees (academic, administrative, technical, health and assistant health, and maintenance staff) was obtained from the Human Resources Office of the university. The lists included names, area of employment, and contact information. Likewise, a complete list of students was obtained from the
at Hacettepe Univeristy on July 31, 2015jfi.sagepub.comDownloaded from

Copur et al. / Perception of adequacy of Resources 1631
Registrar’s Office. according to these lists, the total population of staff at Hacettepe University’s Central Campus was 5,737, and the total population of students was 2,684. The sample size was determined according to the random sampling method (α = .05, n = 8.421, p = .5, d = 0.045), and n = 466 were found. However, a slightly larger sample of 500 was selected to compensate for those who might refuse to partake in the study (academic staff = 120, administrative staff = 65, technical staff = 20, health and assistant health staff = 75, maintenance staff = 60, and students = 160). The difference between the number of staff and students stems from the structure of the population. effort was made to ensure that the sample and population had the same ratios of representatives (academic staff = 24%, administrative staff = 13%, technical staff = 4%, health and assistant health staff = 15%, maintenance staff = 12%, and students = 32%). Random number tables were used to select the participants.
Participants were contacted in person and surveys were given individu-ally. On arrival at their work sites, and following the researcher’s self-introduction, the purpose of the study was explained. Participants were also informed that participation in the study was voluntary. after obtaining their consent, the survey packets, which subjects read and completed on their own, were distributed and then researchers collected all surveys once they were completed. None of the contacted individuals refused to participate. Data were collected between January and November 2004.
Measures
Independent variables. This study included nine independent variables: gender, age, education, income, family type, family life stage, marital sta-tus, length of marriage, and number of children. These variables were used to collect information about the participants’ personal characteristics. These characteristics were selected according to the research literature and their potential effects on the results. Family life stage was determined according to where the oldest child was living. For students who lived with their par-ents, their family life stage was classified in the expanding stage, whereas those living separately from their parents were classified in the contracting stage. If the students were married with no children, their family life stage was classified in the beginning stage. If they were married and had children, their family life stage was classified in the expanding stage (see Table 1 for categories of variables). In addition, another set of independent variables consisted of two groups that were used in the regression equation predicting the outcome variable of perceptions of adequacy of resources. The first group included the demographic variables of gender, age, income,
at Hacettepe Univeristy on July 31, 2015jfi.sagepub.comDownloaded from

1632 Journal of Family Issues
Table 1Description of the Sample
Characteristic No. %
gender Female 319 63.8Male 181 36.2Total 500 100.0
age groups <24 192 38.425-35 185 37.036-45 92 18.446+ 26 6.2Total 500 100.0
education level Primary school 11 2.2High school 102 20.4College 291 58.2Master’s degree (Ma) 38 7.6Doctorate (PhD) 58 11.6Total 500 100.0
Income, YTL 0-500 223 44.6501-1,000 218 43.61,001-1,500 35 7.01,501-2,000 14 2.82,001+ 10 2.0Total 500 100.0
Family type Nuclear 402 80.4extended 61 12.2Single-parent 24 4.8Living alone or with their sibling 13 2.6Total 500 100.0
Family life stage Beginning 48 9.6expanding 291 58.2Contracting 161 32.2Total 500 100.0
Marital status Single 259 51.8Married 228 45.6Widowed or divorced 13 2.6Total 500 100.0
(continued)
at Hacettepe Univeristy on July 31, 2015jfi.sagepub.comDownloaded from

Copur et al. / Perception of adequacy of Resources 1633
education, and marital status, and the second group involved the family structure variables of family type, family life stage, and number of children. Length of marriage was not included in the regression analyses because it was a variable only applicable to the married participants, and its inclusion would reduce the sample size.
Dependent variable. The measure of perceived adequacy of resources selected was the PaR inventory developed by Rowland et al. (1985). Permission to use this inventory was obtained from Rowland’s coauthors Dodder and Nickols. In this measure, seven resources (physical environ-ment, health and physical energy, time, financial, interpersonal, knowledge or skill, and community) were examined. Items identified four different measurements of adequacy for each of the seven resource categories. each item consisted of concepts that were short, easy to understand, and limited to only one idea. also, positive sentences and personal expressions were used. There was a total of 28 items that were placed randomly in the inven-tory. each item was followed by a conventional seven-category, Likert-type response continuum ranging from 1 (strongly agree) to 7 (strongly disagree). The answers were to reflect only the personal ideas of the par-ticipants about resources. all questions were coded so that a higher score indicated higher perceptions of adequacy of resources.
This inventory had not previously been used in Turkey. It was devel-oped in english for use in the United States by Rowland et al. (1985). This measure was translated into Turkish and then back-translated into english
Table 1 (continued)
Characteristic No. %
Length of marriage, years 0-5 61 26.86-10 66 28.911-15 51 22.316-20 25 11.021+ 25 11.0Total 228 100.0
No. of children 1 98 40.72 67 27.83+ 27 11.2No 49 20.3Total 241 100.0
Note: 1 YTL (Turkish lira) = US$0.74.
at Hacettepe Univeristy on July 31, 2015jfi.sagepub.comDownloaded from

1634 Journal of Family Issues
by 10 experts who were all proficient in both english and Turkish. each of the 28 items that formed the inventory was considered carefully to find its conceptual equivalent in Turkish to ensure that the concepts being measured were understood to be essentially the same by both english and Turkish speakers.
Rowland et al. (1985) used factor loadings of .40 following Cattell (1952) on the first factor extracted as the standard for accepting the loading of an item on a factor. The same criterion was used in this study. Principal components factor analysis with a varimax rotation was used for this analysis. Before engaging in factor analysis, however, the Kaiser–Meyer–Olkin (KMO) value was computed to see if the data would be appropri-ate for factor analysis. Because the Bartlett’s test of sphericity (χ2 = 6168.7, df = 378, p < .001) and KMO value for the inventory were found to be 0.85, it was concluded that factor analysis would be appropriate. In this basic components analysis method, when the eigenvalue for a particular factor becomes less than 1.00, no more factors are extracted.
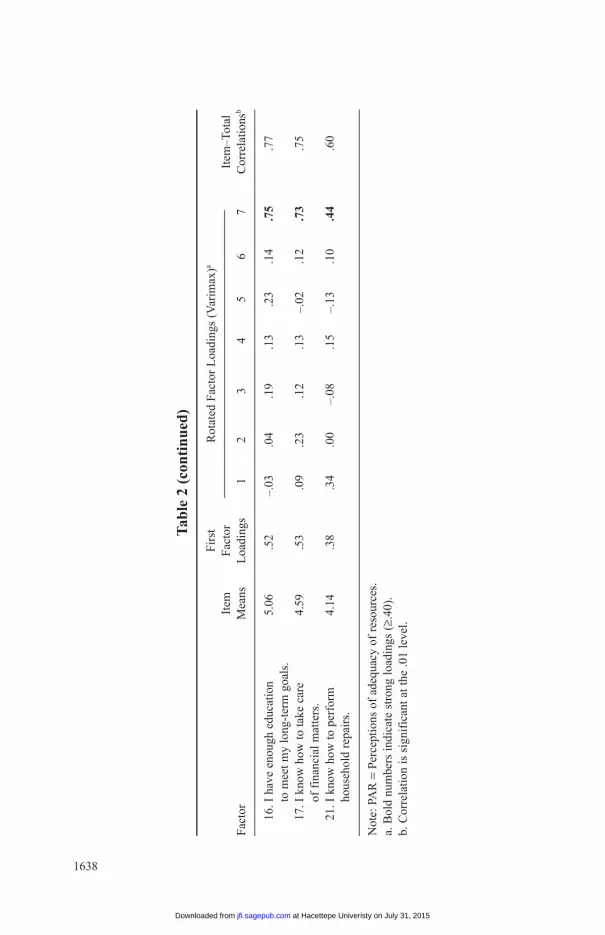
The factor loading of each item on the first factor extracted is shown in Table 2. all 28 items had positive loading on the first factor. However, the factor loadings of 2 items (Items 21 and 25) were found to be less than .40 (.38). although the factor loading of these 2 items was slightly less than .40, they were still at acceptable levels (Cattell, 1952; Tucker & Mac Callum, 1997). almost 66% of the total variance was explained by the first seven factors extracted. as a result, the items together seemed to reflect a general dimension that is thought to be perceived adequacy of resources. In addition, the seven factors together explained a large amount of variation among items in the measure. The results also showed, as expected, that the 4 items designed to measure each of the seven dimensions loaded strongly on the designated factor. However, 3 of the 28 items (Items 4, 21, and 24) had somewhat stronger loadings on more than one factor than would be preferred. Nevertheless, only one of them (Item 24) had a loading in excess of .40 (.43) on more than one factor, and all 3 of these items (4, 21, and 24) had their strongest loading on the designated factor.
To test the reliability of the measure, Cronbach’s alpha was calculated. Cronbach’s alpha is a reliability test used to determine the homogeneity of items. Its value is determined by the extent of correlation among the items weighted by the number of items in the inventory (Thorndike & Hagen, 1961; Sencan, 2005). The correlations among the items varied between .60 and .89 (see Table 2). all correlations were significant (p = .05), and Cronbach’s alpha was calculated for each subscale—time (.88), finan-cial (.88), physical environment (.80), health and physical energy (.80),
(text continues on page 1639)
at Hacettepe Univeristy on July 31, 2015jfi.sagepub.comDownloaded from

1635
Tab
le 2
Item
Mea
ns,
Fir
st F
acto
r L
oad
ings
, Rot
ated
Fac
tor
Loa
din
gs,
and
Ite
m–T
otal
Cor
rela
tion
of
PAR
In
ven
tory
Fir
st
It
em
Fac
tor
It
em–T
otal
Fac
tor
Mea
ns
Loa
ding
s 1
2 3
4 5
6 7
Cor
rela
tion
sb
1. T
ime
reso
urce
s
15.0
2
1.
I ha
ve e
noug
h ti
me
for
3.68
.7
2 .8
5 .0
6 –.
07
.09
.02
.07
.05
.87
leis
ure
acti
viti
es.
8
. I
have
eno
ugh
tim
e to
do
the
3.75
.6
9 .8
6 .0
8 .0
5 .1
2 –.
00
.09
.08
.89
thin
gs th
at I
wan
t to
do.
19
. I
have
eno
ugh
tim
e 3.
81
.63
.83
.01
.12
.04
.06
.07
.08
.84
for
hous
ehol
d w
ork.
22
. I
have
eno
ugh
tim
e to
hel
p ot
hers
. 3.
78
.58
.78
.06
.08
.05
.11
.13
–.02
.8
12.
Fin
anci
al r
esou
rces
13
.98
2
. I
have
eno
ugh
fina
ncia
l res
ourc
es
3.29
.5
5 .0
8 .8
3 .1
6 .0
4 .0
8 .1
3 .0
7 .8
7
to
mee
t une
xpec
ted
expe
nses
.
7.
My
inco
me
cove
rs m
y ex
pens
es.
3.83
.5
7 .0
5 .8
2 .2
5 .0
7 .1
1 .1
1 .0
0 .8
8
18.
I ha
ve a
dequ
ate
cred
it
3.90
.5
1 .0
1 .7
7 .1
9 –.
00
.10
.10
.10
.83
for
my
need
s.
26.
I ha
ve e
noug
h in
com
e to
2.
96
.59
.09
.84
.03
–.00
.1
1 .1
0 –.
01
.85
save
mon
ey r
egul
arly
.
(con
tinu
ed)
Rot
ated
Fac
tor
Loa
ding
s (V
arim
ax)a
at Hacettepe Univeristy on July 31, 2015jfi.sagepub.comDownloaded from

1636
Tab
le 2
(co
nti
nu
ed)
Fir
st
It
em
Fac
tor
It
em–T
otal
Fac
tor
Mea
ns
Loa
ding
s 1
2 3
4 5
6 7
Cor
rela
tion
sb
3. P
hysi
cal e
nvir
onm
ent
19.
50
reso
urce
s
3. S
pace
insi
de m
y ho
me
is
4.85
.5
4 .0
3 .1
5 .7
8 .1
8 .0
3 .0
6 .0
5 .8
1
ad
equa
te f
or m
y ne
eds.
13
. equ
ipm
ent i
n m
y ho
me
is
4.98
.5
7 .0
2 .1
4 .7
9 .1
6 .1
4 .0
1 .1
0 .8
3
ad
equa
te f
or m
y ne
eds.
14
. The
hou
sing
I h
ave
4.92
.6
0 .0
3 .1
5 .8
3 .1
6 .1
2 .0
8 .0
7 .8
6
m
eets
my
need
s.
27. S
pace
sur
roun
ding
my
4.
75
.49
.08
.16
.55
–.00
.1
8 .0
9 .1
8 .6
8
ho
me
mee
ts m
y ne
eds.
4. H
ealt
h an
d ph
ysic
al
21.6
8
en
ergy
res
ourc
es
9. M
y en
ergy
is a
dequ
ate
5.25
.5
4 .1
1 .0
6 .1
7 .7
3 .0
6 .1
5 .1
3 .8
1
fo
r m
y ac
tivi
ties
.
11. M
y he
alth
all
ows
me
5.78
.5
2 –.
02
–.02
.1
4 .8
4 .1
0 .0
6 .1
7 .8
3
to
do
my
wor
k.
24. I
hav
e en
ough
ene
rgy
4.91
.5
0 .4
3 .1
6 .0
0 .6
3 .1
0 .0
3 .0
0 .7
5
fo
r re
crea
tion
.
28. M
y he
alth
all
ows
me
5.74
.5
1 .1
0 –.
03
.16
.79
.11
.01
.20
.81
to d
o w
hat I
wan
t.
(con
tinu
ed)
Rot
ated
Fac
tor
Loa
ding
s (V
arim
ax)a
at Hacettepe Univeristy on July 31, 2015jfi.sagepub.comDownloaded from

1637
Tab
le 2
(co
nti
nu
ed)
Fir
st
It
em
Fac
tor
It
em–T
otal
Fac
tor
Mea
ns
Loa
ding
s 1
2 3
4 5
6 7
Cor
rela
tion
sb
5. I
nter
pers
onal
res
ourc
es
18.3
5
5.
I ha
ve f
rien
ds w
ho
4.85
.5
5 –.
06
.17
.23
.22
.63
.23
–.00
.7
5
ca
n he
lp m
e.
12.
My
rela
tive
s ar
e a
4.36
.5
2 .0
0 .2
1 .1
8 –.
03
.74
.09
.16
.80
help
to m
e.
15.
I ha
ve n
eigh
bors
I c
an
3.87
.4
0 .1
8 .0
2 –.
04
.02
.68
.03
.06
.67
call
on
for
help
.
23.
I kn
ow p
erso
ns w
hose
5.
27
.58
.01
.08
.22
.23
.69
.16
.11
.77
judg
men
t I tr
ust.
6. C
omm
unit
y re
sour
ces
15.1
4
6. C
omm
unit
y fa
cili
ties
are
3.
86
.55
.09
.23
.16
.06
.13
.69
.12
.77
ade
quat
e fo
r m
y ne
eds.
10
. P
rofe
ssio
nal p
eopl
e in
my
4.18
.5
3 .0
8 .0
7 .1
6 .0
7 .2
7 .7
2 .0
4 .7
8
co
mm
unit
y ar
e he
lpfu
l to
me.
20
. M
y co
mm
unit
y is
a g
ood
plac
e 4.
17
.48
.18
–.04
.1
1 .0
6 .0
7 .7
8 .1
2 .7
8
to
live
.
25.
gov
ernm
ent p
rogr
ams
in m
y 2.
93
.38
.07
.28
–.18
.0
6 .0
0 .6
1 .1
8 .6
6
co
mm
unit
y ar
e av
aila
ble
to
help
me.
7. K
now
ledg
e an
d sk
ill r
esou
rces
19
.22
4
. M
y kn
owle
dge
is a
dequ
ate
5.43
.5
0 .0
1 –.
11
.16
.19
.31
–.00
.7
4 .7
5
fo
r th
e w
ork
that
I d
o.
(con
tinu
ed)
Rot
ated
Fac
tor
Loa
ding
s (V
arim
ax)a
at Hacettepe Univeristy on July 31, 2015jfi.sagepub.comDownloaded from
1638
Tab
le 2
(co
nti
nu
ed)
Fir
st
It
em
Fac
tor
It
em–T
otal
Fac
tor
Mea
ns
Loa
ding
s 1
2 3
4 5
6 7
Cor
rela
tion
sb
16
. I h
ave
enou
gh e
duca
tion
5.
06
.52
–.03
.0
4 .1
9 .1
3 .2
3 .1
4 .7
5 .7
7
to
mee
t my
long
-ter
m g
oals
.
17. I
kno
w h
ow to
take
car
e 4.
59
.53
.09
.23
.12
.13
–.02
.1
2 .7
3 .7
5
of
fin
anci
al m
atte
rs.
21
. I k
now
how
to p
erfo
rm
4.14
.3
8 .3
4 .0
0 –.
08
.15
–.13
.1
0 .4
4 .6
0
ho
useh
old
repa
irs.
Not
e: P
aR
= P
erce
ptio
ns o
f ad
equa
cy o
f re
sour
ces.
a. B
old
num
bers
indi
cate
str
ong
load
ings
(≥.
40).
b. C
orre
lati
on is
sig
nifi
cant
at t
he .0
1 le
vel.
Rot
ated
Fac
tor
Loa
ding
s (V
arim
ax)a
at Hacettepe Univeristy on July 31, 2015jfi.sagepub.comDownloaded from

Copur et al. / Perception of adequacy of Resources 1639
Tab
le 2
(co
nti
nu
ed)
Fir
st
It
em
Fac
tor
It
em–T
otal
Fac
tor
Mea
ns
Loa
ding
s 1
2 3
4 5
6 7
Cor
rela
tion
sb
16
. I h
ave
enou
gh e
duca
tion
5.
06
.52
–.03
.0
4 .1
9 .1
3 .2
3 .1
4 .7
5 .7
7
to
mee
t my
long
-ter
m g
oals
.
17. I
kno
w h
ow to
take
car
e 4.
59
.53
.09
.23
.12
.13
–.02
.1
2 .7
3 .7
5
of
fin
anci
al m
atte
rs.
21
. I k
now
how
to p
erfo
rm
4.14
.3
8 .3
4 .0
0 –.
08
.15
–.13
.1
0 .4
4 .6
0
ho
useh
old
repa
irs.
Not
e: P
aR
= P
erce
ptio
ns o
f ad
equa
cy o
f re
sour
ces.
a. B
old
num
bers
indi
cate
str
ong
load
ings
(≥.
40).
b. C
orre
lati
on is
sig
nifi
cant
at t
he .0
1 le
vel.
Rot
ated
Fac
tor
Loa
ding
s (V
arim
ax)a
interpersonal (.73), community (.73), and knowledge or skill (.67). These results suggest that the inner consistency of the inventory is high. The total of the seven resources provides a general index of total perception. although the seven resources appear to be measured adequately, analysis of each of them is beyond the scope of this article.
These analyses are interpreted to mean that the inventory of perceptions of adequacy of resources is reliable and valid for these subjects in Turkey. Thus, it appears that this inventory has intercultural validity in this case and can therefore be used to measure a similar concept in each society; that is, a similar concept appears to have been measured in a Turkish population as has been reported in Western societies. On the other hand, although the term community resources might have similar connotations for the partici-pants from both countries, these resources might be qualitatively and quan-titatively different. For the purpose of this study, the term community resources was used to refer to government programs such as social assist-ance and solidarity fund (SaSF), unemployment assistance, social security, health, transportation, and education services offered by the central and local governments in Turkey.
Data Analysis
Data analysis began with calculating frequencies of the sample on all independent variables. Independent samples t tests were then used to com-pare mean values on the PaR inventory between males and females. One-way analysis of variance (aNOVa) was then computed to compare means among categories of subjects on each remaining independent variable. When the F test indicated significant (.05) mean differences on a given variable, Tukey’s multiple comparison test was used to isolate the specific between-category means that were significantly different. Finally, hierarchi-cal regression analysis was computed to determine the interrelationships between perceptions of adequacy of resources and the independent varia-bles. Variables were entered into the regression equation in the following order: demographic variables and family structure variables. For the hierar-chical regressions, some dummy variables had to be created. gender was already coded as a dummy variable with female = 1 and male = 2, with female as the reference category. age and income were continuously meas-ured in years and Turkish lira, respectively. educational level was recoded from five items (primary school, high school, college, master’s degree, and doctoral degree) into two categories as high school graduates or less = 0 and college graduates or more = 1. Marital status was recoded as married (0) and single, widowed, or divorced (1). Family type, which initially was
at Hacettepe Univeristy on July 31, 2015jfi.sagepub.comDownloaded from

1640 Journal of Family Issues
composed of four categories (1 = nuclear, 2 = extended family, 3 = single-parent family, 4 = living alone or with their sibling), was collapsed into nuclear = 1 and others = 0. Family life stage was recoded as beginning and
Table 3Variance Analysis Results of Perceptions of Adequacy
of Resources Inventory Average Scores According to Variables
Variable group n % M SD F p
education 9.22 <.01 level
Primary school 11 2.2 114.45 28.84 High school 102 20.4 111.84 25.51 College 291 58.2 125.07 23.01 Ma 38 7.6 124.36 25.82 PhD 58 11.6 133.08 21.30 Total 500 100.0 123.01 24.47
Income level, 5.31 <.01 YTL
0-500 223 44.6 120.81 23.67 501-1,000 218 43.6 121.76 24.23 1,001-1,500 35 7.0 132.80 22.27 1,501-2,000 14 2.8 139.00 20.53 2,001+ 10 2.0 142.90 36.98 Total 500 100.0 123.01 24.47
Marital 5.69 <.05 status
Single 259 44.6 126.50 22.78 Married 228 43.6 119.08 25.43 Widowed or 13 7.0 122.38 30.86
divorced Total 500 100.0 123.01 24.47
No. of 3.73 <.05 children
1 98 40.7 124.33 25.57 2 67 27.8 116.34 23.52 3+ 27 11.2 107.03 26.91 No 49 20.3 119.85 25.98 Total 241 100.0 119.26 25.69
Family 2.99 <.01 life stage
Beginning 48 9.6 121.97 25.40 expanding 291 58.2 121.05 24.02 Contracting 161 32.2 126.86 24.69 Total 500 100.0 123.01 24.47
Note: 1 YTL (Turkish lira) = US$0.74.
at Hacettepe Univeristy on July 31, 2015jfi.sagepub.comDownloaded from

Copur et al. / Perception of adequacy of Resources 1641
Table 4Correlation for Variables Used in the Analysis
1 2 3 4 5 6 7 8 9
1. PaR 1.00 2. age –.04 1.00 3. Income .20** .48** 1.00 4. gender –.03 .13* –.12* 1.00 5. education .24** –.26** .19** –.39** 1.00 6. Marital status .15** –.63** –.39** –.12* .30** 1.00 7. Family type .01 –.11* .04 –.06 .19** –.13* 1.00 8. Family life stage –.09* .31** .11* .09* –.23** –.38** .05 1.00 9. No. of children –.13** .70** .32** .16** –.34** –.80** .02 .59** 1.00 M 123.01 29.6 681.11 .36 .77 .54 .80 .58 .38SD 24.47 8.82 505.89 .48 .41 .50 .39 .49 .48
Note: PaR = Perceptions of adequacy of resources.*p < .05. **p < .01.
Table 5Hierarchical Regression Result for Perceptions
of Adequacy of Resources
B SD β F R aR2
Model 1 Constant 100.83 6.17 13.27** .34 .11**gender 4.65 2.34 .09 age –0.032 0.16 –.01 Income 0.013 0.00 .26** education 9.62 2.98 .16** Marital status 9.93 2.77 .20**
Model 2 Constant 101.27 7.11 8.28** .34 .11gender 4.61 2.35 .09 age –0.05 0.18 –.02 Income 0.01 0.00 .26** education 9.53 3.08 .16** Marital status 10.66 3.83 .21** Family type –0.05 2.79 .00 Family life stage –1.38 2.72 –.02 No. of children 1.89 4.77 .03
Note: Y = 101.27 + 4.61 gender + (–.05 age) +.01 Income + 9.53 education + 10.66 Marital status + (–.05 Family type) + (–1.38 Family life stage) + 1.89 Number of children + e.**p < .01.
at Hacettepe Univeristy on July 31, 2015jfi.sagepub.comDownloaded from

1642 Journal of Family Issues
contracting = 0 or expanding = 1. Finally, number of children was recoded as none = 0 and 1 or more children = 1. Before running regression, data were checked for assumption of regression analysis (multicollinearity and auto-correlation) and were found fit for the procedure. These results are presented in Tables 3 to 5. For all analyses, SPSS 12.0 for Windows was used.
Results
Descriptive Information
Descriptive statistics are presented in Table 1. Nearly 64% of the sample was female. The ages of the participants ranged from 19 to 61, with a mean of 29.6 years. Incomes varied between 80 and 5,000 YTL/month, with an average of 681.11 YTL/month (1 YTL = US$0.74). Turkey is a country of 67 million people, with a per capita income of US$5,477 as of 2006. The results of the investigation made by the Memur-Sen (employee Trade Union) Research and Development Center reported that at the end of august 2006, the starvation limit was determined as 708.05 YTL and pov-erty limit as 1,956.90 YTL (Memur-Sen, 2006). Considering these find-ings, the current research sample appears to be lower income families; however, the mean income of the sample is likely to be quite low because almost one third of the sample is composed of college students.
More than one half of the participants had a college education whereas about 20% had only a high school education. In addition, the majority of the individuals lived in a nuclear family. approximately 16% of the indi-viduals’ families were in the expanding stage and 32.2% in the contracting stage. More than one half of the individuals were single and almost 46% were married; widowed or divorced was less common. Of those who were married, the largest group had been married for 6 to 10 years. about 41% of the participants had 1 child, 27.8% had 2, 11.2% had 3 or more, and 20.3% had no children.
Information on the Perceptions of Adequacy of Resources
The participants’ scores on the PaR inventory varied from 42 to 187, with a mean score of 123.01 and a median of 124, which indicated that individuals perceived their resources as adequate. The mean score was also calculated for each question. as shown in Table 2, responses to two items, “I have enough income to save money regularly” and “government
at Hacettepe Univeristy on July 31, 2015jfi.sagepub.comDownloaded from

Copur et al. / Perception of adequacy of Resources 1643
programs in my community are available to help me,” were relatively low, showing less perceived adequacy. In addition, scores were calculated for each subscale, showing that individuals perceived their financial resources (score = 13.98) to be less adequate than their other resources.
Females perceived their adequacy of resources (M = 123.56, SD = 22.88) a bit higher (but statistically significant at the .05 level) than that of males (M = 122.06, SD = 27.09), t = 0.658, df = 498, p > .05. Results of the aNOVa showed that education, income, marital status, number of chil-dren, and family life stage significantly (at least .05) affected scores on the PaR inventory. However, there was no significant relationship between participants’ scores on the PaR inventory and their gender, age, family type, or length of marriage. Table 3 shows the results of one-way aNOVa for education, where the means of educational levels was sig-nificant, F (4, 495) = 9.219, p < .01. For those variables showing sig-nificant differences, Tukey’s multiple comparison test was used to determine which pairs of categories of each variable were significantly different. For education, significant differences were found between the high school education category (M = 111.84, SD = 28.84) and college gradu-ates (M = 125.07, SD = 23.01), Ma graduates (M = 124.36, SD = 25.82), and those acquiring a PhD (M = 133.08, SD = 21.30).
The differences in perceived adequacy of resources among the income categories are shown in Table 3. as can be seen, the means increased as income increased (for 0-500 YTL: M = 120.81, SD = 23.67; for 501-1,000 YTL: M = 121.76, SD = 24.23; for 1,001-1,500 YTL: M = 132.80, SD = 22.27; for 1,501-2,000 YTL: M = 139.00, SD = 20.53; and for 2,001 or more YTL: M = 142.90, SD = 36.98), F(4, 495) = 5.313, p < .01. according to Tukey’s test, there were significant differences between the group with 0 to 500 YTL income and the following three groups: 1,001 to 1,500; 1,501 to 2,000; and 2,001 and more. Results on marital status (Table 3) also showed significant differences, with mean scores of the unmarried cate-gory (M = 126.50, SD = 22.78) being higher than those of the married cate-gory (M = 119.08, SD = 25.43) and of the widowed or divorced (M = 122.38, SD = 30.86), F(2, 497) = 5.685, p < .05. according to the results of the multiple comparison tests, however, there was a significant difference only between married and unmarried people.
as seen in Table 3, the number of children variable was also significant, with the means increasing from the one child category (M = 124.33, SD = 25.57) through the no children category (M = 119.85, SD = 25.98), the two children category (M = 116.34; SD = 23.51), and to the three or more children category (M = 107.03, SD = 26.91), F (3, 237) = 3.733,
at Hacettepe Univeristy on July 31, 2015jfi.sagepub.comDownloaded from

1644 Journal of Family Issues
p < .05. However, results of the multiple comparison tests revealed that the only significant difference was between people with one child and those with three or more children. as shown in Table 3, the aNOVa con-cerning family life stage was also significant, F(2, 497) = 2.993, p < .01. Tukey’s test was used again to determine pairwise differences between groups. The only significant difference was found between those in the contracting stage (M = 126.86, SD = 24.69) and those in the expanding stage (M = 121.05, SD = 24.02).
Before including age in the analysis, those aged 55 or older were placed in the next age category (45-55) because only a small number (n = 5) were 55 or older. Individuals in the 36 to 45 age category had a lower mean (M = 117.25, SD = 26.91) than the other age categories (–24: M = 124.89, SD = 22.4; 25-35: M = 123.03, SD = 23.8; 46+: M = 128.45, SD = 30.25); however, this difference was not significant, F(3, 496) = 2.612, p > .05. The mean of the individuals living in extended families (M = 118.31, SD = 23.93) was lower than those of other categories (nuclear, M = 123.16, SD = 24.51; single-parent, M = 127.87, SD = 22.9; alone or with sibling, M = 131.69, SD = 26.47), but again, there was no significant difference, F (3, 496) = 1.622, p > .05. The differences between length of marriage categories on PaR scores were also not significant (0-5 years of marriage: M = 122.22, SD = 22.39; 6-10 years: M = 118.19, SD = 24.47; 11-15 years: M = 121.56, SD = 25.67; 16-20 years: M = 107.44, SD = 30.36; 21+ years: M = 120.36, SD = 27.60), F(4, 223) = 1.722, p > .05.
Hierarchical regression analysis was used to examine contributions of demographic and family structure variables to the variance in the PaR. Means, standard deviations, and correlation coefficients for all variables are summarized in Table 4. as illustrated in the table, correlations ranged between –.80 (marital status and number of children) and .70 (age and number of children), which is a considerable range. Correlations were both negative and positive. although most correlations had significant .01 and .05 levels, no significant correlations were found among PaR and age, PaR and gender, PaR and family type, income and family type, gender and fam-ily type, family type and family life stage, and family type and number of children. Regression analysis was carried out because correlations between pairs of the predictor variables were lower than .80, which was evidence for little autocorrelation in the residuals.
as seen in Table 5, the first model of the hierarchical regression analysis with the outcome variable of PaR was significant (F = 13.27; p < .01); the independent variables included in the model (gender, age, income, education, marital status) accounted for 11% of the variance in the outcome variable.
at Hacettepe Univeristy on July 31, 2015jfi.sagepub.comDownloaded from

Copur et al. / Perception of adequacy of Resources 1645
Based on adjusted regression coefficients, the order of significance among variables was as follows: income, marital status, and education. When family structure variables of family type, family life stage, and number of children were added to the regression equation predicting PaR, this second model was significant as well (F = 8.28, p = .01). The new set of independent variables also accounted for 11% of the variance in the outcome variable. Thus, the adjusted R-squared was not significant; that is, the addition of the family structure variables did not increase the percentage of variance explained. Income, marital status, and education were the determining variables in the significance of the second model as well. To further exam-ine these findings, only those variables related to family characteristics were included in the stepwise regression analysis, which showed that none of these variables had a significant relationship with the outcome variable. Thus, income, marital status, and education were the variables making the most parsimonious prediction of adequacy scores.
Discussion
The purpose of this study was twofold. It was the first exploration of the PaR inventory in Turkish. Consequently, the validity and reliability was tested with the Turkish form of the inventory with a sample of adults having diverse demographic characteristics. In addition, the research examined individuals’ perceived adequacy of resources according to selected demo-graphic, socioeconomic, and family composition variables previously stud-ied in the West.
analyses of the data from 500 adults of diverse age categories, educa-tional levels, and family compositions showed the PaR inventory to be an acceptably reliable and valid measure in Turkish containing seven different resources. These resources are concluded to be physical environment, health and physical energy, time, financial, interpersonal, knowledge/skill, and com-munity. Multiple factor loadings on certain questions suggest that resources are likely to be interrelated. This is an expected result because resources are conceptually related and at some point may even be interchangeable.
Parallel to the literature (Ptacek et al., 1994), the present research also found that women had slightly, but not significantly, higher PaR inventory scores than did males. This result is consistent with previous studies in the literature. For example, Rommel (1989) found that gender was not a significant factor on variance in resource adequacy perception (RaP).
at Hacettepe Univeristy on July 31, 2015jfi.sagepub.comDownloaded from

1646 Journal of Family Issues
Lee (2000) also found no gender differences in perceived adequacy of family resources.
Following the examination of male–female differences, aNOVa was carried out for the remaining variables. The aNOVas showed significant (.05) differences in the perceptions of adequacy of resources according to income, marital status, number of children, family life stage, and educa-tional levels.
Prior studies have reported that the perception of the adequacy of resources increases in conjunction with an increase in income (Rettig et al., 1999). The current research also found that as the participants’ income levels increased, so did their perception of adequacy of resources. In con-trast, however, Hyun et al. (1993) found neither level of income nor level of education to be significant predictors of resource adequacy perception for either gender.
This study found a significant relationship between both family life stage and number of children and perceptions of adequacy of resources. Families in the contracting stage and those with one child scored higher on the PaR inventory. a curious finding of this study was that singles’ perceptions of adequacy of resources were higher than that of married people.
Hyun et al. (1993) reported age as the most important determinant of resource adequacy perception for both husbands and wives, with older husbands and wives perceiving their resources as more adequate than younger spouses. However, the results in this research were contradictory. No significant age differences were found. This could be because the par-ticipants in this study were almost all under 50, primarily under 36. Similarly, the current study did not find significant differences in percep-tions of adequacy of resources according to family type or to length of marriage. Rommel (1989), on the other hand, did determine a significant rela-tionship between length of marriage and perception of resource adequacy.
In addition, regression analysis showed that demographic variables sig-nificantly predicted perceptions of adequacy of resources. although two different regression models were significant, the hierarchical regression analysis indicated that only income, education, and marital status have independent impacts on perceptions of adequacy of resources. Thus, con-sidering the socioeconomic circumstances of Turkey, it seems likely that individuals perceive resources to be more adequate as income increases because the other resources seem highly contingent on income. Considering the seven resource categories, the results suggest perhaps that income and government programs are less likely to be perceived more adequate than
at Hacettepe Univeristy on July 31, 2015jfi.sagepub.comDownloaded from

Copur et al. / Perception of adequacy of Resources 1647
other resources in Turkey and those participants are less likely to be satis-fied with their economic status and available government programs. These results partially confirmed findings of previous studies cited in the litera-ture. For example, Sumarwan and Hira (1993) found that socioeconomic variables directly affect perceived income adequacy. Their results showed that gender, age, and household income have significant direct effects on perceived income adequacy. Rommel (1989) on the other hand found posi-tive relationships between RaP and the contextual variables of age, length of marriage, and family life stage but no significant relationship between income and RaP.
Individuals and families with the same resources may have different perceptions about adequacy of their resources to support their well-being. Those who perceive their resources as adequate may adjust their level of living to match their perceived resources and therefore feel satisfied with their status. according to the results of this study, individuals with various demographic variables hold differing perceptions of adequacy of resources. Thus, it would seem that perception affects subjective assessment of resources, which is in line with family resource management theory.
Insight into perceptions of adequacy of resources will perhaps provide opportunities for teachers and students to make plans and develop pro-grams to consider, discuss, and formulate strategies to cope with acquiring and using various kinds of resources. It could also direct policy makers’ attention to areas where resources are perceived to be less adequate, par-ticularly income and availability of government programs. Further insight into perceptions of resources could help family counselors and educators in developing programs and courses to enhance effective family resource management for families in Turkey. Professionals working with families could emphasize and clarify more the importance of perceptions of ade-quacy of resources in their courses and programs because individuals’ perceptions of their resources seem to determine, at least partially, aware-ness of their resources and level of satisfaction. Perception is an important concept in family resource management and should be included in resource management educational programs for both males and females. The infor-mation on how families in various circumstances perceive their adequacy of resources could not only be helpful to educators but also assist individuals and families in making better use of their resources and in analyzing the reality of their goals in relation to their resources. These two factors are essential components of the planning process. From a resource management perspective, understanding the significance of families’ perceptions of their resources could help emphasize the development of appropriate managerial
at Hacettepe Univeristy on July 31, 2015jfi.sagepub.comDownloaded from

1648 Journal of Family Issues
activities about their resources. all of these efforts can assist the educator in helping individuals and families discover what aspects they can control and change.
The present study has some methodological limitations that should be taken into account. The sample of the study included only individuals at Hacettepe University, which limits the generalizability of the results. Hacettepe is one of the most prestigious universities in Turkey and is located in ankara, the capital of Turkey. Thus, its employees and students may differ in a significant manner from other universities as well as general populations. Further studies working with more diverse samples are needed. For instance, studies could investigate perceived adequacy of resources among less educated and rural populations in Turkey. Despite these limita-tions, the current study appears to make several contributions to the litera-ture. First, the Perceptions of adequacy of Resource inventory was found to have intercultural validity and reliability in this Turkish sample. In addi-tion, income, education, marital status, number of children, and family life stage were found to be significantly related to scores on the PaR inventory, with income, education, and marital status being the most independent predictors of perceptions of adequacy of resources.
References
Buehler, C., & Hogan, M. J. (1985). Managerial functioning in single-parent families. In S. Nickols (ed.), The balancing act: Thinking globally–acting locally (pp.170-180). Washington, DC: american Home economics association.
Burrell, B., Thompson, B., & Sexton, D. (1995). Measurement characteristics of the perceived adequacy of resources scale. Educational and Psychological Measurement, 55(2), 249-257.
Campbell, a., Converse, P. e., & Rogers, W. L. (1976). The quality of American life. New York: Russell Sage.
Cattell, R. B. (1952). Factor analysis. New York: Harper.Danes, S. M., & Rettig, K. D. (1993). The role of perception in the intention to change the
family financial situation. Journal of Family and Economic Issues, 14(4), 365-389.Deacon, R. e., & Firebaugh, F. M. (1988). Family resource management, Principles and
applications. Boston: allyn & Bacon.Duncan, S. F., Volk, R. J., & Lewis, R. a. (1988). The influence of financial stressors upon
farm husbands and wives well-being and family life satisfaction. In R. Marotz-Baden, C. B. Hannon, & T. Brabaker (eds.), Families in rural America: Stress, adaptation and revitalization (pp. 32-39). St. Paul, MN: National Council on Family Relations.
enevoldsen, B. L. (1994). Factors that influence a rural financial manager’s satisfaction with current economic well-being and ability to achieve success and get ahead. Retrieved October 28, 2004, from http://wwwlib.umi.com/dissertations/fullcit/9405320
Fitzsimmons, V. S., Hira, T. K., Bauer, J. W., & Hafstrom, J. I. (1993). Financial management: Development of scales. Journal of Family and Economic Issues, 14(3), 257-274.
at Hacettepe Univeristy on July 31, 2015jfi.sagepub.comDownloaded from

Copur et al. / Perception of adequacy of Resources 1649
Fox, g. L., & Chancey, D. (1998). Sources of economic distress: Individual and family out-comes. Journal of Family and Economic Issues, 19(6), 725-749.
gross, I. H., Crandall, e. W., & Knoll, M. M. (1980). Management for modern families. englewood Cliffs, NJ: Prentice-Hall.
Hafstrom, J. L., & Dunsing, M. M. (1973). Level of living: Factors influencing the home-maker’s satisfaction. Home Economics Research Journal, 1, 121-132.
Hyun, e. M., Bauer, J. W., & Hogan, M. J. (1993). Resource adequacy perception and marital satisfaction of rural wives and husbands: a no recursive model. Journal of Family and Economic Issues, 14(3), 215-236.
Ilbars, Z. (2000). The Turkish Family in the process of change. Ethnologia Balkanica, 4, 59-65.Lee, H. S. (2000). The effects of family resources and social support on family functioning
style among Korean immigrant families in the U.S. Journal of Family and Consumer Sciences, 92(3), 66-70
Memur-Sen. (2006). Aclık ve yoksulluk sınırı [Starvation and poverty limit]. Retrieved October 28, 2006, from http://www.memursen.org.tr/resimdepoloji/Resim/Upload/ 200609301.doc
Nicolas, P. C., & Little, B. g. (1991). effect of economic resources on marital quality in Black married couples. Journal of Marriage and the Family, 53, 645-655.
O’Neill, B., Xiao, J., Bristow, B., Brennan, P., & Kerbel, C. M. (2000). Successful financial goal attainment: Perceived resources and obstacles. Financial Counseling and Planning, 11(1), 1-12.
Ormsby, P., & Ted Fairchild, g. (1987). Perceived income adequacy and selected financial management practices among families in Chile and Mexico. Social Indicators Research, 19(3), 317-327.
Ptacek, J. T., Smith, R. e., & Dodge, K. (1994). gender differences in coping with stress: When stressors and appraisals do not differ. Journal of Personality and Social Psychology Bulletin, 20, 621-630.
Rettig, K. D. (1993). Problem-solving and decision-making as central processes of family life: an ecological framework for family relations and family resource management. Marriage and Family Review, 18, 187-222.
Rettig, K. D., Leichtentritt, R., & Danes, S. M. (1999). The effects of resources, decision mak-ing, and decision implementing on perceived family well-being in adjusting to an eco-nomic stressor. Journal of Family and Economic Issues, 20(1), 5-34.
Rommel, J. I. (1989). Wives’ and husbands’ resource adequacy perception, conflict resolution and contextual variables: A longitudinal study. Unpublished doctoral dissertation, University of Minnesota, St. Paul.
Rosenblatt, P. C., & Keller, L. O. (1983). economic vulnerability and economic stress in farm couples. Family Relations, 92, 567-573.
Rowland, V. T., Dodder, R. a., & Nickols, S. (1985). Perceived adequacy of resources: Development of a scale. Home Economics Research Journal, 14(2), 218-225.
Rowland, V. T., & Nickols, S. Y. (1985). How is the time spent? Journal of Extension, 23(1), 13-16.
Schram, V. R., & Hafstrom, J. L. (1986). Family resources related to wife’s time inputs to housework. Journal of Consumer Studies and Home Economics, 10, 235-245.
Sencan, H. (2005). Sosyal ve davranissal ölçümlerde güvenirlik ve gecerlik [The reliability and validity of the social and behavioral measurements]. Seckin Yayinlari, ankara.
at Hacettepe Univeristy on July 31, 2015jfi.sagepub.comDownloaded from

1650 Journal of Family Issues
Sumarwan, U., & Hira, T. (1993). The effects of perceived locus of control and perceived income adequacy on satisfaction with financial status of rural households. Journal of Family and Economic Issues, 14(4), 343-364.
Terzioglu, R. g. (1987). Ev idaresi ilkeleri [Home management principles]. Dogus Matbaacilik ve Ticaret Limited Sirketi, ankara.
Terzioglu, R. g. (2000). Ev ekonomisinde aile kaynaklarinin yönetiminin yeri ve önemi [Importance and placement of family resources in the home economics]. Ulusal ev ekonomisi Kongresi (National Home economics Congress), Bildiriler 6-7 Kasım 1997, ankara Universitesi Basımevi, ankara.
Thorndike, R. L., & Hagen, e. P. (1961). Measurement and evaluation in psychology and education. New York: John Wiley.
Tucker, L. R., & Mac Callum, R. C. (1997). Exploratory factor analysis. Retrieved October 15, 2006, from http://www.unc.edu/~rcm/book/factornew.htm
Turkish Statistical Institute. (2003). Genel Nüfus Sayımı [Census]. Retrieved august 02, 2003, from http://www.die.gov.tr/nufus_sayimi.htm
Turkish Statistical Institute. (2006). Aile Yapisi Arastirmasi 2006 [Family Structure Research 2006]. Turkiye Istatistik Kurumu Matbaasi, Yayin No. 3046, ankara.
Voydanoff, P. (2004). The effects of work and community resources and demands on family integration. Journal of Family and Economic Issues, 25(1), 7-23.
Walker, R., & garman, e. T. (1992). The meanings of money. American Behavioral Scientist, 35(6), 781-789.
Walson, C. O. (1992). Determinants of financial managers’ perception of rural household economic well-being: an analysis of composite measure. Retrieved October 28, 2004, from http://wwwlib.umi.com/dissertations/fullcit/9211024
Weigel, D. J., & Weigel, R. R. (1990). Family satisfaction in two-generation farm families: The role of stress and resources. Family Relations, 39, 449-455.
Williams, F. L., Nall, M., & Deck, P. Z. (1976). Financial problems of urban families. Home Economics Research Journal, 4, 185-196.
Yavuz, S. (2004, May 17). Changing household and family compositions in Turkey: a demographic evaluation for 1968-1998 period. Hacettepe Universitesi Sosyolojik Arastirmalar e-Dergisi. Retrieved November 3, 2006, from http://www.sdergi.hacettepe.edu.tr/sutaymakale.htm
at Hacettepe Univeristy on July 31, 2015jfi.sagepub.comDownloaded from