chapter 6: adequacy of haemodialysis (urea reduction ratio
TRANSCRIPT
61
Chapter 6: Adequacy of haemodialysis (Urea reduction ratio) Summary In England & Wales a uniform method of measuring the post dialysis urea sample (as suggested in the 1997 Renal Association standards document) has not yet been implemented. This standardisation is essential to permit meaningful comparative audit among participating renal units. Within Scotland, where a uniform method of post dialysis sampling has been put in place, there is still a wide variation of 57-90% in the percentage of patients at centres achieving a urea reduction ratio (URR) greater than 65%. Due to ‘population distribution curves’, centres will need to reach a median URR of 75% for almost all patients to have a URR >65%. A cross sectional analysis of patients in 1999 showed there was a continuing rise in URRs over the 2 years from starting dialysis. This rose from 40% achieving a URR > 65% in the first 6 months to 70% achieving this at 2 years. Within England and Wales, there has been a year on year increase in dialysis adequacy over the three years of the Registry. The Renal Registry data demonstrate that ‘adequate’ URR results can be achieved. It is hoped that the wide variation in URR achieved in these early cycles of audit of hospital haemodialysis will continue to decrease. Attention is drawn to the limitation in the use of URR to measure dialysis adequacy. It is used at present as it permits verifiable comparison between centres from the data collected by the Registry. Haemodialysis frequency The Standards document states “Twice weekly haemodialysis is not recommended except where there is good preservation of renal function.” The majority of patients in Registry units (94%) received thrice weekly dialysis. Many units have a small proportion of patients (<6%), often with some residual renal function, who dialyse twice weekly. Centre P had the largest proportion of patients (20%) on twice weekly dialysis, due to limited facilities (including staff) and financial constraints. Solute clearance Standards The Renal Standards Document recommends that all patients stable on three times a week haemodialysis should show :
A urea reduction ratio > 65% Or Kt/V > 1.2 (dialysis and residual renal function)
62
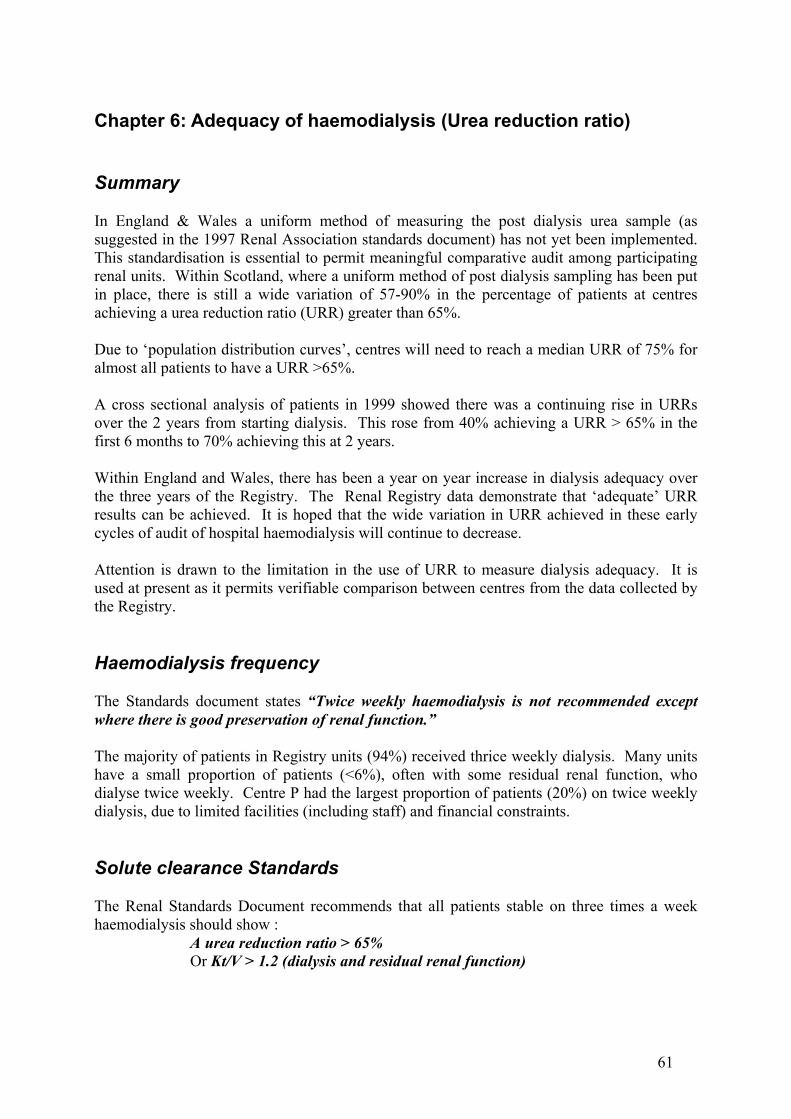
The Standards document considers both Kt/V and Urea Reduction Ratio (URR) as indicators of adequacy of haemodialysis. Several different methods are in use for calculating Kt/V and they give results which vary significantly. For meaningful comparisons, the Registry would need to calculate Kt/V by a single method from the raw data. For example, were the Daugirdas formula used, this would require, as a minimum, a knowledge of pre and post dialysis weights and duration of treatment. This information is not available from many units. The simpler calculation of URR, the percentage fall in blood urea during a dialysis session, is possible and remains the method used by the Registry. This has been shown to correlate with patient survival (Owen, Held). Interpretation of results At present, post dialysis sampling methodology is not uniform across units. A caveat similar to that in the 1999 Report is still placed over the interpretation of the URR results. For convenient reference, the discussion presented in the 1999 report has been reproduced at the end of this chapter. There has been no large move by all centres to a single “post urea” measurement standard. In 1999 some of the centres in England have moved to the Mactier “stop-dialysate-flow” method used by all the Scottish renal units. Use of the Mactier method has been shown to produce a lower URR than the two other main methods in use. This does cause an apparent reduction of achievement of the standard by the centre compared to a centre using the Renal Association recommended “slow flow” method. Centre achievement of the Standard
Figure 6.1 Percentage patients with URR > 65% in the last quarter of 1999 The data above excludes patients known to be on home haemodialysis or dialysing less than three times per week in the last quarter of 1999. The individual centre data from Scotland has also been included this year. Centres F and U have been excluded due to incompleteness of data.
Urea reduction ratio
40
45
50
55
60
65
70
75
80
Sj8
Sd13
Sk4
W0
A0
B12
Se4
Si0
Sc12
Sf16
N2
T4
V0
Sg10
G5
J8
D10
M17
C1
O22
Sh0
I3
K4
L25
H2
Sb3
X4
Sa1
P2
R4
Sct6
E&W19
UK17
Centre
Ure
a re
duct
ion
ratio
Lower 95% CI
Median URR
Upper95% CI
63
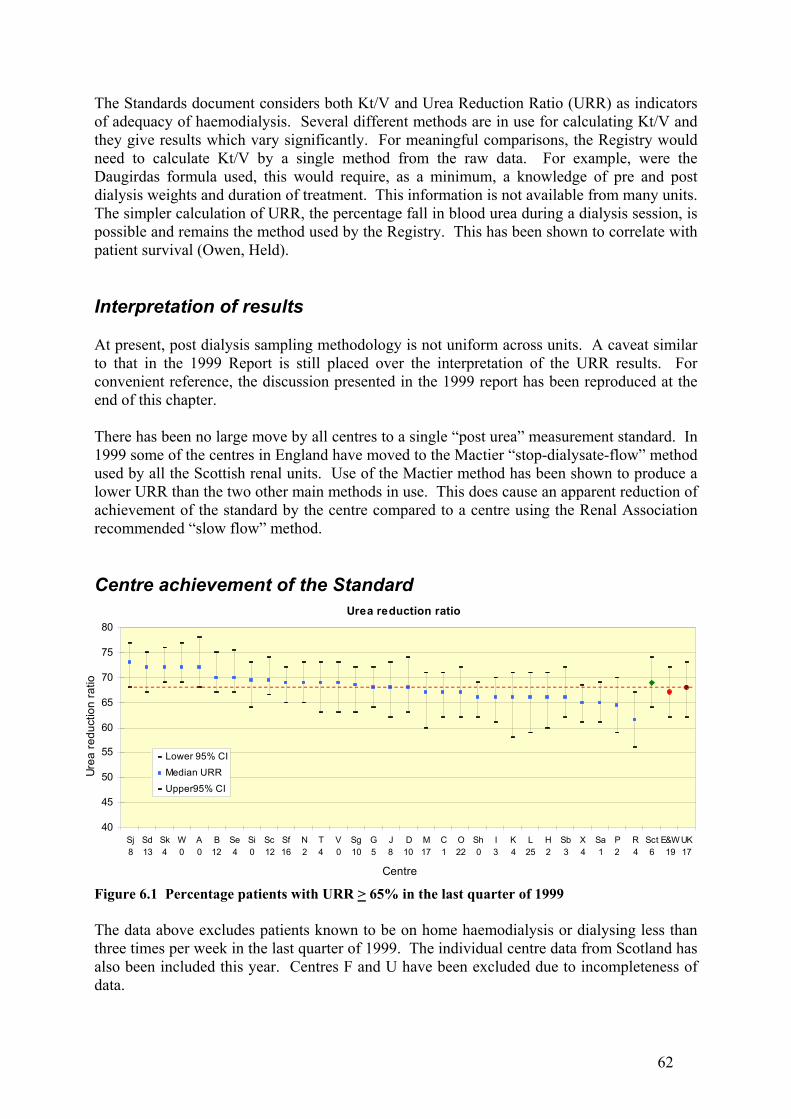
Figure 6.2 Urea reduction ratio distribution There is wide variation between units, in the proportion of patients who achieve the current minimum Standard URR. For England and Wales, the percentage of hospital haemodialysis patients with a compliant URR (>65%) averaged 65% for all of the 19 units which was improved from 54% at the start of 1998 and 57% in the last quarter of 1998. There was still a wide variation between centres from 89% to 34% (97% - 28% in 1998). The results for England & Wales are significantly lower than Scotland which achieved a URR of >65% in 73% of patients (71% in 1998) with a variation between centres of 90% - 57%. Centre R indicate most patients in 1998 were on 3 hours dialysis due to lack of funding. In 1999 these hours were being increased and the data shows some improvement from 1998. The URR calculation does not include residual renal function and so underestimates the true clearance. We have chosen to use it because it permits comparison across centres from the data which is collected at present.
Urea Reduction ratio
0%
10%
20%
30%
40%
50%
60%
70%
80%
90%
100%
Sk4
A0
W0
Sj8
Sc12
Se4
B12
Sd13
N2
Sf16
Si0
V0
T4
G5
Sg10
D10
C1
J8
Sh0
O22
M17
H2
Sb3
Sa1
I3
L25
X4
K4
P2
R4
Sct6
E&W19
UK17
Centre
Perc
enta
ge o
f pat
ient
s
>= 75%
65-74%
60-64%
55-59%
<55%
64
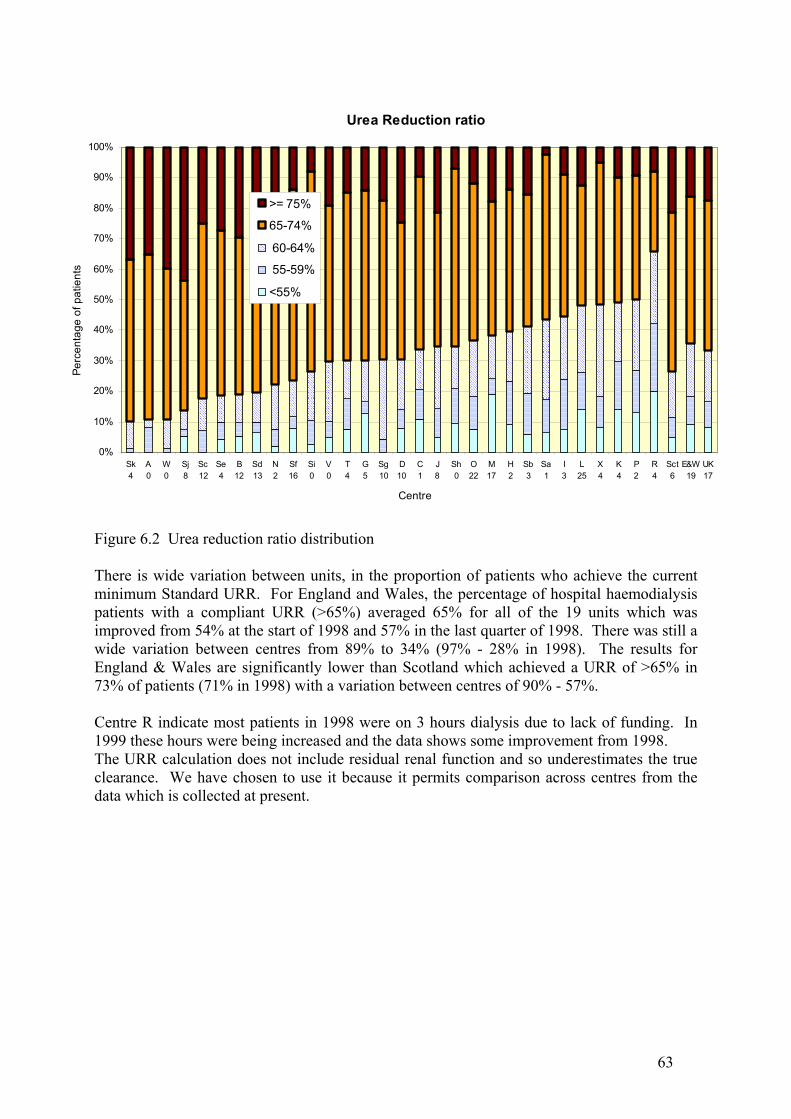
Figure 6.1b Achievement of the RA Standard for haemodialysis
Figure 6.3 URR achievement and median URR The above figure of median URR v percentage of patients achieving the Standard reveals a linear relationship, although it would be expected to tail off at the top end as a URR of >65% may well not be achievable in 100% of patients. It provides a strong indication that with current practice, a centre would have to reach a median URR of 75% for almost all patients to achieve a URR of >65%. This is even true for the USA with a different frequency distribution curve and 73% of patients with a URR >65% with a mean URR of 69%. Change in URR during 1998-99 Overall the URRs increased in 1999 although, in England & Wales, the URR still lagged behind levels achieved in Scotland and the USA.
URR > 65% v Median URR
30
40
50
60
70
80
90
100
60 62 64 66 68 70 72 74
Median URR
% p
atie
nts
> 65
Percentage URR > 65%
20
30
40
50
60
70
80
90
100
Sk4
A0
W0
Sj8
Sc12
Se4
B12
Sd13
N2
Sf16
Si0
V0
T4
G5
Sg10
D10
C1
J8
Sh0
O22
M17
H2
Sb3
Sa1
I3
L25
X4
K4
P2
R4
Sct6
E&W19
UK17
Centre
% o
f pat
ient
s >
65%
Low er 95% CI% w ith URR >= 65
Upper 95% CI
65
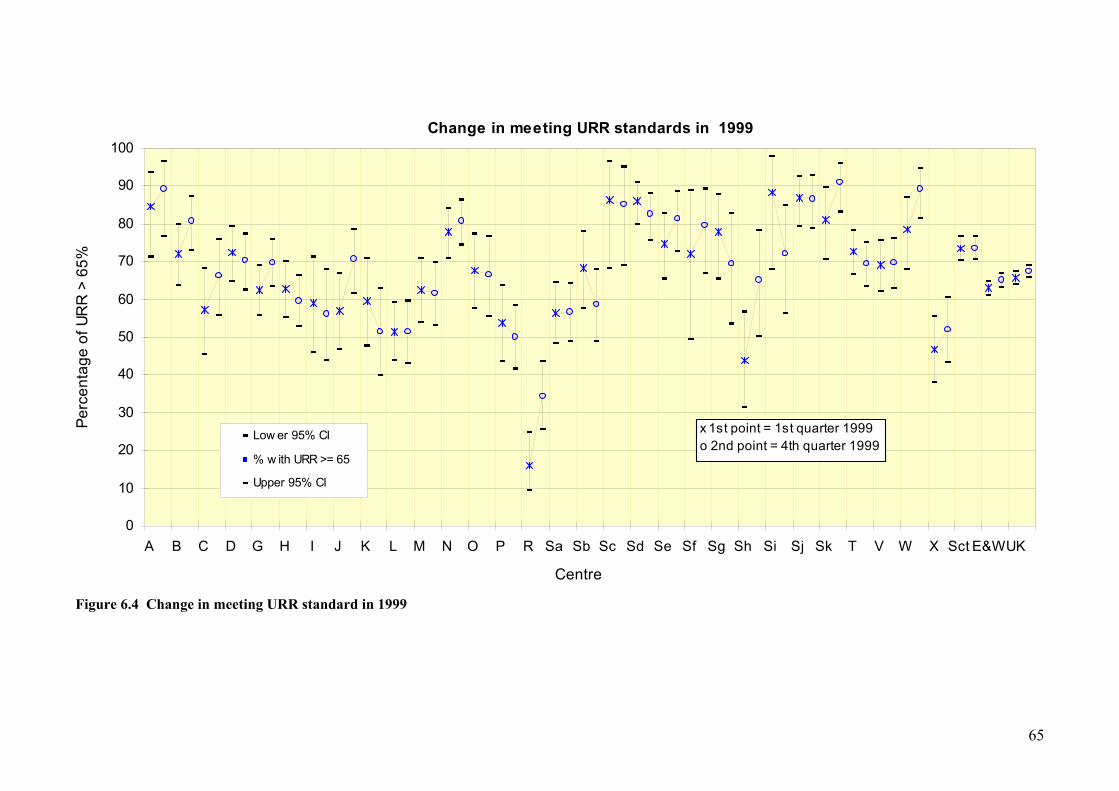
Figure 6.4 Change in meeting URR standard in 1999
Change in meeting URR standards in 1999
0
10
20
30
40
50
60
70
80
90
100
A B C D G H I J K L M N O P R Sa Sb Sc Sd Se Sf Sg Sh Si Sj Sk T V W X Sct E&W UK
Centre
Perc
enta
ge o
f UR
R >
65%
Low er 95% CI
% w ith URR >= 65
Upper 95% CI
x 1st point = 1st quarter 1999o 2nd point = 4th quarter 1999
66
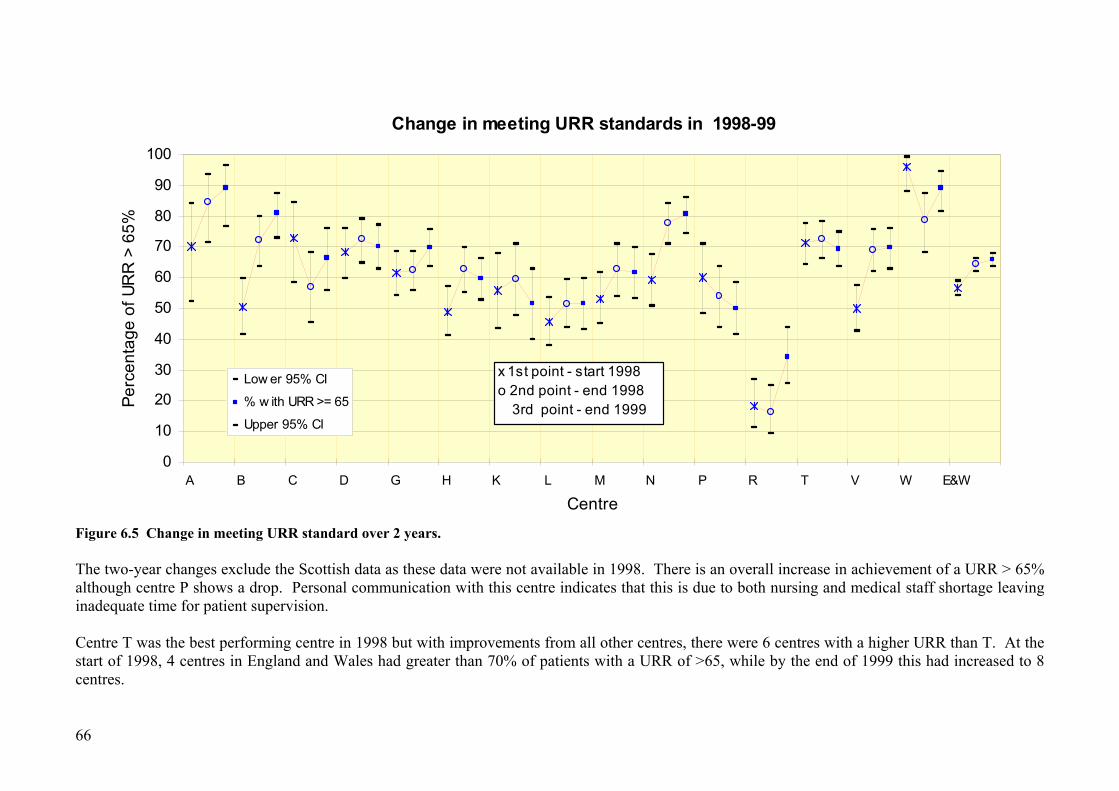
Figure 6.5 Change in meeting URR standard over 2 years. The two-year changes exclude the Scottish data as these data were not available in 1998. There is an overall increase in achievement of a URR > 65% although centre P shows a drop. Personal communication with this centre indicates that this is due to both nursing and medical staff shortage leaving inadequate time for patient supervision. Centre T was the best performing centre in 1998 but with improvements from all other centres, there were 6 centres with a higher URR than T. At the start of 1998, 4 centres in England and Wales had greater than 70% of patients with a URR of >65, while by the end of 1999 this had increased to 8 centres.
Change in meeting URR standards in 1998-99
0
10
20
30
40
50
60
70
80
90
100
A B C D G H K L M N P R T V W E&W
Centre
Perc
enta
ge o
f UR
R >
65%
Low er 95% CI
% w ith URR >= 65
Upper 95% CI
x 1st point - start 1998o 2nd point - end 1998 3rd point - end 1999
67
Achievement of standards in patients starting haemodialysis in1999
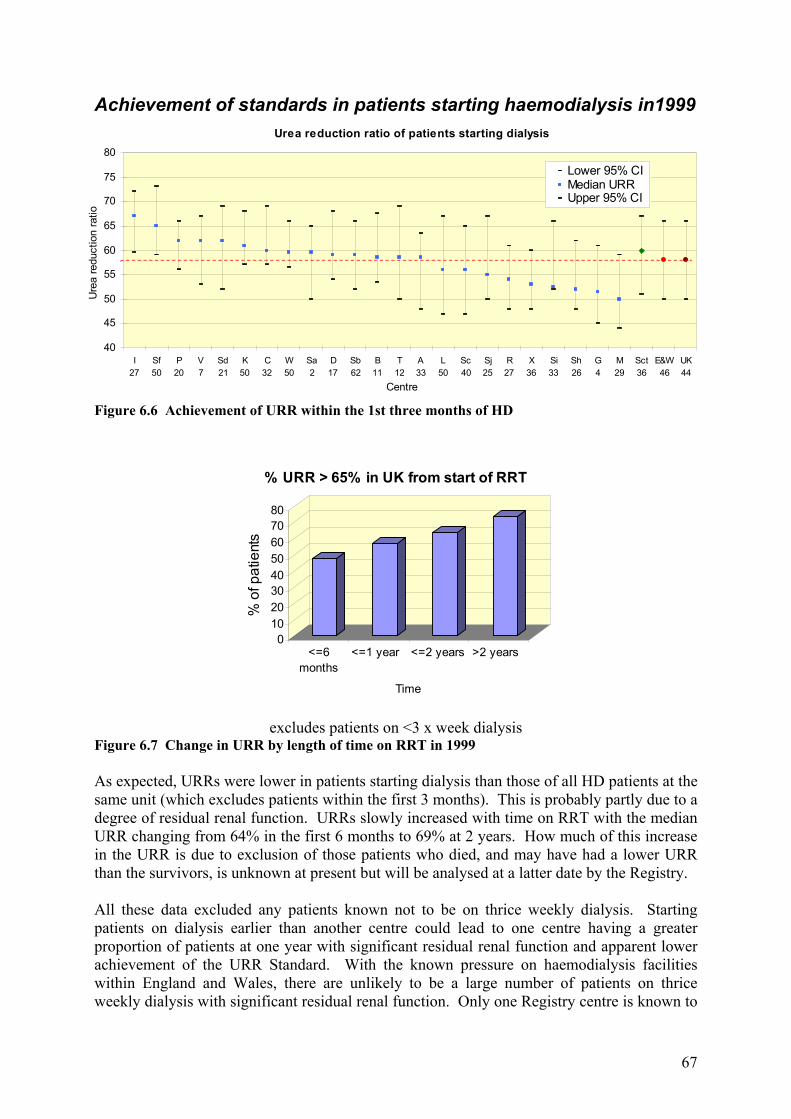
Figure 6.6 Achievement of URR within the 1st three months of HD
excludes patients on <3 x week dialysis Figure 6.7 Change in URR by length of time on RRT in 1999 As expected, URRs were lower in patients starting dialysis than those of all HD patients at the same unit (which excludes patients within the first 3 months). This is probably partly due to a degree of residual renal function. URRs slowly increased with time on RRT with the median URR changing from 64% in the first 6 months to 69% at 2 years. How much of this increase in the URR is due to exclusion of those patients who died, and may have had a lower URR than the survivors, is unknown at present but will be analysed at a latter date by the Registry. All these data excluded any patients known not to be on thrice weekly dialysis. Starting patients on dialysis earlier than another centre could lead to one centre having a greater proportion of patients at one year with significant residual renal function and apparent lower achievement of the URR Standard. With the known pressure on haemodialysis facilities within England and Wales, there are unlikely to be a large number of patients on thrice weekly dialysis with significant residual renal function. Only one Registry centre is known to
01020304050607080
% o
f pat
ient
s
<=6months
<=1 year <=2 years >2 years
Time
% URR > 65% in UK from start of RRT
Urea reduction ratio of patients starting dialysis
40
45
50
55
60
65
70
75
80
I27
Sf50
P20
V7
Sd21
K50
C32
W50
Sa2
D17
Sb62
B11
T12
A33
L50
Sc40
Sj25
R27
X36
Si33
Sh26
G4
M29
Sct36
E&W46
UK44
Centre
Ure
a re
duct
ion
ratio
Lower 95% CIMedian URRUpper 95% CI
68
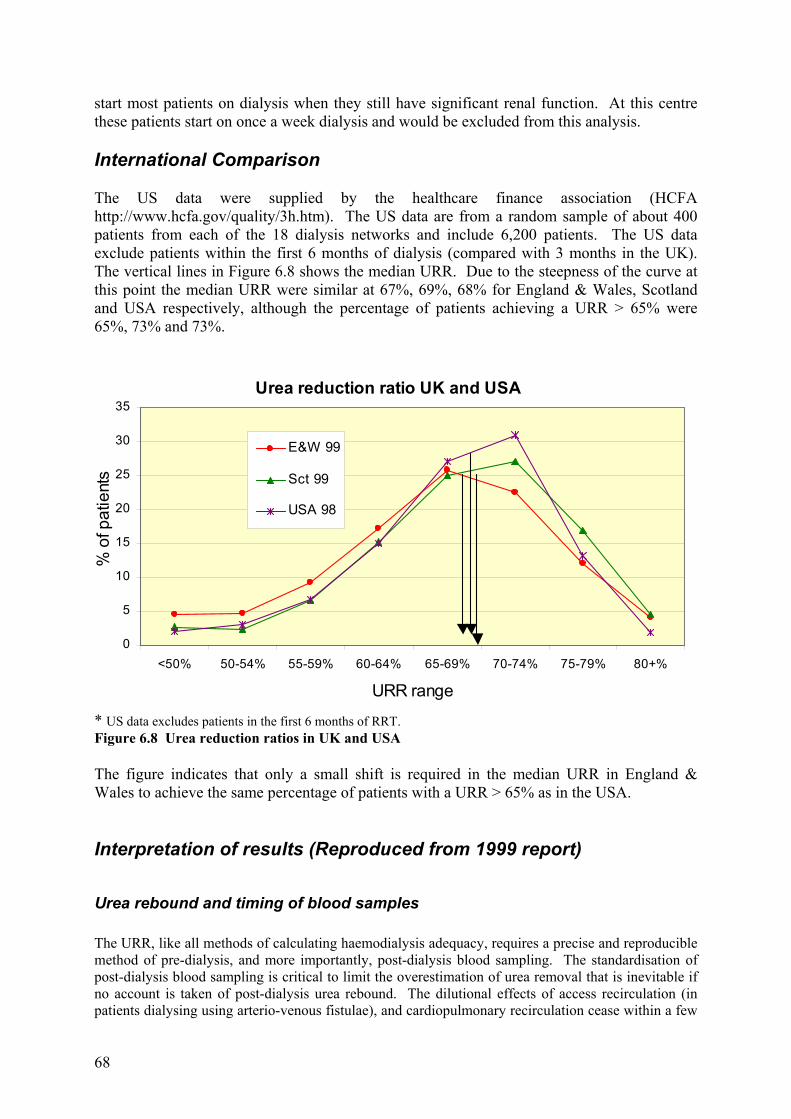
start most patients on dialysis when they still have significant renal function. At this centre these patients start on once a week dialysis and would be excluded from this analysis. International Comparison The US data were supplied by the healthcare finance association (HCFA http://www.hcfa.gov/quality/3h.htm). The US data are from a random sample of about 400 patients from each of the 18 dialysis networks and include 6,200 patients. The US data exclude patients within the first 6 months of dialysis (compared with 3 months in the UK). The vertical lines in Figure 6.8 shows the median URR. Due to the steepness of the curve at this point the median URR were similar at 67%, 69%, 68% for England & Wales, Scotland and USA respectively, although the percentage of patients achieving a URR > 65% were 65%, 73% and 73%.
* US data excludes patients in the first 6 months of RRT. Figure 6.8 Urea reduction ratios in UK and USA The figure indicates that only a small shift is required in the median URR in England & Wales to achieve the same percentage of patients with a URR > 65% as in the USA. Interpretation of results (Reproduced from 1999 report)
Urea rebound and timing of blood samples The URR, like all methods of calculating haemodialysis adequacy, requires a precise and reproducible method of pre-dialysis, and more importantly, post-dialysis blood sampling. The standardisation of post-dialysis blood sampling is critical to limit the overestimation of urea removal that is inevitable if no account is taken of post-dialysis urea rebound. The dilutional effects of access recirculation (in patients dialysing using arterio-venous fistulae), and cardiopulmonary recirculation cease within a few
Urea reduction ratio UK and USA
0
5
10
15
20
25
30
35
<50% 50-54% 55-59% 60-64% 65-69% 70-74% 75-79% 80+%
URR range
% o
f pat
ient
s
E&W 99
Sct 99
USA 98
69
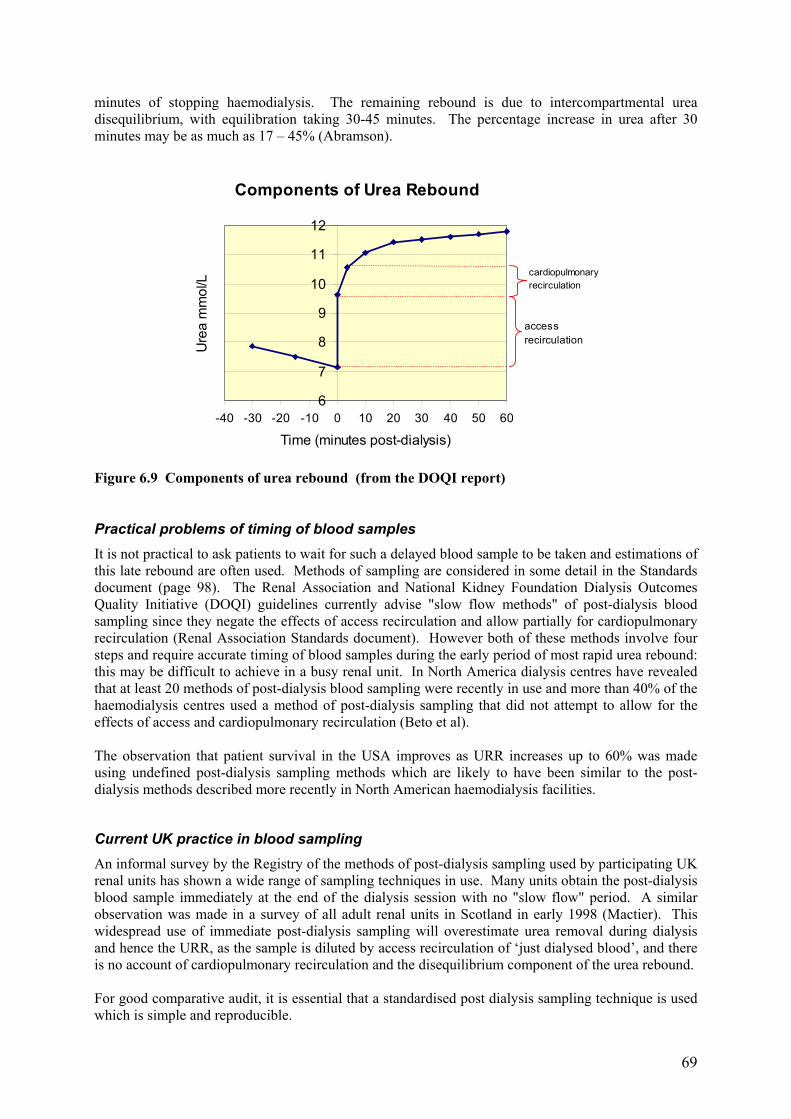
minutes of stopping haemodialysis. The remaining rebound is due to intercompartmental urea disequilibrium, with equilibration taking 30-45 minutes. The percentage increase in urea after 30 minutes may be as much as 17 – 45% (Abramson).
Components of Urea Rebound
6
7
8
9
10
11
12
-40 -30 -20 -10 0 10 20 30 40 50 60
Time (minutes post-dialysis)
Ure
a m
mol
/L
accessrecirculation
cardiopulmonaryrecirculation
Figure 6.9 Components of urea rebound (from the DOQI report)
Practical problems of timing of blood samples It is not practical to ask patients to wait for such a delayed blood sample to be taken and estimations of this late rebound are often used. Methods of sampling are considered in some detail in the Standards document (page 98). The Renal Association and National Kidney Foundation Dialysis Outcomes Quality Initiative (DOQI) guidelines currently advise "slow flow methods" of post-dialysis blood sampling since they negate the effects of access recirculation and allow partially for cardiopulmonary recirculation (Renal Association Standards document). However both of these methods involve four steps and require accurate timing of blood samples during the early period of most rapid urea rebound: this may be difficult to achieve in a busy renal unit. In North America dialysis centres have revealed that at least 20 methods of post-dialysis blood sampling were recently in use and more than 40% of the haemodialysis centres used a method of post-dialysis sampling that did not attempt to allow for the effects of access and cardiopulmonary recirculation (Beto et al). The observation that patient survival in the USA improves as URR increases up to 60% was made using undefined post-dialysis sampling methods which are likely to have been similar to the post-dialysis methods described more recently in North American haemodialysis facilities.
Current UK practice in blood sampling An informal survey by the Registry of the methods of post-dialysis sampling used by participating UK renal units has shown a wide range of sampling techniques in use. Many units obtain the post-dialysis blood sample immediately at the end of the dialysis session with no "slow flow" period. A similar observation was made in a survey of all adult renal units in Scotland in early 1998 (Mactier). This widespread use of immediate post-dialysis sampling will overestimate urea removal during dialysis and hence the URR, as the sample is diluted by access recirculation of ‘just dialysed blood’, and there is no account of cardiopulmonary recirculation and the disequilibrium component of the urea rebound. For good comparative audit, it is essential that a standardised post dialysis sampling technique is used which is simple and reproducible.
70
In the absence of a formal programme of standardisation of dialysis methods in the UK, only one method of sampling has been in evaluation. In 1999 all the renal units in Scotland, and some in England, have utilised a standardised method of post-dialysis blood sampling from any point in the extracorporeal circuit, 5 minutes after stopping the dialysate flow while the dialyser blood flow rate remains unchanged (Traynor et al). This "stop dialysate flow" method does not require exact timing of blood sampling, permits blood sampling from the arterial or venous limbs of the extracorporeal circuit and is practical to perform in a busy unit. This has proved reproducible, allowing for both access and cardiopulmonary recirculation, if not for the disequilibrium component of urea rebound. This technique has been verified in 117 patients. During the same haemodialysis session the URR was 69.1 (s.d. 9.3%) when using the "stop dialysate flow" method compared with 71.7 (s.d. 8.3%), when blood sampling was performed immediately at the end of haemodialysis (p < 0.0001). The method is being further evaluated. It should be noted that the extent of urea rebound depends on the intensity of dialysis in terms of K/V and t, so that a wide range of treatment conditions are required to validate any sampling method. The ‘stop dialysate flow method is not suitable for conversion to estimate Kt/V, unlike versions of ‘slow flow’, so that international and historical data comparisons may be compromised by concentration on this method.
Implications for URR results calculated by the Renal Registry Without a standardised post dialysis sampling technique in use by all units, it must be accepted that many units will be overestimating URR by taking immediate “no slow flow” samples. This is part of a wider problem with URR, however, because it takes no account of urea removal by ultrafiltration. This distorts the equivalence of URR 65% and Kt/V 1.2, which is further flawed because of the effects of variable dialysis time, t. For these reasons URR is not a reliable indicator of haemodialysis dose, despite its relationship to outcomes. This is particularly important when the distribution of unit results clusters around the Standard 65% value, because even a small bias in the data will profoundly shift the percentage compliance with Standard. Values well above (or below) the Standard will be scarcely affected. There are several examples of this from Figures 5.1 and 5.2, where it is clear that a very small change in median URR achieved can make a profound difference to the compliance with the Standard. However, any attempt to increase URR values will tend to increase delivered dialysis doses. In very large-scale mortality studies, these niceties appear to be less relevant. It should be stressed again that the observation that patient survival in the USA improves as URR increases up to 60%, was made using undefined post-dialysis sampling methods. References 1. Abramson F, Gibson S, Barlee V, Bosch JP: Urea kinetic modeling at high urea
clearances: Implications for clinical practice. Advances in Renal Replacement Therapy 1:5-14, 1994
2. Beto JA, Bansal VK, Ing TS, Daugidas JT. Variation in blood sample collection for
determination of haemodialysis adequacy. Arner J Kid Dis 1998; 31: 135-141. 3. Clinical practice guidelines for haemodialysis adequacy. National Kidney Foundation
Dialysis Outcomes Quality Initiative (DOQI). 1997; 25-61. 4. Clinical practice guidelines of the Canadian Society of Nephrology for the treatment of
patients with chronic renal failure. J Am Soc Nephrol 1999; 10: S307.
71
5. Held PJ, Port FK, Wolfe RA, Stannard DC, Carroll CE, Daugirdas JT, Greer JW, Hakim
RM: The dose of hemodialysis and patient mortality. Kidney Int 50:550-556, 1996 6. Leblanc M, Charbonneau R, Lalumiere G, Cartier P, Deziel C: Postdialysis urea rebound:
Determinants and influence on dialysis delivery in chronic haemodialysis patients. Am J Kidney Dis 27:253-261, 1996
7. Owen WF, Lew NL, Liu Y. Lowrie KG, Lazarus JM. The urea reduction ratio and serum
albumin as predictors of mortality in patients undergoing haemodialysis. N Engl J Med 1993; 329: 1001-1006.
8. Treatment of adult patients with renal failure. Recommended standards and audit
measures. The Renal Association 1998; 21 -22. 9. Traynor J. Geddes CC, Walbaum D, MacGregor M, Allam B. Fox JG, Mactier RA. A
new method of post-dialysis blood sampling: the "stop dialysate flow" method. Nephrol Dial Transplant 1999; 14: 2063A.
10. The Scottish Renal Registry. Audit of quality of hospital haemodialysis in Scotland.
Nephrol Dial Transplant 1997; 12: 29-32. 11. The Scottish Renal Registry. The quality of hospital haemodialysis in Scotland -
improvement with audit. Health Bulletin 1999; 57: 237-240. 12. Seghal AR, Snow RJ, Singer ME, et al. Barriers to Adequate Delivery of
Hemodialysis.Am J Kidney Dis 1998;31:593-601