pavement design optimization considering costs and preventive interventions
TRANSCRIPT
Procedia - Social and Behavioral Sciences 53 ( 2012 ) 1184 – 1193
1877-0428 © 2012 The Authors. Published by Elsevier Ltd. Selection and/or peer-review under responsibility of SIIV2012 Scientific Committeedoi: 10.1016/j.sbspro.2012.09.967
SIIV - 5th International Congress - Sustainability of Road Infrastructures
Pavement design optimization considering costs and M&R interventions
João Santosa, Adelino Ferreiraa,* aDepartment of Civil Engineering, University of Coimbra, Rua Luís Reis Santos, 3030-788 Coimbra, Portugal
Abstract
Due to the economic crisis, in Portugal, as in many other countries, the trend of budgetary pressures on highway agencies is increasing. Simultaneously, road users are increasingly demanding in terms of highway quality, comfort and safety. To meet these challenges highway agencies are looking for more cost-effective methodologies for pavement management at project-level. This paper presents a new pavement design optimization model, called OPTIPAV, which considers pavement performance, construction costs, maintenance and rehabilitation costs, user costs, the residual value of the pavement at the end of the project analysis period, and preventive maintenance and rehabilitation interventions.
© 2012 The Authors. Published by Elsevier Ltd. Selection and/or peer-review under responsibility of SIIV2012 Scientific Committee Keywords: Pavement design; optimization; maintenance and rehabilitation costs; preventive interventions.
1. Introduction
Due to the economic crisis, in Portugal, as in many other countries, the trend of budgetary pressures on highway agencies is increasing. Simultaneously, road users are increasingly demanding in terms of highway quality, comfort and safety. Several highway projects have been delayed because of budget constraints. To meet these challenges highway agencies are looking for more cost-effective methodologies for pavement management at project-level.
Highway pavements can be designed with many possible combinations of construction and maintenance and rehabilitation (M&R) strategies. It is desirable to find the optimal pavement structure, in terms of minimum cost while satisfying the engineering constraints, by modern mathematical methods and computer technology. Thus,
* Corresponding author. Tel.: +351.239797101; fax: +351.239797142. E-mail address: [email protected]
Available online at www.sciencedirect.com
© 2012 The Authors. Published by Elsevier Ltd. Selection and/or peer-review under responsibility of SIIV2012 Scientific Committee Open access under CC BY-NC-ND license.
Open access under CC BY-NC-ND license.

1185 João Santos and Adelino Ferreira / Procedia - Social and Behavioral Sciences 53 ( 2012 ) 1184 – 1193
there is a need to develop new optimization models to provide highway agencies with a better and more efficient decision-aid tool for pavement management at project-level.
This paper presents a new pavement design optimization model considering costs and preventive interventions, called OPTIPAV, developed and programmed to help pavement designers to choose the best pavement structure for a road or highway. The paper is divided into three sections. The first section contains a detailed description of the OPTIPAV system. The second section presents the results obtained with the application of the OPTIPAV system to the pavement structures of the Portuguese Manual. The final section consists of a synthesis of the conclusions reached so far and a statement of prospects for future research.
Nomenclature
CCs0 construction cost of a pavement structure s in year 0 in function of the layer´s material and thickness
d discount rate
Msl material of layer l of pavement structure s
MCrst maintenance cost for applying operation r to pavement structure s in year t
Nmaxs maximum number of M&R operations that may occur in pavement structure s over the project analysis
period
PSIt Present Serviceability Index in year t
PSIT+1 Present Serviceability Index in year T+1
R number of alternative M&R operations
RVs,T+1 residual value for a pavement structure s in year T+1
S number of pavement structures generated for analysis
T number of years of the project analysis period
Thsl thickness of layer l of pavement structure s
UCst user cost for pavement structure s in year t (€/km/vehicle)
Xrst is equal to one if operation r is applied to pavement structure s in year t, otherwise it is equal to zero
Zst condition variables for pavement structure s in year t
Z warning levels for the condition variables of pavement structures
Φ pavement condition functions
Θ residual value functions
c construction cost functions
a agency cost functions for M&R
u are the user cost functions
Ω feasible operations sets

1186 João Santos and Adelino Ferreira / Procedia - Social and Behavioral Sciences 53 ( 2012 ) 1184 – 1193
2. Proposed pavement design optimization system
2.1. Introduction
The proposed pavement design optimization system introduces some new capabilities in the previous version of the OPTIPAV system [1], including the possibility to consider preventive M&R operations. The OPTIPAV system uses the pavement performance model of the AASHTO flexible pavement design method [2] to predict the future quality of pavements. This design approach applies several factors such as the change in PSI over the design period, the 80 kN equivalent single-axle load applications, materials properties, drainage and environmental conditions, and performance reliability, to obtain a measure of the required structural strength through an index known as the structural number (SN). The SN is then converted to pavement layer thicknesses according to layer structural coefficients representing relative strength of the layer materials.
The results of the application of the OPTIPAV system consist of the optimal pavement structure, the predicted annual pavement quality, the construction costs, the M&R plan and costs, the user costs, and the pavement residual value at the end of the project analysis period. The objective of the analysis, the road pavement data and models, and the constraints that the system must guarantee are described in the following section.
2.2. Optimization model formulation
The optimization model introduced above can be formulated as follows:
111 11
01
1
1
1
1
1s,TT
T
t
T
tsttrstrstt
R
rs RV
d UC
d XMC
d Min CC
(1)
Subject to: TtSsXXXXZΦZ RstRsstssst ,...,1;,...,1),,...,,...,,...,,( 11110 (2)
TtSsZstZ ,...,1;,...,1, (3)
TtSsRrZX strst ,...,1;,...,1;,...,1, (4)
TtSsXR
rrst ,...,1;,...,1,1
1
(5)
SsThMΨcCC slsls ,...,1,,0 (6)
TtSsRrXZΨaMC rststrst ,...,1;,...,1;,...,1,, (7)
TtSsZΨuUC stst ,...,1;,...,1, (8)
SsZCCΘRV TssTs ,...,1,, 1,01, (9)
SsNX s
R
r
T
trst ,...,1,max
2 1
(10)
300042.0200709.003871.039904.0 tPSItPSItPSIstUC (11)
5.15.45.11
01,T
TsPSI
CCRV
(12)

1187 João Santos and Adelino Ferreira / Procedia - Social and Behavioral Sciences 53 ( 2012 ) 1184 – 1193
Equation (1) expresses the minimization of total discounted costs over the project analysis period, while
keeping a pavement structure above specified quality standards. Total costs include construction costs, M&R costs, user costs and the residual value of a pavement structure, i.e. its value at the end of the project analysis period. Constraints (2) correspond to the pavement condition functions, expressing pavement condition in each year as a set of functions of the initial pavement state and the M&R operations previously applied to the pavement. These functions can describe the pavement condition with regard to variables such as cracking, rutting, longitudinal roughness, surface disintegration (potholing and ravelling) and overall quality of pavements, etc.
Constraints (3) are the warning level constraints which define the maximum (or in relation to the PSI, the minimum) level for the pavement condition variables. The warning level adopted in this study considering the AASHTO pavement design method was a PSI value of 2.0 which corresponds to the PSI terminal value for national roads. A corrective M&R operation appropriate for the rehabilitation of a pavement structure must be performed when the PSI value is lower than 2.0. Constraints (4) represent the feasible operation sets, i.e. the M&R operations that can be applied to maintain or rehabilitate the pavement structure in relation to its quality condition. In this study nine M&R actions were considered (Table 1) that applied individually or in combination correspond to five M&R operations (Table 2). This M&R operations structure was originally defined for the PMS of the Portuguese Road Administration [3,4] and the M&R operation costs, like the construction costs, correspond to the 85th percentile.
Constraints (5) indicate that only one M&R operation should be performed per pavement structure in each year. Constraints (6) represent the construction costs, which are computed in relation to the material and thickness of each pavement layer. Constraints (7) represent the M&R costs, which are computed in relation to the pavement condition and the M&R operation applied to the pavement in a given year. Constraints (8) represent the user cost functions. They express the costs for road users as a function of the pavement condition in a given year. Equation (11) was adopted for calculating the user costs because it is already used in some Portuguese PMS for calculating this type of costs [5,6].
Constraints (9) represent the residual value functions. They express the value of the pavement structure at the end of the project analysis period as a function of the construction cost and the pavement condition at that time. Equation (12) is used for calculating the residual value of pavements structures, which is also used in Portuguese PMS for the same purpose. Constraints (10) were included in the model to avoid frequent M&R operations on the same pavement structure.
Table 1. Maintenance and rehabilitation actions
M&R action Description Cost (€/m2)
1 Do nothing 0.00 2 Tack coat 0.41 3 Surface leveling (1 cm ) 1.23 4 Surface leveling (2 cm) 2.45 5 Membrane anti-reflection of cracks 1.88 6 Base layer (10 cm) 8.63 7 Binder layer (5 cm) 6.13 8 Non structural wearing layer 3.13 9 Wearing layer (5 cm) 6.69
1188 João Santos and Adelino Ferreira / Procedia - Social and Behavioral Sciences 53 ( 2012 ) 1184 – 1193
Table 2. Maintenance and rehabilitation operations
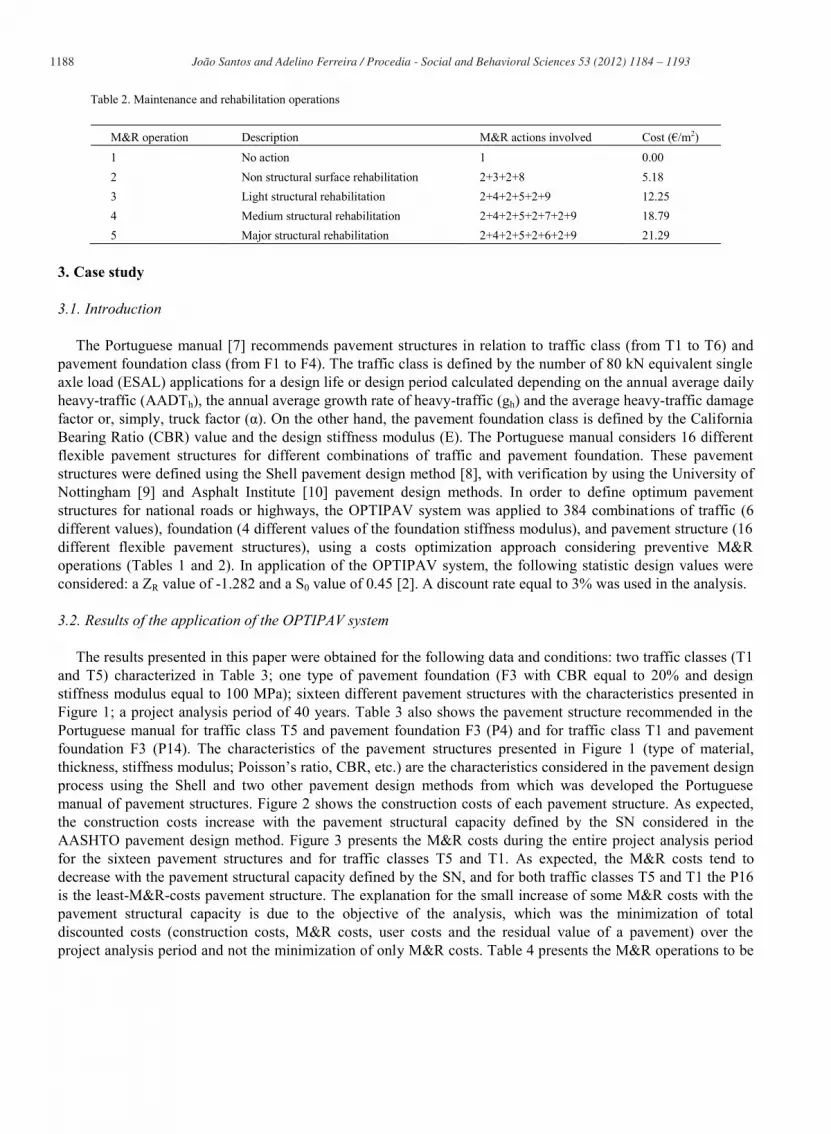
M&R operation Description M&R actions involved Cost (€/m2) 1 No action 1 0.00 2 Non structural surface rehabilitation 2+3+2+8 5.18 3 Light structural rehabilitation 2+4+2+5+2+9 12.25 4 Medium structural rehabilitation 2+4+2+5+2+7+2+9 18.79 5 Major structural rehabilitation 2+4+2+5+2+6+2+9 21.29
3. Case study
3.1. Introduction
The Portuguese manual [7] recommends pavement structures in relation to traffic class (from T1 to T6) and pavement foundation class (from F1 to F4). The traffic class is defined by the number of 80 kN equivalent single axle load (ESAL) applications for a design life or design period calculated depending on the annual average daily heavy-traffic (AADTh), the annual average growth rate of heavy-traffic (gh) and the average heavy-traffic damage factor or, simply, truck factor (α). On the other hand, the pavement foundation class is defined by the California Bearing Ratio (CBR) value and the design stiffness modulus (E). The Portuguese manual considers 16 different flexible pavement structures for different combinations of traffic and pavement foundation. These pavement structures were defined using the Shell pavement design method [8], with verification by using the University of Nottingham [9] and Asphalt Institute [10] pavement design methods. In order to define optimum pavement structures for national roads or highways, the OPTIPAV system was applied to 384 combinations of traffic (6 different values), foundation (4 different values of the foundation stiffness modulus), and pavement structure (16 different flexible pavement structures), using a costs optimization approach considering preventive M&R operations (Tables 1 and 2). In application of the OPTIPAV system, the following statistic design values were considered: a ZR value of -1.282 and a S0 value of 0.45 [2]. A discount rate equal to 3% was used in the analysis.
3.2. Results of the application of the OPTIPAV system
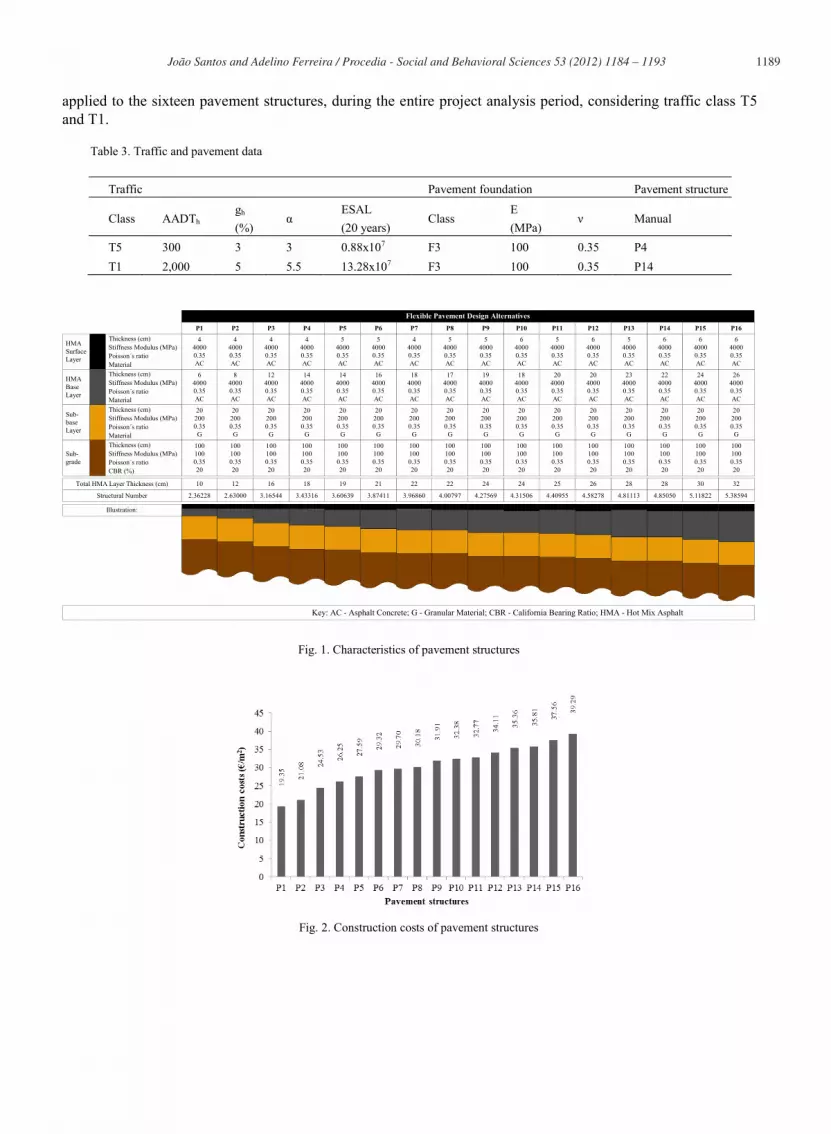
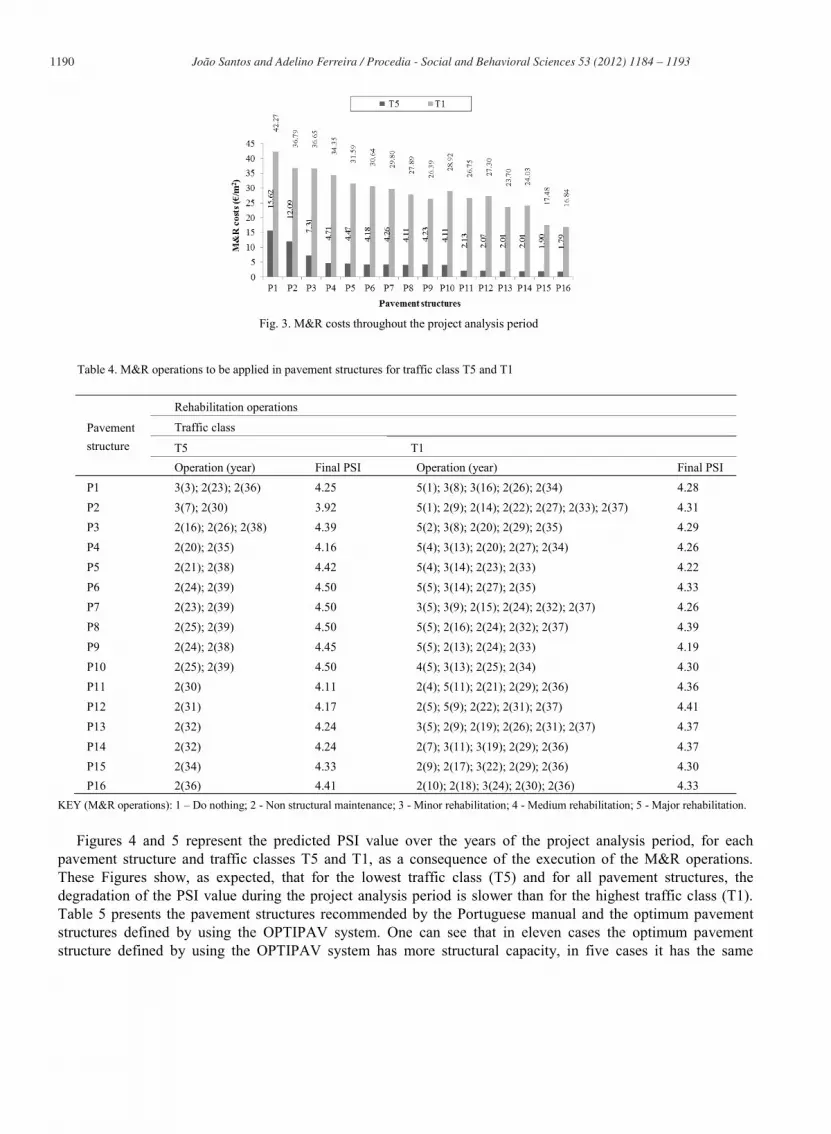
The results presented in this paper were obtained for the following data and conditions: two traffic classes (T1 and T5) characterized in Table 3; one type of pavement foundation (F3 with CBR equal to 20% and design stiffness modulus equal to 100 MPa); sixteen different pavement structures with the characteristics presented in Figure 1; a project analysis period of 40 years. Table 3 also shows the pavement structure recommended in the Portuguese manual for traffic class T5 and pavement foundation F3 (P4) and for traffic class T1 and pavement foundation F3 (P14). The characteristics of the pavement structures presented in Figure 1 (type of material, thickness, stiffness modulus; Poisson’s ratio, CBR, etc.) are the characteristics considered in the pavement design process using the Shell and two other pavement design methods from which was developed the Portuguese manual of pavement structures. Figure 2 shows the construction costs of each pavement structure. As expected, the construction costs increase with the pavement structural capacity defined by the SN considered in the AASHTO pavement design method. Figure 3 presents the M&R costs during the entire project analysis period for the sixteen pavement structures and for traffic classes T5 and T1. As expected, the M&R costs tend to decrease with the pavement structural capacity defined by the SN, and for both traffic classes T5 and T1 the P16 is the least-M&R-costs pavement structure. The explanation for the small increase of some M&R costs with the pavement structural capacity is due to the objective of the analysis, which was the minimization of total discounted costs (construction costs, M&R costs, user costs and the residual value of a pavement) over the project analysis period and not the minimization of only M&R costs. Table 4 presents the M&R operations to be
1189 João Santos and Adelino Ferreira / Procedia - Social and Behavioral Sciences 53 ( 2012 ) 1184 – 1193
applied to the sixteen pavement structures, during the entire project analysis period, considering traffic class T5 and T1.
Table 3. Traffic and pavement data
Traffic Pavement foundation Pavement structure
Class AADTh gh (%)
α ESAL (20 years)
Class E (MPa)
ν Manual
T5 300 3 3 0.88x10⁷ F3 100 0.35 P4 T1 2,000 5 5.5 13.28x10⁷ F3 100 0.35 P14
32
202000.35
G
2640000.35AC
P16
30
202000.35
G
2440000.35AC
P15
28
202000.35
G
2240000.35AC
640000.35AC
P14
28
202000.35
G
2340000.35AC
540000.35AC
P13
26
202000.35
G
2040000.35AC
640000.35AC
P12
25
202000.35
G
2040000.35AC
540000.35AC
P11
24
202000.35
G
1840000.35AC
640000.35AC
P10
24
202000.35
G
1940000.35AC
540000.35AC
P9
22
202000.35
G
1740000.35AC
540000.35AC
P8
22
202000.35
G
1840000.35AC
440000.35AC
P7
21
202000.35
G
1640000.35AC
540000.35AC
P6
19
202000.35
G
1440000.35AC
540000.35AC
P5
18
202000.35
G
1440000.35AC
440000.35AC
P4
16
202000.35
G
1240000.35AC
440000.35AC
P3
12
202000.35
G
840000.35AC
440000.35AC
P2
HMASurfaceLayer
HMABaseLayer
Sub-baseLayer
Total HMA Layer Thickness (cm)
Thickness (cm)Stiffness Modulus (MPa)Poisson´s ratioMaterial
10
202000.35
G
640000.35AC
440000.35AC
P1
Flexible Pavement Design Alternatives
1001000.3520
1001000.3520
1001000.3520
1001000.3520
1001000.3520
1001000.3520
1001000.3520
1001000.3520
1001000.3520
1001000.3520
1001000.3520
1001000.3520
1001000.3520
1001000.3520
1001000.3520
Sub-grade
1001000.3520
5.385945.118224.850504.811134.582784.409554.315064.275694.007973.968603.874113.606393.433163.165442.63000Structural Number 2.36228
Key: AC - Asphalt Concrete; G - Granular Material; CBR - California Bearing Ratio; HMA - Hot Mix Asphalt
640000.35AC
640000.35AC
Thickness (cm)Stiffness Modulus (MPa)Poisson´s ratioMaterialThickness (cm)Stiffness Modulus (MPa)Poisson´s ratioMaterialThickness (cm)Stiffness Modulus (MPa)Poisson´s ratioCBR (%)
Illustration:
Fig. 2. Construction costs of pavement structures
Fig. 1. Characteristics of pavement structures
1190 João Santos and Adelino Ferreira / Procedia - Social and Behavioral Sciences 53 ( 2012 ) 1184 – 1193
Table 4. M&R operations to be applied in pavement structures for traffic class T5 and T1
Pavement structure
Rehabilitation operations
Traffic class
T5 T1 Operation (year) Final PSI Operation (year) Final PSI
P1 3(3); 2(23); 2(36) 4.25 5(1); 3(8); 3(16); 2(26); 2(34) 4.28 P2 3(7); 2(30) 3.92 5(1); 2(9); 2(14); 2(22); 2(27); 2(33); 2(37) 4.31 P3 2(16); 2(26); 2(38) 4.39 5(2); 3(8); 2(20); 2(29); 2(35) 4.29 P4 2(20); 2(35) 4.16 5(4); 3(13); 2(20); 2(27); 2(34) 4.26 P5 2(21); 2(38) 4.42 5(4); 3(14); 2(23); 2(33) 4.22 P6 2(24); 2(39) 4.50 5(5); 3(14); 2(27); 2(35) 4.33 P7 2(23); 2(39) 4.50 3(5); 3(9); 2(15); 2(24); 2(32); 2(37) 4.26 P8 2(25); 2(39) 4.50 5(5); 2(16); 2(24); 2(32); 2(37) 4.39 P9 2(24); 2(38) 4.45 5(5); 2(13); 2(24); 2(33) 4.19 P10 2(25); 2(39) 4.50 4(5); 3(13); 2(25); 2(34) 4.30 P11 2(30) 4.11 2(4); 5(11); 2(21); 2(29); 2(36) 4.36 P12 2(31) 4.17 2(5); 5(9); 2(22); 2(31); 2(37) 4.41 P13 2(32) 4.24 3(5); 2(9); 2(19); 2(26); 2(31); 2(37) 4.37 P14 2(32) 4.24 2(7); 3(11); 3(19); 2(29); 2(36) 4.37 P15 2(34) 4.33 2(9); 2(17); 3(22); 2(29); 2(36) 4.30 P16 2(36) 4.41 2(10); 2(18); 3(24); 2(30); 2(36) 4.33
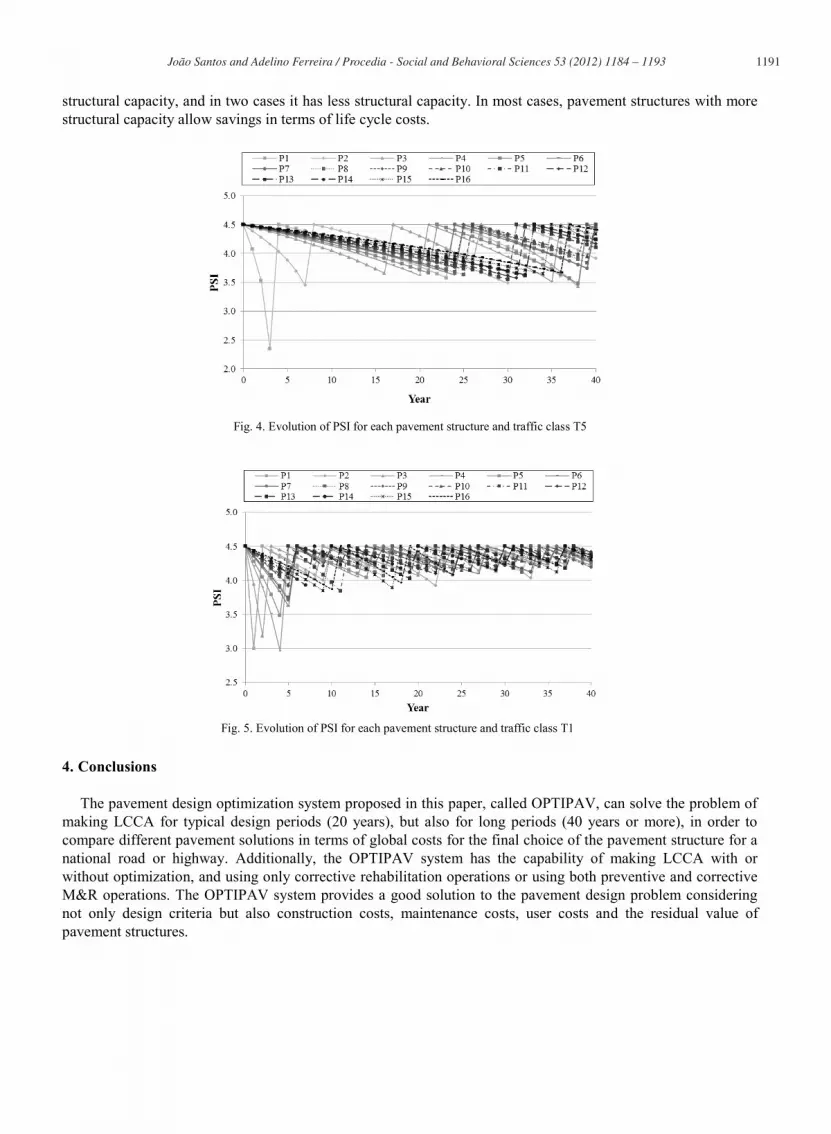
KEY (M&R operations): 1 – Do nothing; 2 - Non structural maintenance; 3 - Minor rehabilitation; 4 - Medium rehabilitation; 5 - Major rehabilitation. Figures 4 and 5 represent the predicted PSI value over the years of the project analysis period, for each
pavement structure and traffic classes T5 and T1, as a consequence of the execution of the M&R operations. These Figures show, as expected, that for the lowest traffic class (T5) and for all pavement structures, the degradation of the PSI value during the project analysis period is slower than for the highest traffic class (T1). Table 5 presents the pavement structures recommended by the Portuguese manual and the optimum pavement structures defined by using the OPTIPAV system. One can see that in eleven cases the optimum pavement structure defined by using the OPTIPAV system has more structural capacity, in five cases it has the same
Fig. 3. M&R costs throughout the project analysis period
1191 João Santos and Adelino Ferreira / Procedia - Social and Behavioral Sciences 53 ( 2012 ) 1184 – 1193
structural capacity, and in two cases it has less structural capacity. In most cases, pavement structures with more structural capacity allow savings in terms of life cycle costs.
Fig. 4. Evolution of PSI for each pavement structure and traffic class T5
4. Conclusions
The pavement design optimization system proposed in this paper, called OPTIPAV, can solve the problem of making LCCA for typical design periods (20 years), but also for long periods (40 years or more), in order to compare different pavement solutions in terms of global costs for the final choice of the pavement structure for a national road or highway. Additionally, the OPTIPAV system has the capability of making LCCA with or without optimization, and using only corrective rehabilitation operations or using both preventive and corrective M&R operations. The OPTIPAV system provides a good solution to the pavement design problem considering not only design criteria but also construction costs, maintenance costs, user costs and the residual value of pavement structures.
Fig. 5. Evolution of PSI for each pavement structure and traffic class T1

1192 João Santos and Adelino Ferreira / Procedia - Social and Behavioral Sciences 53 ( 2012 ) 1184 – 1193
Table 5. Optimum pavement structures
Traffic Pavement foundation Pavement structure
Class AADT AADTh gh (%) α ESAL (20 years) Class E
(MPa) υ Manual OPTIPAV
T6 1,500 150 3 2 0.29x10⁷ F1 30 0.35 NAF P14 T5 3,000 300 3 3 0.88x10⁷ F1 30 0.35 NAF P16 T4 5,000 500 4 4 2.17x10⁷ F1 30 0.35 NAF P15 T3 8,000 800 4 4.5 3.91x10⁷ F1 30 0.35 NAF P16 T2 12,000 1200 5 5 7.24x10⁷ F1 30 0.35 NAF P16 T1 20,000 2000 5 5.5 13.28x10⁷ F1 30 0.35 NAF P15
T6 1,500 150 3 2 0.29x10⁷ F2 60 0.35 P3 P7 T5 3,000 300 3 3 0.88x10⁷ F2 60 0.35 P7 P13 T4 5,000 500 4 4 2.17x10⁷ F2 60 0.35 P11 P15 T3 8,000 800 4 4.5 3.91x10⁷ F2 60 0.35 P13 P16 T2 12,000 1200 5 5 7.24x10⁷ F2 60 0.35 P15 P15 T1 20,000 2000 5 5.5 13.28x10⁷ F2 60 0.35 P16 P15 T6 1,500 150 3 2 0.29x10⁷ F3 100 0.35 P2 P3 T5 3,000 300 3 3 0.88x10⁷ F3 100 0.35 P4 P4 T4 5,000 500 4 4 2.17x10⁷ F3 100 0.35 P6 P9 T3 8,000 800 4 4.5 3.91x10⁷ F3 100 0.35 P9 P15 T2 12,000 1200 5 5 7.24x10⁷ F3 100 0.35 P12 P16 T1 20,000 2000 5 5.5 13.28x10⁷ F3 100 0.35 P14 P16 T6 1,500 150 3 2 0.29x10⁷ F4 150 0.35 P1 P1 T5 3,000 300 3 3 0.88x10⁷ F4 150 0.35 P3 P3 T4 5,000 500 4 4 2.17x10⁷ F4 150 0.35 P5 P5 T3 8,000 800 4 4.5 3.91x10⁷ F4 150 0.35 P8 P7 T2 12,000 1200 5 5 7.24x10⁷ F4 150 0.35 P10 P16 T1 20,000 2000 5 5.5 13.28x10⁷ F4 150 0.35 P12 P13
The application of the OPTIPAV system to the case study permitted us to conclude that the pavement
structures recommended by the Portuguese Manual are not always the optimum solutions. In most cases, pavement structures with more structural capacity allow savings in terms of life cycle costs. Although the proposed pavement design optimization model was developed using data from Portugal, it can be applicable in different countries with appropriate calibration. In addition, the proposed pavement design optimization model can easily be adapted to consider rigid pavements, other pavement performance models, other costs, as well as different types of M&R operations.
In the future, because the OPTIPAV system has an open formulation, some modifications could be made to better serve the needs of pavement design engineers. In the near future, our research in the pavement design field will follow three main directions. First, the OPTIPAV system will be applied considering other pavement performance models, such as the cracking and rutting models considered in the Shell and University of Nottingham pavement design methods, or even the pavement performance models considered in the new AASHTO Mechanistic-Empirical Pavement Design Guide [11]. Second, specific pavement performance models and user cost models will be developed using data already available in some Portuguese PMSs and will be incorporated into the OPTIPAV system for future applications to road pavements. Third, environmental costs will be included in the objective function, such as environmental costs related to the production of new pavement

1193 João Santos and Adelino Ferreira / Procedia - Social and Behavioral Sciences 53 ( 2012 ) 1184 – 1193
materials, related to materials deposited in landfills associated with construction, maintenance, rehabilitation and reconstruction, and also related to pavement materials recycling.
Acknowledgements
The authors are grateful to the Portuguese Foundation of Science and Technology for the financial support provided to this study through Grant PTDC/ECM/112775/2009 - MODAT - Multi-Objective Decision-Aid Tool for Highway Asset Management, financed by the European Community Fund FEDER.
References
[1] Santos, J. & Ferreira, A. (2011). Life-cycle cost analysis for pavement management at project level. International Journal of Pavement Engineering, 1-14, Published online: 06 Oct 2011, DOI:10.1080/10298436.2011.618535, http://dx.doi.org/10.1080/10298436.2011.618535. [2] AASHTO (1993). Guide for design of pavement structures. American Association of State Highway and Transportation Officials, Washington, DC, USA, 4th ed., 1-640. [3] Picado-Santos, L. & Ferreira, A. (2008). Contributions to the development of the Portuguese road administration’s pavement management system. Proceedings of the 3rd European pavement and asset management conference, University of Coimbra, Coimbra, Portugal, CD Ed., paper 1138.pdf, 1–10. [4] Ferreira, A., Picado-Santos, L., Wu, Z. & Flintsch, G. (2011). Selection of pavement performance models for use in the Portuguese PMS. International Journal of Pavement Engineering, 12 (1), 87-97. [5] Ferreira, A., Meneses, S. & Vicente, F. (2009a). Pavement management system for Oliveira do Hospital, Portugal. Proceedings of the Institution of Civil Engineers - Transport, 162 (3), 157-169. [6] Ferreira, A., Meneses, S. & Vicente, F. (2009b). Alternative decision-aid tool for pavement management. Proceedings of the Institution of Civil Engineers - Transport, 162 (1), 3-17. [7] JAE (1995). Manual of pavement structures for the Portuguese road network. Junta Autónoma de Estradas, Lisboa, Portugal, 1-54 (in Portuguese). [8] Shell (1978). Shell pavement design manual - asphalt pavements and overlays for road traffic. Shell International Petroleum Company Ltd., London, UK. [9] Brunton, J., Brown, S. & Pell, P. (1987). Developments to the Nottingham analytical design method for asphalt pavements. Proceedings of the 6th International Conference on Structural Design of Asphalt Pavements, University of Michigan, Ann Arbor, Michigan, USA, 1, 366-377. [10] AI (2001). Thickness design: asphalt pavements for highways and street. Asphalt Institute, Lexington, KY, USA, 1-98. [11] AASHTO (2008). Mechanistic-empirical pavement design guide - a manual of practice. American Association of State Highway and Transportation Officials, Washington, DC, USA, Interim Edition, 1-204.