passenger vehicle crash test procedure developments in
TRANSCRIPT
Thomson 1
PASSENGER VEHICLE CRASH TEST PROCEDURE DEVELOPMENTS IN THE VC-COMPAT PROJECT Robert Thomson Chalmers University of Technology Sweden Mervyn Edwards TRL, Limited (Transport Research Laboratory) United Kingdom on behalf of the VC-Compat Consortium Paper Number 05-0008 ABSTRACT The project “Improvement of Vehicle Crash Compatibility through the development of Crash Test Procedures” (VC-Compat) is a research activity sponsored under the European Commission 5th Framework Programme. It consists of two parallel research activities, one focusing on car-to-car* compatibility and the other on car-to-truck compatibility. The main objective of the car-to-car research is the development of crash test procedures to assess frontal impact crash compatibility. The car-to-truck objective is to develop test methods to assess energy absorbing frontal underrun protection for trucks. The midterm project status of the car-to-car work program is reported in this paper. A survey of European passenger vehicles has been conducted to construct a database of common crashworthiness structures. A review of the detailed accident databases in Germany and UK has been used to identify a target population of accident victims that could benefit from improved vehicle compatibility. Testing and modelling activities have been conducted to improve the understanding of the relationship between crash behaviour in the candidate test procedures and car-to-car crashes. These research activities are helping to develop and evaluate candidate test procedures. To date, work has focused on the Full Width Deformable Barrier (FWDB) and Progressive Deformable Barrier (PDB) tests, which use two different approaches to assess a car’s compatibility. The FWDB test uses load cell wall force measurements whereas the PDB test uses barrier deformation measurements. The activities described herein will continue throughout the project and lead to draft test procedures with performance criteria and limits.
* The car definition includes SUVs.
INTRODUCTION Following the introduction of the European frontal and side impact Directives and EuroNCAP†, car safety has made a major step forward. Even so, there are still over 38000 fatalities and 1.6 million injured people due to traffic accidents in Europe [1]. Passive safety equipment operates well under idealized crash test conditions. However, behaviour of car structures and safety systems during real world conditions is not always directly comparable to crash tested behaviour, especially in car-to-car crashes. The next step to further improve frontal impact protection is to improve compatibility. Crash compatibility will ensure that car frontal structures are more effectively utilized in car-to-car collisions. This should help reduce compartment intrusion in severe accidents and thereby lead to a decrease in the number of serious and fatal injuries. Compatibility is a complex issue but can be broken down into three subtopics: structural interaction, frontal force levels and compartment strength. Structural interaction is a measurement of how well vehicles interact in frontal impacts. If the structural interaction is poor, the energy absorbing front structures of the vehicle may not function as designed leading to a risk of compartment intrusion at lower than designed impact severities. In general, frontal force levels are currently related to vehicle mass[2]. As a consequence, small vehicles absorb more than their share of the impact energy as they are unable to deform the heavier vehicle at the higher force levels required. Matched frontal force levels would ensure that both vehicles in an impact absorb their share of the kinetic energy. This would reduce the risk of injury for the occupant in the lighter vehicle. Compartment strength is closely related to frontal force levels but is nevertheless distinguished since it is such an important issue for self-protection. In cases where the vehicle front structures do not absorb the amount of energy as designed - or in cases where the vehicle is exposed to higher impact severity than it is designed for - the compartment strength needs to be sufficiently high to resist a compartment collapse. VC-Compat[3] is a 3-year project, part financed by the European Commission which started in March 1st 2003 and is split into two research legs; a car-to-car
† EuroNCAP is the European New Car Assessment Programme which provides the consumer with car safety ratings
Thomson 2
leg and a car-to-truck leg. Both legs follow separate research plans with defined points of interaction and information exchange. It is the car-to-car leg consisting of research partners from the UK, France, Germany, Sweden, Italy, and the Netherlands, that is reported in this paper. The scientific and technical objectives for car-to-car research are: • to develop a suite of draft test procedures and
associated performance criteria outlines to assess and control car frontal structures for frontal impact compatibility.
• to ensure that the number of additional test procedures is minimised to keep the test burden on industry to a minimum.
• to provide general recommendations for the design of a compatible car.
• to provide an indication of the benefits and costs of improved compatibility.
European Enhanced Vehicle-safety Committee (EEVC) Working Group 15 members and their industrial advisors are acting as a technical steering group for VC-Compat project to ensure that appropriate test procedures are developed. Project results are also reported to the International Harmonised Research Activities (IHRA) compatibility working group to obtain a world-wide perspective. Recently, the EEVC WG15 has defined a route map to improve frontal impact compatibility. The general objectives of the route map are to:
• Address partner and self protection without decreasing current self protection levels.
• Keep number of procedures to a minimum.
• Internationally harmonise procedures.
The short term objectives are to develop requirements to:
• Improve structural interaction.
• Ensure that frontal force mismatch (stiffness) does not increase and compartment strength does not decrease from current levels.
The medium term objectives are to develop requirements to:
• Improve compartment strength, especially for light vehicles.
• Take first steps to improve frontal force matching.
• Further improve structural interaction.
These objectives are in line with the compatibility route map proposed by the European automotive industry
CANDIDATE TEST PROCEDURES As a result of previous research work by manufacturers and governments, outlines of 4 possible test procedures were proposed as a starting point for the VC-COMPAT work: • Full width Deformable Barrier (FWDB) test at 56
km/h to assess structural interaction. • Progressive Deformable Barrier (PDB) test at 60
km/h to assess structural interaction and frontal force levels.
• Offset Deformable Barrier (ODB) test at 64 km/h to assess frontal force levels.
• High speed Offset Deformable Barrier (ODB) test at 80 km/h to assess compartment strength.
The FWDB test has a deformable element and uses measurements from a high resolution load cell wall (LCW) to assess a car’s structural interaction potential and has been described previously[4]. The premise is that cars exhibiting a more homogeneous force distribution on the LCW should have a better structural interaction potential. Two metrics to assess a vehicle’s structural interaction potential have been proposed: the homogeneity criterion and the Average Height of Force (AHOF). The development of the homogeneity criterion metric has been described previously[2]. It is based on the difference between peak cell loads and an ideal (or target) load level over a specified assessment area or footprint and has cell, vertical and horizontal components. To address a mass dependency problem, the homogeneity criterion was recently ‘normalised’. The new criterion is called the relative homogeneity criterion and is calculated by dividing the homogeneity criterion by the target load squared. The AHOF is a single value representing a force weighted average of the centre of force on the LCW above ground level throughout the impact [5]. The PDB test is a 50 percent overlap offset test which uses measurements from a progressive deformable barrier to assess a car’s compatibility [6]. The barrier stiffness increases with depth and has upper and lower load levels to represent an actual car structure. The progressive stiffness of the barrier has been designed so that the Equivalent Energy Speed (EES) for the vehicle should be independent of the vehicle’s mass. The reader is referred to [7] for more information on the PDB barrier performance. The PDB assesses both a car’s structural interaction potential and frontal force level in the same test. Laser scanning techniques are used to measure the 3D barrier deformations. The development of the PDB metrics is reported separately[7]. The first of these is the Partner Protection Assessment Deformation
Thomson 3
(PPAD) which is a measure of the car’s aggressivity. The formula for calculating the PPAD metric is:
∑=
⎟⎟⎠
⎞⎜⎜⎝
⎛⎟⎟⎠
⎞⎜⎜⎝
⎛=
14
1
2
lim
4
limi
iii X
X
Z
ZSPPAD (2).
where: i is the index for reference depths (14 ranges in the current proposal); Zlim and Xlim are the limit values for barrier deformations in the vertical and longitudinal directions respectively; Si is the surface area for a range of deformation depths: Zi and Xi are the average depth and height for each surface area In addition to the PPAD, the Average height of Deformation (AHOD) - comparable to the AHOF in load cell wall tests - and the Average Depth of Deformation (ADOD) metrics are available. All of these metrics are based on the longitudinal and vertical deformation pattern of the barrier face. In principle, the uniformity of the barrier deformation gives a measure of the vehicle’s structural interaction potential and the longitudinal barrier deformation indicates its frontal force levels. The use of the 64 km/h Offset Deformable Barrier (ODB) test to measure force has been described previously[4]. It aims to assess a car’s frontal force levels from a measurement of the peak force from a LCW positioned behind the deformable element. The high speed ODB test has also been described previously[4]. It aims to ensure that a car’s compartment strength exceeds a minimum requirement, so that it is able to withstand the forces imposed by another car. EEVC WG16 have recommended the use of both an offset and a full width test for assessing a car’s self protection capability in frontal impact to ensure that the car is not optimised to one particular crash configuration. Ideally, to keep the number of test procedures to a minimum, current frontal impact tests should be adapted to include compatibility measures. For example current FMVSS208 type tests could be adapted by adding a deformable element and a LCW to form the FWDB test and the current European offset test could be adapted by changing the barrier face to form the PDB test. It should be noted that the French have recently proposed that the barrier face in the ECE regulation 94 test should be replaced by the PDB face for self protection reasons. The use of a PDB barrier should harmonise the test severity among vehicles of different masses and encourage lighter vehicles to be stronger. The second stage for this proposal is the introduction of compatibility assessments after they are validated[7].
Two proposals for combining the candidate tests to form a suite of test procedures to assess frontal impact protection and compatibility have been made. The first is the FWDB test, the offset deformable barrier (ODB) test and the high speed ODB test[4]. The second is the PDB test and a full width rigid wall test[7]. At this stage the best combination of tests still has to be determined and it could include both the FWDB and PDB tests. VC-COMPAT WORK PROGRAM There are four activities that provide the technical basis for the research: • A structural survey to create a database of
positions and dimensions of the important energy absorbing structures in vehicles. This will be used to determine appropriate structural interaction areas for vehicles.
• Accident analysis to estimate the benefit and cost of improved compatibility.
• A crash testing program of car-to-car and car-to-barrier crash tests to validate the crash test procedures and develop appropriate performance criteria.
• Mathematical modelling to support the development of the test procedures and the cost benefit analysis.
The results of these four activities will be brought together in another activity to synthesize the crash test procedures. In addition, a dissemination activity is communicating the results and findings from this project and soliciting input from industry. Structural Survey (Leader: UTAC) There are two structural properties that determine a vehicle’s “aggressivity” to its opponent: physical strength (or stiffness) of the vehicle components and the position of these components. The first property is associated with the frontal force level compatibility and the second describes a geometric compatibility. The objective of the structural survey was to measure and create a database of the position and dimensions of vehicle structures involved in frontal and side impact. This database will be used to study current geometric compatibility. The specific tasks undertaken were to: • Define the main vehicle structures involved in
frontal and side car-to-car impacts. • Define a representative group of vehicles for
measurement. • Measure the vehicles and generate the database. • Analysis of the database to determine suitable
interaction areas for car-to-car impacts.
Thomson 4
A measurement procedure was developed by the group using the results of previous activities [8]. The structural database contains the following information: • General information of the vehicle (model,
engine and subframe type, mass, length, etc.). • The front unit measurement (position of bumper,
engine, subframe, lower rail, crush can, footwell, etc.).
• Side unit measurement (A, B and C pillar, position of floor sills, fender, etc.).
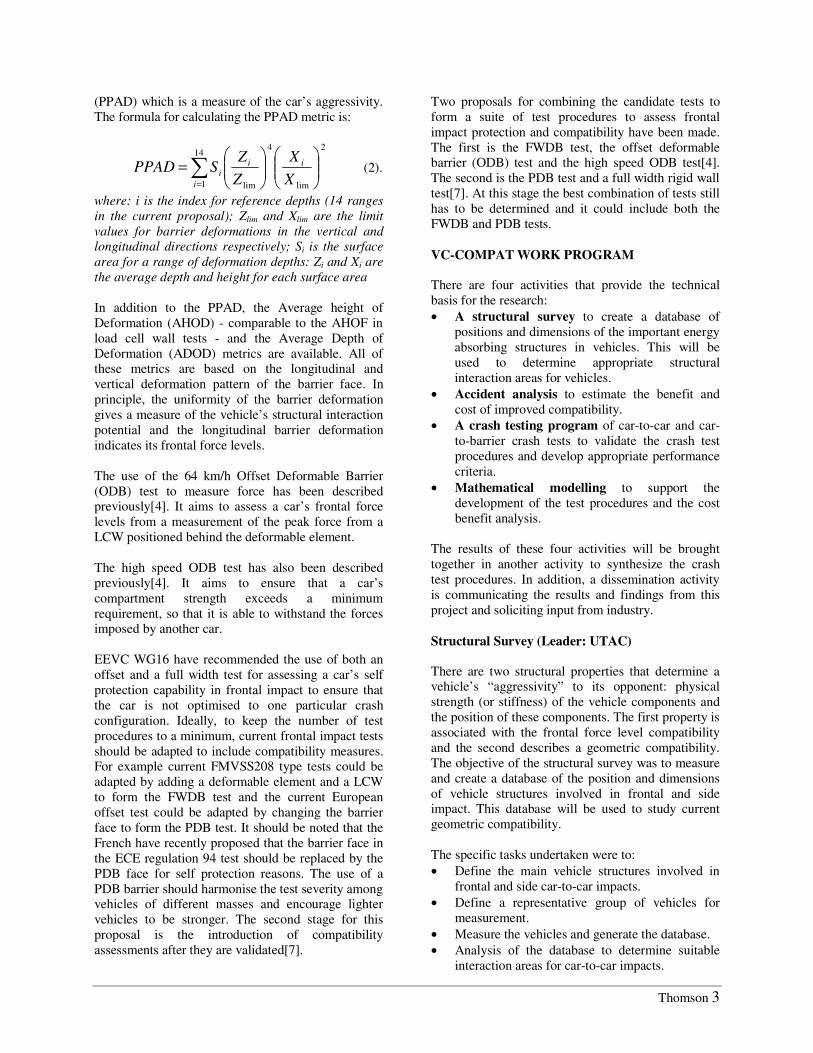
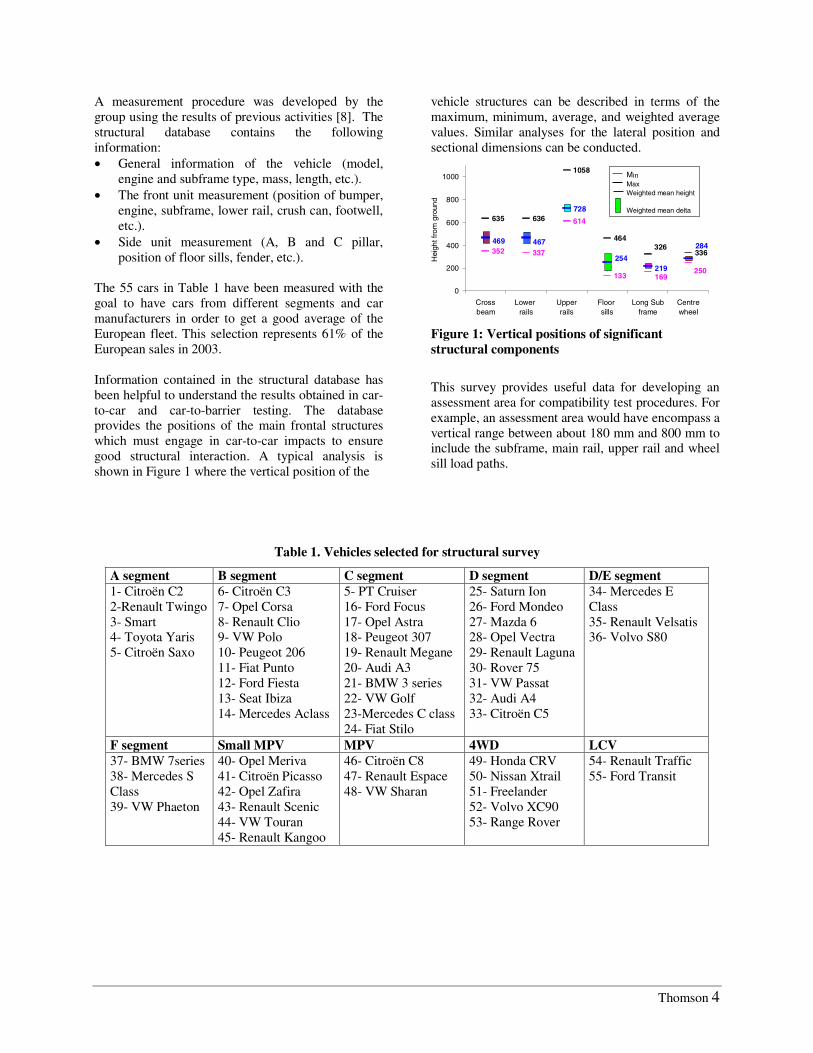
The 55 cars in Table 1 have been measured with the goal to have cars from different segments and car manufacturers in order to get a good average of the European fleet. This selection represents 61% of the European sales in 2003. Information contained in the structural database has been helpful to understand the results obtained in car-to-car and car-to-barrier testing. The database provides the positions of the main frontal structures which must engage in car-to-car impacts to ensure good structural interaction. A typical analysis is shown in Figure 1 where the vertical position of the
vehicle structures can be described in terms of the maximum, minimum, average, and weighted average values. Similar analyses for the lateral position and sectional dimensions can be conducted.
40
99 98
63
352 337
133
635 636
1058
464
336
169
614
250
326469 467
728
254219
284
0
200
400
600
800
1000
Crossbeam
Lower rails
Upperrails
Floor sills
Long Subframe
Centrewheel
Hei
ght f
rom
gro
und
Figure 1: Vertical positions of significant structural components
This survey provides useful data for developing an assessment area for compatibility test procedures. For example, an assessment area would have encompass a vertical range between about 180 mm and 800 mm to include the subframe, main rail, upper rail and wheel sill load paths.
Table 1. Vehicles selected for structural survey
A segment B segment C segment D segment D/E segment 1- Citroën C2 2-Renault Twingo 3- Smart 4- Toyota Yaris 5- Citroën Saxo
6- Citroën C3 7- Opel Corsa 8- Renault Clio 9- VW Polo 10- Peugeot 206 11- Fiat Punto 12- Ford Fiesta 13- Seat Ibiza 14- Mercedes Aclass
5- PT Cruiser 16- Ford Focus 17- Opel Astra 18- Peugeot 307 19- Renault Megane 20- Audi A3 21- BMW 3 series 22- VW Golf 23-Mercedes C class 24- Fiat Stilo
25- Saturn Ion 26- Ford Mondeo 27- Mazda 6 28- Opel Vectra 29- Renault Laguna 30- Rover 75 31- VW Passat 32- Audi A4 33- Citroën C5
34- Mercedes E Class 35- Renault Velsatis 36- Volvo S80
F segment Small MPV MPV 4WD LCV 37- BMW 7series 38- Mercedes S Class 39- VW Phaeton
40- Opel Meriva 41- Citroën Picasso 42- Opel Zafira 43- Renault Scenic 44- VW Touran 45- Renault Kangoo
46- Citroën C8 47- Renault Espace 48- VW Sharan
49- Honda CRV 50- Nissan Xtrail 51- Freelander 52- Volvo XC90 53- Range Rover
54- Renault Traffic 55- Ford Transit
MinMaxWeighted mean height
Weighted mean delta
Thomson 5
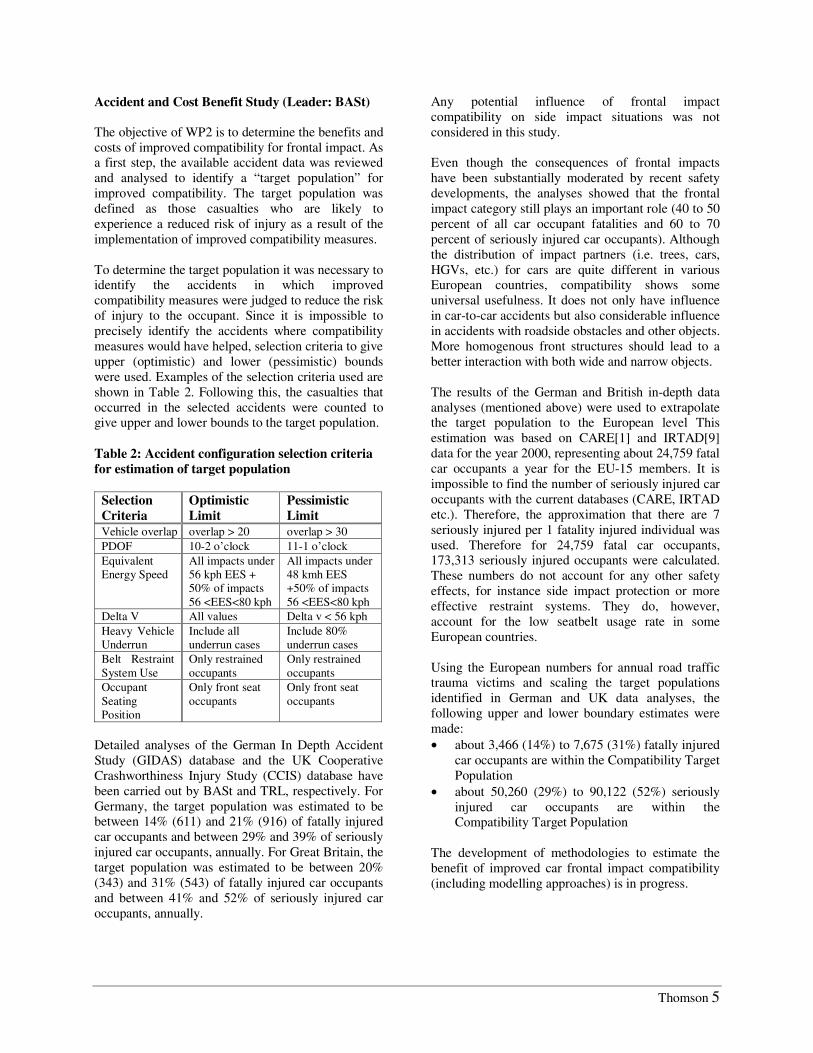
Accident and Cost Benefit Study (Leader: BASt) The objective of WP2 is to determine the benefits and costs of improved compatibility for frontal impact. As a first step, the available accident data was reviewed and analysed to identify a “target population” for improved compatibility. The target population was defined as those casualties who are likely to experience a reduced risk of injury as a result of the implementation of improved compatibility measures. To determine the target population it was necessary to identify the accidents in which improved compatibility measures were judged to reduce the risk of injury to the occupant. Since it is impossible to precisely identify the accidents where compatibility measures would have helped, selection criteria to give upper (optimistic) and lower (pessimistic) bounds were used. Examples of the selection criteria used are shown in Table 2. Following this, the casualties that occurred in the selected accidents were counted to give upper and lower bounds to the target population. Table 2: Accident configuration selection criteria for estimation of target population
Selection Criteria
Optimistic Limit
Pessimistic Limit
Vehicle overlap overlap > 20 overlap > 30 PDOF 10-2 o’clock 11-1 o’clock Equivalent Energy Speed
All impacts under 56 kph EES + 50% of impacts 56 <EES<80 kph
All impacts under 48 kmh EES +50% of impacts 56 <EES<80 kph
Delta V All values Delta v < 56 kph Heavy Vehicle Underrun
Include all underrun cases
Include 80% underrun cases
Belt Restraint System Use
Only restrained occupants
Only restrained occupants
Occupant Seating Position
Only front seat occupants
Only front seat occupants
Detailed analyses of the German In Depth Accident Study (GIDAS) database and the UK Cooperative Crashworthiness Injury Study (CCIS) database have been carried out by BASt and TRL, respectively. For Germany, the target population was estimated to be between 14% (611) and 21% (916) of fatally injured car occupants and between 29% and 39% of seriously injured car occupants, annually. For Great Britain, the target population was estimated to be between 20% (343) and 31% (543) of fatally injured car occupants and between 41% and 52% of seriously injured car occupants, annually.
Any potential influence of frontal impact compatibility on side impact situations was not considered in this study. Even though the consequences of frontal impacts have been substantially moderated by recent safety developments, the analyses showed that the frontal impact category still plays an important role (40 to 50 percent of all car occupant fatalities and 60 to 70 percent of seriously injured car occupants). Although the distribution of impact partners (i.e. trees, cars, HGVs, etc.) for cars are quite different in various European countries, compatibility shows some universal usefulness. It does not only have influence in car-to-car accidents but also considerable influence in accidents with roadside obstacles and other objects. More homogenous front structures should lead to a better interaction with both wide and narrow objects. The results of the German and British in-depth data analyses (mentioned above) were used to extrapolate the target population to the European level This estimation was based on CARE[1] and IRTAD[9] data for the year 2000, representing about 24,759 fatal car occupants a year for the EU-15 members. It is impossible to find the number of seriously injured car occupants with the current databases (CARE, IRTAD etc.). Therefore, the approximation that there are 7 seriously injured per 1 fatality injured individual was used. Therefore for 24,759 fatal car occupants, 173,313 seriously injured occupants were calculated. These numbers do not account for any other safety effects, for instance side impact protection or more effective restraint systems. They do, however, account for the low seatbelt usage rate in some European countries. Using the European numbers for annual road traffic trauma victims and scaling the target populations identified in German and UK data analyses, the following upper and lower boundary estimates were made: • about 3,466 (14%) to 7,675 (31%) fatally injured
car occupants are within the Compatibility Target Population
• about 50,260 (29%) to 90,122 (52%) seriously injured car occupants are within the Compatibility Target Population
The development of methodologies to estimate the benefit of improved car frontal impact compatibility (including modelling approaches) is in progress.
Thomson 6
Crash Testing (Leader: TRL) The objective of the crash testing activity is to perform full scale crash tests and associated analyses to help develop and validate a suite of test procedures to improve car frontal impact compatibility. The following candidate test procedures formed the starting point for this work:
• Full Width Deformable Barrier (FWDB) test at 56 km/h to assess structural interaction.
• Progressive Deformable Barrier (PDB) offset test at 60 km/h to assess structural interaction and frontal force levels.
• Offset Deformable Barrier (ODB) test at 64 km/h to assess frontal force levels.
• High speed Offset Deformable Barrier (ODB) test at 80 km/h to assess compartment strength.
The work performed has mainly focused on the development of tests that can assess a car’s structural interaction potential, the FWDB and PDB test procedures. This follows the EEVC WG 15 route map which, in the short term, requires a test to assess structural interaction. Also, previous research has shown that good structural interaction is an essential prerequisite for compatibility [10]. Load cell wall (LCW) data has been collected from selected EuroNCAP tests to further develop the 64 km/h ODB test. To date, no effort has been directed at the development of the high speed ODB test to assess compartment strength. Previous research[4] has shown that to achieve good structural interaction, it is important that the structures of each car meet suitable components on the other car to react against. Current views are that this is best achieved by utilising multiple level load paths with good links between them. These reasons led to the current FWDB and PDB assessment criteria which encourage a design with good vertical load spreading capabilities, i.e. a multiple level load path design. However, it is still not known whether good predictable structural interaction over the full range of real world impact conditions could be achieved with the current generation one-level load path car design, i.e. lower rails only. Car-to-car tests were performed to address this fundamental question and provide data to validate the FWDB and PDB test procedures. These tests were performed with identical cars to keep parameters such as the car’s frontal force level and compartment strength constant to ensure that only the car’s structural interaction behaviour could affect the test
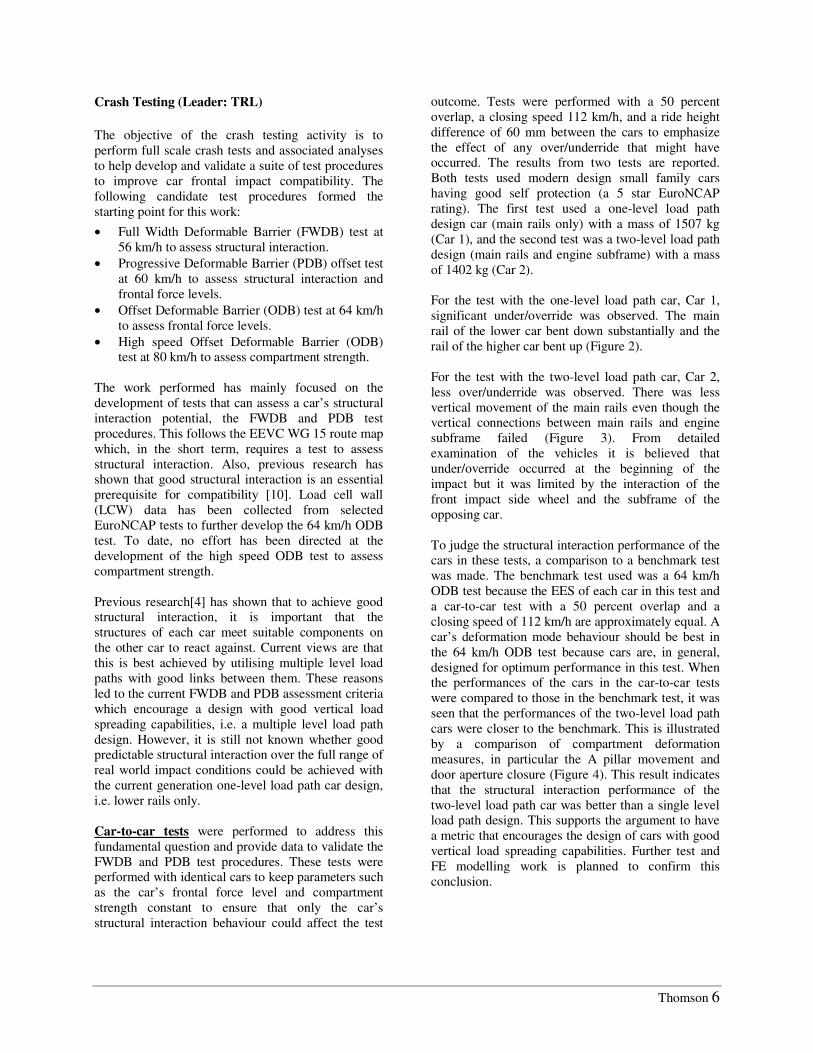
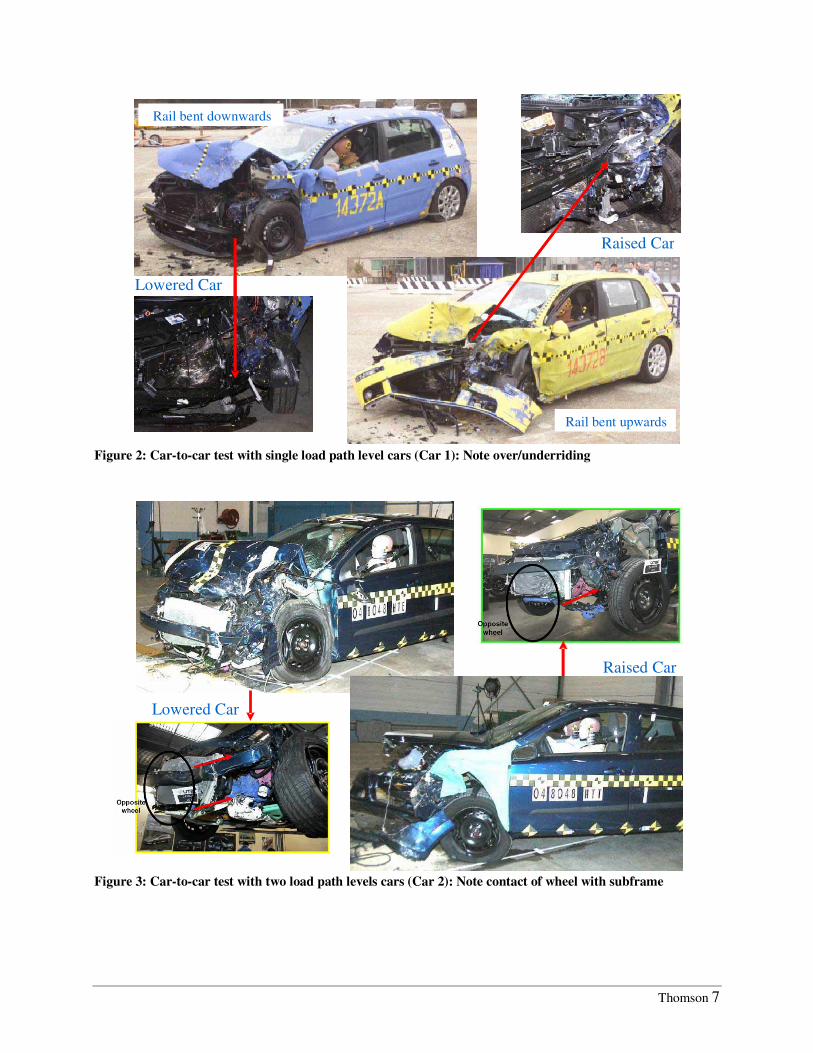
outcome. Tests were performed with a 50 percent overlap, a closing speed 112 km/h, and a ride height difference of 60 mm between the cars to emphasize the effect of any over/underride that might have occurred. The results from two tests are reported. Both tests used modern design small family cars having good self protection (a 5 star EuroNCAP rating). The first test used a one-level load path design car (main rails only) with a mass of 1507 kg (Car 1), and the second test was a two-level load path design (main rails and engine subframe) with a mass of 1402 kg (Car 2). For the test with the one-level load path car, Car 1, significant under/override was observed. The main rail of the lower car bent down substantially and the rail of the higher car bent up (Figure 2). For the test with the two-level load path car, Car 2, less over/underride was observed. There was less vertical movement of the main rails even though the vertical connections between main rails and engine subframe failed (Figure 3). From detailed examination of the vehicles it is believed that under/override occurred at the beginning of the impact but it was limited by the interaction of the front impact side wheel and the subframe of the opposing car. To judge the structural interaction performance of the cars in these tests, a comparison to a benchmark test was made. The benchmark test used was a 64 km/h ODB test because the EES of each car in this test and a car-to-car test with a 50 percent overlap and a closing speed of 112 km/h are approximately equal. A car’s deformation mode behaviour should be best in the 64 km/h ODB test because cars are, in general, designed for optimum performance in this test. When the performances of the cars in the car-to-car tests were compared to those in the benchmark test, it was seen that the performances of the two-level load path cars were closer to the benchmark. This is illustrated by a comparison of compartment deformation measures, in particular the A pillar movement and door aperture closure (Figure 4). This result indicates that the structural interaction performance of the two-level load path car was better than a single level load path design. This supports the argument to have a metric that encourages the design of cars with good vertical load spreading capabilities. Further test and FE modelling work is planned to confirm this conclusion.
Thomson 7
Figure 2: Car-to-car test with single load path level cars (Car 1): Note over/underriding
Figure 3: Car-to-car test with two load path levels cars (Car 2): Note contact of wheel with subframe
Lowered Car
Raised Car
Rail bent downwards
Rail bent upwards
Lowered Car
Raised Car
Rail bent upwards
Rail bent downwards
Thomson 8
0
10
20
30
40
50
60
70
Impact side A-pillar top
Door apeturewaist
Door aperture sill
Dis
plac
emen
t [m
m] 64km/h ODB
Raised Car
Lowered Car
Not
Mea
sure
d
Not
Mea
sure
d
Car 1
0
10
20
30
40
50
60
70
Impact side A-pillar top
Door apeturewaist
Door aperture sill
Dis
plac
emen
t [m
m] 64km/h ODB
Raised Car
Lowered Car
Car 2
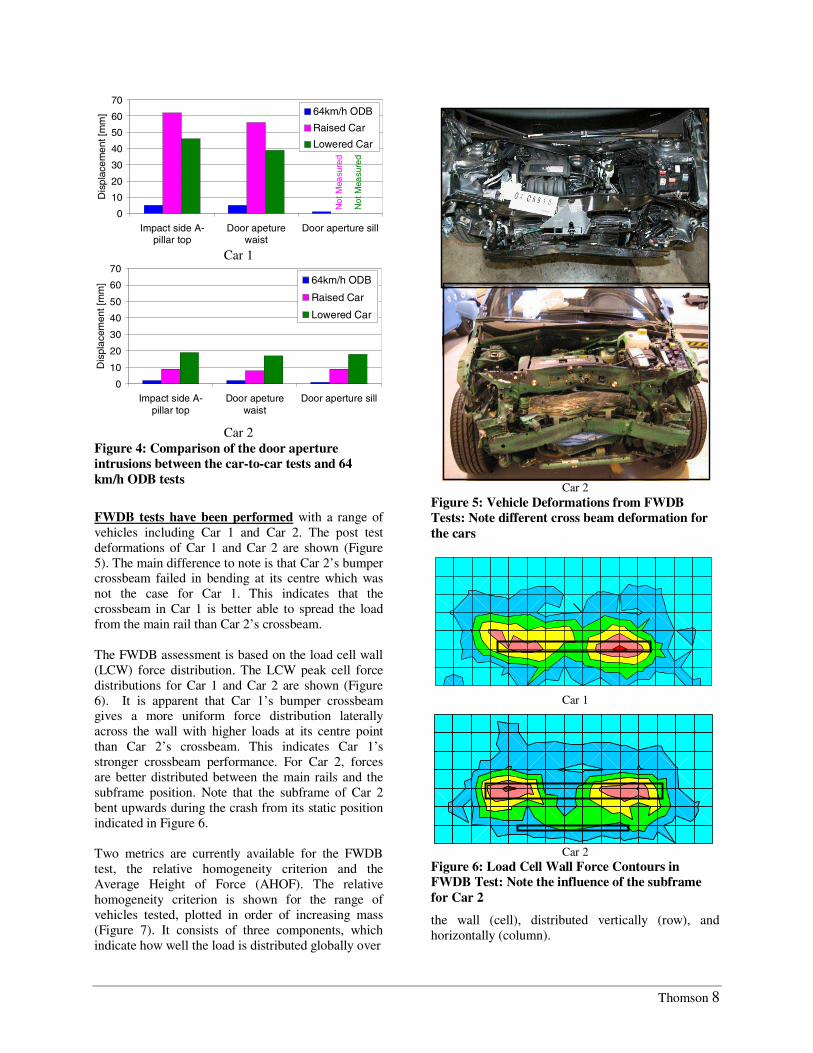
Figure 4: Comparison of the door aperture intrusions between the car-to-car tests and 64 km/h ODB tests
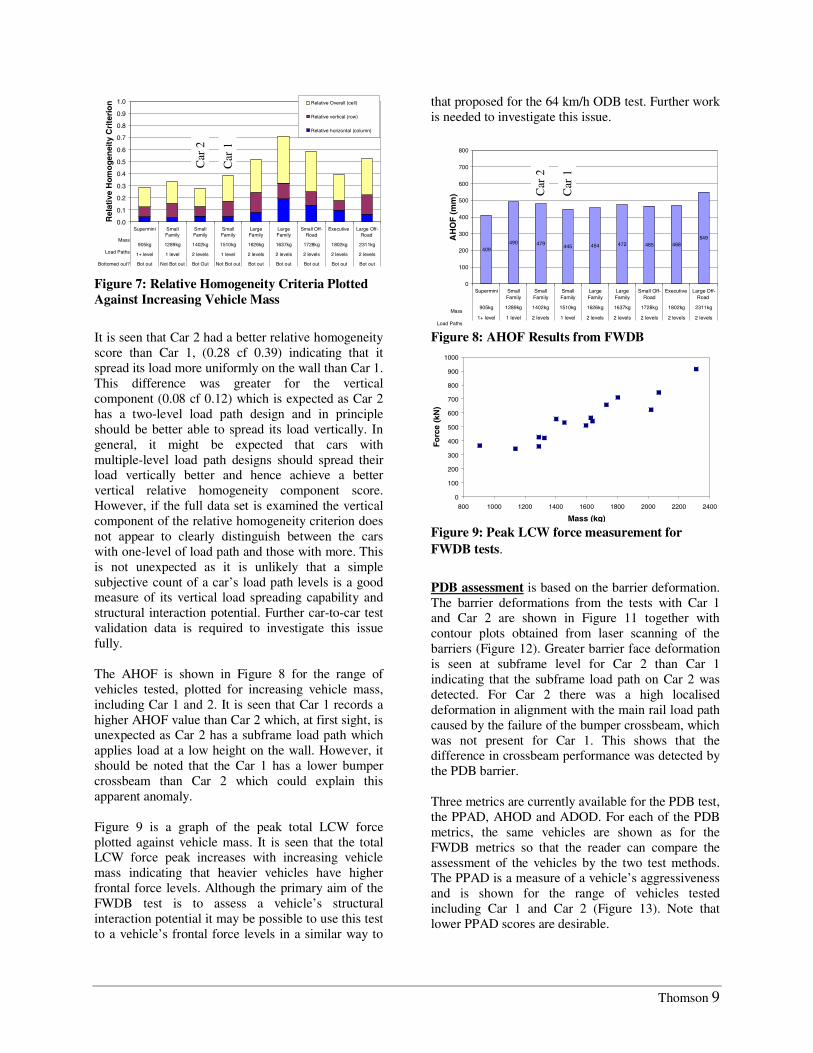
FWDB tests have been performed with a range of vehicles including Car 1 and Car 2. The post test deformations of Car 1 and Car 2 are shown (Figure 5). The main difference to note is that Car 2’s bumper crossbeam failed in bending at its centre which was not the case for Car 1. This indicates that the crossbeam in Car 1 is better able to spread the load from the main rail than Car 2’s crossbeam. The FWDB assessment is based on the load cell wall (LCW) force distribution. The LCW peak cell force distributions for Car 1 and Car 2 are shown (Figure 6). It is apparent that Car 1’s bumper crossbeam gives a more uniform force distribution laterally across the wall with higher loads at its centre point than Car 2’s crossbeam. This indicates Car 1’s stronger crossbeam performance. For Car 2, forces are better distributed between the main rails and the subframe position. Note that the subframe of Car 2 bent upwards during the crash from its static position indicated in Figure 6. Two metrics are currently available for the FWDB test, the relative homogeneity criterion and the Average Height of Force (AHOF). The relative homogeneity criterion is shown for the range of vehicles tested, plotted in order of increasing mass (Figure 7). It consists of three components, which indicate how well the load is distributed globally over
Car 1
Car 2
Figure 5: Vehicle Deformations from FWDB Tests: Note different cross beam deformation for the cars
Car 1
Car 2
Figure 6: Load Cell Wall Force Contours in FWDB Test: Note the influence of the subframe for Car 2
the wall (cell), distributed vertically (row), and horizontally (column).
Thomson 9
0.0
0.1
0.2
0.3
0.4
0.5
0.6
0.7
0.8
0.9
1.0
Supermini SmallFamily
SmallFamily
SmallFamily
LargeFamily
LargeFamily
Small Off-Road
Executive Large Off-Road
905kg 1289kg 1402kg 1510kg 1626kg 1637kg 1728kg 1802kg 2311kg
1+ level 1 level 2 levels 1 level 2 levels 2 levels 2 levels 2 levels 2 levels
Bot out Not Bot out Bot Out Not Bot out Bot out Bot out Bot out Bot out Bot out
Rel
ativ
e H
omo
gen
eity
Cri
teri
on Relative Overall (cell)
Relative vertical (row)
Relative horizontal (column)
Mass
Load Paths
Bottomed out?
Figure 7: Relative Homogeneity Criteria Plotted Against Increasing Vehicle Mass
It is seen that Car 2 had a better relative homogeneity score than Car 1, (0.28 cf 0.39) indicating that it spread its load more uniformly on the wall than Car 1. This difference was greater for the vertical component (0.08 cf 0.12) which is expected as Car 2 has a two-level load path design and in principle should be better able to spread its load vertically. In general, it might be expected that cars with multiple-level load path designs should spread their load vertically better and hence achieve a better vertical relative homogeneity component score. However, if the full data set is examined the vertical component of the relative homogeneity criterion does not appear to clearly distinguish between the cars with one-level of load path and those with more. This is not unexpected as it is unlikely that a simple subjective count of a car’s load path levels is a good measure of its vertical load spreading capability and structural interaction potential. Further car-to-car test validation data is required to investigate this issue fully. The AHOF is shown in Figure 8 for the range of vehicles tested, plotted for increasing vehicle mass, including Car 1 and 2. It is seen that Car 1 records a higher AHOF value than Car 2 which, at first sight, is unexpected as Car 2 has a subframe load path which applies load at a low height on the wall. However, it should be noted that the Car 1 has a lower bumper crossbeam than Car 2 which could explain this apparent anomaly. Figure 9 is a graph of the peak total LCW force plotted against vehicle mass. It is seen that the total LCW force peak increases with increasing vehicle mass indicating that heavier vehicles have higher frontal force levels. Although the primary aim of the FWDB test is to assess a vehicle’s structural interaction potential it may be possible to use this test to a vehicle’s frontal force levels in a similar way to
that proposed for the 64 km/h ODB test. Further work is needed to investigate this issue.
409490 479 445 454 472 465 468
549
0
100
200
300
400
500
600
700
800
Supermini SmallFamily
SmallFamily
SmallFamily
LargeFamily
LargeFamily
Small Off-Road
Executive Large Off-Road
905kg 1289kg 1402kg 1510kg 1626kg 1637kg 1728kg 1802kg 2311kg
1+ level 1 level 2 levels 1 level 2 levels 2 levels 2 levels 2 levels 2 levels
AH
OF
(m
m)
Mass
Load Paths Figure 8: AHOF Results from FWDB
0
100
200
300
400
500
600
700
800
900
1000
800 1000 1200 1400 1600 1800 2000 2200 2400
Mass (kg)
Forc
e (k
N)
Figure 9: Peak LCW force measurement for FWDB tests.
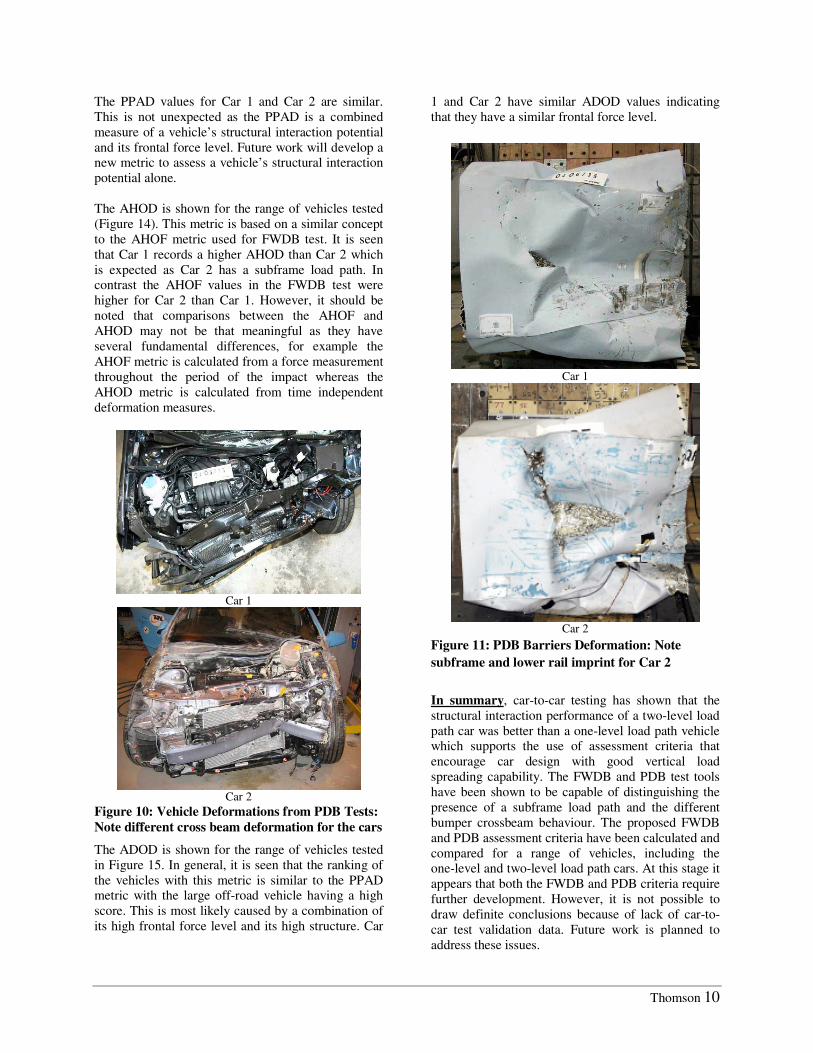
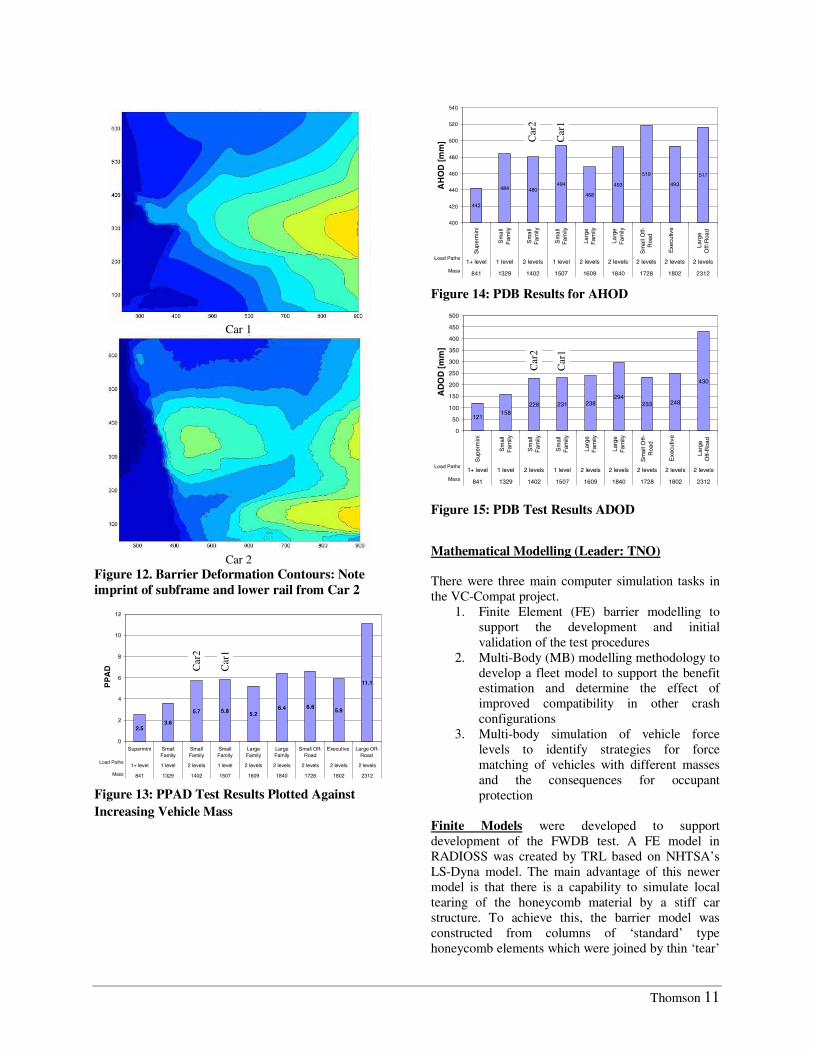
PDB assessment is based on the barrier deformation. The barrier deformations from the tests with Car 1 and Car 2 are shown in Figure 11 together with contour plots obtained from laser scanning of the barriers (Figure 12). Greater barrier face deformation is seen at subframe level for Car 2 than Car 1 indicating that the subframe load path on Car 2 was detected. For Car 2 there was a high localised deformation in alignment with the main rail load path caused by the failure of the bumper crossbeam, which was not present for Car 1. This shows that the difference in crossbeam performance was detected by the PDB barrier. Three metrics are currently available for the PDB test, the PPAD, AHOD and ADOD. For each of the PDB metrics, the same vehicles are shown as for the FWDB metrics so that the reader can compare the assessment of the vehicles by the two test methods. The PPAD is a measure of a vehicle’s aggressiveness and is shown for the range of vehicles tested including Car 1 and Car 2 (Figure 13). Note that lower PPAD scores are desirable.
Car
2
Car
1 C
ar 2
Car
1
Thomson 10
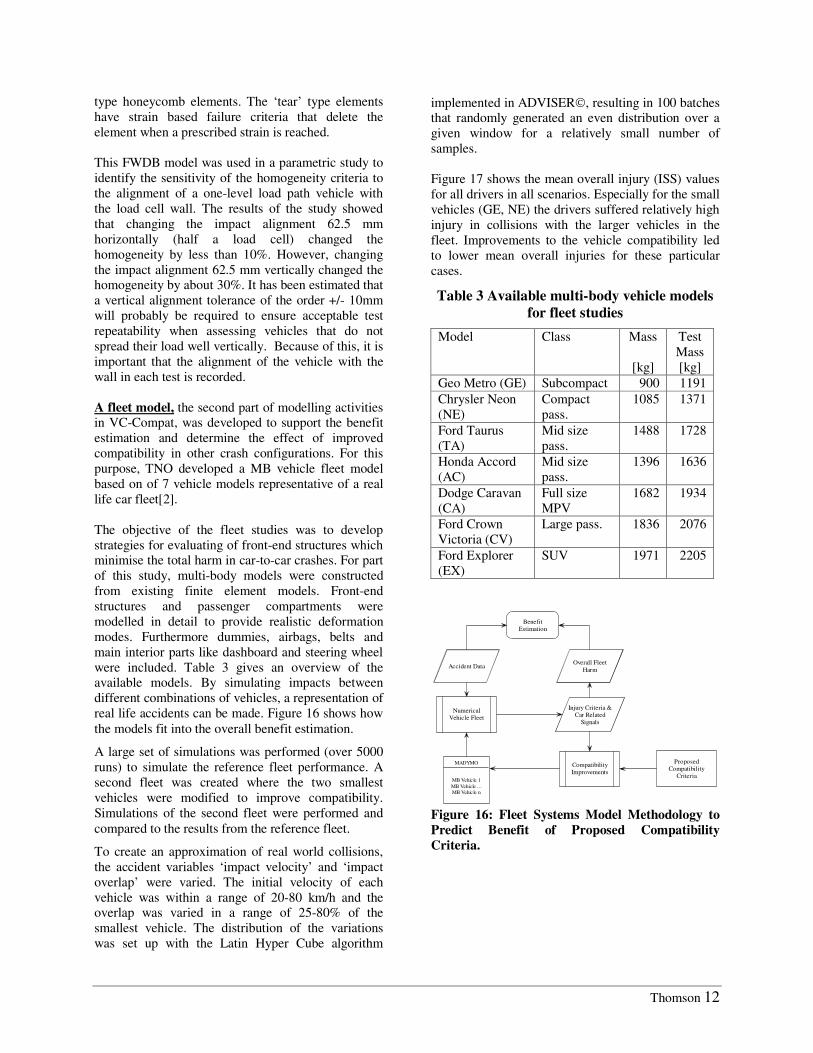
The PPAD values for Car 1 and Car 2 are similar. This is not unexpected as the PPAD is a combined measure of a vehicle’s structural interaction potential and its frontal force level. Future work will develop a new metric to assess a vehicle’s structural interaction potential alone. The AHOD is shown for the range of vehicles tested (Figure 14). This metric is based on a similar concept to the AHOF metric used for FWDB test. It is seen that Car 1 records a higher AHOD than Car 2 which is expected as Car 2 has a subframe load path. In contrast the AHOF values in the FWDB test were higher for Car 2 than Car 1. However, it should be noted that comparisons between the AHOF and AHOD may not be that meaningful as they have several fundamental differences, for example the AHOF metric is calculated from a force measurement throughout the period of the impact whereas the AHOD metric is calculated from time independent deformation measures.
Car 1
Car 2
Figure 10: Vehicle Deformations from PDB Tests: Note different cross beam deformation for the cars
The ADOD is shown for the range of vehicles tested in Figure 15. In general, it is seen that the ranking of the vehicles with this metric is similar to the PPAD metric with the large off-road vehicle having a high score. This is most likely caused by a combination of its high frontal force level and its high structure. Car
1 and Car 2 have similar ADOD values indicating that they have a similar frontal force level.
Car 1
Car 2
Figure 11: PDB Barriers Deformation: Note subframe and lower rail imprint for Car 2
In summary, car-to-car testing has shown that the structural interaction performance of a two-level load path car was better than a one-level load path vehicle which supports the use of assessment criteria that encourage car design with good vertical load spreading capability. The FWDB and PDB test tools have been shown to be capable of distinguishing the presence of a subframe load path and the different bumper crossbeam behaviour. The proposed FWDB and PDB assessment criteria have been calculated and compared for a range of vehicles, including the one-level and two-level load path cars. At this stage it appears that both the FWDB and PDB criteria require further development. However, it is not possible to draw definite conclusions because of lack of car-to-car test validation data. Future work is planned to address these issues.
Thomson 11
Car 1
Car 2
Figure 12. Barrier Deformation Contours: Note imprint of subframe and lower rail from Car 2
2.53.6
5.7 5.8 5.26.4 6.6
5.9
11.1
0
2
4
6
8
10
12
Supermini SmallFamily
SmallFamily
SmallFamily
LargeFamily
LargeFamily
Small Off-Road
Executive Large Off-Road
1+ level 1 level 2 levels 1 level 2 levels 2 levels 2 levels 2 levels 2 levels
841 1329 1402 1507 1609 1840 1728 1802 2312
PP
AD
Load Paths
Mass
Figure 13: PPAD Test Results Plotted Against Increasing Vehicle Mass
442
484 480494
468
493
519
493
517
400
420
440
460
480
500
520
540
Sup
erm
ini
Sm
all
Fam
ily
Sm
all
Fam
ily
Sm
all
Fam
ily
Larg
eF
amily
Larg
eF
amily
Sm
all O
ff-R
oad
Exe
cutiv
e
Larg
eO
ff-R
oad
1+ level 1 level 2 levels 1 level 2 levels 2 levels 2 levels 2 levels 2 levels
841 1329 1402 1507 1609 1840 1728 1802 2312
AH
OD
[m
m]
Load Paths
Mass
Figure 14: PDB Results for AHOD
121158
228 231 238294
233 248
430
0
50
100
150
200
250
300
350
400
450
500
Sup
erm
ini
Sm
all
Fam
ily
Sm
all
Fam
ily
Sm
all
Fam
ily
Larg
eF
amily
Larg
eF
amily
Sm
all O
ff-R
oad
Exe
cutiv
e
Larg
eO
ff-R
oad
1+ level 1 level 2 levels 1 level 2 levels 2 levels 2 levels 2 levels 2 levels
841 1329 1402 1507 1609 1840 1728 1802 2312
AD
OD
[mm
]
Load Paths
Mass
Figure 15: PDB Test Results ADOD
Mathematical Modelling (Leader: TNO) There were three main computer simulation tasks in the VC-Compat project.
1. Finite Element (FE) barrier modelling to support the development and initial validation of the test procedures
2. Multi-Body (MB) modelling methodology to develop a fleet model to support the benefit estimation and determine the effect of improved compatibility in other crash configurations
3. Multi-body simulation of vehicle force levels to identify strategies for force matching of vehicles with different masses and the consequences for occupant protection
Finite Models were developed to support development of the FWDB test. A FE model in RADIOSS was created by TRL based on NHTSA’s LS-Dyna model. The main advantage of this newer model is that there is a capability to simulate local tearing of the honeycomb material by a stiff car structure. To achieve this, the barrier model was constructed from columns of ‘standard’ type honeycomb elements which were joined by thin ‘tear’
Car
2
Car
1
Car
2
Car
1
Car
2
Car
1
Thomson 12
type honeycomb elements. The ‘tear’ type elements have strain based failure criteria that delete the element when a prescribed strain is reached. This FWDB model was used in a parametric study to identify the sensitivity of the homogeneity criteria to the alignment of a one-level load path vehicle with the load cell wall. The results of the study showed that changing the impact alignment 62.5 mm horizontally (half a load cell) changed the homogeneity by less than 10%. However, changing the impact alignment 62.5 mm vertically changed the homogeneity by about 30%. It has been estimated that a vertical alignment tolerance of the order +/- 10mm will probably be required to ensure acceptable test repeatability when assessing vehicles that do not spread their load well vertically. Because of this, it is important that the alignment of the vehicle with the wall in each test is recorded. A fleet model, the second part of modelling activities in VC-Compat, was developed to support the benefit estimation and determine the effect of improved compatibility in other crash configurations. For this purpose, TNO developed a MB vehicle fleet model based on of 7 vehicle models representative of a real life car fleet[2]. The objective of the fleet studies was to develop strategies for evaluating of front-end structures which minimise the total harm in car-to-car crashes. For part of this study, multi-body models were constructed from existing finite element models. Front-end structures and passenger compartments were modelled in detail to provide realistic deformation modes. Furthermore dummies, airbags, belts and main interior parts like dashboard and steering wheel were included. Table 3 gives an overview of the available models. By simulating impacts between different combinations of vehicles, a representation of real life accidents can be made. Figure 16 shows how the models fit into the overall benefit estimation.
A large set of simulations was performed (over 5000 runs) to simulate the reference fleet performance. A second fleet was created where the two smallest vehicles were modified to improve compatibility. Simulations of the second fleet were performed and compared to the results from the reference fleet.
To create an approximation of real world collisions, the accident variables ‘impact velocity’ and ‘impact overlap’ were varied. The initial velocity of each vehicle was within a range of 20-80 km/h and the overlap was varied in a range of 25-80% of the smallest vehicle. The distribution of the variations was set up with the Latin Hyper Cube algorithm
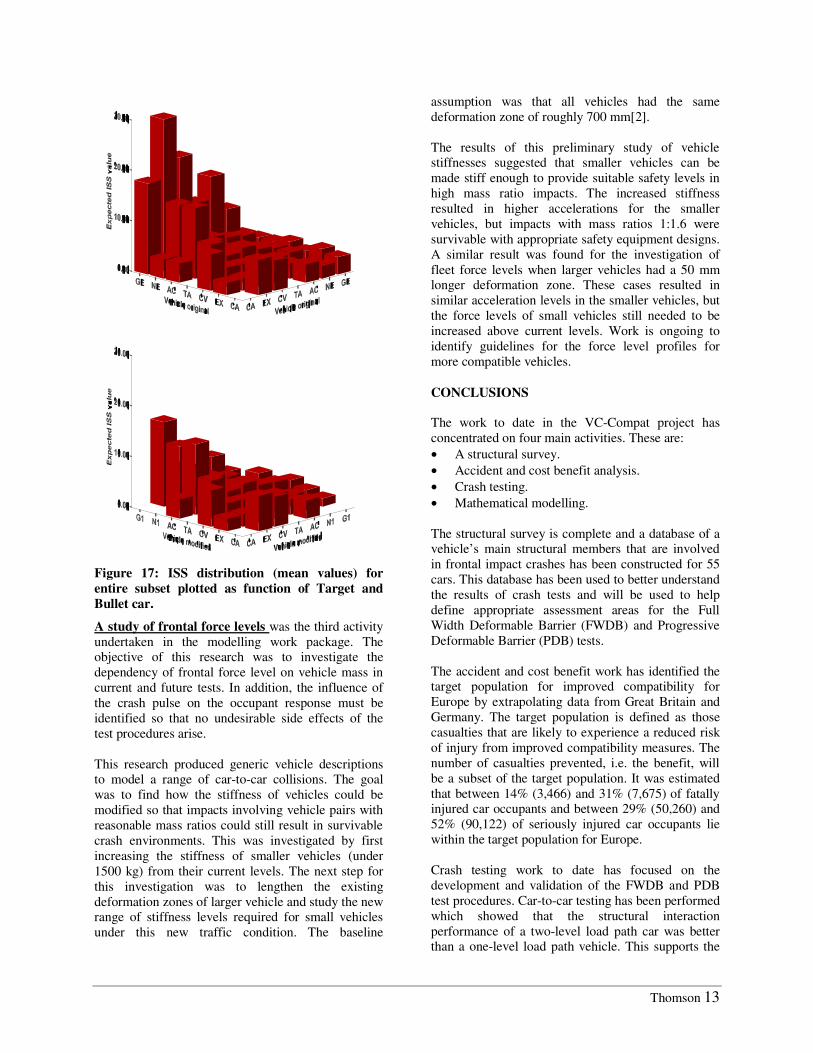
implemented in ADVISER©, resulting in 100 batches that randomly generated an even distribution over a given window for a relatively small number of samples. Figure 17 shows the mean overall injury (ISS) values for all drivers in all scenarios. Especially for the small vehicles (GE, NE) the drivers suffered relatively high injury in collisions with the larger vehicles in the fleet. Improvements to the vehicle compatibility led to lower mean overall injuries for these particular cases.
Table 3 Available multi-body vehicle models for fleet studies
Model Class Mass
[kg]
Test Mass [kg]
Geo Metro (GE) Subcompact 900 1191 Chrysler Neon (NE)
Compact pass.
1085 1371
Ford Taurus (TA)
Mid size pass.
1488 1728
Honda Accord (AC)
Mid size pass.
1396 1636
Dodge Caravan (CA)
Full size MPV
1682 1934
Ford Crown Victoria (CV)
Large pass. 1836 2076
Ford Explorer (EX)
SUV 1971 2205
NumericalVehicle Fleet
CompatibilityImprovements
Injury Criteria &Car Related
Signals
Accident Data
ProposedCompatibility
Criteria
Overall FleetHarm
MADYMO
MB Vehicle 1MB Vehicle ...MB Vehicle n
BenefitEstimation
Figure 16: Fleet Systems Model Methodology to Predict Benefit of Proposed Compatibility Criteria.
Thomson 13
Figure 17: ISS distribution (mean values) for entire subset plotted as function of Target and Bullet car.
A study of frontal force levels was the third activity undertaken in the modelling work package. The objective of this research was to investigate the dependency of frontal force level on vehicle mass in current and future tests. In addition, the influence of the crash pulse on the occupant response must be identified so that no undesirable side effects of the test procedures arise. This research produced generic vehicle descriptions to model a range of car-to-car collisions. The goal was to find how the stiffness of vehicles could be modified so that impacts involving vehicle pairs with reasonable mass ratios could still result in survivable crash environments. This was investigated by first increasing the stiffness of smaller vehicles (under 1500 kg) from their current levels. The next step for this investigation was to lengthen the existing deformation zones of larger vehicle and study the new range of stiffness levels required for small vehicles under this new traffic condition. The baseline
assumption was that all vehicles had the same deformation zone of roughly 700 mm[2]. The results of this preliminary study of vehicle stiffnesses suggested that smaller vehicles can be made stiff enough to provide suitable safety levels in high mass ratio impacts. The increased stiffness resulted in higher accelerations for the smaller vehicles, but impacts with mass ratios 1:1.6 were survivable with appropriate safety equipment designs. A similar result was found for the investigation of fleet force levels when larger vehicles had a 50 mm longer deformation zone. These cases resulted in similar acceleration levels in the smaller vehicles, but the force levels of small vehicles still needed to be increased above current levels. Work is ongoing to identify guidelines for the force level profiles for more compatible vehicles. CONCLUSIONS The work to date in the VC-Compat project has concentrated on four main activities. These are: • A structural survey. • Accident and cost benefit analysis. • Crash testing. • Mathematical modelling. The structural survey is complete and a database of a vehicle’s main structural members that are involved in frontal impact crashes has been constructed for 55 cars. This database has been used to better understand the results of crash tests and will be used to help define appropriate assessment areas for the Full Width Deformable Barrier (FWDB) and Progressive Deformable Barrier (PDB) tests. The accident and cost benefit work has identified the target population for improved compatibility for Europe by extrapolating data from Great Britain and Germany. The target population is defined as those casualties that are likely to experience a reduced risk of injury from improved compatibility measures. The number of casualties prevented, i.e. the benefit, will be a subset of the target population. It was estimated that between 14% (3,466) and 31% (7,675) of fatally injured car occupants and between 29% (50,260) and 52% (90,122) of seriously injured car occupants lie within the target population for Europe. Crash testing work to date has focused on the development and validation of the FWDB and PDB test procedures. Car-to-car testing has been performed which showed that the structural interaction performance of a two-level load path car was better than a one-level load path vehicle. This supports the
Thomson 14
use of assessment criteria that encourage car design with good vertical load spreading capability. The FWDB and PDB test tools have been shown to be capable of distinguishing the presence of subframe load paths and different bumper crossbeam behaviour. The proposed FWDB and PDB assessment criteria have been calculated and compared for a range of vehicles. At this stage it appears likely that both the FWDB and PDB assessment criteria require further development. However, there is a shortage of car-to-car test validation data. Future work is planned to address these issues. A Finite Element (FE) model of the FWDB has been developed and used to investigate the sensitivity of the relative homogeneity criteria to alignment of the car with the LCW. The results showed a high sensitivity to vertical alignment for a non-homogeneous, i.e. incompatible, vehicle. To ensure test repeatability for this type of vehicle it has been estimated that vertical alignment tolerances of the order of +/- 10 mm will be required. A vehicle fleet model has been developed using the MADYMO software. This will be used to quantify the benefits of improved compatibility in the vehicle fleet. Studies to investigate the frontal force mismatch in the current fleet indicate that changes to both light and heavy vehicles are needed. The EEVC WG15 route map requires a test procedure to assess a vehicle’s structural interaction potential in the short term. The VC-Compat project will continue to focus on the development of the FWDB and PDB test procedures as both these tests have the potential to achieve this goal. The VC-Compat Car-to-Car Research Team: TRL: Mervyn Edwards, Huw Davies UTAC: Pierre Castaing, Tiphaine Martin, Pascal
Delannoy BASt: Eberhard Faerber, Claus Pastor, Richard
Damm Chalmers: Robert Thomson, Fredrik Jenefeldt FIAT: Giancarlo Della Valle, Domenico Galeazzi TNO: Cor van der Zweep, Gijs Kellendonk Acknowledgements: The consortium is grateful for the financial sponsorship of: the European Commission DG-TREN, DSCR (French Department of Transport), Swedish Road Administration, UK Department for Transport, German Ministry of Transport and Housing, Dutch Ministry of Transport References 1 Community Road Accident Database (CARE)
http://europa.eu.int/comm/transport/care/
2 Edwards, M. et al, “ A Study To Improve The Crash Compatibility Between Cars In Frontal Impact” Final Report, Directorate-General for Energy and Transport, Contract Reference: E3-3 B2702/SI2.318663/2001 TRL, July 2002
3 VC-Compat webpage: www http://vc-compat.rtdproject.net/.
4 Edwards, M., Davies, H., Hobbs, C.A., “Development of Test Procedures and Performance Criteria to Improve Compatibility in Car Frontal Collisions”, Proceedings of the 18th ESV Conference Paper 86, 2003
5 Summers, S., Prasad, A., Hollowell, W.T., “NHTSA’s Compatibility Research Program Update”, SAE International Congress and Exhibition, Paper 01B-257, 2000
6 Delannoy, P., Faure, J., ”Compatibility Assessment Proposal Close From Real Life Accident”, Proceedings of the 18th ESV Conference, Paper 94, 2003
7 Delannoy, P., Martin, T., Castaing, P., ”Comparative Evaluation of Frontal Offset Tests to Control Self and Partner Protection”, Proceedings of the 19th ESV Conference Paper 05-0010, 2005
8 O’Reilly, P., “Status Report Of Ihra Compatibility And Frontal Impactworking Group”, Proceedings of the 19th ESV Conference Paper 402, 2003
9 OECD - International Road Traffic and Accident Database, www.bast.de/htdocs/fachthemen/irtad/
10 Edwards, M., Happian-Smith, J., Byard, N., Davies, H., and Hobbs, A., ”The Essential Requirements for Compatible Cars in Frontal Impacts”, Proceedings of the 17th ESV Conference, 2001