paper on 'ongoing upgradation in rmg enterprises
TRANSCRIPT
1
Preliminary Draft Please do not quote
Paper on
‘Ongoing Upgradation in RMG Enterprises:
Preliminary Results from a Survey’1
Presented at the
Dialogue on
“Ongoing Upgradation in RMG Enterprises: Results from a Survey”
Presentation by
Dr Khondaker Golam Moazzem
Research Director, CPD
Organised by
Centre for Policy Dialogue (CPD)
3 March 2018
1 The study has been prepared as part of CPD-RMG Study titled “New Dynamics of Bangladesh’s RMG Enterprises:
Perspectives on Restructuring, Upgrading and Compliance Assurance”.
2
CPD Study Team
Dr Khondaker Golam Moazzem, Project Director, CPD-RMG Study
Dr Fahmida Khatun, Executive Director, CPD
Mr Abeer Khandker, Visiting Research Associate, CPD and Senior Lecturer, East West University
Engr Faruk Ahmed, Industrial Engineer, CPD-RMG Study and Senior Lecturer, BGMEA University
of Fashion and Technology (BUFT)
Ms Shamima Pervin, Gender Consultant, CPD-RMG Study
Mr Faijan Bin Halim, Research Associate, CPD-RMG Study
Ms Tahsin Farah Chowdhury, Research Associate, CPD-RMG Study
Ms. Mastura Safayet, Programme Associate, CPD-RMG Study
Mr Minhaz M Reza, Programme Associae, CPD-RMG Study
Ms Syeda Samiha Azim, Programme Associate, CPD-RMG Study
Md Arfanuzzaman, Programme Manager, CPD-RMG Study
3
Contents
1. Introduction and Objectives of the Study ..………………………………………………………………………………………….5
2. Literature Review ……………………………………………………………………………………………………………………………….6
3. Methodology ………………………………………………………………………………………………………………………………………7
3.1 Baseline Survey …………………………………………………………………………………………………………………….8
3.2 Sample Size…………………………………………………………………………………………………………………………..8
3.3. Sampling Frame……………………………………………………………………………………………………………………9
3.4 Conducting High Frequency Data Survey (HFDS)..……………………………………………………………….11
3.5 Estimation Methods ……………………………………………………………………………………………………………12
3.5.1 Upgradation Index ………………………………………………………………………………………………12
3.5.2 Estimating Technological Readiness of Sample Enterprises………………………………….14
4. Sample Enterprises and Workers: Interim Findings..………………………………………………………………………….15
4.1 Distribution of Sample Enterprises and Workers…………………………………………………………………15
4.2 Ownership of Sample Enterprises...…………………………..………………………………………………………..15
4.3 Establishment and Operation of Sample Enterprises..…………………………………………………………17
4.4 Management of Sample Enterprises……………………………………………………………………………………18
4.5 Workers in Sample RMG Enterprises…………………………………………………………………………………..20
4.6 Machinery Use ……………………………………………………………………………………………………………………24
4.7 Buyers and Exports……………………………………………………………………………………………………………..26
4.8 Workers’ Organizations……………………………………………………………………………………………………….28
4.9 Overall Observation on Structure and Composition of Sample Enterprises………………………….30
5. Overall Upgrading of Sample Enterprises..…………………………………………………………………………………………31
5.1 Economic Upgrading……………………………………………………………………………………………………………31
5.2 Social Upgrading …………………………………………………………………………………………………………………33
5.3 Gender Embedded Upgrading……………………………………………………………………………………………..35
6. Upgrading in Different Components …….……………………………………………………………………………………………37
6.1 Components of Economic Upgrading ………………………………………………………………………………….37
6.1.1 Process Upgrading……………………………………………………………………………………………….37
6.1.2 Product Upgrading ………………………………………………………………………………………………38
6.1.3 Functional Upgrading ………………………………………………………………………………………….39
6.2 Components of Social Upgrading…………………………………………………………………………………………40
6.2.1 Employment Security Sub index…………………………………………………………………………..41
4
6.2.2 Rights Sub-Index …………………………………………………………………………………………………42
6.2.3 Standard Sub-Index……………………………………………………………………………………………..42
6.2.4 Non-Discrimination Index ……………………………………………………………………………………43
6.3 Components of Gender Embedded Upgrading…………………………………………………………………….43
6.3.1 Gender Embedded Rights Sub Index………………………………………………………………….44
6.3.2 Gender Embedded Non Discrimination Index………………………………………………………45
6.4 Overall Observations on Upgradation………………………………………………………………………………….45
7. Implications of Upgradation on Firm’s Overall Performance ……………………………………………………………..46
7.1 Price of Production Orders …………………………………………………………………………………………………46
7.2 Suppliers’ Profit ………………………………………………………………………………………………………………….47
7.3 Distribution of Margin in the Value Chain …………………………………………………………….…………….48
7.4 Line and Worker Efficiency………………………………………………………………………………………………….49
8. Conclusion…………………………………………………………………………………………………………………………………………50
Annexure……………………………………………………………………………………………………………………………………………….52
References …………………………………………………………………………………………………………………………………….………53
5
1. Introduction and Objectives of the Study
In the global apparel value chain, issues of firm level competitiveness are being increasingly linked with
factors beyond economic and technological upgrading. This is no less true for issues of social
compliances, particularly in view of recent developments. Gender dimensions also occupy an important
place in this discourse. This renewed focus on competitiveness in terms of economic, social and gender
embedded upgrading got prominence in the global value chain with the tragic incidence of the collapse
of Rana Plaza in April, 2013 which caused deaths of over 1000 garments workers. In other words, the
Rana Plaza tragedy symbolized the poor state of sustainable development of apparel value chain in
Bangladesh and other supplying countries. Consequently, Bangladesh’s apparels sector has put in place
various restructuring and reform measures particularly addressing social and physical compliance
related issues. Over the last five years, RMG enterprises in Bangladesh have focused not only social
concerns but also on economic and other issues with a view to rebuilding their image and
competitiveness and thereby getting ready to compete in the global market under a new paradigm of
competitiveness. In this backdrop, it is important to analyse the state of ongoing activities at the
enterprise level, in the areas of economic and social upgrading, their implications for competitiveness of
RMG enterprises with a view to assess their improvement in capacity to compete in the global apparel
market. Thus, the paper seeks to address the following issues.
The overall objective of the study is to assess the capacity of apparels enterprises to undertake
economic transformation as well as to upgrade physical and social compliances and thereby to continue
maintaining its competitiveness in the global market. Economic transformation at the enterprise level is
reflected through economic upgrading by upgrading its manufacturing base from low-end and mass-
level products towards a combination of low and medium to high end products. This will be related with
enterprises ability to raise the level of productivity, efficiency, technological readiness, market and
product diversity etc. The social upgrading is more related with the ability to undertake necessary
restructuring of physical and social compliances. Based on this assessment, the study would like to put
forward necessary policy suggestions with regard to long term economic upgrading along with social
upgrading targeting sustainable development of apparels enterprises.
This interim study highlights only a part of the above-mentioned objectives; four issues that are
highlighted in this study include: a) to analyse the benchmark condition of RMG enterprises particularly
with regard to structure and composition of ownership, management, workers and their organisations
and technologies etc; b) to estimate the level of upgrading of RMG enterprises with regard to social,
economic and gender-embedded upgrading in order to assess their level of progress; c) to analyse the
enterprise-level upgradation in terms of size, location and other variables with a view to appreciate the
dynamics and changes of upgradation; d) to review the possible impact of firm’s upgradation on its
overall competitiveness particularly in terms of price and profitability.
6
2. Literature Review on Enterprise Level Upgrading and Its Implications on
Overall Performance
The competitiveness of firms in the global value chains has been increasingly interpreted beyond
economic issues. Different social issues related to workers job, work place safety and workers’ rights are
part of firm level competitiveness. Hence firms are increasingly putting emphasis both on economic and
social upgradation. Economic upgrading can be defined as the process through which firms move from
low-value added to high-value added activities along the global value chain (Gereffi, 1999), or, in other
words, value-added increasing innovation (USAID, 2006). It is considered as ‘key means of success for
actors in global value chains’ (Moazzem and Sehrin, 2016). The key indicators of economic upgrading
include process upgrading, product upgrading and functional upgrading which include technological
changes in case of machineries, techniques, products, research and development and functions.
On the other hand, ILO has defined social upgrading in the context of decent work with its four pillars
that include employment, standards and rights at work, social protection and social dialogue (ILO, 1999).
According to Elliot and Freeman (2003) and Barrientos and Smith (2007) social upgrading consists of
measurable standards and enabling rights. Measurable standards are the easily observable and
quantifiable aspects of workers’ well-being, while enabling rights includes freedom of association, right
to collective bargaining, non-discrimination, voice and empowerment. These two concepts are also
interrelated: lack of access to enabling rights weakens workers’ ability to negotiate improvements in
working conditions, while measurable standards are generally outcomes of bargaining processes driven
by the rights of workers.
Traditionally, it was assumed that economic upgrading within the global value chains would bring social
upgrading with it. In fact, if neoclassical theory is considered, labour demand and wages are determined
by technology, and ‘this connects economic to social upgrading’ (Milberg and Winkler, 2011). However,
recent work suggests that economic upgrading is generally a necessary, but not a sufficient condition for
social upgrading (Salido and Bellhouse, 2016), and economic upgrading leading to social upgrading
varies across countries and GVCs (Milberg and Winkler, 2013). From their extensive reviews of issues in
this area, Barrientos et al (2010) and Milberg and Winkler (2011) suggest that economic upgrading ‘only
sometimes translates into improvements for workers’.
The empirical evidence dealing directly with economic and social upgrading is limited, and the ones that
study the two concepts are more recent and sector specific. While some authors suggest that economic
upgrading ultimately leads to social upgrading in the long run, and the process is not automatic
(UNCTAD 2013, 2014), the empirical literature is highly divided on this issue. Recent work suggests that
economic upgrading is generally ‘a necessary, but not a sufficient condition for social upgrading’ (Salido
and Bellhouse, 2016). Moreover, Bernhardt and Milberg (2012) suggest that there appears to be a
positive correlation between economic and social upgrading, but there are some examples where
economic upgrading led to social downgrading. Also, there are different factors that influence the
interrelationships of economic and social upgrading, such as particularities of specific industries,
position within the global value chain, typology of labor, status of workers, etc. (Salido and Bellhouse,
2016). Some studies have found that economic upgrading brings social benefits to permanent workers
and social downgrading to irregular workers. (Lee, Gereffi and Nathan, 2013; Rossi, 2013; Bernhardt and
Milberg, 2012). Governance and lead firm policies can also have a huge effect on the quality of life of
workers at all levels of the value chain (Nathan and Sarkar, 2011; Rossi, 2013).
7
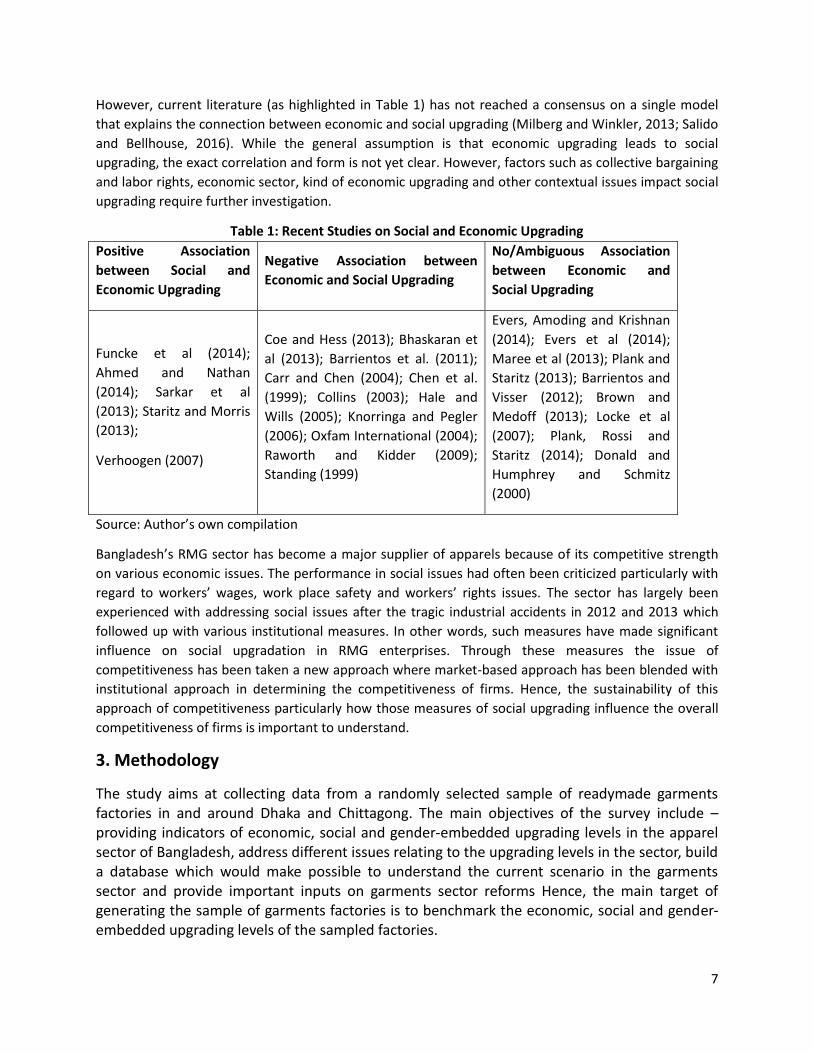
However, current literature (as highlighted in Table 1) has not reached a consensus on a single model
that explains the connection between economic and social upgrading (Milberg and Winkler, 2013; Salido
and Bellhouse, 2016). While the general assumption is that economic upgrading leads to social
upgrading, the exact correlation and form is not yet clear. However, factors such as collective bargaining
and labor rights, economic sector, kind of economic upgrading and other contextual issues impact social
upgrading require further investigation.
Table 1: Recent Studies on Social and Economic Upgrading
Positive Association
between Social and
Economic Upgrading
Negative Association between
Economic and Social Upgrading
No/Ambiguous Association
between Economic and
Social Upgrading
Funcke et al (2014);
Ahmed and Nathan
(2014); Sarkar et al
(2013); Staritz and Morris
(2013);
Verhoogen (2007)
Coe and Hess (2013); Bhaskaran et
al (2013); Barrientos et al. (2011);
Carr and Chen (2004); Chen et al.
(1999); Collins (2003); Hale and
Wills (2005); Knorringa and Pegler
(2006); Oxfam International (2004);
Raworth and Kidder (2009);
Standing (1999)
Evers, Amoding and Krishnan
(2014); Evers et al (2014);
Maree et al (2013); Plank and
Staritz (2013); Barrientos and
Visser (2012); Brown and
Medoff (2013); Locke et al
(2007); Plank, Rossi and
Staritz (2014); Donald and
Humphrey and Schmitz
(2000)
Source: Author’s own compilation
Bangladesh’s RMG sector has become a major supplier of apparels because of its competitive strength
on various economic issues. The performance in social issues had often been criticized particularly with
regard to workers’ wages, work place safety and workers’ rights issues. The sector has largely been
experienced with addressing social issues after the tragic industrial accidents in 2012 and 2013 which
followed up with various institutional measures. In other words, such measures have made significant
influence on social upgradation in RMG enterprises. Through these measures the issue of
competitiveness has been taken a new approach where market-based approach has been blended with
institutional approach in determining the competitiveness of firms. Hence, the sustainability of this
approach of competitiveness particularly how those measures of social upgrading influence the overall
competitiveness of firms is important to understand.
3. Methodology
The study aims at collecting data from a randomly selected sample of readymade garments factories in and around Dhaka and Chittagong. The main objectives of the survey include – providing indicators of economic, social and gender-embedded upgrading levels in the apparel sector of Bangladesh, address different issues relating to the upgrading levels in the sector, build a database which would make possible to understand the current scenario in the garments sector and provide important inputs on garments sector reforms Hence, the main target of generating the sample of garments factories is to benchmark the economic, social and gender-embedded upgrading levels of the sampled factories.
8
3.1 Baseline Survey
The study has been carried out on the basis of the primary data collected from the RMG enterprises.
Given the lack of availability of population data of RMG enterprises, CPD-RMG study has prepared a
comprehensive database for the population of RMG enterprises and workers which called ‘Data
Universe’. A significant time was spent on cleaning and merging these separate datasets resulting in a
single compiled database consisting of 6821 factories (henceforth referred to as the ‘harmonized
dataset’). From that dataset, factories who are still operational were identified through
thoroughly investigating each data, resulting in a master dataset contains 3648 factories (Table
2). As EPZ factories have largely different rules and regulations and are not comparable with the
other factories, they were excluded from the population for more focused studies later, and the
remaining number of factories were 3596. The geographical area of the factories encompass
greater Dhaka and Chittagong, including Gazipur, Narayangonj, Mymensingh, etc.
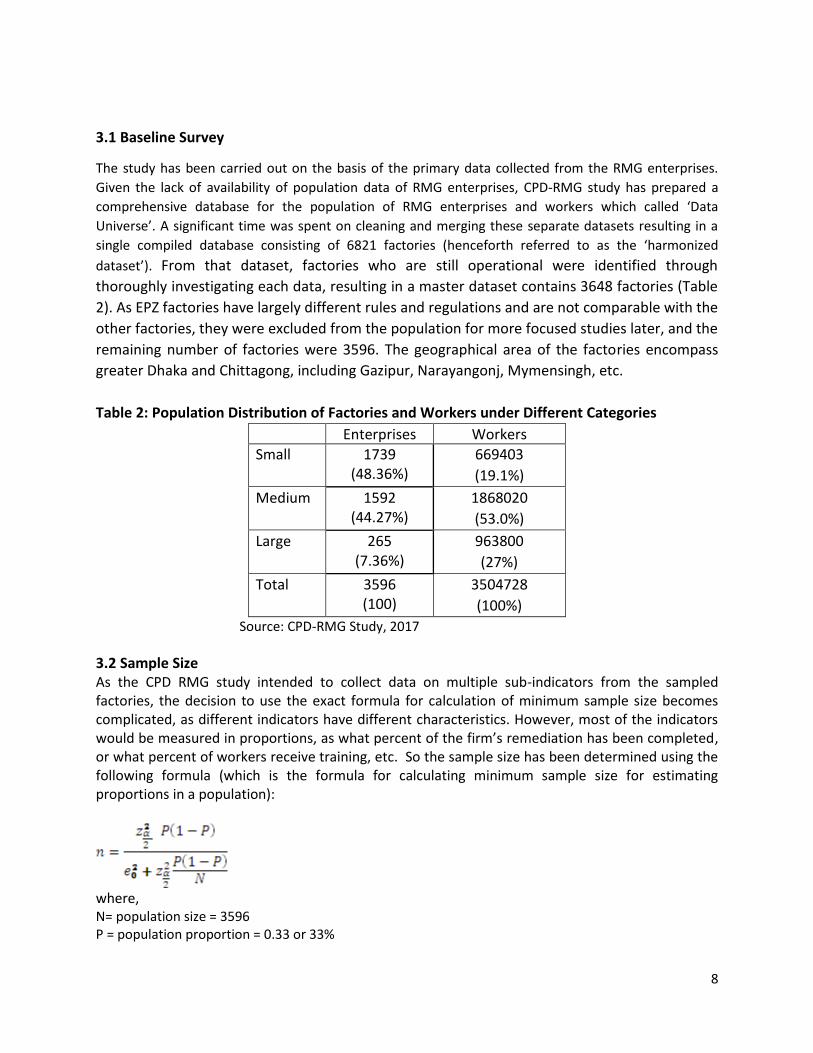
Table 2: Population Distribution of Factories and Workers under Different Categories
Enterprises Workers
Small 1739 (48.36%)
669403
(19.1%)
Medium 1592 (44.27%)
1868020
(53.0%)
Large 265 (7.36%)
963800
(27%)
Total 3596 (100)
3504728
(100%)
Source: CPD-RMG Study, 2017
3.2 Sample Size As the CPD RMG study intended to collect data on multiple sub-indicators from the sampled factories, the decision to use the exact formula for calculation of minimum sample size becomes complicated, as different indicators have different characteristics. However, most of the indicators would be measured in proportions, as what percent of the firm’s remediation has been completed, or what percent of workers receive training, etc. So the sample size has been determined using the following formula (which is the formula for calculating minimum sample size for estimating proportions in a population):
where, N= population size = 3596 P = population proportion = 0.33 or 33%
9
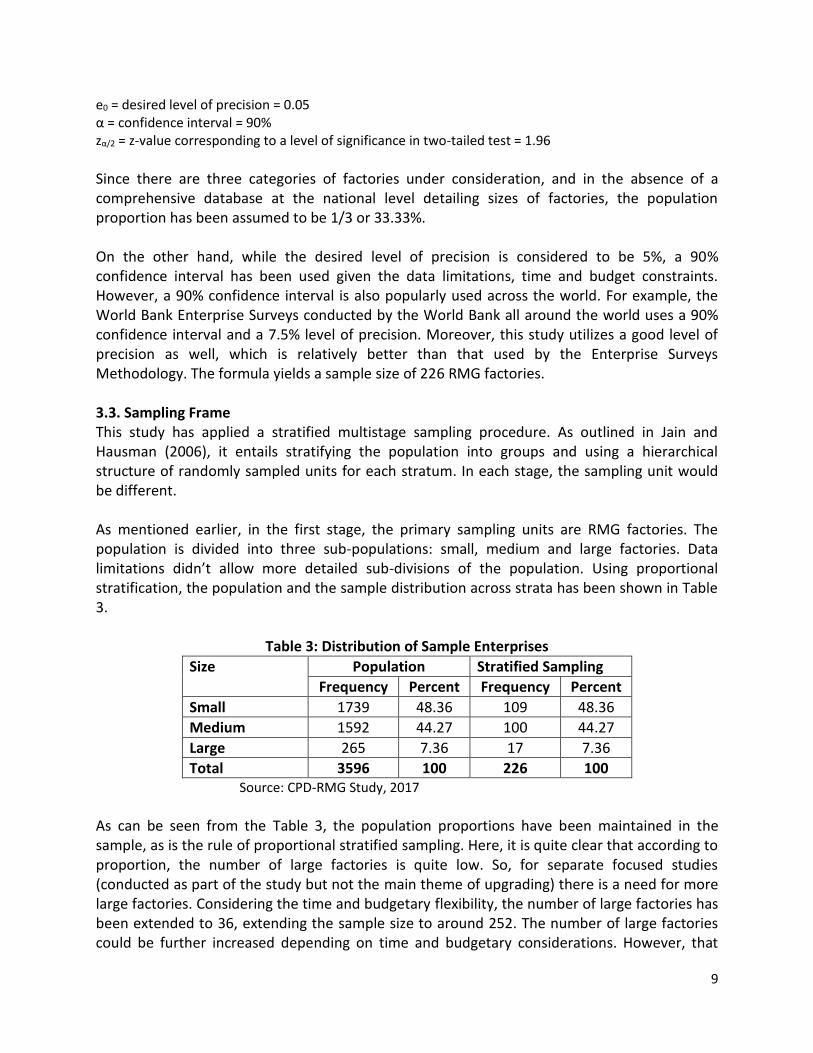
e0 = desired level of precision = 0.05 α = confidence interval = 90% zα/2 = z-value corresponding to a level of significance in two-tailed test = 1.96
Since there are three categories of factories under consideration, and in the absence of a comprehensive database at the national level detailing sizes of factories, the population proportion has been assumed to be 1/3 or 33.33%. On the other hand, while the desired level of precision is considered to be 5%, a 90% confidence interval has been used given the data limitations, time and budget constraints. However, a 90% confidence interval is also popularly used across the world. For example, the World Bank Enterprise Surveys conducted by the World Bank all around the world uses a 90% confidence interval and a 7.5% level of precision. Moreover, this study utilizes a good level of precision as well, which is relatively better than that used by the Enterprise Surveys Methodology. The formula yields a sample size of 226 RMG factories. 3.3. Sampling Frame This study has applied a stratified multistage sampling procedure. As outlined in Jain and Hausman (2006), it entails stratifying the population into groups and using a hierarchical structure of randomly sampled units for each stratum. In each stage, the sampling unit would be different. As mentioned earlier, in the first stage, the primary sampling units are RMG factories. The population is divided into three sub-populations: small, medium and large factories. Data limitations didn’t allow more detailed sub-divisions of the population. Using proportional stratification, the population and the sample distribution across strata has been shown in Table 3.
Table 3: Distribution of Sample Enterprises
Size Population Stratified Sampling
Frequency Percent Frequency Percent
Small 1739 48.36 109 48.36
Medium 1592 44.27 100 44.27
Large 265 7.36 17 7.36
Total 3596 100 226 100 Source: CPD-RMG Study, 2017
As can be seen from the Table 3, the population proportions have been maintained in the sample, as is the rule of proportional stratified sampling. Here, it is quite clear that according to proportion, the number of large factories is quite low. So, for separate focused studies (conducted as part of the study but not the main theme of upgrading) there is a need for more large factories. Considering the time and budgetary flexibility, the number of large factories has been extended to 36, extending the sample size to around 252. The number of large factories could be further increased depending on time and budgetary considerations. However, that
10
would depend mostly on the level of cooperation of sampled factories in this regard. Moreover, for analyses on the whole database, the proportions of the sample would be kept intact to avoid any bias. In the second stage, the sampling units are workers, and workers from each factory are randomly selected. Using 95 percent confidence interval with 2% margin of error and a population proportion of 33% (as before), the minimum number of workers required in the sample is 2122 (given a total population of 3504728 workers of the whole data universe). Given the worker distribution (Table 4) of the population, it is clear that medium factories employ roughly 3 times more workers than small factories and 2 times more workers than large factories. To maintain this ratio, and due to rounding up of the fractions, we obtain a sample of 2123 workers.
Table 4: Distribution of Sample Workers
Size Population (No. of
Workers) Sample (No. of Workers)
No. of Factories
Frequency Per cent Frequency Per cent Frequency Per cent
Small 669403 19.1 408 19.2 109 48.36
Medium 1868020 53.3 1131 53.3 100 44.27
Large 963800 27.5 584 27.5 17 7.36
Total 3504728 100 2123 226 226 100
Source: CPD-RMG Study, 2017
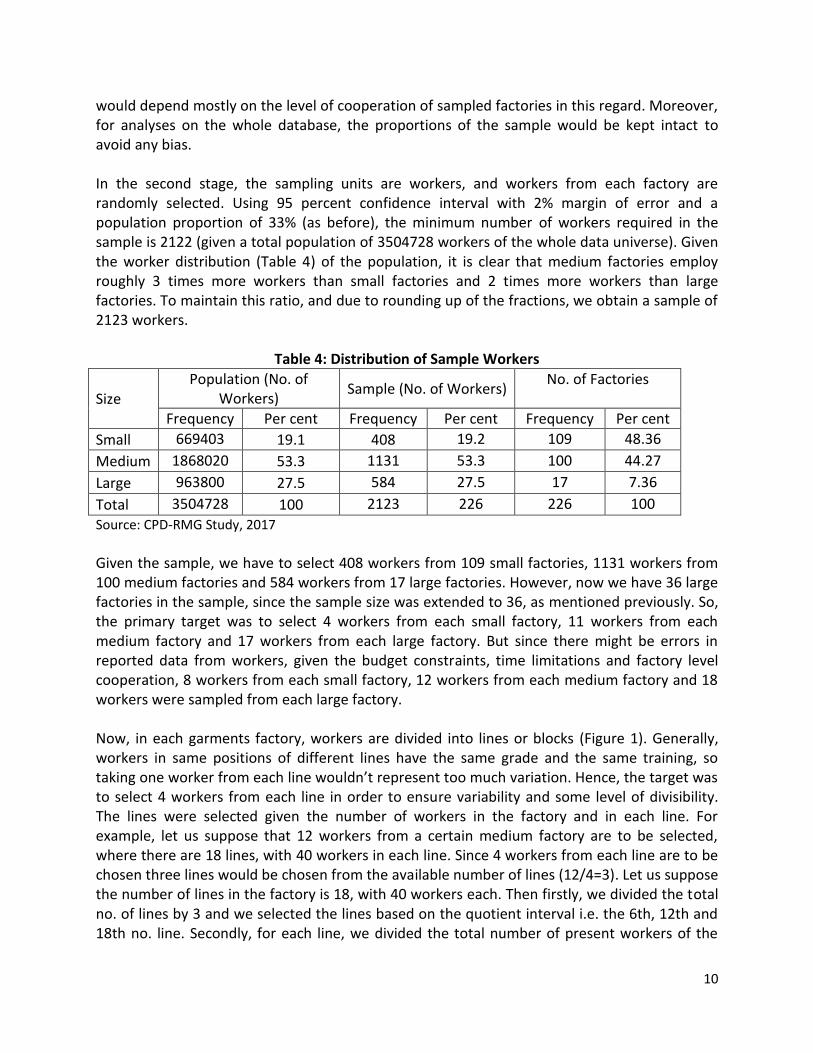
Given the sample, we have to select 408 workers from 109 small factories, 1131 workers from 100 medium factories and 584 workers from 17 large factories. However, now we have 36 large factories in the sample, since the sample size was extended to 36, as mentioned previously. So, the primary target was to select 4 workers from each small factory, 11 workers from each medium factory and 17 workers from each large factory. But since there might be errors in reported data from workers, given the budget constraints, time limitations and factory level cooperation, 8 workers from each small factory, 12 workers from each medium factory and 18 workers were sampled from each large factory. Now, in each garments factory, workers are divided into lines or blocks (Figure 1). Generally, workers in same positions of different lines have the same grade and the same training, so taking one worker from each line wouldn’t represent too much variation. Hence, the target was to select 4 workers from each line in order to ensure variability and some level of divisibility. The lines were selected given the number of workers in the factory and in each line. For example, let us suppose that 12 workers from a certain medium factory are to be selected, where there are 18 lines, with 40 workers in each line. Since 4 workers from each line are to be chosen three lines would be chosen from the available number of lines (12/4=3). Let us suppose the number of lines in the factory is 18, with 40 workers each. Then firstly, we divided the total no. of lines by 3 and we selected the lines based on the quotient interval i.e. the 6th, 12th and 18th no. line. Secondly, for each line, we divided the total number of present workers of the
11
each line by 4 and selected the workers based on the quotient interval i.e. 40/4=10 (if we have 40 worker present in line 6). Here, the workers selected will be 10th, 20th, 30th and 40th. Considering the male-female ratio of workers in sample enterprises, sample workers have been selected randomly from the selected lines. For example, if male-female ratio in sample factory is 40:60 and total number of sample workers is 8, then 40% of 8 i.e. 3 male workers and 60% of 8 i.e. 5 female workers have been selected.
Figure 1: Line and worker selection criterion for the baseline survey
Source: CPD-RMG Study, 2017
3.4 Conducting High Frequency Data Survey (HFDS)
High frequency data survey collects data on a regular basis for the issues that are
concurrently changing. The need for high frequency survey is that sometimes average
response may not be meaningful rather there are some issues for which we need to collect
concrete observation regularly in order to project the changes occur on the concerned
issue. In that respect, high frequency data survey is currently used worldwide in lieu of
paper based survey because baseline survey sometimes do not provide accurate answers
what we seem to have only through regularly monitoring the aspects that we mainly concerned with.
Present study conducted HFDS on issues related to RMG enterprises such as Standard
Minute Value (SMV) where production of various components of different apparel products
varied widely on a daily basis because of variances in workers’ level of productivity,
12
working environment, efficiency of machineries and management practices etc. Standard
Minute Value (SMV) survey intends to scrutinize the efficiency level of the RMG workers and
generate credible information on multiple factors affecting workers’ productivity. The survey
process of SMV is designed based on the observation and evaluation method as well as
preparing short questionnaire. To collect consistent and reliable information for SMV
calculation, the efficiency related data of the workers is collected in three (3) consecutive days.
At first, two different lines are selected from the factory based on the identical style and buyer.
Then the process name, worker ID, worker grade, machine name and brand name are recorded
on the SMV sheet. After that, the surveyors collect seven (7) production cycles of the workers
based on the time scale and evaluate the overall performance of the workers. At the same time
workers basic and daily information are collected successively through a tab-based survey
questionnaire. At the last stage workers’ height, weight, height of knee and chair height were
measured and recorded. Workers height, weight and measurement related information are
collected only on the first day and during 2nd and 3rd days, workers SMV, daily and basic
information are collected.
3.5 Estimation Methods
3.5.1 Upgradation Index: The estimation of upgradation of manufacturing enterprises is a unique
approach. While there is conceptual clarity with regard to economic, social and gender-embedded
upgrading of enterprises in the value chain, there is no such comprehensive initiative to estimate
individual enterprise-level upgradation of apparels enterprises. This study has taken an attempt to
measure upgradation of individual sample enterprises and thereby to appreciate their level of progress.
For the purpose of estimating the indices, a methodology was developed following relevant literature
(Standing, 2003). Upgrading levels of factories have been divided into three parts: economic upgrading,
social upgrading and gender embedded upgrading. Economic upgrading shows the advancement levels
of firms in terms of productivity and technology; social upgrading shows development of rights and
entitlements of workers, while gender embedded upgrading shows how much of the upgrading has
been gender neutral.
Based on Standing (2003), present study measure firm’s social benchmark level through a composite
index of three key sub-index.
Firms’ Social Benchmark Level Index = Employment sub-index (ESI) + Standard sub-index (SSI) +
Rights sub-index (RSI) + Non-Discrimination Index (NDI)
Where the Employment sub-index (ESI) is defined as ESI = Human Resource Development Enterprise
Index (HRDEI)2 + Work Security Index (WSI)3 + Employment Security Index (ESI)4
2 Human Resource Development Enterprise Index (HRDEI) = (TR + TRF) + (RETR + RETRF) + (UPTR + UPTRF) +
TR.INST where TR = 1 if training was usually provided to newly recruited workers, 0 otherwise; RF = 1 if TR was apprenticeship or off-the-job training in classroom or institute, 0 otherwise; RETR = 1 if there was training provided for established workers to improve job performance or transfer between jobs of similar skill, 0 otherwise; RETRF = 1 if that retraining was formal, in class or institute, 0 otherwise; UPTR = 1 if training was provided to upgrade
13
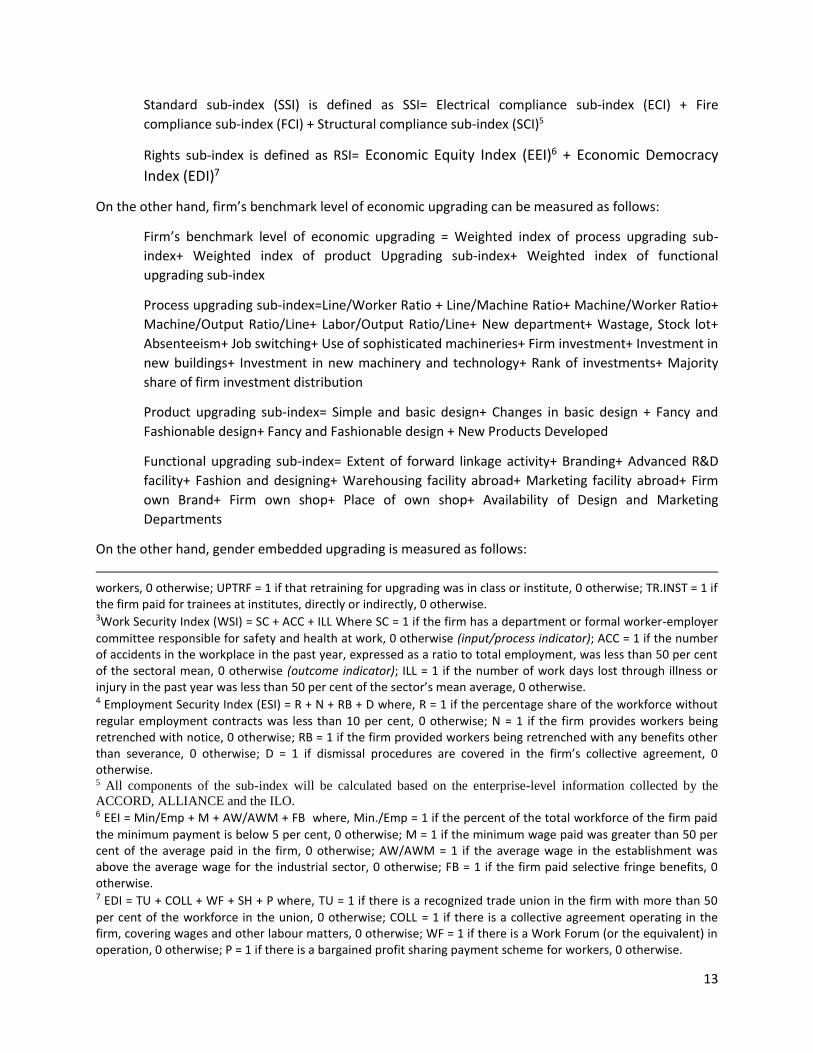
Standard sub-index (SSI) is defined as SSI= Electrical compliance sub-index (ECI) + Fire
compliance sub-index (FCI) + Structural compliance sub-index (SCI)5
Rights sub-index is defined as RSI= Economic Equity Index (EEI)6 + Economic Democracy
Index (EDI)7
On the other hand, firm’s benchmark level of economic upgrading can be measured as follows:
Firm’s benchmark level of economic upgrading = Weighted index of process upgrading sub-
index+ Weighted index of product Upgrading sub-index+ Weighted index of functional
upgrading sub-index
Process upgrading sub-index=Line/Worker Ratio + Line/Machine Ratio+ Machine/Worker Ratio+
Machine/Output Ratio/Line+ Labor/Output Ratio/Line+ New department+ Wastage, Stock lot+
Absenteeism+ Job switching+ Use of sophisticated machineries+ Firm investment+ Investment in
new buildings+ Investment in new machinery and technology+ Rank of investments+ Majority
share of firm investment distribution
Product upgrading sub-index= Simple and basic design+ Changes in basic design + Fancy and
Fashionable design+ Fancy and Fashionable design + New Products Developed
Functional upgrading sub-index= Extent of forward linkage activity+ Branding+ Advanced R&D
facility+ Fashion and designing+ Warehousing facility abroad+ Marketing facility abroad+ Firm
own Brand+ Firm own shop+ Place of own shop+ Availability of Design and Marketing
Departments
On the other hand, gender embedded upgrading is measured as follows:
workers, 0 otherwise; UPTRF = 1 if that retraining for upgrading was in class or institute, 0 otherwise; TR.INST = 1 if the firm paid for trainees at institutes, directly or indirectly, 0 otherwise. 3Work Security Index (WSI) = SC + ACC + ILL Where SC = 1 if the firm has a department or formal worker-employer
committee responsible for safety and health at work, 0 otherwise (input/process indicator); ACC = 1 if the number of accidents in the workplace in the past year, expressed as a ratio to total employment, was less than 50 per cent of the sectoral mean, 0 otherwise (outcome indicator); ILL = 1 if the number of work days lost through illness or injury in the past year was less than 50 per cent of the sector’s mean average, 0 otherwise. 4 Employment Security Index (ESI) = R + N + RB + D where, R = 1 if the percentage share of the workforce without
regular employment contracts was less than 10 per cent, 0 otherwise; N = 1 if the firm provides workers being retrenched with notice, 0 otherwise; RB = 1 if the firm provided workers being retrenched with any benefits other than severance, 0 otherwise; D = 1 if dismissal procedures are covered in the firm’s collective agreement, 0 otherwise. 5 All components of the sub-index will be calculated based on the enterprise-level information collected by the
ACCORD, ALLIANCE and the ILO. 6 EEI = Min/Emp + M + AW/AWM + FB where, Min./Emp = 1 if the percent of the total workforce of the firm paid
the minimum payment is below 5 per cent, 0 otherwise; M = 1 if the minimum wage paid was greater than 50 per cent of the average paid in the firm, 0 otherwise; AW/AWM = 1 if the average wage in the establishment was above the average wage for the industrial sector, 0 otherwise; FB = 1 if the firm paid selective fringe benefits, 0 otherwise. 7 EDI = TU + COLL + WF + SH + P where, TU = 1 if there is a recognized trade union in the firm with more than 50
per cent of the workforce in the union, 0 otherwise; COLL = 1 if there is a collective agreement operating in the firm, covering wages and other labour matters, 0 otherwise; WF = 1 if there is a Work Forum (or the equivalent) in operation, 0 otherwise; P = 1 if there is a bargained profit sharing payment scheme for workers, 0 otherwise.
14
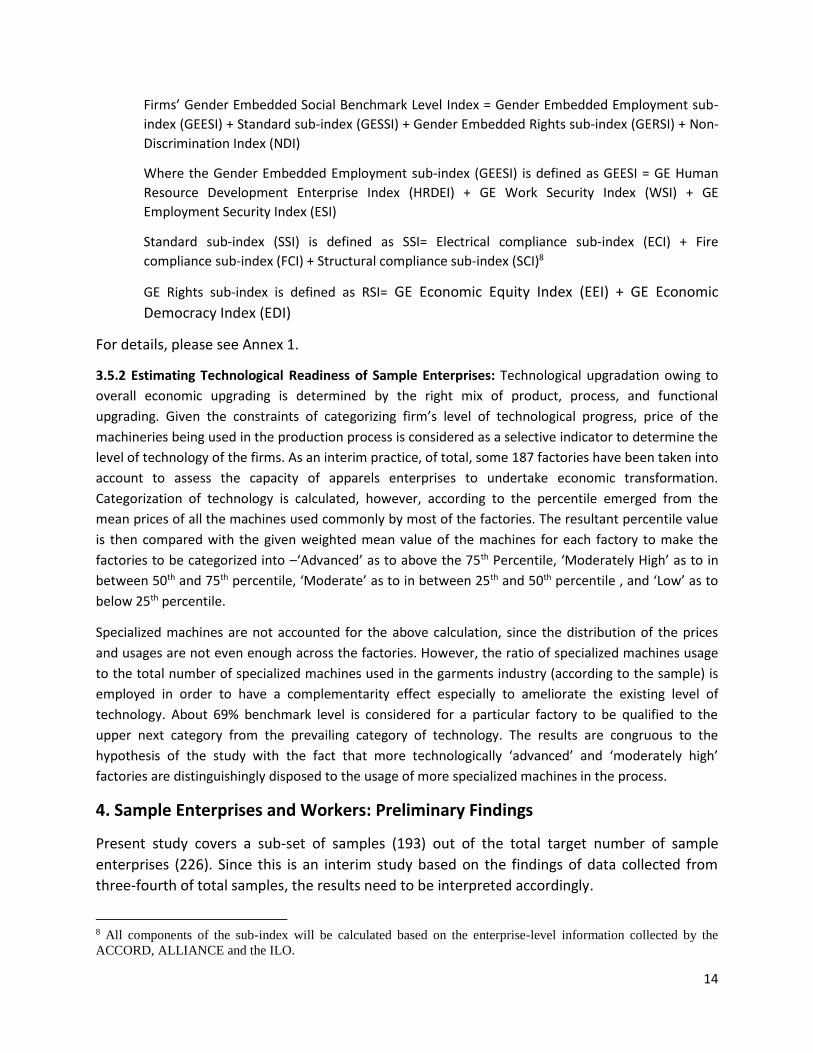
Firms’ Gender Embedded Social Benchmark Level Index = Gender Embedded Employment sub-
index (GEESI) + Standard sub-index (GESSI) + Gender Embedded Rights sub-index (GERSI) + Non-
Discrimination Index (NDI)
Where the Gender Embedded Employment sub-index (GEESI) is defined as GEESI = GE Human
Resource Development Enterprise Index (HRDEI) + GE Work Security Index (WSI) + GE
Employment Security Index (ESI)
Standard sub-index (SSI) is defined as SSI= Electrical compliance sub-index (ECI) + Fire
compliance sub-index (FCI) + Structural compliance sub-index (SCI)8
GE Rights sub-index is defined as RSI= GE Economic Equity Index (EEI) + GE Economic
Democracy Index (EDI)
For details, please see Annex 1.
3.5.2 Estimating Technological Readiness of Sample Enterprises: Technological upgradation owing to
overall economic upgrading is determined by the right mix of product, process, and functional
upgrading. Given the constraints of categorizing firm’s level of technological progress, price of the
machineries being used in the production process is considered as a selective indicator to determine the
level of technology of the firms. As an interim practice, of total, some 187 factories have been taken into
account to assess the capacity of apparels enterprises to undertake economic transformation.
Categorization of technology is calculated, however, according to the percentile emerged from the
mean prices of all the machines used commonly by most of the factories. The resultant percentile value
is then compared with the given weighted mean value of the machines for each factory to make the
factories to be categorized into –‘Advanced’ as to above the 75th Percentile, ‘Moderately High’ as to in
between 50th and 75th percentile, ‘Moderate’ as to in between 25th and 50th percentile , and ‘Low’ as to
below 25th percentile.
Specialized machines are not accounted for the above calculation, since the distribution of the prices
and usages are not even enough across the factories. However, the ratio of specialized machines usage
to the total number of specialized machines used in the garments industry (according to the sample) is
employed in order to have a complementarity effect especially to ameliorate the existing level of
technology. About 69% benchmark level is considered for a particular factory to be qualified to the
upper next category from the prevailing category of technology. The results are congruous to the
hypothesis of the study with the fact that more technologically ‘advanced’ and ‘moderately high’
factories are distinguishingly disposed to the usage of more specialized machines in the process.
4. Sample Enterprises and Workers: Preliminary Findings
Present study covers a sub-set of samples (193) out of the total target number of sample
enterprises (226). Since this is an interim study based on the findings of data collected from
three-fourth of total samples, the results need to be interpreted accordingly.
8 All components of the sub-index will be calculated based on the enterprise-level information collected by the
ACCORD, ALLIANCE and the ILO.
15
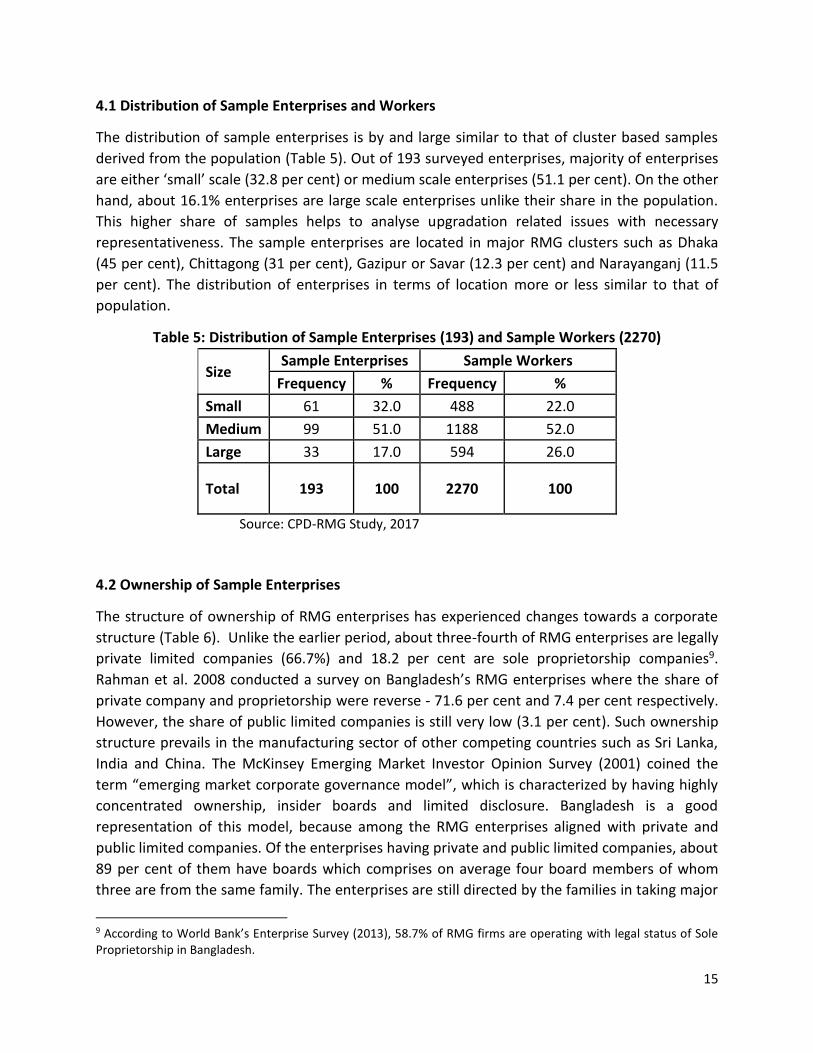
4.1 Distribution of Sample Enterprises and Workers
The distribution of sample enterprises is by and large similar to that of cluster based samples
derived from the population (Table 5). Out of 193 surveyed enterprises, majority of enterprises
are either ‘small’ scale (32.8 per cent) or medium scale enterprises (51.1 per cent). On the other
hand, about 16.1% enterprises are large scale enterprises unlike their share in the population.
This higher share of samples helps to analyse upgradation related issues with necessary
representativeness. The sample enterprises are located in major RMG clusters such as Dhaka
(45 per cent), Chittagong (31 per cent), Gazipur or Savar (12.3 per cent) and Narayanganj (11.5
per cent). The distribution of enterprises in terms of location more or less similar to that of
population.
Table 5: Distribution of Sample Enterprises (193) and Sample Workers (2270)
Size Sample Enterprises Sample Workers
Frequency % Frequency %
Small 61 32.0 488 22.0
Medium 99 51.0 1188 52.0
Large 33 17.0 594 26.0
Total 193 100 2270 100
Source: CPD-RMG Study, 2017
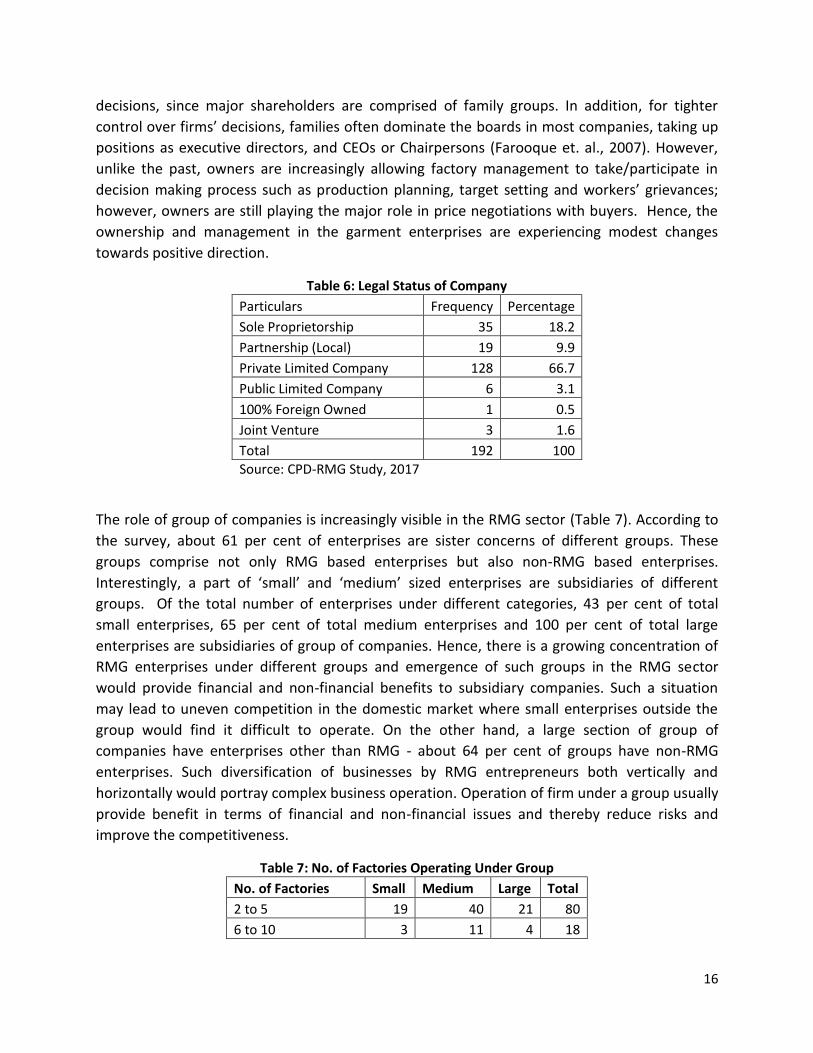
4.2 Ownership of Sample Enterprises
The structure of ownership of RMG enterprises has experienced changes towards a corporate
structure (Table 6). Unlike the earlier period, about three-fourth of RMG enterprises are legally
private limited companies (66.7%) and 18.2 per cent are sole proprietorship companies9.
Rahman et al. 2008 conducted a survey on Bangladesh’s RMG enterprises where the share of
private company and proprietorship were reverse - 71.6 per cent and 7.4 per cent respectively.
However, the share of public limited companies is still very low (3.1 per cent). Such ownership
structure prevails in the manufacturing sector of other competing countries such as Sri Lanka,
India and China. The McKinsey Emerging Market Investor Opinion Survey (2001) coined the
term “emerging market corporate governance model”, which is characterized by having highly
concentrated ownership, insider boards and limited disclosure. Bangladesh is a good
representation of this model, because among the RMG enterprises aligned with private and
public limited companies. Of the enterprises having private and public limited companies, about
89 per cent of them have boards which comprises on average four board members of whom
three are from the same family. The enterprises are still directed by the families in taking major
9 According to World Bank’s Enterprise Survey (2013), 58.7% of RMG firms are operating with legal status of Sole Proprietorship in Bangladesh.
16
decisions, since major shareholders are comprised of family groups. In addition, for tighter
control over firms’ decisions, families often dominate the boards in most companies, taking up
positions as executive directors, and CEOs or Chairpersons (Farooque et. al., 2007). However,
unlike the past, owners are increasingly allowing factory management to take/participate in
decision making process such as production planning, target setting and workers’ grievances;
however, owners are still playing the major role in price negotiations with buyers. Hence, the
ownership and management in the garment enterprises are experiencing modest changes
towards positive direction.
Table 6: Legal Status of Company
Particulars Frequency Percentage
Sole Proprietorship 35 18.2
Partnership (Local) 19 9.9
Private Limited Company 128 66.7
Public Limited Company 6 3.1
100% Foreign Owned 1 0.5
Joint Venture 3 1.6
Total 192 100
Source: CPD-RMG Study, 2017
The role of group of companies is increasingly visible in the RMG sector (Table 7). According to
the survey, about 61 per cent of enterprises are sister concerns of different groups. These
groups comprise not only RMG based enterprises but also non-RMG based enterprises.
Interestingly, a part of ‘small’ and ‘medium’ sized enterprises are subsidiaries of different
groups. Of the total number of enterprises under different categories, 43 per cent of total
small enterprises, 65 per cent of total medium enterprises and 100 per cent of total large
enterprises are subsidiaries of group of companies. Hence, there is a growing concentration of
RMG enterprises under different groups and emergence of such groups in the RMG sector
would provide financial and non-financial benefits to subsidiary companies. Such a situation
may lead to uneven competition in the domestic market where small enterprises outside the
group would find it difficult to operate. On the other hand, a large section of group of
companies have enterprises other than RMG - about 64 per cent of groups have non-RMG
enterprises. Such diversification of businesses by RMG entrepreneurs both vertically and
horizontally would portray complex business operation. Operation of firm under a group usually
provide benefit in terms of financial and non-financial issues and thereby reduce risks and
improve the competitiveness.
Table 7: No. of Factories Operating Under Group
No. of Factories Small Medium Large Total
2 to 5 19 40 21 80
6 to 10 3 11 4 18
17
>10 4 11 5 20
Total 26 62 30 118
Source: CPD-RMG Study, 2017
It is said that owners’ visit to the factories with having intensive use of labour is very important.
According to the survey, owners of about 43 per cent enterprises visited their factories on a
daily basis while owners of another 17 per cent enterprises visit more than once a week (Table
8). In contrast, owners of 40 per cent enterprises are not so regular in visiting their factories
and owners even 15 per cent cases visit their factories once a month or above. Such a pattern
of sporadic nature of visit by the entrepreneurs need alternate network channel with the
management of the factories.
Table 8: Frequency of Factory Visit by Owner
Time Period Frequency Percentage
Everyday 82 43
More Than Once a Week 32 17
Once a Week 24 13
More Than Once a Month 25 13
Once a Month 7 4
Less Than Once a Month 22 11
Total 192 100
Source: CPD-RMG Study, 2017
4.3 Establishment and Operation of Sample Enterprises
According to the survey, the highest number of sample RMG enterprises (about 41 per cent)
were established during 2005-2012 - after the end of multi-fibre arrangement (MFA) (Table 9).
Interestingly, a large share of RMG enterprises were established during 2013-2016 i.e. after the
collapse of the Rana Plaza. This indicates that entrepreneurs have kept their confidence on
investing in the sector despite having adverse situation owing to poor reputation after the
collapse of the Rana Plaza. On the other hand, such investment for setting up new factories
create employment opportunities at the time when a good number of enterprises were closed
down because of problems of non-compliance with regard to work place safety and security.
Table 9: Year of Establishment of Sample RMG Enterprises
Year No. %
Up to 1985 16 8.3
1986-1995 20 10.4
1996-2004 43 22.4
2005-2012 78 40.6
2013-2016 35 18.2
18
Total 192 100.0
Source: CPD-RMG Study, 2017
A considerable share of entrepreneurs operate their enterprises in rented spaces which is as
high as 41 per cent of total sample enterprises. About 34 per cent of the factories operate in
shared buildings where about 63 per cent are RMG related establishments and the rest 37 per
cent are non-RMG related establishments. About 37.5 per cent of RMG enterprises operate in
shared buildings where establishments of the same owners as well as other owners are found.
This is particularly found to be difficult if the establishments are owned by other persons; the
share of such percentage of enterprises is as high as 25 per cent (Table 10). Thus ensuring
safety in a section of RMG enterprises operate from shared building remain in vulnerable state.
Since factories in shared buildings with having non-RMG establishments are usually considered
riskier from the safety point of view, those RMG enterprises may need to relocate in safer
buildings. About 16 per cent of sample entrepreneurs have mentioned that they will either
relocate or close the factory which would happen within 1 to 5 years.
Table 10: Other Businesses in the Same Building
Particulars Frequency (Yes) Percentage
RMG Enterprises Owned by Same Group/Owner 29 40.3
RMG Enterprises Owned by Another Group or Owner 17 23.6
Non-RMG Enterprises 8 11.1
Non-RMG Enterprises Owned by Another Group/Owner 18 25.0
Total 72 100
Source: CPD-RMG Study, 2017
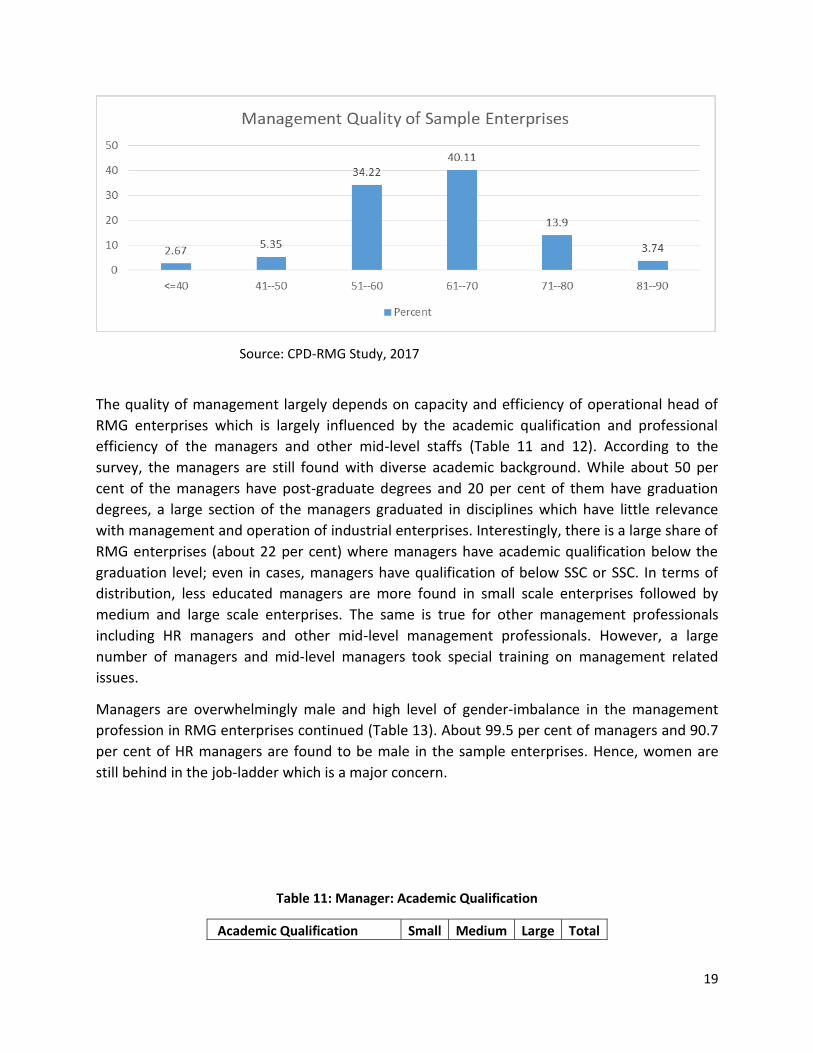
4.4 Management of Sample Enterprises
The weak management is always mentioned as a major stumbling block for improving
competitiveness of RMG enterprises. According to the survey, the quality of management is
found to be mixed. Following the Global Management Survey index, the average score of
management quality of sample enterprises is 69.8 (Figure 2). The highest share of enterprises
are within the score of ’61-70’ (40 per cent) followed by the category ‘51-60’ (34 per cent).
There is a very small share of enterprises in two extreme - either in lower category (2.7 per
cent) or in upper category (3.7 per cent).
Figure 2: Management Score Index of Sample Enterprises
19
Source: CPD-RMG Study, 2017
The quality of management largely depends on capacity and efficiency of operational head of
RMG enterprises which is largely influenced by the academic qualification and professional
efficiency of the managers and other mid-level staffs (Table 11 and 12). According to the
survey, the managers are still found with diverse academic background. While about 50 per
cent of the managers have post-graduate degrees and 20 per cent of them have graduation
degrees, a large section of the managers graduated in disciplines which have little relevance
with management and operation of industrial enterprises. Interestingly, there is a large share of
RMG enterprises (about 22 per cent) where managers have academic qualification below the
graduation level; even in cases, managers have qualification of below SSC or SSC. In terms of
distribution, less educated managers are more found in small scale enterprises followed by
medium and large scale enterprises. The same is true for other management professionals
including HR managers and other mid-level management professionals. However, a large
number of managers and mid-level managers took special training on management related
issues.
Managers are overwhelmingly male and high level of gender-imbalance in the management
profession in RMG enterprises continued (Table 13). About 99.5 per cent of managers and 90.7
per cent of HR managers are found to be male in the sample enterprises. Hence, women are
still behind in the job-ladder which is a major concern.
Table 11: Manager: Academic Qualification
Academic Qualification Small Medium Large Total
20
Below SSC 1 1
SSC 3 5 1 9
H.S.C 10 12 2 24
Diploma 4 1 5
Post-Graduate Diploma 1 2 2 5
Graduate 15 18 6 39
Post Graduate 26 49 20 95
Others 3 9 1 13
Total 62 97 32 191
Source: CPD-RMG Study, 2017
Table 12: Human Resource Manager: Academic Qualification
Education Frequency Percentage
HSC 4 2.1
Graduate 35 18.0
Diploma 134 69.1
Post-Graduate 4 2.1
Other 16 8.8
Total 193 100
Source: CPD-RMG Study, 2017
Table 13: Managerial Position: Sex Distribution
Sex
Managers HR Managers
Frequency Percentage Frequency Percentage
Male 190 99.5 176 90.7
Female 1 0.5 17 9.3
Total 191 193 100
Source: CPD-RMG Study, 2017
4.5 Workers in Sample RMG Enterprises
The employment growth in RMG enterprises has somewhat decelerated in recent years.
According to the CPD-RMG survey, average yearly growth was only 3.02 per cent. Such growth
was lower than the average yearly growth during 2005-2012 as reported in the Survey of
Manufacturing Industries (4.01 per cent per year).
The size of RMG enterprises, in terms of number of workers, has getting marginally bigger -
average number of production workers in sample enterprises has increased by 2.5 per cent
between 2012 and 2016. In terms of distribution of workers in different sections, the sewing
section continues to have the highest concentration in terms of employment (53.5 per cent)
21
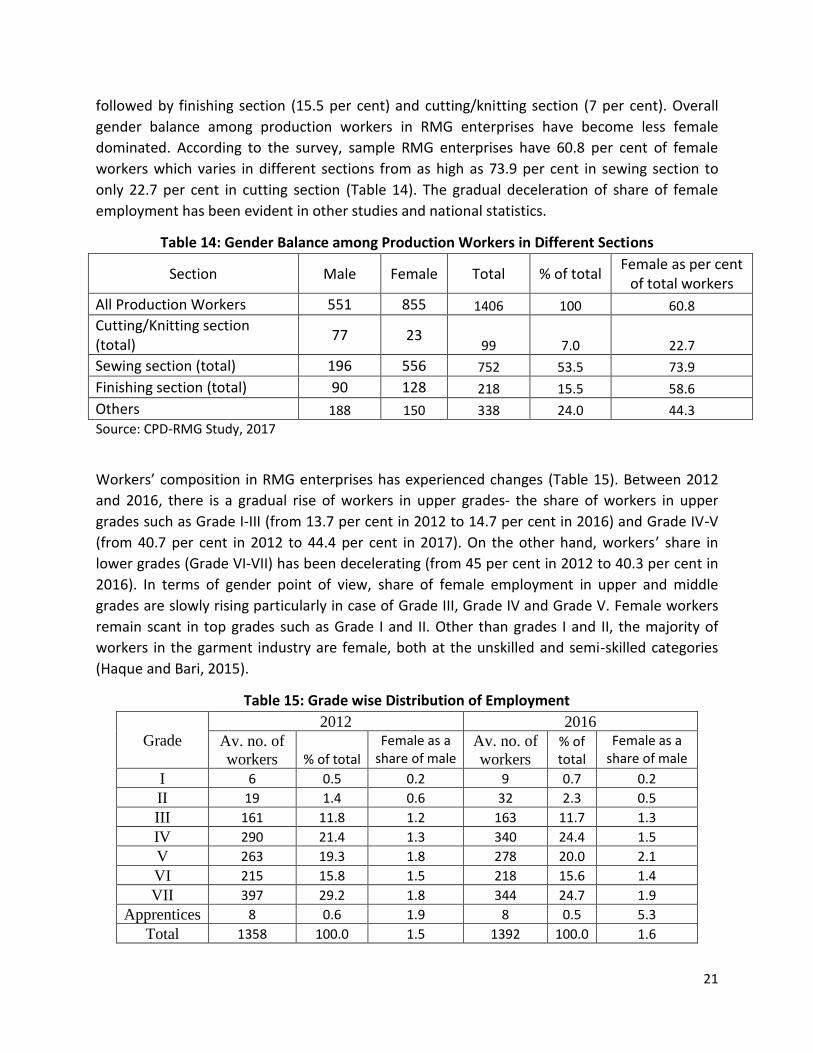
followed by finishing section (15.5 per cent) and cutting/knitting section (7 per cent). Overall
gender balance among production workers in RMG enterprises have become less female
dominated. According to the survey, sample RMG enterprises have 60.8 per cent of female
workers which varies in different sections from as high as 73.9 per cent in sewing section to
only 22.7 per cent in cutting section (Table 14). The gradual deceleration of share of female
employment has been evident in other studies and national statistics.
Table 14: Gender Balance among Production Workers in Different Sections
Section Male Female Total % of total Female as per cent
of total workers
All Production Workers 551 855 1406 100 60.8
Cutting/Knitting section (total)
77 23 99 7.0 22.7
Sewing section (total) 196 556 752 53.5 73.9
Finishing section (total) 90 128 218 15.5 58.6
Others 188 150 338 24.0 44.3
Source: CPD-RMG Study, 2017
Workers’ composition in RMG enterprises has experienced changes (Table 15). Between 2012
and 2016, there is a gradual rise of workers in upper grades- the share of workers in upper
grades such as Grade I-III (from 13.7 per cent in 2012 to 14.7 per cent in 2016) and Grade IV-V
(from 40.7 per cent in 2012 to 44.4 per cent in 2017). On the other hand, workers’ share in
lower grades (Grade VI-VII) has been decelerating (from 45 per cent in 2012 to 40.3 per cent in
2016). In terms of gender point of view, share of female employment in upper and middle
grades are slowly rising particularly in case of Grade III, Grade IV and Grade V. Female workers
remain scant in top grades such as Grade I and II. Other than grades I and II, the majority of
workers in the garment industry are female, both at the unskilled and semi-skilled categories
(Haque and Bari, 2015).
Table 15: Grade wise Distribution of Employment
Grade
2012 2016
Av. no. of
workers % of total
Female as a share of male
Av. no. of
workers
% of total
Female as a share of male
I 6 0.5 0.2 9 0.7 0.2
II 19 1.4 0.6 32 2.3 0.5
III 161 11.8 1.2 163 11.7 1.3
IV 290 21.4 1.3 340 24.4 1.5
V 263 19.3 1.8 278 20.0 2.1
VI 215 15.8 1.5 218 15.6 1.4
VII 397 29.2 1.8 344 24.7 1.9
Apprentices 8 0.6 1.9 8 0.5 5.3
Total 1358 100.0 1.5 1392 100.0 1.6
22
Source: CPD-RMG Study, 2017
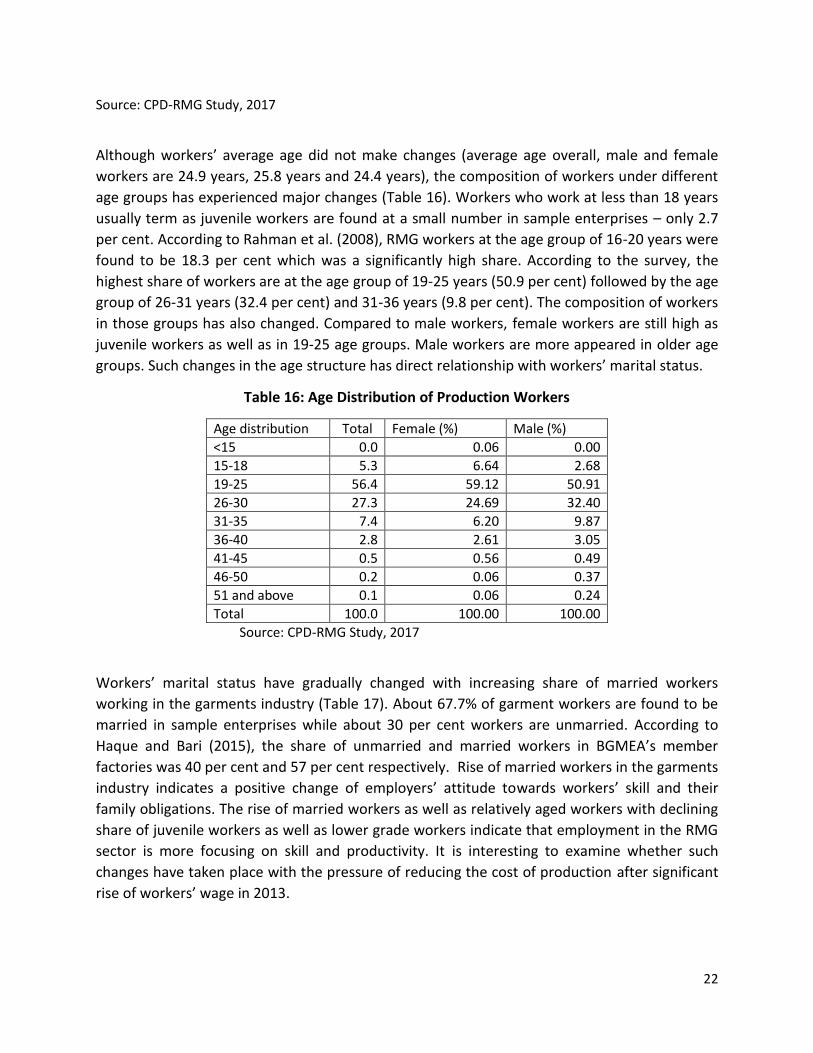
Although workers’ average age did not make changes (average age overall, male and female
workers are 24.9 years, 25.8 years and 24.4 years), the composition of workers under different
age groups has experienced major changes (Table 16). Workers who work at less than 18 years
usually term as juvenile workers are found at a small number in sample enterprises – only 2.7
per cent. According to Rahman et al. (2008), RMG workers at the age group of 16-20 years were
found to be 18.3 per cent which was a significantly high share. According to the survey, the
highest share of workers are at the age group of 19-25 years (50.9 per cent) followed by the age
group of 26-31 years (32.4 per cent) and 31-36 years (9.8 per cent). The composition of workers
in those groups has also changed. Compared to male workers, female workers are still high as
juvenile workers as well as in 19-25 age groups. Male workers are more appeared in older age
groups. Such changes in the age structure has direct relationship with workers’ marital status.
Table 16: Age Distribution of Production Workers
Age distribution Total Female (%) Male (%)
<15 0.0 0.06 0.00
15-18 5.3 6.64 2.68
19-25 56.4 59.12 50.91
26-30 27.3 24.69 32.40
31-35 7.4 6.20 9.87
36-40 2.8 2.61 3.05
41-45 0.5 0.56 0.49
46-50 0.2 0.06 0.37
51 and above 0.1 0.06 0.24
Total 100.0 100.00 100.00
Source: CPD-RMG Study, 2017
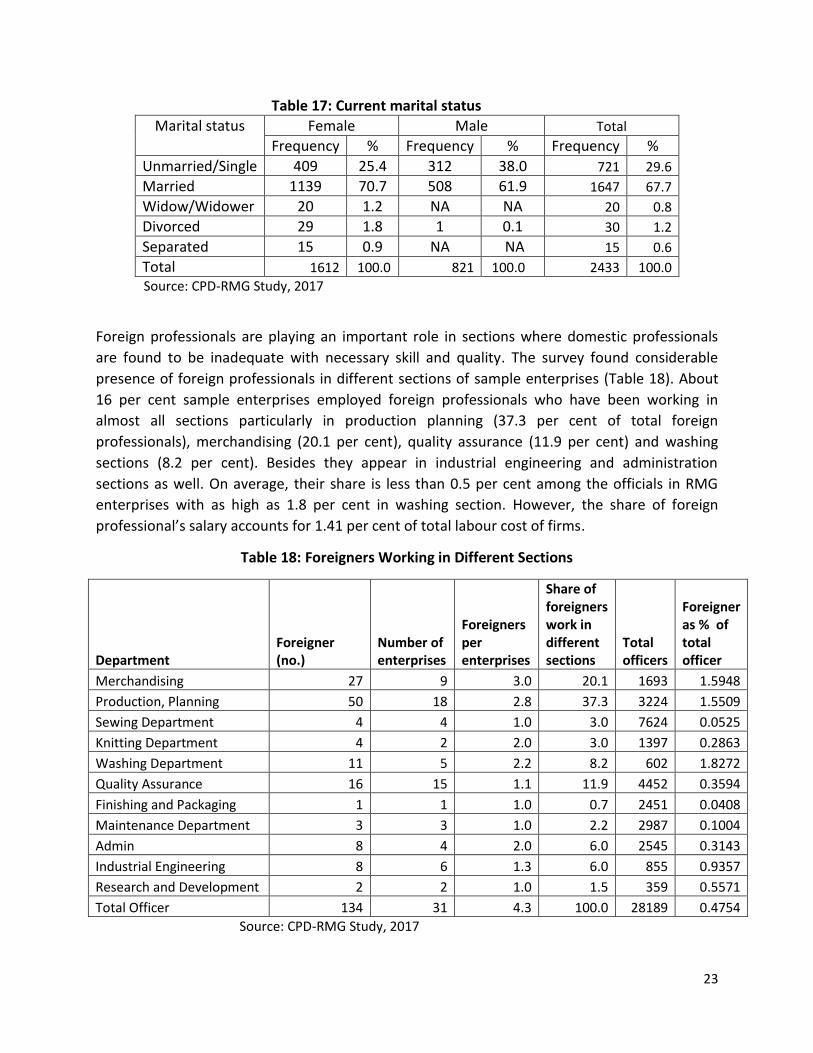
Workers’ marital status have gradually changed with increasing share of married workers
working in the garments industry (Table 17). About 67.7% of garment workers are found to be
married in sample enterprises while about 30 per cent workers are unmarried. According to
Haque and Bari (2015), the share of unmarried and married workers in BGMEA’s member
factories was 40 per cent and 57 per cent respectively. Rise of married workers in the garments
industry indicates a positive change of employers’ attitude towards workers’ skill and their
family obligations. The rise of married workers as well as relatively aged workers with declining
share of juvenile workers as well as lower grade workers indicate that employment in the RMG
sector is more focusing on skill and productivity. It is interesting to examine whether such
changes have taken place with the pressure of reducing the cost of production after significant
rise of workers’ wage in 2013.
23
Table 17: Current marital status
Marital status Female Male Total
Frequency % Frequency % Frequency %
Unmarried/Single 409 25.4 312 38.0 721 29.6
Married 1139 70.7 508 61.9 1647 67.7
Widow/Widower 20 1.2 NA NA 20 0.8
Divorced 29 1.8 1 0.1 30 1.2
Separated 15 0.9 NA NA 15 0.6
Total 1612 100.0 821 100.0 2433 100.0
Source: CPD-RMG Study, 2017
Foreign professionals are playing an important role in sections where domestic professionals
are found to be inadequate with necessary skill and quality. The survey found considerable
presence of foreign professionals in different sections of sample enterprises (Table 18). About
16 per cent sample enterprises employed foreign professionals who have been working in
almost all sections particularly in production planning (37.3 per cent of total foreign
professionals), merchandising (20.1 per cent), quality assurance (11.9 per cent) and washing
sections (8.2 per cent). Besides they appear in industrial engineering and administration
sections as well. On average, their share is less than 0.5 per cent among the officials in RMG
enterprises with as high as 1.8 per cent in washing section. However, the share of foreign
professional’s salary accounts for 1.41 per cent of total labour cost of firms.
Table 18: Foreigners Working in Different Sections
Department Foreigner (no.)
Number of enterprises
Foreigners per enterprises
Share of foreigners work in different sections
Total officers
Foreigner as % of total officer
Merchandising 27 9 3.0 20.1 1693 1.5948
Production, Planning 50 18 2.8 37.3 3224 1.5509
Sewing Department 4 4 1.0 3.0 7624 0.0525
Knitting Department 4 2 2.0 3.0 1397 0.2863
Washing Department 11 5 2.2 8.2 602 1.8272
Quality Assurance 16 15 1.1 11.9 4452 0.3594
Finishing and Packaging 1 1 1.0 0.7 2451 0.0408
Maintenance Department 3 3 1.0 2.2 2987 0.1004
Admin 8 4 2.0 6.0 2545 0.3143
Industrial Engineering 8 6 1.3 6.0 855 0.9357
Research and Development 2 2 1.0 1.5 359 0.5571
Total Officer 134 31 4.3 100.0 28189 0.4754
Source: CPD-RMG Study, 2017
24
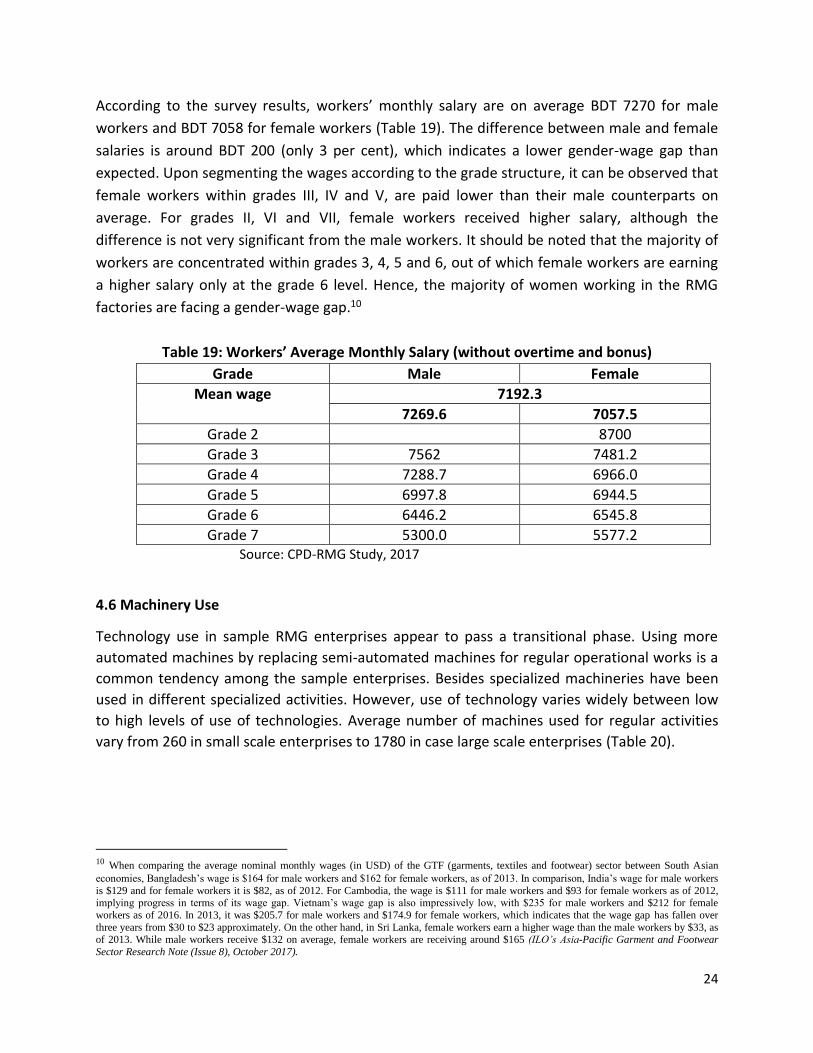
According to the survey results, workers’ monthly salary are on average BDT 7270 for male
workers and BDT 7058 for female workers (Table 19). The difference between male and female
salaries is around BDT 200 (only 3 per cent), which indicates a lower gender-wage gap than
expected. Upon segmenting the wages according to the grade structure, it can be observed that
female workers within grades III, IV and V, are paid lower than their male counterparts on
average. For grades II, VI and VII, female workers received higher salary, although the
difference is not very significant from the male workers. It should be noted that the majority of
workers are concentrated within grades 3, 4, 5 and 6, out of which female workers are earning
a higher salary only at the grade 6 level. Hence, the majority of women working in the RMG
factories are facing a gender-wage gap.10
Table 19: Workers’ Average Monthly Salary (without overtime and bonus)
Grade Male Female
Mean wage 7192.3
7269.6 7057.5
Grade 2 8700
Grade 3 7562 7481.2
Grade 4 7288.7 6966.0
Grade 5 6997.8 6944.5
Grade 6 6446.2 6545.8
Grade 7 5300.0 5577.2 Source: CPD-RMG Study, 2017
4.6 Machinery Use
Technology use in sample RMG enterprises appear to pass a transitional phase. Using more
automated machines by replacing semi-automated machines for regular operational works is a
common tendency among the sample enterprises. Besides specialized machineries have been
used in different specialized activities. However, use of technology varies widely between low
to high levels of use of technologies. Average number of machines used for regular activities
vary from 260 in small scale enterprises to 1780 in case large scale enterprises (Table 20).
10 When comparing the average nominal monthly wages (in USD) of the GTF (garments, textiles and footwear) sector between South Asian
economies, Bangladesh’s wage is $164 for male workers and $162 for female workers, as of 2013. In comparison, India’s wage for male workers
is $129 and for female workers it is $82, as of 2012. For Cambodia, the wage is $111 for male workers and $93 for female workers as of 2012, implying progress in terms of its wage gap. Vietnam’s wage gap is also impressively low, with $235 for male workers and $212 for female
workers as of 2016. In 2013, it was $205.7 for male workers and $174.9 for female workers, which indicates that the wage gap has fallen over
three years from $30 to $23 approximately. On the other hand, in Sri Lanka, female workers earn a higher wage than the male workers by $33, as of 2013. While male workers receive $132 on average, female workers are receiving around $165 (ILO’s Asia-Pacific Garment and Footwear
Sector Research Note (Issue 8), October 2017).
25
Table 20: Use of Machineries by Factories
Factory Size Av. number of machines in different sections Total
Sewing Cutting Finishing Fusing Other
Large 1637 11 25 11 96 1780
Medium 657 6 12 3 15 693
Small 221 6 3 1 29 260
Note: Figures represent average number of machines
Source: CPD-RMG Study, 2017
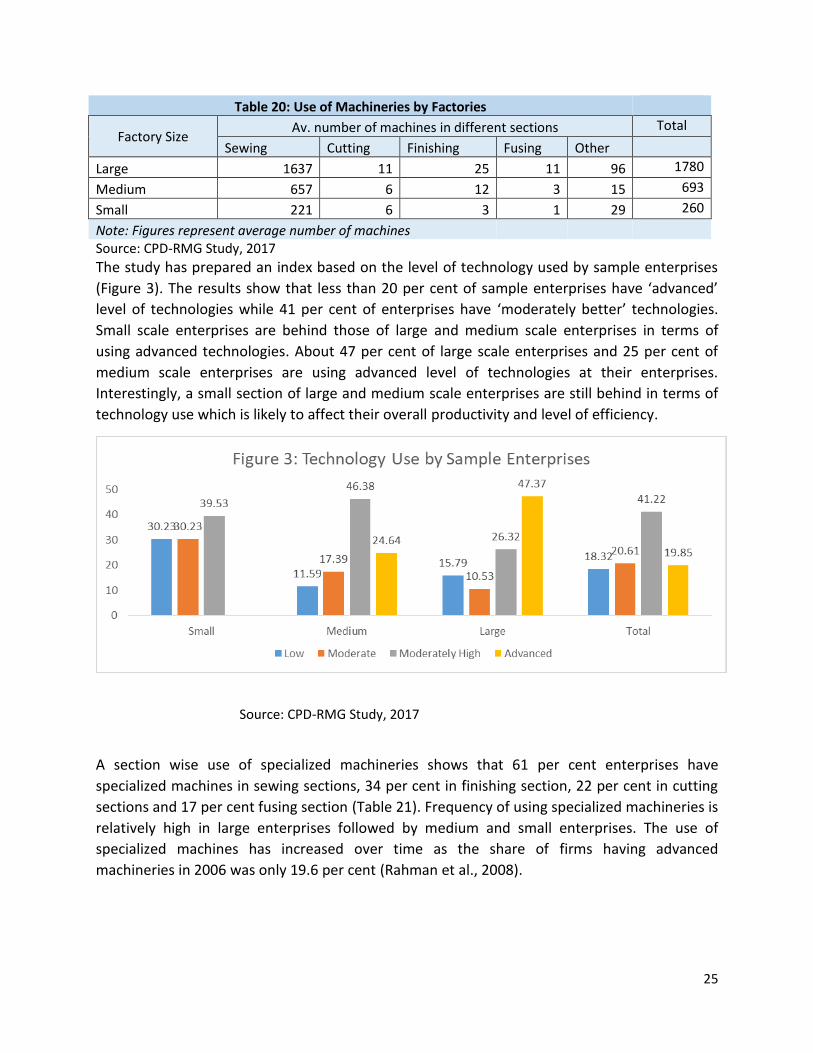
The study has prepared an index based on the level of technology used by sample enterprises
(Figure 3). The results show that less than 20 per cent of sample enterprises have ‘advanced’
level of technologies while 41 per cent of enterprises have ‘moderately better’ technologies.
Small scale enterprises are behind those of large and medium scale enterprises in terms of
using advanced technologies. About 47 per cent of large scale enterprises and 25 per cent of
medium scale enterprises are using advanced level of technologies at their enterprises.
Interestingly, a small section of large and medium scale enterprises are still behind in terms of
technology use which is likely to affect their overall productivity and level of efficiency.
Source: CPD-RMG Study, 2017
A section wise use of specialized machineries shows that 61 per cent enterprises have
specialized machines in sewing sections, 34 per cent in finishing section, 22 per cent in cutting
sections and 17 per cent fusing section (Table 21). Frequency of using specialized machineries is
relatively high in large enterprises followed by medium and small enterprises. The use of
specialized machines has increased over time as the share of firms having advanced
machineries in 2006 was only 19.6 per cent (Rahman et al., 2008).
26
Table 21: Use of Specialized Machines
Sections of S. Machines
Number of Factories having Specialized Machines
Frequency Percentage
Sewing 115 61.50
Cutting 42 22.46
Finishing 65 34.76
Fusing 32 17.11
Other 81 43.32
Source: CPD-RMG Study, 2017
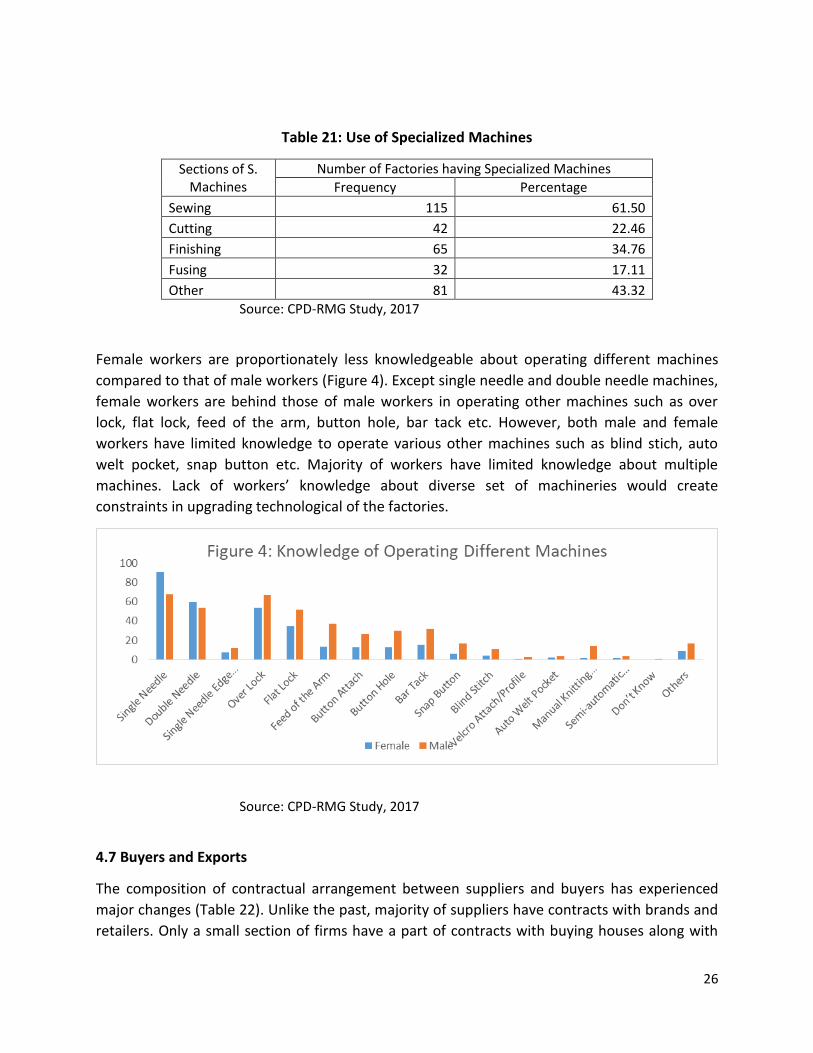
Female workers are proportionately less knowledgeable about operating different machines
compared to that of male workers (Figure 4). Except single needle and double needle machines,
female workers are behind those of male workers in operating other machines such as over
lock, flat lock, feed of the arm, button hole, bar tack etc. However, both male and female
workers have limited knowledge to operate various other machines such as blind stich, auto
welt pocket, snap button etc. Majority of workers have limited knowledge about multiple
machines. Lack of workers’ knowledge about diverse set of machineries would create
constraints in upgrading technological of the factories.
Source: CPD-RMG Study, 2017
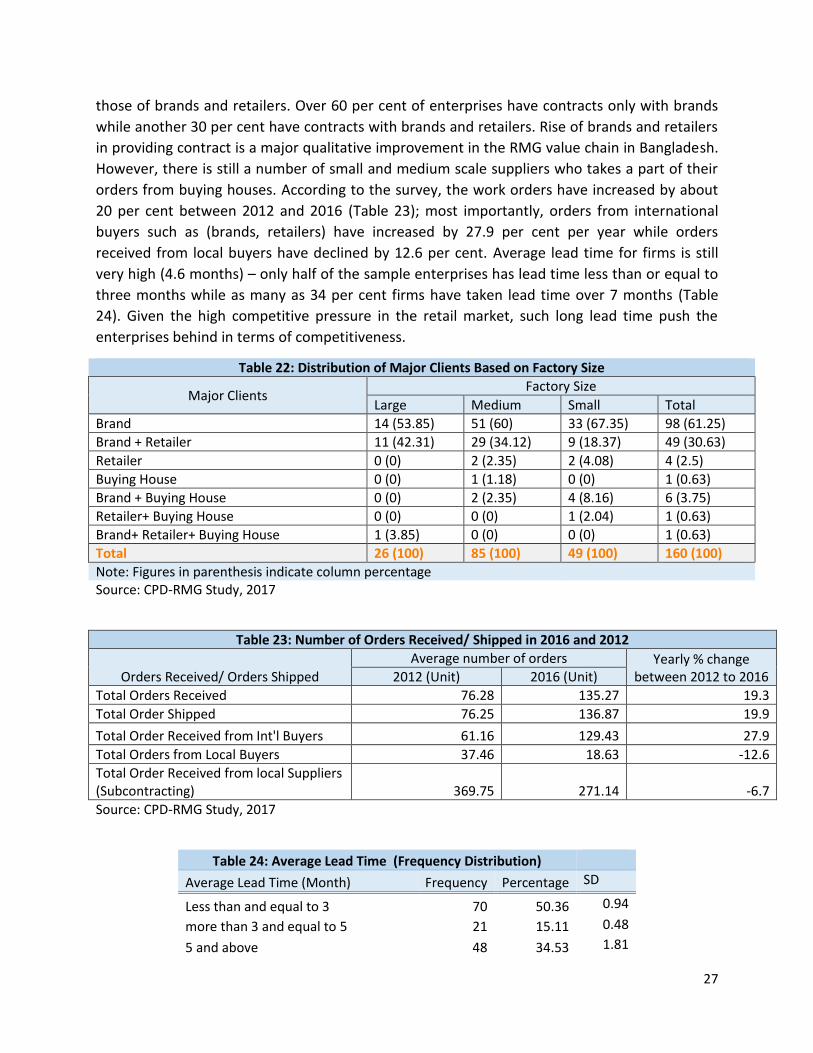
4.7 Buyers and Exports
The composition of contractual arrangement between suppliers and buyers has experienced
major changes (Table 22). Unlike the past, majority of suppliers have contracts with brands and
retailers. Only a small section of firms have a part of contracts with buying houses along with
27
those of brands and retailers. Over 60 per cent of enterprises have contracts only with brands
while another 30 per cent have contracts with brands and retailers. Rise of brands and retailers
in providing contract is a major qualitative improvement in the RMG value chain in Bangladesh.
However, there is still a number of small and medium scale suppliers who takes a part of their
orders from buying houses. According to the survey, the work orders have increased by about
20 per cent between 2012 and 2016 (Table 23); most importantly, orders from international
buyers such as (brands, retailers) have increased by 27.9 per cent per year while orders
received from local buyers have declined by 12.6 per cent. Average lead time for firms is still
very high (4.6 months) – only half of the sample enterprises has lead time less than or equal to
three months while as many as 34 per cent firms have taken lead time over 7 months (Table
24). Given the high competitive pressure in the retail market, such long lead time push the
enterprises behind in terms of competitiveness.
Table 22: Distribution of Major Clients Based on Factory Size
Major Clients Factory Size
Large Medium Small Total
Brand 14 (53.85) 51 (60) 33 (67.35) 98 (61.25)
Brand + Retailer 11 (42.31) 29 (34.12) 9 (18.37) 49 (30.63)
Retailer 0 (0) 2 (2.35) 2 (4.08) 4 (2.5)
Buying House 0 (0) 1 (1.18) 0 (0) 1 (0.63)
Brand + Buying House 0 (0) 2 (2.35) 4 (8.16) 6 (3.75)
Retailer+ Buying House 0 (0) 0 (0) 1 (2.04) 1 (0.63)
Brand+ Retailer+ Buying House 1 (3.85) 0 (0) 0 (0) 1 (0.63)
Total 26 (100) 85 (100) 49 (100) 160 (100)
Note: Figures in parenthesis indicate column percentage Source: CPD-RMG Study, 2017
Table 23: Number of Orders Received/ Shipped in 2016 and 2012
Orders Received/ Orders Shipped
Average number of orders Yearly % change between 2012 to 2016 2012 (Unit) 2016 (Unit)
Total Orders Received 76.28 135.27 19.3
Total Order Shipped 76.25 136.87 19.9
Total Order Received from Int'l Buyers 61.16 129.43 27.9
Total Orders from Local Buyers 37.46 18.63 -12.6
Total Order Received from local Suppliers (Subcontracting) 369.75 271.14 -6.7
Source: CPD-RMG Study, 2017
Table 24: Average Lead Time (Frequency Distribution)
Average Lead Time (Month) Frequency Percentage SD
Less than and equal to 3 70 50.36 0.94
more than 3 and equal to 5 21 15.11 0.48
5 and above 48 34.53 1.81
28
Total 139 100
Source: CPD-RMG Study, 2017
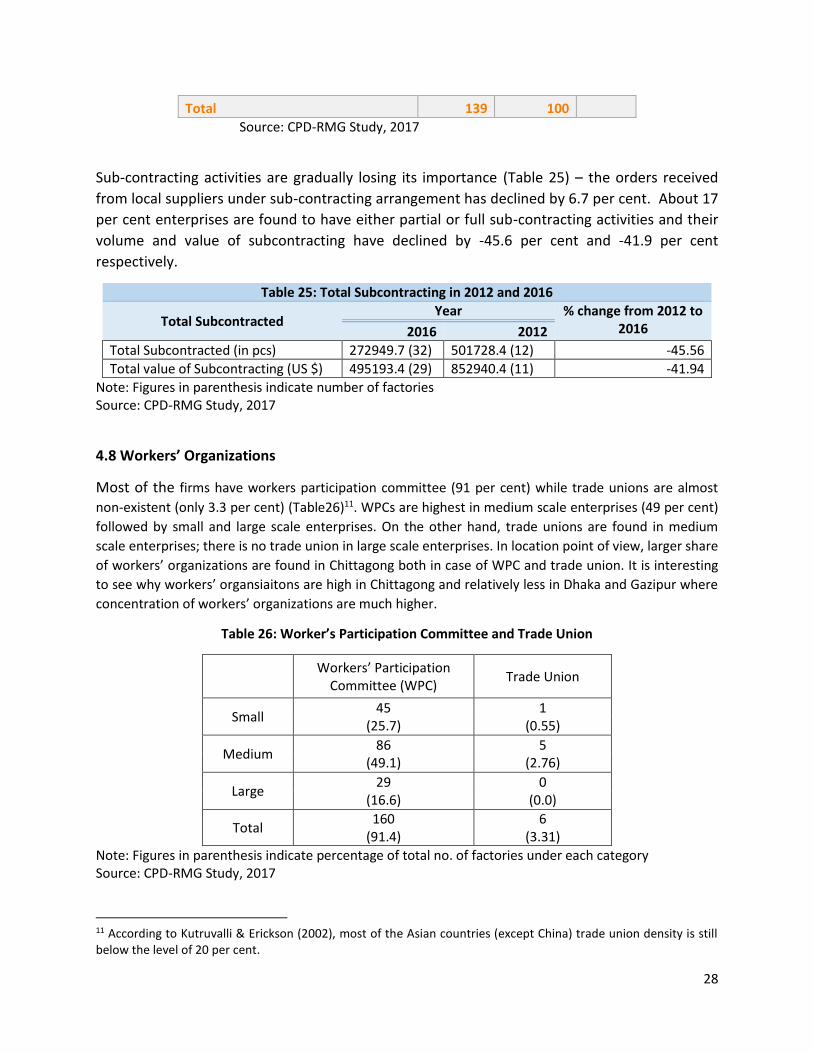
Sub-contracting activities are gradually losing its importance (Table 25) – the orders received
from local suppliers under sub-contracting arrangement has declined by 6.7 per cent. About 17
per cent enterprises are found to have either partial or full sub-contracting activities and their
volume and value of subcontracting have declined by -45.6 per cent and -41.9 per cent
respectively.
Table 25: Total Subcontracting in 2012 and 2016
Total Subcontracted Year % change from 2012 to
2016 2016 2012
Total Subcontracted (in pcs) 272949.7 (32) 501728.4 (12) -45.56
Total value of Subcontracting (US $) 495193.4 (29) 852940.4 (11) -41.94
Note: Figures in parenthesis indicate number of factories Source: CPD-RMG Study, 2017
4.8 Workers’ Organizations
Most of the firms have workers participation committee (91 per cent) while trade unions are almost
non-existent (only 3.3 per cent) (Table26)11. WPCs are highest in medium scale enterprises (49 per cent)
followed by small and large scale enterprises. On the other hand, trade unions are found in medium
scale enterprises; there is no trade union in large scale enterprises. In location point of view, larger share
of workers’ organizations are found in Chittagong both in case of WPC and trade union. It is interesting
to see why workers’ organsiaitons are high in Chittagong and relatively less in Dhaka and Gazipur where
concentration of workers’ organizations are much higher.
Table 26: Worker’s Participation Committee and Trade Union
Workers’ Participation
Committee (WPC) Trade Union
Small 45
(25.7) 1
(0.55)
Medium 86
(49.1) 5
(2.76)
Large 29
(16.6) 0
(0.0)
Total 160
(91.4) 6
(3.31)
Note: Figures in parenthesis indicate percentage of total no. of factories under each category Source: CPD-RMG Study, 2017
11 According to Kutruvalli & Erickson (2002), most of the Asian countries (except China) trade union density is still below the level of 20 per cent.
29
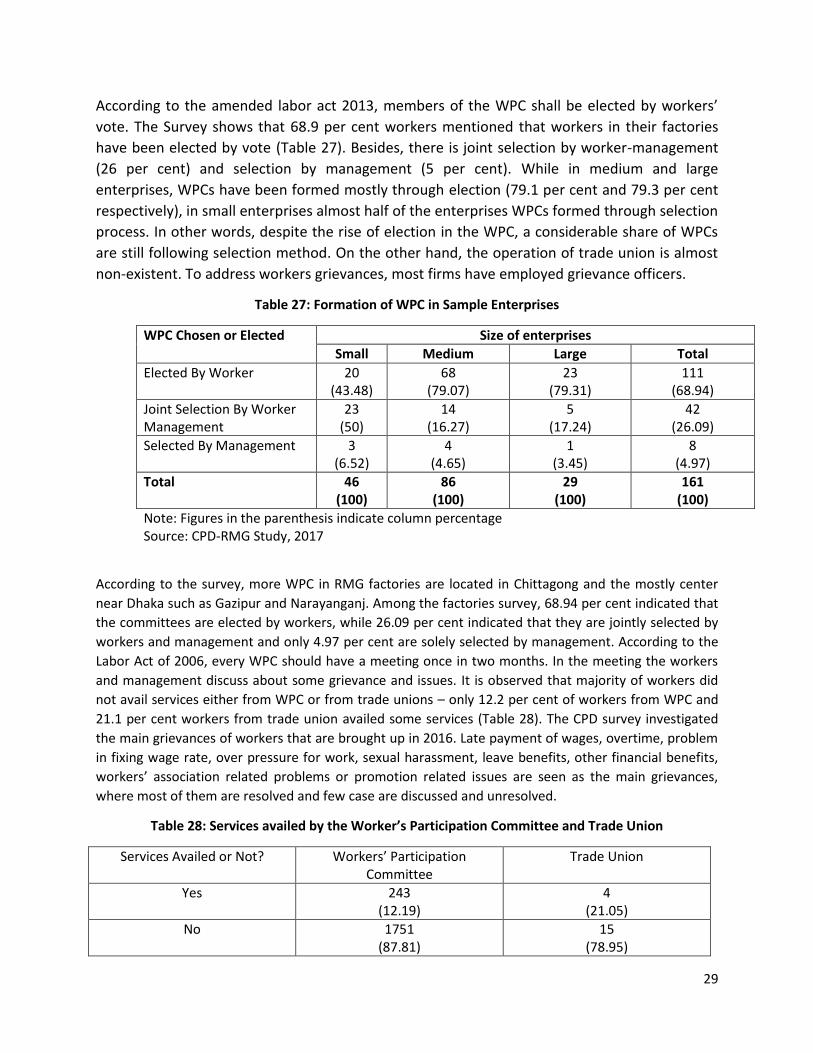
According to the amended labor act 2013, members of the WPC shall be elected by workers’
vote. The Survey shows that 68.9 per cent workers mentioned that workers in their factories
have been elected by vote (Table 27). Besides, there is joint selection by worker-management
(26 per cent) and selection by management (5 per cent). While in medium and large
enterprises, WPCs have been formed mostly through election (79.1 per cent and 79.3 per cent
respectively), in small enterprises almost half of the enterprises WPCs formed through selection
process. In other words, despite the rise of election in the WPC, a considerable share of WPCs
are still following selection method. On the other hand, the operation of trade union is almost
non-existent. To address workers grievances, most firms have employed grievance officers.
Table 27: Formation of WPC in Sample Enterprises
WPC Chosen or Elected Size of enterprises
Small Medium Large Total
Elected By Worker 20 (43.48)
68 (79.07)
23 (79.31)
111 (68.94)
Joint Selection By Worker Management
23 (50)
14 (16.27)
5 (17.24)
42 (26.09)
Selected By Management 3 (6.52)
4 (4.65)
1 (3.45)
8 (4.97)
Total 46 (100)
86 (100)
29 (100)
161 (100)
Note: Figures in the parenthesis indicate column percentage Source: CPD-RMG Study, 2017
According to the survey, more WPC in RMG factories are located in Chittagong and the mostly center
near Dhaka such as Gazipur and Narayanganj. Among the factories survey, 68.94 per cent indicated that
the committees are elected by workers, while 26.09 per cent indicated that they are jointly selected by
workers and management and only 4.97 per cent are solely selected by management. According to the
Labor Act of 2006, every WPC should have a meeting once in two months. In the meeting the workers
and management discuss about some grievance and issues. It is observed that majority of workers did
not avail services either from WPC or from trade unions – only 12.2 per cent of workers from WPC and
21.1 per cent workers from trade union availed some services (Table 28). The CPD survey investigated
the main grievances of workers that are brought up in 2016. Late payment of wages, overtime, problem
in fixing wage rate, over pressure for work, sexual harassment, leave benefits, other financial benefits,
workers’ association related problems or promotion related issues are seen as the main grievances,
where most of them are resolved and few case are discussed and unresolved.
Table 28: Services availed by the Worker’s Participation Committee and Trade Union
Services Availed or Not? Workers’ Participation Committee
Trade Union
Yes 243 (12.19)
4 (21.05)
No 1751 (87.81)
15 (78.95)
30
Total 1994 (100.00)
19 (100.00)
Source: CPD-RMG Study, 2017
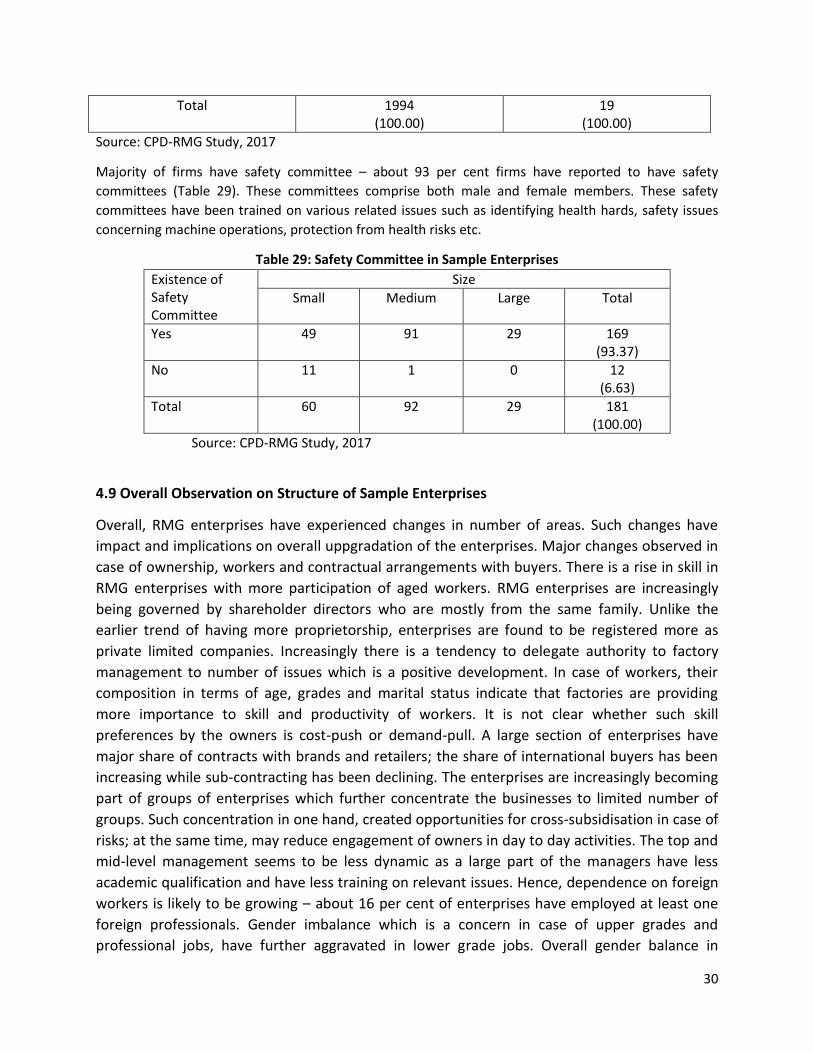
Majority of firms have safety committee – about 93 per cent firms have reported to have safety
committees (Table 29). These committees comprise both male and female members. These safety
committees have been trained on various related issues such as identifying health hards, safety issues
concerning machine operations, protection from health risks etc.
Table 29: Safety Committee in Sample Enterprises
Existence of Safety Committee
Size
Small Medium Large Total
Yes 49 91 29 169 (93.37)
No 11 1 0 12 (6.63)
Total 60 92 29 181 (100.00)
Source: CPD-RMG Study, 2017
4.9 Overall Observation on Structure of Sample Enterprises
Overall, RMG enterprises have experienced changes in number of areas. Such changes have
impact and implications on overall uppgradation of the enterprises. Major changes observed in
case of ownership, workers and contractual arrangements with buyers. There is a rise in skill in
RMG enterprises with more participation of aged workers. RMG enterprises are increasingly
being governed by shareholder directors who are mostly from the same family. Unlike the
earlier trend of having more proprietorship, enterprises are found to be registered more as
private limited companies. Increasingly there is a tendency to delegate authority to factory
management to number of issues which is a positive development. In case of workers, their
composition in terms of age, grades and marital status indicate that factories are providing
more importance to skill and productivity of workers. It is not clear whether such skill
preferences by the owners is cost-push or demand-pull. A large section of enterprises have
major share of contracts with brands and retailers; the share of international buyers has been
increasing while sub-contracting has been declining. The enterprises are increasingly becoming
part of groups of enterprises which further concentrate the businesses to limited number of
groups. Such concentration in one hand, created opportunities for cross-subsidisation in case of
risks; at the same time, may reduce engagement of owners in day to day activities. The top and
mid-level management seems to be less dynamic as a large part of the managers have less
academic qualification and have less training on relevant issues. Hence, dependence on foreign
workers is likely to be growing – about 16 per cent of enterprises have employed at least one
foreign professionals. Gender imbalance which is a concern in case of upper grades and
professional jobs, have further aggravated in lower grade jobs. Overall gender balance in
31
production workers have gradually shifted from female-led operations to male-female balanced
activities in the RMG sector. Despite the rise of machinery use particularly specialised machines
in different sections, a large part of the enterprises could not in the advanced categories in
machinery use. Thus, there is likely to have a gap in technology use between enterprises. In this
backdrop, the upgradation initiatives undertaken by the enterprises after the Rana Plaza
tragedy is likely to have differential impact and implications.
5. Overall Upgrading of Sample Enterprises
The study estimates individual sample enterprises’ level of upgrading in terms of economic,
social and gender point of view. Following the methodologies discussed in section 3, different
types of upgrading have been estimated for individual enterprises. Each of the components of
upgrading has been estimated by index values – the higher the index value the better the
performance of the enterprise.
5.1 Economic Upgrading
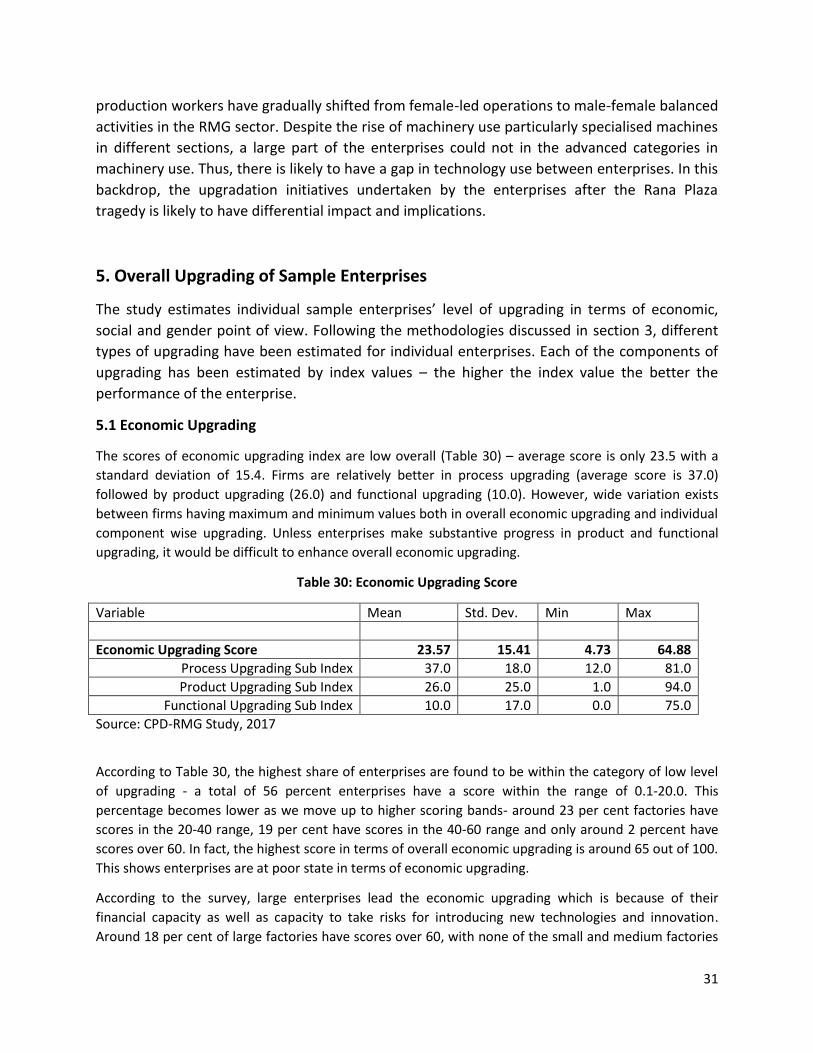
The scores of economic upgrading index are low overall (Table 30) – average score is only 23.5 with a
standard deviation of 15.4. Firms are relatively better in process upgrading (average score is 37.0)
followed by product upgrading (26.0) and functional upgrading (10.0). However, wide variation exists
between firms having maximum and minimum values both in overall economic upgrading and individual
component wise upgrading. Unless enterprises make substantive progress in product and functional
upgrading, it would be difficult to enhance overall economic upgrading.
Table 30: Economic Upgrading Score
Variable Mean Std. Dev. Min Max
Economic Upgrading Score 23.57 15.41 4.73 64.88
Process Upgrading Sub Index 37.0 18.0 12.0 81.0
Product Upgrading Sub Index 26.0 25.0 1.0 94.0
Functional Upgrading Sub Index 10.0 17.0 0.0 75.0
Source: CPD-RMG Study, 2017
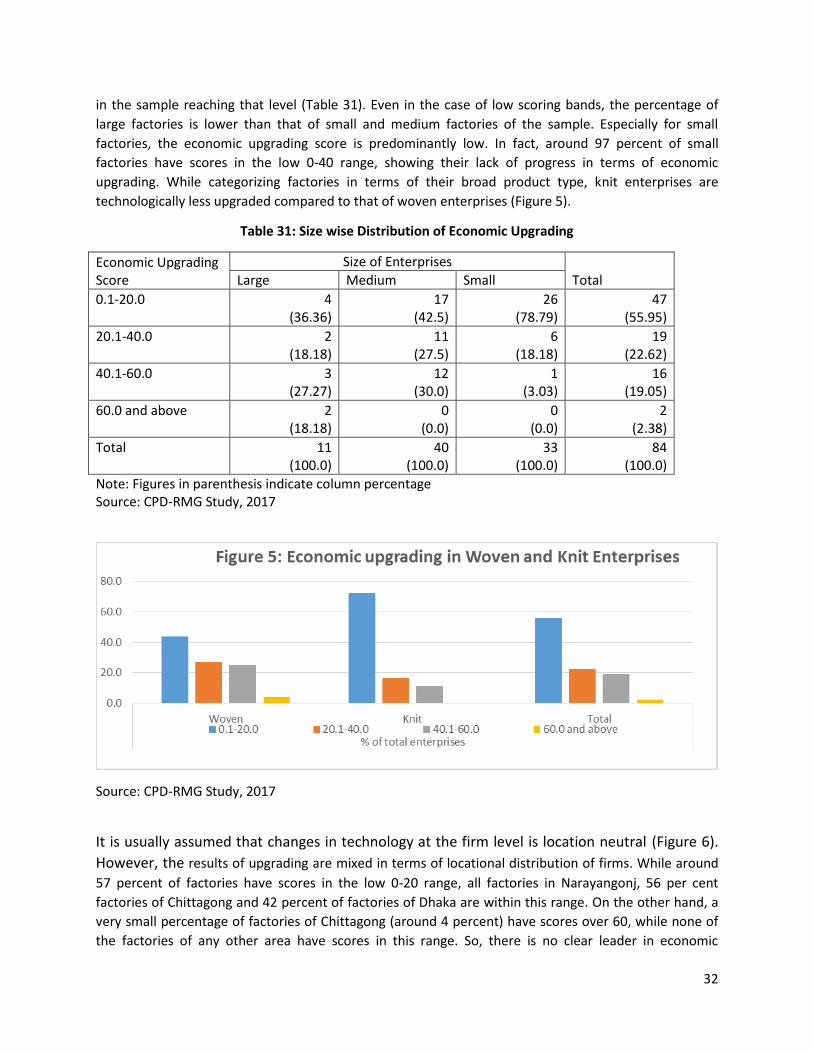
According to Table 30, the highest share of enterprises are found to be within the category of low level
of upgrading - a total of 56 percent enterprises have a score within the range of 0.1-20.0. This
percentage becomes lower as we move up to higher scoring bands- around 23 per cent factories have
scores in the 20-40 range, 19 per cent have scores in the 40-60 range and only around 2 percent have
scores over 60. In fact, the highest score in terms of overall economic upgrading is around 65 out of 100.
This shows enterprises are at poor state in terms of economic upgrading.
According to the survey, large enterprises lead the economic upgrading which is because of their
financial capacity as well as capacity to take risks for introducing new technologies and innovation.
Around 18 per cent of large factories have scores over 60, with none of the small and medium factories
32
in the sample reaching that level (Table 31). Even in the case of low scoring bands, the percentage of
large factories is lower than that of small and medium factories of the sample. Especially for small
factories, the economic upgrading score is predominantly low. In fact, around 97 percent of small
factories have scores in the low 0-40 range, showing their lack of progress in terms of economic
upgrading. While categorizing factories in terms of their broad product type, knit enterprises are
technologically less upgraded compared to that of woven enterprises (Figure 5).
Table 31: Size wise Distribution of Economic Upgrading
Economic Upgrading Score
Size of Enterprises
Total Large Medium Small
0.1-20.0
4 (36.36)
17 (42.5)
26 (78.79)
47 (55.95)
20.1-40.0
2 (18.18)
11 (27.5)
6 (18.18)
19 (22.62)
40.1-60.0
3 (27.27)
12 (30.0)
1 (3.03)
16 (19.05)
60.0 and above
2 (18.18)
0 (0.0)
0 (0.0)
2 (2.38)
Total
11 (100.0)
40 (100.0)
33 (100.0)
84 (100.0)
Note: Figures in parenthesis indicate column percentage Source: CPD-RMG Study, 2017
Source: CPD-RMG Study, 2017
It is usually assumed that changes in technology at the firm level is location neutral (Figure 6).
However, the results of upgrading are mixed in terms of locational distribution of firms. While around
57 percent of factories have scores in the low 0-20 range, all factories in Narayangonj, 56 per cent
factories of Chittagong and 42 percent of factories of Dhaka are within this range. On the other hand, a
very small percentage of factories of Chittagong (around 4 percent) have scores over 60, while none of
the factories of any other area have scores in this range. So, there is no clear leader in economic
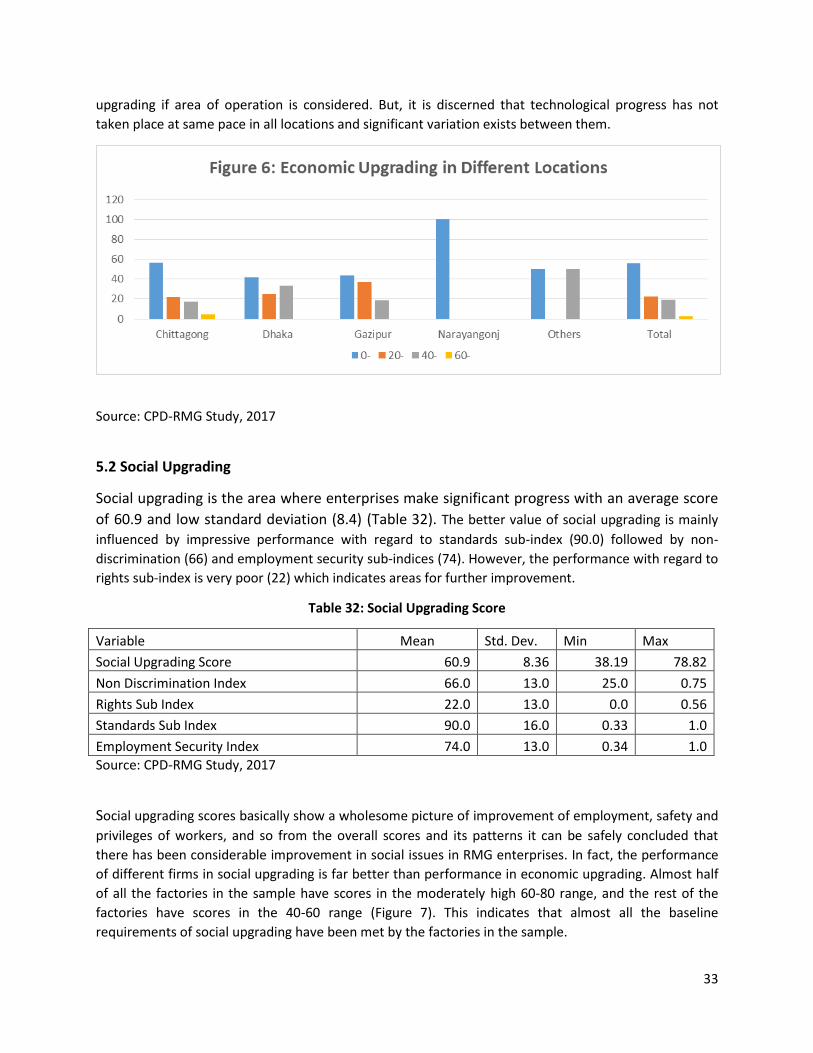
33
upgrading if area of operation is considered. But, it is discerned that technological progress has not
taken place at same pace in all locations and significant variation exists between them.
Source: CPD-RMG Study, 2017
5.2 Social Upgrading
Social upgrading is the area where enterprises make significant progress with an average score
of 60.9 and low standard deviation (8.4) (Table 32). The better value of social upgrading is mainly
influenced by impressive performance with regard to standards sub-index (90.0) followed by non-
discrimination (66) and employment security sub-indices (74). However, the performance with regard to
rights sub-index is very poor (22) which indicates areas for further improvement.
Table 32: Social Upgrading Score
Variable Mean Std. Dev. Min Max
Social Upgrading Score 60.9 8.36 38.19 78.82
Non Discrimination Index 66.0 13.0 25.0 0.75
Rights Sub Index 22.0 13.0 0.0 0.56
Standards Sub Index 90.0 16.0 0.33 1.0
Employment Security Index 74.0 13.0 0.34 1.0
Source: CPD-RMG Study, 2017
Social upgrading scores basically show a wholesome picture of improvement of employment, safety and
privileges of workers, and so from the overall scores and its patterns it can be safely concluded that
there has been considerable improvement in social issues in RMG enterprises. In fact, the performance
of different firms in social upgrading is far better than performance in economic upgrading. Almost half
of all the factories in the sample have scores in the moderately high 60-80 range, and the rest of the
factories have scores in the 40-60 range (Figure 7). This indicates that almost all the baseline
requirements of social upgrading have been met by the factories in the sample.
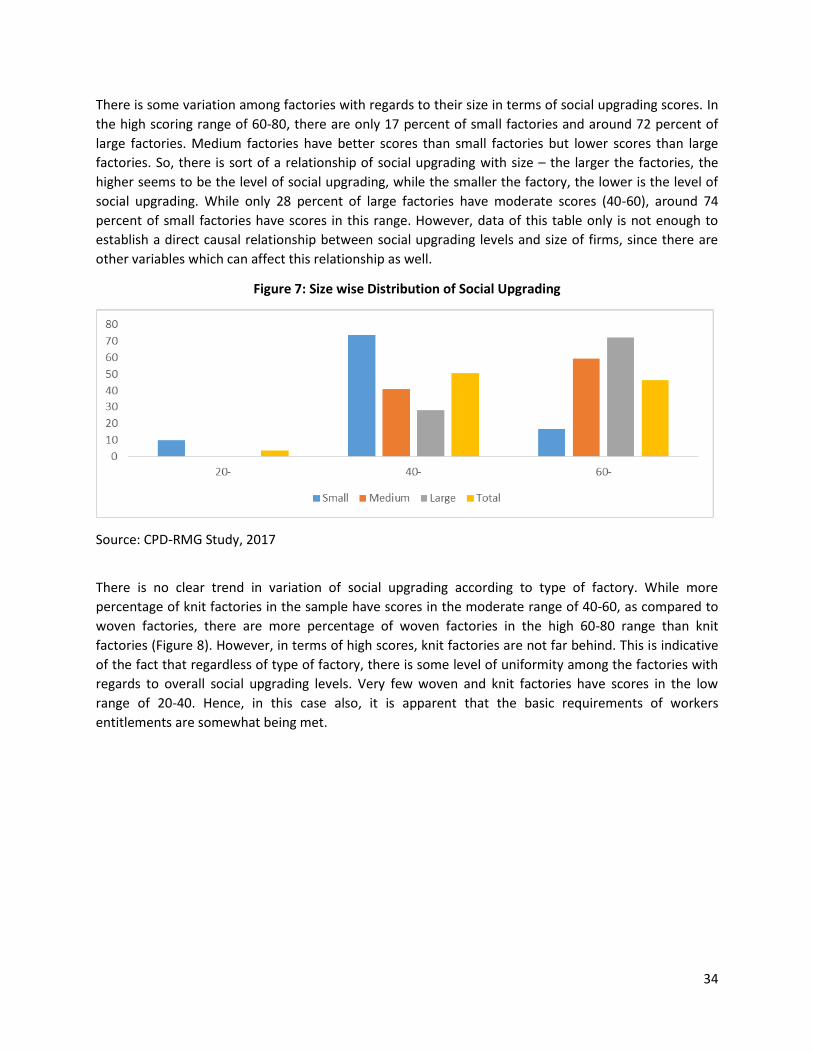
34
There is some variation among factories with regards to their size in terms of social upgrading scores. In
the high scoring range of 60-80, there are only 17 percent of small factories and around 72 percent of
large factories. Medium factories have better scores than small factories but lower scores than large
factories. So, there is sort of a relationship of social upgrading with size – the larger the factories, the
higher seems to be the level of social upgrading, while the smaller the factory, the lower is the level of
social upgrading. While only 28 percent of large factories have moderate scores (40-60), around 74
percent of small factories have scores in this range. However, data of this table only is not enough to
establish a direct causal relationship between social upgrading levels and size of firms, since there are
other variables which can affect this relationship as well.
Figure 7: Size wise Distribution of Social Upgrading
Source: CPD-RMG Study, 2017
There is no clear trend in variation of social upgrading according to type of factory. While more
percentage of knit factories in the sample have scores in the moderate range of 40-60, as compared to
woven factories, there are more percentage of woven factories in the high 60-80 range than knit
factories (Figure 8). However, in terms of high scores, knit factories are not far behind. This is indicative
of the fact that regardless of type of factory, there is some level of uniformity among the factories with
regards to overall social upgrading levels. Very few woven and knit factories have scores in the low
range of 20-40. Hence, in this case also, it is apparent that the basic requirements of workers
entitlements are somewhat being met.
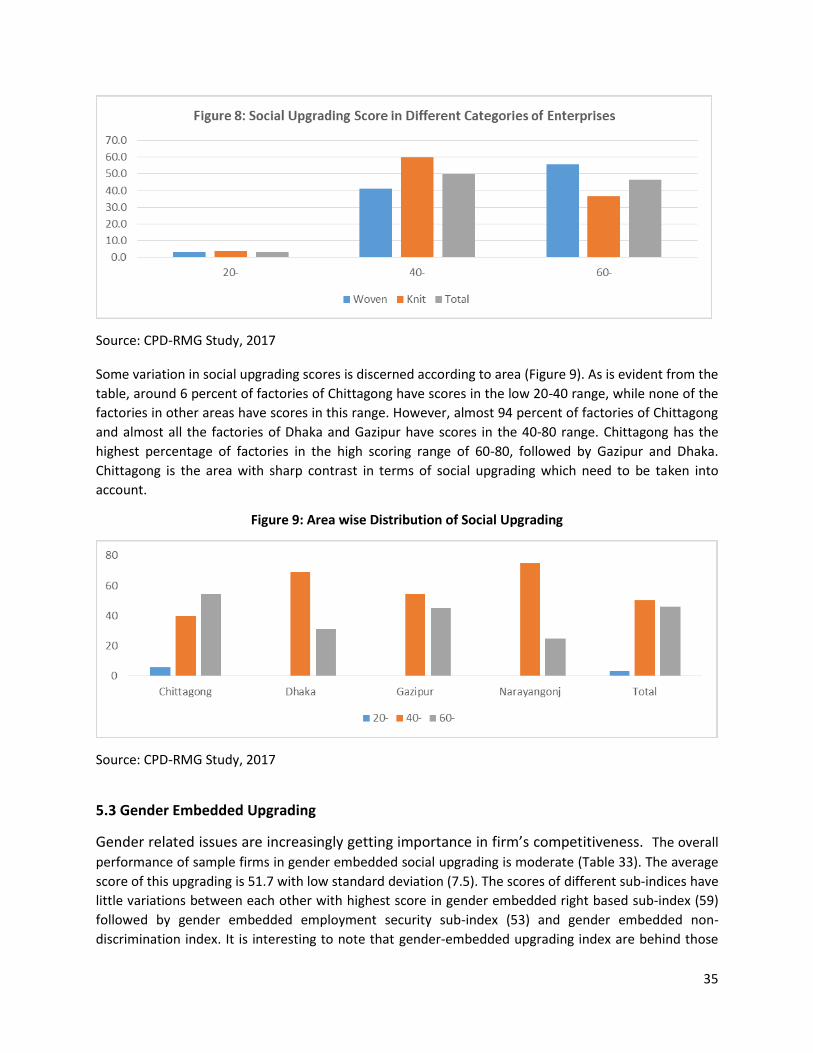
35
Source: CPD-RMG Study, 2017
Some variation in social upgrading scores is discerned according to area (Figure 9). As is evident from the
table, around 6 percent of factories of Chittagong have scores in the low 20-40 range, while none of the
factories in other areas have scores in this range. However, almost 94 percent of factories of Chittagong
and almost all the factories of Dhaka and Gazipur have scores in the 40-80 range. Chittagong has the
highest percentage of factories in the high scoring range of 60-80, followed by Gazipur and Dhaka.
Chittagong is the area with sharp contrast in terms of social upgrading which need to be taken into
account.
Figure 9: Area wise Distribution of Social Upgrading
Source: CPD-RMG Study, 2017
5.3 Gender Embedded Upgrading
Gender related issues are increasingly getting importance in firm’s competitiveness. The overall
performance of sample firms in gender embedded social upgrading is moderate (Table 33). The average
score of this upgrading is 51.7 with low standard deviation (7.5). The scores of different sub-indices have
little variations between each other with highest score in gender embedded right based sub-index (59)
followed by gender embedded employment security sub-index (53) and gender embedded non-
discrimination index. It is interesting to note that gender-embedded upgrading index are behind those
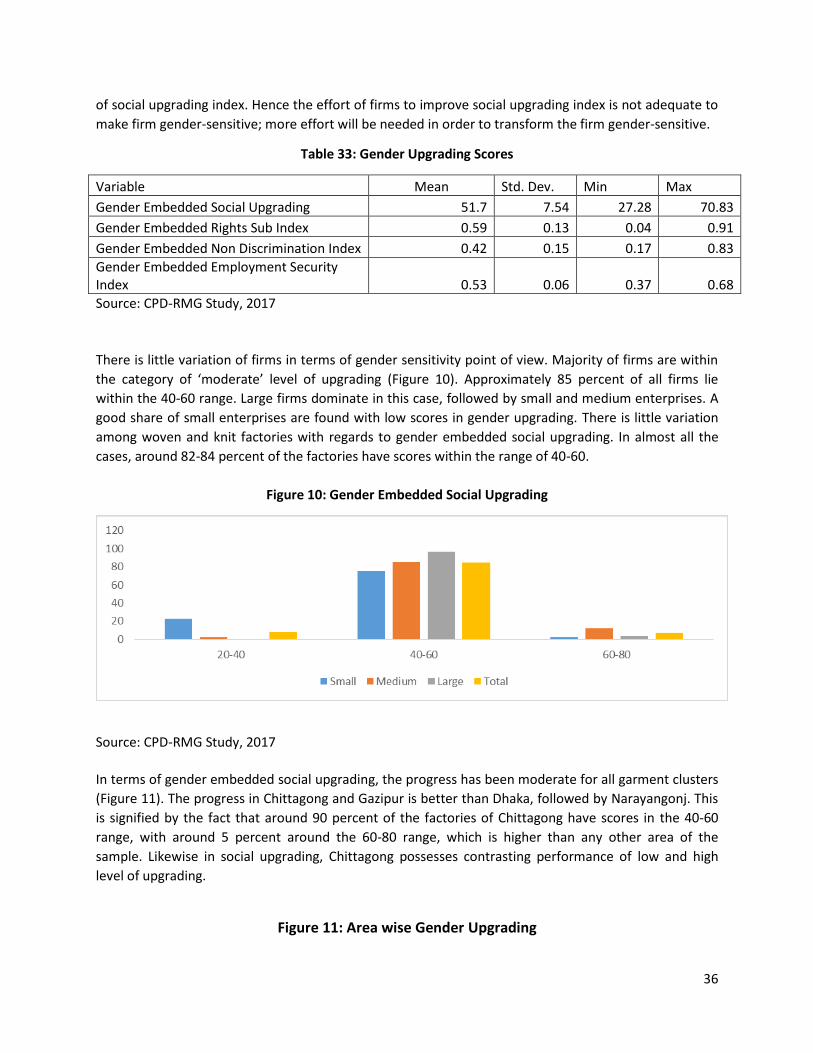
36
of social upgrading index. Hence the effort of firms to improve social upgrading index is not adequate to
make firm gender-sensitive; more effort will be needed in order to transform the firm gender-sensitive.
Table 33: Gender Upgrading Scores
Variable Mean Std. Dev. Min Max
Gender Embedded Social Upgrading 51.7 7.54 27.28 70.83
Gender Embedded Rights Sub Index 0.59 0.13 0.04 0.91
Gender Embedded Non Discrimination Index 0.42 0.15 0.17 0.83
Gender Embedded Employment Security Index 0.53 0.06 0.37 0.68
Source: CPD-RMG Study, 2017
There is little variation of firms in terms of gender sensitivity point of view. Majority of firms are within
the category of ‘moderate’ level of upgrading (Figure 10). Approximately 85 percent of all firms lie
within the 40-60 range. Large firms dominate in this case, followed by small and medium enterprises. A
good share of small enterprises are found with low scores in gender upgrading. There is little variation
among woven and knit factories with regards to gender embedded social upgrading. In almost all the
cases, around 82-84 percent of the factories have scores within the range of 40-60.
Figure 10: Gender Embedded Social Upgrading
Source: CPD-RMG Study, 2017
In terms of gender embedded social upgrading, the progress has been moderate for all garment clusters
(Figure 11). The progress in Chittagong and Gazipur is better than Dhaka, followed by Narayangonj. This
is signified by the fact that around 90 percent of the factories of Chittagong have scores in the 40-60
range, with around 5 percent around the 60-80 range, which is higher than any other area of the
sample. Likewise in social upgrading, Chittagong possesses contrasting performance of low and high
level of upgrading.
Figure 11: Area wise Gender Upgrading
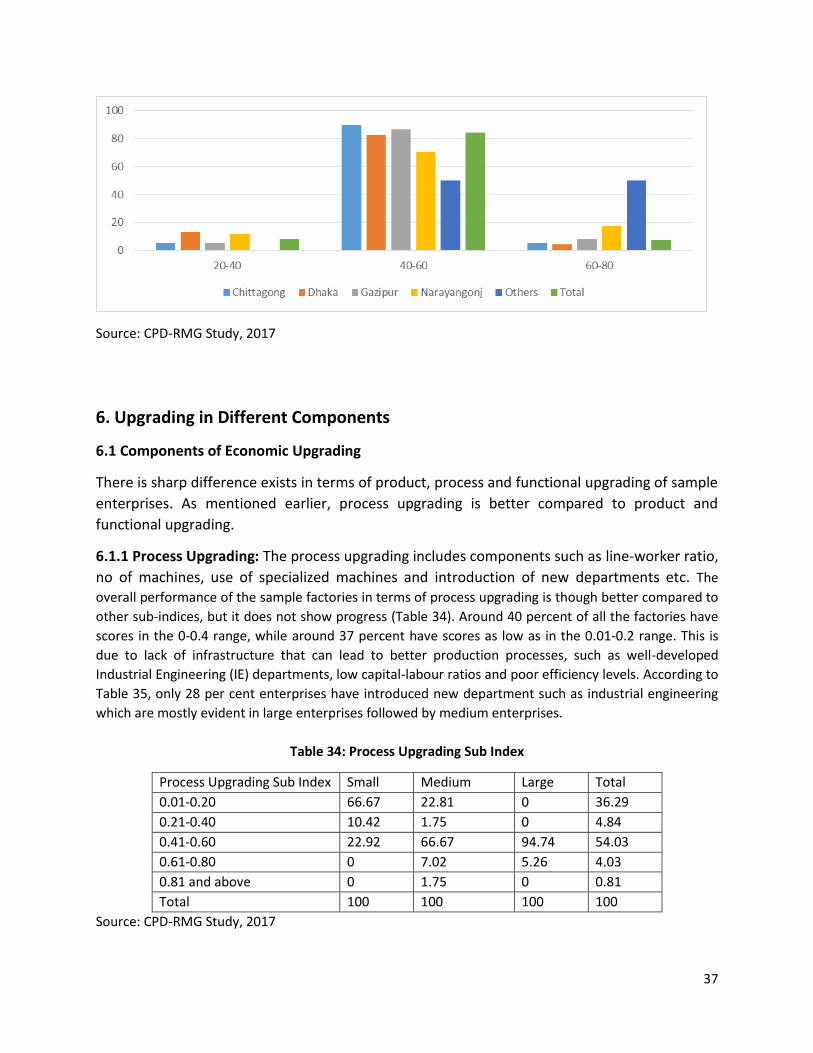
37
Source: CPD-RMG Study, 2017
6. Upgrading in Different Components
6.1 Components of Economic Upgrading
There is sharp difference exists in terms of product, process and functional upgrading of sample
enterprises. As mentioned earlier, process upgrading is better compared to product and
functional upgrading.
6.1.1 Process Upgrading: The process upgrading includes components such as line-worker ratio,
no of machines, use of specialized machines and introduction of new departments etc. The
overall performance of the sample factories in terms of process upgrading is though better compared to
other sub-indices, but it does not show progress (Table 34). Around 40 percent of all the factories have
scores in the 0-0.4 range, while around 37 percent have scores as low as in the 0.01-0.2 range. This is
due to lack of infrastructure that can lead to better production processes, such as well-developed
Industrial Engineering (IE) departments, low capital-labour ratios and poor efficiency levels. According to
Table 35, only 28 per cent enterprises have introduced new department such as industrial engineering
which are mostly evident in large enterprises followed by medium enterprises.
Table 34: Process Upgrading Sub Index
Process Upgrading Sub Index Small Medium Large Total
0.01-0.20 66.67 22.81 0 36.29
0.21-0.40 10.42 1.75 0 4.84
0.41-0.60 22.92 66.67 94.74 54.03
0.61-0.80 0 7.02 5.26 4.03
0.81 and above 0 1.75 0 0.81
Total 100 100 100 100
Source: CPD-RMG Study, 2017
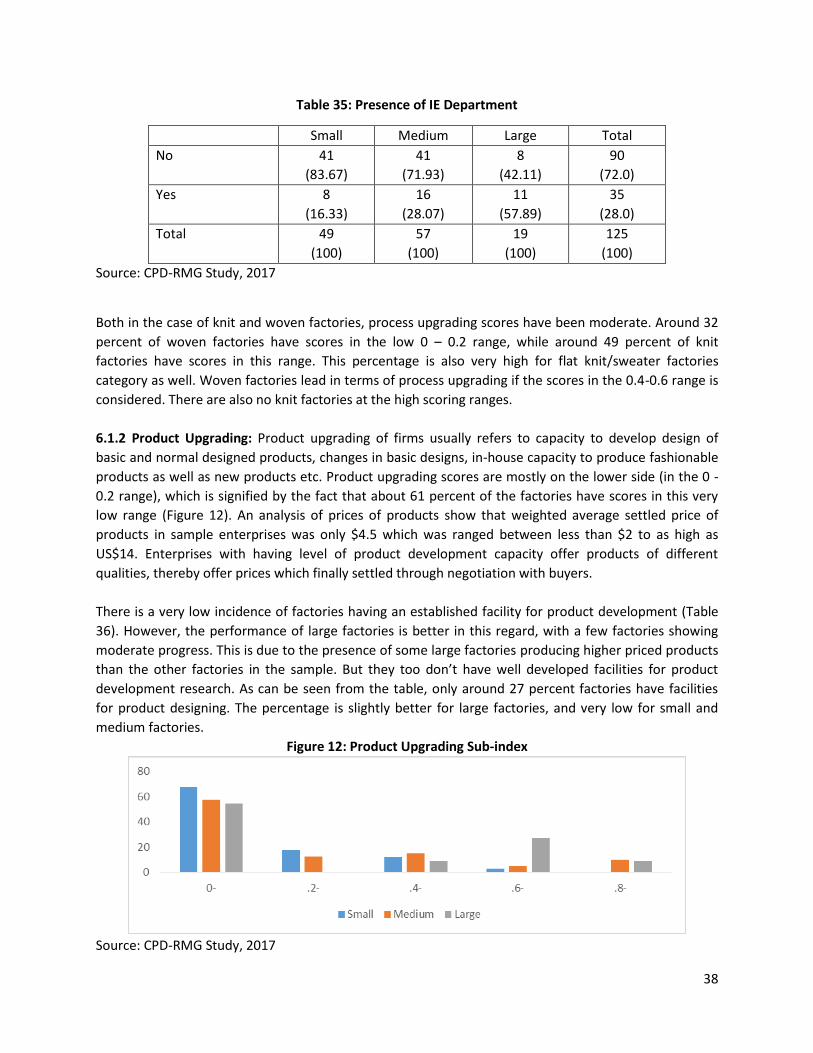
38
Table 35: Presence of IE Department
Small Medium Large Total
No
41
(83.67)
41
(71.93)
8
(42.11)
90
(72.0)
Yes
8
(16.33)
16
(28.07)
11
(57.89)
35
(28.0)
Total
49
(100)
57
(100)
19
(100)
125
(100)
Source: CPD-RMG Study, 2017
Both in the case of knit and woven factories, process upgrading scores have been moderate. Around 32
percent of woven factories have scores in the low 0 – 0.2 range, while around 49 percent of knit
factories have scores in this range. This percentage is also very high for flat knit/sweater factories
category as well. Woven factories lead in terms of process upgrading if the scores in the 0.4-0.6 range is
considered. There are also no knit factories at the high scoring ranges.
6.1.2 Product Upgrading: Product upgrading of firms usually refers to capacity to develop design of
basic and normal designed products, changes in basic designs, in-house capacity to produce fashionable
products as well as new products etc. Product upgrading scores are mostly on the lower side (in the 0 -
0.2 range), which is signified by the fact that about 61 percent of the factories have scores in this very
low range (Figure 12). An analysis of prices of products show that weighted average settled price of
products in sample enterprises was only $4.5 which was ranged between less than $2 to as high as
US$14. Enterprises with having level of product development capacity offer products of different
qualities, thereby offer prices which finally settled through negotiation with buyers.
There is a very low incidence of factories having an established facility for product development (Table
36). However, the performance of large factories is better in this regard, with a few factories showing
moderate progress. This is due to the presence of some large factories producing higher priced products
than the other factories in the sample. But they too don’t have well developed facilities for product
development research. As can be seen from the table, only around 27 percent factories have facilities
for product designing. The percentage is slightly better for large factories, and very low for small and
medium factories.
Figure 12: Product Upgrading Sub-index
Source: CPD-RMG Study, 2017
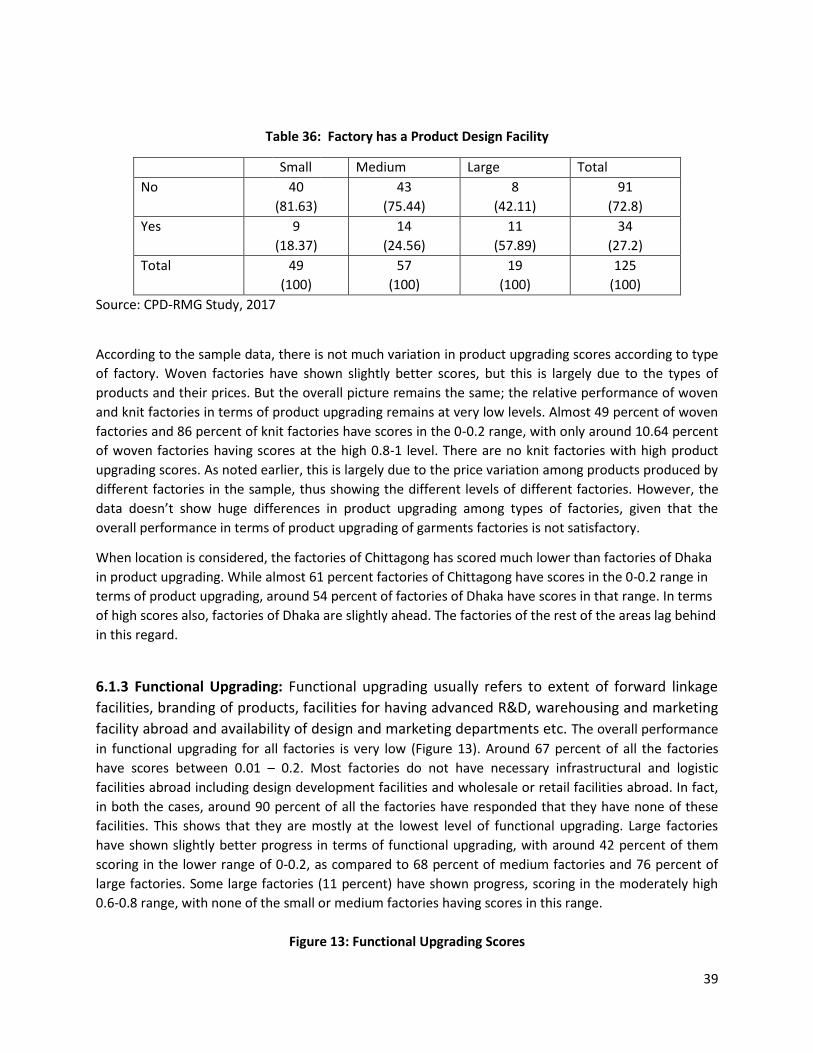
39
Table 36: Factory has a Product Design Facility
Small Medium Large Total
No
40
(81.63)
43
(75.44)
8
(42.11)
91
(72.8)
Yes
9
(18.37)
14
(24.56)
11
(57.89)
34
(27.2)
Total
49
(100)
57
(100)
19
(100)
125
(100)
Source: CPD-RMG Study, 2017
According to the sample data, there is not much variation in product upgrading scores according to type
of factory. Woven factories have shown slightly better scores, but this is largely due to the types of
products and their prices. But the overall picture remains the same; the relative performance of woven
and knit factories in terms of product upgrading remains at very low levels. Almost 49 percent of woven
factories and 86 percent of knit factories have scores in the 0-0.2 range, with only around 10.64 percent
of woven factories having scores at the high 0.8-1 level. There are no knit factories with high product
upgrading scores. As noted earlier, this is largely due to the price variation among products produced by
different factories in the sample, thus showing the different levels of different factories. However, the
data doesn’t show huge differences in product upgrading among types of factories, given that the
overall performance in terms of product upgrading of garments factories is not satisfactory.
When location is considered, the factories of Chittagong has scored much lower than factories of Dhaka
in product upgrading. While almost 61 percent factories of Chittagong have scores in the 0-0.2 range in
terms of product upgrading, around 54 percent of factories of Dhaka have scores in that range. In terms
of high scores also, factories of Dhaka are slightly ahead. The factories of the rest of the areas lag behind
in this regard.
6.1.3 Functional Upgrading: Functional upgrading usually refers to extent of forward linkage
facilities, branding of products, facilities for having advanced R&D, warehousing and marketing
facility abroad and availability of design and marketing departments etc. The overall performance
in functional upgrading for all factories is very low (Figure 13). Around 67 percent of all the factories
have scores between 0.01 – 0.2. Most factories do not have necessary infrastructural and logistic
facilities abroad including design development facilities and wholesale or retail facilities abroad. In fact,
in both the cases, around 90 percent of all the factories have responded that they have none of these
facilities. This shows that they are mostly at the lowest level of functional upgrading. Large factories
have shown slightly better progress in terms of functional upgrading, with around 42 percent of them
scoring in the lower range of 0-0.2, as compared to 68 percent of medium factories and 76 percent of
large factories. Some large factories (11 percent) have shown progress, scoring in the moderately high
0.6-0.8 range, with none of the small or medium factories having scores in this range.
Figure 13: Functional Upgrading Scores
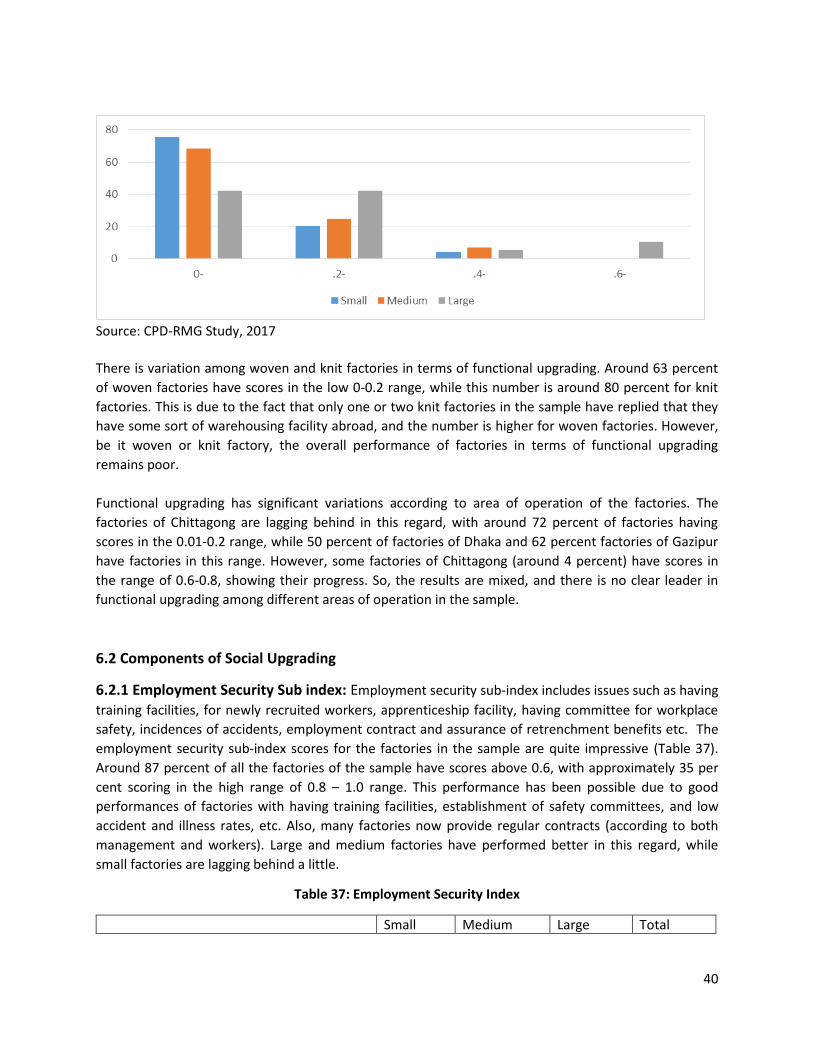
40
Source: CPD-RMG Study, 2017
There is variation among woven and knit factories in terms of functional upgrading. Around 63 percent
of woven factories have scores in the low 0-0.2 range, while this number is around 80 percent for knit
factories. This is due to the fact that only one or two knit factories in the sample have replied that they
have some sort of warehousing facility abroad, and the number is higher for woven factories. However,
be it woven or knit factory, the overall performance of factories in terms of functional upgrading
remains poor.
Functional upgrading has significant variations according to area of operation of the factories. The
factories of Chittagong are lagging behind in this regard, with around 72 percent of factories having
scores in the 0.01-0.2 range, while 50 percent of factories of Dhaka and 62 percent factories of Gazipur
have factories in this range. However, some factories of Chittagong (around 4 percent) have scores in
the range of 0.6-0.8, showing their progress. So, the results are mixed, and there is no clear leader in
functional upgrading among different areas of operation in the sample.
6.2 Components of Social Upgrading
6.2.1 Employment Security Sub index: Employment security sub-index includes issues such as having
training facilities, for newly recruited workers, apprenticeship facility, having committee for workplace
safety, incidences of accidents, employment contract and assurance of retrenchment benefits etc. The
employment security sub-index scores for the factories in the sample are quite impressive (Table 37).
Around 87 percent of all the factories of the sample have scores above 0.6, with approximately 35 per
cent scoring in the high range of 0.8 – 1.0 range. This performance has been possible due to good
performances of factories with having training facilities, establishment of safety committees, and low
accident and illness rates, etc. Also, many factories now provide regular contracts (according to both
management and workers). Large and medium factories have performed better in this regard, while
small factories are lagging behind a little.
Table 37: Employment Security Index
Small Medium Large Total
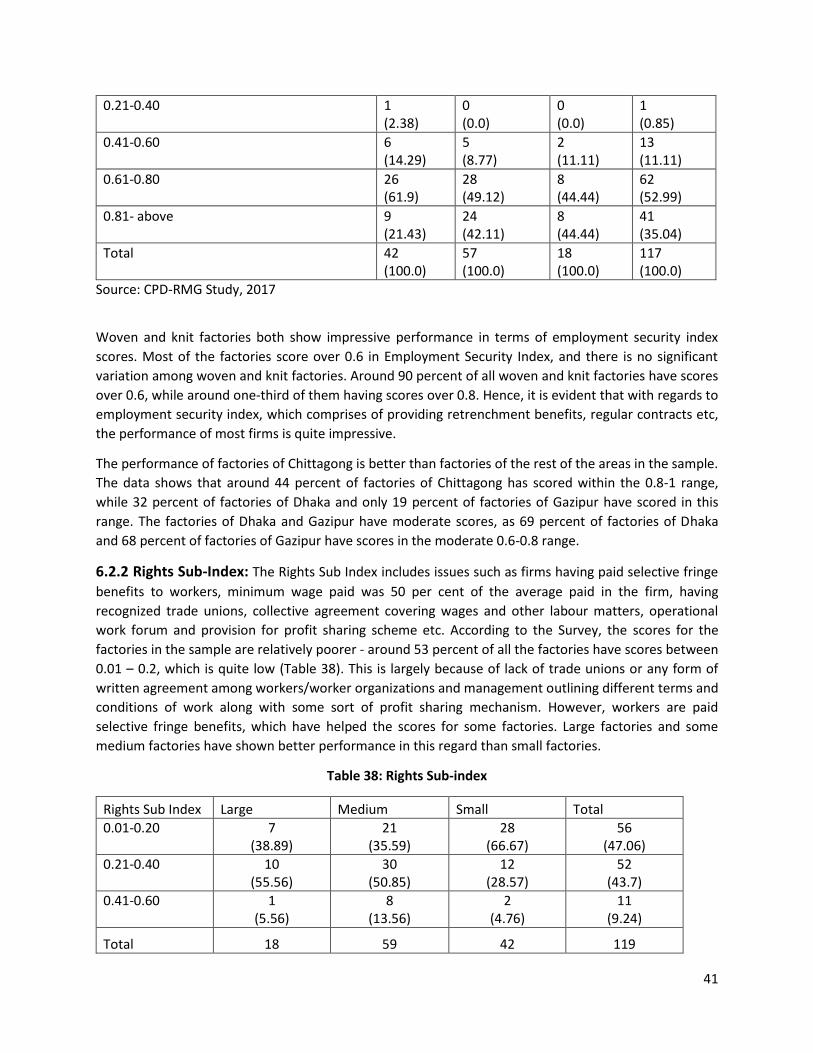
41
0.21-0.40
1 (2.38)
0 (0.0)
0 (0.0)
1 (0.85)
0.41-0.60
6 (14.29)
5 (8.77)
2 (11.11)
13 (11.11)
0.61-0.80
26 (61.9)
28 (49.12)
8 (44.44)
62 (52.99)
0.81- above
9 (21.43)
24 (42.11)
8 (44.44)
41 (35.04)
Total
42 (100.0)
57 (100.0)
18 (100.0)
117 (100.0)
Source: CPD-RMG Study, 2017
Woven and knit factories both show impressive performance in terms of employment security index
scores. Most of the factories score over 0.6 in Employment Security Index, and there is no significant
variation among woven and knit factories. Around 90 percent of all woven and knit factories have scores
over 0.6, while around one-third of them having scores over 0.8. Hence, it is evident that with regards to
employment security index, which comprises of providing retrenchment benefits, regular contracts etc,
the performance of most firms is quite impressive.
The performance of factories of Chittagong is better than factories of the rest of the areas in the sample.
The data shows that around 44 percent of factories of Chittagong has scored within the 0.8-1 range,
while 32 percent of factories of Dhaka and only 19 percent of factories of Gazipur have scored in this
range. The factories of Dhaka and Gazipur have moderate scores, as 69 percent of factories of Dhaka
and 68 percent of factories of Gazipur have scores in the moderate 0.6-0.8 range.
6.2.2 Rights Sub-Index: The Rights Sub Index includes issues such as firms having paid selective fringe
benefits to workers, minimum wage paid was 50 per cent of the average paid in the firm, having
recognized trade unions, collective agreement covering wages and other labour matters, operational
work forum and provision for profit sharing scheme etc. According to the Survey, the scores for the
factories in the sample are relatively poorer - around 53 percent of all the factories have scores between
0.01 – 0.2, which is quite low (Table 38). This is largely because of lack of trade unions or any form of
written agreement among workers/worker organizations and management outlining different terms and
conditions of work along with some sort of profit sharing mechanism. However, workers are paid
selective fringe benefits, which have helped the scores for some factories. Large factories and some
medium factories have shown better performance in this regard than small factories.
Table 38: Rights Sub-index
Rights Sub Index Large Medium Small Total
0.01-0.20
7 (38.89)
21 (35.59)
28 (66.67)
56 (47.06)
0.21-0.40
10 (55.56)
30 (50.85)
12 (28.57)
52 (43.7)
0.41-0.60
1 (5.56)
8 (13.56)
2 (4.76)
11 (9.24)
Total 18 59 42 119
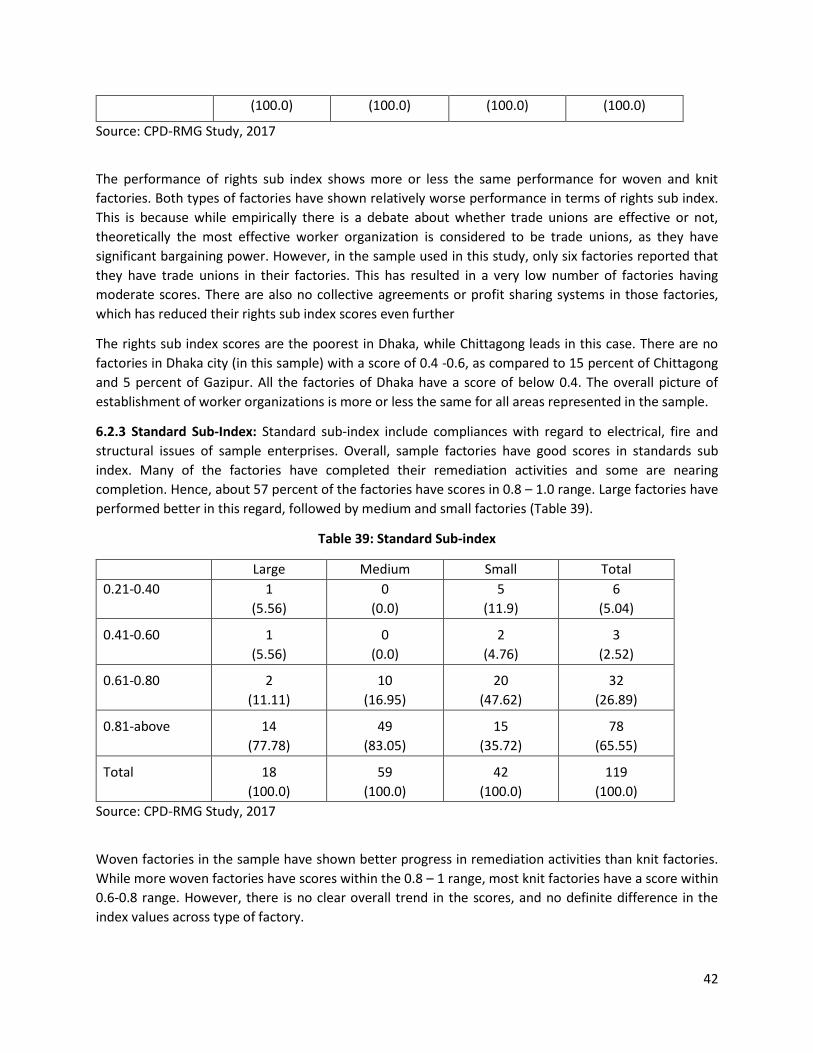
42
(100.0) (100.0) (100.0) (100.0)
Source: CPD-RMG Study, 2017
The performance of rights sub index shows more or less the same performance for woven and knit
factories. Both types of factories have shown relatively worse performance in terms of rights sub index.
This is because while empirically there is a debate about whether trade unions are effective or not,
theoretically the most effective worker organization is considered to be trade unions, as they have
significant bargaining power. However, in the sample used in this study, only six factories reported that
they have trade unions in their factories. This has resulted in a very low number of factories having
moderate scores. There are also no collective agreements or profit sharing systems in those factories,
which has reduced their rights sub index scores even further
The rights sub index scores are the poorest in Dhaka, while Chittagong leads in this case. There are no
factories in Dhaka city (in this sample) with a score of 0.4 -0.6, as compared to 15 percent of Chittagong
and 5 percent of Gazipur. All the factories of Dhaka have a score of below 0.4. The overall picture of
establishment of worker organizations is more or less the same for all areas represented in the sample.
6.2.3 Standard Sub-Index: Standard sub-index include compliances with regard to electrical, fire and
structural issues of sample enterprises. Overall, sample factories have good scores in standards sub
index. Many of the factories have completed their remediation activities and some are nearing
completion. Hence, about 57 percent of the factories have scores in 0.8 – 1.0 range. Large factories have
performed better in this regard, followed by medium and small factories (Table 39).
Table 39: Standard Sub-index
Large Medium Small Total
0.21-0.40
1
(5.56)
0
(0.0)
5
(11.9)
6
(5.04)
0.41-0.60
1
(5.56)
0
(0.0)
2
(4.76)
3
(2.52)
0.61-0.80
2
(11.11)
10
(16.95)
20
(47.62)
32
(26.89)
0.81-above
14
(77.78)
49
(83.05)
15
(35.72)
78
(65.55)
Total
18
(100.0)
59
(100.0)
42
(100.0)
119
(100.0)
Source: CPD-RMG Study, 2017
Woven factories in the sample have shown better progress in remediation activities than knit factories.
While more woven factories have scores within the 0.8 – 1 range, most knit factories have a score within
0.6-0.8 range. However, there is no clear overall trend in the scores, and no definite difference in the
index values across type of factory.
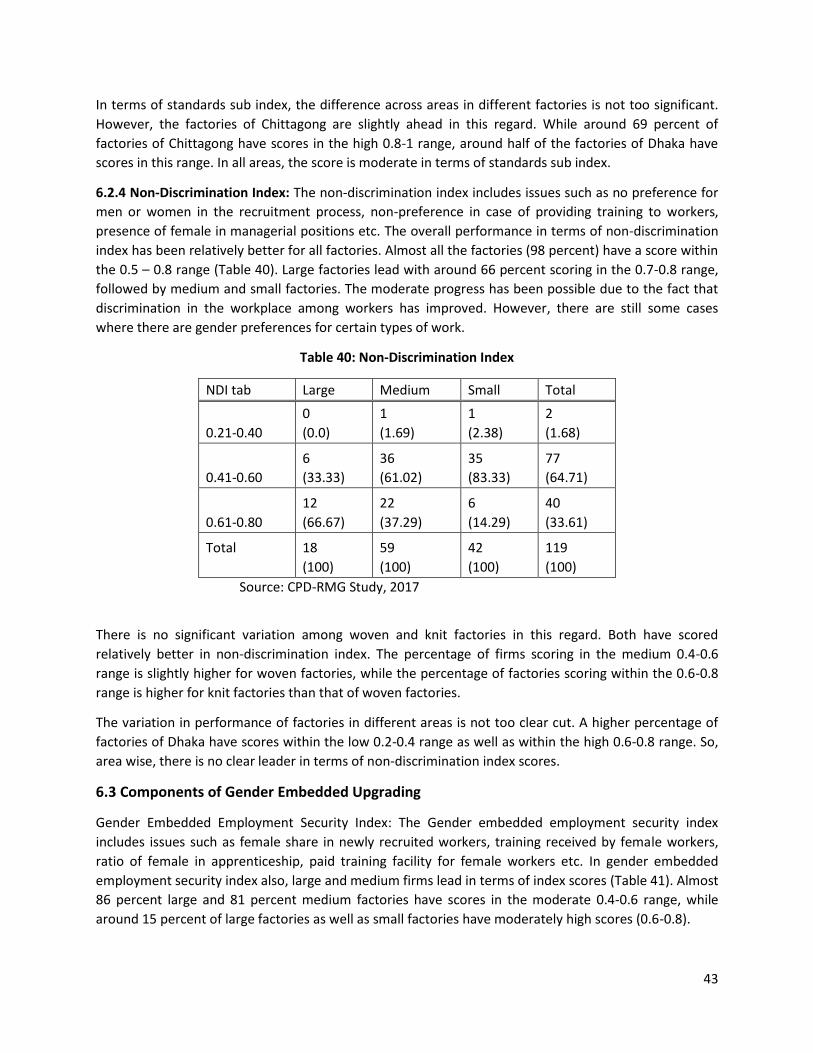
43
In terms of standards sub index, the difference across areas in different factories is not too significant.
However, the factories of Chittagong are slightly ahead in this regard. While around 69 percent of
factories of Chittagong have scores in the high 0.8-1 range, around half of the factories of Dhaka have
scores in this range. In all areas, the score is moderate in terms of standards sub index.
6.2.4 Non-Discrimination Index: The non-discrimination index includes issues such as no preference for
men or women in the recruitment process, non-preference in case of providing training to workers,
presence of female in managerial positions etc. The overall performance in terms of non-discrimination
index has been relatively better for all factories. Almost all the factories (98 percent) have a score within
the 0.5 – 0.8 range (Table 40). Large factories lead with around 66 percent scoring in the 0.7-0.8 range,
followed by medium and small factories. The moderate progress has been possible due to the fact that
discrimination in the workplace among workers has improved. However, there are still some cases
where there are gender preferences for certain types of work.
Table 40: Non-Discrimination Index
NDI tab Large Medium Small Total
0.21-0.40
0
(0.0)
1
(1.69)
1
(2.38)
2
(1.68)
0.41-0.60
6
(33.33)
36
(61.02)
35
(83.33)
77
(64.71)
0.61-0.80
12
(66.67)
22
(37.29)
6
(14.29)
40
(33.61)
Total
18
(100)
59
(100)
42
(100)
119
(100)
Source: CPD-RMG Study, 2017
There is no significant variation among woven and knit factories in this regard. Both have scored
relatively better in non-discrimination index. The percentage of firms scoring in the medium 0.4-0.6
range is slightly higher for woven factories, while the percentage of factories scoring within the 0.6-0.8
range is higher for knit factories than that of woven factories.
The variation in performance of factories in different areas is not too clear cut. A higher percentage of
factories of Dhaka have scores within the low 0.2-0.4 range as well as within the high 0.6-0.8 range. So,
area wise, there is no clear leader in terms of non-discrimination index scores.
6.3 Components of Gender Embedded Upgrading
Gender Embedded Employment Security Index: The Gender embedded employment security index
includes issues such as female share in newly recruited workers, training received by female workers,
ratio of female in apprenticeship, paid training facility for female workers etc. In gender embedded
employment security index also, large and medium firms lead in terms of index scores (Table 41). Almost
86 percent large and 81 percent medium factories have scores in the moderate 0.4-0.6 range, while
around 15 percent of large factories as well as small factories have moderately high scores (0.6-0.8).
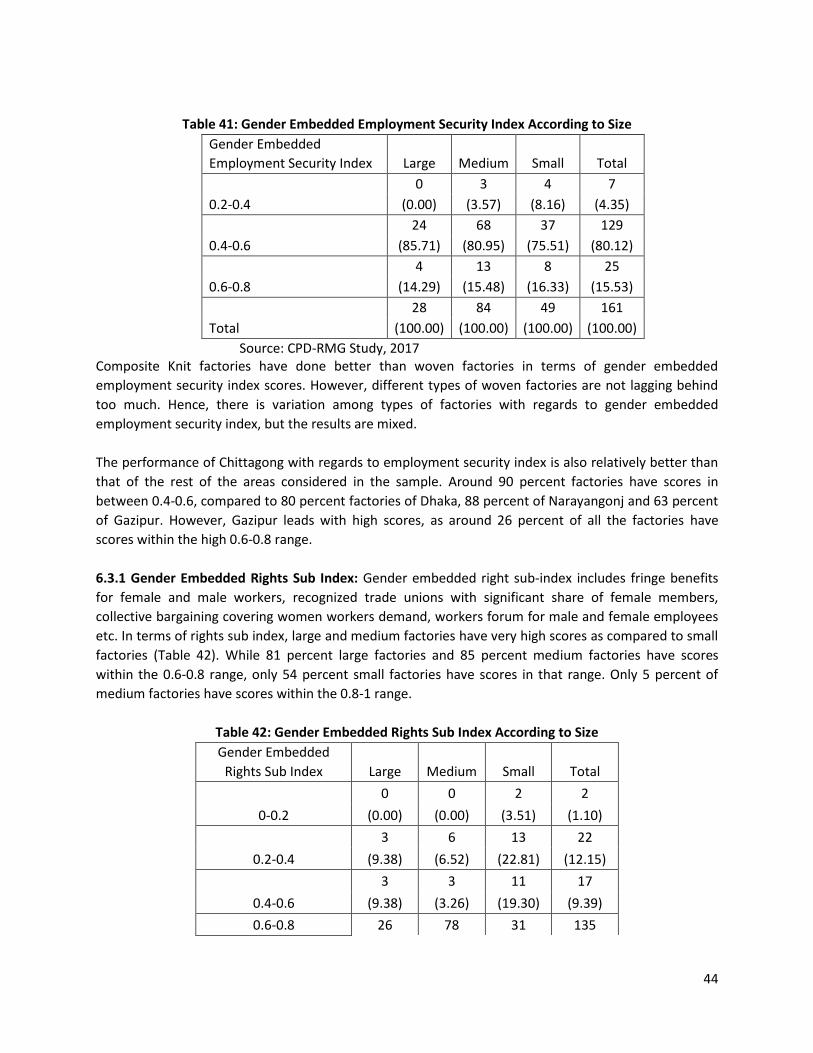
44
Table 41: Gender Embedded Employment Security Index According to Size
Gender Embedded
Employment Security Index Large Medium Small Total
0.2-0.4
0 3 4 7
(0.00) (3.57) (8.16) (4.35)
0.4-0.6
24 68 37 129
(85.71) (80.95) (75.51) (80.12)
0.6-0.8
4 13 8 25
(14.29) (15.48) (16.33) (15.53)
Total
28 84 49 161
(100.00) (100.00) (100.00) (100.00)
Source: CPD-RMG Study, 2017 Composite Knit factories have done better than woven factories in terms of gender embedded
employment security index scores. However, different types of woven factories are not lagging behind
too much. Hence, there is variation among types of factories with regards to gender embedded
employment security index, but the results are mixed.
The performance of Chittagong with regards to employment security index is also relatively better than
that of the rest of the areas considered in the sample. Around 90 percent factories have scores in
between 0.4-0.6, compared to 80 percent factories of Dhaka, 88 percent of Narayangonj and 63 percent
of Gazipur. However, Gazipur leads with high scores, as around 26 percent of all the factories have
scores within the high 0.6-0.8 range.
6.3.1 Gender Embedded Rights Sub Index: Gender embedded right sub-index includes fringe benefits
for female and male workers, recognized trade unions with significant share of female members,
collective bargaining covering women workers demand, workers forum for male and female employees
etc. In terms of rights sub index, large and medium factories have very high scores as compared to small
factories (Table 42). While 81 percent large factories and 85 percent medium factories have scores
within the 0.6-0.8 range, only 54 percent small factories have scores in that range. Only 5 percent of
medium factories have scores within the 0.8-1 range.
Table 42: Gender Embedded Rights Sub Index According to Size
Gender Embedded
Rights Sub Index Large Medium Small Total
0-0.2
0 0 2 2
(0.00) (0.00) (3.51) (1.10)
0.2-0.4
3 6 13 22
(9.38) (6.52) (22.81) (12.15)
0.4-0.6
3 3 11 17
(9.38) (3.26) (19.30) (9.39)
0.6-0.8 26 78 31 135
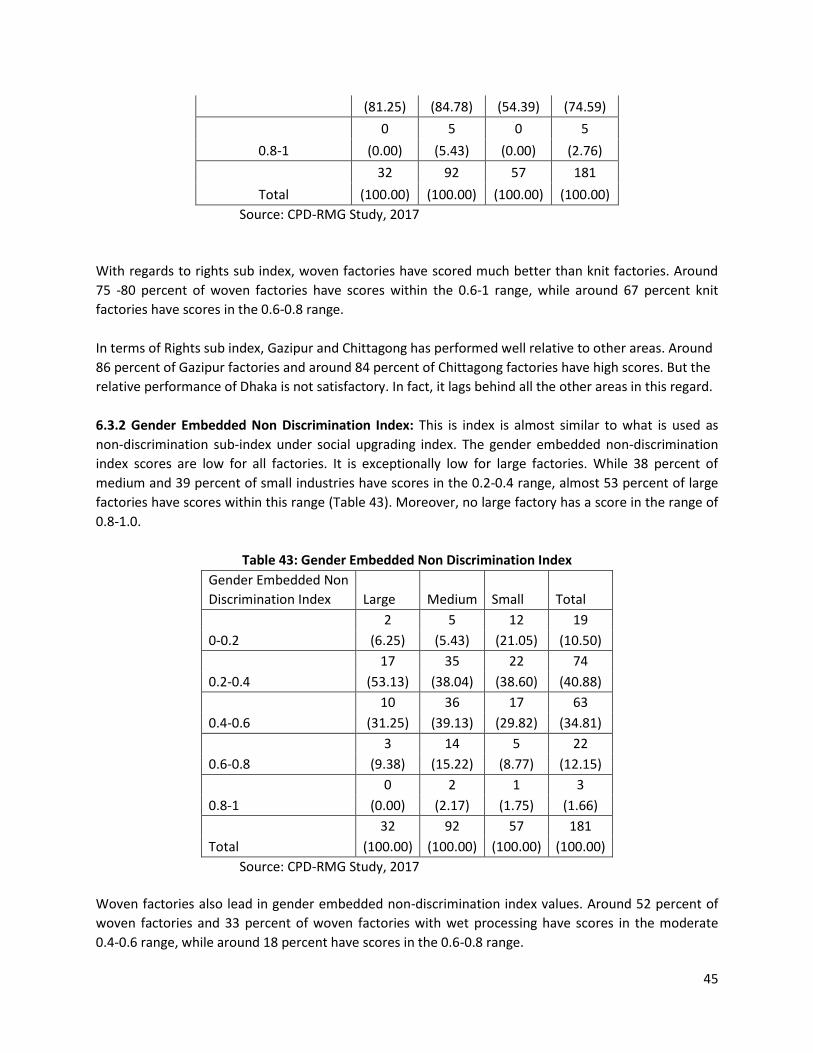
45
(81.25) (84.78) (54.39) (74.59)
0.8-1
0 5 0 5
(0.00) (5.43) (0.00) (2.76)
Total
32 92 57 181
(100.00) (100.00) (100.00) (100.00)
Source: CPD-RMG Study, 2017
With regards to rights sub index, woven factories have scored much better than knit factories. Around
75 -80 percent of woven factories have scores within the 0.6-1 range, while around 67 percent knit
factories have scores in the 0.6-0.8 range.
In terms of Rights sub index, Gazipur and Chittagong has performed well relative to other areas. Around
86 percent of Gazipur factories and around 84 percent of Chittagong factories have high scores. But the
relative performance of Dhaka is not satisfactory. In fact, it lags behind all the other areas in this regard.
6.3.2 Gender Embedded Non Discrimination Index: This is index is almost similar to what is used as
non-discrimination sub-index under social upgrading index. The gender embedded non-discrimination
index scores are low for all factories. It is exceptionally low for large factories. While 38 percent of
medium and 39 percent of small industries have scores in the 0.2-0.4 range, almost 53 percent of large
factories have scores within this range (Table 43). Moreover, no large factory has a score in the range of
0.8-1.0.
Table 43: Gender Embedded Non Discrimination Index
Gender Embedded Non
Discrimination Index Large Medium Small Total
0-0.2
2 5 12 19
(6.25) (5.43) (21.05) (10.50)
0.2-0.4
17 35 22 74
(53.13) (38.04) (38.60) (40.88)
0.4-0.6
10 36 17 63
(31.25) (39.13) (29.82) (34.81)
0.6-0.8
3 14 5 22
(9.38) (15.22) (8.77) (12.15)
0.8-1
0 2 1 3
(0.00) (2.17) (1.75) (1.66)
Total
32 92 57 181
(100.00) (100.00) (100.00) (100.00)
Source: CPD-RMG Study, 2017
Woven factories also lead in gender embedded non-discrimination index values. Around 52 percent of
woven factories and 33 percent of woven factories with wet processing have scores in the moderate
0.4-0.6 range, while around 18 percent have scores in the 0.6-0.8 range.
46
6.4 Overall Observations The RMG sector has experienced two streams in terms of structure and composition as well as
upgradation - in one stream very limited level of changes is discerned and in other stream significant
changes is observed. In case of structure and composition of RMG enterprises, changes are visible in
case of ownership and partly in management of the enterprises while more changes are discerned in
case of composition of workers, skill composition and contractual arrangement between buyers and
suppliers. A large share of enterprises are operating as part of group of companies which include a
significant share of small scale enterprises. There is very limited changes discerned in quality of
management as senior management still has limited exposure to modern management related
knowledge and techniques. A sizable share of enterprises recruited foreign professionals in different
technical and management related activities. Technological changes are visible but there is wide
variation between different types of enterprises in case of using advanced technologies. Workers’
organizations in the form of WPC is more visible however, trade unions are almost non-existent. There is
growing number of enterprises with having elected WPCs. These committees discussed various
grievance issues including late payment of wages, overtime, problems in fixing wage rate, over pressure
for work, sexual harassment, leave benefits, other financial benefits, workers’ association related
problems or promotion related issues. The structure of RMG enterprises give an indication that a sizable
share of enterprises have the potentials to ‘take off’ provided they could improve in terms of
technological readiness, improved management practices, further improvement of workers skill
particularly that of female workers etc.
On the other hand, upgrading in RMG enterprises reveal a diverse pattern. The upgradation is most
prominent in case of social issues particularly with regard to standards, non-discrimination and
employability issues but very poor in rights issue. A moderate level of upgrading is discerned in case of
gender embedded upgrading. In contrast, economic upgrading of sample enterprises in general are very
behind particularly because of poor performance in product and functional upgrading related issues. In
other words, post-Rana Plaza initiatives drive firms to undertake various kinds of upgrading; however,
such upgrading is visible mainly in social upgrading and limited or no progress is discerned in case of
economic upgrading. The upgradation as discerned have size issues where large enterprises are found to
be ahead of medium and small enterprises with regard to economic, social and gender related
upgrading. In case of social upgrading, all types of enterprises are found to be in better condition. In
some cases, woven enterprises are ahead of knit enterprises particularly in case of economic upgrading
point of view. There is location variation of upgardation – Chittagong has sharp contrasts in terms of
upgradation while enterprises located there are behind in terms of economic upgrading on the other
hand, these enterprises are ahead of other regions in case of social and gender embedded upgrading.
In other words, an institution-driven upgradation in social issues which had been undertaken over the
last five years have yet to establish its natural link with economic issues. In that consideration, an
unbalanced upgradation has been taken place with limited focus on economic and technological issues,
particularly those in small and medium enterprises. Such an unbalanced growth usually have limited
positive implications in terms of firm’s overall competitiveness especially those are behind.
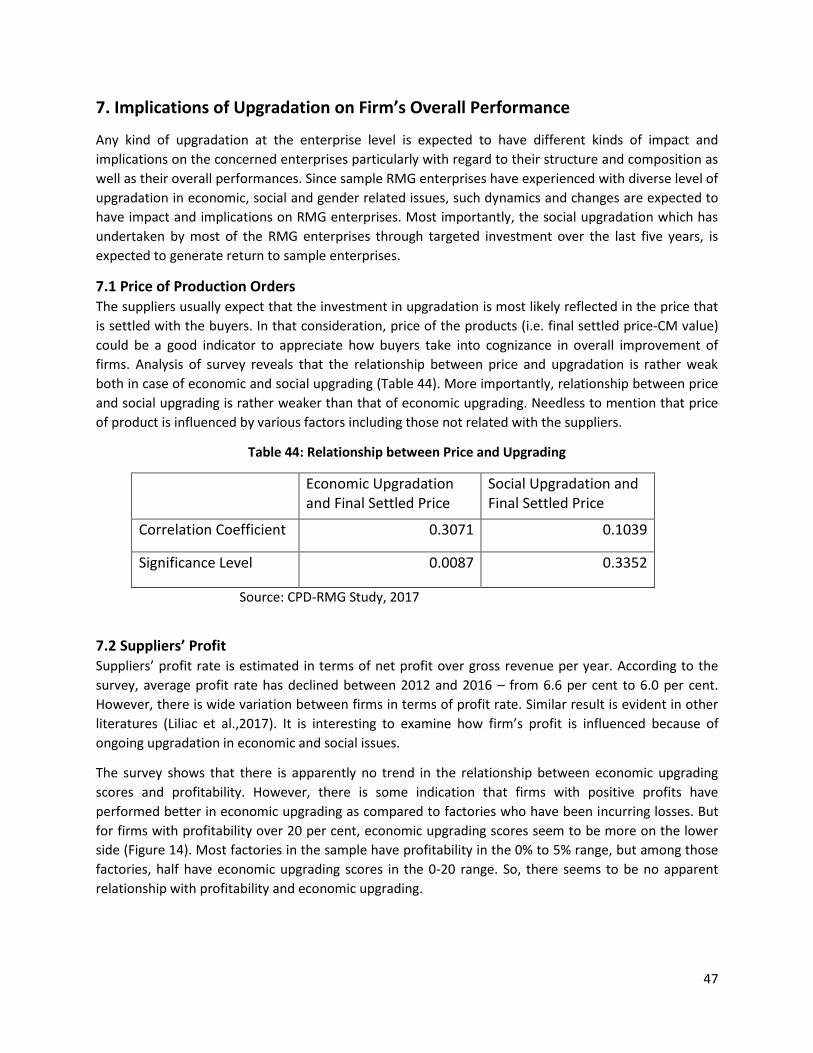
47
7. Implications of Upgradation on Firm’s Overall Performance
Any kind of upgradation at the enterprise level is expected to have different kinds of impact and
implications on the concerned enterprises particularly with regard to their structure and composition as
well as their overall performances. Since sample RMG enterprises have experienced with diverse level of
upgradation in economic, social and gender related issues, such dynamics and changes are expected to
have impact and implications on RMG enterprises. Most importantly, the social upgradation which has
undertaken by most of the RMG enterprises through targeted investment over the last five years, is
expected to generate return to sample enterprises.
7.1 Price of Production Orders The suppliers usually expect that the investment in upgradation is most likely reflected in the price that
is settled with the buyers. In that consideration, price of the products (i.e. final settled price-CM value)
could be a good indicator to appreciate how buyers take into cognizance in overall improvement of
firms. Analysis of survey reveals that the relationship between price and upgradation is rather weak
both in case of economic and social upgrading (Table 44). More importantly, relationship between price
and social upgrading is rather weaker than that of economic upgrading. Needless to mention that price
of product is influenced by various factors including those not related with the suppliers.
Table 44: Relationship between Price and Upgrading
Economic Upgradation and Final Settled Price
Social Upgradation and Final Settled Price
Correlation Coefficient 0.3071 0.1039
Significance Level 0.0087 0.3352
Source: CPD-RMG Study, 2017
7.2 Suppliers’ Profit Suppliers’ profit rate is estimated in terms of net profit over gross revenue per year. According to the
survey, average profit rate has declined between 2012 and 2016 – from 6.6 per cent to 6.0 per cent.
However, there is wide variation between firms in terms of profit rate. Similar result is evident in other
literatures (Liliac et al.,2017). It is interesting to examine how firm’s profit is influenced because of
ongoing upgradation in economic and social issues.
The survey shows that there is apparently no trend in the relationship between economic upgrading
scores and profitability. However, there is some indication that firms with positive profits have
performed better in economic upgrading as compared to factories who have been incurring losses. But
for firms with profitability over 20 per cent, economic upgrading scores seem to be more on the lower
side (Figure 14). Most factories in the sample have profitability in the 0% to 5% range, but among those
factories, half have economic upgrading scores in the 0-20 range. So, there seems to be no apparent
relationship with profitability and economic upgrading.
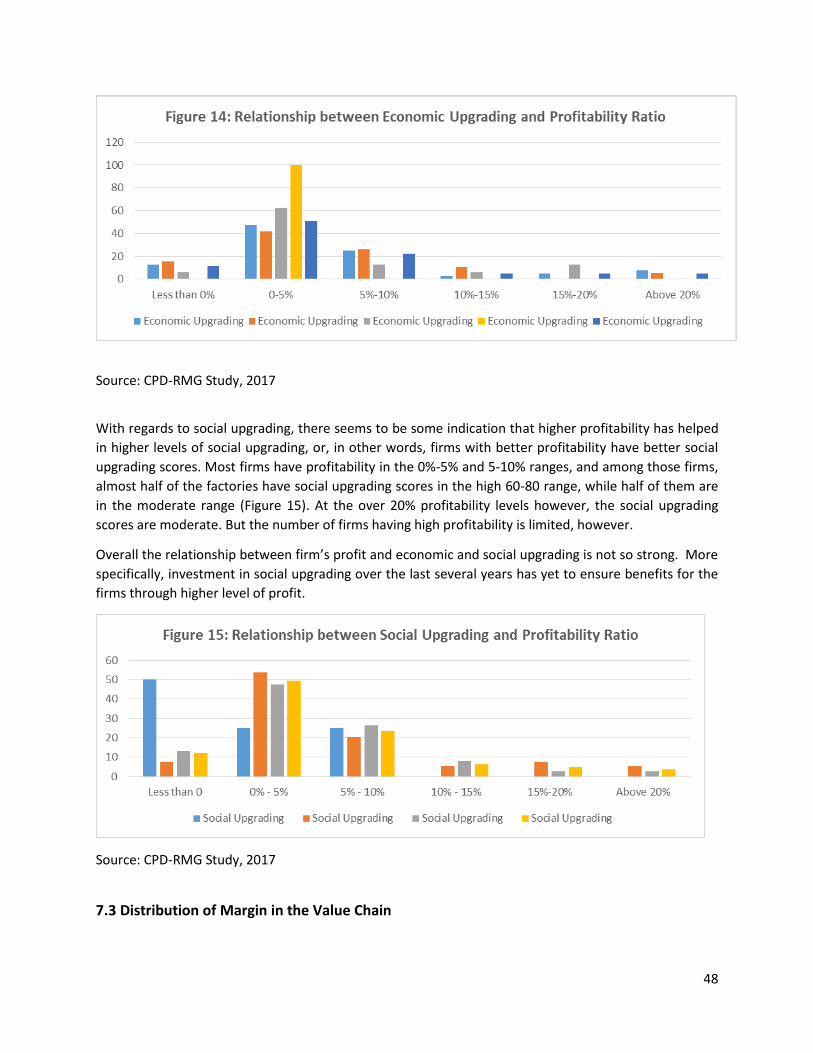
48
Source: CPD-RMG Study, 2017
With regards to social upgrading, there seems to be some indication that higher profitability has helped
in higher levels of social upgrading, or, in other words, firms with better profitability have better social
upgrading scores. Most firms have profitability in the 0%-5% and 5-10% ranges, and among those firms,
almost half of the factories have social upgrading scores in the high 60-80 range, while half of them are
in the moderate range (Figure 15). At the over 20% profitability levels however, the social upgrading
scores are moderate. But the number of firms having high profitability is limited, however.
Overall the relationship between firm’s profit and economic and social upgrading is not so strong. More
specifically, investment in social upgrading over the last several years has yet to ensure benefits for the
firms through higher level of profit.
Source: CPD-RMG Study, 2017
7.3 Distribution of Margin in the Value Chain
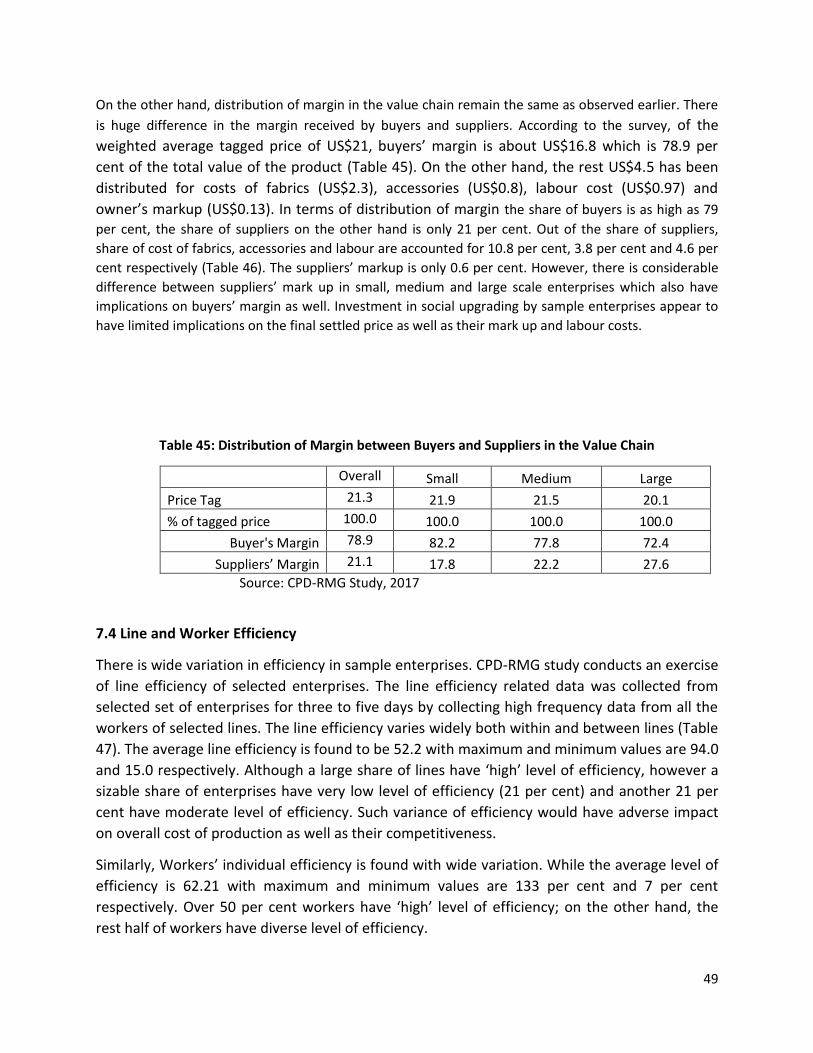
49
On the other hand, distribution of margin in the value chain remain the same as observed earlier. There
is huge difference in the margin received by buyers and suppliers. According to the survey, of the
weighted average tagged price of US$21, buyers’ margin is about US$16.8 which is 78.9 per
cent of the total value of the product (Table 45). On the other hand, the rest US$4.5 has been
distributed for costs of fabrics (US$2.3), accessories (US$0.8), labour cost (US$0.97) and
owner’s markup (US$0.13). In terms of distribution of margin the share of buyers is as high as 79
per cent, the share of suppliers on the other hand is only 21 per cent. Out of the share of suppliers,
share of cost of fabrics, accessories and labour are accounted for 10.8 per cent, 3.8 per cent and 4.6 per
cent respectively (Table 46). The suppliers’ markup is only 0.6 per cent. However, there is considerable
difference between suppliers’ mark up in small, medium and large scale enterprises which also have
implications on buyers’ margin as well. Investment in social upgrading by sample enterprises appear to
have limited implications on the final settled price as well as their mark up and labour costs.
Table 45: Distribution of Margin between Buyers and Suppliers in the Value Chain
Overall Small Medium Large
Price Tag 21.3 21.9 21.5 20.1
% of tagged price 100.0 100.0 100.0 100.0
Buyer's Margin 78.9 82.2 77.8 72.4
Suppliers’ Margin 21.1 17.8 22.2 27.6
Source: CPD-RMG Study, 2017
7.4 Line and Worker Efficiency
There is wide variation in efficiency in sample enterprises. CPD-RMG study conducts an exercise
of line efficiency of selected enterprises. The line efficiency related data was collected from
selected set of enterprises for three to five days by collecting high frequency data from all the
workers of selected lines. The line efficiency varies widely both within and between lines (Table
47). The average line efficiency is found to be 52.2 with maximum and minimum values are 94.0
and 15.0 respectively. Although a large share of lines have ‘high’ level of efficiency, however a
sizable share of enterprises have very low level of efficiency (21 per cent) and another 21 per
cent have moderate level of efficiency. Such variance of efficiency would have adverse impact
on overall cost of production as well as their competitiveness.
Similarly, Workers’ individual efficiency is found with wide variation. While the average level of
efficiency is 62.21 with maximum and minimum values are 133 per cent and 7 per cent
respectively. Over 50 per cent workers have ‘high’ level of efficiency; on the other hand, the
rest half of workers have diverse level of efficiency.
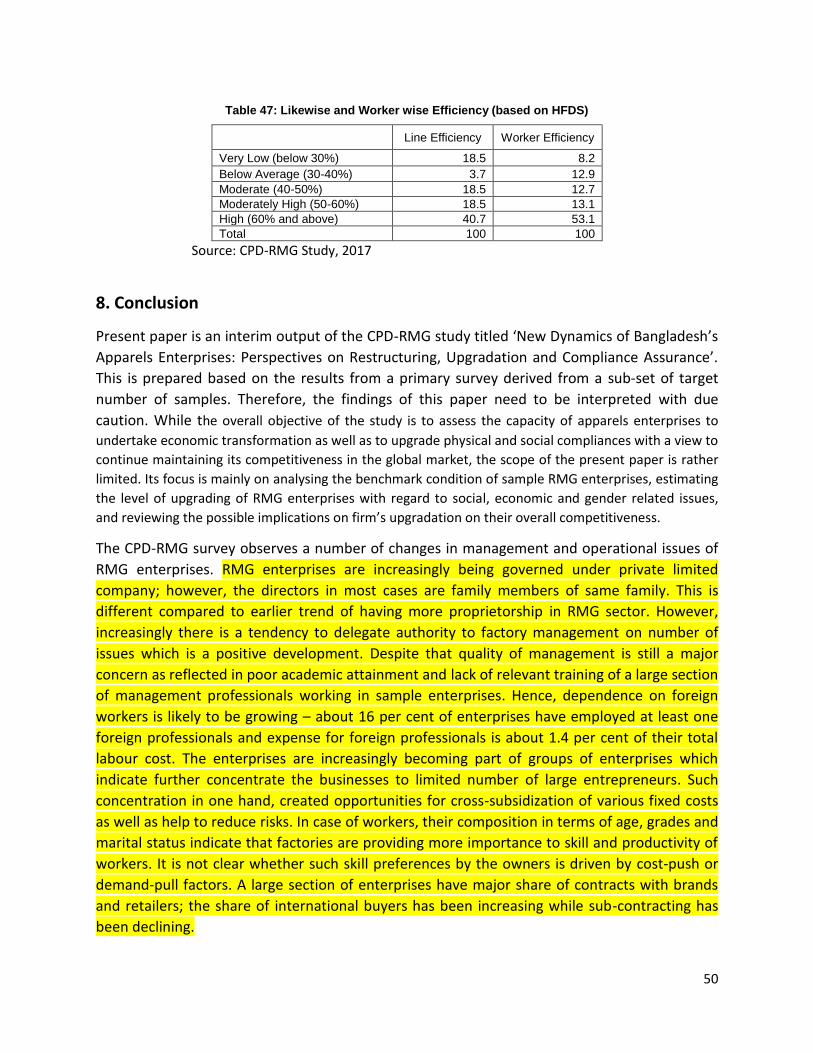
50
Table 47: Likewise and Worker wise Efficiency (based on HFDS)
Line Efficiency Worker Efficiency
Very Low (below 30%) 18.5 8.2
Below Average (30-40%) 3.7 12.9
Moderate (40-50%) 18.5 12.7
Moderately High (50-60%) 18.5 13.1
High (60% and above) 40.7 53.1
Total 100 100
Source: CPD-RMG Study, 2017
8. Conclusion
Present paper is an interim output of the CPD-RMG study titled ‘New Dynamics of Bangladesh’s
Apparels Enterprises: Perspectives on Restructuring, Upgradation and Compliance Assurance’.
This is prepared based on the results from a primary survey derived from a sub-set of target
number of samples. Therefore, the findings of this paper need to be interpreted with due
caution. While the overall objective of the study is to assess the capacity of apparels enterprises to
undertake economic transformation as well as to upgrade physical and social compliances with a view to
continue maintaining its competitiveness in the global market, the scope of the present paper is rather
limited. Its focus is mainly on analysing the benchmark condition of sample RMG enterprises, estimating
the level of upgrading of RMG enterprises with regard to social, economic and gender related issues,
and reviewing the possible implications on firm’s upgradation on their overall competitiveness.
The CPD-RMG survey observes a number of changes in management and operational issues of
RMG enterprises. RMG enterprises are increasingly being governed under private limited
company; however, the directors in most cases are family members of same family. This is
different compared to earlier trend of having more proprietorship in RMG sector. However,
increasingly there is a tendency to delegate authority to factory management on number of
issues which is a positive development. Despite that quality of management is still a major
concern as reflected in poor academic attainment and lack of relevant training of a large section
of management professionals working in sample enterprises. Hence, dependence on foreign
workers is likely to be growing – about 16 per cent of enterprises have employed at least one
foreign professionals and expense for foreign professionals is about 1.4 per cent of their total
labour cost. The enterprises are increasingly becoming part of groups of enterprises which
indicate further concentrate the businesses to limited number of large entrepreneurs. Such
concentration in one hand, created opportunities for cross-subsidization of various fixed costs
as well as help to reduce risks. In case of workers, their composition in terms of age, grades and
marital status indicate that factories are providing more importance to skill and productivity of
workers. It is not clear whether such skill preferences by the owners is driven by cost-push or
demand-pull factors. A large section of enterprises have major share of contracts with brands
and retailers; the share of international buyers has been increasing while sub-contracting has
been declining.
51
Gender imbalance is a concern in case of upper grades and professional jobs. Overall gender
balance among the production workers have gradually shifted from female-led towards male-
female balance (60.8 per cent). Despite the rise of machinery use particularly specialised
machines in different sections, a large part of the enterprises could not in the advanced
categories in machinery use. Thus, there is likely to have a gap in technology use between
enterprises. Workers’ organizations in the form of WPC is more visible in sample enterprises; however,
trade unions are almost non-existent in sample enterprises. There is growing number of enterprises with
having elected WPCs. These committees discussed various grievance issues including late payment of
wages, overtime, problems in fixing wage rate, over pressure for work, sexual harassment, leave
benefits, other financial benefits, workers’ association related problems or promotion related issues.
However, the discussion with the members of the WPC (conducted as part of the study) raises doubt
about effective functioning of these organisations.
The survey found that upgrading in RMG enterprises is of diverse nature. The upgradation is most
prominent in case of social issues particularly with regard to standards, non-discrimination and
employability point of view but very poor in case of rights. A moderate level of upgrading is discerned in
case of gender embedded upgrading. In contrast, economic upgrading of sample enterprises in general
are far behind particularly because of poor performance in product and functional upgrading. In other
words, post-Rana Plaza initiatives drive firms to undertake various kinds of upgrading; however, such
upgrading is visible mainly in social upgrading and limited or no progress is in case of economic
upgrading. The upgradation has link with size of enterprises where large enterprises are found to be
ahead of medium and small enterprises with regard to economic, social and gender related upgrading.
In case of social upgrading, all types of enterprises are found to be in better condition. In some cases,
woven enterprises are ahead of knit enterprises particularly in case of economic upgrading. There is
spatial variation in case of upgardation – Chittagong has sharp contrasts in terms of upgradation.
Enterprises located there are behind in terms of economic upgrading; on the other hand, they are ahead
of enterprises of other regions in case of social and gender embedded upgrading. Overall, an institution-
driven upgradation targeting social issues which had been undertaken over the last five years have yet
to establish its natural link with economic upgradtion and less so with gender related upgradation. In
that consideration, an unbalanced upgradation has been taken place with limited focus on economic
and technological issues, particularly those in small and medium enterprises. Such an unbalanced
growth is likely to have limited positive implications in the long run particularly in terms of firm’s overall
competitiveness especially those which are behind. This is evident in through firms’ performance in
terms of price and profit. The study found weak relationship between price settled at suppliers end and
their level of social upgrading, low share of suppliers in overall margin and deceleration of their rate of
profit. On the other hand, the survey shows that there are weaknesses in areas where the enterprises
claimed about upgradation. For example, a large section of workers received wages less than the
stipulated amount as per official rates. Such cases are evident in other areas.
As it appears that RMG sector has experienced two streams of changes in case of structure and
composition of enterprises as well as their level of upgradation. The structure of RMG enterprises give
an indication that a sizable share of enterprises have the potentials to ‘take off’ provided they could
improve in terms of technological readiness, improved management practices, further improvement of
52
workers skill particularly that of female workers etc. At the same time, there is apprehension that
without ensuring a balanced level of upgrading, a section of enterprises (small and enterprises outside
the group) would find difficult to maintain their competitiveness. In that context, there is specific role to
play by key stakeholders including government, manufacturers, buyers/brands and development
partners for ensuring balanced level of upgrading across all enterprises particularly small and medium
scale enterprises.
Annexure
Annex 1: Variables considered for Index Calculation
- Prices of Biggest Five Orders of Last Year
- Volumes of Biggest Five Orders of Last Year
- Presence of Product Development Facilities
- Total Sales Revenue
- Total Production Workers
- Total Investment in Machinery, Plants and Equipment
- Presence of IE Department
- Presence of warehousing facilities abroad
- Presence of wholeselling facilities abroad
- Presence of retailing facilities abroad
- Presence of design facilities
- Number of workers with disabilities
- Number of women working in the factory
- Total number of production workers
- Gender Preference in recruitment
- Gender preference in training
- Presence of trade union
- Presence of participatory committee
- Presence of profit sharing mechanism
- Benefits Received by Workers other than Salary
- Presence of regular contracts
- Provision of notice before worker layoffs
- Coverage of Worker Dismissal Procedure in Collective Agreement
- Presence of Safety Committee
- Safety Committee Related Training
53
- No. of Accidents
- No. of Workers Reporting Ill
- Providing Training to New Workers
- Training Provided to Established Workers
- Training provided in Institute
- Retraining provided in institute
- Factory Funding of Worker Training
- Total Estimated Expenditure on Fire Safety
- Total Estimated Expenditure on Electrical Safety
- Total Estimated Expenditure on Structural Safety
- Total Expenditure on Fire Safety till 2016
- Total Expenditure on Electrical Safety till 2016
- Total Expenditure on Structural Safety till 2016
- Total Number of Female Respondents
- Total Number of Female Respondents reporting they received training
- Total Number of Female Respondents reporting they received formal training
- Total Number of Female Respondents reporting they received institutional training
- Female members in Safety Committee
- Number of female workers reporting ill
- Number of female workers reporting they have regular employment contracts
- Number of female workers reporting they receive notice before retrenchment
- Notice Period
- Number of female employees
- Number of female disabled workers
- HR Policy with provisions for non-discrimination
- Presence of Maternity Leave Provision
- Day Care Facility
- Provision of Day Care Facility in HR Policy
- Department/committee for sexual harassment protection
- Presence of female members in Department for harassment protection
- Written harassment protection policy
- Fringe benefits received (as reported by workers)
References
1. Bangladesh Bureau of Statistics (BBS). (2017). Quarterly Labour Force Survey Bangladesh 2015-16, Ministry of Planning, Dhaka.
2. Bangladesh Bureau of Statistics (BBS) (2012). Survey of Manufacturing Industries 2012 (SMI 2012), Ministry of Planning, Dhaka.
3. Barrientos, S (2013), “Corporate purchasing practices in global production networks: A socially contested terrain”, Geoforum, 44(1), pp 44-51.
54
4. Barrientos, S and Smith, S (2007), “Do workers really benefit from ethical trade? Assessing codes of labour practice in global production systems,” Third World Quarterly, 28(4), 713-29.
5. Barrientos, S., Gereffi, G. and Rossi, A. (2011). ‘Economic and Social Upgrading in Global Production Networks: A New Paradigm for a Changing World’. International Labour Review 150(3–4), 319–40.
6. Barrientos, S., Gereffi, G. and Rossi, A. (2011). ‘Economic and Social Upgrading in Global Production Networks: A New Paradigm for a Changing World’. International Labour Review 150(3–4), 319–40.
7. Barrientos, S., Mayer, F., Pickles, J., & Posthuma, A. (2011), “Decent work in global production networks: Framing the policy debate”, International Labour Review, 150(3- 4), 297-317.
8. Barrientos, Stephanie and Visser, Margareet (2012), “South African horticulture: opportunities and challenges for economic and social upgrading in value chains,” Working Paper 12, Capturing the Gains.
9. Bernhardt, Thomas and William Milberg (2012), “International trade and the relation between economic and social upgrading,” Capturing the Gains, vol. Summit Briefing, December.
10. Bhaskaran, Resmi, Nathan, Dev, Philips, Nicola and Upendranath, C. (2013), “Vulnerable workers and labour standards (non-)compliance in global production networks: home-based child labour in Delhi’s garment sector”, Working Paper 16, Capturing the Gains.
11. Bhattacharya, Debapriya and K. G. Moazzem. 2013. Least Developed Countries (LDCs) in the Global Value Chain (GVC): Trends, Determinants and Challenges, CPD Working Paper 104, Centre for Policy Dialogue (CPD), Dhaka
12. Brambilla, I., D. Lederman, and G. Porto (2012), ―Exports, Export Destinations, and Skills, American Economic Review.VOL. 102, NO. 7, DECEMBER 2012 (pp. 3406-38)
13. Breinlich, H. and C. Criscuolo (2011), ―International Trade in Services: A Portrait of Importers and Exporters‖, Journal of International Economics, Vol. 84(2), pp. 188-206.
14. Brown C. and J. Medoff (1989), “The employer size wage effect,” Journal of Political Economy, Vol. 97, pp. 1027-1059
15. Carr, M. and Chen, M. (2004). Globalisation, Social Exclusion and Work: With Special Reference to Informal Employment and Gender. Integration Working Paper No. 20 (Geneva: ILO).
16. Chen, M., Sebstad, J. and O’Connel, L. (1999). ‘Counting the Invisible Workforce: The Case of Homebased Workers’. World Development 27(3), 603–10.
17. Chen, M., Sebstad, J. and O’Connel, L. (1999). ‘Counting the Invisible Workforce: The Case of Homebased Workers’. World Development 27(3), 603–10.
18. Coe, Neil M and Hess, Martin (2013), “Economic and social upgrading in global logistics,” Working Paper 39, Capturing the Gains.
19. Collins, J. L. (2003). Threads: Gender, Labor and Power in the Global Apparel Industry (Chicago and London: Chicago University Press).
20. Evers, Barbara, Amoding, Flavia and Krishnan, Aarti (20140, “Social and economic
upgrading in floriculture global value chains: flowers and cuttings GVCs in Uganda”, Capturing the Gains, Working Paper 42.
55
21. Evers, Barbara, Opondo, Maggie, Barrientos, Stephanie, Krishnan, Aarti, Amoding, Flavia and Ndlovu, Lindani (2014), “Global and regional supermarkets: implications for producers and workers in Kenyan and Ugandan horticulture”, Working Paper 39, Capturing the Gains.
22. Freeman, Richard B. and James L. Medoff, 1984. What Do Unions Do? New York: Basic Books.
23. Funcke, André, Mascarenhas, Gilberto, Wilkinson, John and Pereira, Paulo (2014), “Social and economic up and downgrading in Brazil’s hortifruiticulture,” Capturing the Gains Working Paper 41
24. Gereffi, G “International trade and industrial upgrading in the apparel commodity chain”. Journal of International Economics, 1999, 48, pp 37-70.
25. Gereffi, G and Lee, J (2016), “Economic and Social Upgrading in Global Value Chains and Industrial Clusters: Why Governance Matters”, Journal of Business Ethics, January 2016, Volume 133, Issue 1, pp 25-38.
26. Gereffi, Gary (1995). Global Production Systems and Third World Development. In B. Stallings (Ed.), Global Change, Regional Response: The New International Context of Development (pp. 100-142). Cambridge; New York and Melbourne: Cambridge University Press.
27. Gereffi, Gary (1999) “International trade and industrial upgrading in the apparel commodity chain”, Journal of International Economics, Vol. 48, No. 1, pp 37-70.
28. Haidar, J.I. (2012), ―Trade and Productivity: Self-Selection or Learning-by-Exporting in India‖, Economic Modeling, Vol. 29(5), pp. 1766-1773.
29. Haque, A.K.E. and E. Bari (2015). Garment Workers in Bangladesh: Social Impact of the Garment Industry. Technical Report, August, 2015. Asian Center for Development, Dhaka
30. Hale, A. and Wills, J. (eds) (2005). Threads of Labour (London: Blackwell Publishing).
31. Hale, A. and Wills, J. (eds) (2005). Threads of Labour (London: Blackwell Publishing).
32. Helpman, E., M. Melitz, and S. Yeaple (2004), ―Exports Versus FDI with Heterogeneous Firms, American Economic Review, Vol. 94(1), pp. 300-316.
33. Humphrey, J. and Schmitz, H. (2000) Governance and Upgrading: Linking Industrial Cluster and Global Value Chain Research, IDS Working Paper 120, Brighton: IDS
34. International Labor Organization (2013), “Can better working conditions improve the performance of SMEs? An International Literature Review,” International Labor Office, Geneva.
35. ILO’s International Labor Organization (2017) Asia-Pacific Garment and Footwear Sector Research Note (Issue 8), October 2017).
36. Khondaker Golam Moazzem & Farzana Sehrin (2016) "Economic Upgrading in Bangladesh’s Apparel Value Chain during the Post-MFA Period," South Asia Economic Journal, Institute of Policy Studies of Sri Lanka, vol. 17(1), pages 73-93, March.
37. Knorringa, P. and Pegler, L. (2006). ‘Globalisation, Firm Upgrading and Impacts on Labour’. Tijdschrift voor economische en sociale geografie 97(5), 470–79.
38. Lee, Joonkoo, Gary Gereffi and Dev Nathan (2013), “Mobile Phones: Who benefits in shifting global value chains?” Capturing the Gains, vol. Revised Summit Briefin, N° 6.1, February.
56
39. Lester, Richard (1967), “Pay Differentials by Establishment Size,” Industrial Relations, Vol. 7, pp. 57-67.
40. Maree, Johann, Piontak, Rachel, Omwansa, Tonny, Shinyekwa, Isaac and Kamoth, Njenga (2013), “Developmental uses of mobile phones in Kenya and Uganda”, Working Paper 39, Capturing the Gains.
41. Moazzem. K. G. and S. R. Shimon. 2007. “Technological Restructuring in the Apparel Sector of Bangladesh in View of MFA Phase Out: Impact and Implications” published in the Proceedings of International Technology, Education and Development Conference, Spain, March
42. Moazzem, K. G. 2014. “Transformation of the Export-oriented, Ready-made Garment Sector of Bangladesh: Changes, Challenges and the Future Outlook” in Dirk Willem te Velde (ed.) Enhancing Productivity in Bangladesh’s Garment Sector: Current Policy and Research Debates, DEGRP Policy Essays, September 2014
43. Moazzem, K.G. and K.K. Bashak (2015). ‘Margin and Its Relation with Firm Level Compliance: Illustration on Bangladesh Apparel Value Chian’ CPD Working Paper. CPD, Dhaka
44. Nachum Lilac, Nazneen Ahmed and Yoshiteru Uramoto (2017). Corporate Governance & Sustainability Of The Global Value Chain: Bangladesh Ready-Made Garment Industry, available at http://bids.org.bd/uploads/events/almanac2017/TS%206_P3_Nazneen%20Ahmed.pdf
45. Nathan, Dev and Sandip Sarkar (2011), “Blood on your mobile phone? Capturing the gains for artisanal miners, poor workers and women,” Capturing the Gains, vol. Briefing Note 2, February.
46. Oxfam International (2004). Trading Away Our Rights: Women Working in Global Supply Chains (Oxford: Oxfam International).
47. Oxfam International (2004). Trading Away Our Rights: Women Working in Global Supply Chains (Oxford: Oxfam International).
48. O’Rourke Group of Partners (2011), Benchmarking the Competitiveness of Nicaragua’s Apparel Industry, ProIncaragua Investment Promotion Agency, USA
49. Plank, Leonhard and Staritz, Cornelia (2013), “‘Precarious upgrading’ in electronics global production networks in Central and Eastern Europe: the cases of Hungary and Romania”, Working Paper 31, Capturing the Gains.
50. Plank, Leonhard, Rossi, Arianna and Staritz, Cornelia (2014), “What Does ‘Fast Fashion’ Mean for Workers? Apparel Production in Morocco and Romania” in Rossi, Luinstra and Pickles (ed.) Towards Better Work: Understanding Labor in Apparel Global Value Chains
51. Rahman, Mustafizur, D Bhattacharya and K G Moazzem (2008), Bangladesh Apparels Sector in Post-MFA Period, Centre for Policy Dialogue (CPD), Dhaka
52. Raworth, K. and Kidder, T. (2009). ‘Mimicking “Lean” in Global Value Chains – It’s the Workers Who Get Leaned On’. In J. Bair (ed.), Frontiers of Commodity Chain Research (Stanford: Stanford University Press).
53. Raworth, K. and Kidder, T. (2009). ‘Mimicking “Lean” in Global Value Chains – It’s the Workers Who Get Leaned On’. In J. Bair (ed.), Frontiers of Commodity Chain Research (Stanford: Stanford University Press).
54. Rossi, Arianna (2013), “Does Economic Upgrading Lead to Social Upgrading in Global Production Networks? Evidence from Morocco,” World Development, vol. 46, pp 223 – 233.
57
55. Salido Marcos, Joaquín & Bellhouse, Tom (2016), “Economic and Social Upgrading: Definitions, connections and exploring means of measurement,” Sede Subregional de la CEPAL en México (Estudios e Investigaciones) 40096, Naciones Unidas Comisión Económica para América Latina y el Caribe (CEPAL).
56. Sarkar, Sandip, Mehta, Balwant S and Nathan, Dev (2013), “How social upgrading drives economic upgrading by Indian IT majors: the case of telecom IT services”, Working Paper 27, Capturing the Gains.
57. Sato, Yuri and Fujita, Mai (2009), “Capability Matrix: A Framework for Analyzing Capabilities in Value Chains”, IDE Discussion Paper No. 219.
58. Schmitz, H (2006). Learning and Earning in Global Garment and Footwear Chains. The European Journal of Development Research, 18(4): 546-571.
59. Schmitz, H. (2004). Local enterprises in the global economy: Issues of governance and upgrading. Cheltenham, UK: Edward Elgar.
60. Schmitz, H. (2006). Learning and earning in global garment and footwear chains. European Journal of Development Research, 18(4), 546–571.
61. Schmitz, Hubert (2004), “Local Upgrading in Global Chains: Recent Findings,” Paper to presented at the DRUID Summer Conference 2004 on Industrial Dynamics, Innovation and Development
62. Selwyn, Ben (2013), “Social Upgrading and Labour in Global Production Networks: A Critique and an Alternative Conception”, Competition and Change, Vol. 17 No. 1, February 2013, 75–90.
63. Shalini, R. T. 2009. “Economic cost of occupational accidents: Evidence from a small island economy”, in Safety Science, Vol. 47, No. 7, pp. 973–979
64. Sobhan, Rehman (2014). ‘Readymade Garments in Bangladesh: Lessons from Rana Plaza’ in the AmCham, Journal of the American Chamber of Commerce in Bangladesh, Vol.7, No.1, January.
65. Standing, G. (1999). ‘Global Feminization through Flexible Labour: A Theme Revisited’. World Development 27(3), 583–602.
66. Staritz, Cornelia and Morris, Mike, “Local embeddedness and economic and social upgrading in Madagascar’s export apparel industry”, Working Paper 21, Capturing the Gains.
67. USAID (2006), “Lessons Learned on MSE Upgrading in Value Chains”, USAID.
68. Verhoogen, Eric A (2007), “Trade, Quality Upgrading and Wage Inequality in the Mexican Manufacturing Sector,” Discussion Paper No. 6385, CEPR.