reducing ongoing product design decision-making bias
TRANSCRIPT
Reducing Ongoing Product Design Decision-Making Bias�
Michael Antioco, Rudy K. Moenaert, and Adam Lindgreen
The objective of this exploratory study is to add to our understanding of ongoing
product design decision-making to reduce eventual decision-making bias. Six re-
search questions are formulated with the aim to establish if and how functional
membership and informal patterns of communication within an organization influ-
ence whether and why employees are willing to engage in product design modifi-
cations. We selected as a field site for our study an industrial company that had an
internal research and product development operations and where the employees
were located on the same site. A three-step approach within the manufacturing case
company was designed: (1) In-depth interviews were carried out with managers and
employees; (2) a survey questionnaire was sent out to all employees involved with a
specific product that is subject to potential design modifications; and (3) a post hoc
group feedback session was organized to further discuss our findings with the man-
agement. First, analysis of the nine in-depth interviews establishes a taxonomy of
product design decisions involving four types of criteria; product-related, service-
related, market-related, and feasibility-related criteria explain why employees
would engage or not in product design modifications. Second, it is demonstrated
that functional membership has a significant influence on the concern for these
decision-making criteria as well as on the decision to proceed or not with product
design modifications. In other words, functional membership influences whether and
why employees are more or less willing to make product design modifications. In this
manufacturing company, a global industrial player, the differences in concern ap-
pear especially for service- and market-related criteria and pertain particularly to
the research and development (R&D) and service function. Overall, even though the
perceived performance of the specific product under study did not differ significantly
among the different departments, it is observed that R&D employees were signifi-
cantly less in favor of proceeding with product design modifications than other em-
ployees were. Third, using UCINET VI software, we provide some explanations for
this finding. It is shown that informal patterns of communication (i.e., employee
degree centrality) operate a situational opportunity to make modifications to an
existing product and a cognitive opportunity influencing the decision to modify
product design following an inverted U-shaped function. Ultimately, we derive
practical guidelines for an ideal product–team composition to reduce product design
decision-making bias.
�The authors thank Ad de Jong, Joelle Vanhamme, Jeroen Schepers, and the JPIM anonymous reviewers for their very constructive commentson earlier versions of this article. Also, thanks are given to all employees from the case company for their collaboration. Finally, special thanks tothe JPIM editor for his suggestions and responsiveness.
Address correspondence to: Michael Antioco, Department of Marketing, IESEG School of Management (LEM, UMR CNRS 8179), 3 Rue dela Digue, 59000 Lille, France. Tel.:þ 33 (0) 320 545 892. Fax:þ 33 (0) 320 544 786. E-mail: [email protected].
J PROD INNOV MANAG 2008;25:528–545r 2008 Product Development & Management Association
Introduction and Research Background
Many products, although having gone
through an extensive new product devel-
opment (NPD) process, fail once in
the market (Carbonell, Rodriguez, and Aleman,
2004; Cooper, 2001). This was the case for the
early generation of Ericsson mobile phones: though
they often incorporated superior technology, the
aesthetic and ergonomic appeal of these phones was
not successful (Loudon, 2006). Product design is
also essential for manufacturers: it determines a sig-
nificant part of manufacturing costs (Bloch, 1995).
The objective of this study is to add to the under-
standing of the product design decisions employees
make.
NPD is a complex and uncertain process, involving
various functional areas exchanging information to
work their way through several successive stages to
bring a product to the market (Song and Montoya-
Weiss, 1998). The importance of these stages varies
according to the newness of the product (Song and
Montoya-Weiss, 1998). The present study focuses ex-
clusively on incremental design modifications to a
product—that is, modifications made after the first
commercialization of a product. These incremental
product design decisions are thus ongoing. They are
defined as the willingness of employees to adapt,
refine, or enhance the design of a commercialized
product (ibid.).
Ongoing product design decision-making can be
relatively obscure (Englund and Graham, 1999). Two
exploratory studies recently identified the product
design decision-making criteria considered between
each of the stages of the NPD process (Carbonell,
Rodriguez, and Munuera, 2004; Zahay, Griffin, and
Fredericks, 2004). Prior research demonstrates that
the market opportunity and analysis phase is partic-
ularly important for incremental product design mod-
ifications. The firm is likely to obtain customer and
employee feedback on the performance of the com-
mercialized product and the needs and desires of cus-
tomers (Song and Montoya-Weiss, 1998). In the
present paper, we first seek to establish which deci-
sion-making criteria are considered by manufacturers
as they work their way from the market opportunity
and analysis stage to the design stage of the NPD
process. Second, we contribute to the literature by
estimating if and how much concerns for these deci-
sion-making criteria differ between (1) the different
departments of an organization and (2) employees’
position in the company’s informal communication
network. Social network analysis is used to explore
the influence of informal communication networks
on product design decisions. Justifying this approach,
several researchers have put forward the idea that
‘‘informal contacts often substitutes for formal
new product processes’’ (Griffin and Hauser, 1996,
p. 205).
The Stages of NPD and Product Design Decision-Making Criteria
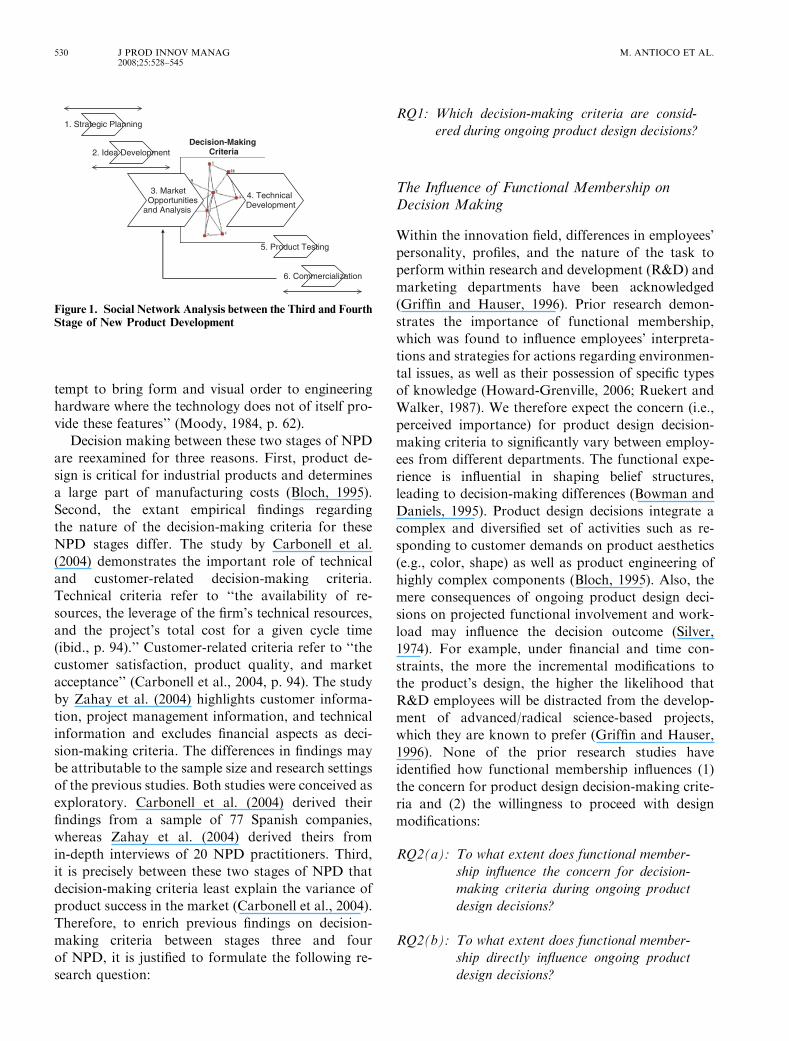
Though it is difficult to reduce the NPD process to
a strict serial diagram, the generic NPD process
typically consists of six stages (Song and Montoya-
Weiss, 1998) (Figure 1). In the third stage—market
opportunities and analysis—product features and
attributes as well as development feasibility are iden-
tified based on market trends, competitor products,
and customer needs (Perks, Cooper, and Jones, 2005).
The fourth stage of NPD refers to the design,
engineering, and building of the desired physical prod-
uct entity. The term design therefore can refer to both
engineering and industrial design, which ‘‘seeks to rec-
tify the omissions of engineering; [it is] a conscious at-
BIOGRAPHICAL SKETCHES
Dr. Michael Antioco is assistant professor of marketing at IESEG
School of Management in Lille, France. His main research interests
are new product development, organizational behavior, and cross-
functional cooperation. He has published in Journal of the Academy
of Marketing Science, Journal of Business & Industrial Marketing,
Journal of Business Ethics, and International Journal of Retail &
Distribution Management.
Dr. Rudy K. Moenaert is professor of strategic marketing at
TiasNimbas Business School (Tilburg University) and part-time
professor of strategic marketing at Nyenrode University in the
Netherlands. He is a sought-after executive teacher on the subjects
of strategy, marketing, and innovation management and advises
business-to-business companies on their marketing strategies. His
main research interests are strategic marketing and the marketing
and management of technological innovation. His work is published
inManagement Science, Journal of Product Innovation Management,
Journal of the Academy of Marketing Science, Journal of Manage-
ment Studies, Industrial Marketing Management, Journal of Service
Research, and Information & Management, among others.
Dr. Adam Lindgreen is professor of strategic marketing at Hull
University Business School. He is published in Journal of the Acad-
emy of Marketing Science, Business Horizons, Industrial Marketing
Management, Journal of Business Ethics, and Psychology & Mar-
keting, among others. His research interests include business and
industrial marketing, consumer behavior, relationship and value
management, and corporate social responsibility.
REDUCING ONGOING PRODUCT DESIGN DECISION-MAKING BIAS J PROD INNOV MANAG2008;25:528–545
529
tempt to bring form and visual order to engineering
hardware where the technology does not of itself pro-
vide these features’’ (Moody, 1984, p. 62).
Decision making between these two stages of NPD
are reexamined for three reasons. First, product de-
sign is critical for industrial products and determines
a large part of manufacturing costs (Bloch, 1995).
Second, the extant empirical findings regarding
the nature of the decision-making criteria for these
NPD stages differ. The study by Carbonell et al.
(2004) demonstrates the important role of technical
and customer-related decision-making criteria.
Technical criteria refer to ‘‘the availability of re-
sources, the leverage of the firm’s technical resources,
and the project’s total cost for a given cycle time
(ibid., p. 94).’’ Customer-related criteria refer to ‘‘the
customer satisfaction, product quality, and market
acceptance’’ (Carbonell et al., 2004, p. 94). The study
by Zahay et al. (2004) highlights customer informa-
tion, project management information, and technical
information and excludes financial aspects as deci-
sion-making criteria. The differences in findings may
be attributable to the sample size and research settings
of the previous studies. Both studies were conceived as
exploratory. Carbonell et al. (2004) derived their
findings from a sample of 77 Spanish companies,
whereas Zahay et al. (2004) derived theirs from
in-depth interviews of 20 NPD practitioners. Third,
it is precisely between these two stages of NPD that
decision-making criteria least explain the variance of
product success in the market (Carbonell et al., 2004).
Therefore, to enrich previous findings on decision-
making criteria between stages three and four
of NPD, it is justified to formulate the following re-
search question:
RQ1: Which decision-making criteria are consid-
ered during ongoing product design decisions?
The Influence of Functional Membership onDecision Making
Within the innovation field, differences in employees’
personality, profiles, and the nature of the task to
perform within research and development (R&D) and
marketing departments have been acknowledged
(Griffin and Hauser, 1996). Prior research demon-
strates the importance of functional membership,
which was found to influence employees’ interpreta-
tions and strategies for actions regarding environmen-
tal issues, as well as their possession of specific types
of knowledge (Howard-Grenville, 2006; Ruekert and
Walker, 1987). We therefore expect the concern (i.e.,
perceived importance) for product design decision-
making criteria to significantly vary between employ-
ees from different departments. The functional expe-
rience is influential in shaping belief structures,
leading to decision-making differences (Bowman and
Daniels, 1995). Product design decisions integrate a
complex and diversified set of activities such as re-
sponding to customer demands on product aesthetics
(e.g., color, shape) as well as product engineering of
highly complex components (Bloch, 1995). Also, the
mere consequences of ongoing product design deci-
sions on projected functional involvement and work-
load may influence the decision outcome (Silver,
1974). For example, under financial and time con-
straints, the more the incremental modifications to
the product’s design, the higher the likelihood that
R&D employees will be distracted from the develop-
ment of advanced/radical science-based projects,
which they are known to prefer (Griffin and Hauser,
1996). None of the prior research studies have
identified how functional membership influences (1)
the concern for product design decision-making crite-
ria and (2) the willingness to proceed with design
modifications:
RQ2(a): To what extent does functional member-
ship influence the concern for decision-
making criteria during ongoing product
design decisions?
RQ2(b): To what extent does functional member-
ship directly influence ongoing product
design decisions?
1. Strategic Planning
2. Idea Development
3. MarketOpportunities
and Analysis
4. Technical Development
5. Product Testing
6. Commercialization
Decision-Making Criteria
Figure 1. Social Network Analysis between the Third and FourthStage of New Product Development
530 J PROD INNOV MANAG2008;25:528–545
M. ANTIOCO ET AL.
The Influence of Informal Patterns ofCommunication on Decision Making
Information acquisition in the market opportunity
and analysis stage of NPD and information dissemi-
nation can reveal interesting findings on the commu-
nication patterns between employees. These patterns
are explained by neither NPD theory nor market ori-
entation, which here is defined as information gener-
ation, dissemination, and use (Jaworski and Kohli,
1993). Effectively managed market intelligence from
customers and competitors creates value by helping
companies develop successful new products (Griffin
and Hauser, 1996). Highlighting the importance of
communication patterns in managing marketing in-
telligence, Jaworski and Kohli (1993, p. 48) note that
the use of market intelligence can be improved by
‘‘designing appropriate dissemination processes.’’
Previous communication studies have mostly tack-
led information dissemination between dyads (Mo-
enaert and Souder, 1990) or triads (Ruekert and
Walker, 1987; Song, Montoya-Weiss, and Schmidt,
1997) by measuring the frequency of communication
using key informants without making further precis-
ions on the communication patterns of the constituent
individuals embedded in the company. These studies
assume that each department involved in NPD brings
a fair contribution to the development of the product.
A more holistic approach, using communication net-
work analysis, enables the identification of employees
who are more degree central in the communication
processes. Degree centrality is defined as ‘‘the number
of individuals with whom an actor is directly con-
nected’’ (Ronchetto, Hutt, and Reingen, 1989, p. 60).
The more an actor is connected (i.e., the more degree
central he or she will be), the more information—and
therefore power—the actor will have (Powell, Koput,
and Smith-Doerr, 1996). Compared to a dyadic rela-
tionship, Iacobucci and Hopkins (1992, p. 5) define a
network as ‘‘a composite of a larger number of actors
and the pattern of relationships that ties them to-
gether.’’ Rather than focusing on personal attributes,
the network approach takes the standpoint that the
internal structure of collaboration and information
exchanges influences decision-making. Such an ap-
proach to communication helps identify informal
dominance within the communication network and
in the decision-making process. This is in line with
the theory of power influence (Pfeffer, 1981), which
has also shown its importance in NPD between the
marketing and the R&D departments (Atuahene-
Gima and Evangelista, 2000). Influence refers to
‘‘the degree to which information offered by partici-
pants in the NPD process leads to changes in behav-
iors, attitudes, and/or actions of the recipient’’ (ibid.,
p. 1269). Therefore, the following research question is
formulated:
RQ3: Which employees are relatively more central
during product information exchanges?
Individuals embedded in a communication net-
work can learn from others (knowledge absorption)
but also can create knowledge by teaching others
(knowledge creation) (Antonelli, 1997). To unravel
knowledge flows, we first establish who the main
knowledge creators and absorbers are and where
they are positioned in the informal communication
network. Further, it is posited that the degree cen-
trality of actors in the network will have a dual effect
on product design decisions. It is expected that the
mere proximity to other central actors may influence
central actors to be more in favor of product design
modifications because they feel more involved and,
therefore, concerned with product success (Salancik
and Pfeffer, 1978). However, it is also posited that
the impact of degree centrality on product design
decisions may be mediated by experimental learning
or knowledge absorption (Kayes, Kayes, and Yam-
azaki, 2005). Experimental learning ‘‘focuses on
how individuals draw on direct experience with the
world to create new knowledge’’ (ibid., p. 89). Strong
ties in a network have been significantly linked to
the receipt of useful information (Levin and Cross,
2004). The more interactions with employees in the
network (i.e., the higher degree centrality) the higher
the experimental learning will be. However, too
much experimental learning may negatively affect
product design decisions. Indeed, organizing and
creating frameworks for understanding knowledge is
a necessity to reach experimental learning (Kayes,
Kayes, and Yamazaki, 2005), and information over-
load may complicate the decision-making process and
lead to higher product design change resistance (Yen
et al., 2006). Therefore, an inverted U-shaped rela-
tionship between the level of experimental learning
and favorable product design decisions is expected.
The three concluding research questions are the
following:
RQ4: Does employee degree centrality during prod-
uct information exchanges lead to more fa-
vorable ongoing product design decisions?
REDUCING ONGOING PRODUCT DESIGN DECISION-MAKING BIAS J PROD INNOV MANAG2008;25:528–545
531
RQ5: Does employee degree centrality during prod-
uct information exchanges lead to higher ex-
perimental learning?
RQ6: Is there an inverted U-shaped function between
the amount of experimental learning and fa-
vorable ongoing product design decisions?
Methodology
Communication Network Case Study & Selection ofthe Field Case
Qualitative methods are appropriate when studying
complex phenomena and when there is a need to take
into account numerous variables for studying the is-
sues at hand (Eisenhardt, 1989). One-site sampling
was chosen due to the complexity and nature of the
research questions (ibid.): A high response rate is im-
perative for social network analysis (Tsai and Goshal,
1998). With the help of two professional consultants,
we selected as a field site for our study an industrial
company that had an internal research and product
development operations and where the employees
were located on the same site. In addressing the re-
search questions, it was mandatory that the field site
invested in in-house product development. Moreover,
we chose an industrial company since product design
modifications occur frequently in such contexts as a
consequence of customer requests or order specifica-
tions (Lee et al., 2004). Providing a competitive offer-
ing requires the integration of inputs from different
functions (e.g., product development, process engi-
neering, marketing and sales, production). This was
best served by having the respondents located on the
same site.
The company that was selected is one of the world’s
leading suppliers of distribution systems. In 2006, the
company reached consolidated net sales and net in-
come of approximately $600 million and $20 million,
respectively. To reach the company’s growth objec-
tive, management continued investing in R&D. The
specific project under study, Multisorter, is a solution
for sorting mixed flows from small to large products.
Seven departments are involved in developing, build-
ing, selling, and servicing the product: R&D, (opera-
tions) engineering, (operations) installation, systems,
sales, service delivery, and service development. Clar-
ifying the roles, the role of engineering is to build
the product. The service delivery department provides
basic services such as maintenance, system updates,
and repair. It also offers additional services such
as training, logistics management, and audits. The
systems department develops the software that mon-
itors and manages the tracking and dispatching of the
products.
Research Design
To examine the five central research questions of this
study, a three-step approach within the manufactur-
ing case company was designed:
1. In-depth interviews were carried out with manag-
ers and employees (RQ1).
2. A survey questionnaire was sent out to all employ-
ees involved with a specific product that is subject
to potential design modifications (RQ2–6).
3. A post hoc group feedback session was organized
to further discuss the study’s findings with the
management.
The heads of the seven departments as well as em-
ployees involved with the Multisorter project were in-
terviewed. Interviews lasted between 45 and 60
minutes. The interviewees had been with the company
for 10.8 years on average. Interviewees were asked
individually to discuss and establish decision-making
criteria that would be evaluated during product design
decisions. Interviewees were four senior managers
(sales, R&D, engineering, and systems), three middle
managers (service, service development, and opera-
tions installation), and two employees (service and
R&D).
The survey questionnaire consisted of three sec-
tions. The first section collected personal information
such as name, gender, department, formal job rank
(five levels), and tenure. Section two inquired about
the employees’ communication frequencies with col-
leagues and customers regarding the performance of
Multisorter. Employees were asked to name the top-
three formal decision makers regarding product
design decisions. The distribution of Multisorter
customers and employees is presented in Table 1.
The 46 employees and 8 customers represent the prod-
uct’s complete network. In the third part of the ques-
tionnaire, rating scales were used to assess (1) product
design decisions, (2) the extent of concern for the
decision-making criteria identified during the inter-
views, and (3) the relative performance of the current
product against those of competitors.
532 J PROD INNOV MANAG2008;25:528–545
M. ANTIOCO ET AL.
The group feedback session was organized to pres-
ent the findings to the company. Members of man-
agement were invited to discuss the findings with us
and their colleagues. This feedback session helped to
validate the study’s findings regarding the structure of
the communication network as well as to further ex-
plain why some departments experienced difficulties
in communicating with one another.
The Unit of Analysis and Data Collection
The frequency of information exchanges between ac-
tors of the network regarding customer and employee
feedback on Multisorter is under study. As previously
described, data were collected via a survey question-
naire distributed via internal mail. After two e-mail
reminders and personal telephone calls, a response
rate of 92.6% was achieved. Regarding the inclusion
of missing employees it was assumed that if X stated
that he or she communicated x times with the missing
employee Y, then Y would have stated the same com-
munication frequency x (Borgatti and Molina, 2003).
For all other employees, the number of symmetric
pairs was 73.87%. Given that the measurement for
communication frequency did not include direction-
ality, if employees X and Y stated different frequen-
cies of interactions, both employees were contacted to
cross-validate their initial input to increase the num-
ber of symmetric pairs to 100%.
Measurement Properties
Communication patterns. Employees were asked to
indicate how frequently they effectively interact with
colleagues and customers about the current perfor-
mance of Multisorter. Also, each employee was asked
to rate (out of 10) how comprehensible the informa-
tion generated during these interactions was and
whether interactions communicated important (i.e.,
useful) detail to them about Multisorter’s perfor-
mance. Based on these measures, the architecture of
the communication patterns and employees regarded
as the most knowledgeable are identified. This means
that, based on others’ reporting, each employee is
given a knowledge creation score and, based on self-
reporting, a knowledge absorption score. If the total
number of employees spoken to by employee i is j, and
the scores given by j employees to employee i to es-
tablish how much learning happens during their in-
teraction is xA [1;10], the knowledge creation score of
i is calculated as follows:Pð1!jÞ xi. The knowledge
absorption score of employee i is simply the sum of all
x’s that employee i allocated to his or her interactions
with j employees of the network he or she communi-
cates with:PðiÞ xi!j. This score helps us answer RQ5
and RQ6.
To study employee involvement in information
sharing we refer to degree centrality (Freeman,
1979), which is used to compare actor centrality
within a single network (Ahuja, Galletta, and Carley,
2003). Actor degree centrality calculations were per-
formed using UCINET VI software (Borgatti, Ever-
ett, and Freeman, 2002). A social network matrix is a
binary matrix with senders on each row and recipients
on each column. The presence of a link between two
employees is represented by a 1 in that cell given that
directionality was not conferred to information ex-
changes. With frequency of communication measured
on a seven-point rating scale, the interviewees were
first consulted to determine an appropriate cutoff
point to assign a 1 or a 0 on each cell of the matrix.
On that basis, a 1 was assigned if the communication
frequency was equal or greater than once a month.
Decision makers. Each employee was asked to
name the top-three formal decision makers regarding
modifications to the design of Multisorter. The rea-
sons for doing so were (1) to identity the functional
membership of formal leaders and, thus, a depart-
ments’ formal influence in decision making; and (2) to
compare the current composition of the formal leader
group with that of a group, which would reduce de-
cision-making bias.
Product design decisions and decision-making crite-
ria. The scale measuring product design decisions was
Table 1. Sample of Interviewees Involved with Multi-sorter
Customers and Departments Frequency Percentage
Customers 8 14.8Systems 4 7.4Engineering 10 18.5Installation 2 3.7Research and Development 10 18.5Sales 7 13Service Delivery 11 20.4Service Development 2 3.7Total 54 100
REDUCING ONGOING PRODUCT DESIGN DECISION-MAKING BIAS J PROD INNOV MANAG2008;25:528–545
533
based on that of Song and Montoya-Weiss (1998,
p. 126). The scale product design decisions (Appendix,
Table A1) is reflective, and the findings show an alpha
reliability coefficient of 0.79 (Cronbach, 1951). Em-
ployees were surveyed about hypothetical modifica-
tions to an existing product given that post hoc data
regarding a product already gone through the product
decision-making process could be affected by belief
revision (Hogarth and Einhorn, 1989). Regarding de-
cision-making criteria, employees were asked to what
extent each criterion identified during the in-depth in-
terviews would be a factor of concern in their decision
making regarding product design modifications.
Scales anchoring ranged from 1 (No, not of concern)
to 5 (Yes, of very much concern). Finally, the relative
performance of the current product against those of
competitors was assessed. Based on the Multisorter
catalogue and by cross-validating important product
attributes (e.g., flexibility, capacity, reliability, system
availability, serviceability) across department, the ex-
tent to which Multisorter performs much worse to
much better than competing products was evaluated
(Appendix, Table A1).
Analysis and Results
RQ1: The Nature of Product Design Decision Criteria
Analysis of the in-depth interviews establishes a tax-
onomy of product design decisions involving four
types of criteria. First, confirming previous findings
(Carbonell et al., 2004; Zahay et al., 2004), product
acceptance and product-related factors are crucial to
product design decisions. Said a senior operations en-
gineering manager:
Analyzing how the product operates in different sites is
essential. For instance, what are the different misallo-
cation rates of the sorter belt? Also, how does the prod-
uct fit customer logistics?
The product-related decision criteria identified
through the interviews were similar to Bloch’s (1995)
dimensions of product form: performance, ergonom-
ics, and aesthetics. Aesthetics refer to ‘‘product ap-
pearance . . . and appeal to the senses’’ (Srinivasan,
Lovejoy, and Beach, 1997, p. 155). Ergonomics in-
volve ‘‘the matching of a product to the target users’
capabilities to maximize safety, efficiency of use, and
comfort’’ (Bloch, 1995, p. 18).
Second, service acceptance or service-related crite-
ria were also identified as relevant in establishing rea-
sons for adapting, refining, or enhancing product
design. Service aspects relate to product serviceability
and service reliability. As stated by one service em-
ployee:
Service needs to be easy. It is simply too difficult right
now since we do not understand the error messages . . .
and it needs to be reliable. That’s all our customers are
asking for, but we need to reconsider the product’s de-
sign to improve this. . .. This is a key issue of concern!
Our findings complement those of Zahay et al.
(2004), who refer to customer needs and wants, which
also include service aspects. These views were shared
by all departments a priori showing no influence of
functional membership during the in-depth inter-
views. In fact, past research found product design to
influence both the amount of service support required
and the way it can be delivered (Goffin, 2000).
Market-related reasons are also considered to be
essential product design decision criteria. Previous
studies found significant support for market-related
criteria such as market share and sales revenues in the
later stages of NPD (Carbonell et al., 2004; Zahay
et al., 2004). However, seven of the interviewees con-
tended that these criteria were also evaluated before
implementing the fourth phase of NPD. Observes the
sales manager:
We know the product and how it performs in terms of
market share. Before we even think of altering it, we
think about how these changes will affect market share
and sales revenues. I mean, what will be the marginal
gain on sales revenues on a five year period?
The system manager’s reflections point in the same
direction:
We sell many products, and the mere fact that we se-
riously consider a product for redesign means that we
have at least established its future sales revenues to
some extent.
Finally, the costs and the ability of design modifica-
tions are taken into consideration. The interviewees
confirm the importance of feasibility-related aspects.
The sales and the R&D manager concur in their as-
sessment: ‘‘The bottom line is also an essential con-
cern!’’ The costs of design modifications relate to the
ability constraints involved with the change of the
534 J PROD INNOV MANAG2008;25:528–545
M. ANTIOCO ET AL.
product. Previous studies identified the importance of
the cost of modifying the product as well as the com-
pany’s ability (resources) to do so (Sahay and Riley,
2003).
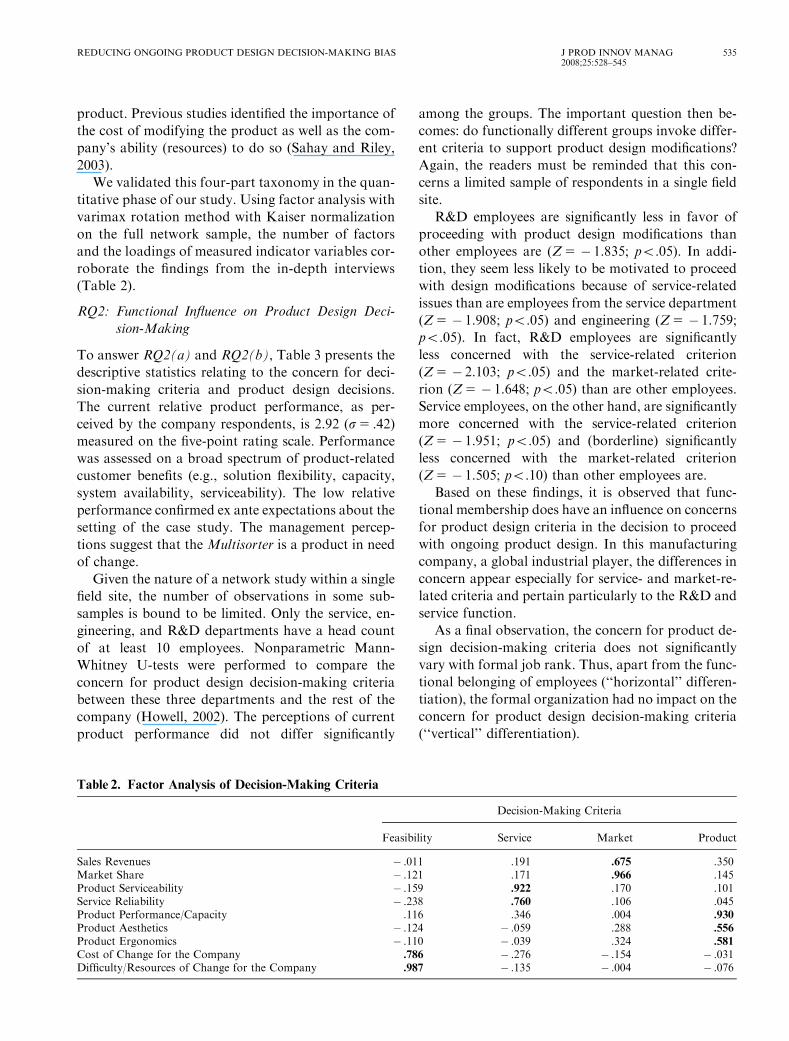
We validated this four-part taxonomy in the quan-
titative phase of our study. Using factor analysis with
varimax rotation method with Kaiser normalization
on the full network sample, the number of factors
and the loadings of measured indicator variables cor-
roborate the findings from the in-depth interviews
(Table 2).
RQ2: Functional Influence on Product Design Deci-
sion-Making
To answer RQ2(a) and RQ2(b), Table 3 presents the
descriptive statistics relating to the concern for deci-
sion-making criteria and product design decisions.
The current relative product performance, as per-
ceived by the company respondents, is 2.92 (s5 .42)
measured on the five-point rating scale. Performance
was assessed on a broad spectrum of product-related
customer benefits (e.g., solution flexibility, capacity,
system availability, serviceability). The low relative
performance confirmed ex ante expectations about the
setting of the case study. The management percep-
tions suggest that the Multisorter is a product in need
of change.
Given the nature of a network study within a single
field site, the number of observations in some sub-
samples is bound to be limited. Only the service, en-
gineering, and R&D departments have a head count
of at least 10 employees. Nonparametric Mann-
Whitney U-tests were performed to compare the
concern for product design decision-making criteria
between these three departments and the rest of the
company (Howell, 2002). The perceptions of current
product performance did not differ significantly
among the groups. The important question then be-
comes: do functionally different groups invoke differ-
ent criteria to support product design modifications?
Again, the readers must be reminded that this con-
cerns a limited sample of respondents in a single field
site.
R&D employees are significantly less in favor of
proceeding with product design modifications than
other employees are (Z5 � 1.835; po.05). In addi-
tion, they seem less likely to be motivated to proceed
with design modifications because of service-related
issues than are employees from the service department
(Z5 � 1.908; po.05) and engineering (Z5 � 1.759;
po.05). In fact, R&D employees are significantly
less concerned with the service-related criterion
(Z5 � 2.103; po.05) and the market-related crite-
rion (Z5 � 1.648; po.05) than are other employees.
Service employees, on the other hand, are significantly
more concerned with the service-related criterion
(Z5 � 1.951; po.05) and (borderline) significantly
less concerned with the market-related criterion
(Z5 � 1.505; po.10) than other employees are.
Based on these findings, it is observed that func-
tional membership does have an influence on concerns
for product design criteria in the decision to proceed
with ongoing product design. In this manufacturing
company, a global industrial player, the differences in
concern appear especially for service- and market-re-
lated criteria and pertain particularly to the R&D and
service function.
As a final observation, the concern for product de-
sign decision-making criteria does not significantly
vary with formal job rank. Thus, apart from the func-
tional belonging of employees (‘‘horizontal’’ differen-
tiation), the formal organization had no impact on the
concern for product design decision-making criteria
(‘‘vertical’’ differentiation).
Table 2. Factor Analysis of Decision-Making Criteria
Decision-Making Criteria
Feasibility Service Market Product
Sales Revenues � .011 .191 .675 .350Market Share � .121 .171 .966 .145Product Serviceability � .159 .922 .170 .101Service Reliability � .238 .760 .106 .045Product Performance/Capacity .116 .346 .004 .930
Product Aesthetics � .124 � .059 .288 .556
Product Ergonomics � .110 � .039 .324 .581
Cost of Change for the Company .786 � .276 � .154 � .031Difficulty/Resources of Change for the Company .987 � .135 � .004 � .076
REDUCING ONGOING PRODUCT DESIGN DECISION-MAKING BIAS J PROD INNOV MANAG2008;25:528–545
535
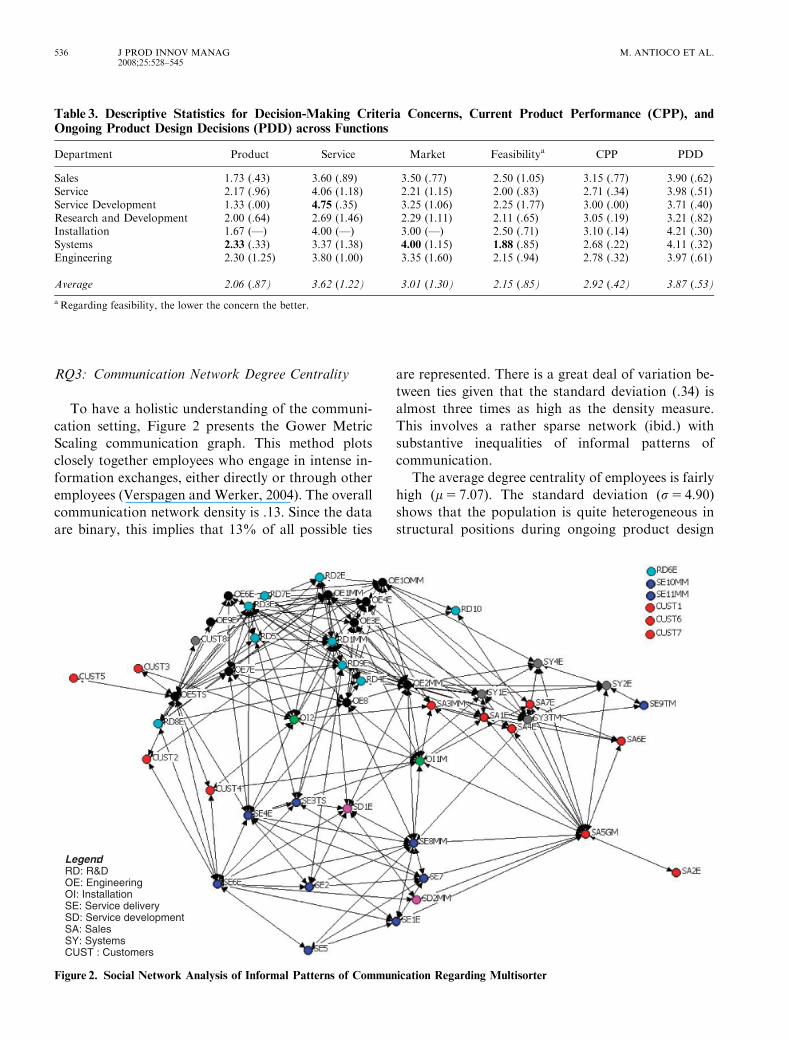
RQ3: Communication Network Degree Centrality
To have a holistic understanding of the communi-
cation setting, Figure 2 presents the Gower Metric
Scaling communication graph. This method plots
closely together employees who engage in intense in-
formation exchanges, either directly or through other
employees (Verspagen and Werker, 2004). The overall
communication network density is .13. Since the data
are binary, this implies that 13% of all possible ties
are represented. There is a great deal of variation be-
tween ties given that the standard deviation (.34) is
almost three times as high as the density measure.
This involves a rather sparse network (ibid.) with
substantive inequalities of informal patterns of
communication.
The average degree centrality of employees is fairly
high (m5 7.07). The standard deviation (s5 4.90)
shows that the population is quite heterogeneous in
structural positions during ongoing product design
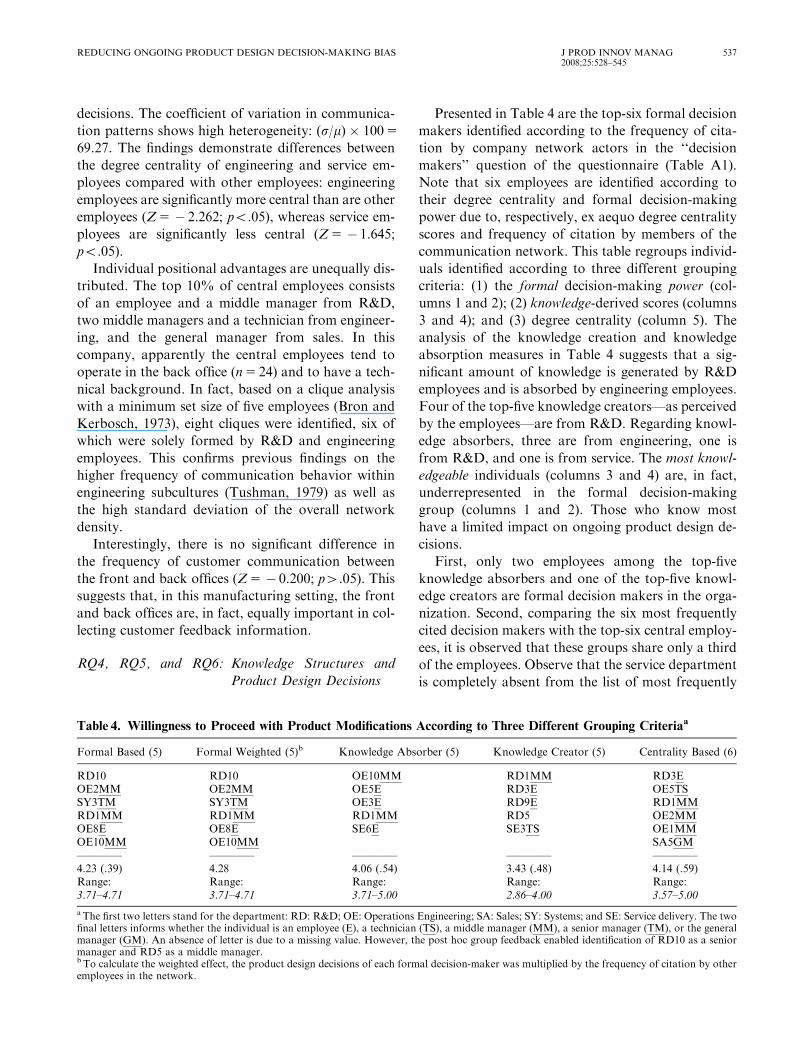
Table 3. Descriptive Statistics for Decision-Making Criteria Concerns, Current Product Performance (CPP), andOngoing Product Design Decisions (PDD) across Functions
Department Product Service Market Feasibilitya CPP PDD
Sales 1.73 (.43) 3.60 (.89) 3.50 (.77) 2.50 (1.05) 3.15 (.77) 3.90 (.62)Service 2.17 (.96) 4.06 (1.18) 2.21 (1.15) 2.00 (.83) 2.71 (.34) 3.98 (.51)Service Development 1.33 (.00) 4.75 (.35) 3.25 (1.06) 2.25 (1.77) 3.00 (.00) 3.71 (.40)Research and Development 2.00 (.64) 2.69 (1.46) 2.29 (1.11) 2.11 (.65) 3.05 (.19) 3.21 (.82)Installation 1.67 (—) 4.00 (—) 3.00 (—) 2.50 (.71) 3.10 (.14) 4.21 (.30)Systems 2.33 (.33) 3.37 (1.38) 4.00 (1.15) 1.88 (.85) 2.68 (.22) 4.11 (.32)Engineering 2.30 (1.25) 3.80 (1.00) 3.35 (1.60) 2.15 (.94) 2.78 (.32) 3.97 (.61)
Average 2.06 (.87) 3.62 (1.22) 3.01 (1.30) 2.15 (.85) 2.92 (.42) 3.87 (.53)
aRegarding feasibility, the lower the concern the better.
Legend:RD: R&D OE: Engineering OI: Installation SE: Service delivery SD: Service development SA: Sales SY: Systems CUST : Customers
Figure 2. Social Network Analysis of Informal Patterns of Communication Regarding Multisorter
536 J PROD INNOV MANAG2008;25:528–545
M. ANTIOCO ET AL.
decisions. The coefficient of variation in communica-
tion patterns shows high heterogeneity: (s/m) � 1005
69.27. The findings demonstrate differences between
the degree centrality of engineering and service em-
ployees compared with other employees: engineering
employees are significantly more central than are other
employees (Z5 � 2.262; po.05), whereas service em-
ployees are significantly less central (Z5 � 1.645;
po.05).
Individual positional advantages are unequally dis-
tributed. The top 10% of central employees consists
of an employee and a middle manager from R&D,
two middle managers and a technician from engineer-
ing, and the general manager from sales. In this
company, apparently the central employees tend to
operate in the back office (n5 24) and to have a tech-
nical background. In fact, based on a clique analysis
with a minimum set size of five employees (Bron and
Kerbosch, 1973), eight cliques were identified, six of
which were solely formed by R&D and engineering
employees. This confirms previous findings on the
higher frequency of communication behavior within
engineering subcultures (Tushman, 1979) as well as
the high standard deviation of the overall network
density.
Interestingly, there is no significant difference in
the frequency of customer communication between
the front and back offices (Z5 � 0.200; p4.05). This
suggests that, in this manufacturing setting, the front
and back offices are, in fact, equally important in col-
lecting customer feedback information.
RQ4, RQ5, and RQ6: Knowledge Structures and
Product Design Decisions
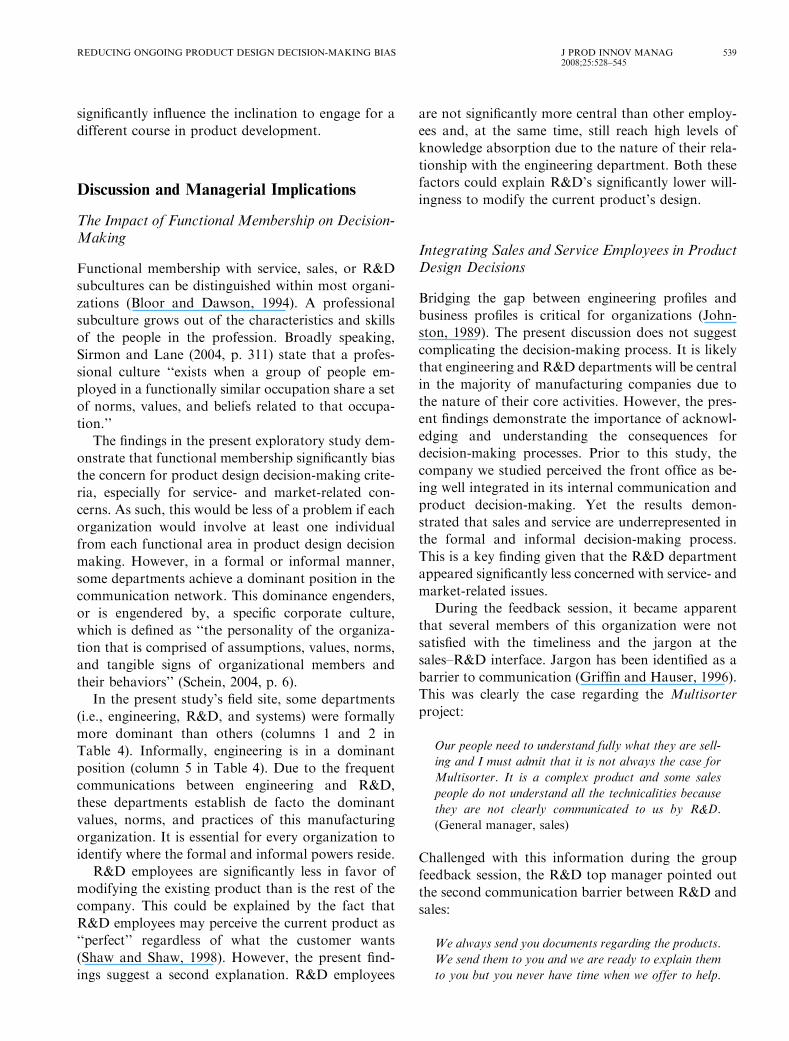
Presented in Table 4 are the top-six formal decision
makers identified according to the frequency of cita-
tion by company network actors in the ‘‘decision
makers’’ question of the questionnaire (Table A1).
Note that six employees are identified according to
their degree centrality and formal decision-making
power due to, respectively, ex aequo degree centrality
scores and frequency of citation by members of the
communication network. This table regroups individ-
uals identified according to three different grouping
criteria: (1) the formal decision-making power (col-
umns 1 and 2); (2) knowledge-derived scores (columns
3 and 4); and (3) degree centrality (column 5). The
analysis of the knowledge creation and knowledge
absorption measures in Table 4 suggests that a sig-
nificant amount of knowledge is generated by R&D
employees and is absorbed by engineering employees.
Four of the top-five knowledge creators—as perceived
by the employees—are from R&D. Regarding knowl-
edge absorbers, three are from engineering, one is
from R&D, and one is from service. The most knowl-
edgeable individuals (columns 3 and 4) are, in fact,
underrepresented in the formal decision-making
group (columns 1 and 2). Those who know most
have a limited impact on ongoing product design de-
cisions.
First, only two employees among the top-five
knowledge absorbers and one of the top-five knowl-
edge creators are formal decision makers in the orga-
nization. Second, comparing the six most frequently
cited decision makers with the top-six central employ-
ees, it is observed that these groups share only a third
of the employees. Observe that the service department
is completely absent from the list of most frequently
Table 4. Willingness to Proceed with Product Modifications According to Three Different Grouping Criteriaa
Formal Based (5) Formal Weighted (5)b Knowledge Absorber (5) Knowledge Creator (5) Centrality Based (6)
RD10 RD10 OE10MM RD1MM RD3EOE2MM OE2MM OE5E RD3E OE5TSSY3TM SY3TM OE3E RD9E RD1MMRD1MM RD1MM RD1MM RD5 OE2MMOE8E OE8E SE6E SE3TS OE1MMOE10MM OE10MM SA5GM———— ———— ———— ———— ————4.23 (.39) 4.28 4.06 (.54) 3.43 (.48) 4.14 (.59)Range: Range: Range: Range: Range:3.71–4.71 3.71–4.71 3.71–5.00 2.86–4.00 3.57–5.00
a The first two letters stand for the department: RD: R&D; OE: Operations Engineering; SA: Sales; SY: Systems; and SE: Service delivery. The twofinal letters informs whether the individual is an employee (E), a technician (TS), a middle manager (MM), a senior manager (TM), or the generalmanager (GM). An absence of letter is due to a missing value. However, the post hoc group feedback enabled identification of RD10 as a seniormanager and RD5 as a middle manager.b To calculate the weighted effect, the product design decisions of each formal decision-maker was multiplied by the frequency of citation by otheremployees in the network.
REDUCING ONGOING PRODUCT DESIGN DECISION-MAKING BIAS J PROD INNOV MANAG2008;25:528–545
537

cited decision makers. However, internally it was
viewed as one of the four key business units in the
company’s annual report. These findings show a
strong discrepancy between the service division’s ac-
tual influence and its assumed network position.
Within the customer contact front office, the service
division is important as a network link but not as a
decision-making authority.
RQ4, RQ5, and RQ6: Influences of DegreeCentrality and Experimental Learning on ProductDesign Decisions
In assessing the relationship among network central-
ity, learning, and product design decisions, partial
least squares was used to estimate the structural equa-
tion model (PLS-Graph Version 3.0; Chin, 2001). To
ensure that the sample size was adequate for the anal-
ysis, a power test was conducted, as proposed by
Cohen (1988), for the F-test, relating R2 for the en-
dogenous constructs. Assuming a large effect size
( f 2 5 0.35; R2 5 0.26) for three predictors, a signifi-
cance level (a) of 0.05, and a desired power (1� b) of0.80 for the study’s analysis, a sample size of 35 is
required. This figure is within the bounds of the sam-
ple size obtained for the network analysis. Figure 3
displays that the following:
� Ongoing product design decisions are a linear
function of the degree centrality (b5 .359,
po.10, R2 5 0.79) (RQ4) and an inverted U-
shaped function of the amount of knowledge ab-
sorbed about current product performance (b of
the quadratic term5 .482, po.05, R2 5 0.79)
(RQ6).
� Learning is a function of degree centrality
(b5 .637, po.05, R2 5 0.41) (RQ5).
The data demonstrate face validity. Other studies
have proven the impact of centrality on learning (e.g.,
Levin and Cross, 2004). Also, the frequency of cus-
tomer contact is significantly associated with the
amount of learning, thereby confirming the value of
customer information for organizational learning
(e.g., Maltz and Kohli, 1996).
Second, the study’s findings confirm the dual im-
pact of degree centrality: (1) a situational opportunity
to make modifications to the existing product; and
(2) a cognitive opportunity influencing the decision
to modify product design following an inverted
U-shaped function. According to the calculation of
this function’s optimum, the optimum Z-score for
the amount of knowledge is 0.18. This means that
(Xoptimal� 86.32)/47.895 0.18, where 86.32 and 47.89
are the mean and standard deviation of original scores
for knowledge absorption, respectively. Thus, em-
ployees most inclined to make modifications to the
existing product are those with total ‘‘quantities’’ of
knowledge absorption equal to Xoptimal 5 95 (where
values range between 23 and 272). If employees learn
to their fullest during each individual interaction
(10/10), they will be most favorable to product design
decisions if they interact with nine actors in the
network. If they learn at the fullest with more actors,
information overload seems to affect the willingness
to alter the design of the existing product.
Where does that leave the formal organization?
Again, only functional differentiation was important.
Job rank does not have a significant effect on ongoing
product design decisions. Counter to popular belief,
the level one occupies in the organization does not
Linear: ß: .359*Situational Opportunity
Inverted -U: .169 x - .482 x2**
Linear: ß: .637**
DegreeCentrality
Product Design
DecisionsR2: 0.79
Experimental Learning
R2: 0.41
Cognitive Opportunity
Figure 3. The Influences of Degree Centrality on Product Design Decisions (� po.1, �� po.05)
538 J PROD INNOV MANAG2008;25:528–545
M. ANTIOCO ET AL.
significantly influence the inclination to engage for a
different course in product development.
Discussion and Managerial Implications
The Impact of Functional Membership on Decision-Making
Functional membership with service, sales, or R&D
subcultures can be distinguished within most organi-
zations (Bloor and Dawson, 1994). A professional
subculture grows out of the characteristics and skills
of the people in the profession. Broadly speaking,
Sirmon and Lane (2004, p. 311) state that a profes-
sional culture ‘‘exists when a group of people em-
ployed in a functionally similar occupation share a set
of norms, values, and beliefs related to that occupa-
tion.’’
The findings in the present exploratory study dem-
onstrate that functional membership significantly bias
the concern for product design decision-making crite-
ria, especially for service- and market-related con-
cerns. As such, this would be less of a problem if each
organization would involve at least one individual
from each functional area in product design decision
making. However, in a formal or informal manner,
some departments achieve a dominant position in the
communication network. This dominance engenders,
or is engendered by, a specific corporate culture,
which is defined as ‘‘the personality of the organiza-
tion that is comprised of assumptions, values, norms,
and tangible signs of organizational members and
their behaviors’’ (Schein, 2004, p. 6).
In the present study’s field site, some departments
(i.e., engineering, R&D, and systems) were formally
more dominant than others (columns 1 and 2 in
Table 4). Informally, engineering is in a dominant
position (column 5 in Table 4). Due to the frequent
communications between engineering and R&D,
these departments establish de facto the dominant
values, norms, and practices of this manufacturing
organization. It is essential for every organization to
identify where the formal and informal powers reside.
R&D employees are significantly less in favor of
modifying the existing product than is the rest of the
company. This could be explained by the fact that
R&D employees may perceive the current product as
‘‘perfect’’ regardless of what the customer wants
(Shaw and Shaw, 1998). However, the present find-
ings suggest a second explanation. R&D employees
are not significantly more central than other employ-
ees and, at the same time, still reach high levels of
knowledge absorption due to the nature of their rela-
tionship with the engineering department. Both these
factors could explain R&D’s significantly lower will-
ingness to modify the current product’s design.
Integrating Sales and Service Employees in ProductDesign Decisions
Bridging the gap between engineering profiles and
business profiles is critical for organizations (John-
ston, 1989). The present discussion does not suggest
complicating the decision-making process. It is likely
that engineering and R&D departments will be central
in the majority of manufacturing companies due to
the nature of their core activities. However, the pres-
ent findings demonstrate the importance of acknowl-
edging and understanding the consequences for
decision-making processes. Prior to this study, the
company we studied perceived the front office as be-
ing well integrated in its internal communication and
product decision-making. Yet the results demon-
strated that sales and service are underrepresented in
the formal and informal decision-making process.
This is a key finding given that the R&D department
appeared significantly less concerned with service- and
market-related issues.
During the feedback session, it became apparent
that several members of this organization were not
satisfied with the timeliness and the jargon at the
sales–R&D interface. Jargon has been identified as a
barrier to communication (Griffin and Hauser, 1996).
This was clearly the case regarding the Multisorter
project:
Our people need to understand fully what they are sell-
ing and I must admit that it is not always the case for
Multisorter. It is a complex product and some sales
people do not understand all the technicalities because
they are not clearly communicated to us by R&D.
(General manager, sales)
Challenged with this information during the group
feedback session, the R&D top manager pointed out
the second communication barrier between R&D and
sales:
We always send you documents regarding the products.
We send them to you and we are ready to explain them
to you but you never have time when we offer to help.
REDUCING ONGOING PRODUCT DESIGN DECISION-MAKING BIAS J PROD INNOV MANAG2008;25:528–545
539

Then, a few weeks later, you ask for them again, and
again, and again.
These frank observations suggest a disparity between
R&D’s and sales’ time orientations or an under-
staffing of sales people in a technical company. Re-
garding time orientation, R&D has a long-term
horizon (Griffin and Hauser, 1996), whereas sales re-
quires on-time information when they are in the pro-
cess of selling a product. This in turn is problematic
for manufacturers given that salespeople need to
make sure that the sold product fits customers’ logis-
tics since this will affect product installation and ser-
viceability. Also, salespeople can be a valuable source
of information regarding customer needs and wants
for R&D engineers. Both parties can benefit from
each other. Therefore, manufacturing companies are
advised to shed light on the R&D–sales communica-
tion patterns, especially for manufacturers of complex
products. To effectively manage R&D–sales relation-
ships, manufacturers must create an atmosphere for
communication. This is rarely accomplished by means
of a quick fix (Patterson et al., 2005); interfunctional
socialization efforts may provide an organizational
method to accomplish this. It fosters goal congruence
and process transparency across functionally different
subgroups in the innovation process (Harris and
Mossholder, 1996). Practically, simply making sure
that product information is accessible online for the
sales department is already an easy way to reduce
timeliness problems.
Several authors have highlighted the importance of
service inputs for the organization (e.g., Voss et al.,
2004). Past research found product design to influence
both the amount of service support required and the
way it can be delivered (Goffin, 2000). The present
empirical results reinforce the role service employees
should play in manufacturing companies. Optimizing
presales and postsales service integration requires not
only gathering customer information but also dissem-
inating and using it (Maltz and Kohli, 1996). There-
fore, manufacturers should make sure to include a
service employee in product design decision-making
teams. His or her role should be to share customer
information with the rest of the decision-making team
and to ensure that back-office decision makers—
especially those from R&D—do not underestimate
the importance of the service-related criterion. The
present study shows, however, that at the departmen-
tal level engineering employees had more frequent
customer contact than service employees. This could
be due to the complexity of the product under study.
However, overall, there is no difference in the fre-
quency of customer contact between the front and the
back offices. These findings show that the front and
back offices are equally important regarding the pos-
session of customer information.
Third, it is important to establish within each de-
partment single points of contacts who should man-
age the information shared with other departments.
Each department should have a gatekeeper (Tichy,
Tushy, and Fombrun, 1979) for product development
communication. A gatekeeper is an individual ‘‘who
links the social unit with external domains’’ (ibid.,
p. 508). This reduces the professional culture bias and
the information overload because gatekeepers collect
and manage information that can be shared intelli-
gently with other subunits.
Experimental Learning: Impact on OngoingProduct Design Decisions
The results presented herein demonstrate that the re-
lationship between the amount of experimental learn-
ing and the decision to modify the existing product
follows an inverted U-shaped function. There are two
reasons for that. First, too large an amount of learn-
ing regarding problems with a product could lead to
the perception that radical design modifications in-
stead of incremental design modifications are needed.
This engendered much resistance within the R&D de-
partment:
We are not completely changing this product. Before
finding all sorts of faults people should read the man-
uals.
Second, information overload will reduce ongoing
product design decisions. Information overload is
the state of an individual (or a system) in which not
all communication inputs can be processed and uti-
lized, leading to breakdown (Rogers and Agarwala-
Rogers, 1975). Information overload occurs because
either too many messages are delivered and it appears
impossible to respond to them adequately or incom-
ing messages are not sufficiently organized to be
easily recognized (Jones, Ravid, and Rafaeli, 2004).
In this study, it is shown that communicating with
nine very knowledgeable people in the network leads
to the highest inclination to support product design
modifications.
540 J PROD INNOV MANAG2008;25:528–545
M. ANTIOCO ET AL.
The fact that our findings do not allow us to iden-
tify which of the individuals, or groups of individuals,
are right or not regarding Multisorter must be ac-
knowledged. Indeed, more central employees are
more in favor of product modifications, but rightly
so? R&D is less concerned with service-related prod-
uct design decision criteria, but rightly so? When pass-
ing a threshold for the quantity of knowledge,
employees become less willing to modify product de-
sign, but rightly so? These questions cannot be an-
swered since this paper studies a hypothetical
modification to an existing product and it is not
known how Multisorter would perform on the mar-
ket if altered. At this stage, however, the present
findings can help manufacturers calibrate decision-
making teams.
How Should Decision Makers Be Assigned forOngoing Product Design?
First, rather than managers and employees, experts
and nonexperts must be present in decision-making
teams. Second, team members should originate from
different departments. Past research advocates that
teams with members of similar profiles may facilitate
knowledge transfer, simplify coordination, and avoid
potential conflicts (Borgatti and Foster, 2003). On the
other hand, limiting communication between dissim-
ilar others prevents a group from reaping the benefits
of diversity (ibid.). Based on the present results, it is
shown that team member similarity can lead to deci-
sion bias. Finally, there should be team members from
both the front and back offices. This finding is derived
from the social network analysis, which demonstrates
that the front office was given significantly less im-
portance than the back office in the communication
network although the front office communicated as
intensively with the customer. In Table 5, product–
team composition guidelines are proposed to reduce
potential product design decision-making bias. The
current formal decision-making team (Table 4, Col-
umn 1) did not fulfill criteria 1, 3, or 4 and partially
fulfilled criterion 2.
Research Limitations and Further Research
As in most research, this study has certain limitations
that affect the generalizability of the results while
at the same time suggesting directions for further
research. The first limitation pertains to the study of
product design decision criteria in between two stages
of NPD. Only two exploratory studies have examined
this issue, and the relevance of these decision criteria
therefore needed to be reexamined for the purposes of
the present study. Without altering the relevance of
the findings, one should, however, acknowledge that
other manufacturing companies may have additional
product design decision-making concerns.
Second, this study was conducted within a network
of 54 actors, and differences in concerns for product
design decision-making criteria and also the decision
outcome were established based on rather small
groups of employees. Eventual differences could not
be tested for other, smaller departments such as in-
stallation, systems, and sales. Despite this, given that
significant results between rather small groups are
observed, we foresee that effects should remain for
larger departments, especially because employees
from similar departments were quite consistent in
their answers.
Third, this study was carried out for a single project
in one manufacturing firm. However, individuals’ in-
formal patterns of communication and decision mak-
ing may depend on the nature and complexity of the
product under study (Adler, 1995) and the context in
which a company operates. Therefore, a replication of
this study could establish external validity of the pres-
ent findings across contingencies.
Finally, the validity of the research could be
strengthened by triangulation. Even if many docu-
ments on the performance of the Multisorter were
consulted to establish its current performance, docu-
ments to verify whether, in the past, product design
decisions had differed between various departments
could have been gathered through archival research
efforts. For instance, these documents could have
Table 5. Ideal Product–Team Composition
Product–Team CompositionGuidelines Reasons
1. Experts and nonexpertsrather than employees andmanagers
Effects of learning quantity ratherthan functional job rank (lack of)influence
2. Different functional areas Centrality, functional membershipinfluence
3. Front- and back-officepersonnel
Centrality, functional membershipinfluence, frequency of customercommunication
4. Keeping track of teammembers’ communications
Inverted-U effects on productdesign decisions
REDUCING ONGOING PRODUCT DESIGN DECISION-MAKING BIAS J PROD INNOV MANAG2008;25:528–545
541

been functional reports on product performance and
suggestions for product design improvements. Com-
mon method variance, which may have inflated some
of the relationships, is considered a limitation of this
research (Lindell and Whitney, 2001).
With regards to further research, first, it is expected
that functional membership and informal patterns of
communication will influence product design deci-
sions between other stages of NPD. It is suggested
here that research should study patterns of commu-
nication to unravel informal influences during the idea
development stage. Indeed, it may be that degree cen-
trality hinders the potential to generate innovative
product ideas (Hansen, 1999). Therefore, the influence
of the situational advantage on ongoing product de-
sign decisions could, in fact, be different in nature on
decision outcomes in this stage of NPD.
Second, research should evaluate the relative dom-
inance of functional employees for different types of
products. The present study tackles the communica-
tion network of an industrial product that is relatively
complex. This may partly explain why service em-
ployees were significantly less central than operations
engineers in the informal communication network.
Replications of this study for different types of incre-
mental product modification projects will bring more
insights in how central service employees are in other
settings.
Finally, these findings suggest the necessity to study
the R&D–sales interface more in depth. Establishing
how manufacturing firms can better manage this in-
terface is essential given that selling a complex prod-
uct, which does not fully fit customer logistics, may
lead to important problems during product installa-
tion, service reliability, and overall quality.
References
Adler, P.S. (1995). Interdepartmental Interdependence and Coordina-tion: The Case of the Design/Manufacturing Interface. Organiza-tion Science 6(2):147–167 (March–April).
Ahuja, M.K., Galleta, D.F., and Carley, K.M. (2003). Individual Cen-trality and Performance in Virtual R&D Groups: An EmpiricalStudy. Management Science 49(1):21–38 (January).
Antonelli, C. (1997). The Economics of Path-Dependence in EconomicOrganizations. International Journal of Industrial Organization15(6):643–671 (October).
Atuahene-Gima, K. and Evangelista, F. (2000). Cross-Functional In-fluence in New Product Development: An Exploratory Study ofMarketing and R&D Perspectives. Management Science46(10):1269–1284 (October).
Bloch, P.H. (1995). Seeking the Ideal Form: Product Design and Con-sumer Response. Journal of Marketing 59(3):16–29 (July).
Bloor, G. and Dawson, P. (1994). Understanding Professional Culturein Organizational Context. Organization Studies 15(2):275–295.
Borgatti, S.P. and Foster, P.C. (2003). The Network Paradigm in Or-ganizational Research: A Review of Typology. Journal of Manage-ment 29(6):991–1013 (December).
Borgatti, S.P., Everett, M.G., and Freeman, L.C. (2002). Ucinet 6 forWindows. Cambridge, MA: Harvard Business School, AnalyticTechnologies.
Borgatti, S.P. and Molina, J.L. (2003). Ethical and Strategic Issues inOrganizational Network Analysis. Journal of Applied BehavioralScience 39(3):337–349 (September).
Bowman, C. and Daniels, K. (1995). The Influence of Functional Ex-perience on Perceptions of Strategic Priorities. British Journal ofManagement 6(3):157–167 (September).
Bron, C. and Kerbosch, J. (1973). Finding All Cliques of an UndirectedGraph. Communication of the ACM 16:575–577.
Carbonell, P., Rodriguez, A.I., and Aleman, J.-L.M. (2004). Technol-ogy Newness and Impact of Go/no-go Criteria on New ProductSuccess. Marketing Letters 15(2–3):81–97 (July–October).
Chin, W. (2001). PLS-Graph User’s Guide Version 3.0. Houston, TX:C.T. Bauer College of Business, University of Houston.
Cohen, J. (1988). Statistical Power Analysis for the Behavioral Sciences.Hillsdale, NJ: Lawrence Erlbaum Associates.
Cooper, R.G. (2001). Winning at New Products: Accelerating the Pro-cess from Idea to Launch, (3rd ed.). Cambridge, MA: Perseus Pub-lishing.
Cronbach, L.J. (1951). Coefficient Alpha and the Internal Structure ofTests. Psychometrika 16(3):297–334.
Eisenhardt, K.M. (1989). Building Theories from Case Study Re-search. Academy of Management Review 14(4):532–550 (October).
Englund, R. and Graham, R.J. (1999). From Experience: Linking toStrategy. Journal of Product Innovation Management 16(1):52–65(January).
Freeman, L. (1979). Centrality in Social Networks: Conceptual Clar-ifications. Social Networks 1(3):215–239.
Goffin, K. (2000). Design for Supportability: Essential Component ofProduct Development. Research TechnologyManagement 43(2):40–47 (May–June).
Griffin, A. and Hauser, J.B. (1996). Integrating R&D and Marketing:A Review and Analysis of the Literature. Journal of Product Inno-vation Management 13(3):191–215 (May).
Hansen, M.T. (1999). The Search-Transfer Problem: The Role ofWeak Ties in Sharing Knowledge across Organization Subunits.Administrative Science Quarterly 44(1):82–111 (March).
Harris, S.G. and Mossholder, K.W. (1996). The Affective Impli-cations of Perceived Congruence with Culture Dimensions duringOrganizational Transformation. Journal of Management 22(4):527–547.
Hogarth, R.T. and Einhorn, H.J. (1989). Order Effects in Belief Up-dating: The Belief-Adjustment Model. Working Paper, Universityof Chicago.
Howard-Grenville, J.A. (2006). Inside the ‘‘Black Box’’: How Organi-zational Culture and Subcultures Inform Interpretations and Ac-tions on Environmental Issues. Organization & Environment19(1):46–64 (March).
Howell, D.C. (2002). Statistical Methods for Psychology, (5th ed.).Belmont, CA: Duxbury.
Iacobucci, D. and Hopkins, N. (1992). Modeling Dyadic Interactionsand Networks in Marketing. Journal of Marketing Research29(1):5–17 (February).
Jaworski, B.J. and Kohli, A.K. (1993). Market Orientation: Anteced-ents and Consequences. Journal of Marketing 57(3):57–70 (July).
Johnston, D.L. (1989). Engineering Contributions to the Evolution ofManagement Practice. IEEE Transactions on Engineering Manage-ment 36(2):105–113 (May).
542 J PROD INNOV MANAG2008;25:528–545
M. ANTIOCO ET AL.
Jones, Q., Ravid, G., and Rafaeli, S. (2004). Information Overload andthe Message Dynamics of Online Interaction Spaces: A TheoreticalModel and Empirical Exploration. Information Systems Research15(2):194–209 (June).
Kaiser, H.F. (1958). The Varimax Criterion for Analytic Rotation inFactor Analysis. Psychometrika 23(3):187–200.
Kayes, A.B., Kayes, D.C., and Yamazaki, Y. (2005). TransferringKnowledge across Cultures: A Learning Competencies Approach.Performance Improvement Quarterly 18(4):87–100 (Spring).
Lee, C.K.M., Lau, H.C.W., Yu, K.M., and Fung, R.Y.K. (2004). De-velopment of a Dynamic Data Interchange Scheme to SupportProduct Design in Agile Manufacturing. International Journal ofProduction Economics 3(87):295–308 (February).
Levin, D.Z. and Cross, R. (2004). The Strength of Weak Ties You CanTrust: The Mediating Role of Trust in Effective Knowledge Trans-fer. Management Science 50(11):1477–1490 (November).
Lindell, M.K. and Whitney, D.J. (2001). Accounting for CommonMethod Variance in Cross-sectional Research Designs. Journal ofApplied Psychology 86(1):114–121 (February).
Loudon, G. (2006). Nice Technology, Shame about the Product. In-stitution for Engineering and Technology (August).
Maltz, E. and Kohli, A.K. (1996). Market Intelligence Disseminationacross Functional Boundaries. Journal of Marketing Research33(1):47–61 (February).
Moenaert, R.K. and Souder, W.E. (1990). An Analysis of the Use ofExtra-functional Information by R&D and Marketing Personnel:Review and Model. Journal of Product Innovation Management7(3):91–107 (September).
Moody, S. (1984). The Role of Industrial Design in the Development ofNew Science Based Products. In Design and Industry, ed. R. Lang-don. London: Design Council.
Patterson, M.G., West, M.A., Shackleton, V.J., and awson, J.F.(2005). Validating the Organizational Climate Measure: Links toManagerial Practices, Productivity, and Innovation. Journal of Or-ganizational Behavior 26(4):370–408 (June).
Perks, H., Cooper, R., and Jones, C. (2005). Characterizing the Role ofDesign in New Product Development: An Empirically DerivedTaxonomy. Journal of Product Innovation Management 22(2):111–127 (March).
Pfeffer, J. (1981). Power in Organizations. Marshfield, MA: Pitman.
Powell, W.W., Koput, K.W., and Smith-Doerr, L. (1996). Interorga-nizational Collaboration and the Locus of Innovation: Networks ofLearning in Biotechnology. Administrative Science Quarterly41(1):116–145 (March).
Rogers, E.M. and Agarwala-Rogers, R. (1975). Organizational Com-munication. In Communication Behavior, ed. G.L. Hanneman andW.J. McEwen. Reading, MA: Addison Wesley, 218–236.
Ronchetto, J.R., Hutt, M.D., and Reingen, P.H. (1989). EmbeddedInfluence Patterns in Organizational Buying Systems. Journal ofMarketing 53(4):51–62 (October).
Ruekert, R.W. and Walker, O.C. Jr. (1987). Marketing’s Interactionwith Other Functional Units: A Conceptual Model and EmpiricalEvidence. Journal of Marketing 51(1):1–19 (January).
Sahay, A. and Riley, D. (2003). The Role of Resource Access, MarketConsiderations, and the Nature of Innovation in Pursuit of Stan-dards in the New Product Development Process. Journal of ProductInnovation Management 20(5):338–355 (September).
Salancik, G.R. and Pfeffer, J. (1978). A Social Information ProcessingApproach to Job Attitudes. Administrative Science Quarterly23(2):224–253 (June).
Schein, E.H. (2004). Organizational Culture and Leadership, (3d ed.).San Francisco: Jossey-Bass.
Shaw, V. and Shaw, C.T. (1998). Conflict between Engineers andMarketers. Industrial Marketing Management 32(6):489–499(July).
Silver, A.M. (1974). Predicting the Performance of Complex Systems:An Approach to Greater Involvement by Design Engineering andOperating Managers. International Journal of Product Research12(2):299–312 (March).
Sirmon, D. and Lane, P.J. (2004). AModel of Cultural Differences andInternational Alliance Performance. Journal of International Busi-ness Studies 35(4):306–319 (July).
Song, X.M. and Montoya-Weiss, M.M. (1998). Critical Devel-opment Activities for Really New versus Incremental Products.Journal of Product Innovation Management 15(2):124–136(March).
Song, X.M., Montoya-Weiss, M.M., and Schmidt, J.B. (1997).Antecedents and Consequences of Cross-Functional Cooperation:A Comparison of R&D, Manufacturing and Marketing Perspec-tives. Journal of Product Innovation Management 14(1):35–47(January).
Srinivasan, V., Lovejoy, W.S., and Beach, D. (1997). Integrated Prod-uct Design for Marketability and Manufacturing. Journal of Mar-keting Research 34(1):154–163 (February).
Tichy, N.M., Tushman, M.L., and Fombrun, C. (1979). Social Net-work Analysis for Organizations. Academy of Management Review4(4):507–519 (October).
Tsai, W. and Goshal, S. (1998). Social Capital and Value Creation: TheRole of Intrafirm Networks. Academy of Management Journal41(4):464–476 (August).
Tushman, M.L. (1979). Managing Communication Networks in R&DLaboratories. Sloan Management Review 20(2):37–49 (Winter).
Verspagen, B. and Werker, C. (2004). Keith Pavitt and the InvisibleCollege of the Economics of Technology and Innovation. ResearchPolicy 23(9):1419–1431 (November).
Voss, C.A., Roth, A.V., Rosenzweig, E.D., Blackmon, K., and Chase,R.B. (2004). A Tale of Two Countries’ Conservatism, Service Qual-ity, and Feedback on Customer Satisfaction. Journal of ServiceResearch 6(3):212–231 (February).
Yen, J., Fan, X., Sun, S., Hanratty, T., and Dumer, J. (2006). Agentswith Shared Mental Models for Enhancing Team Decision-Makings. Decision Support Systems 41(3):634–653 (March).
Zahay, D., Griffin, A., and Fredericks, E. (2004). Sources, Uses, andForms of Data in the New Product Development Process. Indus-trial Marketing Management 33(7):657–666 (October).
REDUCING ONGOING PRODUCT DESIGN DECISION-MAKING BIAS J PROD INNOV MANAG2008;25:528–545
543

Appendix
Table A1. Measurement Instruments
COMMUNICATION PATTERNS (Internal)Please indicate how frequently you interact about work-related matters with the following colleagues about the MULTISORTER product/
solution.Please also indicate in the last column on a scale from 1 to 10 how much you learn about MULTISORTER’s performance by interactingwith each of the colleagues. This score indicates: how clear the information is and whether it communicates important details to you.The first three lines are presented as an example. If you do not interact effectively with a person, do not fill out anything on that line (just as
exemplified in line 2).
List ofColleagues
Less thanonce a year
1–3 timesa year
4–6 timesa year
1–3 timesa month
1–3 timesa week
4–5 timesa week
Several timesa day
How muchdo you learn?
1 Name 1 X 82 Name 23 Name 3 X 4
COMMUNICATION PATTERNS (With customers)
Customers Never Less thanonce a year
1–3 timesa year
4–6 timesa year
1–3 timesa month
1–3 timesa week
4–5 timesa week
Several timesa day
[NAME OFCUSTOMERS]
DECISION MAKERSPlease name the three most important (formal) decision makers when it comes down to deciding whether [Name of the Firm] is going toalter MULTISORTER? Of course, one of the three persons could be you. Please fill in your name if it is the case.
PRODUCT DESIGN DECISIONSPlease state to what extent you agree with the following statements that refer to the current MULTISORTER:
I think that:Completelydisagree
Completelyagree
Enhancing MULTISORTER’s design would be good. 1 2 3 4 5Making some changes to MULTISORTER’s engineering could be beneficial. 1 2 3 4 5Adapting MULTISORTER could lead to some improvements to the products. 1 2 3 4 5Adapting MULTISORTER could lead to some improvements to the process. 1 2 3 4 5Refining some aspects/elements of MULTISORTER would be advisable. 1 2 3 4 5Refining the product and process is something we should consider for MULTISORTER 1 2 3 4 5MULTISORTER is perfect as it is; no changes could improve it. 1 2 3 4 5
DECISION-MAKING CRITERIAIf you have indicated above that you would like to see some changes (adaptations, refinements, or enhancements) to MULTISORTER,note your support for the following concerns/reasons:
No, notof concern
Somewhata concern
Of verymuch concern
Sales revenues 1 2 3 4 5Market share 1 2 3 4 5Product serviceability 1 2 3 4 5Service reliability 1 2 3 4 5
544 J PROD INNOV MANAG2008;25:528–545
M. ANTIOCO ET AL.

.
Table A1. (Contd.)
No, notof concern
Somewhata concern
Of verymuch concern
Product performance/capacity 1 2 3 4 5Product aesthetics for customers (e.g., shape, size, frame, side covers, weight) 1 2 3 4 5Product ergonomics for customers (installation and ease of use) 1 2 3 4 5Cost of change for the company 1 2 3 4 5Difficulty/resources of change for the company 1 2 3 4 5
RELATIVE PRODUCT PERFORMANCEIn comparison with the best competing products on the market, how does MULTISORTER perform on the following dimensions?
Much worse Worse Identically Better Much better
Solution flexibility 1 2 3 4 5Material handling quality 1 2 3 4 5Capacity 1 2 3 4 5Conveyability 1 2 3 4 5Information interface (visualization) 1 2 3 4 5Reliability 1 2 3 4 5System availability 1 2 3 4 5Operating costs 1 2 3 4 5Design flexibility 1 2 3 4 5Serviceability 1 2 3 4 5
REDUCING ONGOING PRODUCT DESIGN DECISION-MAKING BIAS J PROD INNOV MANAG2008;25:528–545
545