paper hahn submit jul2010
TRANSCRIPT
0
NEITHER EFFICIENT NOR ANIMALLY SPIRITED, BUT
EVENTUALLY ADJUSTING:
THE STOCK MARKET ACCORDING TO L.A. HAHN
George Bragues
© 2010
University of Guelph-Humber207 Humber College Blvd. Toronto, Ontario M9W 5L7
Phone: 416.798.1331, Ext. 6049Fax: 416.798.2905
Email: [email protected]
1
NEITHER EFFICIENT NOR ANIMALLY SPIRITED, BUT
EVENTUALLY ADJUSTING:
THE STOCK MARKET ACCORDING TO L.A. HAHN
2
Abstract
Already tottering from the aftermath of the 1990’s
dotcom bubble, the Efficient Markets Hypothesis (EMH) was
dealt a fatal blow by the financial crisis of 2007-2009.
Amid the collapse of EMH, we have witnessed a revival of
Keynesian conceptions of the financial markets. According to
such views, security prices are chiefly driven by emotional
forces that systematically distort the allocation of
investment unless corrected by the government. Exemplifying
this trend is the rising influence of behavioral finance, a
field defined by its attempt to integrate the claims of
cognitive and social psychology into financial economics.
But if EMH exaggerates the rational side of human nature,
3
behavioral finance goes too far in reducing us to slaves of
the emotions.
In search of a middle way, we explore the writings of
L. Albert Hahn, a German banker and investor who made his
name in the mid-20th century as a critic of Keynesian
economics, but who has since been neglected in the economics
literature. Grounded on an Austrian understanding of the
business cycle and uncertainty, Hahn depicts the stock
market as being overwhelmingly inhabited by investors whose
thinking is constrained by mass opinion. While this
generates sustained irrational price movements, such trends
are nevertheless anchored around objective economic facts.
Consequently, deviations from fair values are eventually
corrected in a market process led by a few, independently
minded investors. In Hahn’s view, financial markets are
neither efficient nor animally spirited, but eventually
adjusting.
4
1. Introduction
Until recently, the Efficient Markets Hypothesis (EMH)
demonstrated an impressive resiliency in the face of
discordant events. It emerged from the 1987 stock market
crash only slightly bruised, though the Dow Jones Industrial
Average fell a record 22.6% in a single day when the only
news that might have possibly accounted for such a cataclysm
was a disagreement among industrialized nations about
currency and interest rate levels. Somehow, though it was
left tottering, it managed to survive the denouement of the
late-1990’s dotcom bubble, during which the Nasdaq Composite
Index nearly quadrupled in an eighteen month period while
Internet companies, such as eToys and TheGlobe.com, were
accorded multi-billion valuations despite generating limited
revenues and no profits. With the financial crisis of 2007-
2009, however, it seems that EMH has finally succumbed. Here
was a situation, after all, in which a multitude of
sophisticated analysts and investors, operating in the
world’s leading financial institutions, grossly overvalued
the mortgage backed securities at the heart of the crisis
5
and systematically undervalued the risk in their portfolios,
all the while relying on models quantitatively constructed
on the assumptions of EMH.
Just as the crisis has revived Keynesian ideas in
macroeconomics, so it has led observers to revisit the
sections of The General Theory of Employment, Interest, and Money that
address the behavior of securities markets. There, Keynes
compares the stock market to a giant casino, describing
investors as fundamentally driven by “animal spirits”,
making decisions to buy and sell based on the estimated
direction of crowd psychology as opposed to the intrinsic
value of financial assets. Today, this Keynesian perspective
is being taken up by Behavioral Finance (BF), a school of
thought that began percolating at the margins of financial
economics in the mid-1980’s and which has since dethroned
EMH of its monopoly status in the discipline to become a
formidable alternative. Based on the work of Amos Tversky
and Daniel Kahneman (1979, 1982), BF applies the findings of
psychology to explain price formation on securities markets.
Opposing the EMH presupposition of human beings as utility
6
maximizing calculators, BF sees the mind as inextricably
swayed by emotions, feelings, social influences, cognitive
biases, and heuristics.
No doubt, BF offers a useful corrective to EMH. Yet
common sense, in tandem with a bit of elementary logic,
suggests that it cannot fully account for market phenomena.
If everyday observation amply confirms that we are not cool
logicians, it also reveals examples in which people manage
to overcome their biases and control their passions. An
investor is often enticed by greed to buy a penny stock
touted on an Internet newsgroup only to be brought back to
reason by the realization that the deal is too good to be
true. What is more, markets surely do regain their senses
after bouts of extreme pessimism and optimism. And while
prices may not always be exactly right, it would be hard to
deny that, on occasion at least, certain securities, if not
stocks in general, are correctly valued. Yet if the human
mind is the slave of sub-rational forces, as BF seems to
claim, these moments of rationality are a puzzle. If it is
7
such a challenge to impartially reason, how then do we
manage to get things right from time to time?
To explain this, one would have to assume that, beyond
the periodic deviations from fair values, there exists some
ultimate concordance between the passions and efficient
pricing, that a psychological equivalent of Adam Smith’s
invisible hand somehow propels greed, fear, and myopia
towards the realization of truth in financial markets
without anyone rationally intending it. Otherwise, the
intermittent episodes of market sanity have to be attributed
to chance. Granted, this dilemma can be avoided by relaxing
the causal force of irrational impulses, such that reason is
posited as being merely influenced by the emotions in
varying degrees under specified conditions, instead of being
universally determined by them. But not only does this
qualification undermine the elegance and simplicity that a
scientific theory is supposed to have – an ideal to which BF
aspires as a social science discipline – it requires a more
nuanced portrait of the human mind than that school of
8
thought has thus far provided with its unremitting emphasis
on the vulnerability of our intellectual faculties.
Hence we are in need of a middle way between EMH and
BF. In search of this, we return to the writings of Lucien
Albert (L.A.) Hahn, a self-styled, common-sense economist
who first gained notice with his Economic Theory of Bank Credit
(1921). In a career that traversed the worlds of academia
and banking, Hahn attained his greatest level of fame with
The Economics of Illusion (1949), a critique of Keynes, before
laying out his own economic theory in Common Sense Economics
(1956). Since then, Hahn’s work has been almost forgotten;
only two articles on Hahn come to sight in the scholarly
literature over the last twenty years (Selgin and Boudreaux
1990; Leeson 1997).
Hahn’s views on the stock market are set forth in the
final part of Common Sense Economics. Embarking from an
Austrian understanding of the business cycle and
uncertainty, fleshed out with insights from psychology, Hahn
argues that stock prices result from a combination of
objective and subjective factors. On his account, the
9
influence of mass opinion and mental inertia over most
people’s psyches generates sustained divergences from
intrinsic values. Sooner or later, Hahn observes, these
distortions are corrected by the pull of the objective facts
in a process led by a few alert, independently minded
investors. In Hahn’s analysis – which this paper finds has
stood the test of time -- financial markets are neither
perfectly efficient, nor animally spirited, but eventually
adjusting.
2. Current Theories of Price Formation in Financial Markets
Anyone putting themselves forward as a common sense
economist must have their views evaluated against, not just
the reigning academic theories, but also vis-à-vis the way
in which the relevant practitioners understand their own
activity. Among stock market professionals, the myriad of
investing and trading strategies followed all belong to
either one, or a mix, of two approaches: fundamental
analysis (FA) and technical analysis (TA). The first is the
more predominant and respected of the two, though the second
10
has gained adherents and stature over the last two decades
with the development of faster computers and increased
access to short-term trading opportunities. While most
investors rely exclusively on either one of the two
methodologies, more than a few combine them, typically by
using FA to identify which stocks to purchase or sell and
then turning to TA in deciding when precisely to execute a
transaction.
FA insists that the best way to make investments
decisions is to analyze the financial data pertaining to a
security. It states, too, the necessity of accounting for
industry and macroeconomic conditions that impinge on a
security’s value, the marketability of the firm’s goods and
services, as well as the quality of management. Thus,
practitioners of FA pore over a firm’s balance sheet, its
cash flow statement, reported earnings and profit margins.
They will evaluate how a company’s products stack up against
the competition and whether its strategy is adequately
framed to boost profitability. They will gauge the firm’s
profit potential and risk exposures at different phases of
11
the business cycle and ascertain whether it is part of an
industry that is in a speculative, growth, maturity, or
decline phase. All this is done with a view to determining
the security’s intrinsic value. Some try to arrive at this
number by projecting future cash flows and then discounting
these to their present value. Most FA practitioners, though,
apply a valuation metric of some kind, most commonly the
price to earnings (PE) ratio, against a group of comparable
securities. Say company XYZ earned $1 per share in the last
twelve months and its shares currently trade at $10, giving
it a PE ratio of 10. Now imagine that XYZ’s industry peers
carry a PE ratio of 15. After establishing that XYZ is
equally as solid as the rest of the industry, an FA investor
will conclude that the shares ought to have a PE of 15 and
thus are really worth $15. Since here the intrinsic value is
greater than the market price, the investor ought to
purchase the security and hold it at least until it reaches
intrinsic value. But if, on the other hand, the intrinsic
value were less than market price, investors are supposed to
sell the security or, if they are willing to be more
12
aggressive, sell it short in an attempt to profit from a
declining share price.
Clearly, FA assumes that financial markets are only
sporadically efficient. According to the bible of FA,
Graham and Dodd’s Security Analysis, “market prices, like a stopped
clock, are a correct representation of value twice in an
investor’s day” (Cottle, Murray, and Block 1988, 26).
However much information is now readily available to
investors, FA proponents say, the fact remains that it is
interpreted differently and that most observers fail to
capture the more subtle and revealing bits of data within an
evolving composite view. Not to mention that markets are
subject to the oscillations of fashion which bring different
industry sectors in and out of favor alongside the waves of
fear and greed that engulf the generality of stocks.
Diametrically opposed to FA, TA ignores all the
financial, industry, and economic data (Edwards and Magee
2001). Instead, TA focuses on the historical movement of
prices and transactional volumes. This price and volume data
is depicted on charts, which practitioners of TA examine for
13
the presence of trends. Their modus operandi is to ride a
trend until it shows signs of changing, at which point they
reverse their market positions to exploit the new price
move. To gauge these trends, TA refers to a set of patterns,
such as the head and shoulders and pennant formations, in
judging whether prices are consolidating within the
prevailing trend or are at a critical turning point. Trend
lines are drawn connecting significant high and low points,
moving averages calculated, and indicators (i.e.,
stochastics, relative strength index, on balance volume)
derived through a mathematical transformation of price and
volume data into directional barometers. When asked to
explain why charts are more instructive than financial
statements, TA’s supporters aver that all fundamental
information relevant to a security – whether it be
financial, economic, strategic, or political – is already
reflected in the price. Charts, too, are said to disclose
the historical reality that markets often trend. Or, to put
it in statistical terms, financial asset returns exhibit
autocorrelation. Finally, TA claims that the psychological
14
laws governing human nature mean that chart patterns
inevitably repeat themselves (Murphy 1986, 2-4).
While the seeds of EMH can be found as early as Louis
Bechelier (2006) and Alfred Cowles (1933, 1944), the theory
came into prominence with Eugene Fama (1970) and Paul
Samuelson (1965) in the 1960’s and 1970’s. From the fact
that investors compete to find the best investment
prospects, EMH deduces that this search must equilibrate
with the elimination of all misvaluations. For if any such
exist, investors will immediately exploit the arbitrage
opportunity thereby presented until their actions move
prices until market and intrinsic value is equal. So long as
information is readily accessible and the barriers to
trading are minimal, this no-arbitrage equilibrium will be
reached quickly in response to any changes in market
conditions. Rather than being a goal to which market forces
are drawn and only rarely achieved, as the Austrian
economics tradition holds, equilibrium is seen by EMH in
neo-classical terms as the ordinary state of affairs
(Boettke 2010). As such, EMH asserts that stock prices
15
reflect all available information. In the weak version of
EMH, this claim is restricted to information about
historical prices, thereby rejecting TA. EMH questions FA
through its semi-strong version, according to which all
publicly information about a company’s financial and
economic situation is also encompassed in the stock price.
There is also a strong version that states all relevant
information whatsoever, including that possessed by
insiders, is assimilated into prices, though hardly any EMH
advocate subscribes to it. So other than conceding an edge
to insiders, EMH claims that investors earn returns, not by
buying undervalued securities and selling (or also shorting)
overvalued ones, but by assuming non-diversifiable risk in
their portfolios (Malkiel, 180-215).
Despite its portrayal of investors as emotional and
biased, BF admits this description does not apply to every
single investor. A few are rational. Having made this
exception, BF gives itself a means of solving the
aforementioned puzzle of how to explain the periodic
episodes of reasonable valuations when passion and bad
16
judgment is so prevalent. Perhaps the elite corps of
rational investors cancel their irrational brethren by
exploiting the latter’s mistakes? Indeed, EMH invokes such
arbitrage trading to deal with the glaring fact that not
everyone lives up to their assumption of utility maximizing
behavior. BF, however, declines this tack, arguing instead
that the rational face constraints to arbitrage. Once prices
move away from correct levels, no guarantee exists that the
deviation will not further widen and persist under the sway
of irrational traders. Value arbitrageurs thus expose
themselves to the danger of having to carry a losing
position over a long period during which the intrinsic value
of the security undergoes an adverse change or paper losses
grow to the point of inducing financial stress. Recognizing
this, rational investors will either resist the urge to
trade against the irrational, or perhaps even try to join
them for as long as they are in control of the price
movement, thereby reinforcing the divergence from correct
values. As Keynes originally put this BF claim: “Investment
based on genuine long-term expectation is so difficult to-
17
day as to be scarcely practicable. He who attempts it must
surely lead much more laborious days and run greater risks
than he who tries guess better than the crowd how the crowd
will behave” (Keynes 1964, 157).
Where BF goes beyond Keynes is in specifying the types
of individual biases that combine to mislead the crowd. To
cite the more notable findings, BF scholars conclude that
investors, particularly male, overestimate their investment
abilities (the overconfidence bias); they lag in updating
their beliefs to new evidence (the conservatism bias);
filter information that corroborates their existing beliefs
(the confirmatory bias); surmise that runs within a series
of events must soon reverse (gambler’s fallacy); deduce that
a repeated occurrence of events portends a larger trend
(clustering illusion); and overly rely on easily accessible
memories or ideas in rendering probability judgments (the
availability bias). So too, BF observes that investors are
more sensitive to losses than to gains of the same amount of
money, overweight small probabilities and underweight large
ones, and change their decisions about the same probability
18
scenarios when these are framed differently (Barberis &
Thaler, 2002; Shefrin, 2000).
3. Hahn’s Critique of Market Efficiency
L.A. Hahn wades into the debate about financial markets
because it illuminates the relationship between expectations
and facts in economic life – that is, the extent to which
human subjectivity affects the decisions that people make
relative to the necessities imposed by the objective realm
on individual choices. Entranced by the prospect of
replicating the success of physics in the human realm, the
dominant streams of economics over the last two centuries –
whether classical or neo-classical – have tended to
emphasize the determinative role of objective variables in
accounting for economic phenomena. The mathematical
techniques employed by orthodox economists, with all their
equations depicting a given state of affairs as a function
of various conditions, presuppose the priority of the
objective over the subjective. But this epistemological
preference, Hahn points out, runs asunder on the fact that
19
businesspersons do not simply react to changes in the
economic data taking place now, but must form some estimate
of what shifts might occur in the future. This is because of
the interval existing between the initial decision to deploy
resources in the production of a good or service and the
time it is ready for sale. Between these two points, input
costs might change, as may consumer tastes and the
competitive environment, either of which can significantly
affect the profitability of one’s business projects. With
businesspersons thus compelled to become forecasters, as the
Austrian economists recognize (Mises 1963, 105-106 ), the
subjective factor assumes an influential role, precisely
insofar the future is ultimately incomprehensible. From this
it follows that the future cannot determine anything in the
present and that the mind is liberated to conceive numerous
scenarios in line with its psychological propensities.
That such expectations constitute the basic stuff of
financial markets is obvious from even the most cursory
observation of trading activity. When a company reports its
earnings or the government releases the latest employment
20
numbers, it is not so much what the data itself reveals that
moves markets, but more so how the newly divulged
information compares to expectations. Record profits may be
announced and the unemployment rate fall dramatically, but
stock prices may still drop if the good news does not accord
with forecasts. In evaluating the efficiency of markets, the
question thus becomes: do the expectations set have a
tendency to be on the mark? Prediction errors are
inevitable, of course, but if these turn out to be normally
distributed around realized levels then the argument for
market rationality is greatly strengthened. It is precisely
the contention of EMH that the market’s forecasting mistakes
are normally distributed. As such, the subjective element in
expectations is rendered mathematically tractable by the
application of statistical techniques. The result is that
expectations are objectified, so to speak, by virtue of
being construed as a mechanism reflecting the real
probabilities of events. But if expectations err universally
and systematically, then human subjectivity cannot be viewed
simply as a mirror to the objective world, and must instead
21
take on the character of a truly independent cause of market
phenomena. This is exactly Hahn’s point.
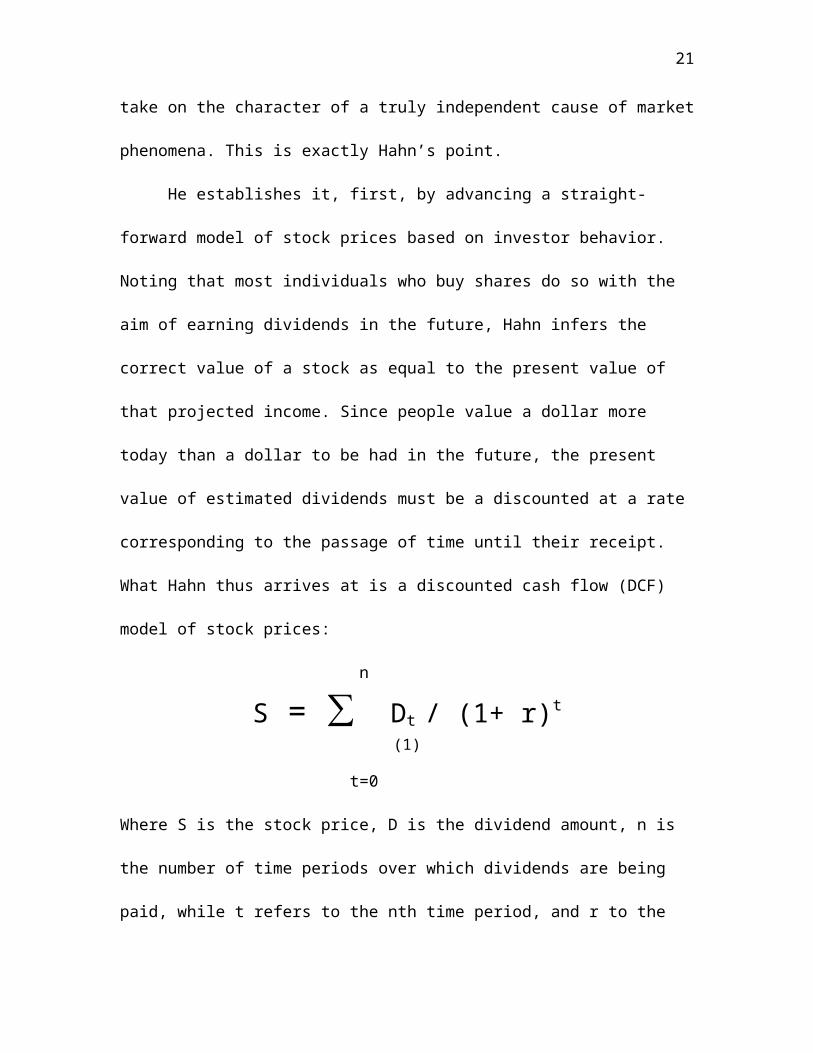
He establishes it, first, by advancing a straight-
forward model of stock prices based on investor behavior.
Noting that most individuals who buy shares do so with the
aim of earning dividends in the future, Hahn infers the
correct value of a stock as equal to the present value of
that projected income. Since people value a dollar more
today than a dollar to be had in the future, the present
value of estimated dividends must be a discounted at a rate
corresponding to the passage of time until their receipt.
What Hahn thus arrives at is a discounted cash flow (DCF)
model of stock prices:
n
S = ∑ Dt / (1+ r)t
(1)
t=0
Where S is the stock price, D is the dividend amount, n is
the number of time periods over which dividends are being
paid, while t refers to the nth time period, and r to the
22
discount rate. Assuming the dividends are secure, this rate
must equal the yield on long-term bonds, for otherwise
investors would have an incentive to switch between bonds
and stocks to whichever offered the higher return. Hahn does
not spell out what happens if the dividend payments are not
as certain as the bonds, but the obvious consequence is that
the discount rate on the stock will contain a risk premium.
One might counter that investors actually focus on
earnings, rather than dividends, and that they often pin
their hopes on selling at a higher price than where they
bought. Even so, as Hahn observes, investors cannot really
care about earnings per se, since they do not necessarily
receive them as income, but only insofar as these signal the
firm’s capacity to eventually issue dividends. Investors
intent on capital gains must also concern themselves with
dividends inasmuch as the stock price can only rise if the
prospect of their payment and growth increase, as proxied by
earnings (Hahn 1956, 197). Given that financial markets are
not populated solely by short-term traders, the latter will
eventually have to deal with someone having a longer-term
23
horizon. Such an investor will not purchase shares from the
short-term trader, and help close the latter’s position at a
profit, unless the outlook for dividends justifies the price
(ibid. 208).
Having formulated a DCF model, Hahn proceeded to test
its predictions of intrinsic value against market prices. By
proceeding in this fashion, Hahn anticipates the centerpiece
of Robert Shiller’s (2000, 184-190) brief against market
efficiency. But unlike Shiller, a leading figure in the BF
school, Hahn did not use the model to generate point
estimates of the present value of future dividends, probably
because of the difficulty of forecasting those numbers the
further one goes out into the future. Another factor,
arguably, is Hahn’s (1956) distrust of the mathematical
methods that have come to dominate economics: “the
mathematical language of modern economics has led many an
economist to describe not so much what actually happens but
what possibly could happen … any resemblance of these
descriptions and explanations to reality seems to me purely
24
accidental” (xi). Consequently, Hahn only uses the model as
a tool to interpret price movements.
The model thus tells us to expect stock prices to vary
directly with dividends and to move inversely with bond
yields. During the 1929-1956 period that Hahn investigated,
the corporate bond yields that he used to represent the
discount rate changed little from 1937 forward. Before then,
stock prices accorded with changes in the bond yield, with
equities declining between 1929 and 1932 as corporate bond
yields rose, and equities increasing from 1933 to1937 as
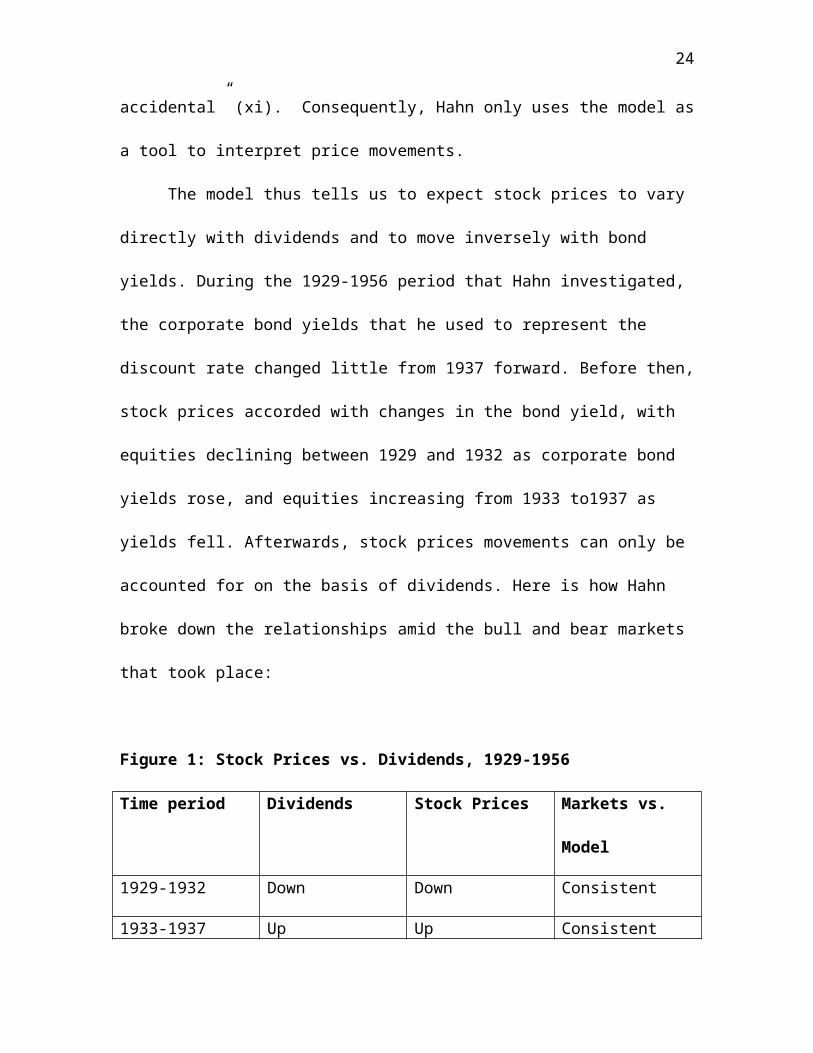
yields fell. Afterwards, stock prices movements can only be
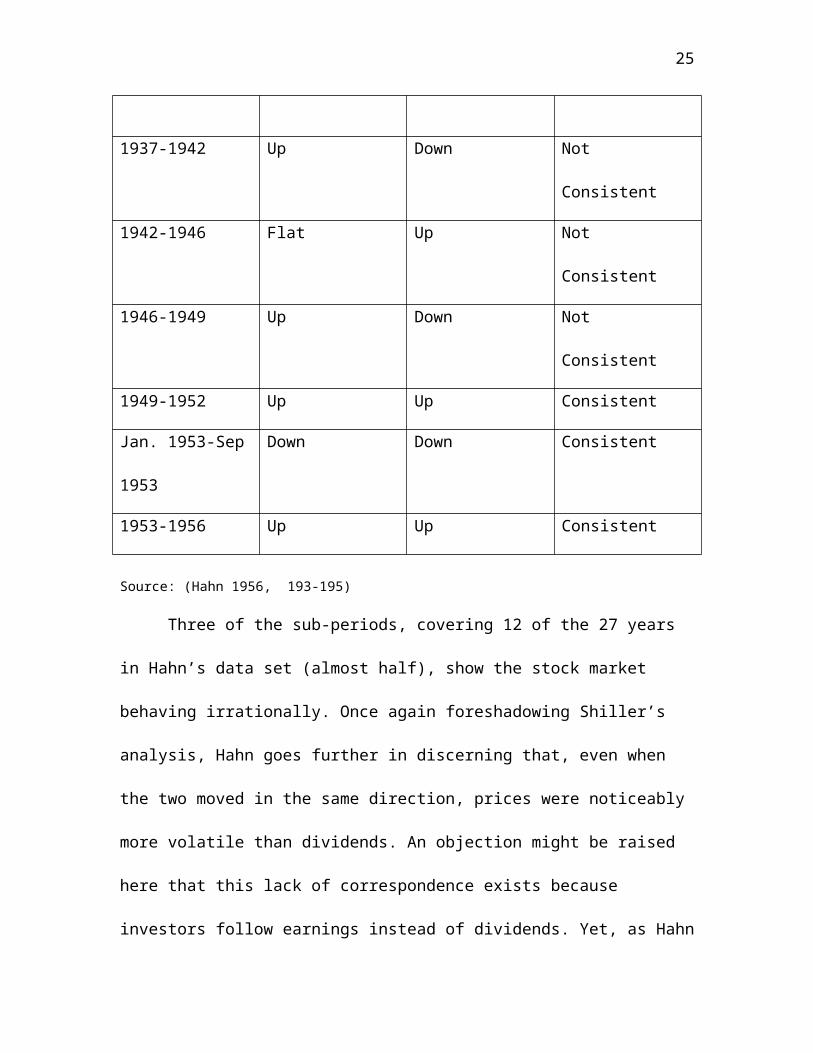
accounted for on the basis of dividends. Here is how Hahn
broke down the relationships amid the bull and bear markets
that took place:
Figure 1: Stock Prices vs. Dividends, 1929-1956
Time period Dividends Stock Prices Markets vs.
Model
1929-1932 Down Down Consistent
1933-1937 Up Up Consistent
25
1937-1942 Up Down Not
Consistent
1942-1946 Flat Up Not
Consistent
1946-1949 Up Down Not
Consistent
1949-1952 Up Up Consistent
Jan. 1953-Sep
1953
Down Down Consistent
1953-1956 Up Up Consistent
Source: (Hahn 1956, 193-195)
Three of the sub-periods, covering 12 of the 27 years
in Hahn’s data set (almost half), show the stock market
behaving irrationally. Once again foreshadowing Shiller’s
analysis, Hahn goes further in discerning that, even when
the two moved in the same direction, prices were noticeably
more volatile than dividends. An objection might be raised
here that this lack of correspondence exists because
investors follow earnings instead of dividends. Yet, as Hahn
26
notes, earnings and dividends generally move in tandem, just
as one would expect from the former serving as a proxy for
the latter. Earnings, indeed, are more volatile, since
corporate boards prefer to keep dividend payouts steady
knowing that profitability is subject to gyration from one
year to the next. Stock prices, as a result, track earnings
more closely. Still, this begs the question: why is it that
investors fail to recognize the instability of earnings that
firms provision for in their dividend policy?
Before we can affirm Hahn’s conclusion that markets are
inefficient, we cannot forget that more than fifty years of
additional data has become available since he wrote. Let us
see, then, how his analysis has stood the test of time using
his interpretive method. Doing so from 1956 forward,
however, is a more complicated exercise than the period that
Hahn covered. For one thing, bond yields cannot be so easily
accounted for and separated, as these began a multi-decade
ascent in the mid-1950’s before descending from 1981 to the
present time. Hence, bond yields must now be explicitly
factored into our enquiry. Then too, inflation, previously a
27
sporadic affair, rose steadily, hitting double digit levels
in the late 1970’s and early 1980’s until being subdued at
lower, if still not trivial, rates. Inasmuch as investors
are able to react faster to changes in inflation than
corporate boards, depending on nominal data leaves us
vulnerable to misinterpreting a legitimate divergence
between stock prices and dividends.
To address this issue, we employ inflation adjusted
figures (as measured by annual percentage changes in the
Consumer Price Index) both for the Standard and Poor’s
Composite Index (S&P 500) as well as the dividends and
earnings per share of its constituent firms. We follow Hahn
in adopting corporate bond yields as our proxy for the
discount rate, and, more specifically, those rated Aaa by
Moody’s. With this variable, though, we apply nominal rates
as opposed to real figures. Were we actually inputting
numbers into the DCF model to calculate specific intrinsic
values, real rates would be proper. Real cash flows, after
all, must be discounted by real rates. As we are not using
the model in this way – estimating all of the future value
28
of the model’s variables being a quixotic exercise – but
rather as an interpretive guide, nominal rates hold a key
advantage. In discounting future dividends, markets
naturally factor in expected inflation since a rise in the
general price level will reduce the purchasing power of the
money eventually received. But until the introduction of
inflation indexed bonds in the 1980’s and 1990’s, there was
no way to directly observe the level of expected inflation.
For the entire period under consideration, the only method
of determining a real discount rate would be to subtract the
current level of inflation from the prevailing corporate
bond yield. Nominal rates, on the other hand, at least have
the virtue of reflecting inflationary expectations. A
heightening of such expectations lowers bond prices (raises
yields), while a reduction raises bond prices (lower
yields). The direction in which nominal rates travel provide
an indication of the market’s view of the future price
level.
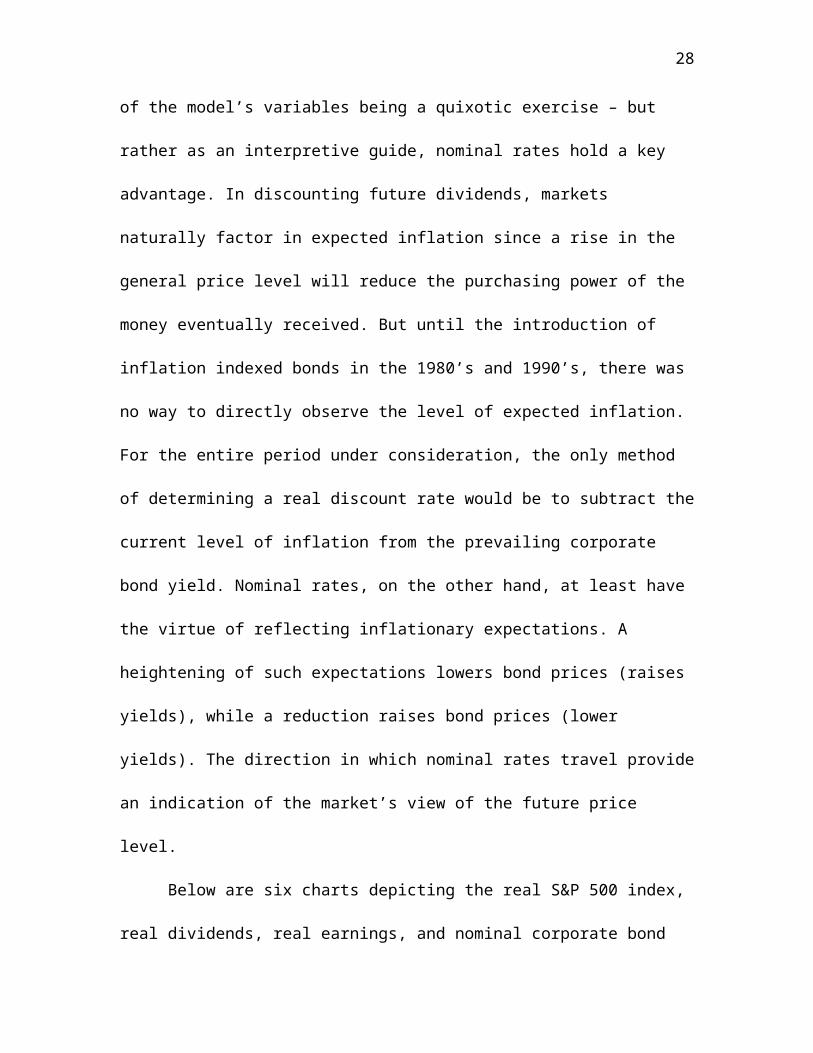
Below are six charts depicting the real S&P 500 index,
real dividends, real earnings, and nominal corporate bond
29
yields over the 1956-1968, 1968-1982, and 1982-2009 time
frames. This break down separates three broad trends that
are discernible between 1956-2009. The 1956-1968 interval
saw the continuation of the post-World War II bull market.
From 1968 to 1982, the combination of inflation and slower
economic growth led to a sustained decline in stock prices
(the full extent of which, it is worth noting, was veiled in
the nominal S&P 500 index). From 1982 to 2009, the stock
market experienced a historically unprecedented bull phase
from which it has been correcting since 2000.
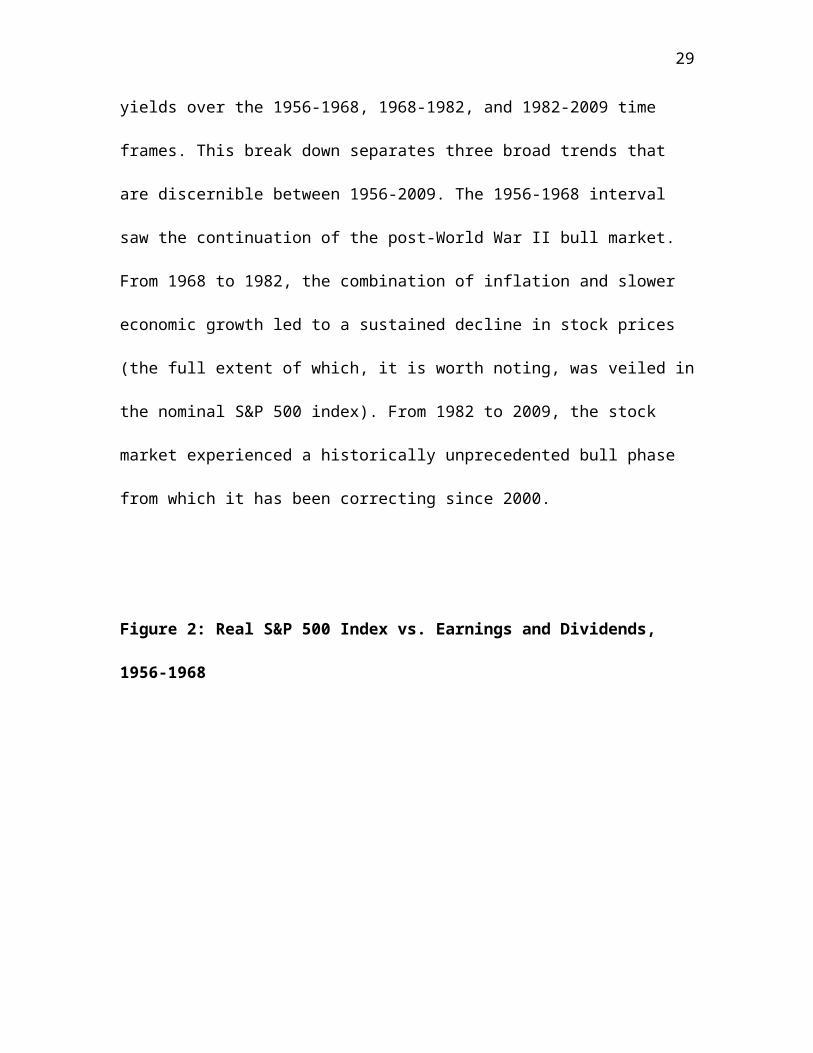
Figure 2: Real S&P 500 Index vs. Earnings and Dividends,
1956-1968
30
Data source: Shiller (2010)
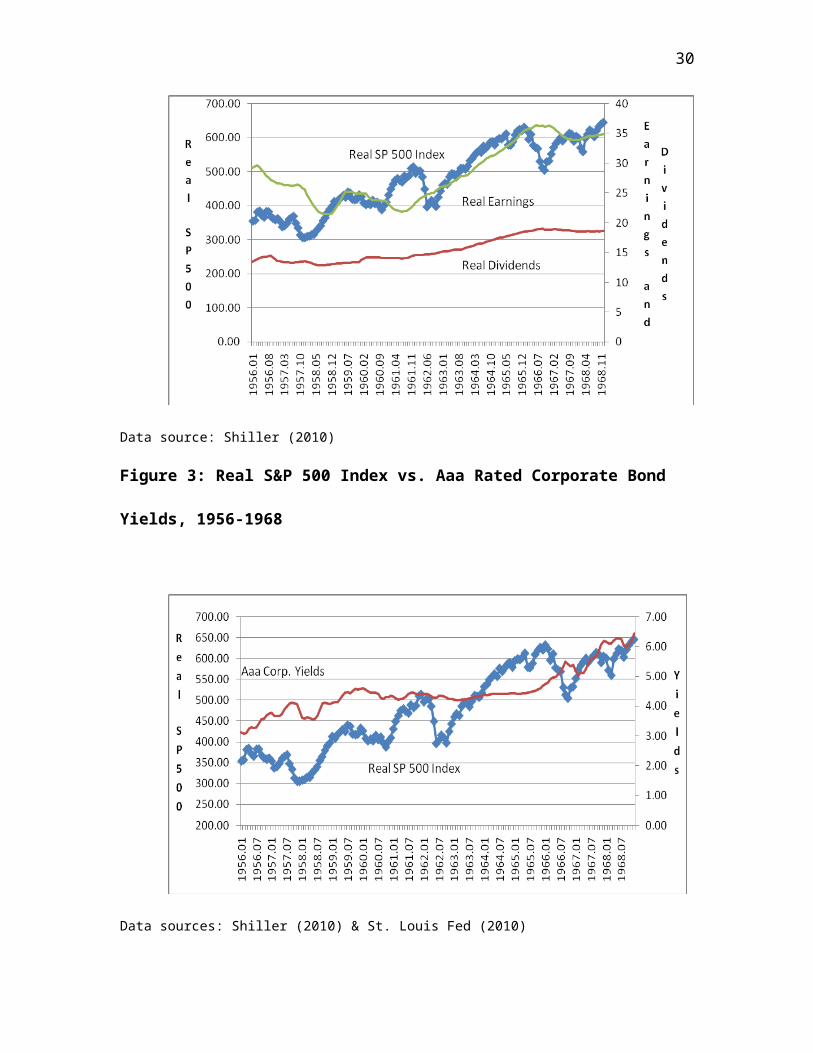
Figure 3: Real S&P 500 Index vs. Aaa Rated Corporate Bond
Yields, 1956-1968
Data sources: Shiller (2010) & St. Louis Fed (2010)
31
In Figure 2, it can be seen that dividends and stock
prices broadly tracked each other, though the latter
exhibited more volatility, just as it did in the 1929-1956
time frame that Hahn examined. This greater volatility seems
due to the fact that investors were swayed by the
vicissitudes of earnings. At odds with the market’s ascent
is the steady rise in nominal yields from 1956-1968 depicted
in Figure 3. It is not out of the question, of course, that
the market’s upward movement was justified by the increase
in dividends outweighing the higher discount rates. Still,
the climb in nominal rates was both significant – doubling
during the period – and persistent.
Figure 4: Real S&P 500 Index vs. Earnings and Dividends,
1968-1982
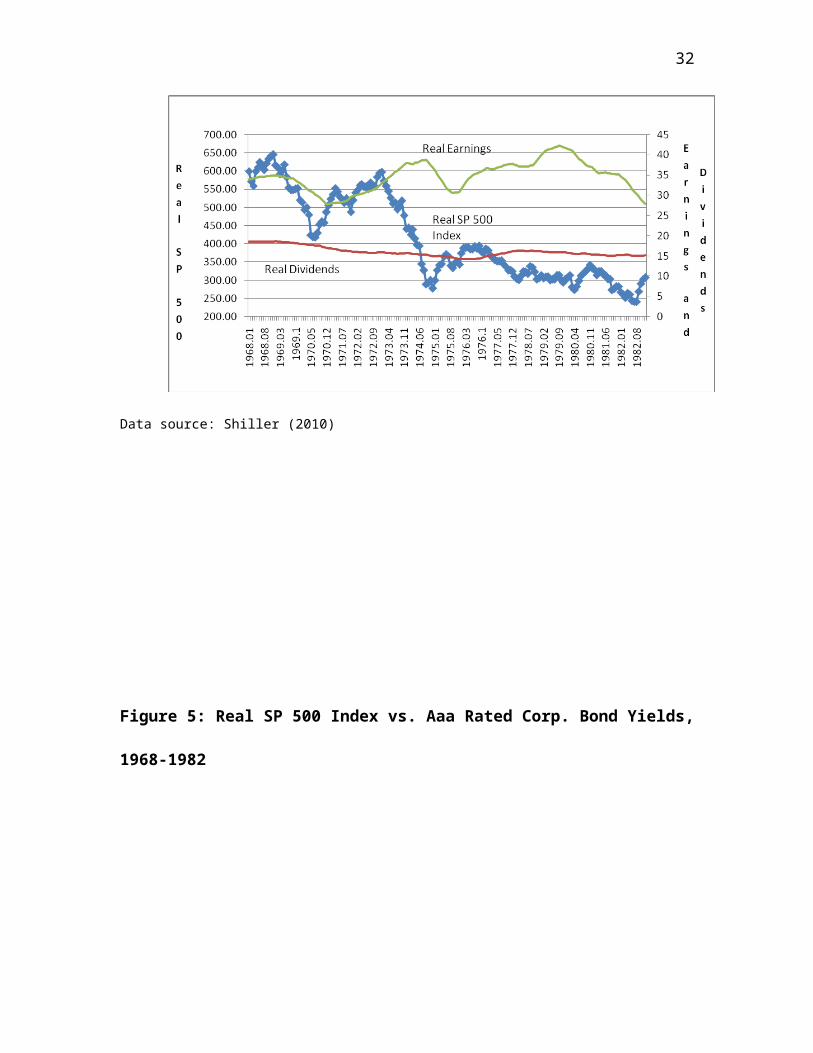
32
Data source: Shiller (2010)
Figure 5: Real SP 500 Index vs. Aaa Rated Corp. Bond Yields,
1968-1982
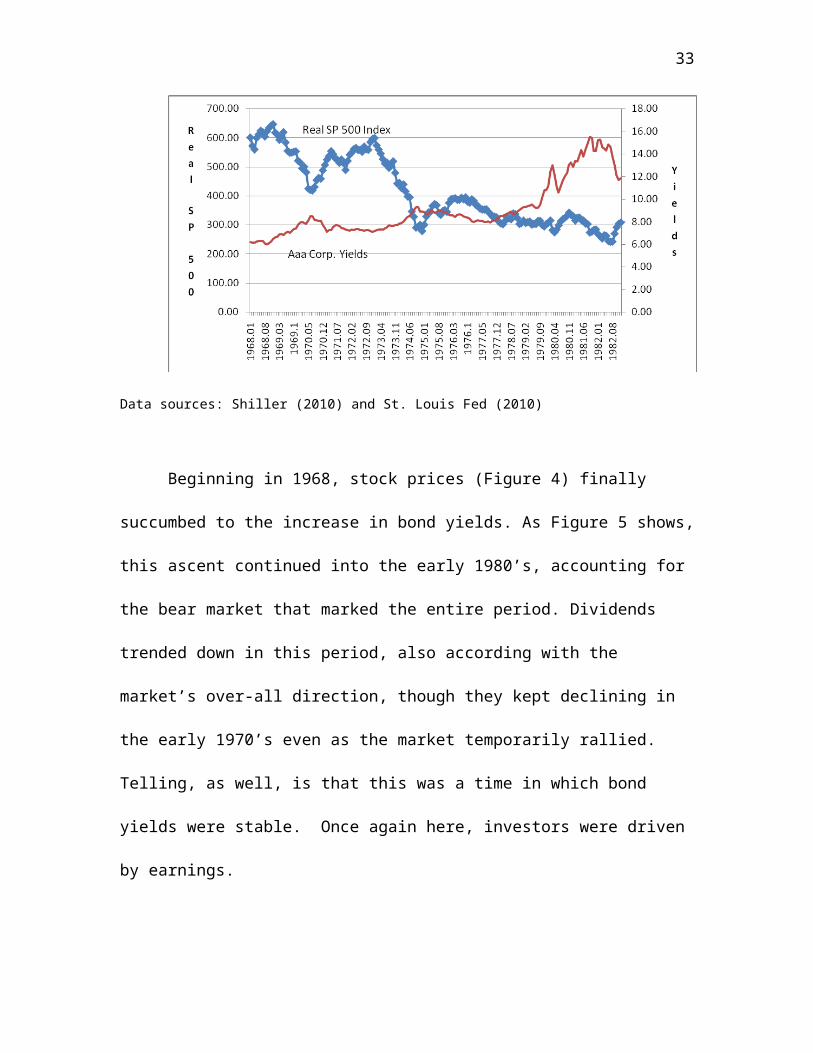
33
Data sources: Shiller (2010) and St. Louis Fed (2010)
Beginning in 1968, stock prices (Figure 4) finally
succumbed to the increase in bond yields. As Figure 5 shows,
this ascent continued into the early 1980’s, accounting for
the bear market that marked the entire period. Dividends
trended down in this period, also according with the
market’s over-all direction, though they kept declining in
the early 1970’s even as the market temporarily rallied.
Telling, as well, is that this was a time in which bond
yields were stable. Once again here, investors were driven
by earnings.
34
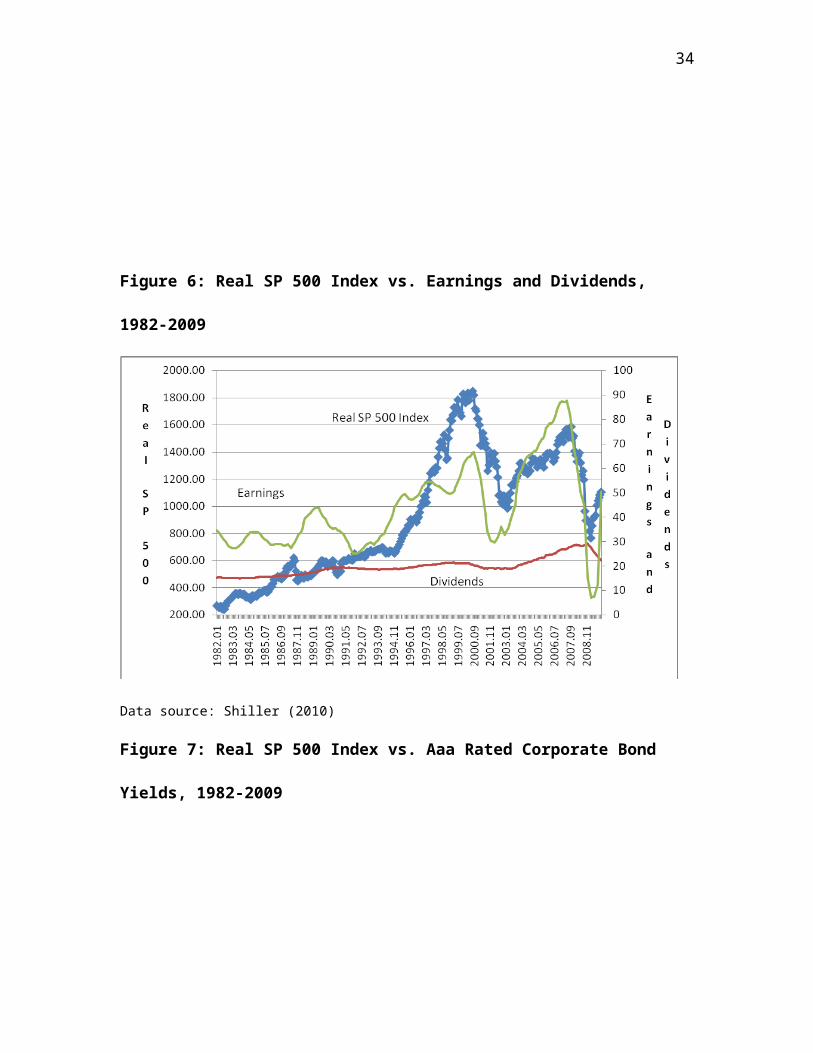
Figure 6: Real SP 500 Index vs. Earnings and Dividends,
1982-2009
Data source: Shiller (2010)
Figure 7: Real SP 500 Index vs. Aaa Rated Corporate Bond
Yields, 1982-2009
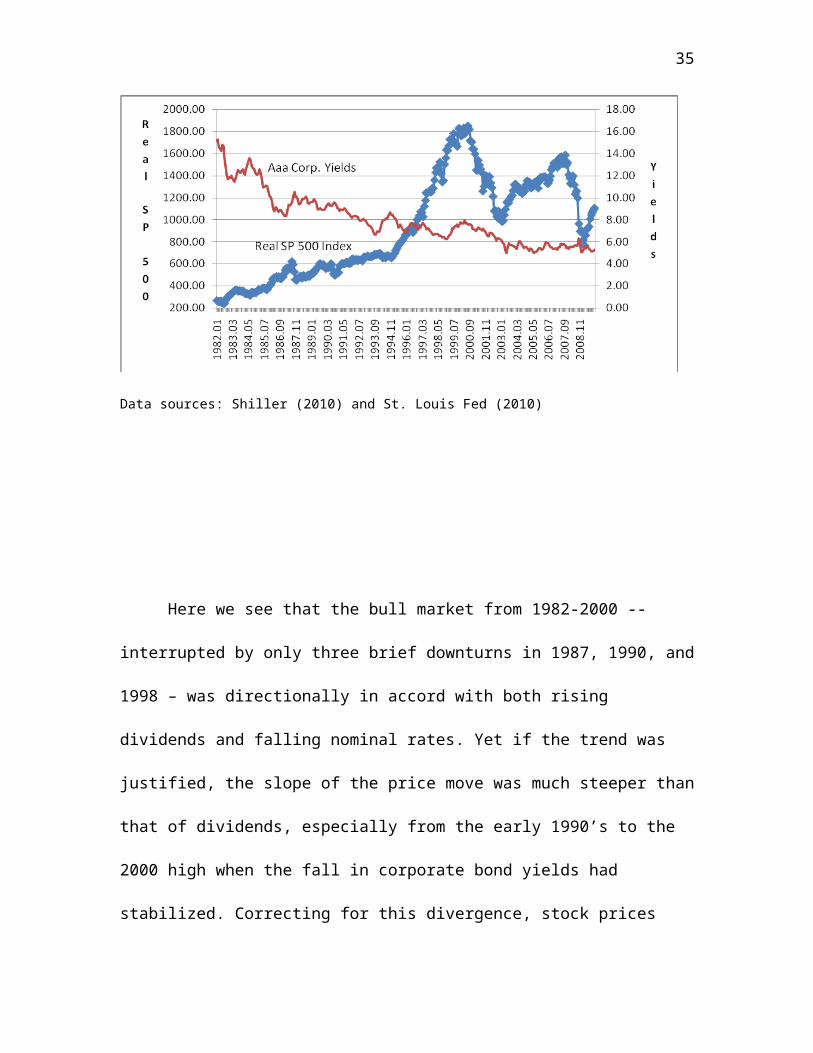
35
Data sources: Shiller (2010) and St. Louis Fed (2010)
Here we see that the bull market from 1982-2000 --
interrupted by only three brief downturns in 1987, 1990, and
1998 – was directionally in accord with both rising
dividends and falling nominal rates. Yet if the trend was
justified, the slope of the price move was much steeper than
that of dividends, especially from the early 1990’s to the
2000 high when the fall in corporate bond yields had
stabilized. Correcting for this divergence, stock prices
36
fell sharply from the 2000 high even as dividends only
gently declined. The real S&P index then failed to establish
new highs on the rally from the 2002 low to match the record
level of dividends.
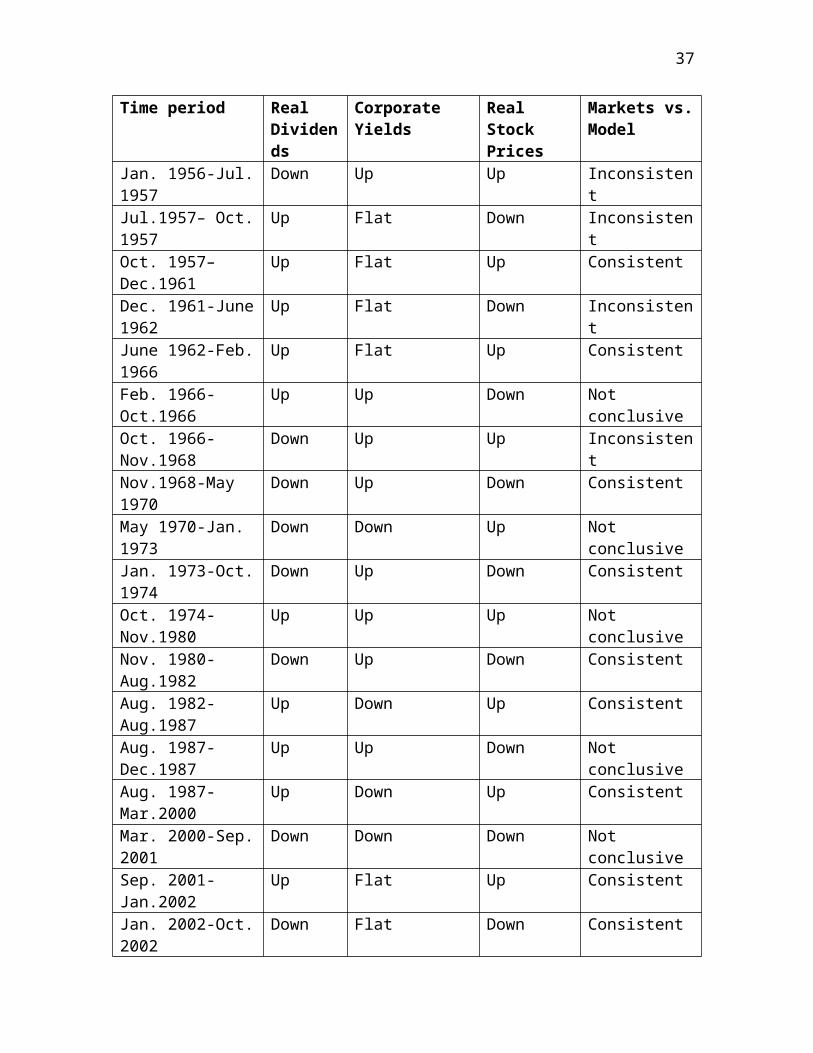
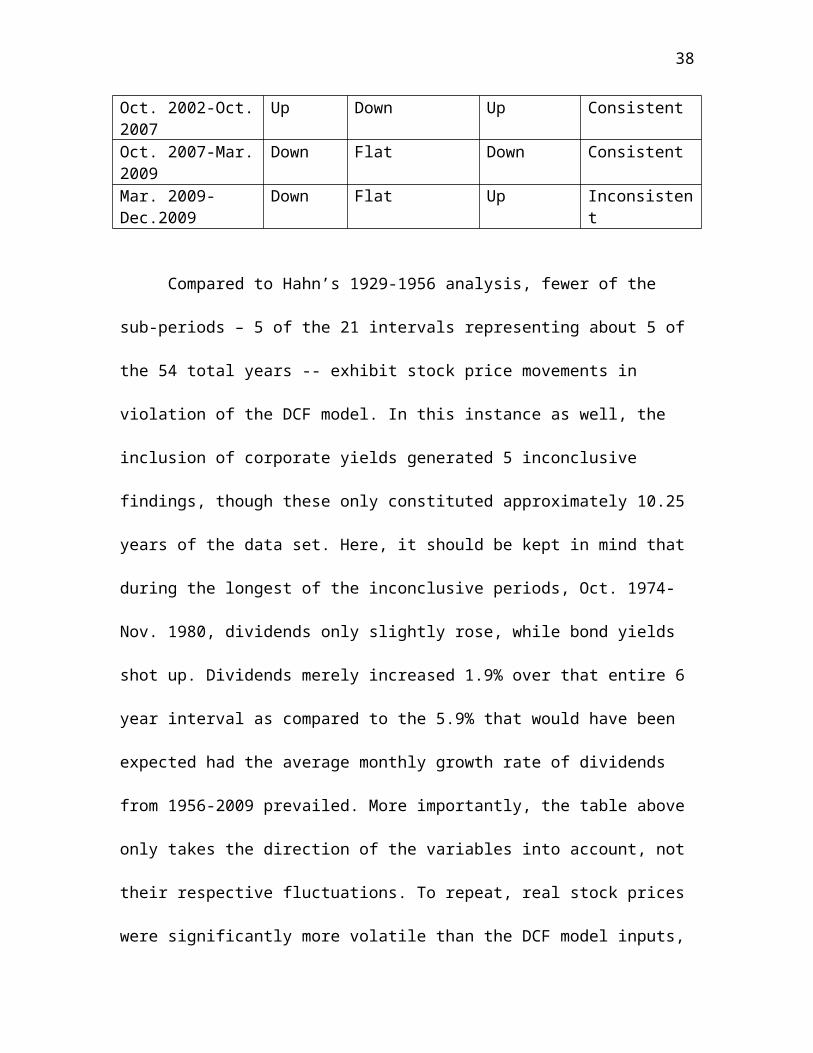
Imitating Hahn’s method, the table below offers a
closer look of the 1956-2009 period, categorized by bull and
bear markets. A bear market is defined as occurring upon a
minimum fall of 20% in the closing price of the nominal S&P
500 index from an earlier peak. A bull market takes place
upon a minimum 20% rise in that index from a low point.
Yields are categorized as flat if there was a 50 basis point
change or less during the bull or bear market in question.
Figure 8: Real Stock Prices vs. Dividends and Yields, 1956-
2009
37
Time period Real Dividends
Corporate Yields
Real Stock Prices
Markets vs.Model
Jan. 1956-Jul.1957
Down Up Up Inconsistent
Jul.1957– Oct.1957
Up Flat Down Inconsistent
Oct. 1957–Dec.1961
Up Flat Up Consistent
Dec. 1961-June1962
Up Flat Down Inconsistent
June 1962-Feb.1966
Up Flat Up Consistent
Feb. 1966-Oct.1966
Up Up Down Not conclusive
Oct. 1966-Nov.1968
Down Up Up Inconsistent
Nov.1968-May 1970
Down Up Down Consistent
May 1970-Jan. 1973
Down Down Up Not conclusive
Jan. 1973-Oct.1974
Down Up Down Consistent
Oct. 1974-Nov.1980
Up Up Up Not conclusive
Nov. 1980-Aug.1982
Down Up Down Consistent
Aug. 1982-Aug.1987
Up Down Up Consistent
Aug. 1987-Dec.1987
Up Up Down Not conclusive
Aug. 1987-Mar.2000
Up Down Up Consistent
Mar. 2000-Sep.2001
Down Down Down Not conclusive
Sep. 2001-Jan.2002
Up Flat Up Consistent
Jan. 2002-Oct.2002
Down Flat Down Consistent
38
Oct. 2002-Oct.2007
Up Down Up Consistent
Oct. 2007-Mar.2009
Down Flat Down Consistent
Mar. 2009-Dec.2009
Down Flat Up Inconsistent
Compared to Hahn’s 1929-1956 analysis, fewer of the
sub-periods – 5 of the 21 intervals representing about 5 of
the 54 total years -- exhibit stock price movements in
violation of the DCF model. In this instance as well, the
inclusion of corporate yields generated 5 inconclusive
findings, though these only constituted approximately 10.25
years of the data set. Here, it should be kept in mind that
during the longest of the inconclusive periods, Oct. 1974-
Nov. 1980, dividends only slightly rose, while bond yields
shot up. Dividends merely increased 1.9% over that entire 6
year interval as compared to the 5.9% that would have been
expected had the average monthly growth rate of dividends
from 1956-2009 prevailed. More importantly, the table above
only takes the direction of the variables into account, not
their respective fluctuations. To repeat, real stock prices
were significantly more volatile than the DCF model inputs,
39
real dividends in particular, throughout the entire 1956-
2009 time frame. And, again, the upward slope in real stock
prices was noticeably more pronounced than that of real
dividends in 1990-2000. On balance, therefore, Hahn’s
conclusion of market inefficiency on the basis of the 1929-
1956 experience is borne out by the subsequent data.
4. The Interplay of Subjective and Objective Forces
At the same time, it cannot be ignored that the market
sometimes gets it right and that, even when it does stray
from intrinsic value, it ultimately finds its way back. Hahn
points out that the relationship between dividends and
stocks becomes much closer once the oscillations created by
bull and bear markets are diminished by smoothing prices
through the calculation of a moving average. Figure 9 checks
to see whether this is also the case for the 1956-2009
period using a 60 month moving average of the real S&P 500
index.
Figure 9: 60 Month Moving Average of Real SP 500 Index vs.
Dividends, 1956-2009

40
Data source: Shiller (2010)
The correlation is indeed tighter, except that the
price average fails to track the dividend increases from
2003 to 2009. These reflect legislation passed by the Bush
Administration in 2003 that lowered the taxation of
dividends. While this change was subsequently extended to
2010, it is set to expire in 2011 unless the U.S. government
chooses to renew it. In view of the uncertainty about this,
the markets have likely factored in the possibility of a
return to the previous tax treatment of dividends. “It must
be borne in mind”, as Hahn (1956) rightly says, “that if any
future change is to lead to changes in the valuation of a
41
share – or of all shares -- it must be expected to be
permanent” (200).
Given how the DCF model looks against a long-term
moving average of stock prices, Hahn concludes that
objective reality ultimately acts as a magnet drawing
markets back from the errors of its shorter and medium-term
ways that continually recur because of the force of human
subjectivity. Usually, Hahn posits, a complete market cycle
proceeds as follows: bull markets emerge out of the depths
of a bear market when dividend yields are high as a result
of a pervasive gloom leading investors to expect further
declines in earnings and dividends. That no bargain hunters
enter the marketplace to take advantage of the high dividend
yields, and thereby raise prices, only reinforces the
negative sentiment. This is what Hahn calls the exaggeration
phase of the bear market. The bull market commences as an
adjustment phase of this overextended move as indications
slowly materialize that the economy is on the mend and
dividends are set to rise. Then, the market enters a normal
phase in which the investing public is neither exuberant nor
42
disconsolate about the future. Share prices now merely obey
the upward trajectory of dividends. But then another
exaggeration stage ensues in which the very fact that
dividends and earnings have been rising generates
expectations that these will continue to rise. Accordingly,
stock prices move ahead of dividends. As prices do not meet
resistance from sellers, and short sellers exploit the
excessive valuations signaled by the low dividend yields,
investors gain reassurance. Finally, a few alert investors
notice that the market’s exalted levels are unsustainable.
These sell and prices start to reverse. As the general
optimism fades, the selling accelerates and we enter another
adjustment phase that launches a bear market. This, too,
subsequently goes into a normal stage during which prices
decline in lockstep with dividends. With time, an
exaggeration phase to the downside transpires and the cycle
starts again. Throughout this entire sequence, Hahn adds, a
mental inertia operates that renders investors incapable of
changing their outlook until the evidence to the contrary
becomes dramatically obvious. The exaggeration phases,
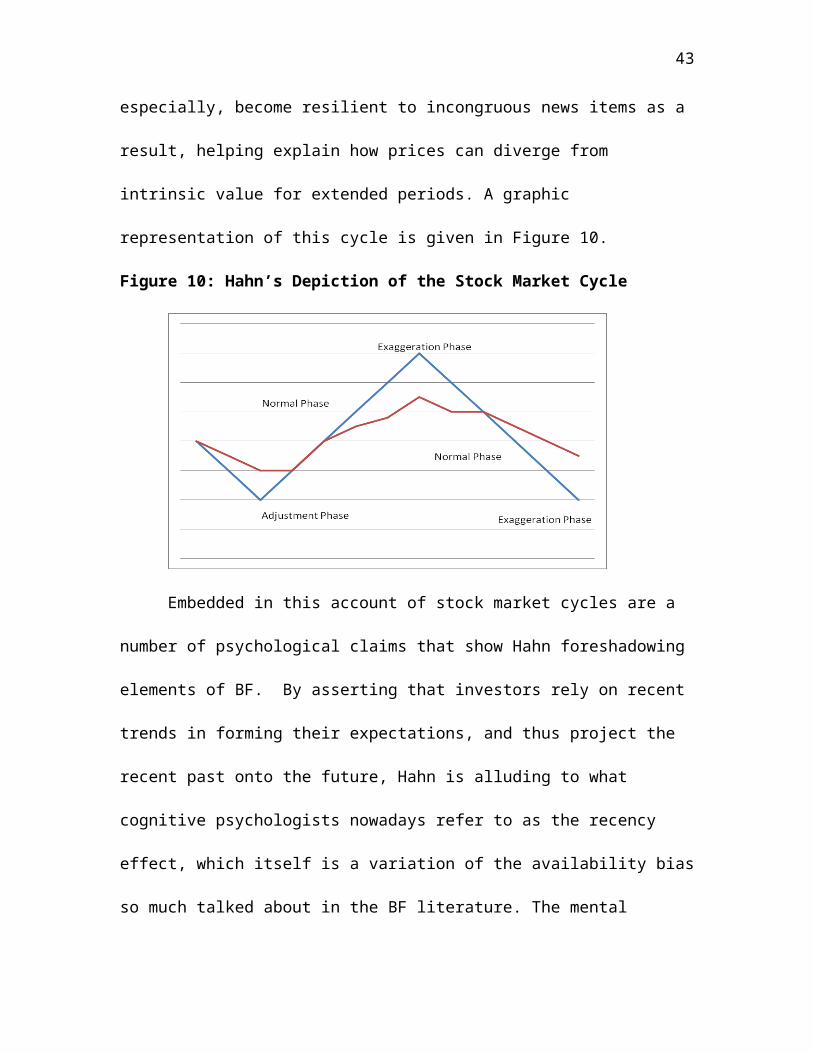
43
especially, become resilient to incongruous news items as a
result, helping explain how prices can diverge from
intrinsic value for extended periods. A graphic
representation of this cycle is given in Figure 10.
Figure 10: Hahn’s Depiction of the Stock Market Cycle
Embedded in this account of stock market cycles are a
number of psychological claims that show Hahn foreshadowing
elements of BF. By asserting that investors rely on recent
trends in forming their expectations, and thus project the
recent past onto the future, Hahn is alluding to what
cognitive psychologists nowadays refer to as the recency
effect, which itself is a variation of the availability bias
so much talked about in the BF literature. The mental
44
inertia, too, that Hahn invokes is equivalent to the
conservatism bias. When he proceeds to outline the
implications of his market theory to investing strategy, he
cites a third psychological trait, namely the individual’s
subjection to mass opinion. “It engulfs not only those who
easily succumb to foreign influences but even those with
normally detached views and sober judgment. An almost
superhuman effort is needed to evade the influence of mass
opinion” (ibid, 212). What this groupthink does, clearly, is
to magnify the predominant trend that the Zeitgeist of the
period happens to be buttressing. Continuing in this
Tocquevillean vein, Hahn even suggests that the
democratization of the stock market enhances this dynamic,
insofar as the widespread dissemination of prices enables
investors to quickly assess what the majority is thinking
(Tocqueville 1969, 254-259). Were Hahn alive to have seen
the Internet, and all the websites offering free quotes and
news, he would surely have concluded that it has augmented
the mental dominance of the crowd.
45
Why, fundamentally, do these subjective factors, these
human thought processes, assume the role that they do in so
often mispricing securities? Why is it, in other words, that
investors are incapable of thinking about the markets in
ways that avoid systematic errors? The very thing, it turns
out, that opens up the economic realm to the play of
subjective forces is that which conduces to market
inefficiency: we cannot know the future. The freedom from
present exigencies that this gives to act on the basis of
our idiosyncratic predictions also dictates our getting
those wrong often. As Hahn correctly notes, if the future
could be known, then securities prices would immediately
reflect that information – a point that would later be
stressed by EMH advocates. The future would then effectively
become the present and cease to exist as a distinct temporal
category. At best, according to Hahn, we can make
probability judgments about the near future. As to the
distant future, “it lies, shrouded in a mist, beyond the
horizon of time” (ibid, 203). Market practitioners
acknowledge this, he insinuates, by restricting the
46
discounting of future developments to twelve months – which
surely does occur, if the predominance of one year earnings
estimates among stock analysts over longer-term forecasts is
any indication.
Even to the extent that an investor is able to make
probability judgments, these are not of the sort described
in statistics textbooks. To be sure, Hahn concedes that a
stock price can, in theory at least, be viewed as the summed
value of various scenarios for the firm, each weighted by
its probability. For example, if there is a 30% that company
PQR will, over the next year, report earnings that
correspond to a share price of $50, and a 70% chance its
eventual income will be such as to correlate with a $40 per
share figure, then PQR stock will trade at $43 (0.3 X $50 +
0.7 X $40). In reality, the number of scenarios is greater
than two and more complicated to delineate, so that the
stock price ends up at the point where the chances of it
going up or down seem to be equal, rather than whatever is
dictated by the calculation of some complex equation.
47
More critically, however, the probabilities imputed are
not mathematical in plotting the frequency of similar events
in the past. In the world of investing, there is no
equivalent of a billion throws of a die to consider, no
large samples of essentially identical phenomena. As Hahn
observes, a market event taking place in one cycle is always
different, in some decisive respect, from an analogous
occurrence in another cycle. An analyst might note, for
example, that the stock market has experienced higher
returns under Democratic presidents, as opposed to
Republican ones, but one cannot simply infer from this that
the pattern will recur. Not only were previous presidents of
the same party often distinctive in their ideological
mindsets and policy approaches, a multitude of other factors
were responsible in moving stock prices -- whose operation,
for all we know, may subsequently combine to overwhelm the
relevance of whether the White House is being occupied by a
Democrat or a Republican. Besides the lack of homogeneity in
the slices of history, the brute fact remains that too few
of them are going to repeat themselves over an investor’s
48
lifetime to enable him or her to depend on the law of large
numbers.
Consequently, though the playing of chances that
investing entails means it can be likened to gambling at a
craps table, no one can proceed in the buying and selling of
securities the way a casino does in operating its games –
that is, by continually playing across numerous locations
according to the same rules on the expectation that, over
time, the expected frequencies will assert themselves. Since
their number of plays is much shorter than that of a casino,
an investor’s risk is significantly higher -- the variance
of their potential outcomes is far greater -- than what a
historical sense of the probabilities might suggest. This
offers an explanation as to why the risk models that Wall
Street employed so spectacularly failed in the recent
financial crisis. Instead of reflecting the mistaken
specification of a normal distribution (Triana, 2009;
Mandelbrot & Hudson, 2006), or the input of insufficient
historical data, the problem lied in thinking that numerical
probabilities could even be assigned at all.
49
Here is how Hahn (1956) aptly puts it:
The case is comparable not to that of the bank in Monte Carlo, which can and does rely on red and black turning up equally often in the long run, but rather to that of the individual player, who cannot know whether the ball will stop on red or on black. He has to take his chance. He may be playing red ten times in succession, although black may win ten times (204-205).
What Hahn basically describes here is the distinction
that Ludwig von Mises (1963, 107-115) drew between class and
case probability. Class probability refers to situations in
which all the factors relevant to the production of numerous
events sharing a set of characteristics are known. The
probability that this set, or class, will occur can be
mathematically calculated. Falling under this category are
the chances of a seven arising from the throw of two dice.
Case probability, by contrast, deals with circumstances in
which some, but not all, of the causal variables are known
and the event in question cannot be classified within a
class. The event is unique and its probability is,
therefore, not subject to a mathematical determination.
Hahn, like Mises, places the game of investing under the
heading of case probability. Indeed, Hahn goes so far as to
50
invoke David Hume’s (1978, 127-130) contention that
probability assessments are subjective mental acts. One
simply feels inclined in favor of one outcome rather than
another, with the level of intensity felt varying roughly
with the preponderance of that outcome relative to other
scenarios in one’s previous experience.
In expounding the objective factors driving stock
prices, Hahn also echoes the Austrian economics tradition.
As we have seen, he argues both that stock prices exhibit
cyclical behavior and that, as per the DCF model, those
prices are a function of expected dividends and prevailing
interest rates. Now since dividends come out of profits, and
these in turn fluctuate with the vicissitudes of the
economy, it follows that the generality of stocks, though
their long-term trajectory will follow secular trends, are
nevertheless affected by the business cycles that have been
a feature of capitalist economies since the 19th century.
The upshot is that the question of what objectively moves
the stock market is necessarily connected to the puzzle of
business cycles. For Hahn, the problem here is figuring out
51
why the demand for goods and services sometimes runs below
production and other times above it. It is not that Say’s
law is wrong. When the business cycle is viewed as a whole,
demand and supply tend to balance. It is just that Say’s law
does not prevail at all times.
One theory for the periodic imbalances, of which
Keynesianism is a variant, is that the economy is inherently
susceptible to underconsumption owing to the excess savings
generated by upper income individuals with the income that
increasingly flows to them in a boom period. Hahn correctly
rejects this theory on the grounds that a downturn in the
business cycle does not arise amid too much savings. Were
this the case, interest rates would be low at that point,
inasmuch as the supply curve of loanable funds would have
shifted to the right, whereas rates are almost always high
when the cycle has reached its apex (Hahn 1956, 161).
Another theory blames overinvestment for business cycles.
During the boom, so the argument goes, businesses invest in
long-term projects, hopeful that consumer demand will render
those profitable. But once those investments are completed,
52
the demand for materials and labor associated with them also
disappear, leaving firms with excess production capacity.
The flaw in this account, Hahn notes, lies in not
recognizing that that an increase in investment permanently
changes the capital structure of the economy. Rather than
planting the seeds for a fall in demand, all that happens is
that a greater proportion of expenditure is devoted to
capital goods in comparison to consumer goods (ibid, 162).
This brings Hahn to Knut Wicksell’s (1936) unnatural
interest rate theory, which grounds the Austrian
understanding of business cycles. According to Wicksell, the
free play of supply and demand forces in the credit market
work to establish the natural rate of interest or, if you
will, the market rate. However, the central bank, with the
commercial banks assisting, can exercise their monopoly
power over currency issuance to drive interest rates away
from the natural or market rate. Where the rate is higher
than the market, fewer loans are sought to finance
consumption and investment expenditures, thus lowering
demand for goods and services. Prices fall and the economic
53
activity declines. Where the rate is lower than the market,
more loans are sought to finance consumption and investment,
thus raising the demand for goods and services. Prices
increase and economic activity rises.
Accordingly, business cycles are the result of central
bank policies. Let us imagine that a change occurs in which
the demand for credit rises because firms now expect the
available investment opportunities to produce a higher
return than the prevailing interest rate. The central bank,
not seeing any inflationary threat and not wanting to cool
the economy in any way, accommodates the rise in credit
demand by relaxing the money supply. Instead of being
constrained to what economic circumstances in reality
afford, the rising demand for credit continues to be met,
fueling a consumption and investment boom. Whether because
the investments made with the borrowed funds fail to meet
expectations, or the central bank is forced to push up
interest rates to deal with the prospect of inflation, or a
combination of both – the economy collapses. Then, the
central bank lowers interest rates in an attempt to revive
54
the economy, erring on the side of keeping them lower than
the market level and so the whole process restarts.
It is very important to note, however, that Hahn
supplements this essentially Austrian account with a
psychological theory influenced by A.C. Pigou’s (1929)
Industrial Fluctuations. Hahn does so to address an objection that
would later be made by the rational expectations school,
namely that the central bank cannot take the economy up and
down, unless people err by not accounting for its actions.
Who would invest in a new capital project well into an
upswing, if they can see that the Federal Reserve is
eventually going to raise interest rates to stop the economy
from overheating? Who is going to shy away from a big
investment amidst a slump if the central bank is committed
to a very loose monetary policy? In Hahn’s view, such
mistakes can only be explained by a pro-cyclical
psychological dynamic in which people are carried by
excitement in prosperous times and sunk by pessimism in
recessionary periods. His analysis of the subjective forces
55
operating in financial markets is meant to corroborate this
point.
Beyond influencing the level of profits, and hence
dividends, that stock prices incorporate, the central bank’s
activities obviously impinge on the discount rate applied by
investors to shares. Everything else remaining equal, an
easing of monetary conditions, by lowering the discount
rate, will raise stock prices and vice-versa. Hahn cites
that easing which takes place during a recession to explain
how bear markets manage to end even as everyone is
pessimistic about the economy’s ability to generate profits
and dividends. Once these begin to revive, the bull market
gains momentum, especially as the central banks keeps
interest rates from immediately jumping to ensure economic
recovery. As this bull phase matures, rates do begin to
rise, with the central bank less willing to accommodate
increased credit demand, but the ascent in profits and
dividends outweighs the higher discount rate. The bull
market ends as interest rates continue to push higher, with
the ensuing bear market strengthening in the wake of falling
56
profits and dividends. All this, it must be said, is not
much different from the story often told in Wall Street and
the City. But, as Hahn (1956) says, “the world does not
consist of economists who know and business men who err”
(166).
5. Concluding Remarks
Using a DCF model of stock prices, Hahn maintains that
the stock market is inefficient, doing so on the basis of
1929-1956 data. Updating his analysis to the end of 2009,
and integrating corporate bond yields, we substantiate his
conclusion that dividends are only loosely correlated with
stock prices, even after taking discount rates into account.
In place of an efficient markets model, Hahn describes the
stock market as subject to recurring cycles in which
subjective and objective factors combine to set prices.
Though the subjective forces of psychology, consisting of
mental inertia and dependence on mass opinion, regularly
take prices either above, or below, levels dictated by the
objective facts, the latter do act as a magnet checking the
57
movements of the former. The objective factors, insofar as
these reflect business cycles, are decisively influenced by
central bank practices of maintaining interest rates at non-
market rates.
By arguing that financial markets are inefficient, Hahn
ends up on the side of investment practitioners who
subscribe to either FA or TA as well as the academic school,
BF, most reflective of the conventional wisdom in the
financial community. His more precise stance, though, with
respect to these three approaches comes to sight in the
personal investing counsel that he draws from his theory of
the stock market. While agreeing with BF that psychological
variables create divergences between stock prices and
rational prices, and while sympathizing with FA that market
values do not always equal intrinsic values, Hahn’s proposed
strategy is surprisingly aligned with TA. To be sure, Hahn
does not refer to trend lines, moving average crossovers,
head and shoulder formations, or any of the other constructs
of TA. In the one instance he does allude to TA, he is
dismissive. This happens when he briefly discusses the Dow
58
theory, a century old concept that seeks to identify the
market’s current trend by comparing movements in the Dow
Jones Industrial Average to those of the Dow Transportation
Average (Rhea, 1932). Hahn contends the Dow theory has
proved to be limited and that its value is negligible in any
case because it is widely known.
That said, Hahn figures that the optimal strategy is to
buy shares at the intersection of the exaggeration phase of
the bear market and the adjustment phase of the incoming
bull market. Here, the wise investor must go against mass
opinion, which is overwhelmingly pessimistic at this stage
when the subjective forces of psychology are in control.
From here, though, one must becomes willing to travel with
mass opinion. For the wise investor is then supposed to hold
on to their shares as the subjective element is brought back
to objective reality. Furthermore, he or she is to maintain
their position afterwards when the two diverge again as the
bull market reaches its most enthusiastic phase. This is, of
course, the moment in which one must again oppose mass
opinion. Thus, the wise investor sells (or short sells), and

59
stays out (or remains short) throughout the normal stage of
the bear market when the objective and subjective orders are
reunited once again, only re-entering (and covering) when
these two diverge at the exaggeration phase of the bear
market. “Thus it is as wrong always to oppose the prevailing
tendency as it is always to follow it. In a nutshell, the
right rule is: first against the tendency, then with it, and
finally against it” (Hahn 1956, 214). Heeding this advice,
one will spend quite a bit of time following the trend,
precisely as TA counsels. Even Hahn speaks of the change in
trend occurring over a “moment” (ibid.). Yet it must be
conceded that Hahn does not think such changes can be
scientifically predicted. To this extent, and only to this
extent, is Hahn in accord with EMH.
REFERENCES
Bachelier, Louis. 2006. Louis Bachelier’s Theory of Speculation. (MarkDavis & Alison Etheridge, Trans.). Princeton: Princeton University Press
60
Barberis, Nicholas & Thaler, Richard. 2002. A Survey of Behavioral Finance. National Bureau of Economic Research Working Paper. Retrieved from, http://papers.ssrn.com/sol3/papers.cfm?abstract_id=327880 onJuly 27/2010
Boettke, Peter J. 2010. What Happened to Efficient Markets? The Independent Review, 14 (3): 363-375
Cottle, Sidney, & Murray, Roger, & Block, Frank. 1988. Graham and Dodd’s Security Analysis. New York: McGraw Hill
Cowles, Alfred. 1933. Can Stock Market Forecasters Forecast?Econometrica, 1: 309-324
____, 1944. Stock Market Forecasting. Econometrica, 12 (3): 206-214
Fama, Eugene. 1970. Efficient Capital Markets: A Review of Theory and Empirical Work. Journal of Finance, 25: 383-417
Keynes, John Maynard. 1964. The General Theory of Employment, Interest, and Money. San Diego: Harcourt
Hahn, Lucien Albert. 1921. Economic Theory of Bank Credit. Publisher unknown
Hahn, Lucien Albert. 1949. The Economics of Illusion. New York: New York Institute of Finance
_______ .1956. Common Sense Economics. New York: Abelard-Schuman Ltd.
Hume, David. 1978. A Treatise of Human Nature (2nd ed.). (Peter Nidditch, Ed.). Oxford: Oxford University Press
Kahneman, Daniel & Tversky, Amos. 1979. Prospect Theory: AnAnalysis of Decisions under Risk. Econometrica, 47: 313-327
61
Kahneman, Daniel & Slovic, Paul & Trversky, Amos. 1982. Judgment under uncertainty: Heuristics and Biases. New York: Cambridge University Press
Leeson, Robert. 1997. Influence (or the lack of it) in the Economics Profession: The Case of Lucien Albert Hahn. History of Political Economy, 29 (4): 635-638
Malkiel, Burton. 2007. A Random Walk Down Wall Street. New York:W.W. Norton
Mandelbrot, Benoit & Hudson, Richard L. 2006. The Misbehavior of Markets: A Fractal View of Financial Turbulence. New York: Basic Books
Mises, Ludwig von. 1963. Human Action: A Treatise on Economics. SanFrancisco: Fox & Wilkes
Murphy, John. 1986. Technical Analysis of the Futures Markets. New York: New York Institute of Finance
Pigou, Arthur C. 1929. Industrial Fluctuations (2nd ed.) New York: A.M. Kelley
Samuelson, Paul. 1965. Proof that Properly Anticipated Prices Fluctuate Randomly. Industrial Management Review, 6: 41-49
Selgin, George A. & Boudreaux, Donald .J. 1990. L. Albert Hahn: A precursor of Keynesianism and the monetarist counterrevolution. History of Political Economy, 22 (2): 261-279
Shefrin, Hersh. 2000. Beyond Greed and Fear. Boston: Harvard Business School Press
Shiller, Robert J. 2000. Irrational Exuberance. New York: Broadway Books
_____, 2010. Online Data. Retrieved from, http://www.econ.yale.edu/~shiller/data.htm on July 23/2010

62
St. Louis Fed. 2010. Economic Data. Retrieved from, http://research.stlouisfed.org/fred2/series/AAA?cid=119 on July 23/2010
Triana, Paolo. 2009. Lecturing Birds on Flying: Can Mathematical Theories Destroy the Financial Markets. New York: John Wiley & Sons
Tocqueville, Alexis de. 1969. Democracy in America. George Lawrence, Trans. Garden City New Yorl: Anchor Books
Wicksell, Knut. 1936. Interest and Prices: A Study of the Causes Regulating the Value of Money. London: Macmillan and Company