organised or unorganised retail final
TRANSCRIPT
ZEE RESEARCH GROUP
2011
Retail – Organized vs
Unorganized or co-
existence of Organized &
Unorganized? A Ground Zero Report
Pankaj Sharma
[ T Y P E T H E C O M P A N Y A D D R E S S ]

ZRG
INDEX
Myths Truths/Page No
Retail is no big deal in India? India is poised to be the key driver for retail market globally and study after study shows co-existence of organized and un-organized growth./ Page No – (3 – 5)
Organized retail eats up unorganized retail
India’s share of organized retail has just hovered around about 4 per cent despite advent of big corporate in retail sector./ Page No - (6)
Organized global retailers eat up local retail chains including mom and pop stores
China, which brought in global retailers like Wal-Mart in 1996, has just about 20 per cent of organized retail meaning the argument that unorganized retail gets decimated, is fallacious. Page No - (7)
All retail formats are adversely (especially food and grocery) impacted by the advent of organized retail.
The highest CAGR achieved for organized retail in India is 46 per cent plus for personal care segment and about 40 per cent for jems and jewelry, as against food and grocery, which, grew only about 16 per cent./ Page No (8)
Retail-especially organized retail- hurts grievously the macro economy
Retail economy accounted for seven per cent plus share of total employment in 2004-05, and with projections to grow every year, with more and more formats opening up in the retail sector. /Page No. – (9)
Retail in India is a limited activity and when FDI comes it would result in killing business of small time ‘kirana’ stores
Retail in India has grown manifold over the years with both organized (Reliance, Tatas, Future Group, RPG, Aditya Birla Group and Bharti enterprises etc in the fray with full might). Page No. – (10)
India is not ready for organized retail yet!
But a clear pan India appeal shows India is ready to host retail without fear or favor. /Page No – (13)

ZRG
Exhibit 1 – Can organize and unorganized retail work together in India?
Myth: Retail is no big deal in India? Where are the numbers that matter?
Truth: India is poised to be the key driver for retail market globally and study after study
shows co-existence of organized and un-organized growth.
Intro Exhibit - India: A case of huge untapped potential!
Source: The Great Indian Bazaar (Organized Retail Comes of Age in India) by Mckinsey &
Company (2008)
The NCAER, study based on its Market Information Survey of Households (MISH), has projected
Indian retail industry to grow to about US$ 590 billion by 2011-12 and further to over US$ 1
trillion by 2016-17.

ZRG
Exhibit 1.1 Global Retail Development Index – 2011
Intro Exhibit - As per Global Retail Development Index (GRDI) 2011 high saving and
investment rates; fast labor force growth; and increased consumer spending—make India
for a very favorable retail environment and the 4th spot in the GRD.

ZRG
Exhibit 1.2 – Worldwide Growth of Retail Sales
Intro Exhibit - Growth of Retail Sales: Valued currently at $450 billion dollars, Indian
retail is pegged to grow by 5.8 per cent in 2014 at about the same rate as Thailand, and
next only to China (11.7 %) and Vietnam (9.8 %)
Source: Outlook for the retail and consumer products sector in Asia (PWC) - 2011

ZRG
Exhibit 2 –Country wise share of organized retail
Organized versus unorganized debate
Myth: Organized retail eats up unorganized retail
Truth: India’s share of organized retail has just hovered around about 4 per cent despite
advent of big corporate in retail sector.
Share of Organized Retail in Selected Countries, 2006
Country Total Retail Sales (US$ bn) Share of Organized Retail (%)
USA 2,983 85
Japan 1,182 66
China 785 20
United Kingdom 475 80
France 436 80
Germany 421 80
India 322 4
Brazil 284 36
Russia 276 33
Korea, South 201 15
Indonesia 150 30
Poland 120 20
Thailand 68 40
Pakistan 67 1
Argentina 53 40
Philippines 51 35
Malaysia 34 55
Czech Republic 34 30
Vietnam 26 22
Hungary 24 30
Source: Planet Retail and Technopak Advisers Pvt. Ltd

ZRG
Exhibit 2.1 – Impact of organized retail on unorganized Retail (Case Study – China)
Myth: Organized global retailers eat up local retail chains including mom and pop stores
Truth: China, which brought in global retailers like Wal-Mart in 1996, has just about 20
per cent of organized retail meaning the argument that unorganized retail gets decimated,
is fallacious.
1. FDI in retailing was permitted in China for the first time in 1992. Foreign retailers
were initially permitted to trade only in six Provinces and Special Economic Zones.
Foreign ownership was initially restricted to 49%.
2. Foreign ownership restrictions have progressively been lifted and, and following
China’s accession to WTO, effective December, 2004, there are no equity
restrictions.
3. Employment in the retail and wholesale trade increased from about 4% of the
total labour force in 1992 to about 7% in 2001. The numbers of traditional
retailers were also increased by around 30% between 1996 and 2001.
4. In 2006, the total retail sale in China amounted to USD 785 billion, of which the
share of organized retail amounted to 20%.
5. Some of the changes which have occurred in China, following the liberalization of
its retail sector, include:
• Over 600 hypermarkets were opened between 1996 and 2001
• The number of small outlets (equivalent to ‘kiranas’) increased from 1.9 million to over
2.5 million
• Employment in the retail and wholesale sectors increased from 28 million people to 54
million people from 1992 to 2001
Source: DIPP
Effect of FDI on Traditional Market in China
Type No. of stores in 1996 No. of stores in 2001
Traditional 1,920,604 2,565,028
Supermarkets 13,079 152,194
Convenience 18,091
Hypermarkets 593
Source: Foreign Direct Investment in Retail – ICICI Bank (2004)
Retail Units of Wal-Mart in China (Started in 1996)
Total Retail Units on October 31, 2011: 352
Walmart Supercenter 235
Sam's Club 6
Neighborhood Market 2
Smart Choice 3
Compact Hypermarket 2
Trust-Mart Hypermarket 104 Source: Website of Wal-Mart
ZRG
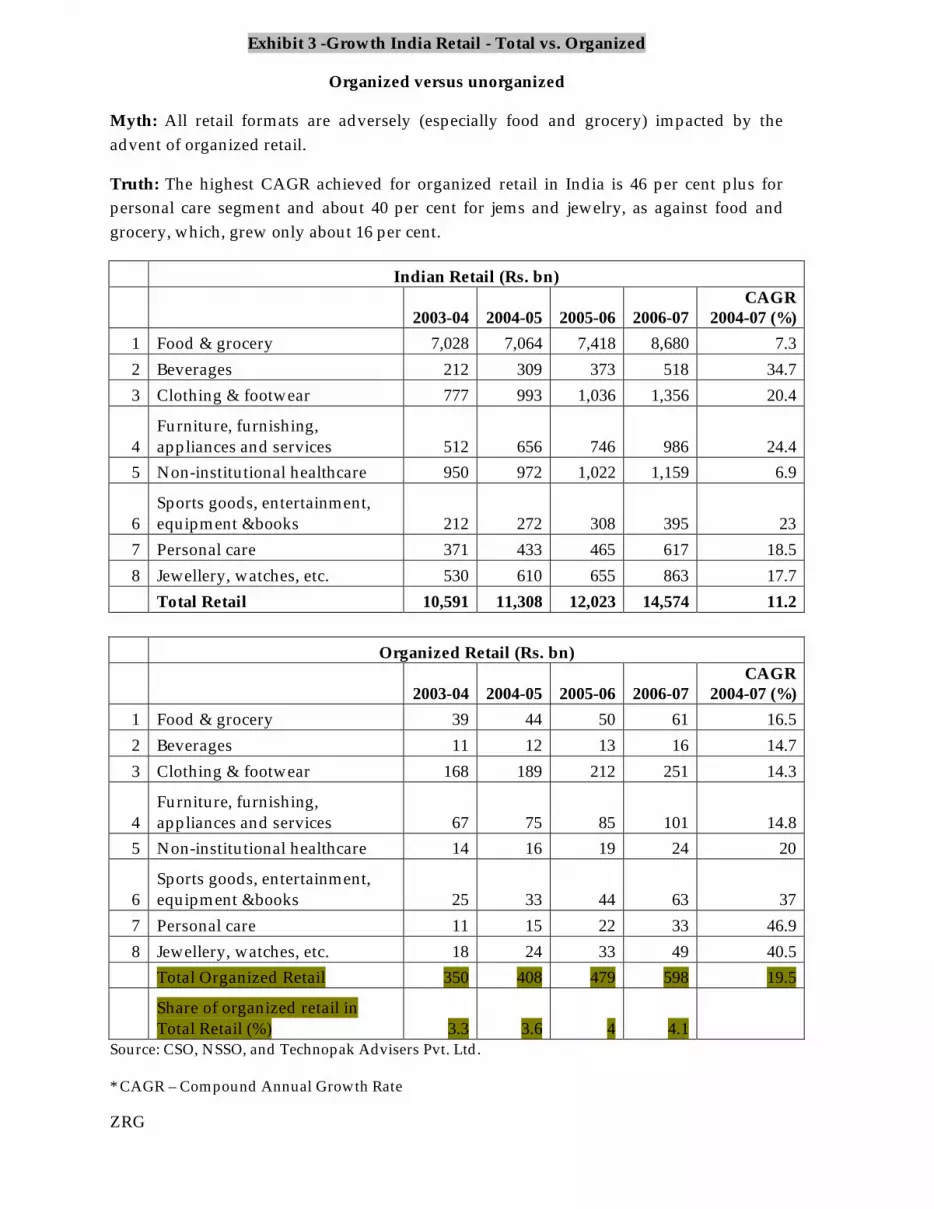
Exhibit 3 -Growth India Retail - Total vs. Organized
Organized versus unorganized
Myth: All retail formats are adversely (especially food and grocery) impacted by the
advent of organized retail.
Truth: The highest CAGR achieved for organized retail in India is 46 per cent plus for
personal care segment and about 40 per cent for jems and jewelry, as against food and
grocery, which, grew only about 16 per cent.
Indian Retail (Rs. bn)
2003-04 2004-05 2005-06 2006-07 CAGR
2004-07 (%)
1 Food & grocery 7,028 7,064 7,418 8,680 7.3
2 Beverages 212 309 373 518 34.7
3 Clothing & footwear 777 993 1,036 1,356 20.4
4 Furniture, furnishing, appliances and services 512 656 746 986 24.4
5 Non-institutional healthcare 950 972 1,022 1,159 6.9
6 Sports goods, entertainment, equipment &books 212 272 308 395 23
7 Personal care 371 433 465 617 18.5
8 Jewellery, watches, etc. 530 610 655 863 17.7
Total Retail 10,591 11,308 12,023 14,574 11.2
Organized Retail (Rs. bn)
2003-04 2004-05 2005-06 2006-07 CAGR
2004-07 (%)
1 Food & grocery 39 44 50 61 16.5
2 Beverages 11 12 13 16 14.7
3 Clothing & footwear 168 189 212 251 14.3
4 Furniture, furnishing, appliances and services 67 75 85 101 14.8
5 Non-institutional healthcare 14 16 19 24 20
6 Sports goods, entertainment, equipment &books 25 33 44 63 37
7 Personal care 11 15 22 33 46.9
8 Jewellery, watches, etc. 18 24 33 49 40.5
Total Organized Retail 350 408 479 598 19.5
Share of organized retail in Total Retail (%) 3.3 3.6 4 4.1
Source: CSO, NSSO, and Technopak Advisers Pvt. Ltd.
* CAGR – Compound Annual Growth Rate

ZRG
Exhibit 4 – Employment through Organized Retail
Myth: Retail-especially organized retail- hurts grievously the macro economy
Truth: Retail economy accounted for seven per cent plus share of total employment in
2004-05, and with projections to grow every year, with more and more formats opening
up in the retail sector.
India’s Organized Sector share in GDP and Employment of Selected Sectors, 1993-94 to
2004-05
Share in GDP (%) Share in Employment (%)
1993- 94
1999- 00
2004- 05
1993- 94
1999- 00
2004- 05
1 Agriculture, forestry, and fishing 28.9 25 18.8 61 56.6 52.1
2 Industry 25.9 25.3 27.5 15.9 17.6 19.4
Of which Manufacturing 15.8 14.8 15.9 11.1 12.1 12.6
3. Services 45.2 49.7 53.7 23.1 25.8 28.5
Of which Trade 11.9 13 14.9 7.7 8.2 8.4
Of which Retail n.a n.a n.a n.a 7.4 7.3
Wholesale n.a n.a n.a n.a 0.8 1.1
Total 100 100 100 100 100 100
Source: CSO and NSSO and Planning Commission.
Exhibit 4.1 - Employment Generation from Retail
Since the retail revolution, the
retail segment has churned out employment opportunities in India. The organized retail segment
particularly has bettered job prospects for the younger generation. According to the survey results
84% of the employees were employed on a fulltime basis and the remaining on contract basis.
Source: Dun & Bradstreet
ZRG
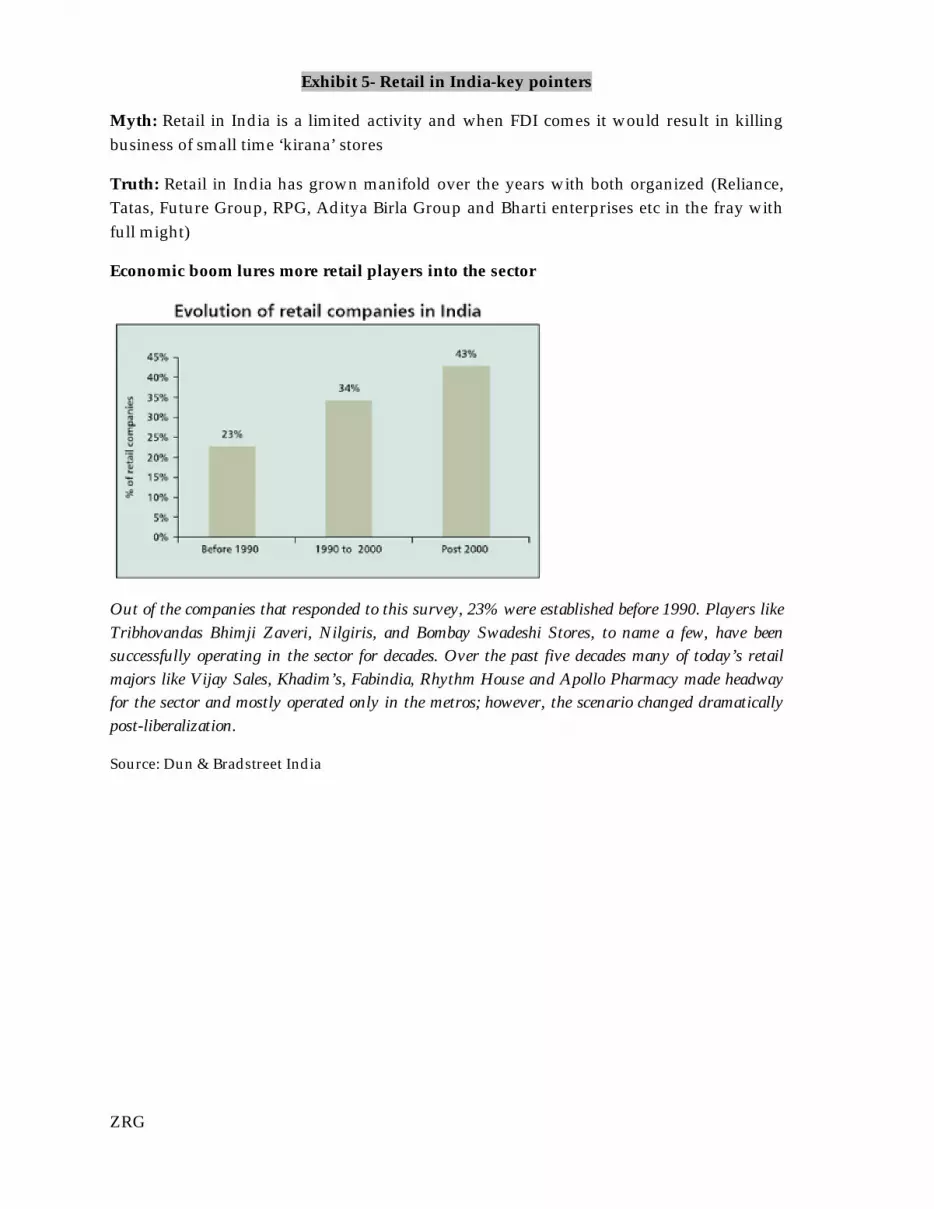
Exhibit 5- Retail in India-key pointers
Myth: Retail in India is a limited activity and when FDI comes it would result in killing
business of small time ‘kirana’ stores
Truth: Retail in India has grown manifold over the years with both organized (Reliance,
Tatas, Future Group, RPG, Aditya Birla Group and Bharti enterprises etc in the fray with
full might)
Economic boom lures more retail players into the sector
Out of the companies that responded to this survey, 23% were established before 1990. Players like
Tribhovandas Bhimji Zaveri, Nilgiris, and Bombay Swadeshi Stores, to name a few, have been
successfully operating in the sector for decades. Over the past five decades many of today’s retail
majors like Vijay Sales, Khadim’s, Fabindia, Rhythm House and Apollo Pharmacy made headway
for the sector and mostly operated only in the metros; however, the scenario changed dramatically
post-liberalization.
Source: Dun & Bradstreet India
ZRG
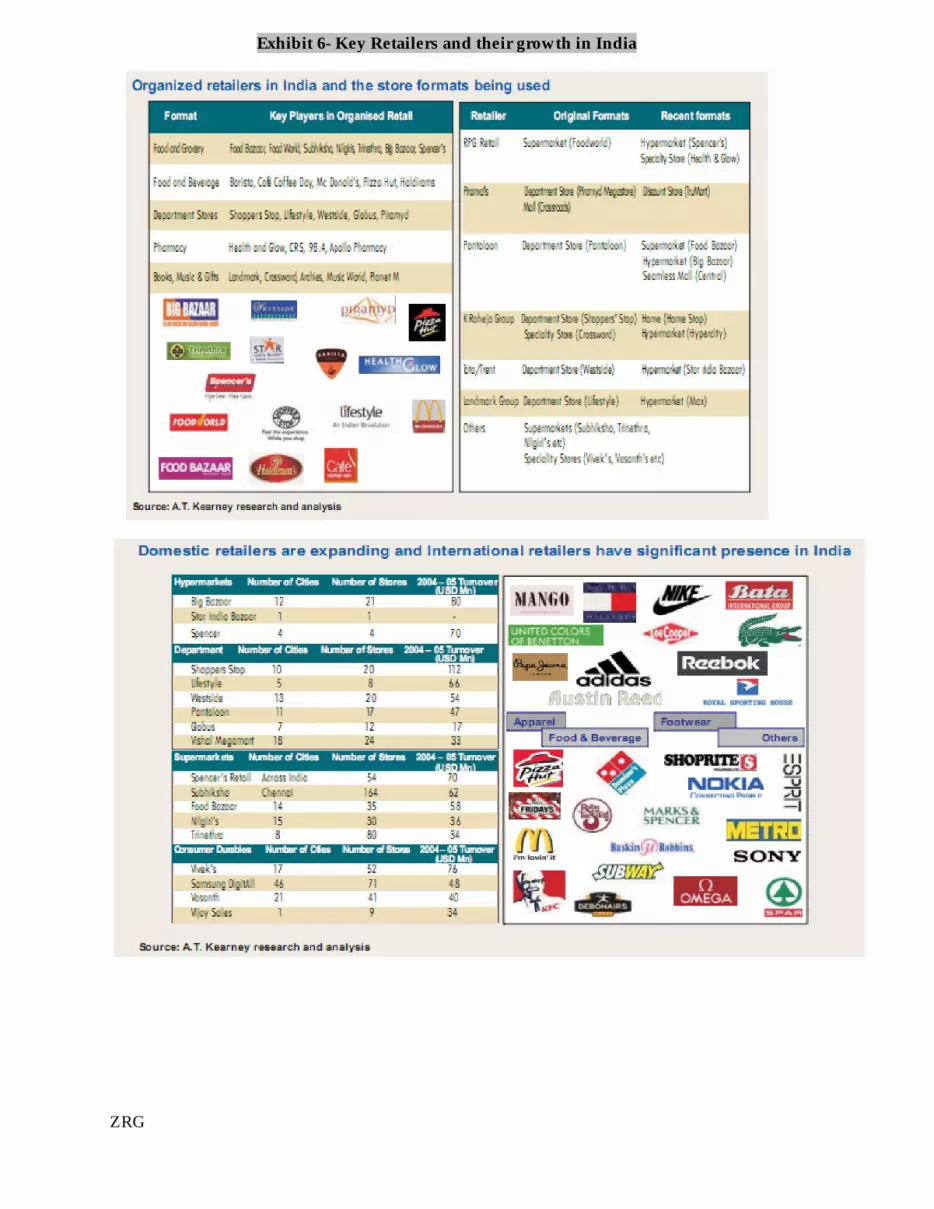
Exhibit 6- Key Retailers and their growth in India

ZRG
Exhibit 6.1 - Organized Retailers Sales’ Turnover in 2006-07
Subhiksha Trent PRIL ITC Spencer’s Mother Dairy Total
Sales turnover (Rs million) 8,000 4,979 19,336 NA 5,400 27,000 64,715
Sales per sq. ft. (Rs) 13,333 6,036 6,108 NA 7,714 NA 8,298
Total sq.ft. area 600,000 825,000 3,165,000 NA 700,000 NA 5,290,000
Source: ICRIER

ZRG
Exhibit 7- Favorite Destination for Retailers in India
Myth – India is not ready for organized retail yet!
Truth – But a clear pan India appeal shows India is ready to host retail without fear or
favor.
Source: Dun & Bradstreet India