optimising stereo baited underwater video for sampling fish and invertebrates in temperate coastal...
TRANSCRIPT
lable at ScienceDirect
Estuarine, Coastal and Shelf Science xxx (2014) 1e7
Contents lists avai
Estuarine, Coastal and Shelf Science
journal homepage: www.elsevier .com/locate/ecss
Optimising stereo baited underwater video for sampling fishand invertebrates in temperate coastal habitats
R.K.F. Unsworth*, J.R. Peters, R.M. McCloskey, S.L. HinderSeagrass Ecosystem Research Group, College of Science, Swansea University, Wallace Building, SA2 8PP, UK
a r t i c l e i n f o
Article history:Received 3 October 2013Accepted 15 March 2014Available online xxx
Keywords:baited videoBRUVsseagrassZosterafisherieskelpbehaviourdeployment timemarine renewablesmarine protected areas
* Corresponding author.E-mail addresses: [email protected], ri
(R.K.F. Unsworth).
http://dx.doi.org/10.1016/j.ecss.2014.03.0200272-7714/� 2014 Elsevier Ltd. All rights reserved.
Please cite this article in press as: Unsworttemperate coastal habitats, Estuarine, Coast
a b s t r a c t
Stereo Baited Remote Underwater Video systems (BRUVs) provide a quantitative sampling method forassessing mobile fauna in a range of habitat types and environments. This non-destructive and cost-effective technique is increasingly used for assessing estuarine, coastal and marine fauna. Althoughsingle camera systems have been used to assess the relative abundance (Nmax) of marine fish and in-vertebrates in low visibility North Atlantic near shore and coastal waters, stereo systems remain in theirinfancy within such environments and their use requires validation. Stereo systems that measure fishand invertebrate size enable size-frequency analysis of populations, providing critical information aboutlife history and population status. We investigated the performance and efficacy of stereo BRUV systemswithin Welsh shallow coastal waters to test the effectiveness of this method. Data are presented on thecapacity of the system to measure fish and invertebrate size under the constraints of low visibility(<2 m). We also present data on the required duration of deployment required to effectively samplerelative fish abundance and diversity. Our study recorded 19 species of mobile fauna with species-timeaccumulation curves providing evidence that a minimum deployment time of 1 h is required to sample66% of the fish species, and 2 h to sample 83%. Results suggest that the efficiency of surveys for targetspecies (e.g. gadoids) could be maximised by modifying the sampling duration between 1 h and 2 h. Thestudy also demonstrates that measurements of fish and invertebrate length could be taken on 41% ofindividuals (of those counted in relative abundance measures using Nmax), a statistic that varies betweenspecies. This indicates a need to modify the construction of the equipment for improved fish assemblagesize frequency analysis. This is particularly relevant in areas and habitats where seine netting andtrawling are not possible. We describe how the system can be modified for optimised usage within lowvisibility waters and suggest potential uses of the system.
� 2014 Elsevier Ltd. All rights reserved.
1. Introduction
Increasing recognition of the need to understand ecosystem ser-vice provision in coastal habitats, particularly within designatedzones such as marine reserves and special areas of conservation(SACs), may necessitate non-destructive tools to assess the size-frequency of mobile fauna at a habitat level. Such information is vi-tal for understanding the life history of constituent species and theirpopulation status, together with developing knowledge of thenursery roleof specificmarine andcoastal habitats (Beck et al., 2001).
In place of conventional fish catch methods that cannot be usedin sensitive and complex habitats, and around structures, visual
h, R.K.F., et al., Optimising steal and Shelf Science (2014), h
assessment techniques (e.g. SCUBA surveys) are commonly used(English et al., 1997; Watson et al., 2005) but such methods areexpensive and have limitations including strong observer bias(Harvey et al., 2002, 2004; Edgar et al., 2004). Baited Remote Un-derwater Video systems (BRUVs) provide a cost effective alternativeto Underwater Visual Census (UVC), may reduce observer error(Harvey et al., 2004) or provide an alternative complimentarysource of data (Lowry et al., 2012).
The use of remote static BRUV systems provide the opportunityto study habitats or environments that may be inaccessible byconventional fishing methods (e.g. rocky or reef habitats and pro-tected areas) or diver survey (e.g. deep depths, night time).
In low visibility coastal and estuarine waters of the NorthAtlantic, single static video BRUV systems have been used to assessa range of habitats and faunal groups (Burrows et al., 1994;Poloczanska et al., 2004; Martinez et al., 2011). Although thesestudies provided valuable information about relative abundance
reo baited underwater video for sampling fish and invertebrates inttp://dx.doi.org/10.1016/j.ecss.2014.03.020
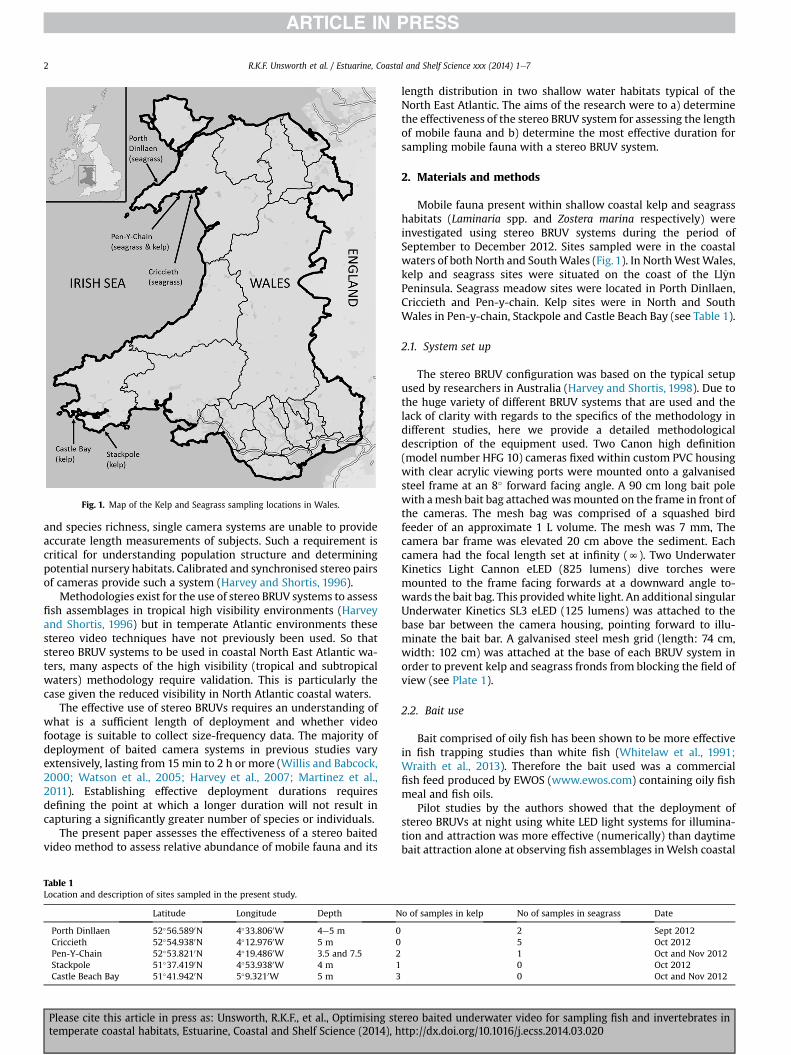
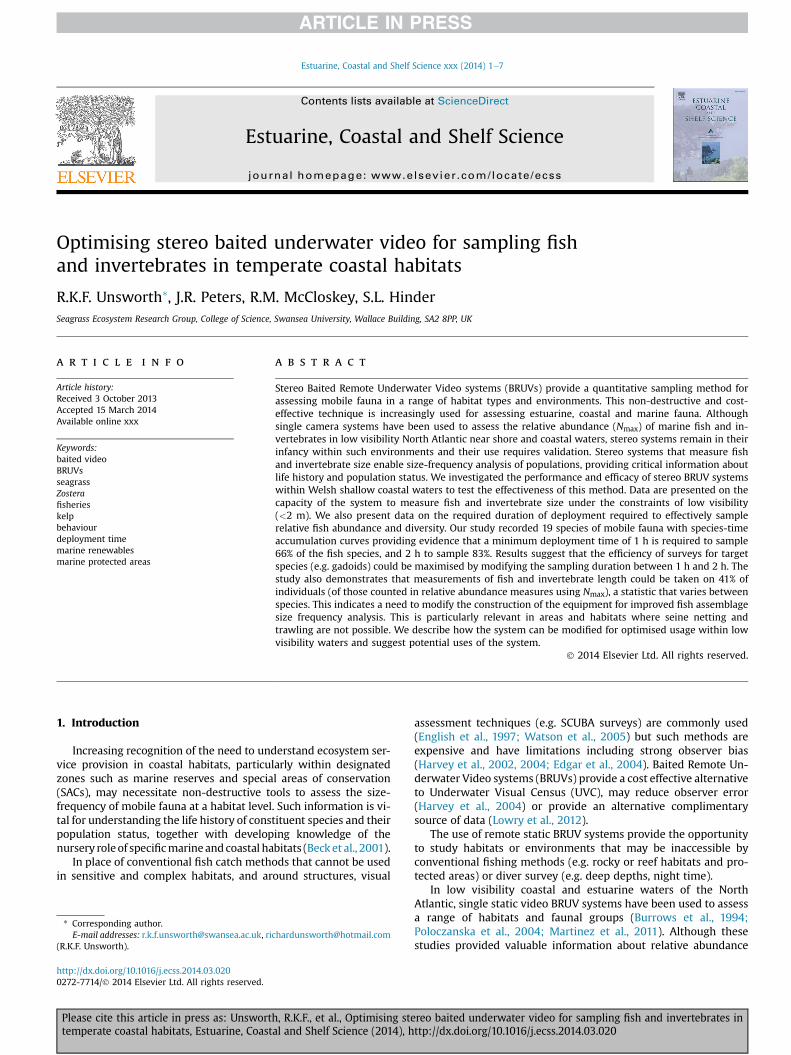
Fig. 1. Map of the Kelp and Seagrass sampling locations in Wales.
R.K.F. Unsworth et al. / Estuarine, Coastal and Shelf Science xxx (2014) 1e72
and species richness, single camera systems are unable to provideaccurate length measurements of subjects. Such a requirement iscritical for understanding population structure and determiningpotential nursery habitats. Calibrated and synchronised stereo pairsof cameras provide such a system (Harvey and Shortis, 1996).
Methodologies exist for the use of stereo BRUV systems to assessfish assemblages in tropical high visibility environments (Harveyand Shortis, 1996) but in temperate Atlantic environments thesestereo video techniques have not previously been used. So thatstereo BRUV systems to be used in coastal North East Atlantic wa-ters, many aspects of the high visibility (tropical and subtropicalwaters) methodology require validation. This is particularly thecase given the reduced visibility in North Atlantic coastal waters.
The effective use of stereo BRUVs requires an understanding ofwhat is a sufficient length of deployment and whether videofootage is suitable to collect size-frequency data. The majority ofdeployment of baited camera systems in previous studies varyextensively, lasting from 15 min to 2 h or more (Willis and Babcock,2000; Watson et al., 2005; Harvey et al., 2007; Martinez et al.,2011). Establishing effective deployment durations requiresdefining the point at which a longer duration will not result incapturing a significantly greater number of species or individuals.
The present paper assesses the effectiveness of a stereo baitedvideo method to assess relative abundance of mobile fauna and its
Table 1Location and description of sites sampled in the present study.
Latitude Longitude Depth N
Porth Dinllaen 52�56.5890N 4�33.8060W 4e5 m 0Criccieth 52�54.9380N 4�12.9760W 5 m 0Pen-Y-Chain 52�53.8210N 4�19.4860W 3.5 and 7.5 2Stackpole 51�37.4190N 4�53.9380W 4 m 1Castle Beach Bay 51�41.9420N 5�9.3210W 5 m 3
Please cite this article in press as: Unsworth, R.K.F., et al., Optimising stetemperate coastal habitats, Estuarine, Coastal and Shelf Science (2014), h
length distribution in two shallow water habitats typical of theNorth East Atlantic. The aims of the research were to a) determinethe effectiveness of the stereo BRUV system for assessing the lengthof mobile fauna and b) determine the most effective duration forsampling mobile fauna with a stereo BRUV system.
2. Materials and methods
Mobile fauna present within shallow coastal kelp and seagrasshabitats (Laminaria spp. and Zostera marina respectively) wereinvestigated using stereo BRUV systems during the period ofSeptember to December 2012. Sites sampled were in the coastalwaters of both North and SouthWales (Fig. 1). In NorthWestWales,kelp and seagrass sites were situated on the coast of the LlynPeninsula. Seagrass meadow sites were located in Porth Dinllaen,Criccieth and Pen-y-chain. Kelp sites were in North and SouthWales in Pen-y-chain, Stackpole and Castle Beach Bay (see Table 1).
2.1. System set up
The stereo BRUV configuration was based on the typical setupused by researchers in Australia (Harvey and Shortis, 1998). Due tothe huge variety of different BRUV systems that are used and thelack of clarity with regards to the specifics of the methodology indifferent studies, here we provide a detailed methodologicaldescription of the equipment used. Two Canon high definition(model number HFG 10) cameras fixed within custom PVC housingwith clear acrylic viewing ports were mounted onto a galvanisedsteel frame at an 8� forward facing angle. A 90 cm long bait polewith amesh bait bag attachedwasmounted on the frame in front ofthe cameras. The mesh bag was comprised of a squashed birdfeeder of an approximate 1 L volume. The mesh was 7 mm, Thecamera bar frame was elevated 20 cm above the sediment. Eachcamera had the focal length set at infinity (N). Two UnderwaterKinetics Light Cannon eLED (825 lumens) dive torches weremounted to the frame facing forwards at a downward angle to-wards the bait bag. This providedwhite light. An additional singularUnderwater Kinetics SL3 eLED (125 lumens) was attached to thebase bar between the camera housing, pointing forward to illu-minate the bait bar. A galvanised steel mesh grid (length: 74 cm,width: 102 cm) was attached at the base of each BRUV system inorder to prevent kelp and seagrass fronds from blocking the field ofview (see Plate 1).
2.2. Bait use
Bait comprised of oily fish has been shown to be more effectivein fish trapping studies than white fish (Whitelaw et al., 1991;Wraith et al., 2013). Therefore the bait used was a commercialfish feed produced by EWOS (www.ewos.com) containing oily fishmeal and fish oils.
Pilot studies by the authors showed that the deployment ofstereo BRUVs at night using white LED light systems for illumina-tion and attraction was more effective (numerically) than daytimebait attraction alone at observing fish assemblages inWelsh coastal
o of samples in kelp No of samples in seagrass Date
2 Sept 20125 Oct 20121 Oct and Nov 20120 Oct 20120 Oct and Nov 2012
reo baited underwater video for sampling fish and invertebrates inttp://dx.doi.org/10.1016/j.ecss.2014.03.020
Table 2Family, species and common name of taxa found in seagrass and kelp habitatsamples (Five 2 h and two 6 h kelp samples, and five 2 h and three 6 h seagrasssamples).
Family Species Common name Present inseagrass
Presentin kelp
Ammodytidae Sandeel x xAtheriniformes Atherina presbyter Sand smelt x xCallionymidae Dragonet* xCottidae Sculpins*Gadidae Gadus morhua Atlantic cod x
Pollachius pollachius Pollack x xMerlangius merlangus Whiting xTrisopterus luscus Bib, Pouting x xTrisopterus minutus Poor cod x x
Gasterosteidae Spinachia spinachia Fifteen-spinedstickleback
x x
Gobiidae Gobiusculus flavescens Two spotted goby x xMugilidae Mullet xPleuronectidae Right-eye flounder xScyliorhinadae DogfishSygnathidae Sygnathus acus Greater pipefish* x xLabridae Labrus bergylta Ballan wrasse xNephropidae Homarus gammarus European lobster* x xSepiolidae Sepiola atlantica Little cuttlefish x x
Speciesmarkedwith an asterix* are those species only found in 6 h samples after theinitial 2 h.
Plate. 1. Image of the stereo BRUV system showing bait bar, lights, seagrass grid andcameras.
R.K.F. Unsworth et al. / Estuarine, Coastal and Shelf Science xxx (2014) 1e7 3
waters. Such light attraction techniques have been used success-fully in Australianwaters (Harvey et al., 2012a). Fish abundance andactivity in shallow water habitats is also typically greater at night(Kopp et al., 2007; Unsworth et al., 2007; Bertelli and Unsworth,2013), therefore night sampling potentially provides a means ofoptimising the method for maximum returns.
2.3. Stereo BRUV deployment
BRUV systems were deployed for either 2 h or 6 h (maximumcamera battery life) in order to assess suitable time frames fordeployment. Eight 2 h samples were taken within seagrass and six2 h samples were takenwithin kelp. Five 6 h samples were taken intotal (three within seagrass, two in kelp). All deployments weremarked with GPS to avoid any resampling of the same locations.Each separate BRUV system was deployed at least 50 m fromanother system.
2.4. Footage analysis
All footage was compressed from AVCHD (.mts) format to Xvid(.avi) format using Xilisoft Video Converter Ultimate for ease of use inspecialist SeaGIS software Event Measure (www.seagis.com.au).Prior to each sampling session, each BRUV system underwentcalibration within a controlled environment and individual cameracalibration files were produced via the SeaGIS software Cal. EventMeasure which permits the synchronisation of footage from bothcameras and the three-dimensional measurements of length, po-sition relative to the cameras, range and pose. An LED diode wasused to synchronise footage from both left and right cameras, and aframe lock function within Event Measure kept the footage in syn-chronisation. The diode uses a series of flashing lights to enablesynchronisation at exactly the same video frame in each camera.Footage was analysed for the Nmax value for each species i.e. themaximum number of individuals observed in one single frame(Priede et al., 1994). Event Measure automatically kept track of thecurrent Nmax recorded by the observer for each species. The lefthand camera footage only was observed to identify species and newNmax values. At the end of the footage the length measurementswere taken at the Nmax for each species. The right hand camerafootage was only used in tandem with the left footage to makefaunal length measurements. Length was measured for each
Please cite this article in press as: Unsworth, R.K.F., et al., Optimising stetemperate coastal habitats, Estuarine, Coastal and Shelf Science (2014), h
individual fish within the Nmax frame using ‘Total Length’. Pointswere placed on the tail and nose of the fish (or ends of the carapace)within both images and the algorithm within Event Measuredetermined calculated length.
Due to the difficulty in working in coastal waters of poor visi-bility, footage was classified in terms of quality. Only footagedeemed to be of high quality was used. This was based on theability of the observer to clearly see the bait bag (90 cm away fromthe cameras) and whether the organisms present could be identi-fied at least to the family level.
2.5. Data analysis
In order to examine the effects of increasing sampling dura-tion upon the number of species and the relative abundance(Nmax), species and abundance accumulation curves werecreated (�95% CI).
3. Results
The present study identified 18 taxonomic groups, 17 of thesetaxa were observed in seagrass and 12 in kelp habitats. Of these 18taxa, 14 different families and 12 different species were identified,with some taxonomic groups remaining unidentified to a specieslevel (Table 2). Difficult to identify groups (gobies and wrasses)could not always be identified to species level and for continuity ofanalysis they were quantified only in terms of total gobies and totalwrasse. Certain taxa (sculpins (Cottidae), common dragonet (Cal-lionymus lyra) and European lobster (Homarus gammarus)) weresampled exclusively after 2 h of deployment (in the 6 h de-ployments during the final 4 h).
The average relative abundance of mobile fauna (Total Nmax e
sum of all individual species Nmax in each 2 h sample) was 7.4 � 4.0SD. For the six 2 h kelp samples this was a Nmax of 7.7 � 3.0 and forthe eight 2 h seagrass samples this was a Nmax of 7.1 � 4.7 SD(Table 2). Sand smelt (Atherina presbyter) were the most abundantspecies in both habitat types with an average Nmax of 2.5 � 2.17 SDper 2 h kelp sample and 1.6 � 2.1 SD per seagrass 2 h sample(Table 3). The second most abundant species were poor cod
reo baited underwater video for sampling fish and invertebrates inttp://dx.doi.org/10.1016/j.ecss.2014.03.020
Table 3Mean (�SD) relative abundance (MaxN) and length for each species within kelp (KP) and seagrass (SG) habitats using stereo Baited Remote Underwater Video in Wales, U.K.Sampling durationwas 2 h conducted at night. Data are also included to show the percentage of the relative abundance for each taxa that could bemeasured in length. We alsoinclude estimates of the length at first maturity for each species (where data available). The origin of the Lm data is specified and is based on the most locally specific reference.NB. lobster, sculpins and dragonets were recorded, but only after 2 h of sampling.
Species Lm (mm) First arrival time (mins) Relative abundance (MaxN) Length (mm) % Measured
KP SG KP SG KP SG KP SG
Ammodytidae e 13.8 � 12.1 40.2 � 32.9 0.8 � 0.8 0.3 � 0.5 69 66 20 50Atherina presbyter e 22.1 � 9.6 28.6 � 23.4 2.5 � 2.2 1.6 � 2.1 143 � 21 128 � 31 33 46Gadus morhua 609a 62.0 0.1 � 0.4 251 100Pollachius pollachius 360e471b 48.5 � 49.8 38.3 � 28.8 0.8 � 1.2 0.6 � 1.1 248 139 20 20Merlangius merlangus 190e220c 43.0 � 28.3 0.9 � 1.7 201 � 46 29Trisopterus luscus 216d 34.6 � 49.9 19.0 0.5 � 0.6 0.1 � 0.4 134 162 33 100Trisopterus minutus 110e130e 20.5 24.0 � 18.5 0.3 � 0.8 1.1 � 1.8 121 � 26 0 44Spinachia spinachia e 54.6 � 28.3 74.3 � 35.5 0.3 � 0.5 0.6 � 0.5 0 0Gobiidae e 39.8 � 31.4 28.6 � 18.8 0.7 � 0.8 0.8 � 1.2 47 44 25 17Labridae e 12.8 � 9.0 0.3 � 0.5 42 50Mugilidae e 92.1 0.1 � 0.4 0Pleuronectidae e 6.4 � 3.3 0.4 � 0.7 199 � 73 100Scyliorhinadae e 21.7 � 21.2 20.2 � 2.3 0.8 � 0.4 0.3 � 0.5 585 501 20 100Sepiola atlantica e 49.6 � 23.5 62.1 � 61.4 0.3 � 0.5 0.3 � 0.5 0 0Sygnathidae e 29.9 0.2 � 0.4 0
a Jennings et al., 1998.b Alonso-Fernández et al., 2013.c Gerritsen et al., 2003.d Dorel 1986.e Beverton and Holt, 1959.
R.K.F. Unsworth et al. / Estuarine, Coastal and Shelf Science xxx (2014) 1e74
(Trisopterus minutus) in seagrass (1.1 � 1.8 SD) and pollack (Polla-chius pollachius) in kelp (0.8 � 1.2 SD). The highest individualspecies Nmax values (maximum number of individuals observed fora given species) were achieved outside the 2 h samples in the 6 hsamples. Whiting (Merlangius merlangus) had the highest individ-ual species Nmax at 16 individuals in a sample, followed by sandsmelt at 10 individuals in a sample. Both these values were ach-ieved near the end of the 6 h deployment (Fig. 3). The highest in-dividual species Nmax values achieved in the 2 h samples were dueto sand smelt (largest Nmax achieved: 6), whiting (5) and poor cod(4), all of which were recorded in seagrass.
3.1. Species attraction
The average first attraction time to the BRUV system withinseagrass and kelp was 10.6� 10.2 min. The first taxa to be observedwere mostly gadoids and dogfish (Scyliorhinus spp.) (Table 3),however when present, right-eye flounders (Pleuronectidae) werethe earliest average arrivals (6.4 � 3.3 SD mins) and the earliest toreach their Nmax at 6.8� 3.8 SD mins. Of the 15 taxa (80%) observedduring the first 2 h, 12 had average first arrival time of less than 1 h(Table 3). Fifteen spined stickleback (Spinachia spinachia), cod(Gadus morhua) and Grey mullet (Mugilidae spp.) were the only 3species recorded in the first 2 h with average first arrival timesgreater than 1 h.
3.2. Species accumulation curves (cumulative relative abundanceNmax)
Both habitats showed similar patterns in the time taken toachieve increments in the cumulative Nmax value (Fig. 2). After 1 hof deployment a cumulative mean Nmax value of 6.0 � 2.8 SD wasachieved in kelp and 5.9 � 4.5 SD in seagrass (78% and 82%respectively of the 2 h values). After 2 h, cumulative mean Nmaxvalues of 7.7 � 3.0 SD and 7.1 � 4.7 SD individuals were recorded inkelp and seagrass respectively (Fig. 2). The most rapid increases inthe cumulative Nmax values occurred before 1 h, with the rate ofincrease declining after this point. The cumulative Nmax values
Please cite this article in press as: Unsworth, R.K.F., et al., Optimising stetemperate coastal habitats, Estuarine, Coastal and Shelf Science (2014), h
throughout the 6 h indicate that these numbers do not fully level offwith increases continuing to occur even at 6 h. The average cu-mulative Nmax for the 6 h samples was 19.0 (�4.7 SD). This is >2.5times the Nmax at 2 h.
3.3. Species accumulation curves (cumulative number of species)
The average numbers of species in the 2 h kelp and seagrasssamples were 5.0 � 1.3 SD and 4.1 � 2.2 SD respectively. The ma-jority of new species appearances occurred within the first 40 minto 1 h of deployment (Fig. 2). Average numbers of species at 1 h are87% and 72% of those at 2 h. The overall average number of speciesin the 6 h samples was 7.4 (�2.7 SD) (Fig. 3).
3.4. Species length measurements
In order to take a length measurement, each individual animalobserved in one camera must be present in the other camera at thesame time, and possess suitable orientation to the camera. Lengthmeasurements of all individuals at each Nmax were therefore notalways possible. Within the first 2 h, 73% of all species and 32% of allindividuals (Nmax) recorded could be measured. The percentage ofthe Nmax measured changed between species. The most numer-ously measured taxa were the sand smelt and gadoids, due to theirtendency to remain at the stereo BRUV systems for longer durationallowing for numerous potential opportunities for the individual tobecome positioned in both cameras at once. However, thesenumerically abundant measurements of sand smelt lengthoccurred only on 39% of the Nmax. The other abundant species (poorcod and pollack) were measured 36% and 20% of the time(respectively). Some taxa such as right eye-flounder and cod weremeasured 100% of the time but their relative abundances (Nmax)were very low and such figures are not representative. Some spe-cies (greater pipefish (Syngnathus acus), fifteen spined sticklebackand grey mullet) could not be measured.
Five species of gadoid were recorded throughout the study,these were more abundant in seagrass than kelp, with only two ofthe five species found in kelp and all 5 found in seagrass. The
reo baited underwater video for sampling fish and invertebrates inttp://dx.doi.org/10.1016/j.ecss.2014.03.020
Fig. 2. Mean (�95% CI) species and relative abundance (Nmax) accumulation curves throughout 2 h of sampling with baited underwater video within seagrass and kelp habitats inWales, UK. Relative abundance (Nmax) accumulation curves are based on calculation of the Nmax over increasing time periods.
R.K.F. Unsworth et al. / Estuarine, Coastal and Shelf Science xxx (2014) 1e7 5
average length for all the measurements from the identified specieswithin the gadoid family combined was 16.3 � 5.3 SD cm (20 in-dividuals measured). All of these individuals, with the exception oftwo poor cod found in seagrass and one pollock found in kelp, wereunder the size of maturation (Lm) (Table 3).
3.5. Camera blind spot
As a result of determining the proportion of fish that could bemeasured, the actual stereo field of view was determined tocalculate the area between the two cameras where a “blind spot”area was created. In high visibility waters such as those in tropical
Fig. 3. Mean (�95% CI) species and relative abundance (Nmax) accumulation curves throughoand kelp habitats in Wales, UK.
Please cite this article in press as: Unsworth, R.K.F., et al., Optimising stetemperate coastal habitats, Estuarine, Coastal and Shelf Science (2014), h
environments, this blind spot is a necessary compromise to allowfor accurate assessment andmeasurement of fish and invertebratesa number of metres away from the BRUV system, but in low visi-bility temperate waters where identification and measurement offish is largely within the first metre surrounding the system, such ablind spot was found to result in data loss (e.g. length measure-ments) as it occupied a significant proportion of the field of view.The focal length of the Canon cameras was 30.4 cm at its widestsetting (with a 35mm equivalent), and the calculated angle of viewwas w69.1�. From this viewing angle, the “blind spot” can becalculated. With the assumption that the focal plane of the camerais set forward w3 cm in front of the camera bar, the blind spot is
ut 6 h of sampling with baited underwater video. Data is amalgamated across seagrass
reo baited underwater video for sampling fish and invertebrates inttp://dx.doi.org/10.1016/j.ecss.2014.03.020
R.K.F. Unsworth et al. / Estuarine, Coastal and Shelf Science xxx (2014) 1e76
w47.6 cm along the bait pole (53%) (calculated for watermagnification � 1.33).
4. Discussion
To our knowledge this was the first study within the NorthAtlantic to utilise stereo baited video systems to investigate the sizeand relative abundance of mobile fauna in shallow coast habitats.This builds on extensive work conducted in the region with singlecamera systems (Burrows et al., 1994; Martinez et al., 2011) andprovides information on the suitability, application and perfor-mance of stereo BRUV systems in North Atlantic coastal waters.
Our study recorded 18 species ofmobile faunawith species-timeaccumulation curves providing evidence that a minimum deploy-ment time of 1 h is required to sample 66% of the fish species, and2 h to sample 83%. These times will also be influenced by localcirculation due to the spread of the bait plume and the loss anddegradation of the bait.
Sampling relative abundance using a sampling duration of 2 hresulted in only observing z50% of the 6 h Nmax. The relativeabundance (Nmax) of individuals did continue to increase over the6 h, which may have been due to the movement of small shoals offish closer to the BRUV systems as they acclimatised to the equip-ment and came into clear view. Alternatively this increase could bedue to the attraction of more fish as the bait plume spread (Dormanet al., 2012). As Nmax is a relative measure of abundance, 2 h maytherefore be sufficient sampling duration. Whilst Nmax is the mostcommonly observed metric for examining relative fish abundancewith baited camera systems, particularly with stereo system use inthe tropics, some studies have revealed that Nmax may not alwaysbe an accurate estimate of relative abundance as this can beinfluenced by the duration of the stay at the bait with speciesexhibiting long staying times having higher high Nmax values.
Time of first attraction to the BRUV system was species specific,with gadoids, sand eels and dogfish being typical early visitors andthe fifteen spined stickleback and mullet taking much longer. Thisis likely to be the result of behavioural and physiological differencesrelated to their boldness and their capacity to sense a bait plumeand be attracted to light (Raymond and Widder, 2007a,b; Martinezet al., 2011; Harvey et al., 2012a). On average only two new species(9%) were sampled after the initial 2 h period. New species addi-tions after the 2 h tended to bemore cryptic classes. Results suggestthat at the very least a minimum sampling time of 1 h is required inthe event that a study were to target specific species or faunalfamilies (e.g. gadoids), and indicates that times commonly used inthe tropics (e.g. 15e30 min) (Willis and Babcock, 2000; Watsonet al., 2005) are inappropriate for temperate North Atlanticcoastal waters. A deployment time of 2 h is an effective compromisefor obtaining information on species diversity and abundance,whilst reducing the processing time for each sample.
Due to our placement of stereo BRUVs in near shore environ-ments where habitats are highly susceptible to reduced visibility,our findings offer a minimum estimate of what can be achievedwith the use of this technique in temperate North Atlantic waters. Akey concern with this method was the frequent inability of thesystem to make length measurements, as only 41% of fish in theNmax were measured. This was principally due to a blind spot be-tween the cameras, meaning that the fish was too close to thecameras to be present in both fields of view at once. It is thereforerecommended that the use of stereo BRUV systems in NorthAtlantic waters should be conducted by decreasing the blind spotby bringing the cameras closer together or increasing the inwardangle of the housings. This would enable a greater proportion offish to be observed by both cameras at once and therefore bemeasured. The proportion of fish measured was species specific
Please cite this article in press as: Unsworth, R.K.F., et al., Optimising stetemperate coastal habitats, Estuarine, Coastal and Shelf Science (2014), h
which is a direct result of why they are attracted to the BRUV sys-tem and their behaviour around it. For example, the fifteen spinedstickleback was difficult tomeasure due to its close attraction to thecamera (and possibly the lights) rather than a tendency to visit thebait station.
Although the use of stereo BRUVs can be seen as an effectivetechnique for sampling fish assemblages in sub-tidal sensitivehabitats, the observed species assemblage was different to thatobserved using a beach seine net on proximate intertidal seagrasssampled at the same time. Bertelli and Unsworth (2013) observed26 species of fish using a seine net in the seagrass meadow at thesame Porth Dinllaen seagrass sampled in the present study and atsimilar times. This species list was higher than recorded by theBRUV and principally relates to a reduction in observations of ju-venile flat fish (e.g. plaice and brill) and cryptic species (e.g. seascorpion andworm pipefish) by the BRUV. Such flat fish and crypticspecies are less likely to be attracted to bait (as the bait is raisedfrom the sea floor) and consequently less likely to appear in thevideo footage. In addition, the BRUV sampled more gadoids. Theorientation of the cameras into the water column rather than downtowards the benthos (where flat fish and cryptic species are likelyto inhabit), together with the relative attraction of different speciesto bait, are the likely drivers for these differences (e.g. Harvey et al.,2007). Previous studies considering differences between BRUVsystems and other forms of fish sampling have also found signifi-cant differences in fish abundance and species richness betweenmethods (e.g. Harvey et al., 2012b) although no data exist tocompare stereo BRUV data directly to seine data.
A critical fisheries management requirement is the provision ofdata on the juvenile fish nursery function of different habitat types(Beck et al., 2001). Our research showed that stereo BRUVs canprovide such data. The Stereo BRUVs were successful at repeatedlytargeting young, commercially important finfish in relatively shortsampling times (less than 1 h) and that although not all individualscould be measured, sufficient length data were collected to deter-mine that the majority of gadoids were of a juvenile size.
Stereo BRUV systems have proved to be an effective tool forinvestigating avarietyofmarinehabitats in temperateNorthAtlanticwaters, across a range of depths and conditions. These systemssampled a wide variety of taxa including crustaceans, flat fish, dog-fishandfinfish. Furtherwork into the selectivityof differentbaits andcomparisons tootherfishassessmentmethodswouldproveuseful inmoving towards a standard methodology for use in temperate wa-ters. Thedevelopmentofmarineprotectedareas in temperatewatersis a growth area and the need to monitor these with effective toolscreates a suitable opportunity for the use of BRUVs.
Acknowledgements
We would like to acknowledge the funding provided by theWelsh Government (Resilient Ecosystems Fund) Grant number:MAR7 and SEACAMS. We would also like to thank Alison Palmer-Hargrave (Penllyn a’r Sarnau SAC), Laura Hughes (National Trust)and several members of Natural Resources Wales (Phil Newman,Mark Burton, Paul Brazier, Kate Lock and Julia Korn) for helping tofacilitate the research. Thanks to the following: Keith Naylor, RuthCallaway, Nicole Estaban and Chiara Bertelli (Swansea University),Tony Bruce (Enlli Charters), Andy Truelove (Broadside Boat Char-ters), Jon Shaw (SeeKat Marine Charters) and SOAS Boat Charters.
References
Alonso-Fernández, A., Villegas-Ríos, D., Valdés-López, M., Olveira-Domínguez, B.,Saborido-Rey, F., 2013. Reproductive biology of pollack (Pollachius pollachius)from the Galician shelf (north-west Spain). J. Mar. Biol. Ass. UK 93, 1951e1963.
reo baited underwater video for sampling fish and invertebrates inttp://dx.doi.org/10.1016/j.ecss.2014.03.020
R.K.F. Unsworth et al. / Estuarine, Coastal and Shelf Science xxx (2014) 1e7 7
Beck, M.W., Heck Jr., K.L., Able, K.W., Childers, D.L., Eggleston, D.B., Gillanders, B.M.,Halpern, B., Hays, C.G., Hoshino, K., Minello, T.J., 2001. The identification, con-servation, and management of estuarine and marine nurseries for fish andinvertebrates. BioScience 51, 633e641.
Bertelli, C.M., Unsworth, R.K.F., 2013. Protecting the hand that feeds us: seagrass (Zosteramarina) serves as commercial juvenile fish habitat. Mar. Poll. Bull. (in press). http://dx.doi.org/10.1016/j.marpolbul.2013.08.011.
Beverton, R.J.H., Holt, S.J., 1959. A review of the lifespans and mortality rates of fishin nature, and their relation to growth and other physiological characteristics.In: Wolstenholme, G.E.W., O’Connor, M. (Eds.), CIBA Foundation colloquia onageing: the Lifespan of Animals, vol. 5. J & A Churchill Ltd, London, pp. 142e180.
Burrows, M., Gibson, R., Robb, L., Comely, C., 1994. Temporal patterns of movementsin juvenile flatfishes and their predators: underwater television observations.J. Exp. Mar. Biol. Ecol. 177, 251e268.
Dorel, D., 1986. Poissons de l’Atlantique nord-est relations taille-poids. InstitutFrancais de Recherche pour l’Exploitation de la Mer. Nantes, France. 165 p.
Dorman, S.R., Harvey, E.S., Newman, S.J., 2012. Bait effects in sampling Coral Reeffish assemblages with stereo-BRUVs. Plos One 7.
Edgar, G.J., Barrett, N.S., Morton, A.J., 2004. Biases associated with the use of un-derwater visual census techniques to quantify the density and size-structure offish populations. J. Exp. Mar. Biol. Ecol. 308, 269e290.
English, S., Wilkinson, C., Baker, V., 1997. Survey manual for tropical marine re-sources. Australian Institute of Marine Science, Townsville.
Gerritsen, H.D., Armstrong, M.J., Allen, M., McCurdy, W.J., Peel, J.A.D., 2003. Vari-ability in maturity and growth in a heavily exploited stock: whiting (Merlangiusmerlangus L.) in the Irish Sea. J. Sea Res. 49, 69e82.
Harvey, E., Shortis, M., 1996. A system for stereo-video measurement of sub-tidalorganisms. Mar. Technol. Soc. J. 29, 10e22.
Harvey, E.S., Shortis, M.R., 1998. Calibration stability of an underwater stereo-videosystem: implications for measurement accuracy and precision. Mar. Tech. Soc. J.32, 3e17.
Harvey, E., Fletcher, D., Shortis, M., 2002. Estimation of reef fish length by divers andby stereo-video e a first comparison of the accuracy and precision in the fieldon living fish under operational conditions. Fish. Res. 57, 255e265.
Harvey, E., Fletcher, D., Shortis, M.R., Kendrick, G.A., 2004. A comparison of un-derwater visual distance estimates made by scuba divers and a stereo-videosystem: implications for underwater visual census of reef fish abundance.Mar. Freshw. Res. 55, 573e580.
Harvey, E.S., Cappo, M., Butler, J.J., Hall, N., Kendrick, G.A., 2007. Bait attraction af-fects the performance of remote underwater video stations in assessment ofdemersal fish community structure. Mar. Ecol. Prog. Ser. 350, 245e254.
Please cite this article in press as: Unsworth, R.K.F., et al., Optimising stetemperate coastal habitats, Estuarine, Coastal and Shelf Science (2014), h
Harvey, E.S., Butler, J.J., McLean, D.L., Shand, J., 2012a. Contrasting habitat use ofdiurnal and nocturnal fish assemblages in temperate Western Australia. J. Exp.Mar. Biol. Ecol. 426, 78e86.
Harvey, E.S., Newman, S.J., McLean, D.L., Cappo, M., Meeuwig, J.J., Skepper, C.L.,2012b. Comparison of the relative efficiencies of stereo-BRUVs and traps forsampling tropical continental shelf demersal fishes. Fish. Res. 125, 108e120.
Jennings, S., Reynolds, J.D., Mills, S.C., 1998. Life history correlates of responses tofisheries exploitation. Proc. R. Soc. Lond. B 265, 333e339.
Kopp, D., Bouchon-Navaro, Y., Louis, M., Bouchon, C., 2007. Diel differences in theseagrass fish assemblages of a Caribbean island in relation to adjacent habitattypes. Aquat. Bot. 87, 31e37.
Lowry, M., Folpp, H., Gregson, M., Suthers, I., 2012. Comparison of baited remoteunderwater video (BRUV) and underwater visual census (UVC) for assessmentof artificial reefs in estuaries. J. Exp. Mar. Biol. Ecol. 416e417, 243e253.
Martinez, I., Jones, E.G., Davie, S.L., Neat, F.C., Wigham, B.D., Priede, I.G., 2011.Variability in behaviour of four fish species attracted to baited underwatercameras in the North Sea. Hydrobiologia 670, 23e34.
Poloczanska, E.S., Hughes, D.J., Burrows, M.T., 2004. Underwater television obser-vations of Serpula vermicularis (L.) reefs and associated mobile fauna in LochCreran, Scotland. Estuar. Coast. Shelf Sci. 61, 425e435.
Priede, I.G., Bagley, P.M., Smith, K.L., 1994. Seasonal change in activity of abyssaldemersal scavenging Grenadiers Coryphaenoides (Nematonurus) Armatus in theEastern North Pacific-Ocean. Limnol. Ocean. 39, 279e285.
Raymond, Widder, 2007a. Phototactic responses. Mar. Ecol. Prog. Ser. 350, 291e298.Raymond, E.H., Widder, E.A., 2007b. Behavioral responses of two deep-sea fish
species to red, far-red, and white light. Mar. Ecol. Prog. Ser. 350, 291e298.Unsworth, R.K.F., Wylie, E., Smith, D.J., Bell, J.J., 2007. Diel trophic structuring of
seagrass bed fish assemblages in the Wakatobi Marine National Park, Indonesia.Estuar. Coast. Shelf Sci. 72, 81e88.
Watson, D.L., Harvey, E.S., Anderson, M.J., Kendrick, G.A., 2005. A comparison oftemperate reef fish assemblages recorded by three underwater stereo-videotechniques. Mar. Biol. 148, 415e425.
Whitelaw, A.W., Sainsbury, K.J., Dews, G.J., Campbell, R.A., 1991. Catching charac-teristics of four fish-trap types on the North West Shelf of Australia. Mar.Freshw. Res. 42, 369e382.
Willis, T.J., Babcock, R.C., 2000. A baited underwater video system for the deter-mination of relative density of carnivorous reef fish. Mar. Freshw. Res. 51, 755e763.
Wraith, J., Lynch, T., Minchinton, T.E., Broad, A., Davis, A.R., 2013. Bait type affectsfish assemblages and feeding guilds observed at baited remote underwatervideo stations. Mar. Ecol. Prog. Ser. 477, 189e199.
reo baited underwater video for sampling fish and invertebrates inttp://dx.doi.org/10.1016/j.ecss.2014.03.020