optimal adjustment to trade shocks under alternative development strategies
TRANSCRIPT

Optimal Adj
ternative
Irma Adelman, University of California, Erinc Yeldan, Bilkent University, Alexander Sarris, University of Athens, and David W. Roland-Holst , Mills College
The techniques of stochastic control are applied to a CGE model of Turkey to compare the robustness of alternative development strategies to disruptions like the 1979 oil shock. The use of instruments and the extent of deviation of state variables from their target values are compared under three different objective functions (growth, stabilization or equality) and three different development strategies (export expansion, agricultural development led industrialization, or import-substitution). We find that the results are sensitive to both development strategies and objectives.
1. INTRODUCTION
The relationships between trade policy, industrial and agricultural policies and adjustment to shocks arising from unforeseen changes in the international environment are still not well understood. The anzytic literature on pvanning under uncertainty (see Adelman and Sarris, 1982) indicates that policy insights derived from the analysis of economic dynamics under certainty do not necessarily carry over to the case of uncertainty. Thus, while formal analyses of trade under certainty show that “open” development strategies that do not discriminate against exports are superior to closed ones, models of trade under uncertainty show that uncertainty in international markets may make it optimal for a risk-averse country to move towards autarky (Ruffin 1974, Sarris 1985, and Cheng 1987). Under uncertainty, import substitution strat- egies may therefore well be superior to strategies of export led growth. The literature also indicates that insights into optimal adjustment pol- icies differ with the structure of the model (e.g., how much substitution has been built in), the timing of decisions (e.g., whether decisions must be taken before the uncertainty is revealed or can be postponed till after the uncertainty has manifested itself) and the modelling of the origin of the shock (e.g., whether uncertainty is additive or multipli-
Address correspondence to Irma Adelman, Dept. of Agricultural and Resource Economics, Division of Agricultural and haturdi Resources, University of Caiifumia, Befkeiey, 267 Giaunini Hall, Berkeley, GA 94720.
Jmral of Policy Mod&g 1 i(d):45 i-509 ( 1389) 451 0 Adelman et al. 0161-8938/89

452 I. Adelman et al.
cative, and whether there is a price or a quantity shock). Theoretical conclusions thus tend to be model-and-situation specific and to offer no general guidelines concerning optimal development .P9nd adjustment strategies under uncertainty.
The empirical evidence cone : ning country adjustments to the 1973 and 1979 oil shocks and to the lebt shocks of the 1980s also reveals no strong general uniformities; Actual country-adjustment patterns to shocks arising from import-price increases in the seventies have varied a great deal. The East Asian economies of South Korea, Taiwan and Japan reacted quite differently from the Latin American economies of Argentina, Brazil, Chile, Mexico and Uruguay.
As pointed out by Corbo and de Melo (1986), the Southern Cone countries-Argentina_ Chile and Uruguay-entered the period of the first oil shock with import substitution policies, large inflation and acute balance of payments crises. They attempted to control the internal and external imbalances by a combination of liberalization policies in commodity and credit markets, reductions in total absorption, and expenditure switching between domestic and foreign markets through real devaluation. Their initial success in controlling inflation and for- eign exchange imbalances was followed by large increases in external debt, internal financial crises, and cycles in output and employment. Brazil and Mexico, on the other hand, delayed implementation of stabilization policies by relying on heavy external borrowing to sustain the growth of domestic demand. They both shifted towards inward- oriented trace strategies, relaxing their export drives, imposing tighter import controls, increasing tariffs and overvaluing their exchange rates. Neither the Southern Cone IMF-type adjustment nor the Brazil-Mexico debt-led growth were very successful in the medium run.
By contrast, as pointed out by Lin (1986), the East Asian economies continued their outward orientation after 1973 and relied on wage moderation and productivity increases to maintain international com- petitiveness. They did not cut real absorption; indeed, in each case, the rates of growth of domestic consumption rose subsequent to the impact of the external shocks, as did savings and real output. South Korea devalued in response to each oil-shock; Taiwan did not; and Japan had a currency appreciation between the two oil shocks. Japan and Taiwan developed substantial foreign exchange surpluses and South Korea had large deficits during the impact periods of the shocks.
orean deficits were quickly brought under control, however, by increasing export elasticities much faster than import elasticities.
The real world thus displays a substantial variety of stabilization and adjustment patterns in response to shocks arising in the external

OPTIMAL ADJUS 453
sector and very varied and changing relationships of policy-instrument adjustments to policy outcomes over time. While some economies have clearly adjusted more successfully than others, it is hard to disentangle from the empirical evidence how much of their relative success was due to differences in policy, how much was due to differences in economic structure, and how much was due to the fact that the same external shock impacts differently on economies that have been pur- suing different development strategies and are of different size.
The present paper attempts to shed some light on these issues by modeliing optimal adjustment to trade shocks in a single middle-income economy pursuing different development strategies. Using the meth- odology developed in Adelman and San-is (1982) and Adelman, Sarris and Roland-Hoist (1987), the techniques of stochastic control are ap- plied to a CGE model of Turkey to compare the robustness of alter- native development strategies to disruptions like the 1979 oil shock. The use of policy instruments and the extent of deviation of state variables from their target values are compared under three different objective functions (growth, stabilization, or income distribution equai- ization) and three different development strategies (export expansion, agricultural development led industrialization, or import-substitution). We find that the results are sensitive to both development strG.tegies and objectives. Nevertheless some interesting strategy and objective speLific generalizations can be made.
2. THE TURKISH ECONOMY
2A. Before the January 1980 Reform
Dwing the 1960s and 1970s Turkey undertook a verlJ intensive import-substitution drive, which was implemented through quantitative restrictions and a deliberate policy of overvaluation of the domestic currency. Growth, while rapid (averaging close to 6.5 percent per annum), was not uniform and not short of problems. Indeed, after the possibilities of the first, “easy,” stage o; import-substitution were exhausted in the early 1960s and the replacement of imports of inter- mediates and capital goods became the dominant thrust of industrial development, the limited size of the domestic market and the faltering foreign trade performance of the economy imposed increasingly bind- ing constraints inhibiting further growth.
One of the first symptoms of the emerging crisis was the acceleration of domestic inflation from a moderate rate of five percent in the 1960~~ to I8 percent in the early 1970s and to 50 percent in 1977. In the

454 I. Adelmn et al.
absence of any major adjustment in the foreign currency value of the Turkish lira, incentives significantly drifted against exports. According to Balassa’s 1381 calculations, the real exchange rate between Turkey and its major trading partners appreciated by 13 percent between 1973 and 1977. The current-account deficit reached $3.8 billion in 1977.
In response to the growing crisis, the government undertook a series of stabilization measures in 1978, and then again in 1979, which met with only mixed success. While the current account deficit improved to $1.8 billion in 1979, the domestic inflation rate accelerated to 64 percent. In the meantime, possibilities for foreign capital inflows, especially commercial borrowing, were exhausted. ‘ihus, the 1979 oil- shock hit Turkey u:ider very adverse conditions. Consequently, inter- mediate and capital-goods imports dropped substantially and contrib- uted to low capacity utilization in industry, which registered, on the average, a growth rate of 2.7 percent during 19781980. The rate of growth of the real GNP fell sharply, from 2.9 percent in 1978, to -0.4 percent in 1979 and again to - 1.1 percent in 1980.
Finally, in January 1980, a new government introduced a set of extensive policy reforms and started implementing a change of focus in Turkey’s development strategy from inward-looking import- substitution to an outward-oriented strategy of manufacturing export expansion.
2B. After the January 1980 Reform
The 1980 reform aimed not only at short-run stabilization but also at changing the structure of the economy towards greater outward orientation and liberalization by providing an increased role to the private sector and to market forces. Further, a change in sectoral priorities occurred, with greater emphasis being given to export- oriented manufactures, such as processed food, textiles, wearing ap- parel and light intermediates, and to commercial services, es overseas contracting.
These structural adjustments were pursued by a set of far-reac policies:’ The Turkish lira was devalued by almost 5ir percent against the U.S. dollar, with further daily adjustment being ,nade to that the effects cf price increases on the real exchange rate were Concurrently, an extensive scheme of export-promotion measures was
‘See Milanovic (1986) and Yagci (1984) for a comprehensive evaluation of the protection and export-incentives scfiemes in Turkish mnwfacturing since 1980. For a detailed description cf the 1980 Reform, see World Bank (1982).
C’PTI.WAE ADJUSTMENT TO TRADE SHOCKS 455
introduced. Import restrictions wer.: liberalized and the waiting pe- riod for import licenses was reduced considerably. Measures were also taken to introduce more flexibility and rationality into the state- enterprise system. Finally, in July of 1980, interest rates were freed from government ceilings.
The reform package yielded its first fruits by 198 1. In that year, led by a 62 percent rise in the dollar value of merchandise exports, GNP grew by 4.1 percent, and industrial alue added rose by 7.2 percent. The current-account deficit narrowed to $2.3 billion after its record high of $3.7 billion in 1980. The successful export performance COD- tinued and the value of exports expanded from $4.7 billion in 198 i to $7.9 billion in 1985, registering an average rate of growth of 22 percent per annum.
However, due to restrictive monetary policies and reductions in domestic absorption, business conditions have generally been sluggish, and domestic private investment remained stagnant in 198 1, after its decline of 20 percent in 1980. Despite wage reductions2 and repressive attitudes towards labor, unemployment increased from 14.8 percent in 1980 to 15.2 percent in 1981 and further to 16.7 percent in 1985. Indeed, as the 1982 World Bank Report (p. 50) states, the decline in private investment and the increase in unemployment seemed to be the two “concomitants” of the Turkish adjustment attempts in the 1980~~ Further, there was an observed imbalance between the structure of exports (in favor of manufactured products) and the allocation of private funds (away from manufacturing industries), a phenomenon which was directly in conflict with the overall growth strategy of increasing man- ufactured exports .4
The mixed results of the 1980 reform package make it natural to ask whether alternative development and adjustment strategies in Tur- key would have yielded better results under the external shocks of the seventies and the protectionist policies of the 1980s. More specifically, for a typical middle-income counp like Turkey, what would constitute optimal policy responses to trade shocks imposed by an acceleration of imported producer-goods prices coupled with an unfavorable en- vironment for exports? How would the economy have fared under
tin an index scale of 100 in 1980, the real wages have fallen to 67.3 in 1985 (Yeldan, 1988). ‘Some scholars have already pointed out that the success of the Turkish export drive was
actually a result of the special favorable events, like the war conjuncture in the region, instead of the reform package itself (see, e.g., Rerksoy, 1985; Kepenek, 1984).
4For a further discussion of this point, see Yeldan (1988).

456 I. Adelman et al.
alternative development strategies? It is these questions we seek to analyze in the present paper.
2C. Seeking Out Alternatives
We start by noting that the export-led growth model does not exhaust the spectrum of “open” development strategies. In particular, a re- cently advocated strategy of “agricultural demand-led industrializa- tion” (ADLI) (Adelman 1984 and Yeldan 1988) can be added to the familiar menu of import-substitution or export-led strategies of indus- trial development. The ADLI strategy calls for a reallocation of in- vestment funds to agriculture within the context of an open development strategy’ in order to increase agricultural productivity. The arguments in favor of such a strategy rest on the dJ namic backward and forward lit+ages of growth in agricultural output and farmer in- co: 2s. These linkages create a mass market for domestic industrial products for use as inputs in agriculture and in rural consumption. The ADLI strategy is a “balanced” industrialization strategy, working through agriculture-industry linkages that expand internal demand for the intermediate and final consumption goods produced by the domestic manufacturing sectors. The advocacy of the ADLI strategy reflects a belief that agricultural and industrial growth can be restructured without departing from an open trade regime so that the primary source of the economy’s dynamic resides in the domestic market rather than in the cyclical and uncertain foreign market.
Under cox.ditions of perfect forss@t, the superiority of the ADLI strategy over the export-led strategy has already been tested and con- firmed by Adelman (1984) for S. Korea, and by Yeldan (1988, 1989) for Turkey. The task of the present paper is to check whether their results carry over to conditions of uncertainty.arising from unexpected fluctuations in the external conditions faced by the domestic economy.
3. METHODOLOGY
3A. The Conceptual Framework of the Methodology
As indicated above, the objective is to examine the robustness of alternative development strategies to exogenous unpredictable shocks.
‘For the original statement and the description of the ADLI strategy see Adelman (1984); and Mellor (1976). For extensions and applications, see de Janvry (1984); Singer and Alizadeh (1986); Adelman, Boumieux and Waelbroeck (1986); and Yeldan (1988, 1989).

OlTTv!AL ADJUSTh~ ‘I’0 TRADE SHOCKS 457
The methodology that we employ to do this, albeit involved, can be
explained in a simple conceptual manner. Consider an economy whose structure can be described by a system
of nonlinear dynamic equations of the following type:
X, = f(X,* XI-0 Y” 2,) (11
where X, denotes a vector of the r economic variables that describe the state of the economy in period t, yt is a vector of m contemporaneous exogenous variables which can be controlled by the authorities, and z, is a vector of k exogenous variables which are outside the control of policymakers. The vector function f is assumed to represent accu- rately the structure of me economy.
The general planning or development strategy problem simply put is to select a time path for tie control variables yt, after having assumed a path for the uncontrolled variables z,, so that the economy as rep- resented by the evolution G,” the vector Xt behaves in a “desirable” fashion. There has been a lot cf literature over the years and techniques developed in order to deal wim this deterministic problem. Examples include linear programming witk Leontief-type models, nonlinear pro- gramming, optimal control of nonlinear models etc. (for a survey see Blitzer, Clark and Taylor, 1975). In practice the choice of a devel- opment strategy is a complicated political-economic process that in- volves many trade-offs. In this paper we shah not be concerned with either the process or the mechanics of a-riving at a general development strategy but rather with the robustness of the chosen strategy under unpredictable shocks.
Assume that the planning horizon is T periods, that a path {Zz} (t = 1 - - , T) has been projected and that based on this and the overall p&ring environment cum political setting, a development strategy {yJ<t = l,..., T) has also been chosen.
These assumptions and decisions imply via Equation (1) that the evolution of the economy will follow time path {z,} (t = 1, . . . , T)
where
for?= I,.. . , T and x0 representing the initial state of the economy. This time path has been implicitly judged “desirable’ ’ or “acceptable” by the planning z-lthorities and this implies that every effort should be made to keep the economy close to that path.
Once the economy starts down the plan period, it is almost always the case that the exogenous variables z, will not be at their projected values. &?~il~ sn;:all deviations usually do not necessitate plan revi-

458 I. Adelman et al.
sions, majo; disruptions like the oil shocks of the seventies, will require some policy adjustment in order to keep the economy close to the
lanned path. The choice of the “on-line” adjustment strategy is a matter of political economy as well since the burden of any type of chosen adjustment will almost never fall equally on all economic groups. In fact the political economy of adjustment might be different than the forces that shaped the original development strategy. These considerations explain the multitude of adjustment strategies chosen by various countries in the seventies.
Suppose we denote the deviations of the various variables from their l-lanned values as follows.
AX, = X, - 53, (3a)
and
AZ, = z, - 2,. (3c)
Given Equation 1 it is conceptually straightforward to sei; that the new variables defined in Equations 3 will be governed by a set of equations of the type.
AX, = f&+AX,, x,_,+AX,_,, y,+Ay” Z,+Az,)
- f@,,%-,, Y,, 2,) = g,(AX,,AX,-,,Ay,Az,). (4)
Note that the vector function g, depends on the choice of development strategy and is therefore a function of t.
An adjustment strategy can be represented by a vector function of the following form.
Ay, = h,(bz;: AX,_,). (3
Since the equations governing the evolution of AX* in Equation (4) depend on the development strategy, the vector function h, is a function of t.
Assume that the political economy of adjustment is summarized by 3 “cost of adjustment” function that is quadratic in the variables AX,.
C=iAX;QAX,=&, (6) #=I *=,
where (‘) denotes the transpose, and Q is a positive semidefinite di- agonal matrix, such that the sum of the diagonal elements equal one.
e matrix Q coul bc dependent on t. Arsume that the adjustment

OPTIMAL ADJUS’I’lWNT To TRADE SHOCKS 459
function h, in Equation (5) has been chosen in an “optimal” fashion, namely so as to minimize the total (over the plan period) expected cost of adjustment described in Equation 6. For a given set of shocks AZ,, if the optimal adjustment strategy is pursued, the economy will follow an “optimal” path given by 2, + AXf(t = 1, . . . : T) whete AR is derived from Equation 4 when the optin~al adjustment Ay: is substi- tuted from Equatioii (5).
and
AX: = g,(AX,*. AX: ,. by,*, AZ,) (7)
AY!’ = h,(Az., AX,*_,). (8)
Consider now the following “normalized cost of adjustment” index-
;;: AX,*’ Q AX: l
w = ( ‘1’ T )*
TC. -
(9) E; Rx’,
1-l
In Equation (9) the r X r matrix R (which could be dependent on t) is a diagonal positive semidefinite one, whose sum of the diagonal elements is equal to one. It reflects the relative preference of policy- makers for the performance of the different variables of the economy over the plan period. If R = Q then the political economy of adjustment is the same as the political economy of development strategy. In this CLM the noi-maZization of Q and R so that their diagonal sum eq~3fs I is not necessary. In general, however, the two matrices will not be the same.
Ideally the development plan would be chosen so as :e maximize a quadratic index such as the one appearing in the denominator of Equation 9. This is not done in this paper, but instead we chose R = Q. In this case the index W has the meaning of a percent cost of adjustment o er the plan period for a given set of shocks. For a dif- ferent set of shocks the index 7 will take a different value. Also for a different development path the index will take different val- ues. Given Q and a set of shocks the index W can be used to eval- uate different development strategies. A smaller value of W implies that a given development strategy coupled with optimal ex-post ad- justment to shocks is preferable or more robust than another one. By the same token, we could fix the development strategy and vary the adjustment matrix Q. We could then judge how, with a given development strategy, different preferences lead to more or less sta- ble economic paths.

460 I. Adelman et al.
LZ general only a subset of the variables X, endogenous to the model will be of interest to the policymakers. This is reflected above by assum- ing that the matrices Q and R are positive semidefinite. If we denote by x, the vector of n variables of interest, then all previous equations can be recast with x, in the place of X, and with the matrices Q and R being pos- itive definite. This is what will be assumed in the sequel.
In the remainder of this methodology section we outline how we op- erationalize the various components of the above conceptual framework.
3B. The Economic Model
The economy will be characterized by a computable general equi- librium (CGE) model. The model is in the Adelman-Robinson (1978) tradition in its characterization of the domestic economy and its dy- namics, and in the Dervis-delblelo-Robinson (1982) tradition in its characterization of international trade. It is based on a social accounting matrix (SAM) for the year 1985. By using a Walrasian multisector, multiagent apparatus,6 the model simulates the optimizing behavior of economic agents in response to endogenous price signals in the com- modity and factor markets. The model is composed of two stages. The first stage is a static general equilibrium construct which utilizes nu- merical methods to solve a system of nonlinear simultaneous equations for the prices that are consistent with zero excess demands in both commodity and factor markets. In the second stage, a dynamic ad- justment process is specified for capital accumulation, for population growth, for changes in technical productivity, and for other changes in the “behavior” of economic factors.
The model, as applied to Turkey, distinguishes four economic sec- tors (agriculture, consumer manufacturing, producer manufacturing and services), four types of labor (agricultural labor, marginal labor, organized labor and service labor), seven consumer groups (agricul- tural, marginal, organized and service labor plus agricultural, industrial and service capitalists) and a government. Domestic output in each sector is give11 by a constant return Cobb-Douglas production function with capital and labor as primary inputs. Intermediate inputs are as- sumed to be used in fixed proportion to output. Sectoral physical capital stocks are treated as fixed in the static stage and profit rates are thus allowed to vary amomg sectors in equilibrium. In the dynamic stage,
“A detailed description of the model is presented in Yeldan (1988).

OPTIMAL ADJUSTMENT TO TRADE SHOCKS 461
however, a behavioral submodel is provided to update the sectoral investment-allocation coefficients in response to the observed differ- ences in sectoral profit rates. This behavioral submodel lurches the system towards a dynamic intertemporal equilibrium in which, in the absence of future shocks or policy changes, profit rates across sectors would tend to be equalized in the long run.
Labor is disaggregated into four categories: agricultural labor is employed only in agriculture, and is treated as separate and immobile within any period. However, between periods, the model specifies a Harris-Todaro (1970) migratory process in which rural-urban migration takes place in response to differences between the agricultural and the expected urban wage rates.
In the urban sectors, tlnc ~a.1 wage rate of organized/skilled labor is assumed fixed and varied only parametrically. The excess of or- ganized labor is absorbed by the unorganized/unskilled labor market, in which the wage rate of unorganized labor adjusts freely to clear the urban labor market. Finally, service lubor is employed only in the servic;e sector which typifies small scale service enterprises and self- employment.
On the trade side, the model adopts the Armington composite- commodity specification, in which domestic and imported goods are imperfect substitutes and are aggregated by a CES function with a given elasticity of substitution. Further, domestic output is allocated between exports and domestic use via a constant elasticity of trans- formation specification, due to Powell and Gruen (1968).
The elasticities of substitution and transformation are chcJsen to reflect differences in the quality and/or nature of the traded goods within each sector. The balance of foreign trade is maintained by exchange rate adjustments.
The model is closed on the macro side by using a “sayings driven” closure rule in which the savings pool of the economy sets the limits to capital investment and which distinguishes between private and public savings decisions. Saving propensities set private savings as a fraction of private disposable income. The government is assumed to preselect a ratio of public savings to aggregate nominal GNP, with public consumption determined residually. The savings-driven closure was selected to make capital accumulatio:l and economic growth max- imally sensitive to fluctuations in the balance of payments accounts and to changes in private income levels.
The system is normalized around a numeraire consisting of an index of composite-goods prices and u&ng sectoral output shares in the base-

462 I. Adelman et al.
year as weights. The complete description of the model and its nu- merical specification is given in Yeldan (1988).
3c. Tbe Adjustment Problem
The method used in this paper for deriving the optimal adjustment rule is similar to that formulated in Adelman and Sarris (1982) and applied by Adelman, Sarris and Roland-Holst (1978) to the study of optimal adjustment to uncertain shocks in a small, low-income, very open economy following an export-led growth strategy (South Korea).
Given the description of the economy by a CGE that can be sum- marized by the set of Equations 1, and a development path character- ized by a set of projections {&} for the exogenous variables, a set of planned paths for the policy instruments {y,], and a set of resulting paths for the n endogenous variables of interest {x,1 (all for it = 1, . . . ,
?>, OUT first task is to outline a more tractable characterization of Equations 4 that denote the evolution of the deviations of the endog- enous variables from their planned paths.
The adjustment problem was formulated in the previous section as follows:
Minimize T
{h,(-),t=l, . . ..T} E"{p:Q*xr} where E. (0) denotes the conditional expectation operator given infor- mation at time, t = 0 (which is normally the initial condition of the economy AX,).
The optimization is done over all feedback rules h, (9) of the type given in Equation 5. The constraints of the problem are given by the following (generally nonlinear) equations akin to 4.
Ax, = R,(*x,, Ax,-,, *Y,, AZ,). (11)
The conditional expectation is taken over the distribution of all random variables in the system that occur from time I = 1 onward (namely the AZ, as well as theAx, that become random by virtue of Equation (10).
In order to render the adjustment problem analytically tractable, the functions g, ( l ) are linearized. This corresponds to taking the Jacobians of the nonlinear model equations&) around the planned development paths, as can be readily seen by referring to the definition of g, in
uation 4.

OPTIMAL ADJUSTMENT TO TRADE SHOCKS 463
g,(Ax,, Ax,- 1, By,, Ai,) = D,(t)Ax, + D,_,(t) AX,_ 1
+ Q(0 Ay, + W) AZ,. (12)
In Equation 12 Dx, Dx- 1, D,, and D, are the Jacobian matrices of the CGE equations fl*) with respect to the vectors x,, x,_ ,, y, and z, re- spectively. Since the linearization is done around a dynamic time path, the matrices D will all be functions of time. Using Equation 12 the linear reduced form of the restrictions for the adjustment problem given by Equation 11 can be written as follows:
where
Ax, = A,Ax,_, + S,Ay, + K,Az, (13)
A, = (1 - &(o)-’ ox-*w (14)
B, = (1 - &(b)) --I D,(z) (19
K, = (1 - R(O) - ’ RW. (16)
Optimization of the linear quadratic function in 10 subject to the linear dynamic Fquations 13 has now been reduced to a standard problem of linear quadratic stochastic control. We shall not delve into the details of the solution technique which the interested reader can find in standard textbooks (e.g., Chow, 1975; Bellman, 1957; and Sargent, 1987), but will only present and discuss the concept cf the solution.
The standard method of solution of the above problem involves the technique of stochastic dynamic programming. This involves breaking up the T period optimization problem 10 into T one-period optimization problems by first using the following well-known property of condi- tional expectations.
&& c,) = &&...L ,ti: c,) #=I 1-I
= &(c,+E,(c,+E,(c,+ . . . +E,_,c,)) ,..) (17)
where in (17) for abbreviation
C, = Ax: (2 Ax,. (18)
In Equation 17, E, denotes the conditional expectation given infor- mation up to and including time S.
Given Equation 17 the minimization of 10 can be rewritten as follows

464 I. Adelman et al.
min Eoii C,} = h
min (min(. . .min (&{i C,}) . .)
h,, h,, . . . . h, h h I=1 (19)
I=1 1 2 T
= min (min (... min(E,(C, + E,(C, + . . . + ET-, CT)) . . . ...) h h,
= min E,(C, + min E,(C, + min E2(C, + . . . + min E,_, C, . ..) h h, h, br
= E,{nin (C, + E,}min (C, + E&in (C, + . . . + E,_,{min CJ) . ..). h, h, h, h,
The first equation above denotes that the optimization over the T ftmc- tionshXt = l,..., T) can be done sequentially by first optimizing over hT, hen over h,_ , and backwards to hl. The second equation above just substitutes 17 in the objective function. The third equality holds by noticing that when optimization over h, is performed, the variables up to and including period t - 1 are known and hence do not affect the choice of h,. Hence only variables from time t onward enter the minimization over h,. The final equation in 19 simply inter- changes the expectation and minimization operators within each pe- riod’s optimization problem. This follows from the property of expectation that for a continuous function fix)
$” Ef(x) = E f" f”,. (20)
It is clear from Equation 19 that the method of solution involves backward recursion. The innermost minimization problem in Equation 19 involves finding h, (in other words AyT in the context of our problem) given all information up to and including time T. This means that A+__, , and A+ are presumed known. Since CT is a quadratic function of Ax,_, , AyT and AZ, by (13), this last period solution can be readily found (in the sequel an asterisk will denote the optimal solution) by setting the partial derivative of ET-, {t$n CT] with respect to yT equal
to zero and substituting for x,:
Ay$ = - (B: Q BT) - ’ B: Q(AT Ax,_, + K, AZ,). (21)
Substituting Ay$ in the expression for CT it can be shown that C*, is a quadratic function of AX,_ I and AZ, Since disturbances up to and including T - 1, and A zT are presumed independent, the conditional distribution of xT- , (given information up to time T - I) is inde-
nt of the one for ence, when taking the conditional ex- ion of C*, with res information known up to and including

OPTIMAL, ADJUSTMENT TO TRADE SHOCKS 465
time T - 1 (as indicated by the innermost term in 19), the cross terms between Ax,_ 1 and AZ, vanish. Furthermore, the quadratic term in AZ, does not involve any variables determined earlier and hence does not influence the subsequent optimizations.
TL 4%nWn F n&r L&w ow .- Yo.Dauerations im;lly that the term CT_, + l&_ , Cf , that must be optimized in the second step with respect to AyT_ ,, is a quadratic function of A+ _ , plus a term that involves the covariance matrix of AZ, that is unimportant from the optimization perspective and will be neglected in the sequel. The quadratic term in Ax, _ , is given by the following expression.
CT-, + ET_, C: = Ax;_, (Q + MT) Ax,_, + f(Cov AZ,) (214
where
MT = A; Q{l - B&B:. Q B,) -’ B: Q} A,.. (22)
0ptimization of the next stage (of expression (19)) with respect to Ayr_ I proceeds in an identical fashion. The optimal value of AyT- I is given by an expression identical in structure to Equation 21 except that T is replaced by T - 1 and Q by e + Mr. The resulting optimal value of the expression in (22) is again a quadratic function of Ax=-* and AzT- ,. Taking the conditional expectation with respect to information up to and including time T - 2, and adding the cost CT_*, will result, as above, in an expression quadratic in A+-_,. Hence, the iteration can proceed backwards.
The general expression for the resulting solution is the following:
Ayf = -WQ + M + 1) RI-'E(Q + M,+,) (A&,-, + KAzr) = G, Ax,-, + H, AZ, (23)
where Mt satisfies the backward recursion.
M = A:(Q + M+,) 11 - B,@:(Q + M,+,) B3 --I WQ + M+,)) 4 (24)
with MT+, = 0. In Equation 23 the second equation just defines the optimal adjustment matrices G, and H,. These are given by
G, = -WQ, + M+NW’ WQ, + M,+,)A, (25)
and
H, = - [BXQ, + M+,) 41-I NQ, + M+ 1) K. (26)
The optimal adjustment rule derived in Equations 23-26 are of the nd on the particular re

466 I. Adelman et al.
7, then adjustment will be needed in all subsequent periods as well. This is because even though the values of AZ, for t 2: T are equal to zero, the values of Ax, t 2 T are not. As Equation 23 shows, this necessitates adjustment over the whole planning horizon.
Adjustment rules 25 and 26 define the loss-minimizing adjustment rules for changing the discretionary policy instruments in response to the destabilizing forces to which the economy is exposed. Assuming the economy starts on a target path, exogenous forces which might drive the system away from its intended trajectory can be partially counteracted by taking the remedial actions dictated by the reduced- form instrument-adjustment rules 2S and 26.
A notable feature of the adjustment rule as characterized by 23 and 24 is that although our objective function will depend upon the “noise” r,, the optimal decision rule AYES = G&_, is independent of the covariance matrix of l ,; i.e., the optimal decision rule is identical with the rule for the componding nonstochastic (deterministic) optimal control problem. In other words, when expressed in lagged feedback form, as given by the matrices G, for periods subsequent to the shock, the optimal decision rule that solves this problem is independent of the noise statistics of the problem. This feature, called the “certainty equivalence principle, ’ ’ is due to the quadratic nature of the objective function and the linearity of the ctinstraint functions, and, anfortu- nately, does not cha--- uWtetir;r.e stochastic control problems generally.7
An equally important point yet to be mentioned in this context is that the derivation of the policy adjustment rule implicitly offers the policymaker the trade-off between weighting the present and future deviations from the target path against the policy induced fitwe de- viations via use of 6, matrices. When determining the immediate policy rule in the period of the exogenous shock, the costs of adjustment will reveal themselves as further deviations in the subsequent periods. These accumulated costs of adjustment (in addition to those of the exogenous shock) are accounted for (by recursive minimization) within the matrices MT + j
T!x adjustment rules derived above must be contrasted with tradi- tional sensitivity analysis. Under such a method, once the development strategy and the resulting paths of the endogenous variables are de- termined, perturbations of the exogenous variables (akin to our AZ,) can be simulated to derive corresponding Ax,%, and various combi- mtbns of changes in By, can be tried so as to make AX, look in some
‘For further discussion on this point, see Sargent (1987, pp 36-38).

OPTIMAL ADJUSTMENT TO TRADE SHOCKS 447
sense “desirable.” This essentially trial and error method is quite wasteful in terms of time (both of the analysis as well as computers) and not very organized. The technique derived above forces the analyst into a consistent way of thinking about adjustment. In essence all he has to experiment with are different values for the objective matrix Q, since everything else is done automatically.
3D. Instrument and State Variable Adjustments
The adjustment matrices G, show how the policy instruments can be adjusted contemporaneously to minimize the induced deviations of the state variables, regardless of the source of the deviation. The matrices H, give a complete characterization of the first-round optimal policy response to a contemporaneous perturbation by uncorrelated exogenous forces, regardless of what has h::ppened before or happens afterwards. Computing these two groups of matrices is a simple matter once the underlying Jacobians &(t), Dx _ 1 (t) , D,(t) , and E&(t) are obtained, and a detailed inspection of them can be quite illuminating.
Although the matrix pairs (G,, H,) for t = 1, . . . , T give a complete characterization of optimal policies for a wide variety of adjustment problems, the present discussion examines only a specific family of possible disturbances. In particular, it is assumed that the exogenous shock occurs once only, in the flh period of the policy interval t = 1 * - , 7’. For a once only disturbance AZ, i-n period T, the first-round adjustment follows Equation 23 and the net effect on the contempo- raneous state variables takes the form
Ax,* = B,Ay: + K, AZ,
= (B,& + K,) AZ, (27)
because hr,_j = 0 for j = 1, . . . , T since no shock occurs before T. These deviations in the period T state variables will, in turn, induce deviations in subsequent endogenous variables via the structural dy- namics of the economy. In the next period, assuming no new exogenous shocks, the actual instrument adjustment will be given by
AY,+, = G,+,Ax,*
= G,+, ULff, + K,) AL (28)
and the contemporaneous state variables will vary according to

468 . Adelman et al.
ax,, I4 = A,+, Ax: + B,+, Ayr+,*
= A,+,@& + K) AZ, + B,+, G+, (ML + (29)
= (A,+, + k+, G+J VW, + KJ AZ,.
In general, for all periods, t = T + 1, . . . , T, subsequen only exogenous shock, the adjusted instruments and resulting state variable deviations take the fcrm
AY: = N,Aq and A$ = P#Az+ (30)
where the matrices N, and P, follow a forwtid recursion given by
N, = G,P,_, and P, = (A, + B,G,) P,_, (32)
with initial conditions
NT = H, and P, = BJI, + K,. (32)
The resulting sequence of matrix pairs $it, 72 ftir i 1 T, . . . , T
measures the optimal adjustments and trajectory deviations from the .
period of the shock to the terminal per-iod in units of the exogenous shock variables AZ,. Thus, in addition to a complete ex-ante derivation of explicit ex-post adjustment rules of the form G, and iY*, it is also possible to compute ex-ante the actual optimal adjustments and induced target path deviation per unit change in the exogenous variables.
It is convenient and illustrative to express the instrument adjustments and target path deviations in elasticity form. To this end, define the following elasticity matrices:
where
(35)
(36)
e fQl~owi~g square diagonal _natrices

OPTiMALADJLJSTMENTTOTRALlESHOCKS 469
y, = Gi %jl (37)
X# = {i,i Sjj} (30
2, = {T,it5u} (39)
where Sti is the Kronecker delta. Then it is easy to show given Equation 30 that
E(t, 0 = Y,_'N,Z, WI
nt, 7) = X,-' N,Z,. (41)
The dimensionless numbers eij (t, 7) and r&, 7) indicate the optimal percentage deviations of an instrument or state variable from its target value in period I in response to a one percent shock in an exogenous variable in period 7. As t is further removed from T, the impact of the shock can be expected to diminish and hence smaller values of Ei,(t, T) and r&, T) are expe&ed.
3E. The Evaluation of the Jacobians
The evaluation of the Jacobians, D,(t), D,,(f), D,(t), and D,__, (t), which make up the composite Jacobian>. A,, Bt, and K,, can be carried out in two ways. The most direct method would be to linearize the structural equations analytically, convert these to reduced form in the endogenous state variables, differentiate the reduced forms around &, &_ ,, j$, and Z,, and then evaluate the differentials on each target path at (x,, x,_ , , y,, z~) for each point of time. We use a different, more expedient and more acurate, method. We obtain numerical estimates for the D&), D,,(f), D,(t), and D, _ Jf) by perturbing the CGE model in its original nonlinear form sound each target path in each period. The perturbations are carried out over x,, x, _ 1, y,, and z, one variable at a time. The differences in solutions for the target variables for each perturbation yield one column of the appropriate differential matrix D.
4. THE OPTIMAL ADJUSTMENT ALTERNATNE STRATEGIES
The optimal adjustment path of the domestic economy in response to trade shocks is computed with the aid of the above discussed CGE model and control methodology over the period 1985 through 1994. This period spans Turkey’s fifth and sixth five-year development plans. The model and the associated stochastic control methodology are utilized as planning devices in order to analyze the expected vior of the economy under shock under three alternative development

470 I. Adelman et al.
strategies: (I) import-substitution industrialization (ISI); (2) export- led industrialization (XLI); and (3) Agricultural Demand-Led Indus- trialization (ADLI).
IJnder each development strategy, three distinct objectives are dis- tinguished for the derivation of the adjustment paths. One objective function is a stabilimtim objective, in which the aim is to stabilize the state variables of (1) merchandise trade balance; (2) per-capita private consumption; (3) organized labor employment; (4) migration; and (5) per-capita food consumption around their target values. A second objective function is an income distribution objective, in which the focus is on minimizing the effect of shocks upon the state variables indicating the per capita income levels of the seven household classes, especially the poor. The seven households derive their respective in- comes from their sectoral factor income earnings and also from the rest of the world as private borrowing and remittance inflows.* A third objective to be considered is a growth ubjective in which the optimal control methodology is employed to minimize the state variable de- viations of sectoral output supplies and physical capital stocks tiom ihcir target values.
For ail three objectives, the lagged values of the state variables (x,- ,) consist o&j’ of the lagged sectoral physical capital stocks and of the lagged values or ;he number of rural-urban migrants. This is because the dynamics of the model are restricted to the rate of capital accumulation, the rate of population grov:th (which is exogenous to the model), and to the reallocation of labor from rural to urban sectors via the migration submodel.
The CGE simulation experiment involves designing an optimal, dynamic adjustment package of scctoral public investment, commercial policy and exchange rate administration. The control variables (y,) are chosen with this in mind and represent the standard structural-adjust- ment and commercial-policy instruments: the nominal exchange rate (the real exchange rate cannot be set unilaterally by the policymaker); the domestic-currency values of sectoral tariffs and export subsidies in each of the three sectors that engage in merchandise trade (agri- culture, consumer manufacturing, and capital goods manufacturing);
--
“It is assumed that agricultural capitalists receive 15% of net private borrowing from the rest of the world and the test is allocated between the urban capitalists. Forty percent of the remittance inflow is assumed to be channeled to the agricultural labor household, and the rest to the urban labor households. Further it is assumed that agricultural labor captures 25% of agricultural profits to highlight the size of the small scale production units in the Turkish rural structure. For details of the aggregation of the social accounting matrix see Yeidan (1988, chp. 4).

OFTMAL ADJUSTMENT TO TRADE SHOCKS 471
and the levels of sectoral public investment by destination. All variables are valued in Turkish bra at real 1981 prices.
The vector (z,) of shocks typifies a highly adverse environment for the domestic economy, like that of the second oil shock of 1979. To simulate this shock, in the first period the world price of imports of producer goods is increased by 60 percent and the world demand for Turkish merchandise exports is reduced by half. Thus, the economy is subjected to a sizable shock from both the income (declining export revenues) and the cost (rising import costs of production) side in the initial year of the plan period.
The weighting matrix Q,, of the expected quadratic loss function defined in the previous section, is devised to reflect the tolerance of the authority for deviations from the target path under each objective. For the stabilization objective, the weights are set equal to the deriv- atives of aggregate gross domestic product with respect to the relevant variable. For the income distribution objective, the variables were weighed according to a Samuelson-Bergson utility function of the form,
where YHi is the per capita household income of each household type, p is the elasticity of the utility of income, and Nj is the number of households of type i. This weighting scheme is equivalent to weighting each household income by the utility of household income multiplied by the number of households receiving that income. For the parameter p, a value of 0.8 was chosen. This Q matrix gives considerably higher weights to the incomes of the poorer households.
For the variables of the growth objective, the weights on the sec- total output supplies were set equal to their respective shares in GNP. For the physical capital stocks, the respective output-capital ratios multiplied by the sectoral shares in GNP were used as the relevant weights.
Under each of the three objective functions identified, the weights were normalized around one to achieve comparability in relative terms. Table 6 exhibits the diagonal elements of the basic Q matrix. The weights, Q fci- the separate objectives were obtained from the basic Q by dividing the weights of the state variables that do not apply to the particular objective by 1 jOOO.
The experiment was conducted in three steps. First, for each of the three alternative development strategies an intertemporal path of state variables and instruments was derived under cond,,ions of per- fect foresight. This path is not necessarily optimal for any objective

472 I. Adelman et ai.
function. Next, utilizing the equilibrium values of the state varia- bles r?om the CGE model under each development strategy as the designated target paths, the methods described in the previous sec- tion were applied to develop a set of dynamic ex-ate rules for ex- post adjustment in response to the trade shocks. These rules are ex- hibited in elasticity terms as explained in Ekptions 33111. Finally, the deviations from the t;rget paths and the intensity of adjustment of the control instruments, as measured by the index W in Equation 9, are contrasted across the alternative strategies to infer conclu- sions about the relative stability characteristics of the strategies themselves.
4A. Implementation of the Alternative Strategies
The XL1 strategy is simulated by subsidizing manufacturing exports by 20 percent, with no subsidy being granted to agricultural exports. All subsidies are provided on an ad valorem basis and are paid directly out of the government’s budget. Also, to eliminate the tariff-induced bias against exports, the +triff rates are decreased gradually from their 1985 levels, and are abolished completely in 1990. To further reflect the positive bias towards export-oriented manufactures, the public investment shares of these sectors are increased at the expense of agriculture.
The ADLI strategy is implemented by shifting the investment structure towards agriculture. In particular, agriculture’s share of the government investment fund is gradually* increased to 25 percent by the end of the Fifth Plan period. (Private investment behavior, on the other hand, is allowed to be determined endogenously, re- sponding to sectoral deviations from the economy-wide average rate of return to capital, as is also the case for both the XLE and IS1 simulations.) It is assumed that the increase in ag=icultural invest- ment will allow the factor productivity of agriculture to grow at a rate twice as fast as the one assumed under the other alternative strategies (2.5 percent versus 1.2 percent during 1986 1989, and two percent versus one percent during 1990- 1994), raising the growth of agricultural productivity towards the mean for less devel- oped countries. Given the prolonged neglect of the Turkish agricul- ture, which reached especially severe proportions during the 198Os, and given the vast potential of unexploited resources in this sector, the assumed rates of agricultural productivity growth under ADL should be considered modest. In fact, the assumed ADLI technolog- ical progress rates are 20 percent below the rate hypothesized by

OPTIMAL ADJUSTMENT TO TRADE SHOCKS 473
Adelman (1984, p. 941) in her own §~~~~~~~~s for SOU which she took the average productivity growth rate of ing countries during the 1970s as her estimate of progress rate achievable in South Korea under ADLI next decade.
With respect to foreign trade, under the ADLI strategy d subsidies are gradually reduced and abolished altogether by 1989, the last year of the Fifth Plan. Further, all tariff rates are reduced to 10 percent and equalized across all sectors, so as to remove the antiagri- culture bias associated with having a differential system of incentives that grants higher levels of protection to industry. Thus, in contrast to the XLI’s scheme of high export subsidies, the ADLI strategy calls for a redirection of trade incentives toward one in which domestic demand plays a leading role under the auspices of an undistorted, open, trade regime.
Lastly, the IS1 strategy is simulated by increasing the tariff rate on imports of consumer goods to 40 percent, and that of producer goods to 60 percent. Further, to reflect the reduced substitution pos- sibilities that result from the quantitative import restrictions often imposed in closed-economy, import-substitution strategies, the im- port share parameter and the substitution elasticity in the Arming- tonian composite function are reduced by two percentage points for producer-goods industries. No subsidies are provided to exports. To account for the likely productivity-reducing effects of the ineffi- ciency associated with the IS1 strategies, technical productivity growth rates in manufacturing industries are reduced by one-third. Finally, public investment shares are shifted in favor of import sub- stituting manufactures.
Common to all three strategies, the model’s closure rule requires that the ratio of government-investment to GDP be specified exoge- nously . To ensure comparability among model runs, this rati was fixed at the path projected by the Fifth Plan for all three strategies.
‘k&e s:mulations were carried out over the period 1986- 1994 con- sisting of three three-year subperiods. In devising the target paths, the data for various exogenous variables and parameters for the subperiod 1986- 1989 was taken d&ctly from the Fifth Plan’s The Plan’s trend values were used for the rest of period. The solution values for the state variables an under each strategy are given in Tables 1 and 2, res tables indicate that the target paths under the different strategies are quite different. ADLI generates the highest rate of growth of real output, nonrural incom es, real food consumption, organized labor em-

474 I. Adelman et al.
ployment, and the least migration but at the cost of the highest increase in merchandise trade deficit and the lowest growth rates of rural in- comes. It entails the highest devaluation by 1994, moderate tariffs, no subsidies, and the highest levels of government investment. The IS1 strategy generates the lowest growth of output, per capita real incomes, real per capita consumption, and organized labor employment. It also leads to the smallest trade deficits, requires the least devaluation, the highest tariffs, and the second highest government investment levels. And XL1 is in between.
4B. The Instrument Adjustment Rules
Table 3 gives a broad summary of the level of optimal instrument adjustments to the “ 1979” shock aggregated over sectors and periods. r,Pnf-wdv cmskabin V”U”l _‘J uywsuurs g, there is a clear imkatim that the optimal response to the combined 1979 shock is a devaluation-cum-increased tariff pro- tection. Both the nominal exchange rate and the level of total tariffs are increased under each strategy, for each objective. The optimal adjustment thus involves a combination of “beggar thy neighbor’” devaluation policies with more closed trade policies on the import side. The devaluation is least under income distribution objectives and high- est with growth objectives. Export-led growth requires the least de- valuation under all three objectives. The smallest tariff increases are with export-led growth and stabilization objectives; the highest in- creases are with import substitution and income distribution objectives.
With respect to export subsidies, the optimal policy rule is mixed across strategies: While for ADLI and IS1 an increase in subsidies is needed, for XL1 a reduction is suggested, except with the income distribution objective. With the XL1 strategy, the reductions in sub- sidies with both growth and stabilization objectives move tariff and subsidy rates closer together, in line with the open-development- strategy policy prescription. For the case of the stabilization objective, these subsidies are cumulatively eliminated with optimal adjustment under the XL1 strategies. The income distribution objective increases export sntsidics, because exports a~ labor-intensive and hence benefit export-sector workers, thereby making the distribution more egalitar- ian. Averaged over all objectives, the lowest optimal subsidy levels are with the ADLI strategy; the highest with the IS1 strategy. But the variations with objectives are substantial. The XL1 strategy entails both the highest and the lowest export-subsidy levels: the highest export subsidies of all are with income distribution objectives; the least of all (zero) are with the stabilization objective. Looking across objectives,

Tab
le
1:
Tar
get
Path
s fo
r th
e M
ajor
Sta
te V
aria
bles
(1
986
Lev
els
and
1986
-194
4 A
nnua
l G
row
th
Rat
es,
%I)
AD
LI
XL
1 IS
I
%
1986
%
19
86
%
1986
Rea
l o
utp
ut ’
A
gric
uitu
re
Con
sum
er
man
ufac
ture
s Pr
oduc
er
man
ufac
ture
s Se
rvic
es
Rea
l C
apit
al S
tock
’ A
gric
ultu
re
Con
sum
er
man
ufac
ture
s Pr
oduc
er
man
ufac
ture
s Se
rvic
es
Per
Cap
ita
Rea
l’ N
ouse
hold
In
com
e A
gric
ultu
rai
iabo
r U
rban
mar
gina
l la
bor
Org
aniz
ed
labo
r Se
rvic
es
labo
r A
gric
ultu
ral
capi
talis
ts
Indu
stri
al c
apita
lists
C
omxn
erci
al c
apita
lists
M
erch
andi
se
trad
e de
fici
t’
Per
capi
ta r
eal
priv
ate
cons
umpt
ion2
Pe
r ca
pita
rea
l fo
od c
onsu
mpt
ion2
O
rgan
ized
la
bor
empl
oym
ent3
M
igra
tion3
- _^
_ 3.
YY
8
6.25
5 7.
274
5.70
1
8.59
7 33
97
5.91
3 33
97
4.20
0 33
97
6.88
0 16
31
11.3
35
1631
9.
370
1631
6.
907
4596
5.
963
4596
6.
110
4596
2.
534
1302
3 3.
502
1302
3 1.
574
1302
3
4.71
5 .1
75
5.64
1 .1
76
4.86
2 .1
58
1.17
3 .1
84
-0.4
46
.183
-2
.169
.1
83
1.65
7 .6
05
1.65
7 .6
05
1.65
7 .6
05
2.64
6 .1
98
1.71
5 .1
99
0.26
8 .1
85
3.31
8 2.
617
5.33
3 2.
645
4.84
6 2.
373
0.40
3 7.
437
0.64
9 7.
770
-0.7
36
6.98
4 1.
709
7.16
2 1.
604
6.98
2 0.
100
7.34
9 5.
364
435
4.33
5 44
3 4.
150
337
3.03
6 .3
44
2.37
3 .3
44
1.77
4 .3
31
3.58
8 ,1
32
1.19
9 .1
30
0.73
3 .1
33
2.66
9 29
19
1.58
4 28
87
0.81
3 30
10
-6.5
13
56
- 12
.973
54
-
10.5
97
66.4
2468
3.
7!xJ
24
37
3.02
2 24
37
2711
6.
705
2760
5.
395
2570
39
82
7.19
3 40
33
6.36
2 39
34
6054
5.
489
5969
5.
379
6196
‘Bill
ions
of
Tur
kish
lir
a,
1981
pri
ces.
2M
illio
ns o
f T
urki
sh
lira,
19
81 p
rice
s.
3 1,0
00 m
an-y
ears
.

able
2:
Lev
els
of t
he I
nstr
umen
ts in
the
Tar
get
Pat
h
1986
19
90
1994
AD
LI
XL
1 IS
I A
DL
I X
L1
IS1
AD
LI
XL
1 IS
1
Exc
hang
e ra
te’
583
592
480
1228
11
94
940
2093
19
82
1553
V
alue
of
tari
ffs*
A
gric
ultu
re
3 1
0 3
0 0
3 0
0 C
onsu
mer
m
anuf
actu
re
4 3
13
5 0
14
6 0
17
Prod
ucer
m
anuf
actu
re
133
78
597
184
0 76
3 24
6 0
974
Val
ue o
f ex
port
su
bsid
ies’
A
gric
ultu
re
12
0 0
0 0
0 0
0 0
Con
sum
er
man
ufac
ture
43
92
0
0 13
3 0
0 17
9 0
Prod
ucer
m
anuf
actu
re
41
85
0 0
120
0 0
160
0 G
over
nmen
t in
vest
men
t*
Agr
icul
ture
17
6 74
47
28
5 86
56
37
6 10
2 65
C
onsu
mer
m
anuf
actu
re
84
148
133
46
174
156
56
207
183
Prod
ucer
m
anuf
actu
re
261
231
286
366
271
335
503
323
393
Serv
ices
41
0 46
9 48
8 45
0 55
2 57
5 46
4 65
0 66
7 T
otal
93
1 Y
22
956
1146
10
83
1121
13
98
1282
13
08
CI
~-
‘Nom
inal
exc
hang
e ra
te,
Tur
kish
lir
a pe
r do
llar.
s
‘In
billi
ons
of T
urki
sh l
ira,
19
81 p
rice
s.
%
F J z c

OF’TIMAL ADJWIMENT TO TRADE SHOCKS 477
the income distribution objective entails the highest export subsidy levels and the growth-objective the smallest.
In addition, the optimal policy-adjustment rules indicate the need for decreasing the level of aggregate public investment for the case of the “open” strategies (ADLI and XLI); yet for the “closed” ISI strategy increase in aggregate public investment is called for, to enable implementation of the strategy.
The matrices of optimal adjustments, N,, represent the government’s optimal decision rules in response to a once-only exogenous shock in the first period, 1986. In the period of the shock, this matrix corre- sponds simply to the H matrix of the first round optimal adjustment. In consecutive periods, the N matrix is derived as a composite of optimal responses of the state variables as induced by the earlier ad- justment rules. The N, are displayed in Appendix Tables Al, A2, and A3, normalized for each shock for billion Turkish lira of shock on the balance of trade. In the text, we display the instrument adjustment matrix E(f, 7 = 1) for the ADLI strategy in Table 4 derived as in Equation 40. In the implementation of Equation 4, some of the elas- ticities are undefined since the values of the corresponding instruments in the target runs were zero (see Table 2). The elasticity matrices, E, are therefore not as informative as the normalized Nt matrices Al-A3 of the Appendix.
Appendix Tables Al-A3 enrich the detail summarized in Table 3 of the text. A general overview of the detailed results reported in Table 4 and in the Appendix indicates that optimal instrument adjustment patterns are multifaceted, and spread adjustment across periods and sectors, regardless of the nature of the global strategies. In no instance does the sector that is directly affected by the shock bear the sole or even the major burden of adjustment. It can therefore be concluded that decision rules based on partial equilibrium analyses would never be optimal. Neither would decision rules based on comparative statics, since the optimal adjustment rules spread the instrument adjustments over time. Finally, the optimal adjustments tend to be small. This contrasts with nonoptimal real world adjustment-policy, which has generally involved rather drastic policy interventions, concentrating on a few instruments.
With optimal instrument adjustment and “open”’ development strat- egies the period of the shock requires the most vigorous policy- mtervention; instrument-adjustment in the second period is much smaller than in the first and (as we shall see below) the growth and distribution state variables return to their target values already in the second period. With the import-substitution strategy, however, ad-

t A
djus
tmen
ts (
1986
-199
4)
(com
bine
d sh
ock)
Inco
me
dist
ribu
tion
Gro
wth
obj
ectiv
e St
abili
zatio
n ob
ject
ive
obje
ctiv
e
AD
LI
XL
1 IS
I A
DL
I X
L1
ISI
AD
LI
XL
1 IS
1
Tot
al ch
ange
in
exc
hang
e ra
te’
7,12
1 3,
478
12,0
75
2,81
9 6,
226
10,1
97
2,33
0 81
3 1,
309
Tar
iffs
2 80
5 73
7 58
6 82
2 55
6 1,
005
577
1,06
1 1,
086
Exp
ort
subs
idie
s’
40
- 29
3 52
21
1 -
759
661
183
65
679
Gov
ernm
ent
inve
stm
ent’
-
1,89
5 -
i ,69
5 -4
2 -
798
- 1,
930
344
- 83
0 -
1,03
5 31
‘Nom
inal
exc
hang
e ra
te,
Tur
kish
lir
a pe
r do
llar.
‘B
Aio
ns
of T
urki
sh l
ira,
val
ued
at 1
981
pric
es.
h
-I -
- ._
-
._
- _
-_
- _^
-,
. ._
.
. ._
-
- -
_ ._
* -
-_
-- -
- -
- .
> -
_”
-~
_ -
-_
LA
.--
-
-

-
Taa
bIe
48:
(E)
Ela
stic
ity
Mat
rice
s of
O
ptim
al
Inst
rum
ent
Adj
ustm
ent
unde
r A
DL
I St
rate
gy’
Gro
wth
In
com
e D
istr
ibut
ion
Sho
ck
s*
Shoc
ks’
I II
II
I IV
1986
I II
II
I IV
Exc
llang
e ra
te
Tar
if’s
Agl
iCU
lpur
e
Con
sum
er
man
ufac
ture
s Pr
oduc
er
mau
ufac
rure
s
Exp
ort
Subs
idie
s A
gric
ultu
re
Con
sum
er
mar
~l’a
ctur
es
Prod
ucer
m
anuf
actu
res
Gov
ernm
ent
inve
stm
ent
0.01
8 0.
007
0.04
9 0.
001
0.01
1 0.
007
0.04
3 0.
004
-3.7
46
0.41
1 -6
.971
-3
.215
1.
161
2.32
1 -r
1.6
16
0.45
9 1.
513
0.24
6 0.
907
0.77
4 0.
545
- 0.
976
4.11
5 -
1,99
4 0.
!05
0.
016
0.01
2 0.
395
0.07
6 -0
.012
-0
.079
0.
330
0.51
1 0.
255
0.71
9 0.
681
0.01
8 0.
i 52
0.
217
-0.1
00
-0.0
10
-0.0
56
-0.2
19
0.17
3 0.
084
0.04
4 0.
099
0.04
2 0.
000
0.00
0 0.
000
0.00
0 0.
000
0.00
0 0.
000
0.00
0 -0
.042
-0
.017
-0
.061
-0
.058
-0
.024
-0
.009
-0
.052
-0
.046
Obj
ectiv
e
Stab
iliza
tion
Shoc
ks’
I II
III
IV
-0.0
01
- 0.
779
2.32
0 4.
420
0.07
2 1.
970
-0.7
72
7.01
2 -
1.04
8 0.
084
-0.0
13
- 00
52
3.33
6
0.54
9 0.
851
1.17
8 0.
146
- 0.
020
-0.0
02
-0.0
41
0.01
6 0.
000
0.00
0 0.
000
0.00
0 -0
.009
-
0.00
5 -
0.02
4 -0
.040
0.00
4 0.
018
-0.0
04

Tai
ble
4:
Qco
ntin
ued)
1990
Obj
ectiv
e
Gro
wth
In
com
e D
istr
ibut
ion
Stab
iliza
tion
Shoc
ks2
Shoc
ks2
Shoc
ks’
I II
II
I IV
I
II
III
IV
I II
II
I IV
-
o.oo
o o.
ooo
oAn1
-0
.001
-Q
.OW
-0
.001
-0
.003
0.
005
0.56
5 0.
515
2.67
5 -
a “32
6 I .
- 0.
w2
0.02
2 -0
.046
0.
078
0.01
3 -0
.011
-0
.042
0.
030
0.04
1 -0
.002
0.
019
- 0.
330
Exc
hang
e R
ate
-0.0
03
0.00
0 -0
.001
--
a001
-0
.005
-0
.005
-0
.024
0.
012
0.00
0 o.
txK
l 0.
004
-0.0
05
Tar
iffs
A
gric
ultu
re
0.00
0 0.
000
o.O
Ml
0.00
0 C
onsu
mer
m
anuf
actu
res
0.32
7 0.
063
0.07
8 0.
114
Prod
ucer
m
anuf
actu
res
0.00
s.
0.00
0 w
lOO
0.
000
Exp
ort
subs
idie
s C
onsu
mer
man
ufac
ture
s 3
Prod
uctio
n m
anuf
actu
res
Gov
ernm
ent
inve
stm
ent
- 0.
008
--a)
.UG
l --
O.(
w)2
-0
.003
--
O.c
MX
-0.
005
-0.Q
27
-c..o
13
-0.0
13
-0.0
01
-0.0
08
-0.0
08
WI_
--_
-+P.
.ros
-1-m
.--
__IW
? a-
-.
1 -1
1..
‘Ela
stic
ities
ar
e m
ult;.
plie
d by
10
0. F
or e
ase
of i
nter
pret
atio
n,
the
s&s
of t
he e
last
iciti
es a
r; c
tiz~j
l~r~
~ so t
hat
a po
wiw
G
gn m
eans
an
incr
ease
m
the
re
leva
nt
inst
rum
ent
in r
qons
e to
the
dec
reas
e !n
exp
olt:s
. ‘S
hack
le
gend
: I-
to
impo
rt
pric
e of
pro
duce
r go
ods;
11
, HI,
and
IV
---w
ex
port
de
man
d of
, re
sp;k
ivs?
y,
a@a:
r~e,
c3
nsum
et
man
ufac
turi
ng,
and
prod
ucer
m
anuf
actu
ring
. T
he s
hock
s to
exp
ort
dem
and
of 1
bill
ion
Tur
kish
Lir
a. T
he s
hock
s to
im
port
p5c
r.s
of p
rodu
cer
gwds
ar
e ca
libra
ted
to g
ener
ate
a 1
billi
on T
urki
sh
Lir
a in
crea
se i
n th
e im
port
bill
of
prod
ucer
go
ods.
%
lank
s in
dica
te c
ndet
ined
(s
ee t
ext)
.

OPTIMAL ADJUSTMENT TO TRADE SHOCKS 481
justment in the second period is larger than in the first (except for the income-distribution objective). This suggests that, as Balassa has re- peatedly pointed out, countries following open-trade strategies have an easier time adjusting to trade shocks than do countries following closed-trade strategies. It also suggests that the contrast between the speedy, successful adjustment of the east Asian countries (following open strategies) and the delayed and less successful adjustment of the Latin American countries (following ISI strategies) qualitatively re- flects optimal adjustment policy in both sets of countries given their choices of trade strategies.
With the growth and income distribution objectives, instrument ad- justment is completed over the first two periods. By contrast, the stabilization objective requires continuation of adjustment-policy into the third period, suggesting that this is a harder goal to achieve, even under optimal adjustment policy. Which of the two open development strategies requires less intervention depends on the objectives pursued. If, as a measure of the extent to which active adjustment policy is needed, one uses the absolute sum of the optimal change in instruments over all instruments per billion 1981 Turkish lira of each of the four shocks, then export-led growth requires somewhat less intervention for the growth and income distribution objectives and agricultural- development-led-industrialization requires considerably less interven- tion for the stabilization objective. By this measure, XL1 requiles 10 percent less intervention than ADLI for the growth objective and 22 percent less than ADLI for the income-distribution objective. For the stabilization objective, however, ADLI requires 53 percent less inter- vention than export-led growth. If all objectives are given the same weight, ADLI is 18 percent less interventionist than export-led growth.
Which instrument is used most actively depends both on the strategy and, the objective. Generally, the two most active instruments are tariffs and the level (and distribution among sectors) of government invest- ment, but which of the two is the most active depends on both the strategy and the objective. The least actively used instrument is export subsidies, except with export-led growth and when stabilization is the objective.
Which shock requires the most active intervention depends on both the strategy and the objective. Per billion Turkish lira of shock on the balance of merchandise trade, the shock requiring the least adjustment under the open strategies is the shock to the import price of producer goods. With the open strategies, the shocks which, on the average, require most active adjustment are either shocks to export demand for agricultural commodities or to consumtr manufacturing. However, the

482 1. Adelman et al.
ranking between the two types of shocks depends on the strategy and objective. With ISI, on the average, the shocks requiring the most active adjustment are to export demand for producer goods and to export demand for consumer goods, in that order. The specific ranking of the remaining shocks depends on the objectives.
The specific optimal adjustment rules are sensitive to both objectives and strategies. For example, Tables A l-A3 indicate that, on the av- erage, in the period of the shock, a shock to import prices of producer goods requires an increase in tariffs on consumer manufacturing when the economy is pursuing the ADLI strategy and a reduction when it is pursuing either of the other two trade strategies. By the same token, a shock to import prices with the ADLI strategy requires decreasing tariffs in agriculture with growth of stabilization objectives and in- creasing them with the income distribution objective.
We find no support in Tables A l-A3 for the uniform, across the board, commercial policy prescriptions of classical liberalization ad- vocates. Even under a given strategy and a given objective, optimal commercial-policy adjustments vary by shock and sector. Furthermore, optimal adjustments of tariffs and subsidies do not tend to move toward the “ideal” uniform tariff or subsidy rates.
4C. The Paths of Optimal State Variable Adjustments
Appendix Tables A4-A6 present the elasticity matrices I& r = 1) of the key endogenous variables in response to the same first period shocks as were used to evaluate the optimal instrument change, as calculated in Equation 41. These matrices display the path of induced deviations in the state variables which would result from the imple- mentation of the optimal adjustment rules in response to the initial period shocks. The I matrices describe the changes in the realized path of the economy under optimal adjustment and indicate how the burden of adjustment is allocated across the state variables under the optimal policy rule for each ective and development strategy. The paths displayed in the I? matrices can therefore be utilized to make inferences about the potential relative stability of each of the three global development strategies.
Table 5 displays the index of the cost of adjustment, W of Equation 9.9 This table indicates, first of all, that under optimal adjustment, the cost of adjustment is quite small for all strategies and objectives.
‘*Ille elements of this policy are discussed in Yeldan (1988, Chapter 5) and in Adelman (1984, pp. 945-946).

OPTIMAL ADJUSTMENT TO TRADE SHOCK:IS
Table 5: Indices of Cost of Adjustment (W)
Objective
orowtll o.oQo19 o.ooo22 0.001% Stabilization O.OCUKV O.W408 o.OoOO1 Income distribution 5.08586 3.83584 2.49917
Secondly, Table 5 also indicates that, under all strategies, the major burden of adjustment falls on household incomes. The index of the state variables describing either growth or stabilization objectives is about three orders of magnitude less than that for the income distri- bution variables. Optimal adjustment is thus Kaldorian, in the sense that, in response to shocks, the distribution of income among house- holds changes so as to achieve equilibrium in the macroeconomic vbtiables (see also Table 6). This is,. in part, because our distributional weights 01-h household incomes (see Table 6) are considerably more egalitarian than the household income shares on the target paths. The per capita household incomes of the three poorest groups are accorded between 12 and 71 times as much weight in our objective function as their share in total per capita household income in 1986, while the richest three groups are accorded between one thousand and 0.5 bil- lionth as much weight. Optimal adjustment with our objective function therefore gives considerably greater weight to keeping the poor poor than to keeping the rich rich! The result is an adjustment elasticity for the per capita household incomes of the richest groups which is greater than one and is, on the average, a third larger (in absolute value) than the adjustment elasticity of the incomes of the poorest two household groups. Since, on the average, optimal adjustment lowers the per capita household incomes of bott the poorest and the richest households, the adjustment process results in a more egalitarian distribution of income than on the target path. It also, iherefore, has considerably higher W values.
Restoration of the target values for the growth variables is achieved much more closely and rapidly (see Table A4) with the two open strategies than with import-substitution. With the open strategies, the index W is about one tenth of its value with import substitution for the growth objective, and the growth variables are back on their target
path within one period with the open strategies while requiring all three periods with ISI. Of the two open strategies, ADLI is, overall, the more robust.
Both ADLI and IS1 achieve stabilization objectives muc
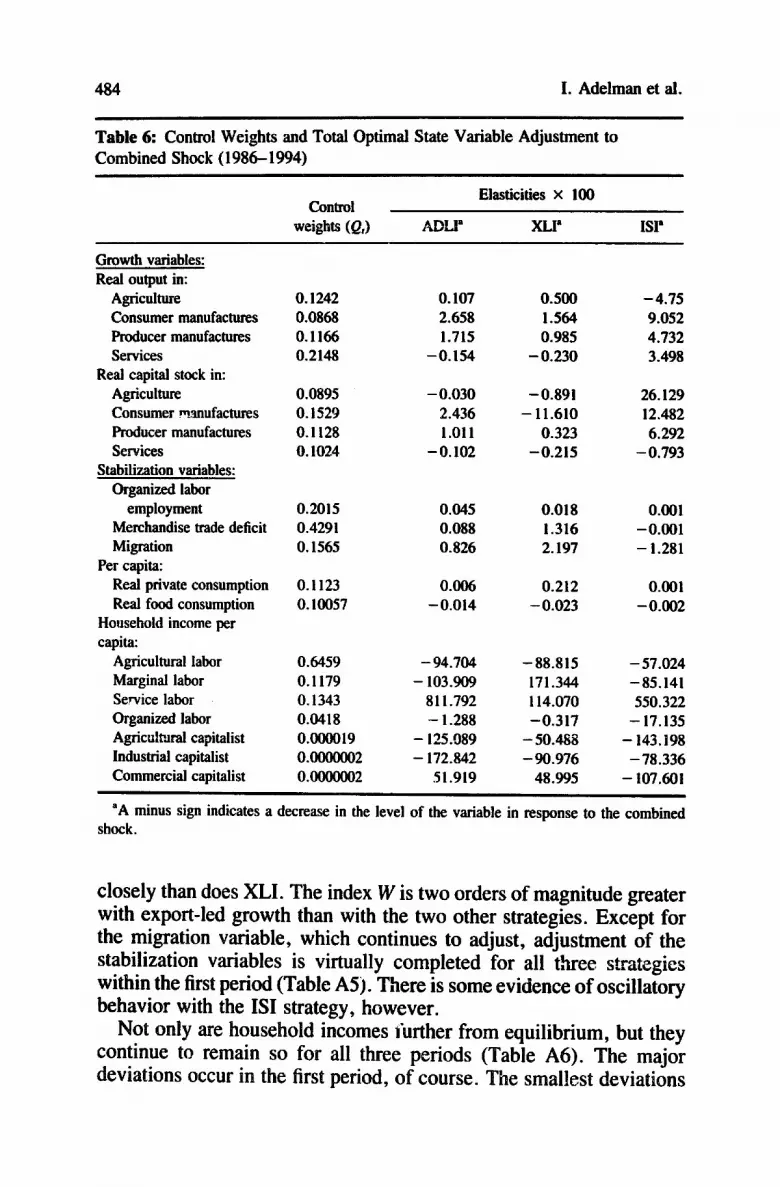
484 I. Adelman et al.
Table 6: Control Weights and Total Optimal State Variable Adjustment to Combined Shock ( 1986- 1994)
Control
wei@ U2J
Elasticities x 100
ADW ?aI” ISlp
Growth variables: Real output in:
Agriculture Consumer manufactures Producer manufactures Services
Real capital stock in: Agriculture Consumer rrlanufactures Producer manufactures Services
Stabilization variables: Organized labor
employment Merchandise trade deficit Migration
Per capita: Real private consumption Real food consumption
Household income per capita:
Agricultural labor Marginal labor Service labor Organized labor Agricu~twal capitalist Industrial capitalist Commercial capitalist
0.1242 0.107 0.500 -4.75 0.0868 2.658 1.564 9.052 0.1166 1.715 0.985 4.732 0.2148 -0.154 - 0.230 3.498
0.0895 - 0.030 - 0.891 26.129 0.1529 2.436 - 11.610 12.482 0.1128 1.011 0.323 6.292 0.1024 -0.102 -0.215 - 0.793
0.2015 0.045 0.018 0.001 0.4291 0.088 1.316 -0.001 0.1565 0.826 2.197 - 1.281
0.1123 0.006 0.212 0.001 0.10057 -0.014 - 0.023 -0.002
0.6459 0.1179 0.1343 0.0418 o.OwO19 o.oooooo2 o.OoOoo02
- 94.704 -88.815 - 57.024 - 103.909 171.344 -85.141
811.792 114.070 550.322 - 1.288 -0.317 - 17.135
- 125.989 - 50.488 - 143.198 - 172.842 - 90.976 - 78.336
51.919 48.995 - 107.601
“A minus sign indicates a decrease in the level of the variable in response to the combined shock.
closely than does XLI. The index W is two orders of magnitude greater with export-led growth than with the two other strategies. Except for the migration variable, which continues to adjust, adjustment of the stabilization variables is virtually completed for all three strategies within the first period (Table A5 j. There is some evidence of oscillatory behavior with the ISI strategy, however.
Not only are household incomes further from equilibrium, but they continue to remain so for all three periods (Table A6). The major deviations occur in the first period, of course. The smallest deviations

OPTIMAL ADJUSTMENT TO TRADE SHOCKS 485
are with the ISI strategy. The largest are with ADLI, which, however, raises the household of some of the poor (service labor) the most.
Table 6 summarizes the total adjustment of the state variables under the combined “1979” shock. This table reinforces what we have learned from the W index, but with more sectoral detail.
5. TURKISH EXPERIENCE WITH STRUCTURAL ADJUSTMENT IN THE 1980s
As mentioned in Section 2B above, the Turkish structuraI adjustment program up to 1986 relied mostly on orthodox policies of expenditure and monetary restraint, and expenditure reswitching. In retrospect, the program’s record has been a mixed one. The rate of growth in real GNP was moderate until 1986, averaging 5.1 percent over the period 1981-1986. It accelerated to 7.4 percent in 1987 but slowed down again in 1988 to 5.2 percent. Manufacturing industry, in particular, experienced a recession in the third quarter of 1988, when manufac- turing outputfell by 5.6 perzent in real terms. This drop was the primary reason for the slowdown in the overall rate of growth.
In the early eighties, Turkey switched from import-substitutionist policies to export-led growth. Growth in merchandise exports became spectacular. Exports increased (in billions of U.S. dollars) from 2.9 in 1980 to 10.2 in 1987. This growth was also accompanied by a marked change in the composition of exports: The share of manufac- tures in total exports rose from an average of 32.6 percent during 1978-1980 to 79.1 percent in 1987. This remarkable performance was achieved mainly through large reductions in real wages, an implicit taxation policy of agriculture by means of dramatic reductions in the agricultural terms of trade, lo an effective real devaluation policy, and high direct incentives granted to exports. However, all of these actions also had some adverse effects. First, the decline in real wages and the fall in the agricultural terms of trade have resulted in a severe increase in inequality. Secondly, the real devaluation increased international competitiveness of Turkish exports, but it also increased the real burden of dollar denominated foreign debt by increasing the cost of debt servicing. Thirdly, the high and differentiated export-incentive system created vast opportunities for noneconomic profits. For instance Ml- anovic (1986) has asserted that “fictitious” exports-sources of for- eign exchange which are illegally reported as exports to be eligible for
“‘Boratav and Turel (1988) calculate that, based on index of 100 for 1977, agricultural terms of trade fell to 47 in 1986.

486 I. Adelman et al.
generous tax rebates-accounted for about 13 percent of total export revenues in 1985.
Nevertheless, the optimal instrument-adjustment calculations we performed suggest that these policy actions were, with some notable exceptions, qualitatively but not quantitatively, correct. We do not use wage rates or agricultural terms of trade as adjustment instruments in OUT analysis. We do, however, observe *te response of these variables to trade shocks under optimal instrument-adjustment. Table A6 indi- cates that, with respect to the wages of organized labor, the optimal response is first a small cut (an elasticity of - .034) followed in the next period by the virtual restoration of real wages (an elasticity of + .03 1) under the XL1 strategy relevant for Turkey of the early eighties with the income distribution objective, resulting in a cumulative small cut of .OO3 (in elasticity terms). With respect to agricultural terms of trade, we can infer their optimal behavior from the behavior of the income of agricultural households: With both open strategies, the total adjustment elasticity of the per capita incomes of agricultural household labor is - .9 (Table A@, suggesting a somewhat larger elasticity of agricultural terms of trade in response to the combined trade shocks.
Our calculations do support the need for a devaluation of the Turkish bra but of more substantial proportions than actually took place. With the XL1 strategy and the growth objective, the cumulative optimal devaluation in response to the 1979 shock is by a factor of two (cal- culated from Tables 2 and 3). Our analysis does not suggest raising export subsidies; rather, our calculations (see Tables 2 and 3) indicate a cumulative cut of about 40 percent under the XL1 strategy and the growth objective or the full elimination of subsidies under the XL1 strategy and the stabilization objective.
In 1981, contractionary policies were adopted in Turkey reducing the public sector deficit in order to bring inflation under control. The public deficit was cut from 10 percent of GNP in 1980 to 5.4 percent in 1981, and stabilized between 4.5 to 5 percent until 1986. These reductions in public deficit were brought about primarily through cuts in public investment, which gradually declined from 11.9 percent of GNP in 1981 to 9.7 percent in 1984. This decline in investment is in line with our optimal-adjustment results, which indicate that, under
strategies, cumulative reductions of the order of 35 percent sector investment should take place in response to the 1979 bles 2 and 3). foreign uade si e, most of the quantitatrve restrictions were
abolished in urkey as early as 19gO- 198 1. In 198 1, the quota list was a-bolished, and again in 1987, and interest-free advance-deposit

OPTIMALADJUSTMENTTOTRADESHOCKS 487
requirements were lowered substantially. In 1984, the import regime was further liberalized and tariffs were reduced. However, at the same time compulsory fund surcharges were increased from four to six.”
Export incentives were initially increased and the subsidy rate av- eraged about 22 percent of the value exports in manufacturing until 1984 (Milanovic, 1986). The primary incentive tool for exports has been rebates on production and income taxes. Vigorous political op- position led to a cut in tax rebate rates to eight percent and their elimination for textile export in 1986. However, the stagnation in exports in that year led to the reintroduction of tax rebates in 1987. In compliance with GATT agreements, export tax rebates started being gradually reduced and were completely abolished by the end of 1988, with a resort to preferential credits as an export incentive-system be- ginning January 1989.
The results derived from the analysis of the optimal policy instrument tables suggest that the optimal strategy with respect to the foreign trade instruments should be more differentiated across sectors and across objectives. We do not find that a uniform reduction in the case of tariffs or a uniform increase in the case of export subsidies are optimal. Our results also suggest that, contrary to the usual liberalization-policy prescriptions, tariffs should have been raised rather than reduced. A rough indication of orders of magnitude can be inferred from our calculations. For the XL1 strategy, tariffs were eliminated after 1989, so a straight ratio of cumulative tariff change to cumulative levels of tariffs would be misleading. Two “counter-factual” assumptions with respect to tariff levels arc possible. One alternative would be to main- tain tariff levels constant at 1986 levels; this calculation yields an optimal 38 percent cumulative increase. Another alternative would be to use the optimal tariff behavior under ADLI, the other open strategy, as a guide; this calculation yields a cumulative 37 percent increase in tariffs. Furthermore, contrary to the actual commercial policies used in Turkey thus far and over the Fifth Plan period ( 1985- 1989), export subsidy adjustments should have played a smaller role than tariff ad- justments in Turkey’s adjustment policy. Finally, as indicated earlier, our results suggest that optimally subsidies should have been reduced over the Fifth Plan period rather than continued at their very high levels. A more vigorous devaluation should have been used instead to provide incentives for exports. Thus, our results suggest that, Turkey’s
“For a more detailed analysis of the Turkish Liberalization attempts, see Senses (1988) and Turhan (1986).

488 I. Adelman et al.
commercial of the economy argue
the limits the orthodox policy, based price incentives wage reductions, been reached. the recent
report on asserts, the in the of in- away from is likely to affect overall produc-
tivity negatively and can already be cited as one of the main reasons of the faltering performance of the economy beginning from the second half of 1988. It seems that the benefits of direct incentives and outright liberalization have been exhausted, and further increases in exports and in overall GNP will only come from future increases in productivity which can only be the result of a careful and integrated investment program both in industry and in agriculture.
Our results suggest that, under optimal adjustment, Turkey would have experienced a smoother, higher, and sustainable rate of growth of real output averaging 5.89 percent with the export-led growth strat- egy. Had Turkey shifted to agricultural development as the dynamic impetus for growth instead, our results suggest that it would have experienced an even higher average rate of growth-625 percent. Under either of the open strategies, it would have adjusted faster than it did to its target path. Also, it would have distributed growth more evenly and the costs of adjustment would have been distributed less regressively then they were. (The rates of growth of household incomes of the poorer groups were higher than those of the richest groups in our calculaiions both in the rural and the with either of the two open strategies.) There would also have been less social dislocation, with less organized-labor unemployment and a substantial reduction in rural-urban migration. Our results, however, do foresee an increasing merchandise trade deficit, as on the target paths of Table 1.
6. SUMMARY AND CONCLUSION
It is always dangerous to generalize from a single case, based on a very specific model, data and methodology. Ideally, our computations should be performed with a large range of economies before drawing any conclusions, for either economic theory or policy. On the other hand, counterfactual experiments performed on a single case do have the advantage of making the counter-factual unique and explicit and of rendering the results of different policies and different policy objectives more nearly comparable. We shall therefore summarize some of the conclusions suggeste by our optimal adjustment calculations, albeit with some trepidation concerning their generality.

OPTIMAL, TO TRADE SHOCKS 489
The results of our calculations and their comparisons with actual stabilization experiences suggest several conclusions. First, our results suggest that the qualitative differences in adjustment to the two ofi shocks between the East Asian countries and the rest of the developing world are primarily the result of differences in their development strat- egies. Qualitatively, we find quicker instrument adjustment and smaller adjustment cost with the open development strategies that have char- acterized the East Asian countries. The open strategies are more robust and require less active intervention than does import-substitution.
Second, our results support the trade-theory contention that deval- uation is an optimal response to trade shocks. We find this result to be independent of strategy and objective.
Third, our results do not support most of the elements of the classical trade-liberalization policy packages. Reduction in export subsidies are recommended in our calculations only for economies that are pursuing export-led growth strategies. Under the other two strategies, increases in subsidies are optimal. Our calculations also do not support the trade- theory contention that cuts in tariffs are optimal. On the contrary, our calculations suggest that under all strategies and objectives tariff in- creases are optimal responses to trade shocks. Finahy, our results also do not support the trade-theory contention that uniform adjustments across sectors are optimal. Rather, we find that optimal responses tend to be sectorally differentiated and shock and objective specific.
Fourth, optimal adjustment tends to spread the adjustment process across instruments and, to a lesser extent, across periods. Partial equi- librium and comparative statics results are therefore unlikely to lead to optimal policy recommendations.
Fifth, adjustment with optimal instrument adjustment requires con- siderably smaller changes than the more concentrated adjustment poli- cies of the real world. Our study suggests that, if Turkey had embarked on its adjustment policy armed with our optimal results, smaller ad- justments and higher, steadier growth would have resulted.
Sixth, our results suggest that per capita household incomes bear the brunt of the adjustment process. With optimal instrument adjust- ment, the growth or stabilization variables can be restored quite quickly to essentially the unshocked trajectory even under very substantial trade shocks. Household incomes, on the other hand, continue. to deviate from their unshocked trajectories despite optimal instrument adjustment and macro adjustment. This generalization appears to hold for all strategies and objectives.
Seventh, among objectives the growth objective is most easily achieved. The stabilization objective requires the most extensive and extended intervention, but can be achieved very closely indeed, es-
490 I. Adelman et al.
pecially under either agricultural development or import substitution. The income distribution objective cannot be achieved very closely and requires continued intervention.
Eighth, among strategies agricultural development entails a smaller adjustment cost than does export-led growth for both growth and sta- bilization objectives. It does, however, entail a larger adjustment cost for income distribution objectives. Import substitution achieves the stabilization objective most closely of all strategies but is least suc- cessful in achieving the (already considerably lower) growth objective.

‘hbk
A
l:
(N)
Mat
rice
s of
Opt
imal
Ins
trum
ent A
djus
tmen
ts,
Gro
wth
Obj
ecti
ves’
Shoc
ks’
Cha
nges
in:
198
6
To
impo
rt p
rice
of
To
expo
rt d
eman
d of
prod
ucer
go
ods3
A
gric
ultu
re
cons
umer
go
ods
Prod
ucer
go
ods
AD
LI
XL
1 IS
1 A
DL
I X
L1
ISI
AD
LI
XL
1 IS
I A
DL
I X
LI
ISI
Exc
hang
e ra
te
0.97
8 I.
135
I .73
6 4.
385
5.73
4 6.
445
8.07
9 -
2.03
4 7.
871
0.13
2 I .
555
IO. 1
21
Tar
iffs
A
gric
ultu
re
Con
sum
er
man
ufac
ture
Pr
oduc
er
man
ufac
ture
- 0.
994
0.10
2 0.
258
1.23
1 5.
821
7.95
2 -
5.42
1 -
I .47
4 8.
480
- 2.
763
- I .
679
23.6
45
0.59
4 -0
.710
-
0.52
9 1.
093
-3.6
06
-3.1
71
8.6%
II
.606
I .
464
0.96
7 -
2.67
4 14
.337
1.
281
- 0.
257
0.75
6 2.
199
- I .
233
- I .
723
0.47
4 0.
997
- 3.
532
15.6
36
16.7
59
3.07
4
Exp
ort
subs
idie
s A
gric
ultu
re
Con
sum
er
man
ufac
ture
Pr
oduc
er
man
ufac
ture
0.55
4 -0
.011
0.
556
3.11
2 0.
044
-0.3
58
2.39
1 0.
009
-4.3
04
1.56
3 -
0.00
8 -0
.041
-0
.175
0.
674
-2.5
18
-0.1
31
0.07
5 -
2.65
5 1.
263
4. I
83
-2.2
16
I .53
9 0.
000
- 1.
588
0.00
0 0.
000
- 0.
099
0.00
0 0.
000
- 2.
629
0.00
0 0.
000
-2.1
50
14.7
29
16.2
33
0.00
Gov
ernm
ent
inve
stm
ent
Agr
icul
ture
C
onsu
mer
m
anuf
actu
re
Prod
ucer
m
anuf
actu
re
Serv
ices
-0.5
86
-0.5
66
0.62
9 -
2.44
2 -
2.79
2 2.
298
4.28
6 -
0.68
8 -
2.83
9 -0
.747
-.
I .0
89
0.58
7 0.
771
0.75
4 2.
402
-3.7
04
2.81
8 -4
.394
-
0.78
3 3.
484
0.35
8 I.
533
0.65
0 0.
121
1.76
4 2.
6991
-
1.31
3 4.
Y35
-4
.747
0.
1 I2
5.
567
0.83
8 I .
037
- 1.
887
- 2.
426
2.27
8 -
7.72
2 -
11.7
64
9.13
5 -
14.1
21
- 2.
426
- II
.243
-
1.59
6 -4
.98
I
3.72
7 4.
604
6.37
9 14
.678

Tab
le
Al:
(c
on
tin
ued
)
Shoc
ks’
To
expo
rt d
eman
d of
T
o im
port
pri
ce o
f pr
oduc
er
good
s3
Agr
icul
ture
co
nsum
er
good
s Pr
oduc
er
good
s
AD
LI
XL
1 IS
I A
DL
I X
L1
IS1
AD
LI
XL
1 IS
1 A
DL
I X
L1
G
Exc
hang
e ra
te
-0.0
32
0.00
7 -0
.013
-0
.068
0.
035
-0.1
19
- 0.
025
-0.0
01
-0.0
98
- 0.
039
-0.0
13
-0.2
25
Tar
iffs
A
gric
uhre
0.
000
0.00
4 0.
004
0.00
0 0.
018
-0.0
09
0.00
0 -0
.008
-0
.008
O
.fKK
t -0
.011
-
0.02
6 C
onsu
mer
m
enuf
actu
re
0.01
5 -0
.016
-0
.011
0.
032
-0.0
85
-0.1
06
0.01
1 0.
001
-0.0
88
0.01
7 0.
031
- 0.
202
Prod
ucer
m
anuf
actu
re
0.00
2 -0
.009
-0
.002
0.
004
- 0.
047
-0.0
63
0.00
1 0.
007
- 0.
053
0.00
2 0.
021
-0.1
27
Exp
ort
subs
idie
s A
gric
ultu
re
0.00
4 -0
.002
-0
.010
0.
009
-0.0
10
-0.0
72
0.00
3 0.
006
- 0.
059
0.00
5 0.
007
-0.1
33
Con
sum
er
man
ufac
ture
-0
.088
-0
.004
0.
026
-0.0
16
-0.0
20
0.14
9 -
0.00
6 -0
.001
0.
122
-0.0
09
0.00
6 0.
266
Prod
ucer
m
anuf
actu
re
-0.0
09
-0.0
06
-0.0
29
-0.0
22
- 0.
045
-0.3
59
-0.0
09
-0.0
22
- 0.
299
-0.0
12
0.00
2 -
0.69
7
Gov
ernm
ent
inve
stm
ent
Agr
icul
ture
-0
.015
0.
000
0.00
5 -0
.031
0.
000
0.02
7 -0
.011
-0
.001
0.
022
- 0.
017
-0.8
01
0.04
7 C
onsu
mer
m
anuf
actu
re
-0.0
13
-0.0
04
0.00
4 -0
.027
-
0.02
2 0.
045
-0.0
10
o.uO
O
0.03
7 -0
.015
-0
.008
0.
086
Prod
ucer
m
anuf
actu
re
-0.0
16
-0.0
05
0.00
6 -
0.03
3 -
0.02
5 0.
064
-0.0
13
0.00
0 0.
053
-0.0
19
-0.0
09
0.12
3 Se
rvic
es
- 0.
030
-0.0
07
0.01
3 -
0.06
3 -
0.03
8 0.
143
-0.0
23
0.00
0 0.
188
- 0.
035
-0.0
14
0.27
4

1994
: E
xcha
nge
rate
Tar
iffs
A
gric
ultu
re
Con
sum
er
man
ufac
ture
Pr
oduc
er
man
ufac
ture
Exp
ort
subs
idie
s A
gric
ultu
re
Con
sum
er
man
ufac
ture
Pr
oduc
er
man
ufac
ture
Gov
ernm
ent
inve
stm
ent
Agr
icul
ture
C
onsu
mer
m
anuf
actu
re
Prod
ucer
m
anuf
actu
re
Serv
ices
o.oo
o
0.00
0 0.
000
0.00
0
0.00
0 0.
000
0.00
0
0.00
0 0.
000
0.00
0 0.
000
o.oo
o -0
.001
0.
000
0.00
0 0.
001
0.00
0 o.
ooo
o.oo
o 0.
000
0.00
1 o.
ooo
0.00
0
0.00
0 -0
.002
0.
000
0.00
0 0.
014
0.00
0 0.
000
-0.0
16
0.00
0
0.00
0 0.
000
0.00
0 0.
000
0.00
0 0.
000
o.aO
O
0.00
0 0.
000
0.00
0 -0
.001
0.
000
0.00
0 -
0.05
1
0.00
0 0.
057
0.00
0 0.
001
0.00
0 0.
000
0.00
0 -0
.078
0.
000
0.04
7 0.
000
-0.5
16
0.00
0 -0
.015
0.
000
-0.0
15
0.00
0 -0
.012
0.
000
- 0.
064
0.00
0 0.
000
- 0.
043
0.00
0 0.
000
-0.1
03
0.00
0 0.
000
0.04
8 0.
000
0.00
0 0.
116
0.00
0 0.
000
0.00
0 0.
000
0.00
0 0.
001
0.00
0 0.
000
0.00
0 0.
000
0.00
0 -0
.001
0.00
0 0.
000
- 0.
065
0.00
0 0.
000
-0.1
58
0.00
0 0.
000
0.39
9 0.
000
0.00
0 0.
962
0.00
0 0.
000
- 0.
432
0.00
0 0.
000
-0.1
04
0.00
0 0.
000
-0.0
13
0.00
0 0.
000
-0.0
31
0.00
0 0.
000
-0.0
13
0.00
0 0.
000
- 0.
032
0.00
0 0.
000
- 0.
010
0.00
0 0.
000
- 0.
025
0.00
0 0.
000
- 0.
054
0.00
0 0.
000
-0.1
30
‘Ent
ries
are
in
billi
ons
of T
urki
sh
lira
per
billi
on o
f T
urki
sh l
ira
of s
hock
. ‘T
he
shoc
ks t
o ex
port
de
man
d ar
e ca
libra
ted
to g
ener
ate
decr
ease
s in
exp
orts
of
I bi
llion
Tur
kish
lir
a. F
or e
ase
of i
nter
pret
atio
n,
the
sign
s of
the
rat
ios
are
chan
ged
so t
hat
a po
sitiv
e si
gn m
eans
an
incr
ease
in
the
rele
vant
sta
te v
aria
ble
in r
espo
nse
to t
he d
ecre
ase
in e
xpor
ts.
‘The
sho
cks
to i
mpo
rt p
rice
s of
pro
duce
r go
ods
are
calib
rate
d to
gen
erat
e a
I bi
llion
Tur
kish
lir
a in
crea
se i
n th
e im
port
bill
of
prod
ucer
go
ods.

Tab
le
AZ
: (N
) M
atri
ces
of O
ptim
al
Inst
rum
ent
Adj
ustm
ents
, St
abili
zatio
n O
bjec
tive’
Shoc
ks*
Cha
nges
in:
198
6
Exc
hang
e ra
te
Tar
iffs
Agr
icul
ture
C
onsu
mer
m
anuf
actu
re
Prod
ucer
m
anuf
actu
re
Exp
ort
subs
idie
s
Agr
icul
ture
C
onsu
mer
m
anuf
actu
re
Prod
ucer
m
anuf
actu
re
Gov
ernm
ent
inve
stm
ent
Agr
icul
ture
C
onsu
mer
m
anuf
actu
re
Prod
ucer
m
anuf
actu
re
Serv
ices
1990
: E
xcha
nge
rate
Tar
iffs
Agr
icul
ture
C
onsu
mer
m
anuf
actu
re
Prod
ucer
m
anuf
actu
re
To
impo
rt p
rice
of
To
expo
rt d
eman
d of
-
prod
ucer
go
ods’
A
gric
ultu
re
Con
sum
er
good
s Pr
oduc
er
good
s
AD
LI
XL
1 IS
I A
DL
I X
L1
ISI
AD
LI
XL
1 IS
1 A
DL
I X
L1
IS1
- 0.
067
1.78
4 2.
398
2.85
7 8.
019
1.17
9 3.
004
-4.5
08
7.22
9 -0
.669
0.
583
1.86
0
-0.2
05
- 0.
257
0.97
2 6.
949
4.89
8 5.
001
3.59
6 0.
630
- 1.
161
0.06
2 -0
.168
1.
207
0.77
2 -3
.401
-
1.56
1 -3
.427
-
14.0
48
0.55
0 8.
447
18.8
44
5.08
6 -
1.33
1 -0
.891
-0
.040
1.
032
- 1.
988
0.38
9 -
1.82
0 -8
.613
1.
638
- 1.
945
4.20
8 -
1.08
9 13
.821
15
.670
13
.977
0.59
5 -0
.017
-0
.927
0.
882
0.01
4 0.
558
3.91
3 0.
006
0.61
6 0.
514
-0.0
12
- 3.
601
- 0.
079
0.53
5 0.
198
2.22
6 2.
450
3.83
7 -
0.50
8 -0
.729
1.
573
0.21
3 -
0.03
4 13
.339
0.
000
5.03
3 0.
000
0.00
0 -
12.9
41
0.00
0 0.
000
7.77
9 0.
w
0.00
0 1.
160
0.00
0
0.01
0 -0
.908
-0
.874
-
I.41
6 -
3.98
3 -0
.379
-
1.5@
7 2.
015
’ 2.
530
-0.2
15
-0.5
08
- 0.
593
-0.0
14
-1.1
99
-1.0
53
-1.5
17
-5.1
93
0.44
6 1.
612
2.47
4 3.
055
-0.1
01
-0.8
14
0.68
3 0.
011.
0.
114
-0.9
51
1.57
8 0.
350
1.66
9 -
1.67
1 0.
582
5.71
I
-0.2
61
-0.9
92
2.98
9 -
0.03
4 -
3.83
3 4.
237
-4.9
59
-16.
656
- 1.
510
-5.1
65
7.89
0 -
10.4
24
-0.1
38
-2.6
31
;-2.
014
0.99
6 1.
394
1.19
4 -0
.713
5.
714
0.40
5 1.
337
- 2.
685
0.41
9 -
2.07
2 0.
375
-0.4
63
-0.0
02
0.04
9 -
I .58
7 -0
.001
0.
201
- 0.
486
- 0.
003
- 0.
094
- 1.
039
0.00
5 0.
013
0.04
2 -0
.414
-0
.551
4.
218
0.11
6 -
2.26
2 1.
261
-0.6
48
1.05
7 3.
030
1.16
3 -0
.145
0.
206
0.69
8 1.
729
1.29
0 -0
.370
7.
094
0.27
6 1.
002
- 3.
327
1.92
5 -
I .67
4 0.
459
1.24
9
1
,,,,
, ,/
,,u
8
, ,,
,,,
,,,,
,*,
,,,“/
, ,,
,,,m
,x
,,
,m
‘I,,
” ,,
,,
I
,, ,,
,“,,
.,
, /I
,,,

Exp
ort
subs
idie
s A
gric
ultu
re
Con
sum
er
man
ufac
ture
Pr
oduc
er
man
ufac
ture
-0.6
14
- I .
802
2.94
9 0.
515
- 7.
385
0.89
5 -
0.78
5 3.
471
I .99
8 1.
149
-0.4
87
0.00
1 -0
.138
0.
393
- 7.
793
0.00
8 1.
610
-2.3
47
-0.2
31
-0.7
58
-5.4
40
0.44
0 0.
109
-0.1
92
0.28
2 -
1.29
4 8.
087
-0.7
84
-5.3
13
2.47
6 0.
08 I
2.
480
5.27
7 0.
387
-0.3
40
-0.2
38
Gov
ernm
ent
inve
stm
ent
Agr
icul
ture
C
onsu
mer
m
anuf
actu
re
Prod
ucer
m
anuf
actu
re
Serv
ices
1994
: E
xcha
nge
rate
Tar
iffs
A
gric
ultu
re
Con
sum
er
man
ufac
ture
Pr
oduc
er
man
ufac
ture
0.49
2 -0
.134
0.
499
-0.3
12
- 0.
548
0.17
0 -0
.681
0.
257
-0.
IS0
1.08
9 O
.-J5
8 -0
.752
0.
638
-0.2
97
-3.0
81
0.21
0 -
0.46
0 1.
450
-0.2
83
0.67
7 -0
.5bl
-
0.99
4 0.
986
- 0.
456
- 4.
074
0.32
3 -0
.760
1.
914
- 0.
454
1.14
3 -
0.72
6 -
1.63
4 0.
313
-0.4
92
- 6.
699
0.12
4 -0
.989
3.
145
- 0.
050
1 .ss
s
- 0.
055
-0.2
50
0.44
9 0.
061
- 1.
027
0.11
4 -0
.065
0.
481
0.50
6 0.
076
0.02
2 0.
446
-0.3
42
-0.0
31
1.83
1 -
0.08
7 0.
022
- 0.
858
-0.3
81
-0.0
19
0.11
9 -0
.178
0.
094
- I .
478
0.02
9 -0
.051
-
6.06
5 0.
007
0.13
4 2.
842
0.03
8 -
0.22
2 -0
.393
0.
021
-0.0
94
- I.
842
- 2.
077
0.06
3 -7
.481
-
0.52
8 -0
.129
3.
508
- 2.
334
0.20
2 -
0.48
6 -
1.10
2
- 0.
035
-0.2
04
-0.2
66
-0.4
38
-0.0
65
-0.1
89
-0.1
77
-0.2
54
-0.3
11
0.24
0
Exp
ort
subs
idie
s
Agr
icul
ture
C
onsu
mer
m
anuf
actu
re
Prod
ucer
m
anuf
actu
re
Gov
ernm
ent
inve
stm
ent
Agr
icul
ture
C
onsu
mer
m
anuf
actu
re
Prod
ucer
m
anuf
actu
re
Serv
ices
-0.0
01
- 0.
456
0.79
s 0.
033
- 1.
871
0.20
3 0.
015
0.87
8 0.
886
- 0.
056
-0.1
25
0.41
3 0.
072
1.19
8 0.
684
- 0.
096
4.91
s 0.
174
0.07
6 -
2.30
5 0.
769
- 0.
073
0.32
1 0.
363
0.13
4 -0
.353
-0
.674
-0
.041
-
1.44
9 -0
.174
0.
207
‘0.6
79
-0.7
38
-0.3
73
- 0.
094
-0.3
34
0.01
7 0.
158
0.18
7 -0
.024
0.
648
0.04
5 -
0.01
7 -
0.30
5 0.
232
-0.0
12
0.04
1 0.
125
0.00
1 0.
099
0.10
1 -0
.002
0.
406
0.02
6 -0
.001
-0
.189
0.
112
-0.0
01
0.02
4 0.
052
0.04
0 0.
160
0.05
3 -0
.042
0.
658
0.01
4 -
0.04
8 -0
.309
0.
053
-0.0
60
0.04
3 0.
021
0.03
0 0.
143
0.33
5 -0
.033
0.
586
0.08
7 -
0.03
6 -0
.275
0.
364
-0.0
43
0.03
7 0.
162
‘Ent
ries
are
in
billi
ons
of T
urki
sh
lira
per
billi
on o
f T
urki
sh l
ira
of s
ho
ck
.
‘The
sh
ocks
to
expo
rt
dem
and
are
calib
rate
d to
gen
erat
e de
crea
ses
in e
xpor
ts o
f 1
billi
on T
urki
sh
lira.
For
eas
e of
int
erpr
etat
ion,
th
e si
gns
of t
he r
atio
s ar
e ch
ange
d so
tha
t a
posi
tive
sign
mea
ns a
n in
crea
se i
n th
e re
leva
nt
stat
e va
riab
le i
n re
spon
se t
o th
e de
crea
se
in e
xpor
ts.
‘The
sh
ocks
to
impo
rt p
rice
s of
pro
duce
r go
ods
are
calib
rate
d to
gen
erat
e a
1 bi
llion
Tur
kish
Iir
a in
crea
se
in t
he i
mpo
rt b
ill o
f pr
oduc
er
good
s.
.,,,
,,/
.,,
*,
,,.,
I ,,,
,,,
A
,,,
,, .,,
,,,
,, .,
#,,
,/ I
,,,,
” ,,
,,,,
, ,*
,,
,,
,,,
/a,,
,,
,,,,
, ,,
,,
,/,
#I#
#I#
,,“,,
,, ,,,
,,

1e A
3:
(N)
Mat
rice
s of
Opt
imal
Ins
trum
ent A
djus
tmen
ts,
Inco
me
Dis
trib
utio
n O
bjec
tive
’
Shoc
ks’
Cha
nges
in
:
To
impo
rt
pric
e of
T
o ex
port
dem
and
of
prod
ucer
go
od?
Agr
icul
ture
C
onsu
mer
go
ods
Prod
ucer
go
ods
AD
LI
XL
1 IS
1 A
DL
I X
L1
is1
AD
Ll
XL
1 IS
1 A
DL
I Y
Li
ISI
1986
: E
xcha
nge
rate
Tar
iffs
Agr
icul
ture
Con
sum
er
man
ufac
ture
Prod
ucer
m
;ini;f
actu
re
Exp
ort
subs
idie
s
Agr
icul
ture
Con
sum
er
man
ufac
ilire
Prod
ucer
m
anuf
actu
re
Gov
ernm
ent
inve
stm
ent
Agr
icul
ture
Con
sum
er
man
ufac
ture
Prod
ucer
m
anuf
actu
re
Serv
ices
1990
: E
xcha
nge
rate
Tar
iffs
A
gric
ultu
re
Con
sum
er
man
ufac
ture
Prod
ucer
m
anuf
actu
re
0.59
3 0.
358
I .45
2 4.
51 I
I .62
7 0.
574
7.06
9 -
I .52
8 0.
795
0.66
9 0.
758
- 3.
379
0,30
8 0.
677
11 .a
37
6.95
2 8.
930
7.84
4 -
1.31
5 -
1.46
6 18
.111
0.
395
0.10
3 12
.448
0.
214
-0.5
54
-5.9
56
-4.3
10
-2.8
52
-0.6
92
4.95
8 13
.057
-
1.66
4 -2
.513
0.
076
- 3.
338
0.92
7 -0
.489
3.
314
- 1.
663
-3.4
01
I .69
2 -
2.98
3 1.
322
- 3.
820
13.0
68
16.4
25
14.6
08
0.02
0 -
0.03
7 -
6.47
7 0.
028
-0.0
85
- 1.
398
0.67
4 0.
045
- 10
.982
-
0.35
3 0.
008
- 1
I .26
2
0.33
I
0.65
0 6.
972
1.99
8 3.
321
6.52
0 1.
202
-1.0
03
18.1
95
0.53
2 -0
.518
25
.570
0.
000
-0.6
43
0.00
0 0.
000
4.79
1 0.
000
0.00
0 -
1.30
6 0.
000
0.00
0 2.
550
0.00
0
-0.3
51
-0.1
78
0.62
9 -
2.27
0 0.
688
0.15
4 3.
576
- 0.
492
0.23
2 -
0.88
2 -0
.611
-
1.25
7
-0.3
48
-0.2
35
0.76
3 -2
.404
0.
848
0.17
1 3.
805
- 0.
456
0.27
3 -0
.613
-
0.94
5 -
1.58
0
-0.3
93
-0.0
13
1.15
1 -2
.522
0.
639
I .47
9 -
3.97
6 0.
330
1.31
2 -
1.00
2 -
I .22
8 -0
.899
- I.
140
-0.7
98
1.88
1 -7
.826
-3
.008
0.
406
- 12
.324
-
I .54
8 0.
543
- 2.
481
-3.0
06
5.53
4
- 0.
576
0.00
3 0.
167
- 5.
920
0.01
2 -0
.044
-
8.34
4 0.
022
- 0.
086
4.36
9 0.
003
-0.3
96
0.00
0 1.
171
-0.0
86
0.00
1 I .
477
0.06
5 0.
001
-0.1
96
0.12
3 -0
.001
-
1.03
6 0.
362
0.25
9 -0
.172
0.
015
2.66
5 -
1.52
7 0.
032
3.75
8 0.
274
0.05
8 -
I .96
8 1.
105
0.09
9
-0.2
18
-0.3
15
-0.3
28
-2.2
1 I
-2.6
97
0.07
1
-3.0
96
0.34
1 0.
140
1 Xi4
2 1.
884
0.71
8

Expo
rt su
bsid
ies
Agric
ultu
re
Cons
umer
m
anuf
actu
re
Prod
ucer
m
anuf
actu
re
Gov
ernm
ent
inve
stm
ent
Agy
cultu
re
Cons
umer
m
anuf
actu
re
Prod
ucer
m
anuf
actu
re
Serv
ices
1994
: Ex
chan
ge
rate
Tar
iffs
Ag
ricu
ltu
re
Co
nsu
mer
m
anu
fact
ure
Pro
du
cer
man
ufa
ctu
re
Exp
ort
su
bsi
die
s
Ag
ricu
ltu
re
Co
nsu
mer
m
anu
fact
ure
Pro
du
cer
man
ufa
ctu
re
0.23
3 -
0.07
5 0.
117
2.38
6 -0
.621
-0
.075
3.
359
0.04
2 -0
.143
-0
.067
0.
004
-0.1
21
-0.6
94
0.03
5 0.
061
- 0.
982
-0.0
03
0.12
3 -
0.02
6 0.
489
0.19
9 -0
.274
4.
028
0.01
0 -0
.389
-0
.263
0.
012
- I .
758
0.50
5 0.
194
0.41
7 -0
.44
- 0.
024
0.41
0 -
2.69
7 -0
.242
0.27
7 0.
010
0.21
2 0.
014
0.27
6 0.
003
0.50
7 0.
021
- 0.
035
0.00
9
0. I
05
- 2.
841
0.08
9 -0
.060
0.
053
- 2.
179
0.09
5 -
0.01
0 0.
055
2.84
0 -
0.02
2 -0
.006
0.
13i
5.21
4 -0
.175
-0
.006
-0.0
54
-0.3
68
0.06
9 0.
050
4.00
2 0.
023
3.07
2 -
0.03
3
4.00
4 -
0.03
4
7,35
2 0.
018
-0.5
19
0.00
5
-0.1
I3
2.
100
-0.0
18
1.60
6 -0
.013
-2
.096
-0
.015
-
3.84
8
0.09
3 0.
272
0.06
8 -
0.36
8 0.
045
-0.1
07
0.03
0 -0
.099
0.
120
- 0.
203
-0.0
42
0.25
9
-0.0
85
0.00
4 0.
048
0.00
2 .
-0.2
01
0.03
1
0.03
8 -
0.87
0 0.
030
- 0.
042
0.01
2 0.
496
0.01
3 -
0.00
9 0.
158
-2.0
65
0.25
2 -0
.133
- I .
227
0.69
9 -2
.913
-0.0
04
- 0.
078
0.64
2 -0
.021
-0
.209
0.
004
-0.0
16
-0.3
66
-0.0
06
- 0.
048
- 0.
010
- 0.
250
1.52
5 -0
.166
-0
.716
0.17
2 -0
.013
-0
.046
-0
.On2
-0
.106
0.
006
-0.0
72
1.77
2 -0
.108
0.
069
-0.0
32
-0.4
76
-0.0
13
0.02
2 0.
074
- 1.
090
0.04
7 -0
.084
2.49
7 -
0.67
0 -
I .53
6
0.00
6 0.
30
- 0.
002
0.04
1 -0
.001
-0
. I5
8
- I .
308
0.07
2 0.
359
0.35
1 0.
007
0.12
6 0.
804
- 0.
030
-0.4
16

Shoc
ks’
Cha
nges
in:
To
impo
rt p
rice
,f
To
expo
rt d
eman
d of
prod
ucer
goo
d?
A~I
~cu
~N~
Con
sum
er
good
s Pr
oduc
er
good
s
AD
LI
XL
1 IS
1 A
DL
I X
L1
ISI
AD
LI
XL
1 IS
1 A
DL
I X
L1
ISI
Gov
ernm
ent
inve
stm
ent
Agr
icul
ture
0.
047
-0.0
06
- 0.
036
0.48
6 -
0.04
3 -0
.032
0.
685
o.O
ct7
0.06
0 -0
.358
0.
023
0.16
9
Con
sum
er
man
ufac
ture
0.
005
-0.0
02
-0.0
10
0.05
4 0.
015
-0.0
09
0.07
6 +
0.0
01
0.01
8 -0
.040
0.
009
0.05
0 Pr
oduc
er
man
ufac
ture
0.
000
0.00
4 -0
.006
0.
001
- 0.
030
- 0.
007
o.O
ft2
O.O
Ol
0.01
2 -0
.001
0.
019
0.03
3 Se
rvic
es
0.00
6 -c
.o07
-
0.02
8 0.
062
0.05
7 -
0.02
6 0.
088
0.00
2 0.
049
-0.0
46
0.03
5 0.
136
‘Ent
ries
are
in
billi
ons
of T
urki
sh
lira
per
billi
on o
f T
urki
sh
lira
of s
hock
. ‘T
he s
hock
s to
exp
ort
dem
and
are
calib
rate
d to
gen
erat
e de
crea
ses
in e
xpor
ts
of
I bi
llion
Tur
kish
lir
a. F
or e
ase
of i
nter
pret
atio
n,
the
sign
s of
the
rat
ios
are
chan
ged
so t
hat
a po
sitiv
e si
gn m
eans
an
incr
ease
in
the
rele
vant
st
ate
vari
able
in
resp
onse
to
the
decr
ease
in
exp
orts
. -‘
The
sho
cks
to i
mpo
rt p
rice
s of
pro
duce
r go
ods
are
calib
rate
d to
gen
erat
e a
I bi
llion
Tur
kish
lir
a in
crea
se i
n th
e im
port
bill
of
prod
ucer
go
ods.

4:
(r)
Ela
stic
ity
Mat
rice
s of
Opt
imal
Sta
te V
aria
ble
Adj
ustm
ents
Und
er O
ptim
al I
nstr
umen
t Adj
ustm
ent;
, G
row
th O
bjec
tive
’
Shoc
ks
To
impo
rr p
rice
of
To
expo
rt d
eman
d of
prod
ucer
go
ods
Agr
icul
ture
C
onsu
mer
go
ods
Prod
ucer
go
ods
1iD
Ll
XL
1 IS
I A
DL
I X
L1
IG
AD
Ll
XL
1 IS
1 A
DL
I X
L1
IS1
1986
R
ean
outp
ut
Agr
icul
ture
0.
003
0.07
5 0.
855
0.00
4 0.
037
-0.1
06
0.01
5 0.
042
-0.4
78
0.00
7 -0
.019
-
1.36
3 C
onsu
mer
m
anuf
actu
re
0.42
1 -0
.182
-
0.29
5 0.
059
- 0.
023
0.23
2 0.
050
0.43
9 0.
747
0.11
6 0.
272
2.00
8 Fr
oduc
er
man
ufac
ture
0.
255
-0.0
16
-0.0
40
0.04
2 0.
018
0.11
2 0.
052
0.20
5 0.
342
0.08
4 0.
096
0.90
3 Se
rvic
es
-0.0
36
- 0.
026
0.03
9 -0
.002
-0
.015
(I
!5i
0.
005
- 0.
027
0.51
2 -0
.003
0.
003
1.26
8
Rea
l ca
pita
l st
ock
Agr
icul
ture
C
onsu
mer
m
anuf
actu
re
Prod
ucer
m
anuf
actu
re
Serv
kes
0.00
0 -0
.101
0.
195
- 0.
002
-0.0
56
0.61
0 0.
004
-0.1
10
- 1.
913
-0.0
03
-0.0
13
Ir .7
53
0.37
7 0.
615
0.31
9 0.
059
- 0.
252
0.24
4 -0
.066
-
0.09
2 0.
825
0.11
5 0.
399
1.98
1 0.
123
0.13
5 0.
154
0.03
0 -
0.05
4 0.
iGO
-
li.os
2 0.
025
0.42
8 6.
060
0.08
6 1.
037
-0.0
18
-0.0
44
0.00
3 -0
.002
-
0.02
0 0.
018
-0.0
00
-0.0
13
-0.0
57
-0.0
04
-0.0
19
-0.1
40
1990
R
eal
outp
ut
Agr
icul
ture
C
onsu
mer
m
anuf
actu
re
Prod
ucer
m
anuf
actu
re
Serv
ices
o.O
OO
0.
000
o.oQ
O
0.00
0 0.
000
0.00
0 0.
000
0.00
0 o.
OfK
l o.
flO
O
0.00
0 0.
000
0.00
0 0.
000
0.06
0 0.
000
0.00
0 -0
.001
0.
000
0.00
0 -0
.002
o.
ooo
0.60
0 -0
.&6
0.00
0 0.
000
0.00
0 0.
000
0.00
0 0.
000
0.00
0 0.
000
0.00
0 o.
Qoo
0.
000
0.00
1 z.
xk?
0.00
6 0.
000
0.00
0 0.
000
0.00
0 0.
000
0.00
0 0.
000
0.00
0 0.
000
-0.a
Ql

T&k
Ad:
(c
onti
nued
)
Shoc
ks
To
impo
rt p
rice
of
To
expo
rt d
eman
d of
prod
ucer
go
ods
Agr
icul
ture
C
onsu
mer
go
ods
Prod
ucer
go
ods
AD
LI
XL
1 IS
I A
DL
I X
L1
IS1
AD
LI
X&
I IS
1 A
DL
I X
L1
IS1
Rea
l ca
pita
l st
ock
Agr
icul
ture
C
onsu
mer
m
anuf
actu
re
Prod
ucer
m
anuf
actu
rer
Serv
ices
O.O
OQ
O
.OQ
Q
0.00
0 O
.OQ
O
o.oo
o o.
ooo
O.O
QO
o.
m
o.oo
o o.
ooo
o.Q
oo
o.oQ
o
0.00
0 O
O
0.00
0 0.
000
o.Q
oQ
o.Q
oo
O.Q
QO
0.
003
0.00
0 0.
000
o.O
tM
0.00
0
Rea
l ou
tput
A
gric
ultu
re
Con
sum
er
man
ufac
ture
Pr
oduc
er
man
ufac
ture
Se
rvic
es
Rea
l ca
pita
l st
ock
Agr
icul
ture
C
onsu
mer
m
anuf
actu
re
Prod
ucer
m
anuf
actu
re
Serv
ices
O.Q
QO
0.
000
O.O
OQ
O
.OQ
O
O.Q
O
.QO
O
O.Q
OQ
O
.QO
O
omo
o.Q
oQ
Q.Q
o.
Q
O.t?
QO
0.
002
0.00
0 0.
002
0.00
0 -0
.002
0.
000
-0.6
02
0.00
0 -0
.001
0.
000
0.00
0
O.Q
OO
O.O
QO
O.Q
QO
O
.OQ
Q
O.Q
QO
0.
000
-0.0
06
O.O
QO
0.
000
-0.0
05
O.O
QO
0.
000
-0.0
02
O.O
OQ
0.
000
-0.0
01
O.Q
QO
0.
001
o.Q
-0
.001
O
.OQ
Q
0.00
5 O
Q
0.00
5
O.O
OQ
O
.OQ
O
0.00
0 O
Q
0.00
0
O.Q
OO
O
.QO
Q
O.Q
O.Q
OO
O
.OO
Q
O.Q
OQ
O
.QO
Q
O.O
OQ
0.
001
0.00
0 0.
001
o.oi
lO
0.00
0 O
.tXK
l 0.
001
O.O
OQ
0.
002
O.O
O
O
0.00
5 O
.ooO
-0
.002
0.
00
O.O
QO
-o
.cm
0.
000
0.01
5 O
.QtJ
O
O.Q
0.
038
0.00
0 0.
018
O.Q
0.
000
0.04
4
O.Q
QO
-0
.018
O
.QO
Q
0.00
0 -0
.016
O
.OQ
Q
0.00
0 --
0.0
08
0.00
0 0.
000
-0.0
02
O.O
OQ
O.Q
QO
O
.OO
Q
0.00
2 O
.QO
Q
0.00
0 0.
027
O.O
0.
000
0.00
1 O
.OQ
Q
0.00
0 0.
002
0.00
0 -0
.043
0.
000
- 0.
039
O.o
oO
- 0.
019
0.00
0 -0
.006
‘Ent
ries
hav
e be
en m
ultip
lied
by 1
00.
For
ease
or
inte
rpre
tatio
n,
sign
s ar
e ch
ange
d so
tha
t a
posi
tive
sign
mea
ns a
n in
crea
se i
n th
e re
leva
nt v
aria
ble
in r
espo
nse
to a
dec
reas
e in
exp
orts
.

Tab
le
A5:
(1
‘) E
last
icity
M
atri
ces
of O
ptim
al
Stat
e V
aria
ble
Adj
ustm
ents
U
rnde
r Opt
imal
In
stru
men
t A
djus
tmen
ts,
Stab
iliza
tion
Obj
ectiv
e’
Shoc
ks
To
impo
rt p
rice
of
prod
ucer
go
ods
AD
LI
XL
1 IS
1
Agr
icul
ture
AD
LI
XL
1 IS
1
To
expo
rt
dem
and
of
Con
sum
er
good
s
AD
LI
XL
1 IS
1
Prod
ucer
go
ods
AD
LI
XL
1 IS
1
1986
O
rgan
ized
la
bor
empl
oym
ent
Mer
chan
dise
tr
ade
defi
cit
Mig
ratio
n Pe
r ca
pita
rea
l pr
ivat
e co
nsum
ptio
n Pe
r ca
pita
rea
l fo
od c
onsu
mpt
ion
1990
O
rgan
ized
la
bor
empl
oym
enr
Mer
chan
dise
tr
ade
defi
cit
Mig
ratio
n Pe
r ca
pita
rea
l pr
ivat
e co
nsum
ptio
n Pe
r ca
pita
rea
l fo
od c
onsu
mpt
ion
1994
O
rgan
ized
la
bor
empl
oym
ent
Mer
chan
dise
tr
ade
defi
cit
Mig
ratio
n Pe
r ca
pita
rea
l pr
ivat
e co
nsum
ptio
n Pe
r ca
pita
rea
l fo
od c
onsu
mpt
ion
0.00
4 -0
.008
0.
001
0.00
7 0.
806
0.00
0 0.
015
0.74
7 -
0.05
8 0.
001
0.13
0 0.
000
0.00
0 -0
.004
-0
.002
0.00
0 0.
018
-0.0
01
0.00
0 0.
01 I
0.
000
0.00
0 0.
045
-0.0
01
0.00
0 -0
.024
0.
000
0.00
0 -0
.012
O
.oG
O
0.00
0 -0
.007
0.
000
0.00
0 -0
.029
0.
000
0.00
0 0.
015
0.00
0 0.
022
-0.0
89
-0.2
69
0.00
3 0.
003
-0.0
07
0.00
7 0.
014
-0.0
44
-0.0
06
-0.1
81
0.01
7 0.
000
0.00
0 0.
000
0.00
0 0.
000
0.00
0 0.
000
0.00
1 0.
000
0.00
0 -0
.001
0.
000
0.00
0 0.
001
0.00
2 0.
000
0.00
0 0.
000
0.00
0 0.
001
0.00
0 0.
000
0.00
0 0.
000
o.oo
o o.
ooo
o.oo
o o.
ooo
o.oo
o o.
ooo
0.01
7 0.
068
0.03
0 o.
wU
0.
000
0.00
0 0.
000
0.00
0 0.
000
0.00
3 -0
.005
0.
000
0.00
6 0.
486
0.00
0 0.
028
0.25
4 -0
.001
0.
000
0.07
8 0.
000
0.00
1 -
0.00
3 o.
KH
l
0.00
0 0.
000
0.00
0 0.
000
0.00
0
0.00
0 0.
000
0.02
2 0.
000
0.00
0
0.00
0 0.
000
0.00
1 0.
000
0.00
0
0.01
9 -0
.004
0.
001
-0.0
09
0.01
0 0.
000
0.03
7 -0
.215
-0
.001
-0
.017
-1
.060
-0
.001
0.
162
- 0.
469
-0.0
19
0.01
1 -
0.03
4 -
0.02
1
0.00
3 0.
035
0.00
1 -0
.001
-0
.171
0.
000
-0.0
05
0.00
0 -0
.001
0.
000
0.00
3 0.
000
o.oo
o o.
ooo
o.oo
o o.
ooo
o.oo
o o.
ooo
0.00
9 0.
095
0.01
4 0.
000
0.00
0 0.
000
0.00
0 0.
000
0.00
0
o.oo
o o.
ooo
0.00
0 o.
ooo
o.oo
o o.
ooo
-0.0
06
-0.0
05
0.09
0.
000
0.00
0 0.
000
0.00
0 0.
000
0.00
0
‘Ent
ries
hav
e be
en m
ultip
lied
by
100.
For
eas
e of
int
erpr
etat
ion,
si
gns
are
chan
ged
so t
hat
a po
sitiv
e si
gn m
eans
an
incr
ease
in
the
rel
evan
t st
ate
vari
able
in
resp
onse
to
a d
ecre
ase
in e
xpor
ts.

Tab
le
86:
(r)
Ela
stic
ity
Mat
rice
s of
Opt
imal
St
ate
Var
iabi
e A
djus
tmen
ts
Und
er
Opt
imal
In
stru
men
t A
djus
tmen
ts,
istr
ibut
ion
Obj
ectiv
e’
Shoc
ks
Per
capi
ta
hous
ehol
d hc
ome
To
impo
rt p
rice
of
To
expo
rt d
eman
d of
prod
ucer
go
ods
Agr
icul
ture
C
onsu
mer
go
ods
Prod
ucer
go
ods
AD
LI
XL
1 IS
I A
DL
I X
L1
IS1
AD
LI
XL
1 IS
1 A
DL
I X
L1
IS1
1986
A
gric
ultu
ral
labo
r -
8.09
3 M
argi
nal
labo
r -
9.48
8 O
rgan
ized
la
bor
-0.0
91
Serv
ice
labo
r 70
.450
A
gric
ultu
ral
capi
talis
t -
10.6
54
Indu
stri
al c
apita
list
-9.8
15
Com
mer
cial
ca
pita
list
1.60
5
1990
A
gric
ultu
ral
labo
r M
argi
nal
labo
r O
rgan
ized
la
bor
Serv
ice
labo
r A
gric
ultu
ral
capi
talis
t In
dust
rial
cap
italis
t C
omm
erci
al
capi
talis
t
- 0.
724
0.40
7 0.
000
-0.0
71
0.18
2 0.
000
0.52
2 -0
.716
-0
.001
0.
472
- 4.
240
-0.0
01
-0.0
21
1.35
0 0.
000
-0.0
19
0.79
9 0.
000
- 0.
410
- 1.
031
0.00
2 -0
.370
-0
.610
0.
002
- 0.
505
-4.2
23
0.04
9 -
0.45
8 -2
.671
-
0.00
5 -
1.97
6 -
5.73
8 0.
152
- 1.
811
- 3.
670
0.01
7 2.
041
0.54
1 -
0.59
9 1.
860
0.20
8 0.
057
-8.1
98
- 1.
502
78.8
85
- 2.
243
- 1.
511
0.07
0 51
.578
14
.500
-2
1.14
0 -3
.712
-4
1.26
8 -8
.101
3.
205
- 29
.286
- 7.
301
- 8.
559
- 0.
083
63.5
58
- 9.
677
- 11
.544
1.
077
- 10
.301
46
.680
-
0.89
4 30
.520
-
12.5
20
-23.
173
0.17
1
- 0.
694
- 1.
035
0.03
3 6.
698
- 1.
749
- 1.
928
0.23
I
-37.
811
- 44
.333
-
0.42
7 32
9.16
7 -
50.0
70
- 60
.053
6.
189
- 0.
370
0.12
5 0.
000
- 2.
443
-0.2
93
-0.0
02
- 0.
096
0.55
1 0.
000
- 1.
917
-0.4
21
0.00
6 -
2.38
4 -
0.54
5 -
0.03
2 -
9.41
9 -0
.383
0.
120
9.65
9 1.
019
0.40
2
- 8.
960
- 4.
830
8.31
6 9.
770
-9.3
85
32.2
07
-7.2
13
21.5
31
- 99
.385
-
14.0
19
- 0.
616
0.22
8 0.
207
3.91
8 0.
435
21.0
53
46.6
83
- 15
9.96
6 -6
4.98
1 53
.906
-
8.39
8 -
12.2
09
24.8
24
26.3
74
- 23
.604
-
6.93
3 -6
.647
25
.453
52
.260
-6
.043
-
2.45
4 0.
582
-0.0
40
7.39
3 -
1.99
6
0.18
0 -0
.387
0.
000
-0.1
17
0.90
2 -0
.004
0.
416
- 1.
701
0.00
0 0.
932
1.29
8 0.
01 I
1.16
6 6.
276
- 0.
088
4.68
0 8.
761
0.18
1 -4
.771
-
0.02
9 1.
085

w
Agr
icul
tura
l la
bor
0.00
0 0.
002
0.00
0 0.
000
0.00
1 0.
000
0.00
1 0.
001
0.00
0 0.
000
-0.0
02
0.00
0 kh
trgi
nal
labo
r -0
.001
-o
.wo
0.00
0 -0
.001
-0
.023
0.
000
-0.6
03
-0.0
16
0.00
0 0.
002
0.05
0 0.
000
Org
aniz
ed
labo
k 0.
000
0.00
0 0.
000
0.00
0 0.
000
o.uO
O
0.00
1 0.
000
0.00
0 0.
000
0.00
0 0.
000
Serv
ice
labo
r -0
.001
0.
003
0.00
0 -0
.001
0.
002
0.00
0 -0
.005
0.
001
0.00
0 0.
002
-0.0
04
0.00
0 A
gric
ultu
ral
capi
talis
t 0.
000
-0.0
01
-0.0
03
0.00
0 -0
.001
0.
000
-0.0
01
0.00
2 0.
002
0.00
1 0.
003
0.00
5 In
dust
rial
cap
italis
t 0.
089
0.02
7 -0
.124
0.
081
0.01
7 0.
016
0.41
9 0.
005
0.11
4 -
0.20
8 -
0.03
8 0.
331
Com
mer
cial
ca
pita
list
0.02
4 0.
005
-0.0
15
0.02
2 0.
004
0.00
1 0.
114
-0.0
02
0.00
8 -
0.05
7 -
0.01
0 0.
022
‘Ent
ries
hav
e be
en m
ultip
lied
by
100.
For
eas
e of
int
erpr
etat
ion,
si
gns
are
chan
ged
so t
hat
a po
sitiv
e si
gn m
eans
an
incr
ease
in
the
rele
vant
st
ate
vari
able
in
resp
onse
to
a d
ecre
ase
in e
xpor
ts.

504 1. Adelman et al.
REFERENCES Adeb, I. (1984) Beyond Export-Led Growth World Development 12, No. 9: 937-949. AQlman, I., Bournieux, J. M. and Waelbmeck, J. (1986) Agricultural Development Led In-
dustriabsation in a Global Perspective. Working Paper No. 435, Depertment of Api- cultural and Resource Economics, University of California, Berkeley.
Adelman, 1. Sank, A.H. and Roland-Hoist, D.W. (1987) Adjustment Under Uncertainty with Computable General Equilibrium Models. Working Paper No. 426, Department of Ag- ricultup! and Resource Economics, University of California, Berkeley.
Adelman, 1. and Robinson, S. (1978) Income Distribution Policy in Developing Countries: A
Case Srudy of Korea Stanford: Stantord University Press. Adelman, I. and Sarris, A. ( 1982) Incorporating Uncertainty into Planning of Industrialization
Strategies for Developing Countries. World Bank Staff Working Paper 503, Washington, D.C.: The World Bank.
Armington. P. (1969) A Theory of Demand for Products Distinguished by Place of Production, IMF StafPapers 16: 159-178.
Balassa. B. (198 I) Adjustment io External Shocks in Developing Bconomies. World Bank Staff Working Paper No. 427, Washington, D. C.: The World Bank.
Bellman, R. (1957) Dynamic Programming. Princeton, New Jersey: Princeton University Press. Berksoy, T. (1985) ” 198o’Ierde Dis Economik iliskiler” in Kumc (ed) Turkiye Ekonomisi MO-
lp85, Istanbul: Bilgi Yay. Blitzer, C.R., Clark, P.B. and Taylor, L. (1975) Economy-Wide Mod& and Development
Planning. Oxford University Press for the World Bank. Boratav, K. and Tuml, 0. (1988) Notes on the Current Development Problems and Growth
Prospects of the Turkish Economy, New Perspectives on Turkey 2, No. I (Spring); 37-50.
Cheng, L. (1987) Uncertainty and Economic Self-Sufficiency, Journul of International Eco-
rwmics 23: I&7- I 78. Chow, G.C. (1975) Analysis and Control of Dynamic Economic Systems. New York: Wiley
and Sons. Corbo, V. and de Melo, 1. (1986) External Shocks and Policy Reforms in Southern Cone
Countries: A Reassessment. World Bank, Development Research Division Discussion Paper 241.
Dermis, K., deMelo, S. and Robinson, S. (1982) General Equilibrium Models for Development
Policy. Cambridge: Cambridge University Press. de Janvry, A. (1984) The Search for Styles of Development: Lessons from Latin America and
Implications for India. Working Paper No. 357, Department of Agricultural and Resource Economics, University of California, Berkeley.
Harris, J. and Todaro. M. (1970) Migration, Unemployment and Deve!opment: A Two-Sector Analysis, American Economic Review 60: 126-142.
Lin, C.Y. (1986) East Asia and Latin America as Contrasting Models. Paper presented at a conference at Vanderbilt University on Why Does Overcrowded Resource Poor East Asia Succeed-Lessons for the LDCs? mimeo.
Kepenek, Y. (1984). Gelisimi, Uretim Yapisi ve Sorunlariyla Turkiye Ekonomisi, Ankara: Savas. Mellor, J (1976) The New Economics of Growth: A Strategy for India and the Deveioping
World. Ithaca: Cornell University Press.
kilanovic, B. (1986) Export Incentives and Turkish Manufactured Exports, 1980-1984. World Bank Staff Working Paper, No. 708, Washington, D. C.: The World Bank.
Organization of Economic Cooperation and Development (1988) OECD Economic Surwy~. Turkey, Paris.
OF rIMAL ADJUSTMENT TO TRADE SHOCKS 505
Powell, A.A. and Gruen, F-H. (1%8) Ihe Constant Elasticity of Transformation Production Frontier and Linear Supply System, Interruztional Economic Review. 9. No. 3: 315-328.
Ruffin, R.J. ( f 974) International Trade Under Uncertainty. foumul of /nremariond Economirs
4: 243-259. Sargent, T. (1987) Dynumic Muc~~cotwtnic Theory. Massachusetts: Harvard University Press. Sarrjs, A. (1985) Food Security and Agricultural Production Strategies Under Risk in Egypt.
lorunal of Development Economics, 19: 8% 112. Senses, F. (1988) “An Overview of Resent Tutkish Experience with Economic Stabilization
and Liberalization,” Chapter I in T. Nas and M. Odekon (eds.). Liberalizution und the
Turkish Econamy. New York: Greenwood Press. Singer, H. and Alizadeh, P. (1986) Import Substitution Revisited in a Darkening External
Environment, RazvojlDevelopment International, U2: 295-321.
Turban, A. (1986) Turk Ekonomisinde Sektorlere Gore KONIM Oranlari ve Mal Bazinda Koruma Fonksiyonu. State Planning Organization Staff Paper, October.
TUSIAD (Turkish Industrialists and Businessmen’s Association) (1989) 1989 YiIina Girerken
Turk Economisi (Istanbul). World Bank (1982) Turkey: Industrialization and Trade Strategy. Washington, D. C.: The World
Bank. Yagci, F. (1984) Protection and Incentives in Turkish Manufacturing. World Bank Staff Working
Paper No. 660, Washington, D. C.: The World Bank. Yeldan, E. (1988) Turkish Economy in Transition: A General Equilibrium Analysis of the Export-
Led versus Domestic DemandLed Strategies of Development. Unpublished Doctoral Dissertation, University of Minnesota.
Ye&n, E. (1989) Structural Adjustment and Trade in Turkey: Investigating the Alternatives that are “Beyond Export-Led Growth,” Journal of Policy Modeling. I I: 273-296.