on stage single cell identification of rat spermatogenic cells
TRANSCRIPT
Biology of the Cell (1997) 89, 53-66 o Elsevier, Paris
53
Original article
On stage single cell identification of rat spermatogenic cells
Juan G Reyes, Alvaro Diaz, Nelson Osses, Carlos Opazo and Dale J Benos * hstituto de Quimica, Universidad Catolica de Valparaiso, Valparaiso; Depto Fisiologia y Biofisica, facultad de Medicina, U de Chile, Santiago, Chile; Department of Physiology and Biophysics, H-IS6 704, the University of Alabama at Birmingham, 1918 University Boulevard, Birmingham, Al 35294-0005, USA
The study of spermatogenic cell physiology has been hindered by the absence of unbiased methods of identification of cells upon which single cell techniques are being applied. In this work, we have used histochemical techniques, digital videoimaging, quantification of chromatin-bound DNA probes, and measurements of cell diameter to identify single spermatogenic cells at different periods of development. Our criteria of identification permit the definition of four developmental stages of spermatogenesis on which to perform single cell analyses: spermatogonia B/preleptotene spermatocytes, lfptqtene/zygotene spermatocytes, pachytene spermatocytes, and round spermat- ids, The use of voltage-sensitive dyes and Caz+-sensitive dyes does not interfere with the estimations of DNA content. The estimations of DNA content of spermatogenic cells can be performed both with near-UV excited dyes (H= ) and long wavelength-excited dyes (ethidium bromide), allow- ing the use of a wide range of physiological and immunocytochemical fluorescent probes to study the sperrnatogenic process.
testicle / seminiferous tubule / cell cycle / cell differentiation / male
INTRODUCTION
Mammalian spermatogenesis takes place in the seminiferous tubule in the testis. This process begins on the serosal side of the seminiferous tubule with mitotic events of primordial cells and spermatogonia (A and B), followed by differentia- tion of spermatogonia B into preleptotene sperma- tocytes. These cells are characterized by a ploidy of 2 N and approximately 5 pm difference in cell diameter (Romrell et al, 1976; Bell&, 1977). Figure 1 shows the .schematiL; representation of the spermato- genie process in a plot of ploidy zwsus cell diame- ter. The progression of preleptotene spermatocytes into meiosis implies an S phase to reach a ploidy of 4 N, migration through the Sertoli cell tight junc- tions, and the entrapce into the prolonged meiotic prophase (leptoten&zygotene-pachytene sperma-
* Correspondence and reprints
In spite of the importance of the spermatogenic process, the study of the physiology of the sper- matogenic cells and its regulatory aspects have only lately been approached more systematically (Hagiwara and Kawa, 1984; Reyes et al, 1990; Reyes et al, 1994; Lievano et al, 1996). Part of this delay can be understood because there are mainly two populations of spermatogenic cells that can be obtained in sufficient quantity and purity to be studied with averaging methods of cell physiology research: pachytene spermatocytes and round spermatids. Besides the fact that mainly the late meiotic stages can be studied in purified cell prep-
On stage single cell identification of rat spermatogenic cells Reyes et al
tocytes) with dramatic changes in cell size. Two successive meiotic divisions, generating secondary spermatocytes and round spermatids, are charac- terized by reductions of size and ploidies of 2 N and 1 N, respectively (Bellv4, 1979; deKretser and Kerr, 1988; Braun et al, 1995). Spermatogenesis is completed with remarkable changes in cell shape, organelle rearrangement, and cytoplasmic shading that accompany the spermiogenesis.

54
4
3
ax 2 .- ,o a
1
0
Biology of the Cell (1997) 89, 53-66
leptotene-zygotene pachytene dyplotene
B spermatogonia A spermatogonia
I I /
BjGGy==J
J
I 1 1 1 1 I 1 I I 1 I 1 I I I 1
6 8 10 12 14 16 18 20 22
Cell diameter (pm)
Fig 1. Plot of ploidy versus cell diameter in the premeiotic and meiotic spermatogenic process. The values of cell diame- ters for each cell type were taken from the range of values published in the literature.
arations, the methodology to obtain pure enough populations of these and other spermatogenic cells require protease treatments (Lam et al, 1970; Grabske et al, 1975; Romrell et al, 1976) that are known to remove receptors and other proteins from cell membranes (D’Agostino et al, 1984; Reichter and Dattatreyamurty, 1989), or to mimic cell-cell interactions (Grotegoed et al, 1989; Ara- vindan ef al, 1996). In contrast to these shortcom- ings of the averaging methods to study spermato- genie cell physiology, powerful methodologies are available for single cell physiological and molecu- lar biological studies of spermatogenic cells (eg video transmission and fluorescence microscopy, patch-clamp and single cell oligonucleotide amplification techniques). Because these methods do not require pure populations, they could avoid the use of extensive protease digestion of the semi- niferous tubules. However, the use of these single cell methodologies requires, cell identification, and, even in ‘purified’ populations, ways to avoid the almost inevitable bias of choosing an inappropri- ate popuiation by their prominence or ease of manipulation.
The usefulness of identification schemes for
On stage single cell identification of rat spermatogenic cells
single cells requires them to be performed on the microscope stage simultaneously or subsequently to measurements of the physiological parameter of interest. The development of fluorescent probes to study quantitatively the cell content of macro- molecules and of inexpensive video microscopy and image analysis techniques prompted our efforts to devise a strategy to identify, on the microscope stage, spermatogenic cells at different steps of development based on the differences in cell DNA structure and content, and the changes in cell size occurring during this differentiation process (Cowell and Franks, 1980; Grogan et al, 1981; Arndt-Jovin and Jovin, 1989; Gottschalk- Sabag et al, 1995). We have also utilized cyto- chemical techniques to identify the presence of peritubular cells in the seminiferous tubule cell preparation. Vital staining with H,,,,, and a guessstimate of the respective cell type by the appearance of the chromatin, followed by a quan- titation of the relative DNA content in the same cell shows that there is a close correspondence between both criteria of cell classification for rat spermatids, but not so for spermatogonia or pri- mary spermatocytes. The use of a bivariable
Reyes et al

Biology of the Cell (1997) 89, 53-66 55
system of classification of seminiferous tubule cells allows us to define regions in a plot of rela- tive DNA content versus cell diameter where there is a high probability of correctly classifying cells as spermatogonia B/preleptotene, leptotene- zygotene primary spermatocytes, late pachytene primary spermatocytes or spermatids.
MATERIALS AND METHODS
Rat spermatogenic cell preparation
Rat seminiferous tubule cell populations were prepared from testicles of adult (60 days) or 12-14-day-old rats, as described by Romrell et al (1976) and Bellve et al (1977). The resulting cell suspension was filtered through a layer of cotton and 250 and 70 p nylon meshes and washed three times in Krebs-Henseleit 10 mM Hepes, 10 mM (K- H) lactate medium. The mixed seminiferous tubule cells were used either without purification, partially purified by passing the cells through a 2% BSA/15%/30% Per- co11 discontinuous gradient, or, the different cell popula- tions were purified using sedimentation velocity in a 260 mL 24 % BSA in K-H medium gradient at unit grav- ity and at 16 + 2°C (Bell&, 1977). The cells were allowed to settle for 3 II and then the BSA gradient was collected in 3 mL fractions at approximately 1 fraction per minute.
Measurements of cell diameter and DNA content using transmission and fluorescence digital video microscopy
The studies of video microscopy were performed in an inverted Nikon Diaphot microscope with epifluores- cence. A cooled CCD 12 bit video camera (Spectrasource, Los Angeles, CA) was attached to the videoport of the microscope. The image analyses were performed with the appropriate software using a 486 IBM compatible computer. Cell diameter measurements were made by previously calibrating the optical and digital analysis system in pixels/pm using a reticulated slide, and further calibrated using normal human red blood ceils. The within-assay variation coefficients for diameter determi- nation of pachytene spermatocytes and round spermatids were 3 and 1 %, respectively.
The non-intercalating bisbenzimide DNA probe H3= (excitation wavelengths 330-380 nm, emission wave- lengths > 420 run) or ethidium bromide (excitation wave- lengths 450490 run, emission wavelength > 520 nm), were used to estimate the DNA content of the cells. Because of the intrinsic difficulties of estimating the absolute values of cell DNA using fluorescent probes (Amdt-Jovin and Jovin, 1989), we used permeabilized rat spermatozoa as an inter- nal standard with constant ploidy (1 N) and an easily rec- ognizable shape in image analysis (fig 2A). The spermato- zoa were obtained from the cauda epididymis of rats by puncturing and gently pressing this organ. In order to remove the tails of the spermatozoa and to permeabilize them, we treated the spermatozoa cell suspension with five sequences of 10 s sonication pulses (Branson El2 80 watts, Shelton, CO). To obtain a homogeneously permeabilized
On stage single cell identification of rat spermatogenic cell S
Fig 2. A. Image of H,,,,, fluorescence in rat round sper- matids and spermatozoa. The cells were exposed to 2 PM HSSSJ2 and 15 &mL digitonin in Krebs-Henseleit buffer for 30 min and at room temperature (18 * 2°C). The image was taken with a cooled CCD video camera using a 40 x NA 0.85 objective and 0.1 s of exposure. The excita- tion and emission wavelengths were 330-380 and > 420, respectively. The bar represents 15 pm. B. Photomicro- graph of a pachytene spermatocyte, a round spermatid and a trinucleated symplast. The ceils were exposed to 2 PM H,,,, in Krebs-Henseleit buffer for 40 min at room temperature. The bar represents 25 pm.
spermatozoa population, treatment with 0.1% Triton X-100 saline, three washes and a further cycle of freezing and thawing was necessary. Those cells with two or more vis- ible nuclei generated during the cell preparation were iden- tified visually and either discarded from our analysis or utilized as internal standards for quantitative DNA deter- minations (fig 2B). The within assay variation coefficient of H,, fluorescence of spermatozoa, spermatids and pachy- tene spermatocyte determinations using a 0.85 NA 40 x objective, were 9,12, and 8%, respectively. The use of a 1.35 NA 100 x oil immersion objective gave for the same cell types variation coefficients of 8, 7, and lo%, respectively. Because either objective gave comparable variation coeffi- cients in the HWZ fluorescence determination, but the 100 x objective gave a limited number of cells in the field, we chose to use the 0.85 NA 40 x objective for all the quan- titative estimations of relative total cell DNA content.
Reyes et al

56 Biology of the Cell (1997) 89, 53-66
Membrane potential and intracellular Ca*+ determinations in single rat spermatids
In order to test the feasibility of performing physiological measurements and cell identification, we have success- fully used the following protocol: 1) In dim light conditions, we let the cells (previously loaded with calcium sensitive dyes when appropriate) settle for 10 min in a microscope chamber (0.7 mL) hav- ing a coverslip as the bottom wall. Alternatively, the cells were adhered to a polylysine-covered coverslips which were attached to the bottom of the chamber with a mini- mal amount of silicone grease. Subsequently, ethidium bromide (5 PM final concentration) was added to the microscope chamber. 2) After 2-3 min of exposure to ethidium bromide, the unattached cells and the ethidium bromide solution were washed away by perfusing 10 mL (2 mL /mm) of K-H lactate buffer containing 2 @4 H33342.
3) 43342 was allowed to enter the cells for 30 min with- out perfusion. 4) The cells were selected for observation by taking a transmission image in order to estimate cell diameter, and by fluorescence observation of the chromatin stained with H33742. Those cells with a damaged membrane (stained violet by ethidium bromide and Ha& were eas- ily identified and discarded. 5) The cells were exposed for 30 min in the dark to potential sensitive probes when membrane potential was to be determined. 6) At the appropriate excitation and emission wave- lengths, a series of images were taken and stored, and calibrations of the fluorescent probes were performed. 7) The cells were perfused with 10 mL of K-H lactate buffer with 10 pgg/mL digitonin and 2 PM HsM2, and the dye was allowed to equilibrate for 30 min. Two images of H 33342 stained cells were taken at 25 and 30 min to check for the effective equilibration of the dye. Subsequently, 5-10 H,,,,, images of spermatozoa were taken and stored. 8) The relative DNA content was calculated from the ratio of the cell DNA-H,, fluorescence and the average spermatozoa DNA-H-, fluorescence (interspermatozoa variation coefficient of lo-15%).
The plasma membrane potential of rat spermatids was estimated at 18 + 3°C from the intra-extracellular distri- bution of bisoxonol determined in fluorescence video images taken with excitation wavelengths of 510-560 nm and emission wavelengths of > 590 nm (Ehrenberg et al, 1988). In order to estimate the out-of-focus extracellular fluorescence we utilized neutral tetramethylrhodamine- dextran (M, 70 000) as an impermeant fluorescent probe.
The bisoxonol fluorescence distribution was calibrated for each cell at 0 mV and -100 mV by superfusion of a solution of bisoxonol with different Na+/K+ saline con- taining 10 $4 gramicidin (Reyes et al, 1994).
Intracellular calcium was estimated after loading of the cells with Fluo-3 by incubating them for 30 mm at 33’C with 5 PM Fluo-3-AM. The cell fluorescence was determined at 18 * 3”C, from video images obtained with excitation wavelengths of 450-490 nm and emission wavelengths of > 520 run. The intracellular Ca2+ probe was calibrated with ionomycin, MnCl,, and digitonin as described by Kao et al (1989).
Thin section histological techniques
The cells were pelleted in a micro centrifuge at 2000 g and fixed with Kamovsky’s reagent containing 2 % gluta- raldehyde, 2 % formaldehyde, 5 % sucrose in 0.1 M caco- dylate buffer (pH 7.3) (Kamosvky, 1965) for 2 h at 4°C. The cell pellet was washed twice for 4 h in 7% sucrose, 0.1 M cacodylate buffer (pH 7.3). Subsequently, the pellets were postfixed in 1% reduced osmium, dehydrated, and embedded in Epon. Thin sections (2 m) were stained with toluidine blue and examined by light microscopy.
Chemicals
Hoechst 33342 (I&&, b&(1,3 dðyl) thiobarbiturate trime- thine oxonol (bisoxonol), fluo-3, ethidium bromide and the substrate for alkaline phosphatase were obtained from Molecular Probes, Inc (Eugene, OR). Collagenase, DNAse, trypsin, Percoll, BSA, digitonin and the salts and buffers used were obtained from Sigma Chemical Co (St Louis, MO).
RESULTS
Alkaline phosphatase activity in seminiferous tubule cells
As described by Palombi and DiCarlo (1988), the peritubular (myoid) cells of the seminiferous tubule have an alkaline phosphatase (AI?) activity (figs 3A, B, C). Using the Al’ substrate from Molecular Probes (Eugene, Or), the activity of the enzyme can be vitally determined and was localized only to peritubular cells and not to sub-adjacent seminifer- ous tubule cells (fig 3C) or spermatogenic cells (seen at the extruding ends of the tubule in figure 3B). In the mixed cell population obtained either by trypsin treatment or mechanical disruption of the seminiferous tubules, these alkaline phosphatase
Fig 3. A. Fluorescence of the product of alkaline phosphatase reaction (performed at room temperature) in seminiferous ) tubules isolated by collagenase treatment. The excitation and emission wavelengths were 330-380 and > 420, respectively. The bar represents 100 pm. B. Optical transmission photomicrograph of the seminiferous tubule depicted in A. Note the spermatogenic cells and spermatozoa extruding at the cut ends of the tubule. Other conditions were similar to those of A. C. Fluorescence photomicrograph of a seminiferous tubule vitally stained for alkaline phosphatase activity (yellow-green), and with H33342 to show the nuclear DNA (blue). Note that the layers of cells below the peritubular cells (in yellow green) are devoid of the alkaline phosphatase reaction product. The bar represents 25 pm. Other conditions were similar to those of A.
On stage single cell identification of rat spermatogenic cells Reyes et al

On s ;tage single cell identification of rat spermatogenic cells Reyes et a/

58 Biology of the Cell (1997) 89, 53-66
0.8 -
0.6 -
a
2.0
1.6
0.0
b
Time (min)
I
0 I I I
10 ,
20 I
30 40 ‘\
50 60
Time (min) ~
positive cells were less than 0.5% of the total cell population (not shown), and hence they are unlikeiy to represent a significant contamination when using single cell physiological techniques.
Kinetics of H33342 binding to spermatogenic cell nucleus
H 33342 bound to nuclear material in intact spermat- ids with a half time of approximately 30 min
(fig 4A). A similar time course of binding was observed with pachytene spermatocytes (not shown). The steady-state level of spermatid and pachytene H,,, fluorescence relative to permeabi- Iized spermatozoa fluorescence reached values of 0.5-0.7 and 2.3-2.8, respectively, when the cells were exposed to 2 ,uM H,,,,. In prepuberal sper- matogenic cells (sperma3togonia-preleptotene sper- matocytes and leptotene-zygotene spermatocytes), the time course of H 33342 binding to the cell nucleus
On stage single cell identification of rat spermatogenic cells Reyes et al

Biology of the Cell (1997) 89, 53-66 59
0.8 -
0.6 -
0 4 8 12 16 20
Time (min)
Fig 4. a. Fractional increase in fluorescence of H,,,,, in rat spermatids as a function of time. The fluorescence reached at 70 min was arbitrarily given a value of 1.0. H3aaa2 concentration was 2 pm. The points and error bars represent the mean and standard deviation of six cells obtained in two different cell preparations. b. Changes in fluorescence of Ha,,, in rat prepuberal spermatogenic cells. Control data were obtained in a separate experiment with the same batch of cells. The H aaN concentration was 2 PM. The different symbols represent individual cells in the same cell preparation. c. Fractional changes in H33342 fluorescence in rat spermatids treated with 10 pg/mL digitonin in Krebs-Henseleit buffer. Ha,,, concen- tration was 2 PM. The point and error bars represent the mean and standard deviation of six cells in three different cell preparations.
was characterized by a slow uptake. In these cells, the relative fluorescence (cell/spermatozoa) only reached steady values of 0.1-0.2 after 70 min of exposure to 2 w H,, (fig 4B). Treatment with digitonin (10 pg/mL) produced an increase in cell fluorescence that reached the expected values for diploid or tetraploid cells (fig 4B) in about 10 min. Exposure of rat spermatids or pachytene sperma- tocytes to digitonin, simultaneously with H,,,,, accelerated the appearance of nuclear fluorescence, reaching an equilibrium binding in about 10 min (fig 4C). In the experiments where the relative DNA content of the cells was estimated from the H,,,, fluorescence, this dye was allowed to equilibrate with the permeabilized cells for 30 min.
Relative DNA content of selected seminiferous tubule cells
In order to validate the methodology to estimate the relative DNA content of the seminiferous tubule cells, we utilized cell populations that can be highly purified (> 90 % purity) such as pachy- tene spermatocytes and round spermatids. In these cells, the relative DNA contents obtained were 3.9 f 0.5 (N = 16) and 1.2 + 0.2 (N = 19), for
On stage single cell identification of rat spermatogenic cells Reyes et al
pachytene spermatocytes and spermatids, respec- tively.
The cell population obtained from fractions 20-25 of a BSA gradient of prepuberal (lZday-old) rat seminiferous tubule cells consisted of approximately 80 % spermatogonia A, judged from their prominent nucleolus and oval nucleus (fig SA, B; see also Bellve, 1977). The cells not presenting condensed chromosomes when stained with HW, had diame- ters of 14 f 1 m (N = 21, range 13-15 p). Those cells that are at M phase, and specifically at metaphase, can be easily recognized when stained with H,,,, (fig SC). These cells at metaphase were 14 + 1 p in diameter (N = 11, range 13-15 p) and, as expected for a 4 N cell at that stage of the cell cycle, their rela- tive DNA content was 4.3 f 0.4 (N = 40).
These data show that the relative DNA content of the cells estimated from the H,,,, fluorescence agreed with the expected ploidy of the seminifer- ous tubule cell populations, validating its use for relative DNA estimations in different spermato- genie cell populations. A similarly good agreement between expected ploidy and relative DNA content was found when we used polynucleated cells (sym- plasts) formed during the cell preparation (data not shown).

On stage single cell identification of rat spermatogenic cells Reyes et al
Biology of the Cell (1997) 89, 5366 61
Relative DNA content and cell diameter in purified spermatogenic cell populations
In order to estimate the variance for the relative DNA determinations, we used purified popula- tions of early primary spermatocytes (leptotene- zygotene, 65-70 %), pachytene spermatocytes (85-90 %), and round spermatids (> 95 %) obtained by separation using velocity sedimenta- tion at unit gravity in BSA gradients of rat sper- matogenic cells obtained from prepuberal or adult rats (Romrell et al, 1976; Bellve, 1977). Besides using purified or enriched cell popula- tions, the cells on which we performed relative DNA content determinations were chosen by their diameter (8-10, 16-20 and 11-13 m for lep- totene/zigotene, pachytene and round spermat- ids, respectively), and by the appearance of the chromatin stained with H33342. After a transmitted light image was taken to measure cell diameter, and using the previously described permeabiliza- tion with digitonin and H33342 treatment, we determined the relative DNA content of single cells at different steps of the spermatogenesis. The estimated mean and standard deviations of DNA contents from at least three different cell prepara- tions were 4.4 f 0.3 (N = 18), 3.9 + 0.5 (N = 16) and 1.2 f 0.2 (N = 19) for leptotene-zygotene sper- matocytes, pachytene spermatocytes and round sperma tids, respectively.
Use of ethidium bromide, instead of H,,,, for relative DNA determinations in spermatids and pachytene spermatocytes gave relative fluorescence values of 1.2. f 0.3 (N = 6), and 4.3 it 0.6 (N = 4), respectively. Thus, either dye yields comparable values of relative fluorescence.
The spermatogonia A subpopulation
Our estimation of the relative DNA content of the spermatogonia A subpopulation not presenting condensed chromosomes (fig 5) showed that these cells had relative DNA contents from 2.5 to 4.6, suggesting that this population is composed of cells that were at different stages of the cell cycle. In fact, only lo-20 % of the cells appeared to be at G, as judged from their relative DNA content. The appearance of the cell chromatin stained with
H 33342 showed a recognizable pattern, revealing an oval nuclei and a relatively homogenous chromatin distribution. Because they present a variable DNA content, we did not device a strategy for an inde- pendent confirmation of their identity in an unpuri- fied cell population and on the microscope stage (see below).
Sertoli cell
The size of Sertoli cells increases during develop- ment in rodents (eg Bellve, 1977). In adult rats, their reported diameter is in the range of 12-15 ,um (Flo- ridi et al, 1983; Qian et al, 1985). In our experience, in adult rats, the cells that presented an irregular nucleus when stained with H,,, had diameters of 13.0 f 1.1 p (N = 13)(fig 6A, B). These cells had relative DNA contents of 2.3 + 0.3 (N = 5). In 12- day-old rats, the cells with irregular nuclei and characteristic heterochromatin, showed diameters ranging from 9-12 p in cells stained with H,,,, or thin sections stained with toluidine blue (see also Bucci et al (1986)).
A bivariable distribution of seminiferous tubule cells obtained from prepuberal and adult rats
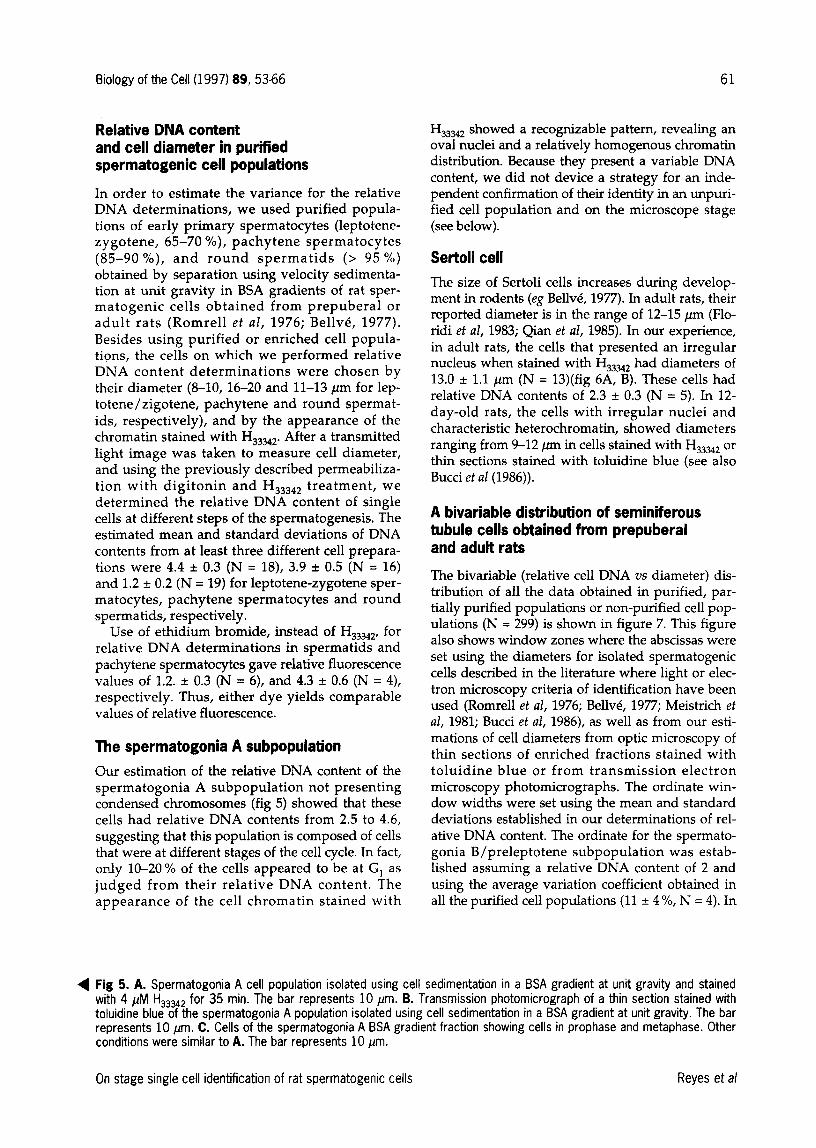
The bivariable (relative cell DNA vs diameter) dis- tribution of all the data obtained in purified, par- tially purified populations or non-purified cell pop- ulations (N = 299) is shown in figure 7. This figure also shows window zones where the abscissas were set using the diameters for isolated spermatogenic cells described in the literature where light or elec- tron microscopy criteria of identification have been used (Romrell et al, 1976; Bell&, 1977; Meistrich et al, 1981; Bucci et al, 1986), as well as from our esti- mations of cell diameters from optic microscopy of thin sections of enriched fractions stained with toluidine blue or from transmission electron microscopy photomicrographs. The ordinate win- dow widths were set using the mean and standard deviations established in our determinations of rel- ative DNA content. The ordinate for the spermato- gonia B/preleptotene subpopulation was estab- lished assuming a relative DNA content of 2 and using the average variation coefficient obtained in all the purified cell populations (11 + 4 %, N = 4). In
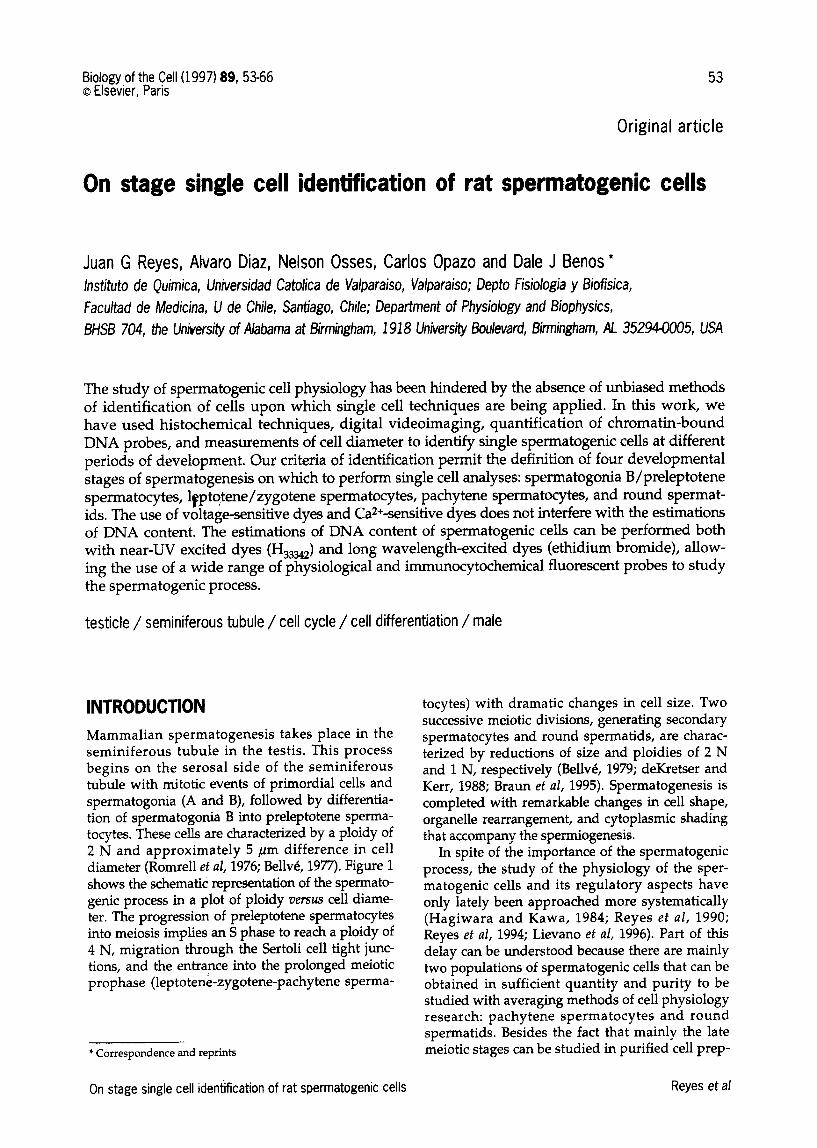
4 Fig 5. A. Spermatogonia A cell population isolated using cell sedimentation in a BSA gradient at unit gravity and stained with 4 PM Ha,,, for 35 min. The bar represents 10 pm. B. Transmission photomicrograph of a thin section stained with toluidine blue of the spermatogonia A population isolated using cell sedimentation in a BSA gradient at unit gravity. The bar represents 10 pm. C. Cells of the spermatogonia A BSA gradient fraction showing cells in prophase and metaphase. Other conditions were similar to A. The bar represents 10 pm.
On stage single cell identification of rat spermatogenic cells Reyes et al

62 Biology of the Cell (1997) 89, 53-66
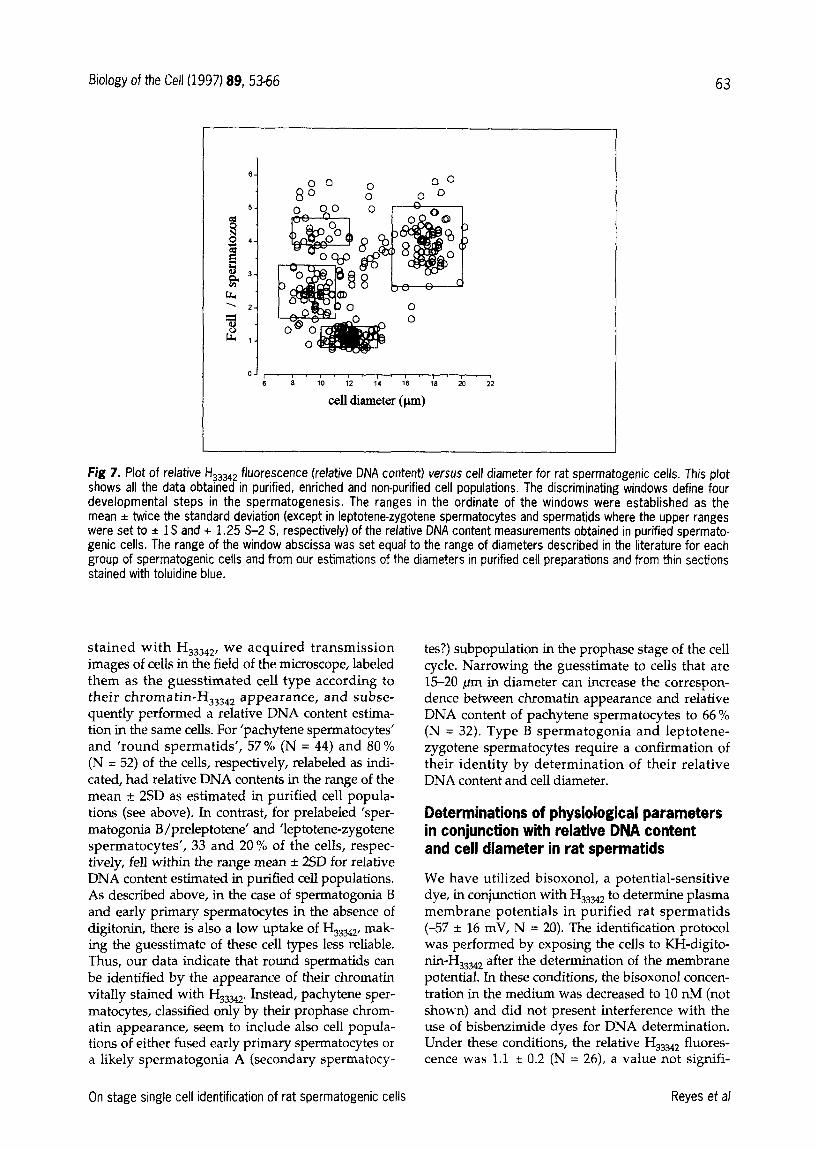
Fig 6. A. Transmission photomicrograph of a thin section of a BSA gradient cell fraction stained with toluidine blue, show- ing Sertoli cells (arrow heads) with the typical irregular nucleus. The bar represents 10 pm. B. Fluorescence photomicro- graph of non-purified seminiferous tubule cells stained with 4 PM H,,,,. Note the cell at the center and above (marked) showing a highly irregular nucleus typical of the Sertoli cell. The bar represents 10 pm.
these zones, there is a high probability of correctly classifying a cell as spermatogonia B/preleptotene, leptotene-zygotene primary spermatocytes, pachy- tene primary spermatocytes and round spermatids from their simultaneous diameter and relative DNA determination (see Discussion).
A guessing game for non-purified spermatogenic cell populations
In order to estimate the confidence with which, in non-purified cell populations, a cell can be identi- fied only by the appearance of the chromatin vitally
On stage single cell identification of rat spermatogenic cells Reyes et al
Biology of the Cell (1997) 89, 53-66 63
,
6
i 00
-00
Fig 7. Plot of relative H,,,,, fluorescence (relative DNA content) versus cell diameter for rat spermatogenic cells. This plot shows all the data obtained in purified, enriched and non-purified cell populations. The discriminating windows define four developmental steps in the spermatogenesis. The ranges in the ordinate of the windows were established as the mean f twice the standard deviation (except in leptotene-zygotene spermatocytes and spermatids where the upper ranges were set to f 1 S and + 1.25 S-2 S, respectively) of the relative DNA content measurements obtained in purified spermato- genie cells. The range of the window abscissa was set equal to the range of diameters described in the literature for each group of spermatogenic cells and from our estimations of the diameters in purified cell preparations and from thin sections stained with toluidine blue.
cell diameter (pm)
stained with Ha,,,,, we acquired transmission images of cells in the field of the microscope, labeled them as the guesstimated cell type according to their chromatin-H33342 appearance, and subse- quently performed a relative DNA content estima- tion in the same cells. For ‘pachytene spermatocytes’ and ‘round spermatids’, 57 % (N = 44) and 80 % (N = 52) of the cells, respectively, relabeled as indi- cated, had relative DNA contents in the range of the mean + 2SD as estimated in purified cell popula- tions (see above). In contrast, for preIabeled ‘sper- matogonia B/preleptotene’ and ‘leptotene-zygotene spermatocytes’, 33 and 20 % of the cells, respec- tively, fell within the range mean -+ 2SD for relative DNA content estimated in purified cell populations. As described above, in the case of spermatogonia B and early primary spermatocytes in the absence of digitonin, there is also a low uptake of Hs=, mak- ing the guesstimate of these cell types less reliable. Thus, our data indicate that round spermatids can be identified by the appearance of their chromatin vitally stained with H,,. Instead, pachytene sper- matocytes, classified only by their prophase chrom- atin appearance, seem to include also cell popula- tions of either fused early primary spermatocytes or a likely spermatogonia A (secondary spermatocy-
tes?) subpopulation in the prophase stage of the cell cycle. Narrowing the guesstimate to cells that are 15-20 pm in diameter can increase the correspon- dence between chromatin appearance and relative DNA content of pachytene spermatocytes to 66% (N = 32). Type B spermatogonia and leptotene- zygotene spermatocytes require a confirmation of their identity by determination of their relative DNA content and cell diameter.
Determinations of physiological parameters in conjunction with relative DNA content and cell diameter in rat spermatids
We have utilized bisoxonol, a potential-sensitive dye, in conjunction with H33342 to determine plasma membrane potentials in purified rat spermatids (-57 + 16 mV, N = 20). The identification protocol was performed by exposing the cells to KH-digito-
~-Hw4, after the determination of the membrane potential. In these conditions, the bisoxonol concen- tration in the medium was decreased to 10 nh4 (not shown) and did not present interference with the use of bisbenzimide dyes for DNA determination. Under these conditions, the relative H33342 fluores- cence was 1.1 ? 0.2 (N = 26), a value not signifi-
On stage single cell identification of rat spermatogenic cells Reyes et al

64 Biology of the Cell (1997) 89, 53-66
cantly different from that obtained in the absence of oxonol.
A similar protocol was utilized to estimate (Ca2+)i with the fluorescent probe Fluo-3, giving a resting intracellular Ca2+ concentration of 87 + 20 nM (N = 10) and a relative HBX2 fluorescence value of 1.1 + 0.2.
DISCUSSION
The study of the physiology and regulation of mammalian spermatogenesis, and some molecular approaches to this cell differentiation process have been hindered because of the difficulties of combin- ing, at the single cell level and in the same cell, measurements of cell function and identification at different steps of spermatogenesis. Although the classical histology techniques used to identify sper- matogenic stages are well worked out (eg deK.retser and Kerr, 1988), they are not generally applicable to studies where a single cell measurement has been made, and the same cell must be identified before removing it from the microscope field. Thus, it is difficult if not impossible to identify and function- ally study the same cell using these techniques. In this work, we show that the labeling of the cell DNA with H,,,,, and the simultaneous measure- ment of cell diameter and relative DNA content of spermatogenic cells allows for the classification of the cells and the sequential use of other fluorescent probes to estimate physiological parameters or use of single cell electrophysiological and molecular biological techniques.
In order to achieve equilibrium binding of the DNA probes and to decrease the time needed for estimation of cell relative DNA content, we found that the use of 10 pg/mL of digitonin was ade- quate. Higher than 20 pg/mL digitonin concentra- tions (not shown) gave values of relative fluores- cence that differed substantially from the expected relative DNA content of spermatogenic cells. Lower digitonin concentrations did not permeabi- lize the entire cell population. As suggested for the effect of digitonin on nuclear Hsssa2 fluores- cence, the low accessibility of Hsssd2 to premeiotic and early meiotic cell nuclei was limited at the level of the plasma membrane. Whether this restricted entry was due to a decreased membrane permeability for H,,,,,, or reflects the existence of
a H33342 active efflux system in these cells (eg Ney- fakh, 1988) can not be elucidated from our data. The existence of a multidrug transport system is also suggested from the resistance of premeiotic spermatogenic cells to the action of extracellular hydrophobic drugs (Sjoblom et al, 1996). These authors found that premeiotic spermatogenic cells have low sensitivity to vinblastine, a drug which,
like H33342, is a substrate for the P-glycoprotein multidrug transporter. Ethidium bromide, an intercalating DNA probe, gave values of relative fluorescence that did not differ significantly from the values obtamed with H,,,,,. This result allows, in principle, to extend the use of the spermato- genie cell identification method proposed here in conjunction with the use of cell physiology fluo- rescent probes with excitation wavelengths in the near W range (eg SBFI, PBFI, fura-2, DPH).
Visualization of nuclear material stained with H 33342 in single cells also permits the identifica- tion of bi- or polynucleated cells formed during cell preparation. We have found that visibly poly- nucleated cells consist mainly of spermatid nuclei.
Figure 1 shows some of the cell cycle transi- tions associated with the seminiferous tubule cells, such as preleptotene S phase (2 N -+ 4 N, 7-10 pm in diameter), type B spermatogonia mitotic S, G,, and M phases (2 N w 4 N cycling, 7-10 pm in diameter), or the mitotic S, G, and M phases of the cell cycle in spermatogonia A (2 N t) 4 N cycling, 12-15 ,um in diameter). This consideration can, in principle, limit the effective regions of interest in plot of ploidy ~1s cell diame- ter, narrowing the late primary spermatocyte zone to 16-20 pm pachytene spermatocytes. Sper- matogonia B are likely to spend around 30 % of its cell cycle in the DNA content region where it could be classified erroneously as leptotene-zygo- tene spermatocytes by cell diameter and relative DNA content (late S, G, phase and mitosis; (Bell&, 1979)). This spermatogonia B population in lo-14-day-old mice represents 30-40 % of a mixed leptotene/spermatogonia B population (Bell&, 1977). In these conditions, the probability of randomly finding a spermatogonia B in the region 4.4 + 0.3 relative DNA units and 7-12 pm area (leptotenelzygotene zone) is likely to be less than 15 % in non-purified prepuberal rat spermato- genie cells.
In spite of the fact that Sertoli cells (cell diame- ters 9-12 pm and 12-15 pm for prepuberal and adult rats, respectively) could appear as interfer- ing in the classification of spermatogenic cells in a plot of relative DNA content us cell diameter, their highly irregular nuclei allow to discard these cells (and any other irregularly nucleated cell) by simple appearance of their chromatin stained with H,,,,,.
Thus, in a plot of relative DNA content us cell diameter (fig 7), we defined four regions of inter- est, representing different steps of spermatogene- sis: 1) premeiotic diploid cells (7-11 ,um, spermato- gonia B-preleptotene spermatocytes); 2) tetraploid primary spermatocytes (7-l 1 m, leptotene-zygo- tene spermatocytes); 3) advanced tetraploid pri-
On stage single cell identification of rat spermatogenic cells Reyes et al

Biology of the Cell (1997) 89, 53-66
mary spermatocytes (16-20 pm, pachytene sper- matocytes); and 4) haploid round spermatids (lo-14 pm). The range of the ordinate in each group was set to * 2 SD, except leptotene-zygo- tene spermatocytes where a f 1 SD window was chosen, and in spermatids, where an asymmetric range of -2 SD and +1.25 SD was utilized. These ranges allow > 95% confidence (except in the lep- totene-zygotene spermatocyte region) to state that a random determination falling in those regions belongs to that cell subgroup and not to the other classes of spermatogenic cells. Acceptance of the cell classification presented here also establishes criteria to discard or accept data that, in part, could originate from being biased by the investi- gator in choosing a cell type by simple micro- scopic appearance or by easiness of manipulation in a certain single cell technique.
The visualization of the cell nucleus stained
with %,X2 reveals characteristic patterns of het- ero- and euchromatin in spermatogenic cells that can orient the investigator to the cell type on which to perform the cell physiological measure- ment. However, these patterns of the chromatin stained with H33342 are relatively reliable only in the case of round spermatids. The classification method proposed in this paper provides an unbiased confirmation of the class of spermato- genie cell chosen.
The cell classification presented here spans an important part of the spermatogenesis and thus permits a systematic approach to study the physiol- ogy and molecular biology of the differentiation process at the single cell level. This single cell clas- sification can be used in unpurified cell popula- tions, avoiding trypsinization that removes mem- brane proteins involved in spermatogenic cell physiology and cell-cell interactions (Jegou, 1993). Furthermore, this strategy for cell classification needs minute amounts of biological material allow- ing, in principle, the application of single cell physio- logical and cell molecular biological techniques to studies of the spermatogenesis in most species, using biopsy methods for tissue sampling.
ACKNOWLEDGMENTS
We thank Dr E: Couve and Mr F Vargas for performing the histological techniques and TEM analysis of our prep- arations. This work was funded by DGI-UCV and Fonde- cyt 1960398/96
REFERENCES Aravindan GR, Pineau CP, Bardin CW and Cheng CY (1996)
Ability of trypsin in mimicking germ cell factors that affect Sertoli cell secretory function. J Cell Physioll68,123-133
Arndt-Jovin DJ and Jovin TM (1989) Fluorescence labeling and
On stage single cell identification of rat spermatogenic cells
65
microscopy of DNA. In: Fluorescence Microscopy of Living Cells in Culture (Taylor DC, Wang Y, eds) Methods Cell Biol 3tJ417-448
Bell& AR, Cavicchia JC, Millette CF, O’Brien DA, Bhatnagar YM and Dym M (1977) Spermatogenic cells of the prepu- beral mouse: Isolation and morphological characterization. 1 Cell Biol74,68-85
Bellve AR (1979) The molecular biology of mammalian sper- matogenesis. In: Oxford Reuiews of Reproductive Biology (Finn CA, ed) Clarendon Press, Oxford, UK, 159-261
Braun RE, Lee K, Shumacher JM and Fajardo MA (1995) Molecular genetic analysis of mammalian spermatid diffe- rentiation. Ret Prog Horm Res 50,275286
Bucci LR, Brock WA, Johnson TS and Meistrich ML (1986) Iso- lation and biochemical studies of enriched populations of spermatogonia and early primary spermatocytes from rat testes. Biol Reprod 34,195-206
Cowell JK and Franks LM (1980) A rapid method for accurate DNA measurements in single cells in situ using a simple micro fluorimeter and Hoechst 33258 as a quantitative fluo- rochrome. J Histochem Cytochem 28,:206-210
D’Agostino A, Monaco L, Stefanini M and Geremia R (1984) Study of the interaction between germ cells and Sertoli cells in vitro. Exp Cell Res 150,430-435
de Kretser DM and Kerr JB (1988) The cytology of the testis. In: The Physiology of Reproduction (Knobil E, Neil1 J, eds) Raven Press, New York, 837-932
Ehrenberg B, Montana V, Wei MD, Wuskell JP and Loew LM (1988) Membrane potentials can be determined in individ- ual cells from the Nernstian distribution of cationic dyes. Biophys 153‘785-794
Floridi A, Mercante ML, D’Atri S, Feriozzi R, Menichini R, Citro G, Cioli V and De Martin0 C (1983) Energy metab- olism of normal and Lonidamine-treated Sertoli cells of rats. Exp Mel Path01 38,137-147
Gottschalk-Sabag SH, Weiss DB and Sherman Y (1995) Assess- ment of spermatogenic process by deoxyribonucleic acid image analysis. Fertil Steril64,403-407
Grabske RJ, Lake S, Gledhill BL and Meistrich ML (1975) Cen- trifugal elutriation: Separation of spermatogenic cells on the basis of sedimentation velocity. J Cell Physiol 86, 177-190
Grogan W MC, Farnham WF and Saban J (1981) DNA analysis and sorting of viable mouse testis cells. J Histochem Cyto- them 29,738-746
Grotegoed JA, Den Boer PJ and Mackenbach P (1989) Sertoli- germ cell communication. Ann NY Acad Sci 564,232-242
Hagiwara S and Kawa K (1984) Calcium and potassium cur- rents in spermatogenic cells dissociated from rat seminifer- ous tubules. J Physiol356,135-149
Jegou B (1993) The Sertoli-germ cell communication network in mammals. lnt Rev Cytoll47,25-96
Kao JPY, Harootunian ATH and Tsien RY (1989) Photochemi- tally generated calcium pulses and their detection by Fluo- 3.1 Biol Chem 264,8179-8184
Karnovsky M J (1965) A formaldehyde-glutaraldehyde fixative of high osmolarity for use in electron microscopy. J Cell Biol 27,137a
Lam DMK, Furrer R and Bruce WR (1970) The separation, physical characterization and differentiation kinetics of spermatogonial cells from mouse. Proc Natl Acad Sci LISA 65,192-199
Lievano A, Santi CM, Serrano CJ, Triviiio CL, Bellve AR, Her- nandez-Cruz A and Darszon A (1996) T-type Ca2+ channels and alE expression in spermatogenic cells and their pos- sible relevance to the sperm acrosome reaction. FEBS Lett 388,150-l.%
Meistrich ML, Longtin J, Brock WA, Grmes SR and Mace ML (1981) Purification of rat spermatogenic cells and prelimi- nary biochemical analysis of these cells. Biol Reprod 25, 1065-1077
Neyfakh AA (1988) Use of fluorescent dyes as molecular probes for the study of multidrug resistance. Exp Cell Res 174,168-176
Reyes et al

66 Biology of the Cell (1997) 89, 53-66
Palombi F and DiCarlo C (1988) Alkaline phosphatase is a marker for myod cells in cultures of rat peritubular and tubular tissue. Biol Reprod 39,1101-1109
Qian Z, Tsai Y, Steinberger A, Lu M, Greenfield ARL and Had- dox MK (1985) Localization of omithine decarboxylase in rat testicular cells and epididymal spermatozoa. Biol Reprod 33,1189-1195
Reichter Jr LE and Dattatreyamurty B (1989) The follicle-stim- ulating hormone (FSH) receptor in testis: Interaction with FSH, mechanisms of signal transduction and properties of the purified receptor. Biol Reprod 40,13-26
Reyes JG, Velarde MV, Ugarte R and Benos DJ (1990) The gly- colytic component of rat spermatid energy and acid-base metabolism. Am J PhysioZ259, C66O-C667
On stage single cell identification of rat spermatogenic cells
Reyes JG, Bacigalupo J, Araya R and Benos DJ (1994) Ion dependence of resting membrane potential of rat spermat- ids. J Repd Ferfil 102313-319
Romrell LJ, Bellve AR and Fawcett DW (1976) Separation of mouse spermatogenic cells by sedimentation velocity. A morphological characterization. Dar BioZ49,119-131
Sjoblom T, Parvinen M and Lahdetie J (1996) Stage-specific DNA synthesis of rat spermatogenesis as an indicator of genotoxic effect of vinblastine, mitomycin C and ionizing radiation on rat spermatogonia and spermatocytes. Mutat Res 331,181-190
Received 27 January 1997; accepted 31 March 1997
Reyes et al