obstructive sleep apnea and sickle cell anemia
TRANSCRIPT

Seediscussions,stats,andauthorprofilesforthispublicationat:https://www.researchgate.net/publication/263936308
ObstructiveSleepApneaandSickleCellAnemia
ARTICLEinPEDIATRICS·JULY2014
ImpactFactor:5.47·DOI:10.1542/peds.2013-4223·Source:PubMed
CITATIONS
6
READS
49
14AUTHORS,INCLUDING:
CarolLRosen
CaseWesternReserveUniversity
100PUBLICATIONS4,206CITATIONS
SEEPROFILE
RobertCStrunk
WashingtonUniversityinSt.Louis
312PUBLICATIONS9,190CITATIONS
SEEPROFILE
BabaInusa
EvelinaLondon,Guy'sandStThomas'NH…
36PUBLICATIONS300CITATIONS
SEEPROFILE
FenellaJKirkham
UniversityCollegeLondon
311PUBLICATIONS7,990CITATIONS
SEEPROFILE
Availablefrom:MichaelRDeBaun
Retrievedon:05February2016

DOI: 10.1542/peds.2013-4223; originally published online July 14, 2014;Pediatrics
Roberts, R. Lucas Goodpaster, Beth Malow, Mark Rodeghier and Fenella J. KirkhamSeicean, Daniel I. Craven, Johanna C.D. Gavlak, Olu Wilkey, Baba Inusa, Irene Carol L. Rosen, Michael R. Debaun, Robert C. Strunk, Susan Redline, Sinziana
Obstructive Sleep Apnea and Sickle Cell Anemia
http://pediatrics.aappublications.org/content/early/2014/07/09/peds.2013-4223
located on the World Wide Web at: The online version of this article, along with updated information and services, is
of Pediatrics. All rights reserved. Print ISSN: 0031-4005. Online ISSN: 1098-4275.Boulevard, Elk Grove Village, Illinois, 60007. Copyright © 2014 by the American Academy published, and trademarked by the American Academy of Pediatrics, 141 Northwest Pointpublication, it has been published continuously since 1948. PEDIATRICS is owned, PEDIATRICS is the official journal of the American Academy of Pediatrics. A monthly
at Vanderbilt Univ on July 21, 2014pediatrics.aappublications.orgDownloaded from at Vanderbilt Univ on July 21, 2014pediatrics.aappublications.orgDownloaded from

Obstructive Sleep Apnea and Sickle Cell Anemia
WHAT’S KNOWN ON THIS SUBJECT: Obstructive sleep apneasyndrome (OSAS) prevalence in children with sickle cell anemia isnot well described. Although these children often experiencenocturnal oxygen desaturation, it is unclear whether they aremore likely to have OSAS.
WHAT THIS STUDY ADDS: Children with sickle cell anemia havea high prevalence of OSAS with typical symptoms, beyond justnocturnal oxyhemoglobin desaturation. This study supports theneed for increased efforts to screen for, diagnose, and treat OSASin this vulnerable population.
abstractOBJECTIVE: To ascertain the prevalence of and risk factors for obstruc-tive sleep apnea syndrome (OSAS) in children with sickle cell anemia(SCA).
METHODS: Cross-sectional baseline data were analyzed from the Sleepand Asthma Cohort Study, a multicenter prospective study designed toevaluate the contribution of sleep and breathing abnormalities to SCA-related morbidity in children ages 4 to 18 years, unselected for OSASsymptoms or asthma. Multivariable logistic regression assessed therelationships between OSAS status on the basis of overnight in-laboratory polysomnography and putative risk factors obtainedfrom questionnaires and direct measurements.
RESULTS: Participants included 243 children with a median age of 10years; 50% were boys, 99% were of African heritage, and 95% werehomozygous for bS hemoglobin. OSAS, defined by obstructive apneahypopnea indices, was present in 100 (41%) or 25 (10%) children atcutpoints of $1 or $5, respectively. In univariate analyses, OSAS wasassociated with higher levels of habitual snoring, lower waking pulseoxygen saturation (SpO2), reduced lung function, less caretaker edu-cation, and non–preterm birth. Lower sleep-related SpO2 metrics werealso associated with higher obstructive apnea hypopnea indices. Inmultivariable analyses, habitual snoring and lower waking SpO2remained risk factors for OSAS in children with SCA.
CONCLUSIONS: The prevalence of OSAS in children with SCA is higherthan in the general pediatric population. Habitual snoring and lowerwaking SpO2 values, data easily obtained in routine care, were thestrongest OSAS risk factors. Because OSAS is a treatable conditionwith adverse health outcomes, greater efforts are needed to screen,diagnose, and treat OSAS in this high-risk, vulnerable population.Pediatrics 2014;134:273–281
AUTHORS: Carol L. Rosen, MD,a Michael R. Debaun, MD,MPH,b Robert C. Strunk, MD,c Susan Redline, MD, MPH,d
Sinziana Seicean, MD, MPH, PhD,e Daniel I. Craven, MD,a
Johanna C.D. Gavlak, MPhil,f Olu Wilkey, FRCPCH,g BabaInusa, FRCPCH,h Irene Roberts, MD,i R. Lucas Goodpaster,BA,b Beth Malow, MD,b Mark Rodeghier, PhD,j and FenellaJ. Kirkham, MD, FRCPCHk
aDepartment of Pediatrics and Rainbow Babies and Children’sHospital, Case Western Reserve University School of Medicine,Cleveland, Ohio; bVanderbilt University School of Medicine andMonroe Carell Jr Children’s Hospital at Vanderbilt, Nashville,Tennessee; cDivision of Allergy, Immunology, and PulmonaryMedicine, Department of Pediatrics, Washington UniversitySchool of Medicine, St Louis, Missouri; dDepartment of Medicine,Brigham and Women’s Hospital and Beth Israel DeaconessMedical Center, Harvard Medical School, Boston, Massachusetts;eHeart and Vascular Institute, Cleveland Clinic Foundation,Cleveland, Ohio; fDepartment of Paediatric Respiratory Medicine,Great Ormond Street Hospital, London, United Kingdom; gNorthMiddlesex Hospital National Health Service Trust, London, UnitedKingdom; hEvelina Children’s Hospital, Guy’s and St ThomasHospital, London, United Kingdom; iDepartment of Paediatrics,Imperial College and Imperial College Healthcare NationalHealth Service Trust, London, United Kingdom; jIndependentstatistician, Chicago, Illinois; and kUniversity College LondonInstitute of Child Health, London, United Kingdom
KEY WORDSsickle cell anemia, obstructive sleep apnea, polysomnography,sleep disorders, epidemiology, cohort study, blood disorders,sleep medicine
ABBREVIATIONSAHI—apnea hypopnea indexFEV1—forced expiratory volume in 1 secondFVC—forced vital capacityHbS—sickle cell hemoglobinOAHI—obstructive apnea hypopnea indexOSAS—obstructive sleep apnea syndromeSCA—sickle cell anemiaSpO2—pulse oxygen saturation
(Continued on last page)
PEDIATRICS Volume 134, Number 2, August 2014 273
ARTICLE
at Vanderbilt Univ on July 21, 2014pediatrics.aappublications.orgDownloaded from

Obstructive sleep apnea syndrome(OSAS) is adisorderof breathingduringsleep in which episodic upper airwaycollapse disrupts ventilation and leadsto oxyhemoglobin desaturation andpoor sleep quality. This common pedi-atric disorder, with a prevalence of 1%to 5%, is associatedwith adverse healthoutcomes, such as behavioral prob-lems, daytime sleepiness, cognitivedeficits, cardiovascular changes, andreduced quality of life.1,2 In adults, un-treated OSAS is associated with in-creased risk of incident cardiovasculardisease and stroke.3 Adenotonsillar hy-pertrophy is the most commonly iden-tified risk factor for childhood OSAS andadenotonsillectomy is effective treat-ment. Otherwise normal children withOSAS are more likely to be African-American,4–7 exposed to environmentaltobacco smoke,7 born preterm,5 haveundergone adenotonsillectomy,8 andlive in disadvantagedneighborhoods.9,10 Itis unknown whether these risk factorsgeneralize to children with sickle cellanemia (SCA).
SCA affects 1 in 600 African-Americansand is characterized by chronic hemo-lytic anemia and complications relatedto recurrent vaso-occlusion. One of thestrongest triggers for vaso-occlusion isoxyhemoglobin desaturation, which hasbeen linked to several complications ofSCA, such as increased pain,11 greaterrisk of central nervous system events,12
cognitive dysfunction,13 and history ofacute chest syndrome.14 Oxyhemoglobindesaturation is a well-known phenom-enon in SCA resulting from a combina-tion of calibration of the pulse oximeterfor hemoglobin A, and not hemoglobin S,a rightward shift of the oxyhemoglobindissociation curve, and dyshemoglo-bins, which are elevated in the presenceof intravascular hemolysis but in-capable of transporting oxygen. Be-cause desaturation is common to bothSCA and OSAS, the relationship betweenSCA and OSAS is of great interest.
The prevalence of OSAS in children withSCA is not well defined, and there isuncertainty whether OSAS is morecommon in this disorder.15,16 Previouslyreported prevalence rates range from5% to 79%. Except for 1 study,17,18
prevalence estimates have been basedon samples clinically referred for OSASsymptoms19–23 or with desaturation.24,25
Furthermore, clinicians are uncertainwhether the same symptoms, signs, andrisk factors associated with OSAS inotherwise healthy children have clinicalutility in screening for OSAS in childrenwith SCA.1
We used data from participants in theprospective Sleep and Asthma CohortStudy who were unselected for OSASsymptoms to investigate theprevalenceand risk factors for OSAS in childrenwith SCA. We hypothesized that (1)children with SCA will have a higherthan expected prevalence of OSAS forchildren of African heritage and (2)higher obstructive apnea hypopneaindices (OAHIs) will be associated withmore OSAS symptoms and greaternocturnaloxyhemoglobindesaturation.
METHODS
A detailed description of the testingprocedures and statistical approach isprovided in the Supplemental Infor-mation. In brief, we conducted a cross-sectional analysis of baseline datacollected as part of the Sleep andAsthma Cohort Study, a prospectiveobservational cohort of children ages 4to 18 years with SCA (homozygous forsickle cell hemoglobin [HbSS] or com-pound heterozygotes for sickle b thal-assemia zero [HbSb0]), designed toevaluate the contribution of asthmaand sleep abnormalities to SCA-relatedmorbidity. Participants were recruited(66% participation rate) from 3 pedi-atric centers: St Louis, Missouri;Cleveland, Ohio; and London, UnitedKingdom. Children were enrolled with-out regard to past morbidity from or
symptoms of sleep-disordered breath-ing or asthma. Children were ineligiblefor participation if they themselveswere smokers, receiving long-termblood transfusions, or receiving long-term continuous positive airway pres-sure therapy at the time of enrollment;were participating in a clinical trialevaluating blood transfusion, oxygen,or hydroxyurea therapy; had chroniclung disease (other than asthma); orwere HIV positive. Participants placedon transfusion therapy during the studywere retained in the cohort. Institutionalreview boards for each site approvedthe study protocol. Written informedparental consent and patient assentwere obtained for all participants.
Questionnaires and Definitions
Parents/primarycaretakersofparticipantscompleted standardized questionnairesabout demographic characteristics andmedical history, including asthma, al-lergies, and sleep.26–29 Asthma was de-fined as a “yes” response to any of thefollowing 3 questions: (1) “Has a doc-tor ever said that the participant hasasthma?”, (2) “Does the participanttake any asthma medications?”, and(3) “Does the participant still haveasthma?” Hayfever was defined asa “yes” response to “Has a doctorever said that the participant hashayfever?” Household tobacco smokeexposure was defined as a “yes” re-sponse to current exposure.
Habitual snoringwasassessedbyusingthe sleep questionnaire by response to“How many times did your child snorein the previous month?” and was de-fined as snoring $3 nights per week.Trouble breathing or witnessed apneawere defined when these symptomsoccurred at least “sometimes” (1 to 2times per week). Enuresis was definedas bedwetting at least 1 to 2 times perweek. Previous tonsillectomy or ade-noidectomy was indicated by a “yes”response to removal of tonsils or
274 ROSEN et al at Vanderbilt Univ on July 21, 2014pediatrics.aappublications.orgDownloaded from

adenoids. Family history of OSAS wasdefined as positive if there were any“yes” responses to a family membereither diagnosed with OSAS or usingcontinuous positive airway pressure.Sleepiness was assessed by using theEpworth Sleepiness Scale modified forchildren, in which scores range from0 to 24, with higher scores indicatinggreater daytime sleepiness.29
Physiologic assessments included stan-dardized measurements of height,weight, BMI converted to age- andgender-adjusted z scores,30 and bloodpressure converted to age-, gender-,and height-adjusted systolic and di-astolic percentiles based on ausculta-tory normative data for children withSCA.31 Allergy skin tests using the prickpuncture technique with the multitest(Lincoln Diagnostics, Decatur, IL) to 9aeroallergens were performed as pre-viously reported.32 Atopy was defined ashaving at least 2 positive skin tests.
Spirometry measures (forced expira-tory volume in 1 second [FEV1], forcedvital capacity [FVC], and the ratio ofFEV1 to FVC [FEV1:FVC]) were performedby study-certified technicians with theuse of standardized protocols33 andcompared with normative data forhealthy black children.34,35 Wakingpulse oxygen saturation (SpO2) valueswere collected by using a standardized5-minute period. Other laboratory datawere collected as part of clinical care.
Children underwent full channel, in-laboratory polysomnography by study-certified technicians with standardizedprotocols and equipment followingAmerican Academy of Sleep Medicineguidelines for data acquisition andscoring, except for carbon dioxide,which was not collected.36 Becausethere is no consensus about what OAHIthreshold should be used to defineOSAS status, OAHI data were summa-rized by using several commonly usedpediatric cutpoints: OAHI $1,37 OAHI$1 plus habitual snoring,37,38 OAHI
$1.5,39 OAHI $2,40 and OAHI $5.4–6,38
Primary snoring was defined as anOAHI value of,1 with habitual snoring3 to 5 nights per week.
Statistical Analyses
Means, SDs, medians, and interquartileranges were computed for continuousvariables. Frequencies and percentageswere computed for categorical vari-ables. Continuous datawere analyzed byusing analysis of variance or the non-parametric equivalent for nonnormaldistributions. Categorical data wereanalyzed with a x2 test, and the Fisher’sexact test was used where expected cellcounts did not meet minimum require-ments. Logistic regression was used forthemultivariable analyses to assess theassociation between potential risk fac-tors and OSAS status. For analytic pur-poses, the dependent variable, OAHI,was categorized into 3 OSAS statusgroups: no OSAS (OAHI ,1), mild OSAS(1# OAHI,5), and moderate to severeOSAS (OAHI$5). Associations betweenthe risk factors and OSAS status wereexpressed as odds ratios (ORs) with95% confidence intervals (CIs). Alltests for significance were 2-tailed.P values of,.05 were considered sig-nificant. All analyses were performedby using SPSS version 21 (IBM SPSSStatistics, IBM Corporation, Armonk,NY).
RESULTS
The final analytic sample included 243children: 59 (24%) from Cleveland, 94(39%) from London, and 90 (37%) fromSt Louis. The median age was 10 years,50% were boys, 99% had African heri-tage, and 95% were homozygous forHbSS. The OAHI data were not normallydistributed:mean (SD, range) = 2.1 (4.6,0–37.2), whereas the median (inter-quartile range) was 0.6 (0.2–1.9). Fig-ure 1 shows the prevalence of OSASbased on commonly used OAHI cutpointsand definitions: 41% for an OAHI$1, 34%for an OAHI $1 plus habitual snoring,28% for an OAHI $1.5, 24% for an OAHI$2, and 10% for an OAHI$5. Among the143 (59%) participants with OAHI val-ues,1, 21% were habitual snorers (atleast 3–5 nights per week) and 48%snored at least 1 to 2 nights per week.
Participant Characteristics andOSAS Symptoms by OAHI Categories
Table 1 shows associations of partici-pant characteristics and OSAS symp-toms by OAHI categories. The frequencyof OSAS symptoms (habitual snoring,trouble breathing, witnessed apnea,nocturnal enuresis) increased withhigher OAHI values but not for noctur-nal restlessness or daytime sleepiness.Only less caretaker education variedsignificantly with increasing OAHI val-ues, whereas age, male gender, and
FIGURE 1OSAS status at different OAHI cutpoints. ICSD-II, International Classification of Sleep Disorders II.
ARTICLE
PEDIATRICS Volume 134, Number 2, August 2014 275 at Vanderbilt Univ on July 21, 2014pediatrics.aappublications.orgDownloaded from

household income did not. Lower wakingSpO2 valueswere significantly associatedwith greater OAHI values, whereas lowerhemoglobin values, higher BMI z scores,and elevated blood pressure were not.Participants with SCA were rarely obese.Greater OAHI values were significantlyassociated with reduced lung function(lower FEV1 and FEV1:FVC), but not withlower FVC. Preterm birth was associatedwith lower, not higher, apnea hypopneaindex (OAHI) values. Other potential OSASrisk factors, such as family history ofOSAS, previous adenotonsillectomy, andother allergic or inflammatory con-ditions (asthma, hayfever, atopy, andenvironmental tobacco smoke expo-sure), were not associated with in-
creasing OAHI. Hydroxyurea prescriptionwas caretaker reported for 10% of thesample but was not associated withlower OAHI (P = .46).
Polysomnography Findings andOximetry Metrics by IncreasingOAHI Cutpoints
Polysomnography results stratified byOAHI cutpoints are shown in Table 2 forcardiorespiratory data and are shown inTable 3 for sleep data. Higher OAHI cut-points were significantly associated withhigher respiratory and desaturation in-dices and lower SpO2 metrics. Obstructiveapneas had a negligible contribution tothe overall OAHI at cutpoints,2. Centralapneas tended to be more frequent with
higher OAHIs, but remained within thenormal range. Higher arousal index wasthe only sleep variable associated withhigher OAHI cutpoints (P, .001).
Risk Factors for OSAS:Multivariable Models Using 2 OSASSeverity Groups
Table 4 summarizes the final multivari-able models in which the dependentvariable, OSAS status, is categorized into3 groups: no OSAS (OAHI,1), mild OSAS(1# OAHI,5), and moderate to severeOSAS (OAHI $5). When the b-value isnegative, significant associations willhave ORs,1, which means that a lowervariable value is associated with agreater odds of being a member of the
TABLE 1 Distribution of Participant Characteristics and OSAS Symptoms by OAHI Categories
All (N = 243) OAHI ,1(n = 143; 59%)
OAHI$1 and,2(n = 42; 17%)
OAHI$2 and,5(n = 33; 14%)
OAHI $5(n = 25; 10%)
P
Demographic characteristicsAge, mean (SD), y 10.6 (4.2) 10.6 11.1 11.4 8.8 .11Male gender, % 50.2 47.6 50.0 48.5 68.0 .31Caretaker education less than high school
(n reported = 239), %39.3 33.1 50.0 57.6 32.0 .03
Household income ,$30 000 (n reported = 207), % 59.9 56.3 73.0 61.3 55.0 .32Sleep and breathing symptomsHabitual snoring $3 nights/week (n reported = 232), % 34.0 21.1 36.8 50.0 80.0 ,.001Trouble breathing $1 night/week (n reported = 219), % 19.2 14.0 13.2 25.9 48.0 .001Witnessed apnea $1 night/week (n reported = 218), % 9.2 5.6 2.6 14.3 32.0 ,.001Nocturnal enuresis, $1 night/week (n reported = 227), % 30.0 27.6 20.0 32.9 56.0 .016Restless, $1 night/week, % 31.7 32.9 33.3 30.3 24.0 .84Epworth Sleepiness Scalea (n reported = 237), mean (SD) 7.1 (4.2) 7.0 6.9 8.1 7.0 .59
Physiologic measurementsHemoglobin, mean (SD), g/dL 8.2 (1.2) 8.4 8.1 8.0 7.9 .10Waking SpO2 (n reported = 236), median (IQR), % 97.1 (94.0 to 98.6) 98.3 96.5 94.0 95.8 ,.001BMI z score (n reported = 241), median (IQR) 0.02 (20.71 to 0.82) 0.06 0.04 20.10 20.02 .90Systolic blood pressure.90th percentile
(n reported = 241), %23.7 27.7 11.9 21.2 24.0 .21
Diastolic blood pressure .90th percentile(n reported = 240), %
2.5 2.1 2.4 3.0 4.0 .95
Atopy ($2 positive skin tests; n reported = 217), % 26.3 25.0 26.3 37.9 18.2 .41FVC (n reported = 241), % predicted 92.2 (14.3) 93.8 89.6 92.0 87.8 .13FEV1 (n reported = 241), % predicted 88.0 (13.8) 90.7 84.3 83.6 84.4 .003FEV1:FVC (n reported = 241) 0.86 (0.07) 0.87 0.85 0.81 0.87 ,.001
Other medical and/or family history, %Previous tonsillectomy or adenoidectomy (n reported = 240) 19.6 17.6 28.6 16.1 20.0 .43Household smoking exposure (n reported = 241) 28.6 27.0 23.8 39.4 32.0 .44Asthma 27.6 23.1 35.7 33.3 32.0 .30Hayfever (n reported = 196) 18.9 20.0 15.8 18.5 18.8 .95Preterm birth (n reported = 233) 12.0 17.0 7.5 0.0 8.0 .03Prescribed hydroxyurea at time of polysomnography
(n reported = 218)10.3 12.6 9.5 6.1 4.0 .46
Family history of OSAS or CPAP use (n reported = 239) 10.0 9.2 17.1 12.5 0.0 .15
Continuous data with normal distributions are reported as means (SD), whereas data with nonnormal distributions are reported as medians (IQR). Categorical data are reported asa percentage of the entire sample (N = 243) or numbers (n) reported. IQR, interquartile range; CPAP, continuous positive airway pressure.a The range for the Epworth Sleepiness Scale score is 0 to 24, with higher scores indicating greater daytime sleepiness and normal values ,11 in children.
276 ROSEN et al at Vanderbilt Univ on July 21, 2014pediatrics.aappublications.orgDownloaded from

OSAS group. To improve clinical in-terpretability of the significant, but large,negative ORs, we “reformatted” wakingSpO2 values ,96% to present the effectwith an OR .1 and recoded pretermbirth as non–preterm birth.
There were 218 participants in the 2groups: a no-OSAS group and a mild-OSAS group. In the screening modelwith 13 variables of interest, 186 of 218participants had full data (loss of 14.7%)and the following 6 variables passedscreening with P , .20: habitual snor-ing, waking SpO2 ,96%, FEV1 percentpredicted, environmental tobacco smokeexposure, caretaker education less than
high school, and non–preterm birth. Byusing the 6 variables from the first stepwith the 186 participants to estimatea reduced model, multivariable analy-ses revealed that 4 variables weresignificantly and independently asso-ciated with a greater odds of mildOSAS: waking SpO2 values ,96% (OR:7.89; 95% CI: 3.66–17.02; P , .001), ha-bitual snoring (OR: 2.76; 95% CI: 1.24–6.17; P = .013), lower FEV1 percentpredicted (OR: 0.96; 95% CI: 0.93–0.99;P = .010), and non–preterm birth (OR:4.98; 95% CI: 1.1–20.97; P = .028). Thefinal model was 57.6% accurate atpredicting mild OSAS in this sample
(sensitivity = 0.78, specificity = 0.67;given a prevalence rate of 31% for mildOSAS in this sample, the positive pre-dictive value was 0.52 and the negativepredictive value was 0.87).
For no OSAS versus moderate to severeOSAS (OAHI $5), there were 168 partic-ipants. With the use of the 4 variablesfrom the final model for mild OSAS (plusage and gender) in the model for mod-erate to severe OSAS (OAHI $5), therewere 148 participantswith full data (lossof 11.9%). Multivariable analyses re-vealed that only 2 factors significantlyand independently associated with mod-erate to severe OSAS status: habitual
TABLE 2 Cardiorespiratory Polysomnography Variables by OAHI Diagnostic Cutpoints
Characteristic All (N = 243) OAHI,1 (n = 143) OAHI$1 (n = 100) OAHI$2 (n = 58) OAHI$5 (n = 25) P
OAHIIn NREM, median (IQR) 0.23 (0.0–1.18) 0.0 0.85 1.68 4.62 ,.001In REM, median (IQR) 2.0 (0.0–8.0) 1.00 4.5 11.0 47.0 ,.001Median (IQR) 0.0 0.0 0.0 0.13 0.71 ,.001
Central apnea index, median (IQR) 0.29 (0.12–0.68) 0.24 0.50 0.35 0.38 .005Sleep-wake SpO2 difference (n reported = 236),
mean (SD), %20.85 (1.74) 20.63 20.90 21.24 21.46 .073
SpO2, %During sleep, median (IQR) 96.4 (93.8–98.1) 97.7 96.0 92.5 93.9 ,.001During NREM sleep, median (IQR) 96.4 (94.0–98.8) 97.5 95.9 92.4 94.4 ,.001In REM sleep (n reported = 242), median (IQR) 96.7 (93.8–98.4) 98.0 96.0 92.5 93.0 ,.001
Minimum NREM SpO2, median (IQR), % 92.0 (86.6–95.2) 93.8 90.8 85.9 85.1 ,.001Minimum REM SpO2, median (IQR), % 91.7 (84.8–95.0) 93.3 90.0 84.0 76.0 ,.0013% Desaturation indexMedian (IQR) 2.2 (0.6–6.3) 0.9 3.2 7.0 15.9 ,.001In NREM, median (IQR) 1.40 (0.39–4.44) 0.70 2.35 4.90 8.33 ,.001In REM, median (IQR) 3.79 (1.06–10.52) 1.44 5.74 11.87 39.04 ,.001
Sleep time with SpO2 ,95%, median (IQR), % 6.2 (0.2–81.2) 0.4 20.2 88.9 68.2 ,.001Sleep time with SpO2 ,92%, median (IQR), % 0.07 (0–8.91) 0.02 0.115 46.7 7.66 ,.001Sleep time with SpO2 ,90%, median (IQR), % 0.02 (0.0–0.6) 0.0 0.03 1.74 1.91 ,.001Sleep time with SpO2 ,85%, median (IQR), % 0.0 (0.0–0.4) 0.0 0.0 0.06 0.69 ,.001Heart rate asleep (n reported = 242), mean (SD), beats/min 84.5 (10.7) 82.9 83.7 86.6 92.3 ,.001
Continuous data with normal distributions are reported as means (SD), whereas data with nonnormal distributions are reported as medians (IQR). Categorical data are reported asa percentage of the entire sample (N = 243) or the numbers (n) of participants reported. IQR, interquartile range; NREM, nonrapid eye movement; REM, rapid eye movement.
TABLE 3 Sleep Polysomnography Variables by OAHI Diagnostic Cutpoints
Characteristic All (N = 243) OAHI ,1 (n = 143) OAHI $1 (n = 100) OAHI $2 (n = 58) OAHI $5 (n = 25) P
Total sleep time, mean (SD), min 438.7 (68.2) 438.4 450.2 431.5 430.9 .60Sleep latency, median (IQR), min 20.5 20.0 24.8 20.5 15.0 .88REM latency, median (IQR), min 83.5 80.8 89.0 92.0 90.0 .28Sleep efficiency, median (IQR), % 85.5 (78.6–89.5) 85.9 84.5 84.4 82.2 .21NREM stage 1 sleep, mean (SD), % 5.2 (2.7) 5.0 5.0 5.9 5.8 .22NREM stage 2 sleep, mean (SD), % 45.6 (8.2) 45.5 46.7 45.5 44.7 .78NREM stage 3 sleep, mean (SD), % 22.5 (8.1) 22.4 20.9 22.7 25.7 .13REM sleep, mean (SD), % 26.6 (6.3) 27.0 27.3 25.9 23.9 .10Supine sleep time, mean (SD), % 46 (0.26) .47 .42 41 57 .09Arousal index, mean (SD) events/hr 8.6 (3.0) 8.2 8.3 9.1 10.9 ,.001
Continuous data with normal distributions are reported as means (SD), whereas data with nonnormal distributions are reported as medians (IQR). IQR, interquartile range; NREM, nonrapideye movement; REM, rapid eye movement.
ARTICLE
PEDIATRICS Volume 134, Number 2, August 2014 277 at Vanderbilt Univ on July 21, 2014pediatrics.aappublications.orgDownloaded from
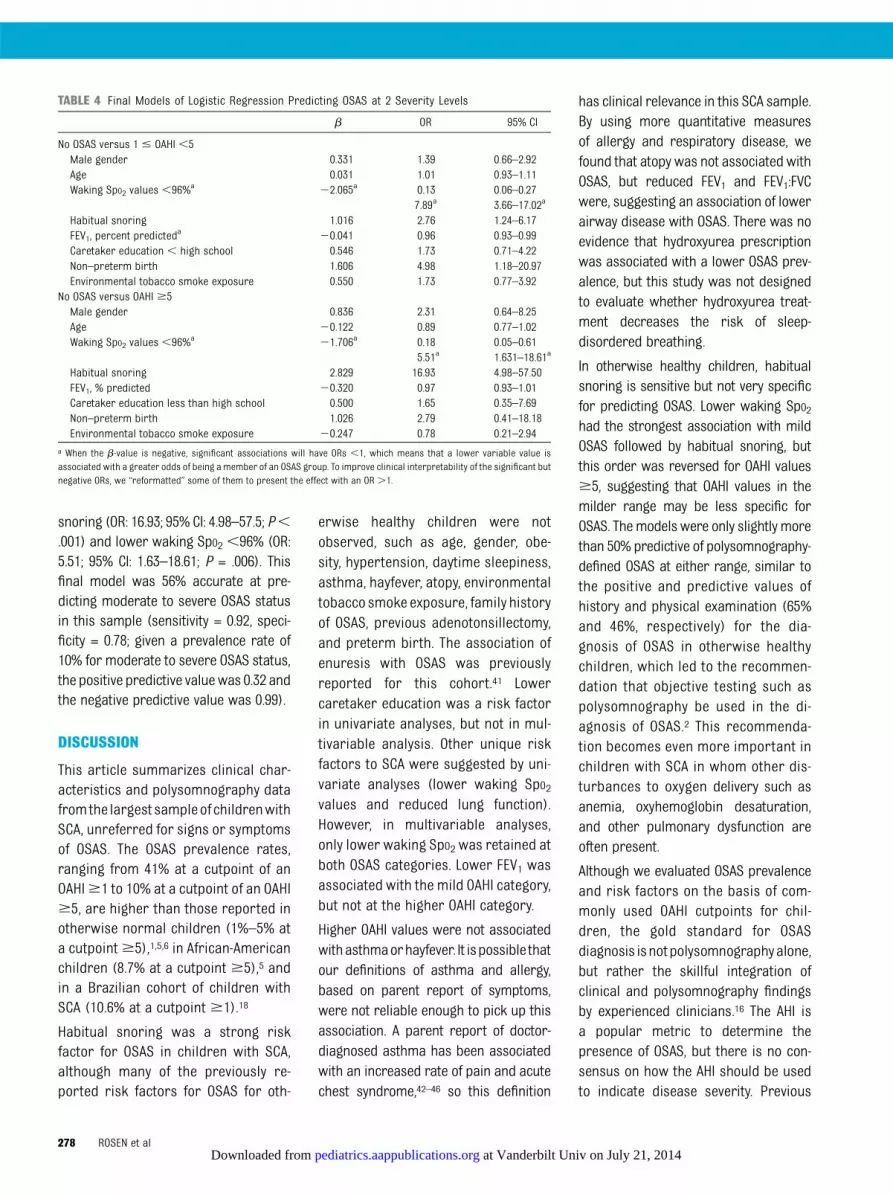
snoring (OR: 16.93; 95% CI: 4.98–57.5; P,.001) and lower waking SpO2 ,96% (OR:5.51; 95% CI: 1.63–18.61; P = .006). Thisfinal model was 56% accurate at pre-dicting moderate to severe OSAS statusin this sample (sensitivity = 0.92, speci-ficity = 0.78; given a prevalence rate of10% for moderate to severe OSAS status,the positive predictive valuewas 0.32 andthe negative predictive value was 0.99).
DISCUSSION
This article summarizes clinical char-acteristics and polysomnography datafromthe largest sampleofchildrenwithSCA, unreferred for signs or symptomsof OSAS. The OSAS prevalence rates,ranging from 41% at a cutpoint of anOAHI$1 to 10% at a cutpoint of an OAHI$5, are higher than those reported inotherwise normal children (1%–5% ata cutpoint$5),1,5,6 in African-Americanchildren (8.7% at a cutpoint $5),5 andin a Brazilian cohort of children withSCA (10.6% at a cutpoint $1).18
Habitual snoring was a strong riskfactor for OSAS in children with SCA,although many of the previously re-ported risk factors for OSAS for oth-
erwise healthy children were notobserved, such as age, gender, obe-sity, hypertension, daytime sleepiness,asthma, hayfever, atopy, environmentaltobacco smoke exposure, family historyof OSAS, previous adenotonsillectomy,and preterm birth. The association ofenuresis with OSAS was previouslyreported for this cohort.41 Lowercaretaker education was a risk factorin univariate analyses, but not in mul-tivariable analysis. Other unique riskfactors to SCA were suggested by uni-variate analyses (lower waking SpO2values and reduced lung function).However, in multivariable analyses,only lower waking SpO2 was retained atboth OSAS categories. Lower FEV1 wasassociated with the mild OAHI category,but not at the higher OAHI category.
Higher OAHI values were not associatedwithasthmaorhayfever. It ispossible thatour definitions of asthma and allergy,based on parent report of symptoms,were not reliable enough to pick up thisassociation. A parent report of doctor-diagnosed asthma has been associatedwith an increased rate of pain and acutechest syndrome,42–46 so this definition
has clinical relevance in this SCA sample.By using more quantitative measuresof allergy and respiratory disease, wefound that atopy was not associated withOSAS, but reduced FEV1 and FEV1:FVCwere, suggesting an association of lowerairway disease with OSAS. There was noevidence that hydroxyurea prescriptionwas associated with a lower OSAS prev-alence, but this study was not designedto evaluate whether hydroxyurea treat-ment decreases the risk of sleep-disordered breathing.
In otherwise healthy children, habitualsnoring is sensitive but not very specificfor predicting OSAS. Lower waking SpO2had the strongest association with mildOSAS followed by habitual snoring, butthis order was reversed for OAHI values$5, suggesting that OAHI values in themilder range may be less specific forOSAS. Themodelswere only slightlymorethan 50% predictive of polysomnography-defined OSAS at either range, similar tothe positive and predictive values ofhistory and physical examination (65%and 46%, respectively) for the dia-gnosis of OSAS in otherwise healthychildren, which led to the recommen-dation that objective testing such aspolysomnography be used in the di-agnosis of OSAS.2 This recommenda-tion becomes even more important inchildren with SCA in whom other dis-turbances to oxygen delivery such asanemia, oxyhemoglobin desaturation,and other pulmonary dysfunction areoften present.
Although we evaluated OSAS prevalenceand risk factors on the basis of com-monly used OAHI cutpoints for chil-dren, the gold standard for OSASdiagnosis isnotpolysomnographyalone,but rather the skillful integration ofclinical and polysomnography findingsby experienced clinicians.16 The AHI isa popular metric to determine thepresence of OSAS, but there is no con-sensus on how the AHI should be usedto indicate disease severity. Previous
TABLE 4 Final Models of Logistic Regression Predicting OSAS at 2 Severity Levels
b OR 95% CI
No OSAS versus 1 # OAHI ,5Male gender 0.331 1.39 0.66–2.92Age 0.031 1.01 0.93–1.11Waking SpO2 values,96%a 22.065a 0.13 0.06–0.27
7.89a 3.66–17.02a
Habitual snoring 1.016 2.76 1.24–6.17FEV1, percent predicted
a 20.041 0.96 0.93–0.99Caretaker education , high school 0.546 1.73 0.71–4.22Non–preterm birth 1.606 4.98 1.18–20.97Environmental tobacco smoke exposure 0.550 1.73 0.77–3.92
No OSAS versus OAHI $5Male gender 0.836 2.31 0.64–8.25Age 20.122 0.89 0.77–1.02Waking SpO2 values,96%a 21.706a 0.18 0.05–0.61
5.51a 1.631–18.61a
Habitual snoring 2.829 16.93 4.98–57.50FEV1, % predicted 20.320 0.97 0.93–1.01Caretaker education less than high school 0.500 1.65 0.35–7.69Non–preterm birth 1.026 2.79 0.41–18.18Environmental tobacco smoke exposure 20.247 0.78 0.21–2.94
a When the b-value is negative, significant associations will have ORs ,1, which means that a lower variable value isassociated with a greater odds of being a member of an OSAS group. To improve clinical interpretability of the significant butnegative ORs, we “reformatted” some of them to present the effect with an OR .1.
278 ROSEN et al at Vanderbilt Univ on July 21, 2014pediatrics.aappublications.orgDownloaded from

studies have shown that the AHI was notuseful in predicting either baselineneurobehavioral morbidity or responseto OSAS treatment in children in thegeneral population.40,47–53 Even “pri-mary snoring,” that is snoring with anAHI ,1, has been associated with neu-robehavioral morbidity.54–56 For thesereasons, we cannot identify an AHIthreshold at which OSAS needs to beaddressed. Because the study wasbased on cross-sectional data, the im-pact of OSAS or greater hypoxemia onhealth outcomes in children with SCAcannot be assessed. Further outcomesstudies are required to determine whatthreshold is associated with SCA-related morbidity.
Although OSAS appears to be 1 contrib-utor tosleep-disorderedbreathing inSCA,the oximetry metrics reveal that somechildren also experience more sustainednocturnal desaturation. Greater desatu-ration time was associated with higherOAHI cutpoints, but desaturation can alsobe related to comorbid lower respiratorytract pathology. In our sample with SCA,the oximetry metrics for sleep time of,95% and ,92% were similar to theupper limits of normal reported for oth-erwise healthy children.57–59 Neverthe-less, the oximetry and lung functionfindings suggest that a portion of thesleep-disordered breathing in childrenwith SCA may be an indicator of lowerrespiratory tract problems rather thana specific marker of upper airway ob-struction and OSAS.
The strengths of this study include par-ticipants who were unselected forsymptoms of OSAS, the largemulticentersample, and objective assessment ofsleep-disordered breathing by stan-dardized full polysomnography scoredcentrally without clinical correlates.Nevertheless, several limitations arenoted. With a participation rate of 66%, itis possible that the sample includedfamilies with greater concerns aboutsleep-disordered breathing, leading tohigher OSAS prevalence rates. We rec-ognize that questionnaire data and par-ent report of symptoms are imperfectmeasures of the presence and severity ofOSAS2 and potential OSAS risk factors. Onthe other hand, in this cohort, parentreport of wheezing symptoms wasa better predictor of a physician di-agnosis of asthma than lung functiontesting.60 In terms of data collection,tonsil size was not assessed, end-tidalcarbon dioxide was not measured, anddaytime behavioral problems were notevaluated, so the assessment of OSASsigns, symptoms, and consequencescould have been more comprehensive.Finally, although validated in comparisonwith arterial saturation in patients withSCA,61 simple pulse oximetry may un-derestimate oxygenation status becausethe dyshemoglobins are not measured.62
CONCLUSIONS
This study confirms that children withSCA have a higher prevalence of sleep-
disordered breathing consistent withOSAS, beyond greater nocturnal de-saturation, and that these children ex-perience typical nocturnal symptomsof snoring and breathing/sleep dis-turbances. Because OSAS is a treatablecondition with adverse health out-comes, greater efforts are needed toimplement andevaluateprocedures forscreening, diagnosing, and treatingOSAS in this high-risk, vulnerable pop-ulation.
ACKNOWLEDGMENTSWethank the following individualsat the3 study sites and the coordinating site(Vanderbilt University, Nashville TN): StLouis site: Washington University:Joshua Field, MD, Lisa Garrett, RN, CCRP,Pamela Bates, CRT, RPFT, PRSGT, RickTalbert, RPSGT, Sabrina Lockett, RPSGT,Valerie Morgan, RRT, Phillip Blanks, andTinishia Greene. Cleveland site: CaseWestern Reserve University: SusanSurovec, BA, Nancy Scott, BS, REEG/EPT,RPSGT, REDT, CNIM, and Mary DeBarr,RN, BSN. London site: University Collegeof London Institute of Child Health andGreat Ormond Street Hospital: JaneKirkby, BSc, Satwinder Sahota, BSc,Liam Welsh, PhD, Ursula Johnson, RN,Aidan Laverty, MSc, MBCS, and AnneO’Reilly; North Middlesex Hospital: AnneYardumian, MD, FRCP, and MarilynRoberts-Harewood, MRCPCH; Univer-sity of York: Avijit Kumar Datta, MD,MRCP; Nashville: Ms Dionna O. Roberts,MPH, MS.
REFERENCES
1. Marcus CL, Brooks LJ, Draper KA, et al;American Academy of Pediatrics. Diagnosisand management of childhood obstructivesleep apnea syndrome. Pediatrics. 2012;130(3):576–584
2. Marcus CL, Brooks LJ, Draper KA, et al;American Academy of Pediatrics. Diagnosisand management of childhood obstructivesleep apnea syndrome. Pediatrics. 2012;
130(3). Available at: www.pediatrics.org/cgi/content/full/130/3/e714
3. Loke YK, Brown JW, Kwok CS, Niruban A, MyintPK. Association of obstructive sleep apneawith risk of serious cardiovascular events:a systematic review and meta-analysis. CircCardiovasc Qual Outcomes. 2012;5(5):720–728
4. Redline S, Tishler PV, Schluchter M, Aylor J,Clark K, Graham G. Risk factors for sleep-
disordered breathing in children: associa-tions with obesity, race, and respiratoryproblems. Am J Respir Crit Care Med. 1999;159(5 pt 1):1527–1532
5. Rosen CL, Larkin EK, Kirchner HL, et al.Prevalence and risk factors for sleep-disordered breathing in 8- to 11-year-oldchildren: association with race and pre-maturity. J Pediatr. 2003;142(4):383–389
ARTICLE
PEDIATRICS Volume 134, Number 2, August 2014 279 at Vanderbilt Univ on July 21, 2014pediatrics.aappublications.orgDownloaded from

6. Bixler EO, Vgontzas AN, Lin HM, et al. Sleepdisordered breathing in children in a gen-eral population sample: prevalence andrisk factors. Sleep. 2009;32(6):731–736
7. Weinstock TG, Rosen CL, Marcus CL, et al.Predictors of obstructive sleep apnea se-verity in adenotonsillectomy candidates.Sleep. 2014;37(2):261–269
8. Morton S, Rosen C, Larkin E, Tishler P, AylorJ, Redline S. Predictors of sleep-disorderedbreathing in children with a history oftonsillectomy and/or adenoidectomy. Sleep.2001;24(7):823–829
9. Brouillette RT, Horwood L, Constantin E,Brown K, Ross NA. Childhood sleep apneaand neighborhood disadvantage. J Pediatr.2011;158(5):789–795, e781
10. Spilsbury JC, Storfer-Isser A, Kirchner HL,et al. Neighborhood disadvantage as a riskfactor for pediatric obstructive sleep ap-nea. J Pediatr. 2006;149(3):342–347
11. Hargrave DR, Wade A, Evans JP, Hewes DK,Kirkham FJ. Nocturnal oxygen saturationand painful sickle cell crises in children.Blood. 2003;101(3):846–848
12. Kirkham FJ, Hewes DK, Prengler M, Wade A,Lane R, Evans JP. Nocturnal hypoxaemia andcentral-nervous-system events in sickle-celldisease. Lancet. 2001;357(9269):1656–1659
13. Hollocks MJ, Kok TB, Kirkham FJ, et al.Nocturnal oxygen desaturation and disor-dered sleep as a potential factor in exec-utive dysfunction in sickle cell anemia. J IntNeuropsychol Soc. 2012;18(1):168–173
14. Rackoff WR, Kunkel N, Silber JH, Asakura T,Ohene-Frempong K. Pulse oximetry andfactors associated with hemoglobin oxygendesaturation in children with sickle celldisease. Blood. 1993;81(12):3422–3427
15. Wise MS, Nichols CD, Grigg-Damberger MM,et al. Executive summary of respiratoryindications for polysomnography in chil-dren: an evidence-based review. Sleep.2011;34(3):389–398
16. Wise MS, Nichols CD, Grigg-Damberger MM,et al. Respiratory indications for poly-somnography in children: an evidence-based review. Sleep. 2011;34(3):389–398
17. Salles C, Ramos RT, Daltro C, Nascimento VM,Matos MA. Association between adenotonsillarhypertrophy, tonsillitis and painful crises insickle cell disease. J Pediatr (Rio J). 2009;85(3):249–253
18. Salles C, Ramos RT, Daltro C, Barral A,Marinho JM, Matos MA. Prevalence of ob-structive sleep apnea in children andadolescents with sickle cell anemia. J BrasPneumol. 2009;35(11):1075–1083
19. Brooks LJ, Koziol SM, Chiarucci KM, BermanBW. Does sleep-disordered breathing con-tribute to the clinical severity of sickle cell
anemia? J Pediatr Hematol Oncol. 1996;18(2):135–139
20. Maddern BR, Reed HT, Ohene-Frempong K,Beckerman RC. Obstructive sleep apneasyndrome in sickle cell disease. Ann OtolRhinol Laryngol. 1989;98(3):174–178
21. Samuels MP, Stebbens VA, Davies SC, Picton-Jones E, Southall DP. Sleep related upperairway obstruction and hypoxaemia in sicklecell disease. Arch Dis Child. 1992;67(7):925–929
22. Kaleyias J, Mostofi N, Grant M, et al. Se-verity of obstructive sleep apnea in chil-dren with sickle cell disease. J PediatrHematol Oncol. 2008;30(9):659–665
23. Rogers VE, Lewin DS, Winnie GB, Geiger-Brown J. Polysomnographic characteristicsof a referred sample of children with sicklecell disease. J Clin Sleep Med. 2010;6(4):374–381
24. Needleman JP, Franco ME, Varlotta L, et al.Mechanisms of nocturnal oxyhemoglobindesaturation in children and adolescentswith sickle cell disease. Pediatr Pulmonol.1999;28(6):418–422
25. Spivey JF, Uong EC, Strunk R, Boslaugh SE,DeBaun MR. Low daytime pulse oximetryreading is associated with nocturnaldesaturation and obstructive sleep apneain children with sickle cell anemia. PediatrBlood Cancer. 2008;50(2):359–362
26. Ferris BG. Epidemiology StandardizationProject (American Thoracic Society). AmRev Respir Dis. 1978;118(6 pt 2):1–120
27. Childhood Asthma Management ProgramResearch Group. The Childhood AsthmaManagement Program (CAMP): design, ra-tionale, and methods. Control Clin Trials.1999;20(1):91–120
28. Owens JA, Spirito A, McGuinn M. TheChildren’s Sleep Habits Questionnaire(CSHQ): psychometric properties of a sur-vey instrument for school-aged children.Sleep. 2000;23(8):1043–1051
29. Johns MW. A new method for measuringdaytime sleepiness: the Epworth sleepinessscale. Sleep. 1991;14(6):540–545
30. Kuczmarski RJ, Ogden CL, Grummer-StrawnLM, et al. CDC growth charts: United States.Adv Data. 2000;Jun 8(314):1–27
31. Pegelow CH, Colangelo L, Steinberg M, et al.Natural history of blood pressure in sicklecell disease: risks for stroke and deathassociated with relative hypertension insickle cell anemia. Am J Med. 1997;102(2):171–177
32. Field JJ, Stocks J, Kirkham FJ, et al. Airwayhyperresponsiveness in children with sicklecell anemia. Chest. 2011;139(3):563–568
33. Strunk RC, Szefler SJ, Phillips BR, et al;Childhood Asthma Research and Education
Network of the National Heart, Lung, andBlood Institute. Relationship of exhalednitric oxide to clinical and inflammatorymarkers of persistent asthma in children.J Allergy Clin Immunol. 2003;112(5):883–892
34. Wang X, Dockery DW, Wypij D, Fay ME, FerrisBG Jr. Pulmonary function between 6 and18 years of age. Pediatr Pulmonol. 1993;15(2):75–88
35. Pellegrino R, Viegi G, Brusasco V, et al. In-terpretative strategies for lung functiontests. Eur Respir J. 2005;26(5):948–968
36. Iber C, Ancoli-Israel S, Chesson A, Quan S;American Academy of Sleep Medicine. TheAASM Manual for Scoring of Sleep and As-sociated Events: Rules, Terminology andTechnical Specification. 1st ed. Westchester,IL: American Academy of Sleep Medicine; 2007
37. American Academy of Sleep Medicine. In-ternational Classification of Sleep Dis-orders: Diagnostic & Coding Manual. 2nded. Westchester, IL: American Academy ofSleep Medicine; 2005
38. Li AM, Au CT, Ng SK, et al. Natural historyand predictors for progression of mildchildhood obstructive sleep apnoea. Tho-rax. 2010;65(1):27–31
39. Beck SE, Marcus CL. Pediatric polysomno-graphy. Sleep Med Clin. 2009;4(3):393–406
40. Marcus CL, Moore RH, Rosen CL, et al;Childhood Adenotonsillectomy Trial (CHAT).A randomized trial of adenotonsillectomyfor childhood sleep apnea. N Engl J Med.2013;368(25):2366–2376
41. Lehmann GC, Bell TR, Kirkham FJ, et al.Enuresis associated with sleep disorderedbreathing in children with sickle cell ane-mia. J Urol. 2012;188(4 suppl):1572–1576
42. Glassberg JA, Chow A, Wisnivesky J, HoffmanR, Debaun MR, Richardson LD. Wheezing andasthma are independent risk factors forincreased sickle cell disease morbidity. Br JHaematol. 2012;159(4):472–479
43. Boyd JH, Macklin EA, Strunk RC, DeBaun MR.Asthma is associated with increased mor-tality in individuals with sickle cell anemia.Haematologica. 2007;92(8):1115–1118
44. Boyd JH, Macklin EA, Strunk RC, DeBaun MR.Asthma is associated with acute chest syn-drome and pain in children with sickle cellanemia. Blood. 2006;108(9):2923–2927
45. Glassberg J, Spivey JF, Strunk R, Boslaugh S,DeBaun MR. Painful episodes in children withsickle cell disease and asthma are tempo-rally associated with respiratory symptoms.J Pediatr Hematol Oncol. 2006;28(8):481–485
46. Leong MA, Dampier C, Varlotta L, Allen JL.Airway hyperreactivity in children with sicklecell disease. J Pediatr. 1997;131(2):278–283
47. Chervin RD, Archbold KH. Hyperactivityand polysomnographic findings in children
280 ROSEN et al at Vanderbilt Univ on July 21, 2014pediatrics.aappublications.orgDownloaded from

evaluated for sleep-disordered breathing.Sleep. 2001;24(3):313–320
48. O’Brien LM, Holbrook CR, Mervis CB, et al. Sleepand neurobehavioral characteristics of 5- to 7-year-old children with parentally reportedsymptoms of attention-deficit/hyperactivitydisorder. Pediatrics. 2003;111(3):554–563
49. Beebe DW, Wells CT, Jeffries J, Chini B, KalraM, Amin R. Neuropsychological effects ofpediatric obstructive sleep apnea. J IntNeuropsychol Soc. 2004;10(7):962–975
50. Gottlieb DJ, Chase C, Vezina RM, et al. Sleep-disordered breathing symptoms are associatedwith poorer cognitive function in 5-year-oldchildren. J Pediatr. 2004;145(4):458–464
51. Huang YS, Chen NH, Li HY, Wu YY, Chao CC,Guilleminault C. Sleep disorders in Taiwanesechildren with attention deficit/hyperactivitydisorder. J Sleep Res. 2004;13(3):269–277
52. Mulvaney SA, Goodwin JL, Morgan WJ, RosenGR, Quan SF, Kaemingk KL. Behavior problemsassociated with sleep disordered breathing inschool-aged children—the Tucson Children’s
Assessment of Sleep Apnea Study. J PediatrPsychol. 2006;31(3):322–330
53. Chervin RD, Weatherly RA, Garetz SL, et al.Pediatric sleep questionnaire: prediction ofsleep apnea and outcomes. Arch OtolaryngolHead Neck Surg. 2007;133(3):216–222
54. Blunden S, Lushington K, Kennedy D, MartinJ, Dawson D. Behavior and neurocognitiveperformance in children aged 5-10 yearswho snore compared to controls. J Clin ExpNeuropsychol. 2000;22(5):554–568
55. O’Brien LM, Mervis CB, Holbrook CR, et al.Neurobehavioral implications of habitual snor-ing in children. Pediatrics. 2004;114(1):44–49
56. Emancipator JL, Storfer-Isser A, Taylor HG,et al. Variation of cognition and achieve-ment with sleep-disordered breathing infull-term and preterm children. ArchPediatr Adolesc Med. 2006;160(2):203–210
57. Montgomery-Downs HE, O’Brien LM, GulliverTE, Gozal D. Polysomnographic characteristicsin normal preschool and early school-agedchildren. Pediatrics. 2006;117(3):741–753
58. Tapia IE, Karamessinis L, Bandla P, et al. Poly-somnographic values in children undergoingpuberty: pediatric vs. adult respiratory rulesin adolescents. Sleep. 2008;31(12):1737–1744
59. Verhulst SL, Schrauwen N, Haentjens D, VanGaal L, De Backer WA, Desager KN. Referencevalues for sleep-related respiratory variablesin asymptomatic European children andadolescents. Pediatr Pulmonol. 2007;42(2):159–167
60. Strunk RC, Cohen RT, Cooper BP, et al.Wheezing symptoms and parental asthmaare associated with a physician diagnosisof asthma in children with sickle cell ane-mia. J Pediatr. 2014;164(4):821–826, e821
61. Fitzgerald RK, Johnson A. Pulse oximetry insickle cell anemia. Crit Care Med. 2001;29(9):1803–1806
62. Caboot JB, Jawad AF, McDonough JM, et al.Non-invasive measurements of carboxy-hemoglobin and methemoglobin in childrenwith sickle cell disease. Pediatr Pulmonol.2012;47(8):808–815
(Continued from first page)
Dr Rosen helped develop the data collection instruments for sleep, supervised sleep data collection at 1 site, designed the concepts for this manuscript, interpretedthe data, created the initial draft, and revised the manuscript for final submission; Dr Debaun was the principal investigator for the National Institutes of Health–sponsored Sleep and Asthma Cohort (SAC) project and the principal investigator for 1 site and reviewed and helped revise the manuscript; Dr Strunk contributed tothe development of the SAC project, study concepts, and procedures; supervised the quality assurance for pulmonary function testing; and reviewed and helpedrevise the manuscript; Dr Redline developed the procedures for sleep data collection and analysis, was the principal investigator for 1 site, oversaw the quality ofthe acquired sleep study data, and reviewed and helped revise the manuscript; Dr Seicean performed data acquisition and analysis at 1 site and reviewed andhelped revise the manuscript; Dr Craven contributed as a coinvestigator at 1 site, supervised patient data collection, monitored patient safety, and reviewed andhelped revise the manuscript; Ms Gavlak performed data acquisition and analysis at 1 site, monitored patient safety, and reviewed and helped revise themanuscript; Drs Wilkey, Inusa, and Roberts were principal investigators for 1 site, supervised patient data collection, monitored patient safety, and reviewedand helped revise the manuscript; Mr Goodpaster was responsible for sleep data analysis, management, and quality assurance and reviewed and helped revise themanuscript; Dr Malow supervised the sleep data analysis, management, and quality assurance and reviewed and helped revised the manuscript; Dr Rodeghierdeveloped the statistical approach, performed those analyses, and reviewed the integrity of those analyses; Dr Kirkham was the principal investigator for 1 site,helped develop the concepts for this SAC project and this manuscript, analyzed and interpreted the data, contributed to the development of the initial draft, andreviewed/revised the manuscript; and all authors approved the final manuscript as submitted.
www.pediatrics.org/cgi/doi/10.1542/peds.2013-4223
doi:10.1542/peds.2013-4223
Accepted for publication May 12, 2014
Address correspondence to Carol L. Rosen, MD, Division of Pediatric Pulmonology, Department of Pediatrics, 11100 Euclid Ave, Mailstop 5017, Cleveland, OH 44106.E-mail: [email protected]
PEDIATRICS (ISSN Numbers: Print, 0031-4005; Online, 1098-4275).
Copyright © 2014 by the American Academy of Pediatrics
FINANCIAL DISCLOSURE: The authors have indicated they have no financial relationships relevant to this article to disclose.
FUNDING: All phases of this study were supported in part by the National Heart, Lung, and Blood Institute (NIH 1R01HL079937 [Dr Debaun], UL1 RR024989 CaseWestern Reserve University Clinical Research Unit and by Research and Development in the National Health Service (United Kingdom). Funded by the NationalInstitutes of Health (NIH).
POTENTIAL CONFLICT OF INTEREST: The authors have indicated they have no potential conflicts of interest to disclose.
ARTICLE
PEDIATRICS Volume 134, Number 2, August 2014 281 at Vanderbilt Univ on July 21, 2014pediatrics.aappublications.orgDownloaded from

DOI: 10.1542/peds.2013-4223; originally published online July 14, 2014;Pediatrics
Roberts, R. Lucas Goodpaster, Beth Malow, Mark Rodeghier and Fenella J. KirkhamSeicean, Daniel I. Craven, Johanna C.D. Gavlak, Olu Wilkey, Baba Inusa, Irene Carol L. Rosen, Michael R. Debaun, Robert C. Strunk, Susan Redline, Sinziana
Obstructive Sleep Apnea and Sickle Cell Anemia
ServicesUpdated Information &
/peds.2013-4223http://pediatrics.aappublications.org/content/early/2014/07/09including high resolution figures, can be found at:
Supplementary Material
9/peds.2013-4223.DCSupplemental.htmlhttp://pediatrics.aappublications.org/content/suppl/2014/07/0Supplementary material can be found at:
Permissions & Licensing
tmlhttp://pediatrics.aappublications.org/site/misc/Permissions.xhtables) or in its entirety can be found online at: Information about reproducing this article in parts (figures,
Reprints http://pediatrics.aappublications.org/site/misc/reprints.xhtml
Information about ordering reprints can be found online:
rights reserved. Print ISSN: 0031-4005. Online ISSN: 1098-4275.Grove Village, Illinois, 60007. Copyright © 2014 by the American Academy of Pediatrics. All and trademarked by the American Academy of Pediatrics, 141 Northwest Point Boulevard, Elkpublication, it has been published continuously since 1948. PEDIATRICS is owned, published, PEDIATRICS is the official journal of the American Academy of Pediatrics. A monthly
at Vanderbilt Univ on July 21, 2014pediatrics.aappublications.orgDownloaded from