observations of lightning phenomena using radio interferometry
TRANSCRIPT
JOURNAL OF GEOPHYSICAL RESEARCH, VOL. 99, NO. D6, PAGES 13,059-13,082, JUNE 20, 1994
Observations of lightning phenomena using radio interferometry
C. T. Rhodes, • X. M. Shao, P. R. Krehbiel, R. J. Thomas, and C. O. Hayenga • Geophysical Research Center, New Mexico Institute of Mining and Technology, Socorro
Abstract.
A radio interferometer system is described which utilizes multiple baselines to determine the direction of lightning radiation sources with an angular resolution of a few degrees and with microsecond time resolution. An interactive graphics analysis procedure is used to remove fringe ambiguities from the data and to reveal the structure and development of lightning discharges inside the storm. Radiation source directions and electric field waveforms have been analyzed for different types of breakdown events for two lightning flashes. These include the initial breakdown and K type events of in-cloud activity, the leaders of initial and subsequent strokes to ground, and activity during and following return strokes. Radiation during the initial breakdown of one flash was found to consist of intermittent, localized bursts of radiation that were slow moving. Source motion within a given burst was unresolved by the interferometer but was detected from burst to burst, with negative charge being transported in the direction of the breakdown progression. Radiation during initial leaders to ground was similar but more intense and continuous and had a characteristic intensity waveform. Radiation from in-cloud K type events is essentially the same as for dart leaders; in both cases it is produced at the leading edge of a fast-moving negative streamer that propagates along a well-defined, often extensive, path. K type events are sometimes terminated by a fast field change that appears analogous to the field change of a return stroke. Dart leaders are sometimes observed to die out before reaching ground; these are termed "attempted leaders" and, except for their greater extent, are no different than K type events. Several modes of breakdown during and after return strokes have been documented and analyzed. One mode corresponds to the launching of a positive streamer away from the upper end of the leader channel, apparently as the return stroke reaches the leader start point. In another mode, the quenching of the dart leader radiation upon reaching ground reveals concurrent breakdown in the vicinity of the source region for the leader. In both instances the breakdown appears to establish channel extensions or branches that are followed by later activity of the flash. Finally, a new type of breakdown event has been identified whose electric field change and source development resemble those of an initial negative leader but which progresses horizontally through the storm. An example is shown which spawned a dart leader to ground.
Introduction
The most interesting parts of a lightning discharge occur inside the cloud where they are obscured from
• Now at Los Aimnos National Laboratories, Los Aimnos, New Mexico.
2Now at Boulder, Colorado.
Copyright 1994 by the American Geophysical Union.
Paper number 94JD00318. 0148-0227/94/94JD-00318505.00
view at optical frequencies. Clouds are transparent at radio frequencies, however, and several techniques have been developed for locating RF radiation events inside the storm. Time-of-arrival techniques have been used to locate and study lightning radiation in two and three spatial dimensions [e.g., Proctor, 1976, 1981; Taylor, 1978; Lennon, 1975; Proctor et al., 1988; Rustan et al., 1980]. These techniques work best for locating iso- lated, impulsive radiation events but produce images of lightning which tend to be spatially noisy and diffi- cult to interpret. Interferometric techniques allow the sources of nonimpulsive radiation events to be located and have continually improved as a means for study-
13,059
13,060 RHODES ET AL.: RADIO INTERFEROMETER OBSERVATIONS OF LIGHTNING
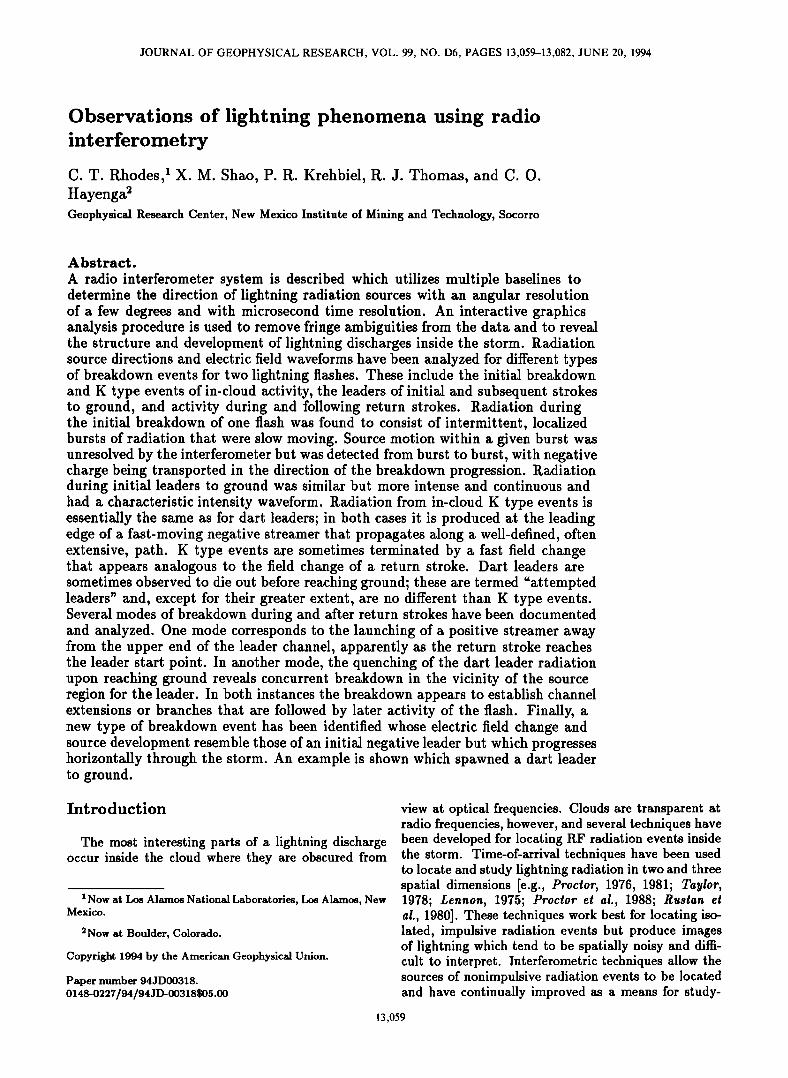
w
Figure 1. Configuration of the interferometer anten- nas. Five antennas were shared to produce short (0.SA) and long (4A) baselines in orthogonal directions.
ing discharge processes [Ha•lenga, 1979, 1984; Warwick et ai., 1979; Hayenga and Warwick, 1981; Richard and A u•ray, 1985; Richard ½t ai., 1985, 1986; Rhodes, 1989; Rhodes and Krehbiel, 1989]. Much of the energy radi- ated by lightning at radio frequencies occurs in continu- ous bursts lasting several tens or hundreds of microsec- onds or longer, which is not amenable to location by time-of-arrival techniques. Interferometric techniques allow the radiation sources to be located as a function of
time during the bursts and clearly delineate the break- down channels.
A primary difficulty of using interferometry to study lightning is that multiple-wavelength baselines are need- ed to obtain the desired angular resolution, but such baselines have fringe ambiguities that need to be re- solved. Short baseline measurements can be used to
resolve the fringe amibiguities but have substantial sys- tematic errors that adversely affect the fringe resolu- tion. The systematic errors are caused by the interac- tion between the closely spaced antennas and also by the use of a finite ground plane for the antenna array. In addition, the phase measurements used to determine the source direction have random errors because of the
stochastic nature of the radiation, which also adversely affect the ambiguity resolution. The combination of these effects complicates the analyses of interferometric observations.
In this paper we describe an interferometer developed at the New Mexico Institute of Mining and Technology for studying lightning radiation. We first discuss the interpretation of the measurements and then describe the approach used to analyze the observations. Then we present results from two lightning discharges which illustrate different types of discharge processes. The discharges which we discuss occurred over Socorro, New Mexico, during the summer of 1988.
The Interferometer System
The interferometer system used in this study mea- sured the direction of arrival of VHF radiation with
1-its time resolution and has been described in detail by Rhodes [1989]. Figure 1 shows the antenna array of the interferometer. Five antennas were configured to form long and short baselines along each of two orthog- onal directions in a horizontal plane. Antennas were shared between baselines to reduce the number of re-
ceiving systems needed. The long baselines were 4A in length and provided an accurate but ambiguous de- termination of the source direction. The short baselines
were A/2 in length and provided a coarse determination of the source direction for resolving the ambiguities of the long baseline measurements.
The interferometer operated at a center frequency of 274 MHz with a bandwidth of 6 MHz. The sig- nal received by each antenna was prefiltered, amplified, and down-converted to 60 MHz intermediate frequency, then it was further amplified and transmitted by coax- ial cable from the rooftop antenna installation to an interior room in our research building. Here the signals were limited in amplitude using constant-phase limit- ing amplifiers. Quadrature phase detectors were used to measure the phase difference d of the signals from each baseline or pair of antennas. The outputs of the phase detectors were proportional to I - A cos d and Q = A sin d, corresponding to the Cartesian compo- nents of a radial vector or phasor making an angle d with respect to the I or x axis. This will be referred to as the "I-Q" vector, which was displayed during oper- ation of the interferometer for monitor purposes. The amplitude limiting enabled the instrument to operate over a large dynamic range of input signal strength (70 dB) and made the I-Q vector have constant length for input signals larger than 3-6 dB above minimum de- tectable signal.
The I and Q signals were averaged with 1-ps running averagers to improve the accuracy of the phase estimate and were digitized at 1-ps time intervals for subsequent processing. Flash analog-to-digital converters with 7- bit resolution and 10 MHz digitizing capability were used. The resulting digital I and Q values were used as addresses to a read-only memory which performed an inverse tangent lookup operation to determine the phase difference d = tan-•(Q/I). Four phase values were thus obtained, corresponding to the short and long baselines along the orthogonal directions. Each phase value consisted of an 8-bit digital word (2 quadrant bits and 6 additional bits), in which 0 to 2•r phase difference was represented as 00-FF hexadecimal.
A separate antenna and receiver measured the am- plitude of the ttF radiation signal using a logarithmic detector, and a flat plate antenna was used to sense the electrostatic field change AE of the lightning discharge. The electric field change was sensed in the manner de- scribed by Krehbiei et ai. [1979] using a decay time con- stant of 10 s; its signal was also differentiated with a decay time of 0.1 ms and amplified by a factor of 100 to give the fast components of AE. The ttF ampli- tude and fast AE data values were digitized with 8-bit resolution in synchronization with the phase values and were combined with the phase values to form two 3-byte
RHODES ET AL.: RADIO INTERFEROMETER OBSERVATIONS OF LIGHTNING 13,061
data words per microsecond. These were recorded on a high-density digital magnetic tape recorder capable of continuous recording for 15 min between tape changes. A 1-bit serial housekeeping stream was also recorded, which contained time and the 10-s decay constant AE signal. The latter was digitized with 12-bit resolution at 20-/•s time intervals and provided the electrostatic field change of the discharge. Flashes of interest were played back at a reduced rate into a computer for analysis.
Interpretation and Analysis of the Phase Mea- surements
For plane-wave radiation arriving at an angle 0 with respect to an antenna baseline, the phase difference of the signal at the output of the long and short baselines is readily shown to be given by
2•r { a' cos0 - T,t ½os 0 - ½os 0) d- 4A- 8(A/2), (1)
where d is the antenna separation or baseline length and A is the wavelength of the received radiation. The mea- sured phase differences thus give the angle cosine, cos0, of the source direction. For a A/2 baseline , •b = '•bshort varies from +•r to --•r as the source direction varies from 0 = 0 to •r. This corresponds to one complete rotation of the I-Q vector and provides an unambiguous indica- tion of the source direction. For the 4A or long baseline, •1ong -- 8•short and varies through eight sets of 2•r, or eight "fringes", as the source direction varies from 0 - 0 to •r. The term fringe refers to incoherent interferomet- tic systems and implies the existence of maxima and minima (nulls) in the response pattern of a multiple aperture system. Such nulls do not exist in a coherent, quadrature system, but the terminology remains useful for describing the interferometer operation.
As the source direction 0 varies, the I-Q vectors ro- tate in angle, with the long baseline vector rotating 8 times faster than the corresponding short baseline vec- tor. The short and long baseline phases are therefore analogous to the hour and minute "hands" of a clock. This provides a useful analogy for understanding the interferometer operation: the short and long baselines in each direction indicate the source phase or direction in the same manner as the hour and minute hands of an
8-hour clock. In principle, the time (phase) of the clock can be determined from the hour hand (•/2 baseline) alone, but the minute hand (long baseline) provides a vernier for more accurate determination. However, the minute hand alone does not provide information about the hour (fringe).
To show how the phase values are related to the source direction, it is useful to define a normalized phase •b • = •b/•r, where •b is the accurate (short baseline) phase value that results from combining the short and long baseline phases. Defining the x axis of the coordinate system to lie along one of the baseline directions, we have from spherical trigonometry that
•b• - cos a - sin(Az) cos(El)
and, for the orthogonal (y axis) baseline,
• - cos/• - cos(Az)cos(El). (s)
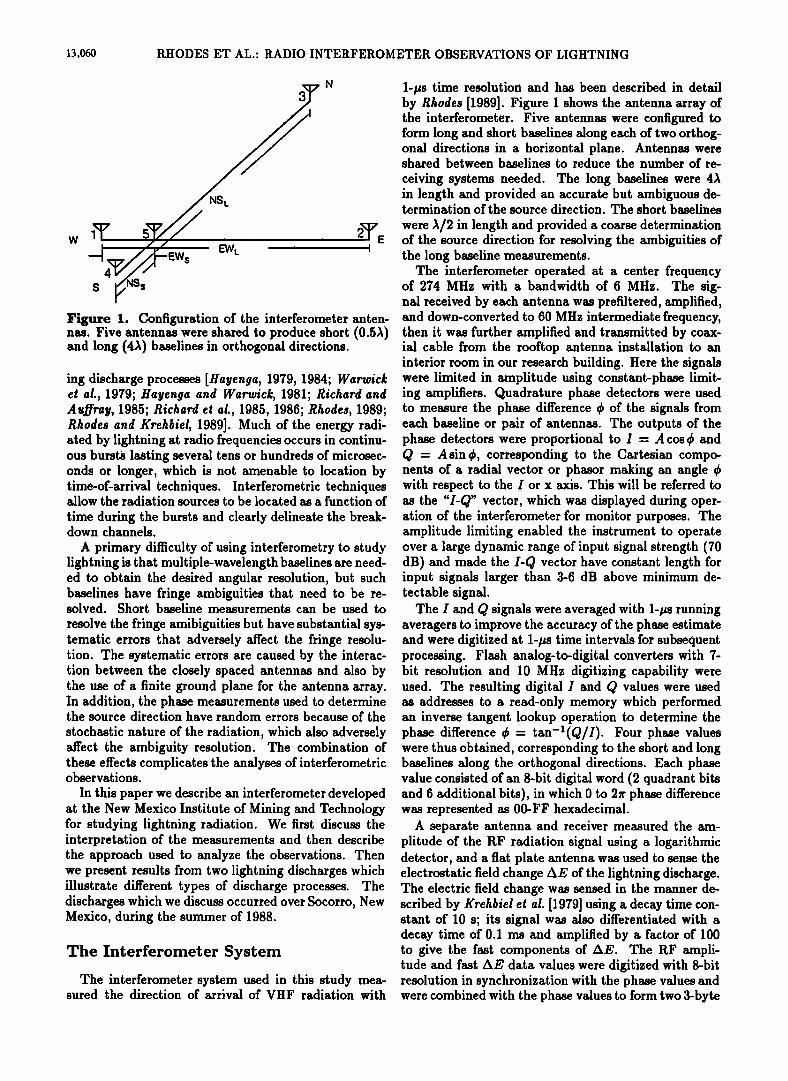
Here, a and/• are the spherical angles of arrival with respect to each baseline direction (equivalent to 0 in equation (1)) and Az and El are the azimuth and ele- vation of the source direction, respectively. The right- hand sides of (2) and (3) describe the projection of a point located at angles Az, El on a unit radius sphere onto the horizontal plane. The normalized phase values therefore correspond to such a projection.
The above result is illustrated graphically in Figure 2. The radiation sources in three-dimensional space are projected radially onto a "celestial" sphere of unit ra- dius. The normalized phase values correspond to the projection of the celestial points onto the horizontal plane, that is, the plane of the antenna array. The az- imuth and elevation angles are obtained from measured phase values by inverting equations (2) and (3), that is, by projecting the phase values upward onto the unit sphere. The circle in the phase or projection plane is termed the "unit circle" and corresponds to the horizon. The center of the phase plane/unit circle corresponds to the zenith.
Figure 2 illustrates a disadvantageous characteristic of using only horizontal baselines, namely, sources at low-elevation angles have their phase values compressed just inside the horizon circle. Errors in the phase mea- surements tend to have a constant value in the phase plane and therefore produce increasingly large elevation errors as the source elevation approaches the horizon. This effect can be important at angles as high as 300 above the horizon; sources below this elevation have their phase values compressed into an annular region between 0.77 and unity radius. Below 200 elevation the source phases are compressed between 0.94 and unity radius.
The above effect caused the interferometer of this
study to function best for discharges that were at high elevation angles, that is, at close range. For more dis- tant discharges, or at low altitude on the channel-to- ground of closer discharges, the interferometer func- tioned primarily as an azimuthal direction finder. If 100 is considered to be the lowest usefully determined elevation angle, the effective range of an interferometer for determining elevation is about 30 km for a source at 5 km altitude. The effect could be alleviated by tilting the plane of the antenna array in a preferred direction of observation or by incorporating a vertical baseline. The latter approach has been utilized by Taylor [1978] in a short baseline time-of-arrival system.
From Figure 2 it is clear that phase values outside the unit circle cannot correspond to physical sources. Receiver noise at each antenna, however, produces un- correlated phase values that are uniformly distributed over the phase plane. This turns out to provide a useful test of the interferometer operation.
13,062 RHODES ET AL.' RADIO INTERFEROMETER OBSERVATIONS OF LIGHTNING
Combining the Short and Long Baseline Phases
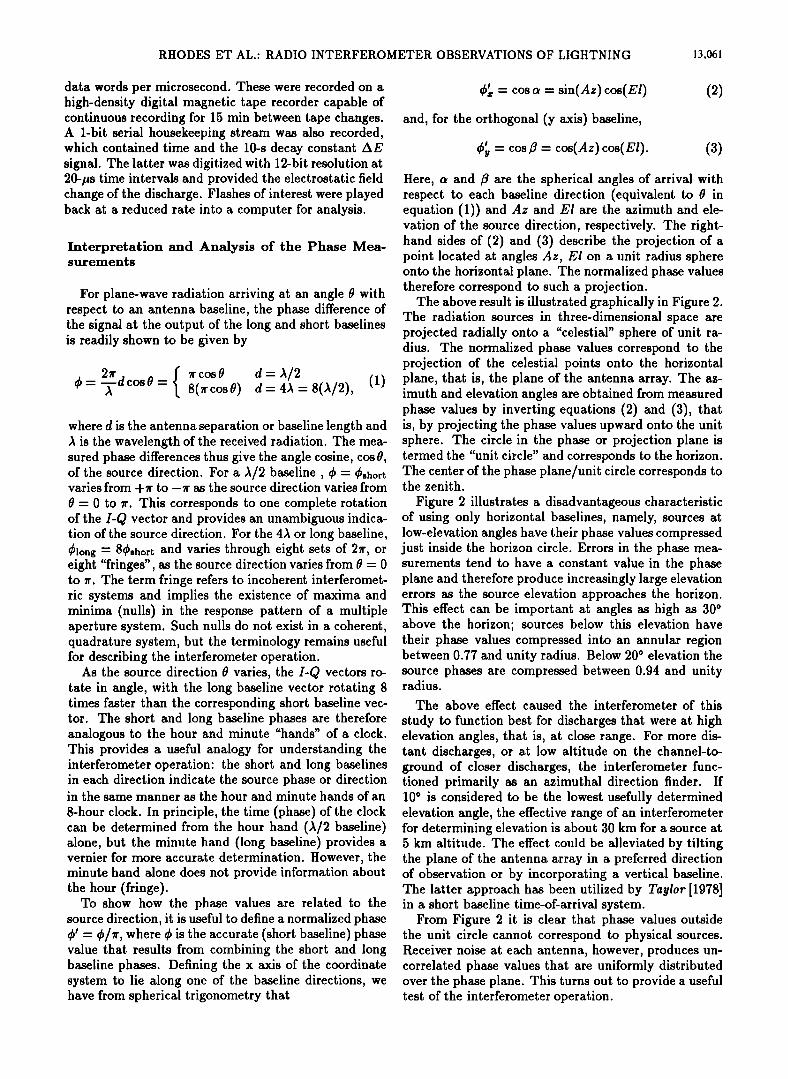
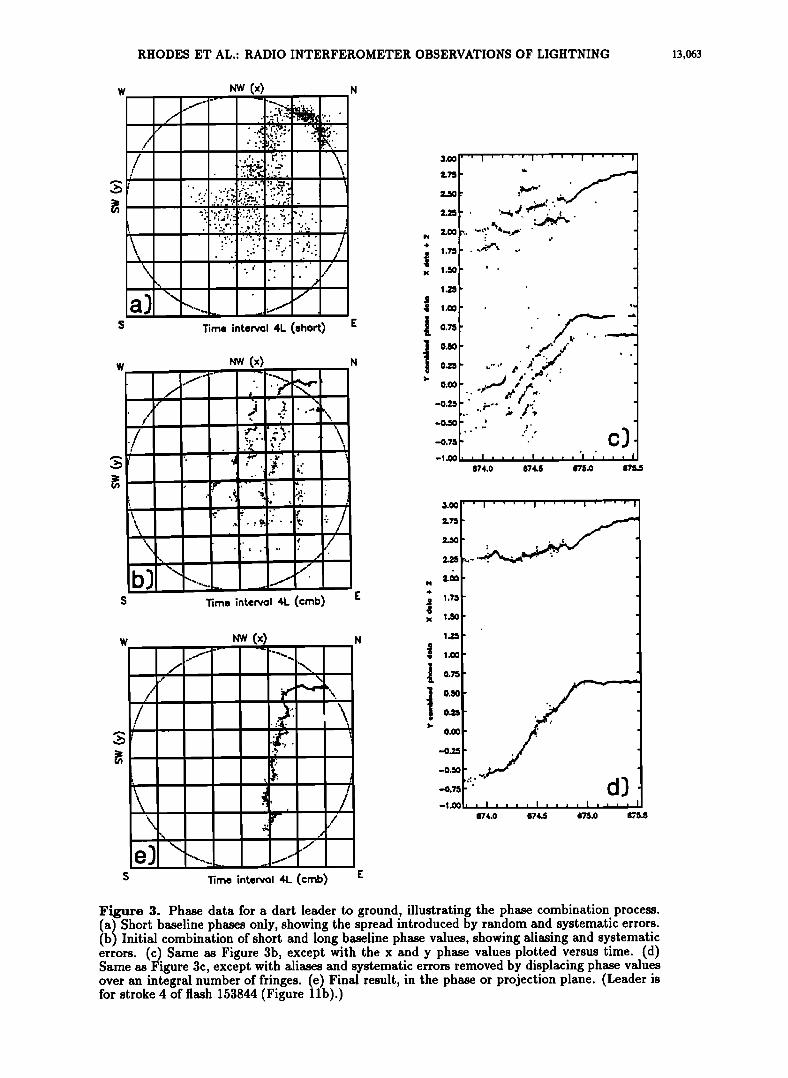
Figure 3 shows an example of observational data in the phase or projection plane which illustrates the un- certainties of the observations and the problems in- volved in combining the short and long baseline phases. In this case the radiation was produced by an extensive dart leader that started southeast of the interferome-
ter, passed nearly overhead, and went to ground to the north of the inteferometer. It progressed continuously along a well-defined path, requiring about about 1.5 ms to reach ground. As discussed above, the inscribed cir- cle corresponds to the horizon, and the center of the phase plane corresponds to the zenith. The fringe am- biguities of the long baseline system are equally spaced in the phase plane and are denoted by the 8 x 8 square grid. The long baseline data provide an accurate mea- sure of the source location within a small grid square,
and the short baseline phases are used to estimate the actual square in which the sources originated.
Figure 3a shows the short baseline phases only, while Figure 3b shows the results of using the short base- line phases to estimate the long baseline fringe. As can be seen, the large scatter in the short baseline phases causes substantial aliasing in the combined phase es- timates of Figure 3b, extending over several adjacent fringes. The aliasing is clearer when the combined phase values in each direction are plotted separately versus time, as in Figure 3c. For events whose source loca- tions vary continuously and single-valuedly with time, such as in this example, it is a relatively simple matter to computationally displace the phase values over an integral number of fringes to make them continuous as in Figure 3d. The dealiased phases can then be plot- ted in the phase plane to reveal the true nature of the streamer (Figure 3e). The result can be displaced from
Figure 2.
9O
75
6O
45
30-
15-
0 I I , ,1
0 30 60 90 120 150
AZIMUTH
Interpretation of the interferometer measurements. (a) Radiation from the three- dimensional lightning channels can be considered as originating on a unit radius celestial hemi- sphere. (b) The normalized phase measurements from orthogonal baselines correspond to the projection of the sources from the celestial hemisphere onto the plane of the antenna array. (c),(d) In turn, the phase values indicate the azimuth and elevation of the sources.
180
RHODES ET AL.' RADIO INTERFEROMETER OBSERVATIONS OF LIGHTNING 13,053
• (x) s . .
, -,., -,• :-' / ' :." •'.:':•.: ' ß
ß r:-., 'r•';.'
I .. .;:.' .:•,': :: ;:.t,, .• . .... ..:...,
ß . :': •:• f•). '..;>':-:. ß .... -..•. ...• f. .
.':., , ,,•' •.. '. :'...• ',-. ß .,.,;•,....,....:...)),. :.":.. .... ß
... ."' ......:,-... .. •,;: ß .. :., ,... -,,): I •\ '::'. "; i
\ ß ß .. /
'.':.', ...... / ß . ß
,% ' ß
a] -'•-.-. S Time interval 4L (short)
my (x) N
S Time intervol 4L (crab)
w •w (x)
S Time intervol 4L (crab)
1.7:•
1.50
1.25
1.00
0.75 o.•o
0.2.5 0.00
-0.25
-0.75
-1.00
ß
ß o• ,i o
ß ,=
ß
, , I , , , , I , , , , I , , , , I
874.0 874.5 6"75.0 175.5
3.00
2.75
2.•)
2.25
1.7:•
1.50
1.25
1.00
0.2•
0.00
-0.2•
-0.50 .
-0.75 ':", ' -l.OO I , , I I I 874.0 674,.5 S7•.0 117f•
Figure 3. Phase data for a dart leader to ground, illustrating the phase combination process.
I• I Short baseline phases only, showing the spread introduced by random and systematic errors. Initial combination of short and long baseline phase values, showing aliasing and systematic errors. (c) Same as Figure 3b, except with the x and y phase values plotted versus time. (d) Same as Figure 3c, except with aliases and systematic errors removed by displacing phase values over an integral number of fringes. (e) Final result, in the phase or projection plane. (Leader is for stroke 4 of flash 153844 (Figure 11b).)
13,064 RHODES ET AL.: RADIO INTERFEROMETER OBSERVATIONS OF LIGHTNING
its correct location by an integral number of fringes if the phase values were shifted onto a wrong fringe in Figure 3c. In the case of dart leaders, the fact that the leader propagates to the horizon (the unit circle) usually enables the streamer to be placed in the cor- rect location. Dart leaders thus provide an important framework for analyzing the remainder of a flash. Most radiation events are confined within a single fringe or progress through a couple of fringes, and are correctly located by comparison with known channels and the use of pattern recognition. When radiation is from a new channel segment, the fringe is identified from continuity considerations for the overall flash.
The above provides an interactive procedure for re- constructing a discharge from the phase observations. Although tedious and time-consuming, it has been used to produce self-consistent pictures of discharges that ap- pear to be valid. The long baseline phases are implicitly assumed to be correct. (An improved antenna config- uration, coupled with improved data processing tech- niques, has since significantly reduced the systematic errors and fringe ambiguity problem and enabled the processing to be done automatically and in real time [Shao, 19931.)
In contrast to the system of this study, Ha•tenga and Warwick [1981] utilized single, orthogonal baselines two wavelengths in extent, having a 4 x 4 fringe ambiguity grid, and resolved the fringe ambiguities from knowl- edge of the storm location and from physical consid- erations. Richard ½i al. [1986] utilized two equilateral triangular arrays: a small array having an antenna spac- ing of 1A or 0.5A and a large array of 10A spacing. The latter would have a 20 x 20 fringe ambiguity grid in an orthogonal system; the use of nonorthogonal baselines somewhat reduces the number of ambiguities.
A simple algorithm helps to identify the long base- line fringe from the short baseline data and to reduce aliasing. In a given direction, the fringe number n is es- timated to be the nearest integer n to (8•short- •ong)' The combined phase estimate is then
(•t__ (•1 "l- (•ong)/8 ß (4)
The algorithm corrects errors of up to one-half fringe in the short baseline data and is analogous to using the minute hand of a clock to correct errors of up to one-half hour in the position of the hour hand. The algorithm was used in the data of Figure 3c and significantly re- duces the aliasing that would otherwise occur.
The scatter in the short baseline phases of Figure 3a is due to both random and systematic errors. System- atic error is seen as the leader neared ground, where the short baseline phase values lie in the physically impos- sible region outside the unit circle. (This was not due to a simple offset in phase, as a continuously pulsed cal- ibration source was used to remove phase offsets.) The systematic error changed with source location or direc- tion, as evidenced by "jumping" of the dominant fringe in the plots of Figures 3b and 3c.
The systematic errors result primarily from interac- tion between the closely spaced antennas and from the effects of a finite ground plane. The effect of antenna interaction has been discussed by Richard and A uffray [1985], who used an analytical model of the interac- tion to correct the phase values. This approach has not been feasible for the antenna array used in this study. Random errors arise from a variety of effects, includ- ing the uncertainties of measuring the phase difference of stochastic signals, low signal-to-noise ratios, signal decorrelation across the array, etc. Partial analyses of the random errors have been presented by Hayenga and Warwick [1981], Richard and Auffray [1985], and Rhodes [1989]. In addition to limiting the angular res- olution of the instrument, the errors have the practical effect of substantially complicating the data analyses.
For the system of this study, Rhodes [1989] has es- timated the uncertainty of source locations due to the random phase measurement error to be about 1 ø rms at high elevation angles. The elevation error increases at lower elevation angles as 1/sin/• due to the geometric projection effect discussed above. Signal decorrelation across the antenna array also increases the phase and angle errors of the long baselines when the radiation is incident along the baseline. For the 4A baseline of this study, this increases the rms azimuth error by about x/• in the worst case.
The interferometer measurements described above lo-
cate the centroid of the lightning radiation as a func- tion of time and produce meaningful results only when the lightning radiation is relatively localized or dom- inated by a localized source. It happens that this is often the case. The high time resolution of the mea- surements helps in this regard, as does the fact that multiple sources often have substantially different ra- diation strengths. In the latter case, the phase val- ues "lock" onto the stronger source. When two spaced events of approximately equal strength are active simul- taneously, the sources have been observed to alternate between the two channel segments in response to appar- ent changes in the relative strength of the radiation from each. The single or dominant source assumption breaks down during initial leaders to ground, which radiate si- multaneously from different locations over a relatively large region in the vicinity of the leader channels. Si- multaneous multiple events could in principle be imaged using aperture synthesis techniques, but the measure- ments and processing required to do this are currently prohibitive.
Data and Results
In this section we present results obtained from the analysis of two flashes that occurred on August 23 (Day 236), 1988. The first flash was the subject of the earlier study by Rhodes [1989]. A preliminary presentation of the results has been made by Rhodes et al. [1991]. The
_ observations were made from our research building in Socorro, at an altitude of 1430 m above mean sea level.
RHODES ET AL. RADIO INTERFEROMETER OBSERVATIONS OF LIGHTNING 13,065
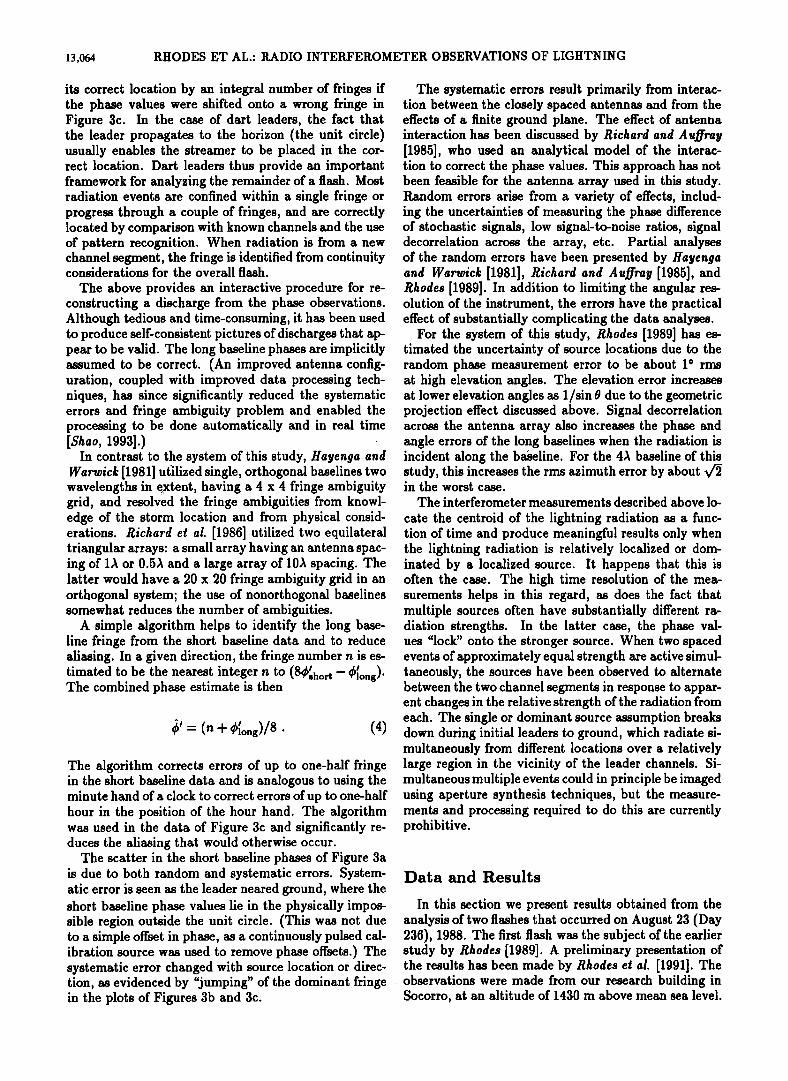
Figure 4 shows composite views of selected results for the two flashes. The source locations are shown both
in projection and in azimuth-elevation format. Overall time waveforms for the flashes are shown in Figure 5. Flash 153844 (Figures 4a and 4b and Figure 5a) lasted about 1.2 s and began with 360 ms of intracloud ac- tivity followed by 5 strokes to ground. Flash 155325 (Figures 4c and 4d and Figure 5b) lasted about 1 s and began immediately with the initial leader to ground; it produced 9 strokes down the same channel. Both discharges went to ground 5 km or more north of the interferometer site and had in-cloud channels which ex-
tended toward, overhead, and past the interferometer site. The ground strokes of both flashes were of nor- mal polarity, that is, they lowered negative charge to ground.
Cloud base for each of the flashes was between 200
and 300 elevation along the vertical part of the chan- nel to ground; the channels above this elevation were inside the storm. The discharges are seen to have been substantially branched inside the cloud. Flash 153844 (Figures 4a and 4b) began at the location denoted by the circled region and established channels A-E during the intracloud phase of the flash. The initial leader to ground began adjacent to the flash start point and established the channel followed by subsequent leaders and strokes. The second stroke required two leaders to initiate. The third stroke initiated a continuing cur- rent that originated along the D and E branches. Later strokes originated farther along the main channel to the left of the D segment.
w NW (x) N Nw (x) _N
S E S E
i i i i i 90[ I4 • D A-D 75 ..... ":;; .."" _.."-'• ß L-'• • - .•.• .•r•l•.' .'. .-: ' ß '",
60 P5 15 • .•:;r '• ' ••'•'• • 2 .,... .,.. ,I4
• 30
15: Flash 153844 J1 • •0 • • 220 2• 290 32• 0
AZIMUTH
go 150 210 270 330 30 go
AZIMUTH
Figure 4. Composite results for flash 153844 in both (a) the projection plane and (b) azimuth- elevation format, showing channels traversed by the preliminary intracloud activity (events A- E), the dart leaders for strokes 3, 4, and 5, and several K streamers in the interstroke intervals following strokes 4 and 5 (I4 and I5). (c), (d) Similar results for flash 155325, showing the dart leaders for strokes 3, 4, 7, 8, and 9, and several interstroke K streamers following strokes 8 and 9 (I8 and I9). Circles indicate the flash starting points.
13,066 RHODES ET AL.: RADIO INTERFEROMETER OBSERVATIONS OF LIGHTNING
-lOOO
-1500
-2OOO
-25OO
,,,
i ,
ß
: AL2
ALl
IL i i I , , , l
5OO
A. Flash 153844
1000
- T T T -1' 234
1 .
i i i
0
ic
T t t T B. Flash 155325 -
i I , , , I , , , ! , , i I l
200 400 600 800
Time from Beginning of Flash. ms
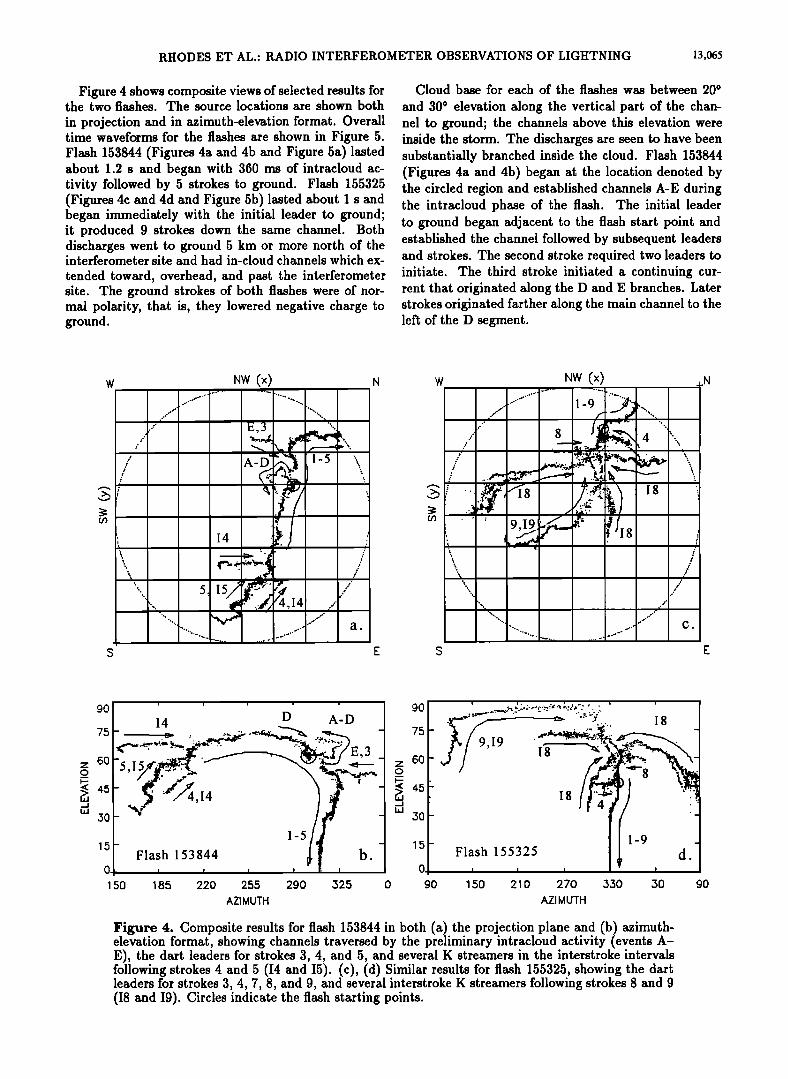
Figure 5. (a) Overall electric field change of flash 153844, showing the time of occurrence of individual strokes (1-5), events of note during the preliminary intracloud activity (A-D), the initial leader (IL) and attempted leaders (ALl and AL2), and a short continuing current (CC). (b) Same as Figure 6a except for flash 155325, showing the stroke times, the hybrid breakdown event (IC) which initiated the sixth stroke, and the start of a long continuing current.
Flash 155325 (Figures 4c and 4d) produced nine strokes to ground and had a complex structure inside the cloud. Most of the branches were established by intracloud activity late in the flash, after the eighth stroke to ground. The flash started with the initial leader at the circled location in the figures. The leaders for strokes 4 and 8 traveled into the main channel to
ground along the short branches near the main chan- nel. The three branches labeled 18 in the figure were traversed only by interstroke activity and K events fol- lowing the eighth stroke. The long left-most branch was traversed both by the leader for the ninth stroke and by K events subsequent to the ninth stroke. It ex- tended overhead and past the interferometer site; hence its high elevation angle between 210 ø and 270 ø azimuth. The branches appear to have extended horizontally in different directions away from the channel to ground, causing the elevation angle of some of the branches to decrease with increasing distance from the interferome- ter.
The electric field change measurements in Figure 5 were made on the roof our research building and were not calibrated for this study. However, from a previous study the total electric field change of similar flashes in storms in the same area was typically 2.0 x 10⁴ V/m [Krehbiel et aL, 1979], within about 10%. Assuming this to be the maximum field change of the flashes in Figure 5 (both of which have about the same total am-
plitude), we estimate that 100 AE units corresponded approximately to 1.0 kV/m electric field change. (This applies to all figures.) The fast AE signal was a factor of 12.5 more sensitive; that is, 100 fast AE units cor- responded to about 80 V/m electric field change. The radiation intensity ("log RF") of later figures is also pre- sented in arbitrary units; for this signal, 24 units corre- sponded to 10 dB intensity change. The minimum de- tectable intensity at the receiving antenna (correspond- ing to a log RF value of about 5 units) was-100 dBm m-2 MHz-•.
Initial Breakdown
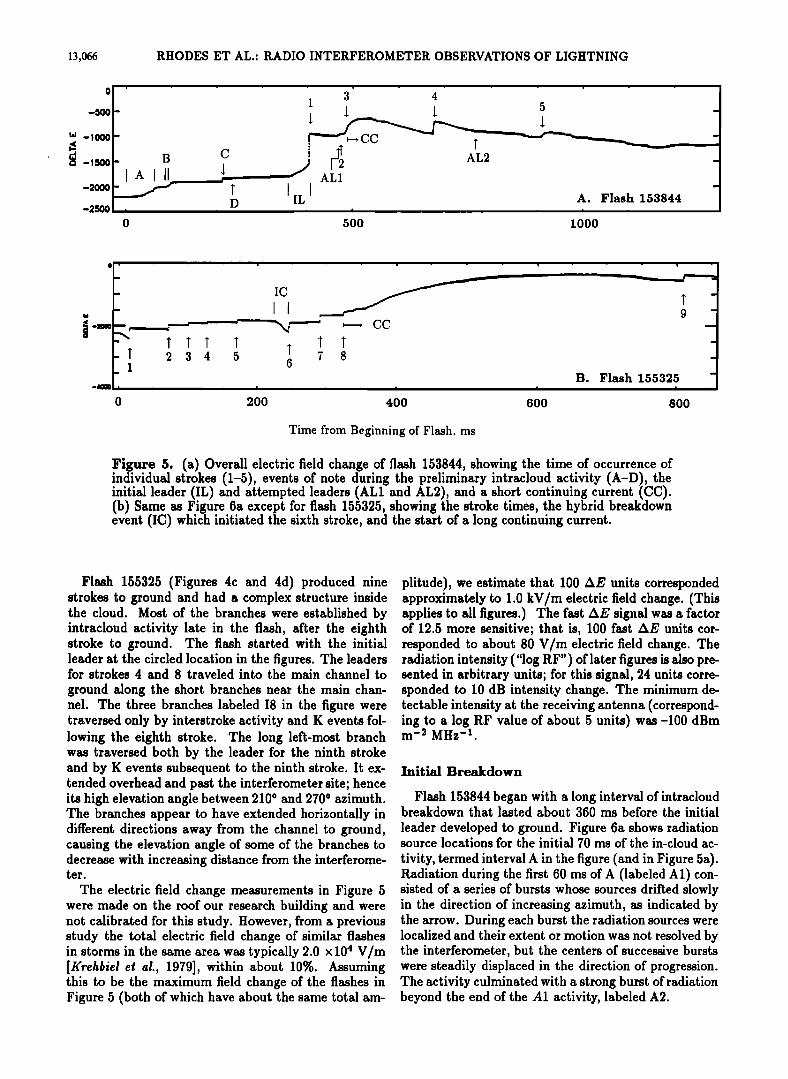
Flash 153844 began with a long interval of intracloud breakdown that lasted about 360 ms before the initial
leader developed to ground. Figure 6a shows radiation source locations for the initial 70 ms of the in-cloud •c-
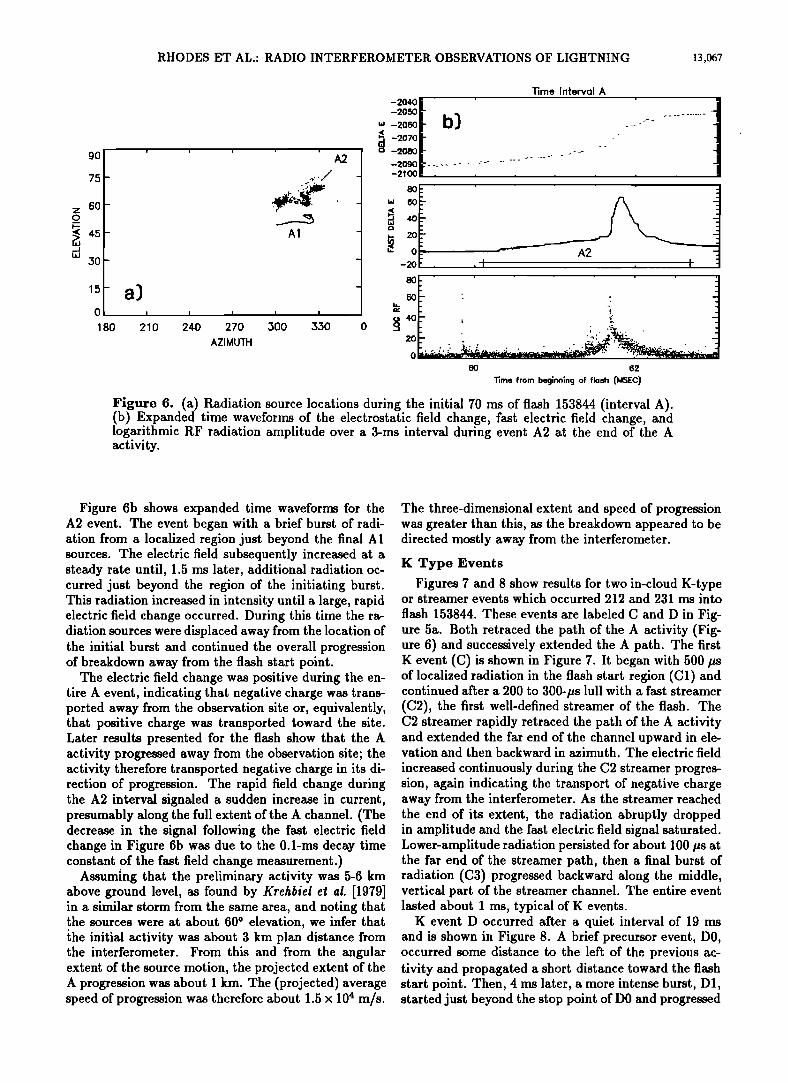
tivity, termed interval A in the figure (and in Figure 5a). Radiation during the first 60 ms of A (labeled A1) con- sisted of a series of bursts whose sources drifted slowly in the direction of increasing azimuth, as indicated by the arrow. During each burst the radiation sources were localized and their extent or motion was not resolved by the interferometer, but the centers of successive bursts were steadily displaced in the direction of progression. The activity culminated with a strong burst of radiation beyond the end of the A1 activity, labeled A2.
RHODES ET AL' RADIO INTERFEROMETER OBSERVATIONS OF LIGHTNING 13,067
go
75-
60-
4.5- 50-
15-
O•
180
a)
^l
I I I I I
210 24.0 270 300 330 0
AZIMUTH
Time interval A -2040 -2050
-2070 ß
....
-2080 ............
-20go .......... ' ......... - ." .... ' '" ...... • ............................ - ,
- I
20
6O 62
Time from beginning of flash (MSEC)
Figure 6. (a) Radiation source locations during the initial 70 ms of flash 153844 (interval A). (b) Expanded time waveforms of the electrostatic field change, fast electric field change, and logarithmic RF radiation amplitude over a 3-ms interval during event A2 at the end of the A activity.
Figure 6b shows expanded time waveforms for the A2 event. The event began with a brief burst of radi- ation from a localized region just beyond the final A1 sources. The electric field subsequently increaSed at a steady rate until, 1.5 ms later, additional radiation oc- curred just beyond the region of the initiating burst. This radiation increased in intensity until a large, rapid electric field change occurred. During this time the ra- diation sources were displaced away from the location of the initial burst and continued the overall progression of breakdown away from the flash start point.
The electric field change was positive during the en- tire A event, indicating that negative charge was trans- ported away from the observation site or, equivalently, that positive charge was transported toward the site. Later results presented for the flash show that the A activity progressed away from the observation site; the activity therefore transported negative charge in its di- rection of progression. The rapid field change during the A2 interval signaled a sudden increase in current, presumably along the full extent of the A channel. (The decrease in the signal following the fast electric field change in Figure 6b was due to the 0.1-ms decay time constant of the fast field change measurement.)
Assuming that the preliminary activity was 5-6 km above ground level, as found by Krehbiel et al. [1979] in a similar storm from the same area, and noting that the sources were at about 600 elevation, we infer that the initial activity was about 3 km plan distance from the interferometer. From this and from the angular extent of the source motion, the projected extent of the A progression was about 1 km. The (projected) average speed of progression was therefore about 1.5 x 10⁴ m/s.
The three-dimensional extent and speed of progression was greater than this, as the breakdown appeared to be directed mostly away from the interferometer.
K Type Events
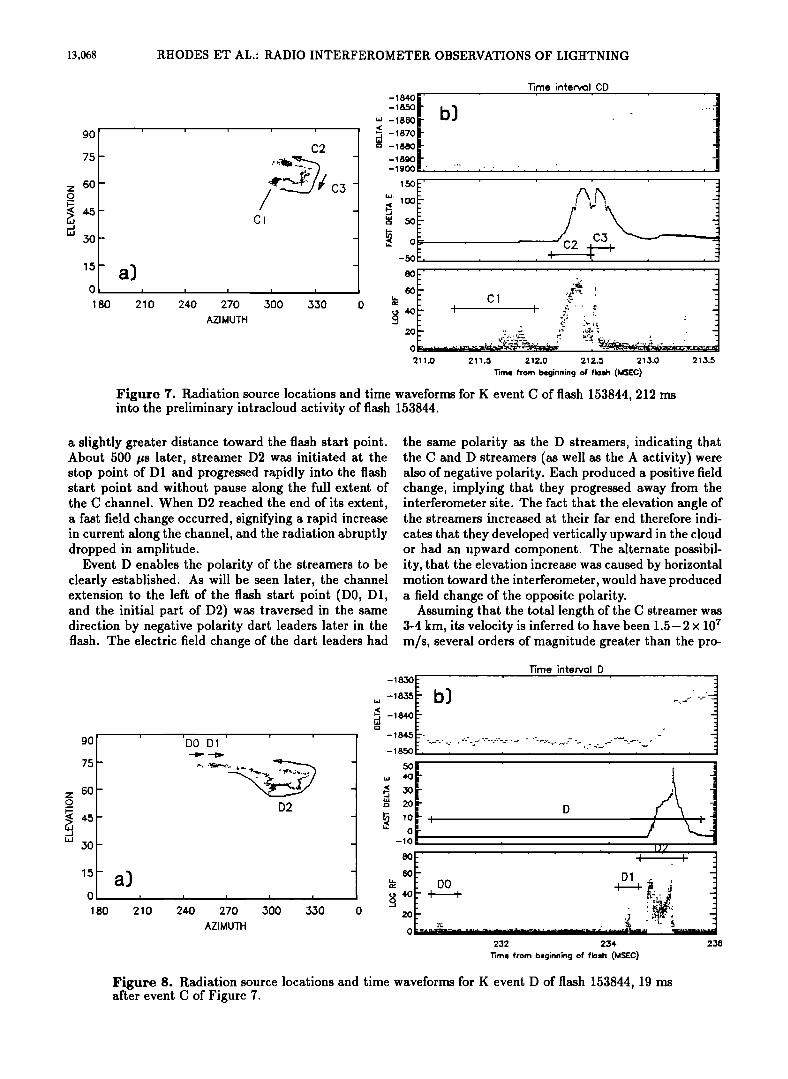
Figures 7 and 8 show results for two in-cloud K-type or streamer events which occurred 212 and 231 ms into
flash 153844. These events are labeled C and D in Fig- ure 5a. Both retraced the path of the A activity (Fig- ure 6) and successively extended the A path. The first K event (C) is shown in Figure 7. It began with 500/•s of localized radiation in the flash start region (C1) and continued after a 200 to 300-/•s lull with a fast streamer (C2), the first well-defined streamer of the flash. The C2 streamer rapidly retraced the path of the A activity and extended the far end of the channel upward in ele- vation and then backward in azimuth. The electric field
increased continuously during the C2 streamer progres- sion, again indicating the transport of negative charge away from the interferometer. As the streamer reached the end of its extent, the radiation abruptly dropped in amplitude and the fast electric field signal saturated. Lower-amplitude radiation persisted for about 100/•s at the far end of the streamer path, then a final burst of radiation (C3) progressed backward along the middle, vertical part of the streamer channel. The entire event lasted about I ms, typical of K events.
K event D occurred after a quiet interval of 19 ms and is shown in Figure 8. A brief precursor event, DO, occurred some distance to the left of the previous ac- tivity and propagated a short distance toward the flash start point. Then, 4 ms later, a more intense burst, D1, started just beyond the stop point of DO and progressed
13,068 RHODES ET AL' RADIO INTERFEROMETER OBSERVATIONS OF LIGHTNING
9O
75-
60-
4.5- 30-
15-
O•
180
a]
210
C2
--
I I I, I
24-0 270 ,300 3,30 0
AZIMUTH
Time inter•l CD -1840
ß
'" -1860 .....
• - 1870 -" c• -1880 .
-189o ...' -1900 ...... ' ............. ß .............. --.' ' .......
150
-50
C3
• c1 ß :-•..: :'.
211.0 211.5 212.0 212.5 213.0 213.5
'11me from beginnl. 9 of fl•sh (M$œC)
Figure 7. Radiation source locations and time waveforms for K event C of flash 153844, 212 ms into the preliminary intracloud activity of flash 153844.
a slightly greater distance toward the flash start point. About 500 /•s later, streamer D2 was initiated at the stop point of D1 and progressed rapidly into the flash start point and without pause along the full extent of the C channel. When D2 reached the end of its extent, a fast field change occurred, signifying a rapid increase in current along the channel, and the radiation abruptly dropped in amplitude.
Event D enables the polarity of the streamers to be clearly established. As will be seen later, the channel extension to the left of the flash start point (DO, D1, and the initial part of D2) was traversed in the same direction by negative polarity dart leaders later in the flash. The electric field change of the dart leaders had
the same polarity as the D streamers, indicating that the C and D streamers (as well as the A activity) were also of negative polarity. Each produced a positive field change, implying that they progressed away from the interferometer site. The fact that the elevation angle of the streamers increased at their far end therefore indi-
cates that they developed vertically upward in the cloud or had an upward component. The alternate possibil- ity, that the elevation increase was caused by horizontal motion toward the interferometer, would have produced a field change of the opposite polarity.
Assuming that the total length of the C streamer was 3-4 km, its velocity is inferred to have been 1.5-2 x 10 ? m/s, several orders of magnitude greater than the pro-
90
75
z 60 o
50
15
0
180
- a)
210
, I ! ,
DO 01
D2
I , I , I I
2½0 270 300 330
AZIMUTH
-1845
-1850
5o
lO o
-lO
Time intervol O
,
232 2,34 236
Time from beginning of fl<3•h (MSEC)
Figure 8. Radiation source locations and time waveforms for K event D of flash 153844, 19 ms after event C of Figure 7.
RHODES ET AL.: RADIO INTERFEROMETER OBSERVATIONS OF LIGHTNING 13,069
gression speed of the initial A activity. The D streamer propagated over approximately twice the distance of the C streamer in about twice the time (500/•s), giving a similar speed estimate.
Event D is significant for another reason. A careful analysis of the observations indicates that radiation was not detected prior to the D activity along the channel extension established by DO, D1, and the initial part of D2. Thus the channel appeared to be extended by breakdown which began at a distance from previously detected activity, and the resulting streamer was fast even though no prior radiation was detected along the first half of its path. It is also significant that two precursor events were required to initiate the final D streamer. Each is presumed to have enhanced the local electric stress for the subsequent event.
Initial Leader and Return Stroke
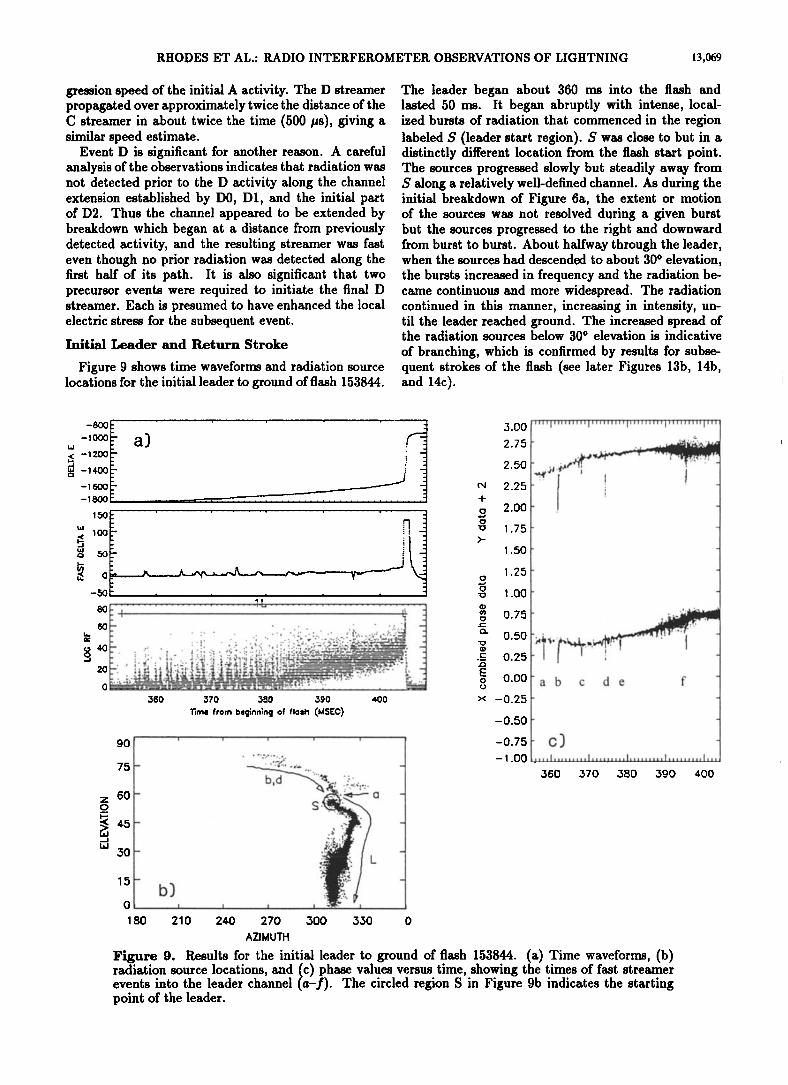
Figure 9 shows time waveforms and radiation source locations for the initial leader to ground of flash 153844.
The leader began about 360 ms into the flash and lasted 50 ms. It began abruptly with intense, local- ized bursts of radiation that commenced in the region labeled $ (leader start region). $ was close to but in a distinctly different location from the flash start point. The sources progressed slowly but steadily away from $ along a relatively well-defined channel. As during the initial breakdown of Figure 63, the extent or motion of the sources was not resolved during a given burst but the sources progressed to the right and downward from burst to burst. About halfway through the leader, when the sources had descended to about 30 ø elevation, the bursts increased in frequency and the radiation be- came continuous and more widespread. The radiation continued in this manner, increasing in intensity, un- til the leader reached ground. The increased spread of the radiation sources below 30 ø elevation is indicative
of branching, which is confirmed by results for subse- quent strokes of the flash (see later Figures 13b, 14b, and 14c).
-1600
-1,500 h ..
150
360 370 3BO ,390 400
Time from beginning of flash (MSEC)
90
75
z 60
15 b)
3.00
2.75
2.50
2.25
2.00
1.75
1.50
1.25
1.00
0.75
0.50
0.25
0.00
-0.25
-0.50
-0.75
- 1.00
I ' -
a b c de f -
.... I ......... I ......... I ......... I ......... I,,,
360 370 380 390 400
1 80 210 240 270 300 330 0
AZIMUTH
Figure 9. Results for the initial leader to ground of flash 153844. (a) Time waveforms, (b) radiation source locations, and (c) phase values versus time, showing the times of fast streamer events into the leader channel (a-f). The circled region S in Figure 9b indicates the starting point of the leader.
13,070 RHODES ET AL.' RADIO INTERFEROMETER OBSERVATIONS OF LIGHTNING
An interesting finding is that several fast streamers occurred during the initial leader. Three of these are shown in Figure 9b, labeled a, b, and d. Each began beyond the starting point of the leader and progressed rapidly into the start region along one of two branches that were established during the preceding intracloud activity. (We refer to these as the left and right branches of the flash (see Figure 4b)). The streamers occurred mostly during the first half of the leader (Figure 9c). They transported negative charge into the developing leader and undoubtedly aide it continued development.
The leader traveled an estimated 5 to 8-km distance
in 50 ms, • corresponding to an average speed of progres- sion of about 1-1.6 x 10⁵ m/s, typical of initial leaders. Although initial leaders propagate in a stepwise manner to ground, no evidence of stepping could be detected in the 1-#s sampled radiation or electric field data. At the close range of the flash, the electric field change is dominated by the electrostatic component, whereas the
radiation component is most useful in detecting stepped breakdown. Thus it cannot be determined if the leader
began with the characteristic stepping of initial leaders or if stepping developed at a later stage of the leader. The radiation amplitude signal in Figure 9a had a char- acteristic waveform that is typical of initial leaders, in which the radiation was intermittent during the first half of the leader and became continuous and increased
in amplitude as the leader progressed [e.g., Rhodes and Krehbiel, 1989].
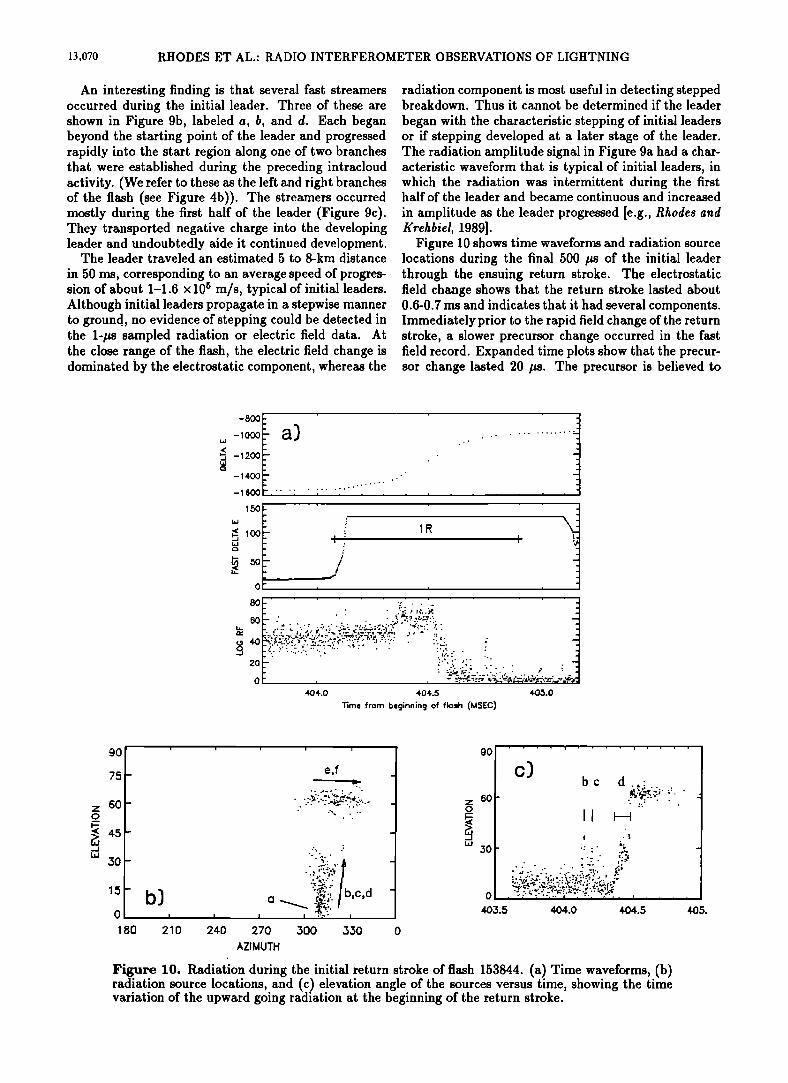
Figure 10 shows time waveforms and radiation source locations during the final 500 #s of the initial leader through the ensuing return stroke. The electrostatic field change shows that the return stroke lasted about 0.6-0.7 ms and indicates that it had several components. Immediately prior to the rapid field change of the return stroke, a slower precursor change occurred in the fast field record. Expanded time plots show that the precur- sor change lasted 20 ps. The precursor is believed to
• 1R
!
o•-, --
•0..' . '.' ß .' ½ :-'. "'. '.?.::.:-7:. • ,...'. ;. ',': .'.-'-'..7 .:::;.:..:'"--.'•.;.•.:-.:'.? -"'-'-'-'•. -'- '.
' ".' '::!<::t i..-:.- .
404.0 404.5 405.0
Time from beginning of
9O
75
7 60 o
•o
0 I
180
b)
210
e,f
ß
ß
I I I -';-' I
2½0 270 500 550 0
AZIMUTH
9O
z 6o
o
405.5
bc d.,..
.. ..
II ß
ß .' .. ß . ...
' .: .. .'. . .o
:,, .;.•:;':.:,z...,;, ,.:'-. :'-:•:.:-,'7'; '..' :; -42. •.•,• .-.-. ,7- ?- .e' ;•'; :,- . .•,...•.,, .•....,, . . ,•. ß ß .,' ...;..*' .... •--•: .:..<.....•'.. ,• .,•
i
4O4.0 404.5
Figure 10. Radiation during the initial return stroke of flash 153844. (a) Time waveforms, (b) radiation source locations, and (c) elevation angle of the sources versus time, showing the time variation of the upward going radiation at the beginning of the return stroke.
RHODES ET AL.: RADIO INTERFEROMETER OBSERVATIONS OF LIGHTNING 13,071
have been caused by an upward moving streamer from the ground that completed the connection to ground. The ensuing return stroke quickly saturated the fast field change signal but, as seen on the less-sensitive electrostatic record, initially produced a relatively small electrostatic field change. The return stroke field change intensified 200/•s later, coincident with a noticeable in- crease in the radiation intensity.
At the beginning of the return stroke the amplitude of the radiation did not change significantly from that of the leader. The radiation source locations during the first part of the return stroke indicate that a sequence of two events (b and c) traveled up along the lower part of the channel. These are seen between 404.1 and 404.2
ms in the elevation-time plot of Figure 10c and corre- sponded to the smaller-amplitude initial return stroke. The more intense stroke occurred just after 404.3 ms and was accompanied by stronger radiation that moved rapidly up the lower part of the channel (d). The radia-
tion moved up to about 300 elevation, or several kilome- ters distance, in about 100 ps, corresponding to a speed of about 3 x 10⁷ m/s. (Upward events b and c were faster than this, on the order of l0 s m/s.) Subsequently, the radiation abruptly switched to higher elevation and pro- greased to the right along the right-hand feeder channel of the leader (e and j•). No radiation was detected along the upper half of the leader channel. The concentrated sources labeled a at the bottom of the channel in Figure 10b were produced during the final part of the leader. No source motion could be detected during the 20-/•s connection event.
Dart Leaders and Return Strokes
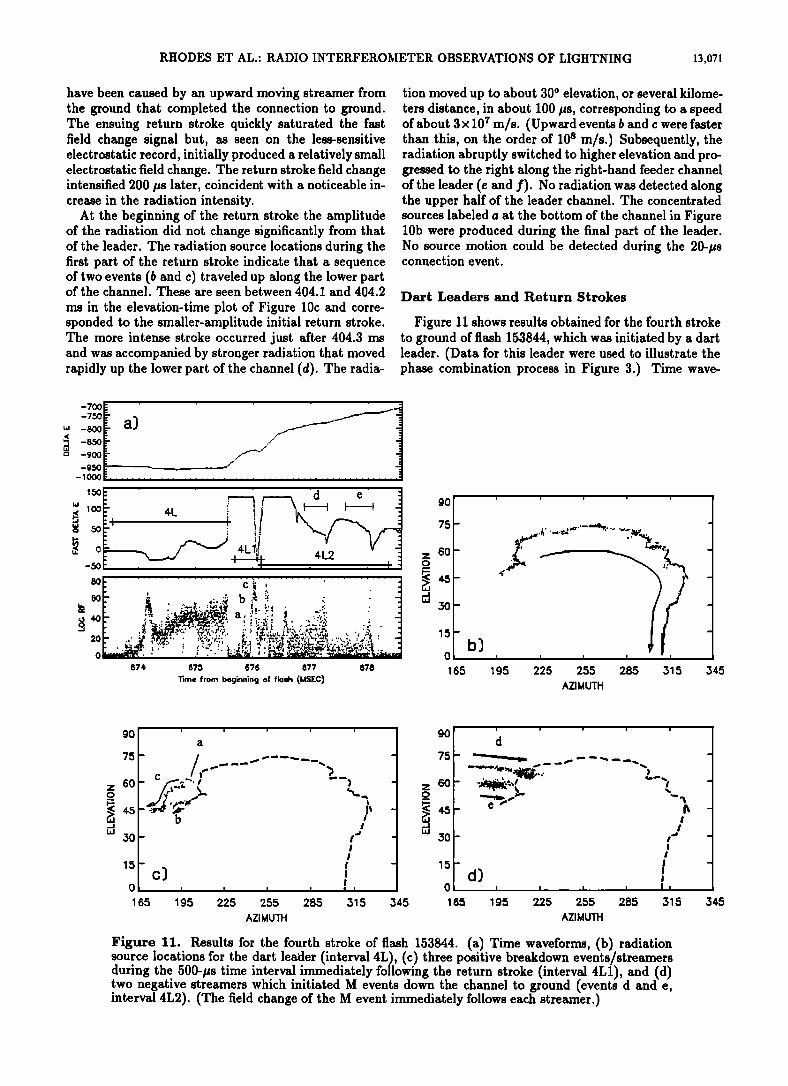
Figure 11 shows results obtained for the fourth stroke to ground of flash 153844, which was initiated by a dart leader. (Data for this leader were used to illustrate the phase combination process in Figure 3.) Time wave-
• I: ,• :.. Z-"•.'i,./.4•'•':• ,, .•. ':;; ; ..."!. : :1 •- ,'.', :.....'•?•.z.i•.•[,'• a, ß. ., ,• :-"'- -I
,•' :.;r..' •""g •"-•' '-'- •' ß: •' '; '*' ---."• , ß • -'• ' 1, ß .•'--"'•,,'%.'.'.'.'.'.'.'.-• "";. •-". • ' •' •"-' ' ."; ß " '•'.•. • •. ,•::..,"•, .:...-..,,-.. •.... .... :,• ...... :..•.-' .: ß ß .. ,.•.•.. ß .% ..• ... . .. •. • t,,. •. .• ß .•. . .. , ß . •.'1' ß ß •.":.• ß .. ,• $ .%,..•. •. :._ .., • ..•. .... . : :, . 2or-- :.-, •. .-,,, ,... ..... C.-.=...• ..... .• .... ß ........ ..., ß '..1' :t. ..". . .'.... ß :'. ß .. . ",',• - ..•-•.. ,- ,..:.':.•r .. . .. ,'•' . ß .. . •..½.. . . . .. r•r.• • . :,•. • o•...•.•...•.•...o ......,,......
674 675 676 677 678
Time from beginning of flash (MSEC)
o
5
0-
5
5
165
b) I I I , I
195 225 255 285 315
AZIMUTH
345
z 60 c ..s':;: '(
t,,j 30
c) 0 I I I
1 65 195 225 255
AZIMUTH
I
I I I - I !
285 315 345
90'
75-
z 60- o
30-
15-
O•
165
t '
B - t
t
t • - I d)
I I I I I I
195 225 255 285 315
AZIMUTH
Figure 11. Results for the fourth stroke of flash 153844. (a) Time waveforms, (b) radiation source locations for the dart leader (interval 4L), (c) three positive breakdown events/streamers during the 500-•s time interval immediately following the return stroke (interval 4L1), and (d) two negative streamers which initiated M events down the channel to ground (events d and e, interval 4L2). (The field change of the M event immediately follows each streamer.)
345
13,072 RHODES ................ FEROMETER OBSERVATIONS OF LIGHTNING
forms over a 5-ms time interval from the beginning of the leader through the resulting return stroke are shown in Figure 11a. The dart leader, shown in Figure 11b, radiated strongly at its advancing tip and progressed continuously along a well-defined path to ground. The leader required 1.7 ms to reach ground and propagated over a substantial horizontal distance within the cloud
before turning vertically downward. The final third of the leader was along the path of the initial stroke. The leader began south of the interferometer and prop- agated overhead and to the north, reaching a maxi- mum elevation of 75 ø while passing overhead. When the leader sources reached 0 ø elevation, a fast electric field change occurred indicating the onset of the return stroke, and the radiation abruptly dropped in ampli- tude. The return stroke saturated the fast field signal but not the electrostatic field change.
Little or no radiation was produced by the return stroke until 200 ps into the stroke, when the first of three radiation bursts occurred, each more intense than the previous (interval 4L1 in Figure 11b). The bursts originated just beyond the initiation point of the dart leader, as shown in Figure 11c. Bursts b and c were pro- duced by fast streamers that progressed away from the far end of the dart leader along two separate channels or branches. Burst a was localized at the start point of c. Burst c produced a strong negative field change which brought the fast electric field signal temporarily out of saturation. This and the fact that c propagated in the opposite direction from the leader (away from the ob- servation site) indicate that it was a positive streamer. Although the fast electric field signal did not come out of saturation during b, the fact that it propagated away from the leader indicates that it also was a positive streamer. The time delay of the events after the onset of the return stroke indicates that they were associated with the arrival of the return stroke back in the source
region of the dart leader. Careful analysis has shown that no radiation occurred along the b or c branches prior to the occurrence of the leader. This suggests that their channels were formed by the postive stream- ers. As we later show, the a-c branch was traversed by the final stroke of the flash.
Figure 11d shows radiation source locations for the remainder of the stroke (interval 4L2 in Figure 11b). For about 2 ms following the 4L1 bursts, several nega- tive streamers progressed along two other branches that connected into the channel of the dart leader and return
stroke. These branches had been active during the in- terstroke interval between the third and fourth strokes.
The last two streamers are labeled d and e in the figure and initiated fast electric field changes that are charac- teristic of "M" components, that is, enhanced current or charge flow down the channel to ground. The M field changes were initiated when each of the streamers ap- peared to reach the leader channel, at which point the radiation amplitude abruptly dropped. The ensuing M field changes were initially negative and then positive, indicating that negative charge initially approached and then receded from the interferometer site, consistent
with the fact that the channel passed over the inter- ferometer. The continued positive fast field change in- dicates that the charge went all the way to ground and was part of a short continuing current. The fact that no radiation was detected along the main channel dur- ing the return stroke or during the M events is typical of conducting channels and illustrates that radio fre- quency radiation is produced by the breakdown of new or decayed channels rather than by current flow along already conducting channels.
The total length of the fourth stroke leader is esti- mated to have been about 20 km, corresponding to an average speed of about 1-1.5 x 10 ? m/s. This is simi- lar to the K streamer speeds during preliminary break- down. The quiet period following the onset of the return stroke lasted 200 ps; assuming this to be the time re- quired for the return stroke to arrive back in the leader source region, the average speed of the return stroke was about I x 10 s m/s.
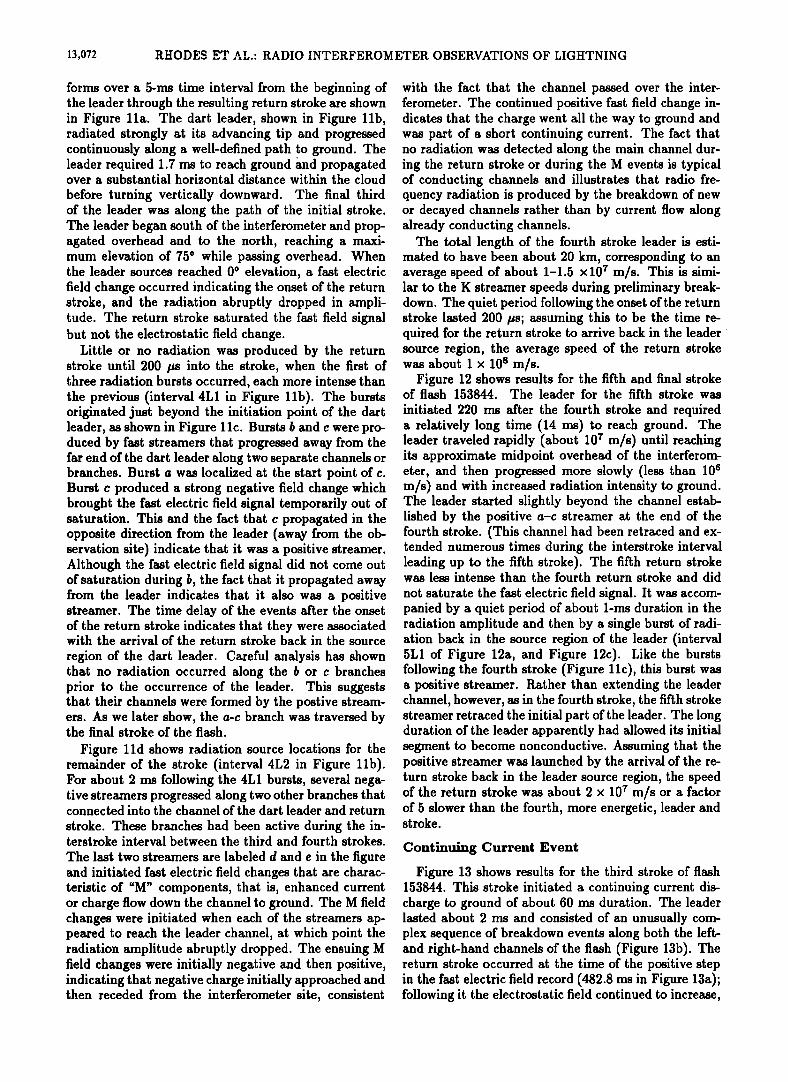
Figure 12 shows results for the fifth and final stroke of flash 153844. The leader for the fifth stroke was
initiated 220 ms after the fourth stroke and required a relatively long time (14 ms) to reach ground. The leader traveled rapidly (about 10 ? m/s) until reaching its approximate midpoint overhead of the interferom- eter, and then progressed more slowly (less than 106 m/s) and with increased radiation intensity to ground. The leader started slightly beyond the channel estab- lished by the positive a-c streamer at the end of the fourth stroke. (This channel had been retraced and ex- tended numerous times during the interstroke interval leading up to the fifth stroke). The fifth return stroke was less intense than the fourth return stroke and did
not saturate the fast electric field signal. It was accom- panied by a quiet period of about 1-ms duration in the radiation amplitude and then by a single burst of radi- ation back in the source region of the leader (interval 5L1 of Figure 12a, and Figure 12c). Like the bursts following the fourth stroke (Figure 11c), this burst was a positive streamer. Rather than extending the leader channel, however, as in the fourth stroke, the fifth stroke streamer retraced the initial part of the leader. The long duration of the leader apparently had allowed its initial segment to become nonconductive. Assuming that the positive streamer was launched by the arrival of the re- turn stroke back in the leader source region, the speed of the return stroke was about 2 x 10 ? m/s or a factor of 5 slower than the fourth, more energetic, leader and stroke.
Continuing Current Event
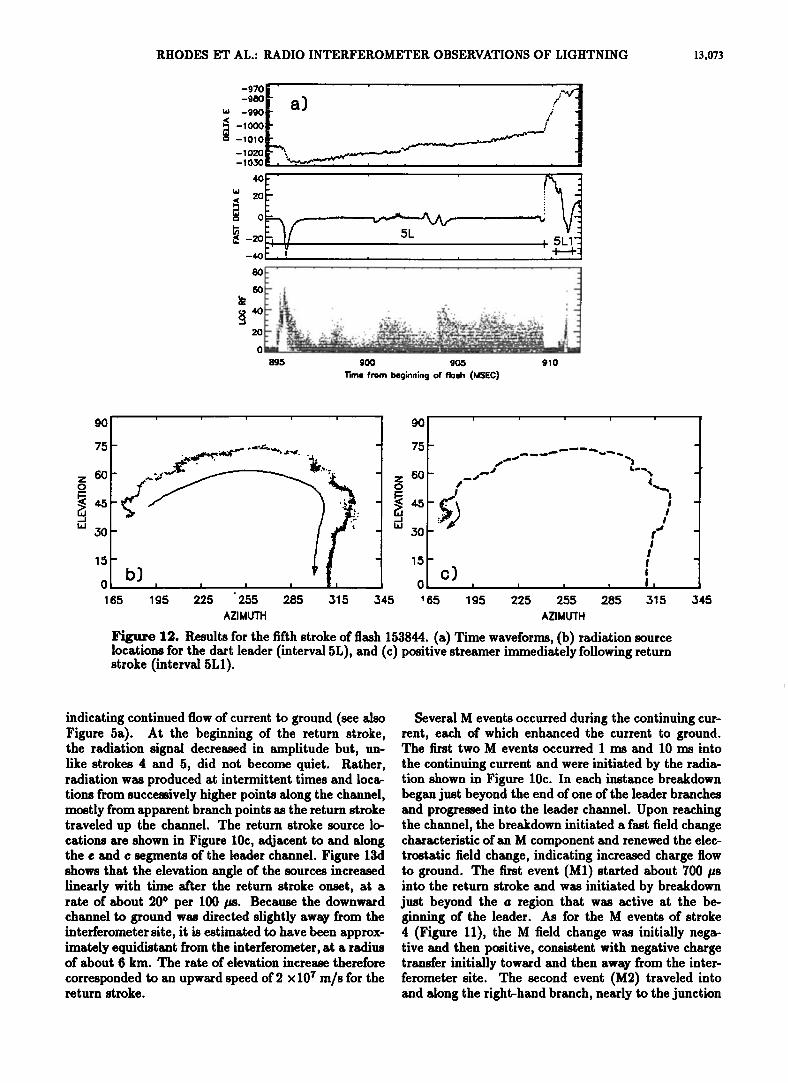
Figure 13 shows results for the third stroke of flash 153844. This stroke initiated a continuing current dis- charge to ground of about 60 ms duration. The leader lasted about 2 ms and consisted of an unusually com- plex sequence of breakdown events along both the left- and right-hand channels of the flash (Figure 13b). The return stroke occurred at the time of the positive step in the fast electric field record (482.8 ms in Figure 13a); following it the electrostatic field continued to increase,
RHODES ET AL.: RADIO INTERFEROMETER OBSERVATIONS OF LIGHTNING •3,o73
-970 • '
-980[ '.' a)
b.i -- 1010 •,.• - 1 o2o •- ", -10,.•3 •= . •""r',--"-"','• , ' .............
• zo c• 0
• -zo 5L
9O
75
z 6O
15
o
165 345
b) i i i
.
195 225 255 285 315
AZIMUTH
90
75
60
,,-4, 30 15
0
•65
I I I I
195 225 255 285
AZIMUTH
I
I
1
515 345
Figure 12. Results for the fifth stroke of flash 153844. (a) Time waveforms, (b) radiation source locations for the dart leader (interval 5L), and (c) positive streamer immediately following return stroke (interval 5L1).
indicating continued flow of current to ground (see also Figure 5a). At the beginning of the return stroke, the radiation signal decreased in amplitude but, un- like strokes 4 and 5, did not become quiet. Rather, radiation was produced at intermittent times and loca- tions from successively higher points along the channel, mostly from apparent branch points as the return stroke traveled up the channel. The return stroke source lo- cations are shown in Figure 10c, adjacent to and along the e and c segments of the leader channel. Figure 13d shows that the elevation angle of the sources increased linearly with time after the return stroke onset, at a rate of about 20 ø per 100/•s. Because the downward channel to ground was directed slightly away from the interferometer site, it is estimated to have been approx- imately equidistant from the interferometer, at a radius of about 6 km. The rate of elevation increase therefore
corresponded to an upward speed of 2 x 10⁷ m/s for the return stroke.
Several M events occurred during the continuing cur- rent, each of which enhanced the current to ground. The first two M events occurred I ms and 10 ms into
the continuing current and were initiated by the radia- tion shown in Figure 10c. In each instance breakdown began just beyond the end of one of the leader branches and progressed into the leader channel. Upon reaching the channel, the breakdown initiated a fast field change characteristic of an M component and renewed the elec- trostatic field change, indicating increased charge flow to ground. The first event (M1) started about 700/•s into the return stroke and was initiated by breakdown just beyond the a region that was active at the be- ginning of the leader. As for the M events of stroke 4 (Figure 11), the M field change was initially nega- tive and then positive, consistent with negative charge transfer initially toward and then away from the inter- ferometer site. The second event (M2) traveled into and along the right-hand branch, nearly to the junction
13,074 RHODES ET AL' RADIO INTERFEROMETER OBSERVATIONS OF LIGHTNING
Time intewal 5
-glo
• -920 '""'-"""""'"'- ....
•-• .. -9443 .......... :: ß
-950 ......................... " - 9 60 ..................... :"' , , , , , ,
20
0
-20
5L
• ! • '., ' .. ..'&-., '. •--'..•.L.;.-..:::.'.,.'..-':.:t-;'.•œ•'-•.•g i•'.{'.: '--: .-: '.'. •-':•...-. i •..Z•.'• ß 80 482 484
'rime from beginning of fk•sh (MSEC)
90'
75
•o 1,5-
O•
18O
b]
210
ß _
_
I I I I
2½0 270 300 530
AZIMUTH
9O
75
z 60 o
15
_ / I,•.• _ ml .•.
I'
rs/./ ß
500 330
c] I I I
180 210 240 270
AZIMUTH
90
0 ,
482.8
d] m m I m
483.0 4.83.:
Figure 13. Results for third stroke of flash 153844, which initiated a continuing current dis- charge to ground. (a) Time waveforms, (b) radiation sequence during dart leader, (c) sources of intermittent, upward-going radiation during the return stroke, and radiation of breakdown which initiated two M-events (ml and m2), and (d) elevation increase versus time of the upward going return stroke radiation.
point of the branch with the main channel, before ini- tiating the M field change. (Time waveforms for this event are not shown but were similar to those of the
first M event. In both instances the radiation ampli- tude decreased when the breakdown reached the leader
channel.) The continuing current therefore appeared to be sustained by charge beyond the end of both branches. Leader branching or complexity is not necessary for a continuing current discharge, as the long-duration con- tinuing current initiated by stroke 8 of flash 155325 was initiated by a normal dart leader.
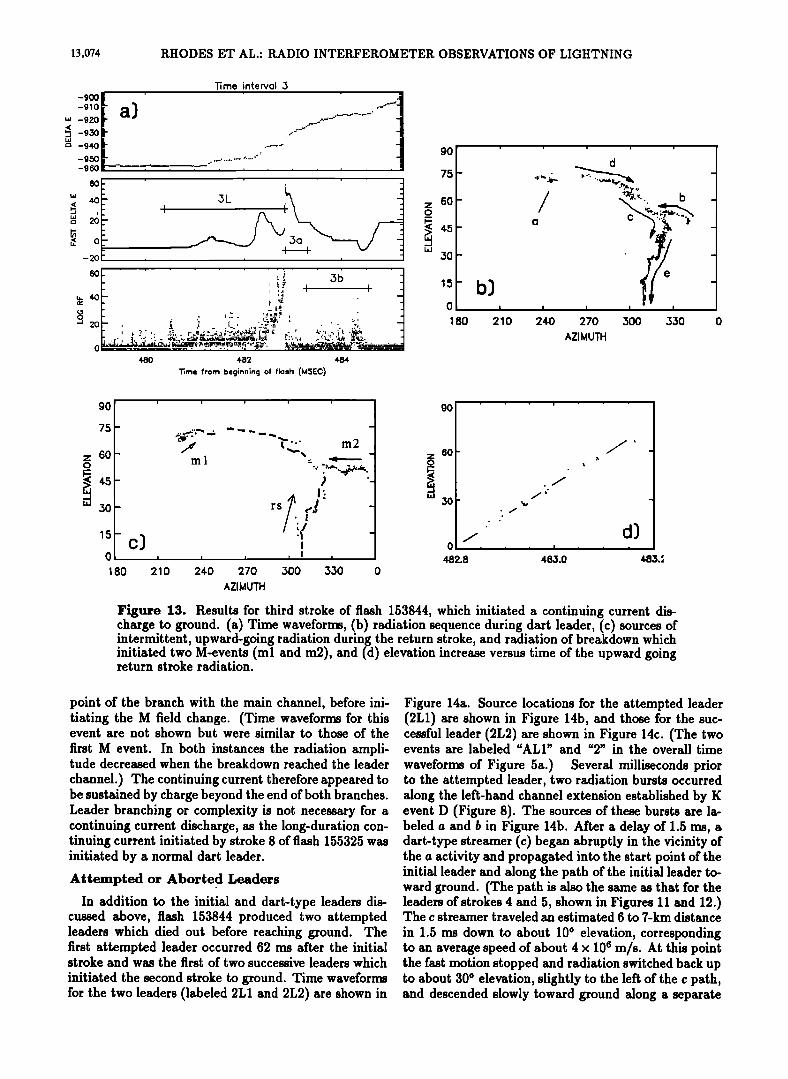
Attempted or Aborted Leaders
In addition to the initial and dart-type leaders dis- cussed above, flash 153844 produced two attempted leaders which died out before reaching ground. The first attempted leader occurred 62 ms after the initial stroke and was the first of two successive leaders which
initiated the second stroke to ground. Time waveforms for the two leaders (labeled 2L1 and 2L2) are shown in
Figure 14a. Source locations for the attempted leader (2L1) are shown in Figure 14b, and those for the suc- cessful leader (2L2) are shown in Figure 14c. (The two events are labeled "ALl" and "2" in the overall time
waveforms of Figure 5a.) Several milliseconds prior to the attempted leader, two radiation bursts occurred along the left-hand channel extension established by K event D (Figure 8). The sources of these bursts are la- beled a and b in Figure 14b. After a delay of 1.5 ms, a dart-type streamer (c) began abruptly in the vicinity of the a activity and propagated into the start point of the initial leader and along the path of the initial leader to- ward ground. (The path is also the same as that for the leaders of strokes 4 and 5, shown in Figures 11 and 12.) The c streamer traveled an estimated 6 to 7-km distance
in 1.5 ms down to about 10 ø elevation, corresponding to an average speed of about 4 x 10⁶ m/s. At this point the fast motion stopped and radiation switched back up to about 30 ø elevation, slightly to the left of the c path, and descended slowly toward ground along a separate
RHODES ET AL.: RADIO INTERFEROMETER OBSERVATIONS OF LIGHTNING 13,075
90
75
z 60 o
30
15
-940
-960
-980
-1000
-1020
8O
"' 60
'-< o -20
20
0
Time interval 2L
ß - 2L1 . - . _•_ 2L2 2
;:,•::'•.:'...' !i:.•. ß .: ;:•' • ;:.•,.•:. :L. ß :;. !q-.&• .. i'..r•r:. - .'_ .•-...'•..,-. . . .: -",":.'•". •-.:•:'..,:.!..'. . ;.. -: :-.- ..
465 47O 475
'lqma from baginning of f•h (MSEC)
- b) I
180 210 2½0 210
;-.. c 75
z 60 o . 0 -., _o
c'"O•, - •.';,::.g l b w .30 ,
•:'i d I I I 0 I I I I
270 ,300 ,3.30 0 180 24-0 270 ,300 ,3.30
AZIMUTH AZIMUTH
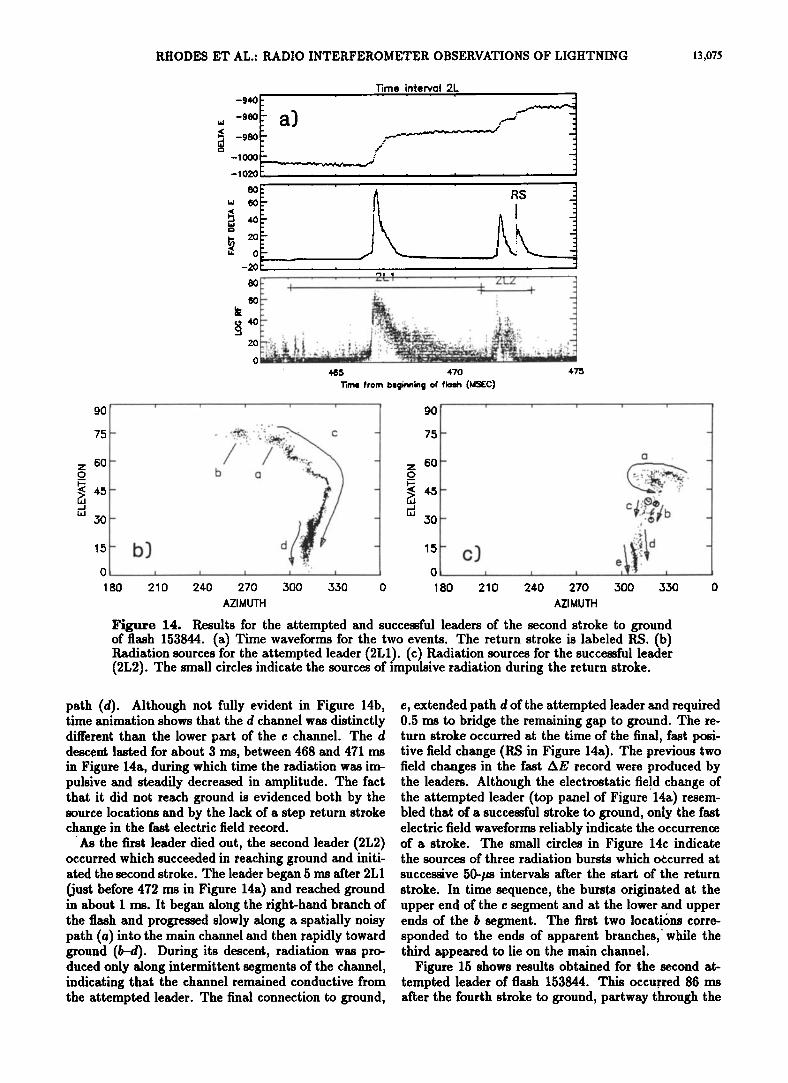
Figure 14. Results for the attempted and successful leaders of the second stroke to ground of flash 153844. (a) Time waveforms for the two events. The return stroke is labeled RS. (b) Radiation sources for the attempted leader (2L1). (c) Radiation sources for the successful leader (2L2). The small circles indicate the sources of impulsive radiation during the return stroke.
path (d). Although not fully evident in Figure 14b, time animation shows that the d channel was distinctly different than the lower part of the c channel. The d descent lasted for about 3 ms, between 468 and 471 ms in Figure 14a, during which time the radiation was im- pulsive and steadily decreased in amplitude. The fact that it did not reach ground is ev. idenced both by the source locations and by the lack of a step return stroke change in the fast electric field record.
As the first leader died out, the second leader (2L2) occurred which succeeded in reaching ground and initi- ated the second stroke. The leader began 5 ms after 2L 1 (just before 472 ms in Figure 14a) and reached ground in about I ms. It began along the right-hand branch of the flash and progressed slowly along a spatially noisy path (a) into the main channel and then rapidly toward ground (b-d). During its descent, radiation was pro- duced only along intermittent segments of the channel, indicating that the channel remained conductive from the attempted leader. The final connection to ground,
e, extended path d of the attempted leader and required 0.5 ms to bridge the remaining gap to ground. The re- turn stroke occurred at the time of the final, fast posi- tive field change (RS in Figure 14a). The previous two field changes in the fast AE record were produced by the leaders. Although the electrostatic field change of the attempted leader (top panel of Figure 14a) resem- bled that of a successful stroke to ground, only the fast electric field waveforms reliably indicate the occurrence of a stroke. The small circles in Figure 14c indicate the sources of three radiation bursts which occurred at
successive 50-/•s intervals after the start of the return stroke. In time sequence, the bursts originated at the upper end of the c segment and at the lower and upper ends of the b segment. The first two locations corre- sponded to the ends of apparent branches,' while the third appeared to lie on the main channel.
Figure 15 shows results obtained for the second at- tempted leader of flash 153844. This occurred 86 ms after the fourth stroke to ground, partway through the
13,076 RHODES ET AL.: RADIO INTERFERObIETER OBSERVATIONS OF LIGHTNING
o i i i i i d
.. • ,..a•, .: .
z 60- c o_ ,•b
ß '•.
• 45 - .•.•,/ "' 30- "'
15-
0 I I I I I
160 1 go 220 250 280 310
AZIMUTH
Figure 15, Radiation source locations for an attempted leader that occurred halfway through the interstroke interval between the fourth and fifth strokes of flash 153844.
interstroke interval between the fourth and fifth strokes.
(This event is labeled AL2 in the overall time wave- forms of Figure 5a). Several disjoint radiation events (a-c) were followed by a negative streamer (d) which
retraced the path of the fourth stroke leader before dy- ing out part way down the vertical channel to ground. The streamer traveled an estimated 5 to 10-km distance
in 2 ms, corresponding to an average speed of 2.5-5 x 10⁶ m/s. Except for its large extent, d behaved identically to the streamers of K type events that were occurring in the interstroke intervals. This, and the obvious sim- ilarity of d to a dart leader, demonstrates that there is essentially no difference between K events and dart leaders, except that the latter have enough energy to reach ground.
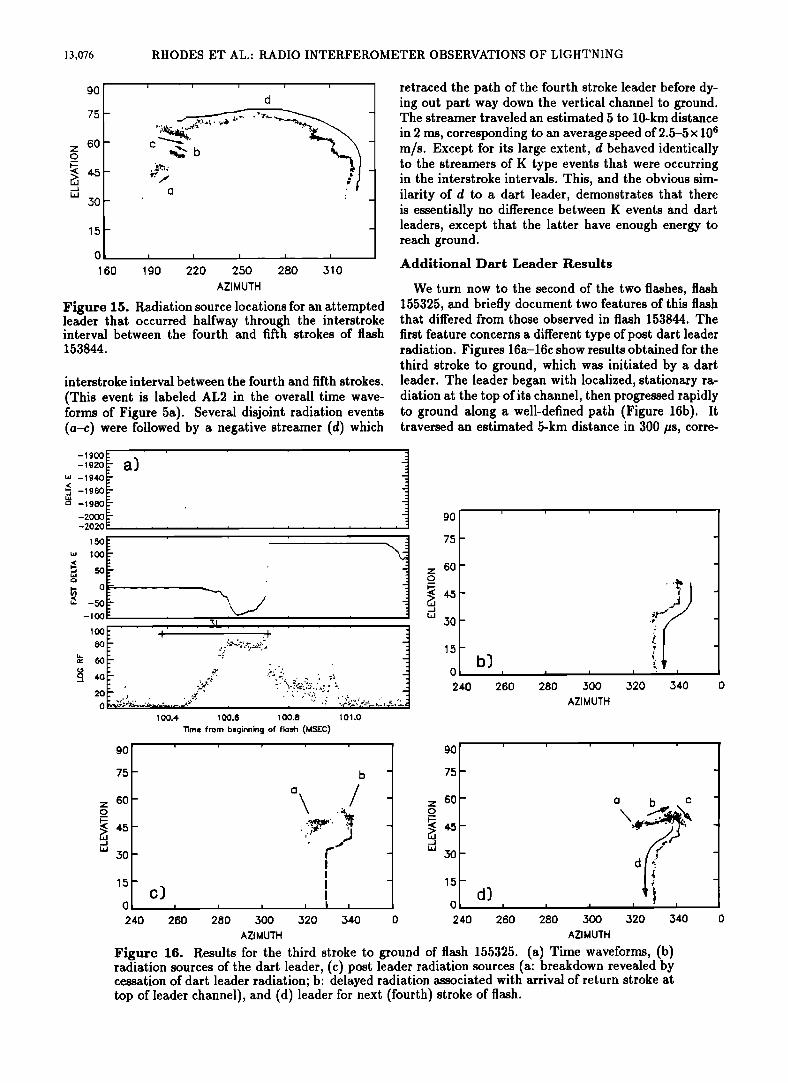
Additional Dart Leader Results
We turn now to the second of the two flashes, flash 155325, and briefly document two features of this flash that differed from those observed in flash 153844. The
first feature concerns a different type of post dart leader radiation. Figures 16a-16c show results obtained for the third stroke to ground, which was initiated by a dart leader. The leader began with localized, stationary ra- diation at the top of its channel, then progressed rapidly to ground along a well-defined path (Figure 16b). It traversed an estimated 5-kin distance in 300 Os, corre-
'" -1940 •'
-2000
90
75
z 60 o
15
100.4. 100.6 100.8 101.0
Time from beginning of flash (MSEC)
i ! ! ! i
c) I I I I
b
90'
b) i i
240 260 280 500
AZIMUTH
i
520 540
go
75
z 60 o
•0
15
0 I I I .
240 280 280 300 320 340 O 240 280 280 300
AZIMUTH AZIMUTH
o,,,,,,,•. b..•
I I
520 540
Figure 16. Results for the third stroke to ground of flash 155325. (a) Time waveforms, (b) radiation sources of the dart leader, (c) post leader radiation sources (a: breakdown revealed by cessation of dart leader radiation; b' delayed radiation associated with arrival of return stroke at top of leader channel), and (d) leader for next (fourth) stroke of flash.
RHODES ET AL.: RADIO INTERFEROMETER OBSERVATIONS OF LIGHTNING •3,077
sponding to an average speed of about 1.5 x10 ? m/s. At the onset of the return stroke, the radiation dropped abruptly in amplitude, but not down to the receiver noise level, as it did for the later strokes. Rather, the radiation continued at a lower level through the time of the return stroke. (The radiation waveform shown in Figure 16a is the output of a logarithmic receiver, so that the decrease at the time of the return stroke
was substantial, about 15 dB.) The continuing radia- tion originated from the region labeled a in Figure 16c. It occurred at the same elevation as the source region of the dart leader, but was displaced from the source re- gion. The a radiation continued for 150 ps until about 100.9 ms, when two large-amplitude bursts occurred at the upper end of the leader channel, labeled b in Fig- ure 16c. The time delay and location of the b events suggest that they were associated with the arrival of the return stroke at the top of the leader channel. As- suming this to be the case, the average speed of the return stroke was about 3 x 10 ? m/s (only twice as fast as the leader speed).
The result that the radiation immediately following the leader shifted location to region a and was reduced in amplitude indicates that the a-breakdown was con- current with that of the downward progressing leader but was not revealed until the more strongly radiating leader was extinguished. No direction of progression could be discerned during the a activity, as the source locations were randomly located with time. Also, no activity was detected in the a region prior to the third stroke. However, the a region became the starting point of the leader for the next stroke of the flash, shown in Figure 16d. This suggests that the concurrent leader breakdown was responsible for establishing this branch of the flash. As can be seen in the overviews of Fig-
ures 4c and 4d, the flash was highly branched inside the cloud. Similar breakdown was found to accompany most of the leaders of the flash and appeared to intitiate most of the branches.
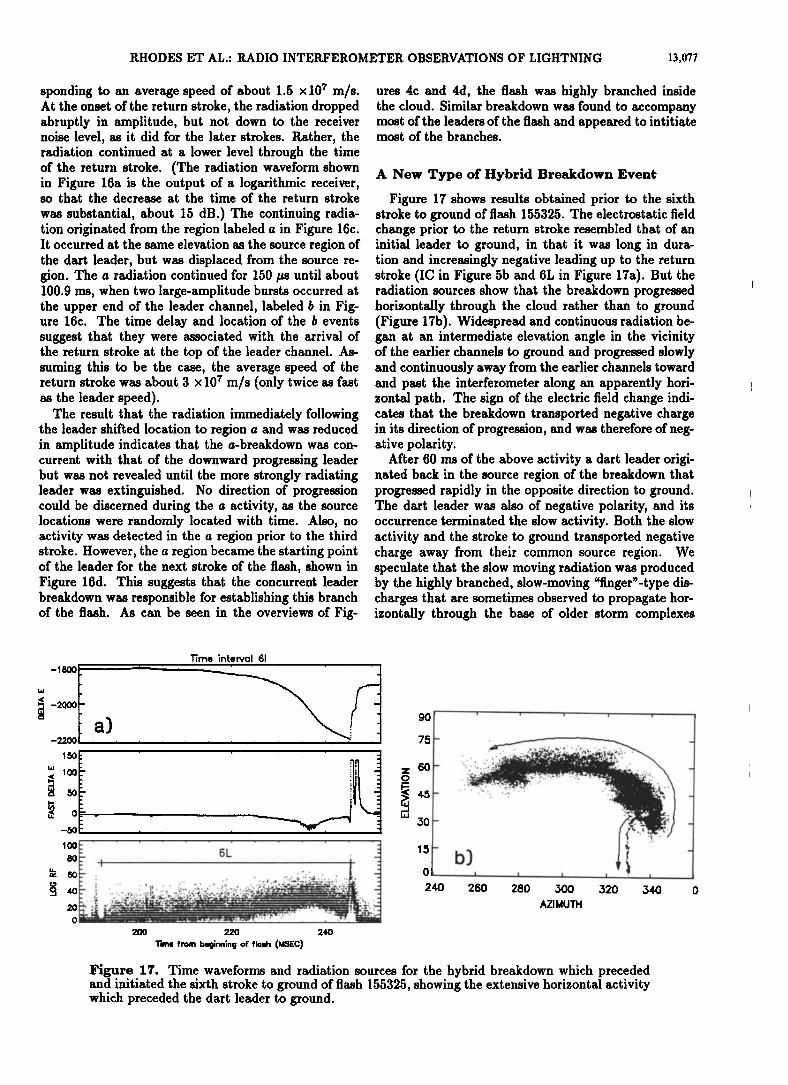
A New Type of Hybrid Breakdown Event
Figure 17 shows results obtained prior to the sixth stroke to ground of flash 155325. The electrostatic field change prior to the return stroke resembled that of an initial leader to ground, in that it was long in dura- tion and increasingly negative leading up to the return stroke (IC in Figure 5b and 6L in Figure 17a). But the radiation sources show that the breakdown progressed horizontally through the cloud rather than to ground (Figure 17b). Widespread and continuous radiation be- gan at an intermediate elevation angle in the vicinity of the earlier channels to ground and progressed slowly and continuously away from the earlier channels toward and past the interferometer along an apparently hori- zontal path. The sign of the electric field change indi- cates that the breakdown transported negative charge in its direction of progression, and was therefore of neg- ative polarity.
After 60 ms of the above activity a dart leader origi- nated back in the source region of the breakdown that progressed rapidly in the opposite direction to ground. The dart leader was also of negative polarity, and its occurrence terminated the slow activity. Both the slow activity and the stroke to ground transported negative charge away from their common source region. We speculate that the slow moving radiation was produced by the highly branched, slow-moving "finger"-type dis- charges that are sometimes observed to propagate hor- izontally through the base of older storm complexes
Time in•,erval GI
a;) ! -2200 '"":' 75
ß
,oo ß ' • so : .... . ..... :..:.:..;_'.•;..•,:,; ..... ;.:,:. • 4o• i ... :'. .. .-'.:,1: - .::' .,:•.-..;..!•?.:,,";5':,.-.-,.':.:•-;:: .... '•-'--;..;'•-•- -• 240 260 280 300 320 340
,.,,.,1:,.' '",. •......';,.•'•--•',•. "•• ...... ,. ß =•.•: ;_-I AZIMUTH o I:i:•._.. ......... • .•'•....-- .... •,,.•.•.;-.[,.. :-; •.- ß . , .,;. '•
200 220 24.0
T'm, te from beginning of fl•sh (MSEC}
150
Figure 17. Time waveforms and radiation sources for the hybrid breakdown which preceded and initiated the sixth stroke to ground of flash 155325, showing the extensive horizontal activity which preceded the dart leader to ground.
13,078 RHODES ET AL.: RADIO INTERFEROMETER OBSERVATIONS OF LIGHTNING
(e.g., the "air discharges" described by Malan [1963], and the "rocket" lightning of Uman [1987]). Additional examples are required for a better understanding of this phenomenon.
Summary and Discussion
The results of this study further illustrate the useful- ness of interferometric techniques for studying lightning discharge processes. They agree in a number of respects with results obtained from previous studies of lightning radiation but also differ with and/or clarify some previ- ous results. In this section we summarize the discharge characteristics observed in this study and compare them with previous results.
Much of the VHF radiation from lightning occurs in bursts lasting several tens to several hundreds of mi- croseconds or longer. Interferometric techniques enable the radiation sources to be located as a function of time
during such bursts. The bursts appear to be produced by two distinct kinds of breakdown events: (1) fast- moving streamers which propagate along well-defined channels during a given burst, at speeds of 1-2 x 10 ? m/s down to about 106 m/s, and (2) localized, intense break- down whose motion within a burst is not resolved but
whose centroid progresses slowly from burst to burst. In both cases, the breakdown is predominantly negative in polarity, that is, negative charge is transported in the direction of the breakdown progression. Radiation is also observed from fast positive streamers, as discussed later.
Fast-moving negative streamers are characteristic of both dart leaders to ground and in-cloud K type events, and appear to be the same process in both instances. As noted by Hayenga [1984], the two types of events ap- pear to be distinguished only by the fact that dart lead- ers develop toward ground and initiate a return stroke, whereas K streamers progress horizontally or upward in the storm. Some K streamers produce fast field changes (e.g., Figure 8), indicative of a rapid current increase along the streamer channel. Many K streamers do not produce a fast field change, however, but simply die out after traveling some distance.
While most dart leaders progress continuously along a well-defined path to ground, the leader breakdown is sometimes complex and involves different branches and channel segments (Figures 13b and 14c). In addition, some dart leaders die out before reaching ground (Fig- ures 14b and 15). These further illustrate the similarity between dart leaders and K events.
Localized, slow-moving radiation is observed during the initial intracloud breakdown of a flash and during initial leaders to ground (Figures 6 and 9, respectively). The speed of progression is estimated to be about 105 m/s during initial leader breakdown and greater than 104 m/s during initial breakdown of intracloud activ- ity which preceded the cloud-to-ground phase of the flash. Radiation during initial leaders often becomes increasingly widespread with time, which appears to be related to the development of branches. A new type
of event has been identified which resembles that of an
initial leader to ground, except that it progresses hori- zontally within the storm rather than going to ground. In the instance reported in this paper, the slow break- down spawned a negative-polarity dart leader in the opposite direction to ground (Figure 17).
The result that radiation during initial breakdown is localized and slow moving agrees with the observa- tions of other investigators for ground flashes preceded by intracloud activity. In summarizing the results from a number of flashes, Proctor et ai. [1988, p. 12,709] reported that the noise sources during such activity "clustered in a region about the origin." Warwick et ai. [1979] reported one-dimensional source locations for one flash that were noisy but drifted at an estimated (projected) speed of 3 x10⁴ m/s. Richard et ai. [1986] reported that the initial radiation sources were scat- tered over distances of about i km and in some cases
drifted or expanded and spread. Similar agreement is obtained with previous results
concerning initial leaders to ground. Proctor et ai. [1988] reported speeds of 1-2 x 10⁵ m/s for the radiation sources of initial leaders. He found that initial lead-
ers were easy to map and were often heavily branched and complex. Hayenga and Warwick [1981] observed a progression speed of 2 x 10⁵ m/s during horizontal pro- gression of the first 31 ms of an initial leader to ground and 5 x 10⁵ m/s during the downward descent of the leader. Richard et ai. [1986] were unable to resolve the ambiguities of their 10-A system during initial leaders because of the large dispersion of the sources but re- ported a drift speed of about 105 m/s during the first 10 ms of a 25-ms initial leader to ground. Uman et ai. [1978] and Rustan et ai. [1980] reported a signifi- cantly higher speed for the initial leader of an energetic 3-stroke flash which happened to strike a tower. The initial leader required only 4.9 ms to traverse a 7-km distance to ground, corresponding to an overall average speed of about 1.5 x 10⁶ m/s.
During the initial leader of flash 153844, a sequence of fast negative streamers was observed to propagate along earlier channels into the start region of the leader (Fig- ure 9). This is a new result that was missed in the orig- inal analysis of the flash but which has since been ob- served in other flashes and may be commonplace. The fast streamers undoubtedly progress down the devel- oping leader channel and supply negative charge that assists the leader's development. Proctor et al. [1988] reported the occurrence of several exceptional sources which became active above the leader origin at the end of an initial leader, that may have been produced by the same phenomenon. We have not been able to identify stepping in the initial leaders, either from the radiation signals or from electric field measurements. The latter were dominated by the electrostatic change of the leader at the close range of the measurements. Hence we use the term initial rather than "stepped" leader.
The fast streamers of in-cloud K events have been
observed by other investigators and are particularly well-delineated by interferometric measurements. Hay-
RHODES ET AL.: RADIO INTERFEROMETER OBSERVATIONS OF LIGHTNING 13,079
enõa [1979, 1984] termed the streamers "fast bursts" and noted their correlation with K events, as well as their similarity with what Proctor [1976] termed "Q" noise and with what Rustan et ai. [1980] termed "soli- tary pulses." Hayenga found that the fast bursts pre- ceded the K field change and reported one fast burst to have a speed of about 2 x 10 ? m/s over an estimated length of 6 km. The speed was noted to be one or- der of magnitude greater than the value of 1.3 x 10⁶ m/s determined by Oõawa and Brook [1964]. (Ogawa and Brook's value was based on the assumption that K changes travel over a 1-km distance in about I ms and thus was only an estimate.) Richard et al. [1986] ob- served fast streamers during intracloud discharges that traveled distances of up to 10 km at speeds of about 10 ? m/s. These and other fast streamers were observed by them to travel along well-defined channels and to represent a major part of the radiating activity of a discharge. The fast streamers were found to be associ- ated with K type field changes and were considered by Richard et al. [1986] to be associated with recoil stream- ers of the K events. They noted that the speeds were greater than photographic estimates of 1 -4 x 10⁶ m/s from Brook and Oõawa [1977] and, because of this, con- cluded that the radiation was decorrelated with the op- tical K event. Richard et al.'s interpretation that the streamers were recoil events conflicted with Hayenga's observations that the streamers preceded the fast elec- tric field change of a K event.
The K streamers of the present study traveled at speeds similar to those of the above observations, with values ranging from 1 - 2 x 10⁷ m/s down to 106 m/s, depending apparently on the energy of the breakdown event and the residual conductivity of the channel. The same range of speeds is observed for dart leaders. As summarized by Brook and Oõawa [1977], Ishikawa [1961] photographed three rates of streamer progression in lightning discharges: 5 x 10⁴ m/s, 1- 2 x 10 • m/s, and 3- 4 x 10⁶ m/s. Ishikawa termed these to be slow, medium, and fast streamers, respectively. Orville and Idone [1982] measured photographic speeds of 2.9 x 10⁶ to 2.3 x 10⁷ m/s for dart leaders near ground, compa- rable to and greater than the fast speeds of Ishik•awa. Given the similarity between K type and dart stream- ers and the observed speed range for each, there is good agreement between the radio and optical observations. Oõawa and Brook's [1964] estimate of 1.3 x 10⁶ m/s for K events is smaller than the typical values, because they underestimated the extent of the K channel and overestimated the duration of propagation. Ishikawa's medium- and slow-speed streamers may correspond to the initial-type breakdown discussed above and to the slow intracloud event of Figure 17.
As noted by Hayenõa [1984], the K streamers imme- diately precede the rapid field change of the K event. Rather than the K streamer itself being a recoil event, as assumed by Richard et al. [1986], the K streamer would be the initiator of any recoil event (i.e., of the current increase evidenced by the rapid K field change). In this regard the K streamer would again be similar
to the dart leader, which initiates the recoil-like return stroke. The interpretation of K events as a recoil phe- nomena originated with Oõawa and Brook [1964], who studied the shape of the electrostatic field change of a number of intracloud discharges and inferred that the K events, which occurred late in the flashes, were neg- ative recoil streamers along the path of slow positive breakdown from the upper positive charge in a storm down to the level of negative charge. This inference was supported by moving-camera photographs of intracloud channels that happened to extend below cloud base, which showed that the channel brightening associated with K events propagated in the opposite direction to branching of the channel.
The composite results of Figure 4 show that the flashes branched away from the channel to ground. The K streamers and dart leaders of the flashes progressed in the direction of the channel to ground and therefore progressed in the opposite direction to the branches, in agreement with the above observations of Oõawa and Brook [1964]. Similar observations have been obtained by Proctor [1981], Proctor et al. [1988], and Richard et al. [1985]. The fact that the K streamers travel opposite to the direction of branching is a result of the retrograde manner in which the flashes develop, however, and does not in itself imply that the K streamers (or dart leaders) are recoil events. The inference by Ogawa and Brook [1964] that the K events were preceded by a slow down- ward positive streamer was obtained from single-station electric field change measurements; similar analyses of multiple station electric field measurements by Liu and Krehbiei [1985] and Krehbiel [1981] indicated the oppo- site, namely that intracloud breakdown starts with up- ward negative breakdown. The latter is also supported by the results for the initial breakdown of flash 153844 of this study (Figure 6).
Mazur [1989] has proposed that the negative K stream- ers are recoil events which travel backward along the channels of RF-invisible positive streamers that are part of bidirectional breakdown of previous activity. These inferences were based on indications of bidirectional
breakdown in aircraft-triggered lightning and on obser- vations by Richard et al. [1985] in which gaps in the channels of extensive intracloud discharges were sub- sequently traversed by high-speed negative streamers. K event D of Figure 8 is an example in which a fast streamer bridged a gap; component D2 of this event be- gan at a distance from previously detected activity and propagated at a high speed (10 • m/s) into the path of the previous activity. The event was delayed by 19 ms from the previous C activity, however, and required two attempts to get started. This, and the fact that posi- tive streamers are observed which radiate at RF, makes it unclear that an RF-invisible phenomenon needs to be invoked or is the cause of K streamers. Rather, K streamers (and dart leaders) would appear simply to be the result of the onset of breakdown at a distance in
locally enhanced fields. (Recent analyses of additional flashes observed with an improved system indicate that K streamers usually begin close to or on previously de-
13,080 RHODES ET AL.: RADIO INTERFEROMETER OBSERVATIONS OF LIGHTNING
tected channels and do not usually bridge gaps, which would further obviate the need for invisible streamers
[Shao, 1993].) Hayenga [1979, 1984] noted the similarity between
the fast burst streamers of K events and what he termed
"precursor" radiation associated with dart leaders of subsequent strokes to ground. Inexplicably, Hayenga's results did not show that the dart leader radiation pro- gressed to ground. This led him to use the term "precur- sor" for the dart leader ttF activity and to conclude that the optical and radio dart leader phenomena, although related, were not correlated. This finding was supported by the early observations of Brook and Kitagawa [1964] that UHF radiation during dart leaders often ceased 50 to 150 ps before the return stroke onset. The latter led Kitagawa and Brook to suggest that dart leader radi- ation was produced primarily within the cloud rather than by the descending part of the leader to ground.
Richard et al. [1986] found that the dart leader radia- tion propagated in a highly organized manner to ground at estimated speeds between 107 and 5 x 10⁷ m/s. They noted that the speed values were at the high end of the photographically measured speeds of Orville and Idone [1982]. Rhodes [1989] confirmed this behavior of the dart leader radiation and obtained speed estimates that were in better agreement with Orville and Idone's mea- surements. Rhodes' results are documented in this pa- per, along with more recent results of a similar nature. In addition to progressing down the channel like the op- tical dart leader, the I•F radiation is found to continue up to the time of the return stroke and to extinguish at the onset of the return stroke. Although we do not have correlated optical observations, there can be lit- tle doubt that the ttF radiation is well correlated with
the optical leader descent. Further study is required to explain Brook and Kitagawa 's [1964] observations.
While the dart leader observations of Richard et al.
[1986] were consistent with the idea of a descending leader, they interpreted other results of their study to be inconsistent with the generally accepted view that the channel to ground is established by the initial leader. In particular, they observed fast streamers that appeared to establish the channel to ground well before the on- set of the initial leader and also at the beginning of the initial leader (events a and b of their Figure 8). Streamer a occurred several hundred milliseconds be-
fore the initial stroke, and streamer b occurred at the beginning of the apparent initial leader, 50 ms before the return stroke. Also, later streamers prior to the stroke (c and d) appeared to extend the leader channel upward rather than downward. Finally, electric field change measurements of the streamers did not agree with the assumed streamer orientation or usual leader
phenomenology. From this they concluded that the ra- dio phenomenology of breakdown prior to and during the initial leader of a discharge was uncorrelated with the electrostatic and optical phenomena.
The results of this study indicate that radiation from initial leaders, although noisier and more complex than dart leaders, progresses in an orderly manner to ground
(see also Rhodes and Krehbiel [1989]). Breakdown dur- ing intracloud activity preceding the initial leader is confined within the cloud, and fast streamers during the initial leader propagate into rather than away from the leader channel. Krehbiel [1981] has shown that the electrostatic field change of initial leaders is fully con- sistent with a gradual and steady lowering of negative charge during the leader descent. Also, Proctor [1981] and Proctor et al. [1988] reported excellent agreement between the measured electrostatic field changes of lead- ers and computed field changes based on the progression of the I•F source locations.
We note that the discrepancies identified by l•ich- ard et al. [1986] and described above can be explained if streamers a-d of their Figure 8 and the intracloud streamer of their Figure 11 propagated horizontally away from (or toward) their interferometer rather than vertically toward (or away from) ground. In both situations the elevation angle would decrease (or in- crease) with time, as if the channel were directed toward ground. This type of ambiguity is always present in single-station interferometer observations but can usu- ally be resolved by careful examination of the overall results. Also, the streamers may have appeared to con- tact ground as a result of incorrect resolution of their fringe ambiguities.
Several types of radiating events have been observed during and after return strokes. For initial strokes the leader radiation is observed to continue through the onset of the return stroke and usually to increase in amplitude relative to the leader radiation. The contin- ued radiation originates along the lower extent of the leader channel, presumably from radial breakdown into the return stroke channel. The radiation sources are
observed to progress rapidly up the channel, either as one well-defined event or (in more complex situations) as a sequence of several upward propagating events (Figure 10), and also to travel out along unsuccess- ful branches. l•adiation later during the return stroke originates in or beyond the source region of the leader. Similar results have been reported by Proctor [1981], Proctor et al., [1988], and Richard et al. [1986]. Hay- enga [1984] was unable to detect upward source motion during initial or subsequent return strokes.
For strokes initiated by dart leaders, the leader ra- diation usually extinguishes at the onset of the return stroke. In agreement with the results of a number of in- vestigators, the return stroke tends to be quiet at radio frequencies [Malan, 1958; Brook and Kitagawa, 1964; Rustan et al., 1980; Proctor, 1981; Hayenga, 1984; Rich- ard et aL, 1986; Proctor et aL, 1988]. This indicates that ttF radiation is associated primarily with break- down and not with current flow such as occurs during the return stroke. Intermittent radiation is sometimes
observed at locations back up along the leader channel, apparently as the upward propagating return stroke en- counters branch points on the channel (Figures 13c and 13d, and 14c). This agrees with the interpretation of Le Vine and Krider [1977]. l•adiation occurs intermit-
RHODES ET AL.: RADIO INTERFEROMETER OBSERVATIONS OF LIGHTNING 13,08!
tenfly along channel segments that have been recently conducting, as in the case of the leader of Figure 14c.
The quiet period of the return stroke is usually ter- minated by one or more bursts of radiation from the source region of the leader. Some of these bursts oc- cur within 100-200 ys of contact with the ground and appear to be associated with the arrival of the return stroke back in the leader source region, in agreement with the inference by Brook and Kitagawa [1964]. Such bursts are either localized just beyond the leader source region, as in event b of Figure 16c, or propagate away from the source region, as in Figures 11c and 12c. The latter are positive streamers that travel at speeds com- parable to the fast negative streamers of dart leaders and K events. They often are not preceded by other detectable activity and appear to establish new channel segments which are followed by the subsequent activity of the flash.
Post return stroke bursts which occur after a longer time delay, up to 1-2 ms, propagate into the leader channel as negative streamers (Figure 11d) and ap- pear to renew the current flow along the entire chan- nel to ground. M events during continuing currents (Figure 11d and 13c) behave in the same manner, and the two are probably the same phenomenon. Haycnga [1984] found downward moving sources during the post return stroke period, which presumably were also the same phenomena.
Some strokes initiated by dart leaders do not have a quiet period during the return stroke. In these in- stances, also noted by Takagi [1969] and Hayenga [1984], the radiation continues with decreased amplitude after the leader contacts ground (Figure 16a). The contin- uing radiation originates in a region that is distinctly separate from the leader source region, and is produced by breakdown which appears to have been concurrent with that of the leader, but whose presence is not re- vealed until the stronger radiation of the descending leader is extinguished. The concurrent breakdown ap- peared to establish new branches which were followed by subsequent strokes of the flash. In the example shown (Figure 16c), delayed radiation was also produced im- mediately adjacent to the leader start point, which ap- peared to be associated with the arrival of the return stroke at the top of the leader channel. This indicates that the concurrent breakdown did not produce a con- ducting extension of the leader channel.
The above results suggest that new branches during cloud-to-ground flashes are produced at the time of a leader-return stroke sequence, either by the action of positive streamers which are launched when the return stroke reaches the upper end of the leader channel or by breakdown which is concurrent with the leader near the leader source region. Not all strokes produce such activity, however, so that other branching mechanisms would also appear to occur.
On the basis of their results, Proctor et al. [1988] pro- posed a model of a ground flash in which breakdown immediately following a return stroke overshoots previ- ously active regions and extends the channels primarily
in vertical directions, both upward and downward from the main, horizontal channel inside the cloud. The ver- tical channels were found to be active during the ensu- ing interstroke interval, and the flashes were observed to develop in a retrograde manner horizontally through the storm, with each stroke producing a series of the verti- cally oriented streamers. The resulting structure of the flash was therefore envisioned to have a "herringbone" pattern. The results of the present study are consis- tent with horizontal development of the discharges, as found both by Krehbiel et al. [1979] and Proctor et al., [1988]. They indicate that the flashes developed in a retrograde manner but show no evidence of a herring- bone structure. Rather, the retrograde development appeared to be the result of primarily horizontal break- down, mostly during the interstroke interval and some- times also immediately following the return stroke. The interstroke activity consisted of negative streamers that progressed into the previous stroke channel from ad- jacent locations, thus extending the flash horizontally. The immediate post stroke activity consisted of positive streamers that progressed away from the stroke channel, apparently as the return stroke reached the source re- gion of the leader (Figures 11c and 12c). This behavior has been confirmed by the analysis of a number of addi- tional ground flashes and presents a more self-consistent picture of retrograde development than Proctor et al.'s model.
Finally, it is clear from the results of this and other studies that VHF radiation is produced by breakdown processes and not by current flow along already con- ducting channels. The mechanism or mechanisms by which this radiation is produced is not well understood and remains an unanswered question.
Acknowledgments. This research was supported by the National Science Foundation under grants ATM-8518165 and ATM-8117665 and by the U.S. Office of Naval Research under grant N00014-84-K-0069.
References
Brook, M., and N. Kitagawa, Radiation from lightning dis- charges in the frequency range 400 to 1000 Mc]s, J. Geo- phys. Res., 69, 2431-2434, 1964.
Brook, M., and T. Ogawa, The cloud discharge, in Lightning, vol. 1, edited by R. H. Golde, pp. 191-230, Academic, San Diego, Calif., 1977.
Hayenga, C. O., Positions and movement of VHF lightning sources determined with microsecond resolution by inter- ferometry, Ph.D. thesis, Univ. of Colo., Boulder, 1979.
Hayenga, C. O., Characteristics of lightning VHF radiation near the time of return strokes, J. Geophys. Res., 89, 1403-1410, 1984.
Hayenga, C. O., and J. W. Warwick, Two-dimensional inter- ferometeric positions of VHF lightning sources, J. Geo- phys. Res., 86, 7451-7462, 1981.
Ishikawa, H., Nature of lightning discharges as origins of atmospherics, Proc. Res. Inst. Atmos. Nagoya Univ., 8A, 1-274, 1961.
Krehbiel, P., An analysis of the electric field change pro- duced by lightning, Ph.D. dissertation, Univ. of Manch-
13,082 RHODES ET AL.: RADIO INTERFEROMETER OBSERVATIONS OF LIGHTNING
ester Instit. of Sci. and Tech., Manchester, England, 1981.
Krehbiel, P. R., M. Brook, and R. A. McCrory, An analysis of the charge structure of lightning discharge to ground, J. Geophys. Res., 8J, 2432-2456, 1979.
Lennon, C. L., LDAR-A new lightning detection and rang- ing system (abstract), EoS Trans. A GU, 56(12), 991, 1975.
LeVine, D. M., and E. P. Krider, The temporal structure of HF and VHF radiations during Florida lightning return strokes, Geophys. Res. Lett., 4, 13-16, 1977.
Liu, X.S., and P. R. Krehbiel, The initial streamer of intra- cloud flashes, J. Geophys. Res. 90, 6211-6218, 1985.
Malan, D. J., Radiation from lightning discharges and its re- lation to the discharge process, in Recent Advances in At- mospheric Electricity, pp. 557-563, Pergamon, New York, 1958.
Malan, D. J., 176 pp, Physics of Lightning, English Univer- sity Press, London, 1963.
Mazur, V., Triggered lightning strikes to aircraft and natural intracloud discharges, J. Geophys. Res., 94, 3311-3325, 1989.
Ogawa, T., and M. Brook, The mechanism of the intra- cloud lightning discharge, J. Geophys. Res., 69, 5141- 5150, 1964.
Orville, R. E., and V. I. Idone, Lightning leader characteris- tics in the Thunderstorm Research International Program (TRIP), J. Geophys. Res., 87, 11,177-11,192, 1982.
Proctor, D. E., A radio study of lightning, Ph.D. thesis, 574 pp., Univ. of Witwatersrand, Johannesburg, South Africa, 1976.
Proctor, D. E., VHF radio pictures of cloud flashes, J. Geo- phys. Res., 86, 4041-4071, 1981.
Proctor, D. E., R. Uytenbogaardt, and B. M. Meredith, VHF radio pictures of lightning flashes to ground, J. Geo- phys. Res., 93, 12,683-12,727, 1988.
Rhodes, C. T., Interferometric observations of VHF radia- tion from lightning, Ph.D. thesis, N.M. Instit. of Mining and Technol., Socorro, N.M., 1989.
Rhodes, C. T., and P. R. Krehbiel, Interferometric obser- vations of a single stroke cloud-to-ground flash, Geo- phys. Res. Lett., 16, 1169-1172, 1989.
Rhodes, C. T., X. M. Shao, P. R. Krehbiel, R. J. Thomas, Observations of lightning processes using VHF radio in- terferometry, International Aerospace Conf. on Lightning and Static Electricity, NASA Conf. Publ. 3106, 68A1- 68A13, Cocoa Beach, Fl., 1991.
Richard, P., and G. Auffray, VHF-UHF interferometric mea- surement applications of lightning discharge mapping, Radio Sci., ,•0, 171-192, 1985.
Richard, P., J. Appel, and F. Broutet, A three-dimensional interferometric imaging system for the spatial character- ization of lightning discharges, paper presented at 10th International Aerospace and Ground Conference on Light- ning and Static Electricity, Paris, France, 1985.
Richard, P., A. Delannoy, G. Labanne and P. Laroche, Re- suits of spatial and temporal characterization of the VHF- UHF radiation of lightning, J. Geophys. Res., 91, 1248- 1260, 1986.
Rustan, P. L., M. A. Uman, D. G. Childers, W. H. Beasley, and C. L. Lennon, Lightning source locations from VHF radiation data for a flash at Kennedy Space Center, J. Geophys. Res., 85, 4893-4903, 1980.
Shao, X. M., The development and structure of lightning discharges observed by VHF radio interferometer, Ph.D. dissertation, N.M. Inst. of Mining and Technol., Socorro, N.M., 1993.
Takagi, M., VHF radiation from ground discharges, Proc. Res. Inst. Atmos. Nagoya Univ., 16, 163-168, 1969.
Taylor, W. L., A VHF technique for space-time mapping of lightning discharge processes, J. Geophys. Res., 83, 3575-3583, 1978.
Uman, M. A., et al., An unusual lightning flash at the NASA Kennedy Space Center, Science, ,•01, 9-16, 1978.
Uman, M. A., The Lightning Discharge, Academic, San Diego, Calif., 1987.
Warwick, J. W., C. O. Hayenga, and J. W. Brosnahan, In- terferometric directions of lightning sources at 34 MHz, J. Geophys. Res., 8J, 2457-2468, 1979.
C. O. Hayenga, 4855 Kings Ridge Blvd., Boulder, CO 80301. (e-mail: Internet 71674.1403•compuserve.com)
P. R. Krehbiel, X. M. Shao, and R. J. Thomas, Geophysical Research Center, New Mexico Institute of Mining and Technology, Socorro, NM 87801. (e-mall: Internet krehbiel•opus.nmt.edu; xuan-min•opus.nmt.edu; thomas•crane.nmt.edu)
C. T. Rhodes, Los Alamos National Laboratories, MS D466, Los Alamos, NM 87545. (e-mall: Internet ctr•lanl.gov)
(Received December 30, 1992; revised January 10, 1994; accepted January 28, 1994.)