numerical counterparts of grb host galaxies
TRANSCRIPT
arX
iv:a
stro
-ph/
0701
762v
1 2
6 Ja
n 20
07
Mon. Not. R. Astron. Soc. 000, 000–000 (0000) Printed 19 January 2014 (MN LATEX style file v2.2)
Numerical counterparts of GRB host galaxies
S. Courty1,2, G. Bjornsson & E. H. Gudmundsson1Science Institute, University of Iceland, Dunhaga 3, IS–107 Reykjavik, Iceland2Laboratoire de l’Univers et de ses Theories, CNRS UMR 8102,
Observatoire de Paris-Meudon,5 place Jules Janssen, 92195 Meudon, France
e-mail: courty, gulli, [email protected]
19 January 2014
ABSTRACT
We explore galaxy properties in general and properties of host galaxies of gamma-ray bursts (GRBs) in particular, using N-body/Eulerian hydrodynamic simulationsand the stellar population synthesis model, Starburst99, to infer observable properties.We identify simulated galaxies that have optical star formation rate (SFR) and SFR-to-luminosity ratio similar to those observed in a well-defined sample of ten hostgalaxies. Each of the numerical counterparts are found in catalogs at the same redshiftsas the observed hosts. The counterparts are found to be low-mass galaxies, with lowmass-to-light ratio, recent epoch of formation, and high ratio between the SFR and theaverage of the SFR. When compared to the overall galaxy population, they have colorsmuch bluer than the high-mass star-forming galaxy population. Although their SFRsspan a range of values, the specific rates of the numerical counterparts are equal to orhigher than the median values estimated at the different redshifts. We also emphasizethe strong relationships between the specific star formation rate (SFR) and quantitiesknown to reflect the star formation history of galaxies, i.e. color and mass-to-lightratio: At intermediate redshift, the faintest and bluest galaxies are also the objectswith the highest specific rates. These results suggest that GRB host galaxies are likelyto be drawn from the high specific SFR sub-population of galaxies, rather than thehigh SFR galaxy population. Finally, as indicated by our catalogs, in an extendedsample, the majority of GRB host galaxies is expected to have specific SFRs higherthan found in the magnitude-limited sample studied here.
Key words: cosmology: large-scale structure of Universe – galaxies: formation –galaxies: evolution – gamma rays: bursts
1 INTRODUCTION
Galaxies with a wide variety of properties are observed inthe universe and galaxy sub-populations contribute in adifferent way to the overall galaxy properties at differentredshifts. Important questions in present day cosmology in-clude investigations into how the different sub-populationscan be characterized, how sub-populations formed at highredshift evolve into galaxies in the local universe and howthese populations contribute to various properties of theoverall galaxy population. In this paper we use a numer-ical approach to extend our investigation of galaxy prop-erties (Courty et al. 2004, hereafter referred to as PaperI) that focused on the specific star formation rate. Whilethe star formation rate is a ’snapshot’ of the stellar activ-ity in a galaxy, the specific rate is an indicator of how thegalaxy forms its stellar mass relative to the total mass thathas been assembled through its entire lifetime, via mergers
and/or transformation of new accreted gas. The specific rateshould therefore give some insight into the star formationhistory of galaxies, as do other properties, such as colors.The specific SFR has been estimated in a number of ob-servational studies: Guzman et al. (1997) compare the spe-cific SFRs of compact blue galaxies with other galaxy popu-lations, Brinchmann et al. (2004) discuss the star-forminggalaxies of the SDSS, Bell et al. (2005) combine infrareddata from the Spitzer Space Telescope with optical data,and Feulner et al. (2005) estimate the specific SFR up toz = 5.
As in Paper I, we here focus on the properties of aparticular population of galaxies, namely the host galax-ies of long-duration gamma-ray bursts. The nature of thehosts and their evolution with redshift are still open ques-tions. The emphasis over the last few years has been onthe host galaxies of long-duration GRBs, which are seenas a powerful tracer of massive star formation in the uni-
2 Courty, Bjornsson & Gudmundsson
verse. It is now well established that at least some long-duration GRBs occur at the death of massive stars (e.g.Hjorth et al. 2003; Stanek et al. 2003) and in a cosmolog-ical context massive stars are very short-lived. Because oftheir extreme brightness, long-duration GRBs are an effec-tive way of locating distant galaxies, most of which are sofaint that they would go undetected in galaxy surveys. Infact, host galaxies fainter than magnitude 29 have alreadybeen detected (Jaunsen et al. 2003). In addition, GRBs havebeen detected out to a redshift higher than z = 6, and willlikely be detected to even higher redshifts. Rather detailedstudies of the local star forming regions in the hosts is there-fore possible (Berger et al. (2005), Berger et al. (2005)). Themost distant burst to date, GRB 050904 at z = 6.29(Tagliaferri et al. 2005; Kawai et al. 2005), has already re-vealed a number of interesting properties of the interstellarmedium of the host (Totani 2005), while information aboutgalaxy formation and evolution is yet to be explored in de-tail, mostly awaiting the increase of the currently modestsample size (around 50 hosts).
¿From individual studies of host galaxies of GRBs(Fruchter et al. 1999; Fynbo et al. 2003), comparison of hostsamples with other sources detected in various deep surveys(Le Floc’h et al. 2003), and statistical stellar populationsynthesis of the optical and near-infra-red host properties(Sokolov et al. 2001; Chary et al. 2002; Christensen et al.2004), indications are that host galaxies have particularcharacteristics: These galaxies tend to be optically sub-luminous, low-mass, blue, star-bursting galaxies, with youngstellar populations, a modest activity of optical star forma-tion, and perhaps low-metalicity and modest amount of dustobscuration, although this last feature still needs to be firmlyestablished. Le Floc’h et al. (2003) compare a large sampleof host galaxies of GRBs, observed in the near infra-red,with various galaxy surveys and find that the observed Kand R−band magnitudes of the hosts are comparable to thefield sources selected in optical/N-IR deep surveys, but dif-fer significantly from luminous and dusty starburst galaxiesobserved with ISO and SCUBA. Moreover they show blueR − K colors typical of the faint blue galaxy population inthe field at z = 1. Also, SCUBA sub-millimeter observationsof GRB host galaxies performed by Smith et al. (2005) sug-gest that most hosts are not luminous dusty star-forminggalaxies. Furthermore, Christensen et al. (2004) have stud-ied a magnitude-limited sample of hosts and estimate theratio between the rest-frame UV star formation rate andthe host optical luminosity. They suggest that the hosts aresimilar to those HDF galaxies that have the highest SFR-to-luminosity ratios.
In Paper I, we showed that among the population stillactively forming stars at low redshift, the high-mass galaxieshave much lower specific SFR than the low-mass galaxies.The non star-forming galaxies, that span the whole galaxymass range, are old galaxies while most of the stellar pop-ulations in the high specific SFR galaxies formed recently.At high redshift the trend of increasing specific SFR withdecreasing galaxy mass is also seen, but an interesting pointis that the cosmological evolution is much stronger for thehigh-mass than the low-mass galaxies. These trends agreein general well with the aforementioned observational esti-mates, to the extent that we concentrate on the qualitativebehavior of the specific SFR. Although not based on ob-
servable properties, the results of Paper I for the specificSFR suggest that a sub-population of faint and blue galax-ies, some of the characteristics of the GRB hosts, are likelyto belong to the high specific SFR galaxy population, ratherthan the high-SFR population.
In this paper, we extend the discussion of the propertiesof GRB host galaxies in Paper I, by combining the results ofthe same simulations as in that paper with the stellar pop-ulation synthesis (SPS) code, Starburst99 (Vazquez et al.2005), to infer observable properties. SPS codes allow us tocompute the spectral energy distributions of the simulatedgalaxies at different redshifts. We identify simulated galaxiesthat have both similar rest-frame ultraviolet SFRs and ra-tios between this SFR and the B−band luminosity as the tenobserved hosts of a well-defined sample (Christensen et al.(2004), hereafter Chr04). The numerical counterparts ofthese observed hosts are characterized by a variety of prop-erties, estimated either directly from the simulation or fromthe computation of the SEDs. In particular, for each galaxywe determine the mass, the ratio between the SFR andthe average of the SFR, SFR∗/〈SFR〉, the specific SFR,the epoch of formation, the R − K color, and the mass-to-light ratio. The properties of the counterparts are thencompared to the overall galaxy population, that is charac-terized through the close relationships between the specificSFR and the color index and mass-to-light ratio. This com-parison is, however, limited by the fact that the observedsample still only includes 10 hosts, spanning a large redshiftrange.
Although fairly small, the sample of Chr04 is the onlyavailable homogeneous sample that estimates the ratio be-tween the optical SFR and the luminosity. Information onother hosts does exist in the literature and other studies, e.g.Sollerman et al. (2005), use different star formation rate es-timators such as SFRHα
and SFROII, rather than the UV-
based indicator adopted in Chr04, but only for a couple ofhosts. A comprehensive study of a large host sample usingall available information awaits future studies. In Section3 we also briefly discuss the counterparts of GRB 000911and 030329, whose SFRUV and MB values are availablein Masetti et al. (2005) and Gorosabel et al. (2005), respec-tively.
The paper is organized as follows: In Section 2, we de-scribe briefly the simulation and use of the SPS code. Sec-tion 3 contains the main results of the paper. It starts bydiscussing the observed host sample we use (section 3.1)and the procedure used to identify the numerical counter-parts (section 3.2). We discuss the observational propertiesof the counterparts in section 3.3 and compare their prop-erties with those of the galaxy population in section 3.4.Section 4 concludes the paper.
2 NUMERICAL PROCEDURE
We repeat the simulation used in Paper I in order toobtain galaxy catalogs at the same redshifts as that ofthe observed GRB hosts in the sample of Chr04. Webriefly recall the numerical method and we refer to Pa-per I for details regarding the simulation. The three dimen-sional N-body/hydrodynamical code couples a PM schemefor computing gravitational forces with an Eulerian ap-
Numerical counterparts of GRB host galaxies 3
proach for solving the hydrodynamical equations. The dom-inant processes relevant for galaxy formation are included:Gravitation, hydrodynamical shocks and radiative cool-ing processes. Collisional ionization equilibrium is not as-sumed and the cooling rates are explicitly computed fromthe evolution of a primordial composition hydrogen-heliumplasma. The cosmological scenario adopted is a Λ−colddark matter model with the following parameters: H0 =70 km s−1 Mpc−1, ΩK = 0, Ωm = 0.3, ΩΛ = 0.7, Ωb =0.02h−2 with h = H0/100, σ8 = 0.91. The comoving sizeof the computational volume is 32 h−1Mpc and the simu-lation has 2563 dark matter particles and an equal numberof grid cells. Galaxy formation is introduced using a phe-nomenological approach. At each time step, in cells whosegas satisfies given criteria, a fraction of the gas is turned intoa stellar particle of mass m∗ and epoch of formation a∗, thescale-factor corresponding to the cosmic time, t∗. The crite-ria are the following: The cooling time must be less than thedynamical time, tcool < tdyn; the baryonic density contrast,(1 + δB), must be higher than a threshold (1 + δB)s = 5.5;the gas must be in a converging flow, ∇ · ~v < 0; and thesize of the cell must be less than the Jean’s length, given byλJ = cs(π/Gρ)1/2. The mass m∗ is given by mB(t0)∆t/t∗,where ∆t is the timestep, the characteristic time is takento be t∗ = max(tdyn, 108 yr), and mB(t0) is the baryonicmass enclosed within the grid cell. Galaxy-like objects arethen defined, at any redshift, by grouping the stellar parti-cles with a friend-of-friend algorithm. A simulated galaxy istherefore a collection of stellar particles of different massesformed at different epochs.
At any redshift, galaxies are characterized by theirmass, M , defined as the sum of the mass of all the stel-lar particles the galaxy is composed of; an epoch of forma-tion, defined to be the mass-weighted average of the epochof formation of all its stellar particles; and a star forma-tion rate, SFR∗, defined as the amount of stellar materialformed in the previous 108 yr. We also estimate the specificstar formation rate, ǫ ≡ log(1011 yr SFR∗/M), a quantitythat measures the efficiency of the conversion of the gas intostellar material relative to the galaxy mass. We have, as inPaper I, only considered galaxies with a mass higher than5 ·108 M⊙ in the simulated catalogs. We refer to Paper I foran illustration of the different sub-populations of galaxiesobtained.
Considering each stellar particle as a homogeneous stel-lar population, the total spectral energy distribution (SED)of a galaxy can be computed from synthesis codes. Evolu-tionary synthesis codes combine stellar evolutionary theoryto describe the time evolution of model stars, stellar atmo-sphere theory to transform quantities from the theoreticalspace to the observational one, and the stellar birth rate,giving the number of stars with a given initial mass formedat a given time. The stellar birth rate comes from the starformation history, which gives the number of stars born ina given time, and the initial mass function (IMF), whichgives the relative number of stars born as a function of mass(see Cervino & Luridiana (2005) for a discussion regardingthe uncertainties of the synthesis codes). In our procedure,the star formation history of a galaxy comes directly fromthe formation epoch and mass of all its stellar populationsas recorded in the simulation. We use the stellar popula-tion synthesis model, Starburst99 (Leitherer et al. 1999) in
its latest version (Vazquez et al. 2005), to derive observableproperties. The main change in this version is the introduc-tion of the Padova stellar evolutionary tracks, allowing thecomputation of stellar evolution for old and low-mass starsas well as high-mass stars.
We start by defining a SED template: we consider a sin-gle stellar population of 106 M⊙, assumed to form instan-taneously and evolve passively over a maximal time of 15Gyr. The SED is computed at 1221 points between 91 A and160 µm. We select in Starburst99 the “Padova AGB” evo-lutionary tracks, selection of the 1992 − 1994 Padova trackswith thermally pulsing AGB stars added, with a metalic-ity of Z = 0.004 = 0.2Z⊙, where Z⊙ ≃ 0.02. We choosea Salpeter IMF, dP/dm = m−2.35, with low and high-masscut-offs at 0.1 and 100 M⊙, respectively. The other input pa-rameters adopted (supernova cut-off mass, black hole cut-offmass, wind model, interpolation in mass method, model at-mosphere), are the standard ones. We refer the reader to theStarburst99 website1 for a full explanation.
The total SED of a galaxy at a given redshift is thesum of the SEDs of all the stellar populations present in thegalaxy. The SED of a stellar particle, at a given redshift, isthe SED template evolved on the time t(z)− t∗, in order totake cosmological expansion into account, and scaled to themass of the stellar population with the factor m∗/(10
6M⊙).To properly include the contribution of those stellar particlesthat formed at the simulation output time, t(z), the SED isevolved over 104 yr. Note that this procedure is applied tothe simulated galaxies after the simulation run, and not dur-ing it. Nevertheless, the inferred SED of a galaxy accountsfor the formation all along the simulation of different stellarpopulations. A caveat of the procedure is that the simulationdoes not take into account any evolution of the gas metal-icity, and our derived observable properties are based on asingle template. Due to the higher UV-luminosities of low-metalicity stars, assuming higher metalicity tracks would de-crease the total UV-luminosity. However, in the catalog atz = 1 almost all of the non star-forming galaxies have lumi-nosities more than twice the luminosity computed with so-lar metalicity tracks, whereas there are only 19 star-forminggalaxies with such a large luminosity.
Star formation rates can be derived from the UV contin-uum or the Hα luminosity using appropriate proportionalitycoefficients. These coefficients are derived from stellar pop-ulation synthesis models, involving an initial mass function(IMF) and star formation history, by looking for a propor-tionality relation assuming that the star formation rate isconstant in the later phases on given timescales. These areroughly 107 yr for Hα and 108 yr for the UV. These coef-ficients therefore depend on the IMF and its slope, the up-per and lower mass cut-off, and the metalicity (Boselli et al.2001). Since one of the purposes of this paper is to find thenumerical counterparts of observed host galaxies, we use thesame indicator of the star formation rate as Chr04, and es-timate it from the UV continuum at 2800 A, although theSFRs of the two hosts at the highest redshifts are estimatedusing the UV continuum at 1500 A in Chr04. The calibra-tion factor used to convert the luminosity at 2800 A intoSFR is 1.4 × 10⁻²⁸, in units of (M⊙ yr−1)(erg s−1 Hz−1)−1
1 http://www.stsci.edu/science/starburst99/
4 Courty, Bjornsson & Gudmundsson
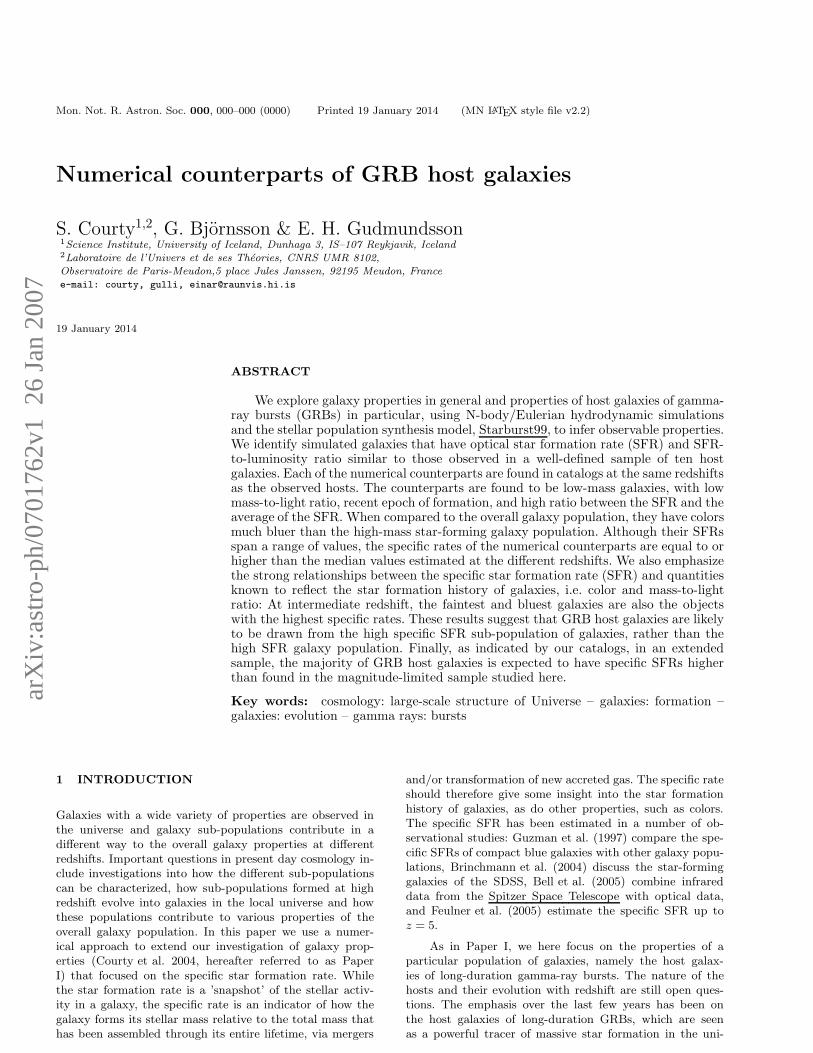
Figure 1. Comparison of the star formation rate SFR∗ withSFRUV obtained from the synthetic spectrum for galaxies atz = 1. Non-star forming galaxies are for display purposes plot-ted at SFR∗ = 0.02 M⊙ yr−1. The diagonal dashed line showsSFRUV = SFR∗.
(Kennicutt 1998). In our procedure the luminosity at 2800A is obtained by averaging the spectrum over 20 A around2800 A. Note that, although our spectral energy distribu-tions are determined at sub-solar metalicity, we adopt theusual calibration to convert the UV luminosity into SFRthat is estimated at solar metalicity. At lower metalicity thecalibration increases due to the higher luminosity of low-metalicity stars. The SFR of low-metalicity galaxies whenestimated with a calibration at solar metalicity is thus over-estimated. The evolution of the calibration associated withdifferent SFR indicators is estimated in Sullivan et al. (2001)and Bicker & Fritze-v. Alvensleben (2005), for instance. AtZ = 0.2Z⊙, the latter paper found that the SFR is overes-timated by a factor 1.4, compared to our calibration.
In Figure 1, we compare the SFR∗, computed directlyfrom the simulation, with the SFR estimated from the syn-thetic spectrum of the simulated galaxies at z = 1. Non-star forming galaxies (i.e. with SFR∗=0) are for displaypurposes plotted at SFR∗ = 0.02 M⊙ yr−1. At this red-shift, the galaxy population includes 1927 objects, with 1148star-forming galaxies (as expected, the number of non star-forming galaxies is larger at z = 0). The diagonal dashedline shows SFRUV = SFR∗. Despite the scatter in the dia-gram, it is clear that the two different estimates are of thesame order. The estimate from the simulations is a factor ofabout 2 lower than that obtained from the synthetic spectra.
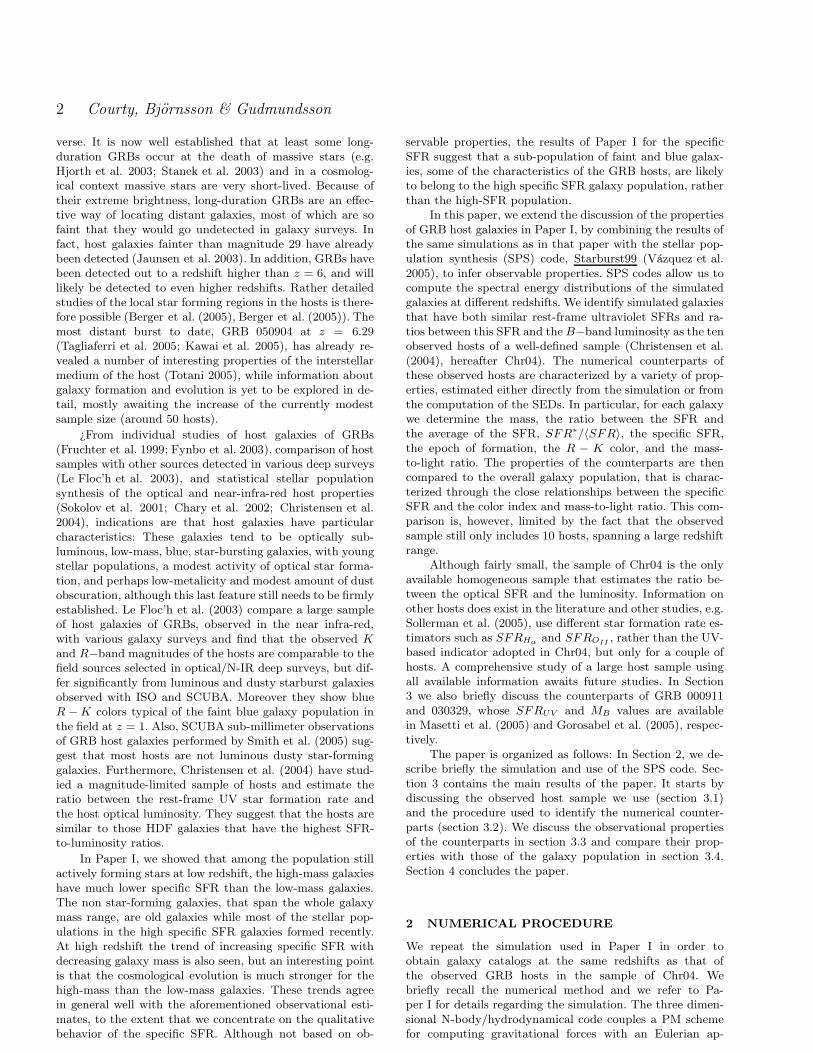
Figure 2 shows the B− and K−band magnitudes asfunctions of the galaxy mass for the simulated catalog atz = 1. The B and K−band magnitudes are computed usingthe “Buser’s B3” filter and the “IR K filter + Palomar 200IR detectors + atmosphere 0.57” from the Galaxev pack-age (Bruzual & Charlot 2003). Different symbols distinguishstar-forming and non star-forming galaxies. Note that bothare strongly correlated with the mass. There is much less dis-persion in MK since the B−band luminosities are dominatedby the flux from young massive stars whereas LK is a bettertracer of the overall stellar population. The correspondingplots at z = 0 would show the same trend although quantita-tively different. For instance, the MK−mass relation showsslightly more dispersion and galaxies at M∗
K = −24.2, the
Figure 2. The mass-magnitude diagrams (upper panel: K−band,lower-panel: B−band) for the simulated galaxies at z = 1. In bothpanels, dots denote star-forming galaxies while the small dotsdenote the non star-forming galaxies. The estimate of M∗
Ks=
−24.7 around z = 1 from the K20 galaxy survey (Pozzetti et al.2003) is marked by the dotted horizontal line.
characteristic magnitude of the galaxy luminosity functionin Cole et al. (2001), have a mass of ∼ 1011 M⊙.
In the following sections we consider other quantities tocharacterize galaxies. The lifetime of a galaxy is estimatedat a given redshift, t(z)− tform, where tform is the epoch ofthe formation of the first stellar population. From this theaverage of the star formation rate, 〈SFR〉, at a given red-shift is determined as the amount of stellar material formedover the lifetime of the galaxy. The SFR∗ is compared withthe average through the ratio SFR∗/〈SFR〉, that may beseen as analogous to the so-called birth-rate parameter, b,(Kennicutt et al. 1994). The mass-to-light ratios in the Band K−bands are estimated using the solar magnitudes of5.45 and 3.3, respectively, and the color R − K using the“Cousins R” filter from the Galaxev package. Finally, theratio between the rest-frame ultraviolet SFR and the lumi-nosity, SFRUV /(LB/L∗
B), uses the characteristic magnitudeor magnitude at the break of the local galaxy luminosityfunction, M∗
B = −21. This ratio is sometimes called thespecific SFR as e.g., in Chr04, but we will refer to it by theterm SFR-to-luminosity ratio and reserve the term specificSFR for the ratio between the SFR and the galaxy mass, asis customary in the literature.
Numerical counterparts of GRB host galaxies 5
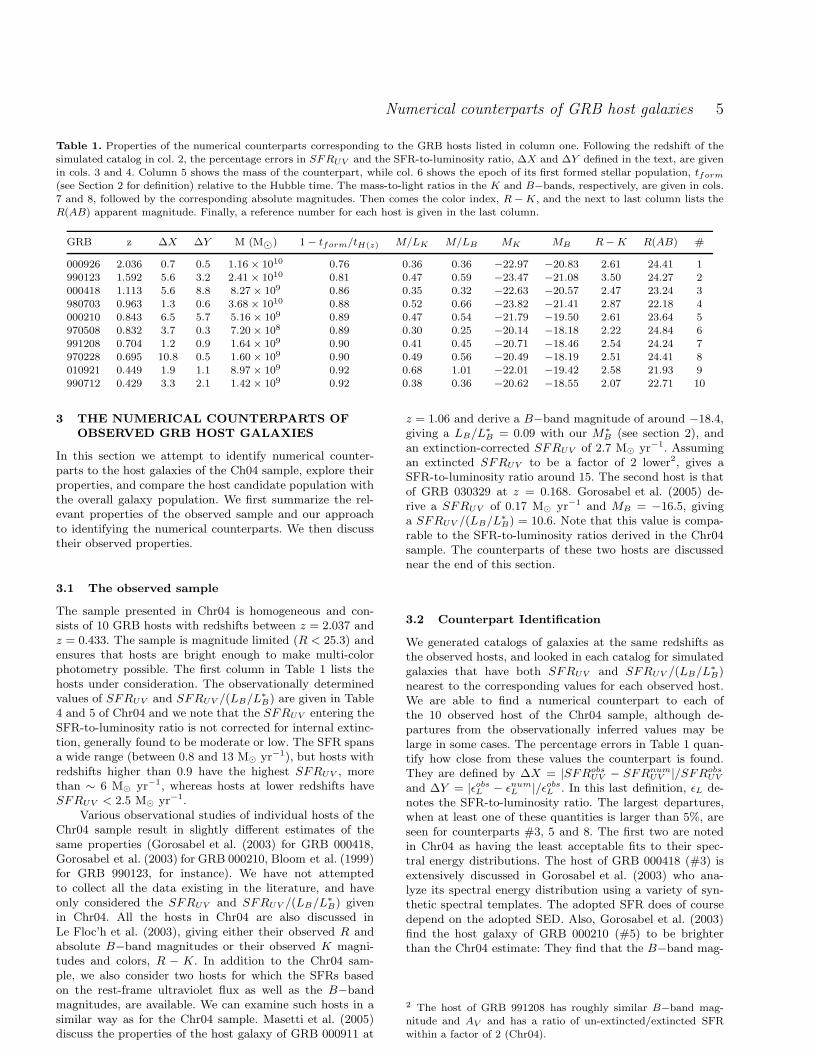
Table 1. Properties of the numerical counterparts corresponding to the GRB hosts listed in column one. Following the redshift of thesimulated catalog in col. 2, the percentage errors in SFRUV and the SFR-to-luminosity ratio, ∆X and ∆Y defined in the text, are givenin cols. 3 and 4. Column 5 shows the mass of the counterpart, while col. 6 shows the epoch of its first formed stellar population, tform
(see Section 2 for definition) relative to the Hubble time. The mass-to-light ratios in the K and B−bands, respectively, are given in cols.7 and 8, followed by the corresponding absolute magnitudes. Then comes the color index, R − K, and the next to last column lists theR(AB) apparent magnitude. Finally, a reference number for each host is given in the last column.
GRB z ∆X ∆Y M (M⊙) 1 − tform/tH(z) M/LK M/LB MK MB R − K R(AB) #
000926 2.036 0.7 0.5 1.16 × 10¹⁰ 0.76 0.36 0.36 −22.97 −20.83 2.61 24.41 1990123 1.592 5.6 3.2 2.41 × 10¹⁰ 0.81 0.47 0.59 −23.47 −21.08 3.50 24.27 2000418 1.113 5.6 8.8 8.27 × 10⁹ 0.86 0.35 0.32 −22.63 −20.57 2.47 23.24 3980703 0.963 1.3 0.6 3.68 × 10¹⁰ 0.88 0.52 0.66 −23.82 −21.41 2.87 22.18 4000210 0.843 6.5 5.7 5.16 × 10⁹ 0.89 0.47 0.54 −21.79 −19.50 2.61 23.64 5970508 0.832 3.7 0.3 7.20 × 10⁸ 0.89 0.30 0.25 −20.14 −18.18 2.22 24.84 6991208 0.704 1.2 0.9 1.64 × 10⁹ 0.90 0.41 0.45 −20.71 −18.46 2.54 24.24 7970228 0.695 10.8 0.5 1.60 × 10⁹ 0.90 0.49 0.56 −20.49 −18.19 2.51 24.41 8010921 0.449 1.9 1.1 8.97 × 10⁹ 0.92 0.68 1.01 −22.01 −19.42 2.58 21.93 9990712 0.429 3.3 2.1 1.42 × 10⁹ 0.92 0.38 0.36 −20.62 −18.55 2.07 22.71 10
3 THE NUMERICAL COUNTERPARTS OF
OBSERVED GRB HOST GALAXIES
In this section we attempt to identify numerical counter-parts to the host galaxies of the Ch04 sample, explore theirproperties, and compare the host candidate population withthe overall galaxy population. We first summarize the rel-evant properties of the observed sample and our approachto identifying the numerical counterparts. We then discusstheir observed properties.
3.1 The observed sample
The sample presented in Chr04 is homogeneous and con-sists of 10 GRB hosts with redshifts between z = 2.037 andz = 0.433. The sample is magnitude limited (R < 25.3) andensures that hosts are bright enough to make multi-colorphotometry possible. The first column in Table 1 lists thehosts under consideration. The observationally determinedvalues of SFRUV and SFRUV /(LB/L∗
B) are given in Table4 and 5 of Chr04 and we note that the SFRUV entering theSFR-to-luminosity ratio is not corrected for internal extinc-tion, generally found to be moderate or low. The SFR spansa wide range (between 0.8 and 13 M⊙ yr−1), but hosts withredshifts higher than 0.9 have the highest SFRUV , morethan ∼ 6 M⊙ yr−1, whereas hosts at lower redshifts haveSFRUV < 2.5 M⊙ yr−1.
Various observational studies of individual hosts of theChr04 sample result in slightly different estimates of thesame properties (Gorosabel et al. (2003) for GRB 000418,Gorosabel et al. (2003) for GRB 000210, Bloom et al. (1999)for GRB 990123, for instance). We have not attemptedto collect all the data existing in the literature, and haveonly considered the SFRUV and SFRUV /(LB/L∗
B) givenin Chr04. All the hosts in Chr04 are also discussed inLe Floc’h et al. (2003), giving either their observed R andabsolute B−band magnitudes or their observed K magni-tudes and colors, R − K. In addition to the Chr04 sam-ple, we also consider two hosts for which the SFRs basedon the rest-frame ultraviolet flux as well as the B−bandmagnitudes, are available. We can examine such hosts in asimilar way as for the Chr04 sample. Masetti et al. (2005)discuss the properties of the host galaxy of GRB 000911 at
z = 1.06 and derive a B−band magnitude of around −18.4,giving a LB/L∗
B = 0.09 with our M∗B (see section 2), and
an extinction-corrected SFRUV of 2.7 M⊙ yr−1. Assumingan extincted SFRUV to be a factor of 2 lower2, gives aSFR-to-luminosity ratio around 15. The second host is thatof GRB 030329 at z = 0.168. Gorosabel et al. (2005) de-rive a SFRUV of 0.17 M⊙ yr−1 and MB = −16.5, givinga SFRUV /(LB/L∗
B) = 10.6. Note that this value is compa-rable to the SFR-to-luminosity ratios derived in the Chr04sample. The counterparts of these two hosts are discussednear the end of this section.
3.2 Counterpart Identification
We generated catalogs of galaxies at the same redshifts asthe observed hosts, and looked in each catalog for simulatedgalaxies that have both SFRUV and SFRUV /(LB/L∗
B)nearest to the corresponding values for each observed host.We are able to find a numerical counterpart to each ofthe 10 observed host of the Chr04 sample, although de-partures from the observationally inferred values may belarge in some cases. The percentage errors in Table 1 quan-tify how close from these values the counterpart is found.They are defined by ∆X = |SFRobs
UV − SFRnumUV |/SFRobs
UV
and ∆Y = |ǫobsL − ǫnum
L |/ǫobsL . In this last definition, ǫL de-
notes the SFR-to-luminosity ratio. The largest departures,when at least one of these quantities is larger than 5%, areseen for counterparts #3, 5 and 8. The first two are notedin Chr04 as having the least acceptable fits to their spec-tral energy distributions. The host of GRB 000418 (#3) isextensively discussed in Gorosabel et al. (2003) who ana-lyze its spectral energy distribution using a variety of syn-thetic spectral templates. The adopted SFR does of coursedepend on the adopted SED. Also, Gorosabel et al. (2003)find the host galaxy of GRB 000210 (#5) to be brighterthan the Chr04 estimate: They find that the B−band mag-
2 The host of GRB 991208 has roughly similar B−band mag-nitude and AV and has a ratio of un-extincted/extincted SFRwithin a factor of 2 (Chr04).
6 Courty, Bjornsson & Gudmundsson
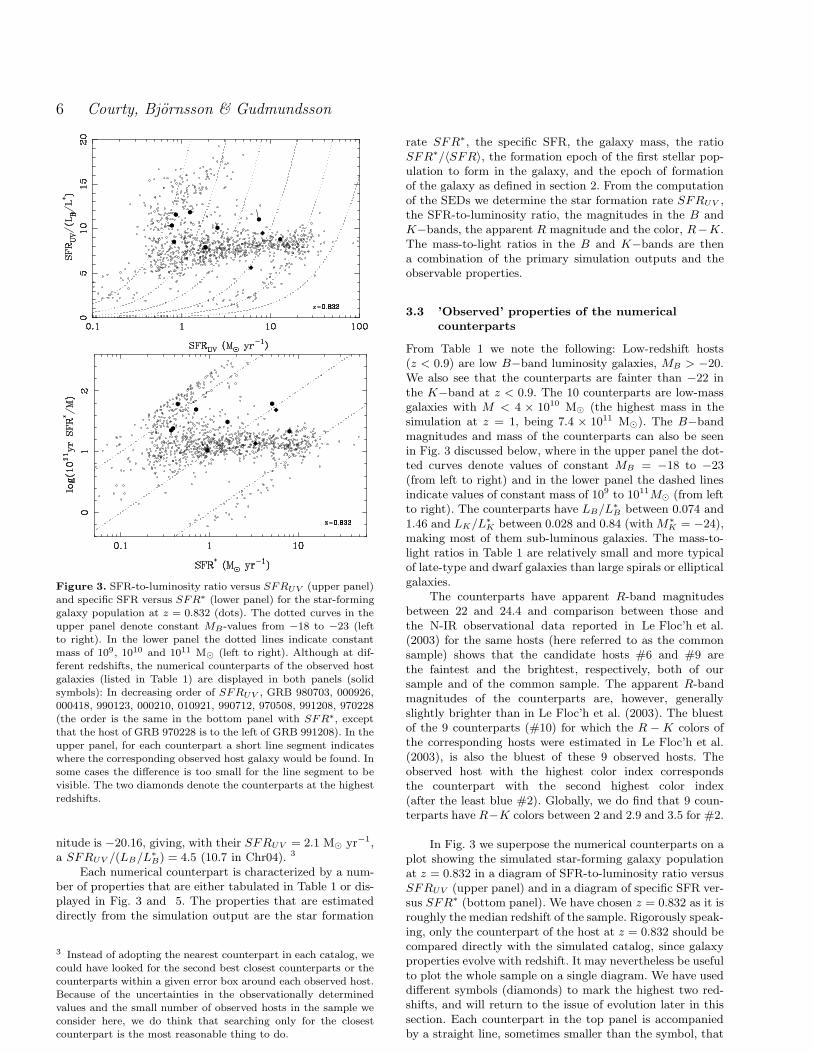
Figure 3. SFR-to-luminosity ratio versus SFRUV (upper panel)and specific SFR versus SFR∗ (lower panel) for the star-forminggalaxy population at z = 0.832 (dots). The dotted curves in theupper panel denote constant MB-values from −18 to −23 (leftto right). In the lower panel the dotted lines indicate constantmass of 109, 1010 and 1011 M⊙ (left to right). Although at dif-ferent redshifts, the numerical counterparts of the observed hostgalaxies (listed in Table 1) are displayed in both panels (solidsymbols): In decreasing order of SFRUV , GRB 980703, 000926,000418, 990123, 000210, 010921, 990712, 970508, 991208, 970228(the order is the same in the bottom panel with SFR∗, exceptthat the host of GRB 970228 is to the left of GRB 991208). In theupper panel, for each counterpart a short line segment indicateswhere the corresponding observed host galaxy would be found. Insome cases the difference is too small for the line segment to bevisible. The two diamonds denote the counterparts at the highest
redshifts.
nitude is −20.16, giving, with their SFRUV = 2.1 M⊙ yr−1,a SFRUV /(LB/L∗
B) = 4.5 (10.7 in Chr04). 3
Each numerical counterpart is characterized by a num-ber of properties that are either tabulated in Table 1 or dis-played in Fig. 3 and 5. The properties that are estimateddirectly from the simulation output are the star formation
3 Instead of adopting the nearest counterpart in each catalog, wecould have looked for the second best closest counterparts or thecounterparts within a given error box around each observed host.Because of the uncertainties in the observationally determinedvalues and the small number of observed hosts in the sample weconsider here, we do think that searching only for the closestcounterpart is the most reasonable thing to do.
rate SFR∗, the specific SFR, the galaxy mass, the ratioSFR∗/〈SFR〉, the formation epoch of the first stellar pop-ulation to form in the galaxy, and the epoch of formationof the galaxy as defined in section 2. From the computationof the SEDs we determine the star formation rate SFRUV ,the SFR-to-luminosity ratio, the magnitudes in the B andK−bands, the apparent R magnitude and the color, R−K.The mass-to-light ratios in the B and K−bands are thena combination of the primary simulation outputs and theobservable properties.
3.3 ’Observed’ properties of the numerical
counterparts
From Table 1 we note the following: Low-redshift hosts(z < 0.9) are low B−band luminosity galaxies, MB > −20.We also see that the counterparts are fainter than −22 inthe K−band at z < 0.9. The 10 counterparts are low-massgalaxies with M < 4 × 10¹⁰ M⊙ (the highest mass in thesimulation at z = 1, being 7.4 × 10¹¹ M⊙). The B−bandmagnitudes and mass of the counterparts can also be seenin Fig. 3 discussed below, where in the upper panel the dot-ted curves denote values of constant MB = −18 to −23(from left to right) and in the lower panel the dashed linesindicate values of constant mass of 109 to 1011M⊙ (from leftto right). The counterparts have LB/L∗
B between 0.074 and1.46 and LK/L∗
K between 0.028 and 0.84 (with M∗K = −24),
making most of them sub-luminous galaxies. The mass-to-light ratios in Table 1 are relatively small and more typicalof late-type and dwarf galaxies than large spirals or ellipticalgalaxies.
The counterparts have apparent R-band magnitudesbetween 22 and 24.4 and comparison between those andthe N-IR observational data reported in Le Floc’h et al.(2003) for the same hosts (here referred to as the commonsample) shows that the candidate hosts #6 and #9 arethe faintest and the brightest, respectively, both of oursample and of the common sample. The apparent R-bandmagnitudes of the counterparts are, however, generallyslightly brighter than in Le Floc’h et al. (2003). The bluestof the 9 counterparts (#10) for which the R − K colors ofthe corresponding hosts were estimated in Le Floc’h et al.(2003), is also the bluest of these 9 observed hosts. Theobserved host with the highest color index correspondsthe counterpart with the second highest color index(after the least blue #2). Globally, we do find that 9 coun-terparts have R−K colors between 2 and 2.9 and 3.5 for #2.
In Fig. 3 we superpose the numerical counterparts on aplot showing the simulated star-forming galaxy populationat z = 0.832 in a diagram of SFR-to-luminosity ratio versusSFRUV (upper panel) and in a diagram of specific SFR ver-sus SFR∗ (bottom panel). We have chosen z = 0.832 as it isroughly the median redshift of the sample. Rigorously speak-ing, only the counterpart of the host at z = 0.832 should becompared directly with the simulated catalog, since galaxyproperties evolve with redshift. It may nevertheless be usefulto plot the whole sample on a single diagram. We have useddifferent symbols (diamonds) to mark the highest two red-shifts, and will return to the issue of evolution later in thissection. Each counterpart in the top panel is accompaniedby a straight line, sometimes smaller than the symbol, that
Numerical counterparts of GRB host galaxies 7
indicates how well the properties of that numerical coun-terpart match those of the observed host (the difficulty inobtaining a good counterpart for host #3 is clearly seen). Asnoted above, the hosts have various SFRs, be it either theSFRUV or the SFR∗, but they have high SFR-to-luminosityratio and high specific rate, as they all lie in the upper halfof both panels in Fig. 3. The specific SFR and the SFR-to-luminosity ratio would be even better correlated if the latterquantity is based on the K−band luminosity, according tothe magnitude-mass diagrams in Fig. 2.
3.4 Comparison with the overall galaxy
population
Even if some aspects of the simulation may be incomplete, itprovides us with catalogs of galaxies at various redshifts inwhich different galaxy populations may be distinguished. Af-ter defining a particular sub-population of galaxies e.g. sim-ilar to the host galaxies of GRBs, an important issue isto compare this particular population to the overall galaxypopulation. Such a comparison is in the present case limitedby the fact that the observed sample includes only 10 hosts,spanning a wide redshift range where cosmological evolutioncannot be neglected.
3.4.1 The relationship between the specific SFR and the
color index
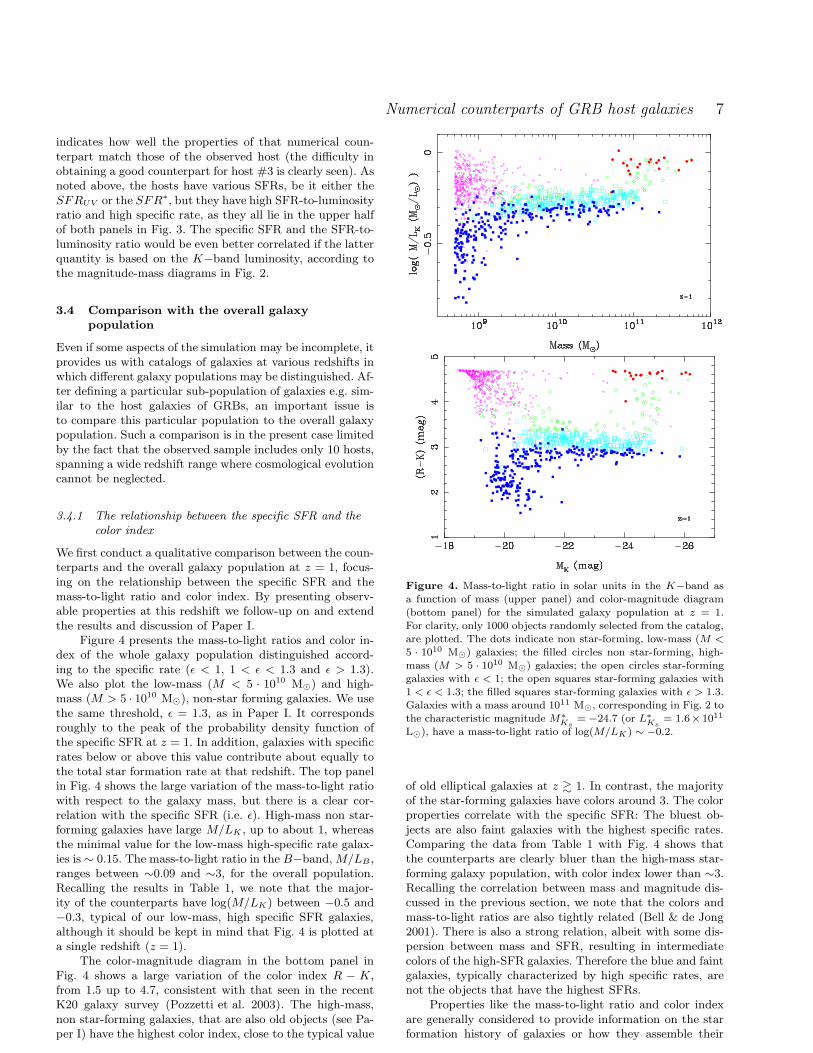
We first conduct a qualitative comparison between the coun-terparts and the overall galaxy population at z = 1, focus-ing on the relationship between the specific SFR and themass-to-light ratio and color index. By presenting observ-able properties at this redshift we follow-up on and extendthe results and discussion of Paper I.
Figure 4 presents the mass-to-light ratios and color in-dex of the whole galaxy population distinguished accord-ing to the specific rate (ǫ < 1, 1 < ǫ < 1.3 and ǫ > 1.3).We also plot the low-mass (M < 5 · 1010 M⊙) and high-mass (M > 5 · 1010 M⊙), non-star forming galaxies. We usethe same threshold, ǫ = 1.3, as in Paper I. It correspondsroughly to the peak of the probability density function ofthe specific SFR at z = 1. In addition, galaxies with specificrates below or above this value contribute about equally tothe total star formation rate at that redshift. The top panelin Fig. 4 shows the large variation of the mass-to-light ratiowith respect to the galaxy mass, but there is a clear cor-relation with the specific SFR (i.e. ǫ). High-mass non star-forming galaxies have large M/LK , up to about 1, whereasthe minimal value for the low-mass high-specific rate galax-ies is ∼ 0.15. The mass-to-light ratio in the B−band, M/LB ,ranges between ∼0.09 and ∼3, for the overall population.Recalling the results in Table 1, we note that the major-ity of the counterparts have log(M/LK) between −0.5 and−0.3, typical of our low-mass, high specific SFR galaxies,although it should be kept in mind that Fig. 4 is plotted ata single redshift (z = 1).
The color-magnitude diagram in the bottom panel inFig. 4 shows a large variation of the color index R − K,from 1.5 up to 4.7, consistent with that seen in the recentK20 galaxy survey (Pozzetti et al. 2003). The high-mass,non star-forming galaxies, that are also old objects (see Pa-per I) have the highest color index, close to the typical value
Figure 4. Mass-to-light ratio in solar units in the K−band asa function of mass (upper panel) and color-magnitude diagram
(bottom panel) for the simulated galaxy population at z = 1.For clarity, only 1000 objects randomly selected from the catalog,are plotted. The dots indicate non star-forming, low-mass (M <5 · 1010 M⊙) galaxies; the filled circles non star-forming, high-mass (M > 5 · 1010 M⊙) galaxies; the open circles star-forminggalaxies with ǫ < 1; the open squares star-forming galaxies with1 < ǫ < 1.3; the filled squares star-forming galaxies with ǫ > 1.3.Galaxies with a mass around 1011 M⊙, corresponding in Fig. 2 tothe characteristic magnitude M∗
Ks= −24.7 (or L∗
Ks= 1.6× 10¹¹
L⊙), have a mass-to-light ratio of log(M/LK ) ∼ −0.2.
of old elliptical galaxies at z & 1. In contrast, the majorityof the star-forming galaxies have colors around 3. The colorproperties correlate with the specific SFR: The bluest ob-jects are also faint galaxies with the highest specific rates.Comparing the data from Table 1 with Fig. 4 shows thatthe counterparts are clearly bluer than the high-mass star-forming galaxy population, with color index lower than ∼3.Recalling the correlation between mass and magnitude dis-cussed in the previous section, we note that the colors andmass-to-light ratios are also tightly related (Bell & de Jong2001). There is also a strong relation, albeit with some dis-persion between mass and SFR, resulting in intermediatecolors of the high-SFR galaxies. Therefore the blue and faintgalaxies, typically characterized by high specific rates, arenot the objects that have the highest SFRs.
Properties like the mass-to-light ratio and color indexare generally considered to provide information on the starformation history of galaxies or how they assemble their
8 Courty, Bjornsson & Gudmundsson
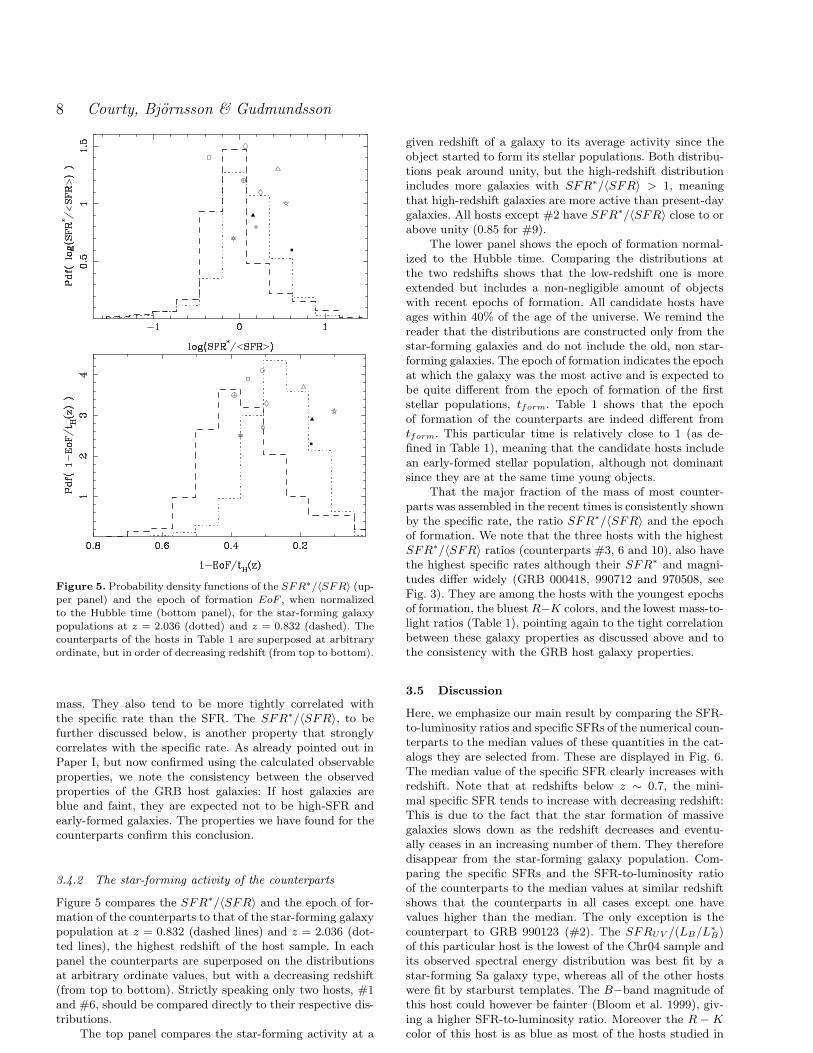
Figure 5. Probability density functions of the SFR∗/〈SFR〉 (up-per panel) and the epoch of formation EoF , when normalizedto the Hubble time (bottom panel), for the star-forming galaxypopulations at z = 2.036 (dotted) and z = 0.832 (dashed). Thecounterparts of the hosts in Table 1 are superposed at arbitraryordinate, but in order of decreasing redshift (from top to bottom).
mass. They also tend to be more tightly correlated withthe specific rate than the SFR. The SFR∗/〈SFR〉, to befurther discussed below, is another property that stronglycorrelates with the specific rate. As already pointed out inPaper I, but now confirmed using the calculated observableproperties, we note the consistency between the observedproperties of the GRB host galaxies: If host galaxies areblue and faint, they are expected not to be high-SFR andearly-formed galaxies. The properties we have found for thecounterparts confirm this conclusion.
3.4.2 The star-forming activity of the counterparts
Figure 5 compares the SFR∗/〈SFR〉 and the epoch of for-mation of the counterparts to that of the star-forming galaxypopulation at z = 0.832 (dashed lines) and z = 2.036 (dot-ted lines), the highest redshift of the host sample. In eachpanel the counterparts are superposed on the distributionsat arbitrary ordinate values, but with a decreasing redshift(from top to bottom). Strictly speaking only two hosts, #1and #6, should be compared directly to their respective dis-tributions.
The top panel compares the star-forming activity at a
given redshift of a galaxy to its average activity since theobject started to form its stellar populations. Both distribu-tions peak around unity, but the high-redshift distributionincludes more galaxies with SFR∗/〈SFR〉 > 1, meaningthat high-redshift galaxies are more active than present-daygalaxies. All hosts except #2 have SFR∗/〈SFR〉 close to orabove unity (0.85 for #9).
The lower panel shows the epoch of formation normal-ized to the Hubble time. Comparing the distributions atthe two redshifts shows that the low-redshift one is moreextended but includes a non-negligible amount of objectswith recent epochs of formation. All candidate hosts haveages within 40% of the age of the universe. We remind thereader that the distributions are constructed only from thestar-forming galaxies and do not include the old, non star-forming galaxies. The epoch of formation indicates the epochat which the galaxy was the most active and is expected tobe quite different from the epoch of formation of the firststellar populations, tform. Table 1 shows that the epochof formation of the counterparts are indeed different fromtform. This particular time is relatively close to 1 (as de-fined in Table 1), meaning that the candidate hosts includean early-formed stellar population, although not dominantsince they are at the same time young objects.
That the major fraction of the mass of most counter-parts was assembled in the recent times is consistently shownby the specific rate, the ratio SFR∗/〈SFR〉 and the epochof formation. We note that the three hosts with the highestSFR∗/〈SFR〉 ratios (counterparts #3, 6 and 10), also havethe highest specific rates although their SFR∗ and magni-tudes differ widely (GRB 000418, 990712 and 970508, seeFig. 3). They are among the hosts with the youngest epochsof formation, the bluest R−K colors, and the lowest mass-to-light ratios (Table 1), pointing again to the tight correlationbetween these galaxy properties as discussed above and tothe consistency with the GRB host galaxy properties.
3.5 Discussion
Here, we emphasize our main result by comparing the SFR-to-luminosity ratios and specific SFRs of the numerical coun-terparts to the median values of these quantities in the cat-alogs they are selected from. These are displayed in Fig. 6.The median value of the specific SFR clearly increases withredshift. Note that at redshifts below z ∼ 0.7, the mini-mal specific SFR tends to increase with decreasing redshift:This is due to the fact that the star formation of massivegalaxies slows down as the redshift decreases and eventu-ally ceases in an increasing number of them. They thereforedisappear from the star-forming galaxy population. Com-paring the specific SFRs and the SFR-to-luminosity ratioof the counterparts to the median values at similar redshiftshows that the counterparts in all cases except one havevalues higher than the median. The only exception is thecounterpart to GRB 990123 (#2). The SFRUV /(LB/L∗
B)of this particular host is the lowest of the Chr04 sample andits observed spectral energy distribution was best fit by astar-forming Sa galaxy type, whereas all of the other hostswere fit by starburst templates. The B−band magnitude ofthis host could however be fainter (Bloom et al. 1999), giv-ing a higher SFR-to-luminosity ratio. Moreover the R − Kcolor of this host is as blue as most of the hosts studied in
Numerical counterparts of GRB host galaxies 9
Figure 6. The median values (crosses) of the SFR-to-luminosityratio (top) and specific SFR (bottom) for the star-forming galaxypopulations at the redshifts of the GRB hosts. The range of val-ues for each catalog is shown by the length of the vertical lines.Diamonds refer to the numerical counterpart in each case. Thetwo squares are the counterparts of GRB 000911 and 030329 hoststhat are briefly discussed at the end of Section 3.
Le Floc’h et al. (2003), whereas it is the reddest one of oursample, as seen above (see Table 1).
It is interesting to note that Chary et al. (2002) esti-mate the specific SFRs of hosts #2, 4, 6, 7 and 8, althoughtheir observational study is based on extinction-correctedSFRs, and thus their derived specific rates are much higherthan our results. The observed hosts #4, 6, 7, and 8 areamong those with the highest specific SFR of the wholeChary et al. (2002) sample. They are also found to havehigher specific rates than local starbursts have. The numer-ical counterparts to #6, 7 and 8 have specific rates wellabove the median values (the first three objects on the leftin Fig. 3).
The two squares in Fig. 6 show the SFR-to-luminosityratio and the specific SFR of the counterparts of the hostsof GRB 000911 and 030329, discussed at the beginning ofthis section. These counterparts were searched for in cat-alogs at slightly different redshifts from the host redshifts,z = 1 and z = 0.133, respectively. The counterpart of GRB000911 (∆X = 0.3% and ∆Y = 5.2%) is a low-mass, youngobject (M = 1.1×10⁹ M⊙, 1−EoF/tH(z)=0.37) with a highspecific rate (ǫ=1.87), blue color R −K = 2.12 and a mass-to-light ratio M/LK = 0.36. The closest counterpart that
we find for the host of GRB 030329 has a lower SFR-to-luminosity ratio than the observed estimate (∆X = 1.7%but ∆Y ∼ 19%). The candidate host is a low-mass ob-ject (M = 1.4 × 10⁹ M⊙), with blue color R − K = 2.2,a specific rate of ǫ = 0.7 and an epoch of formation of1 − EoF/tH(z)=0.45. Compared to the overall populationthese two candidate hosts have SFR-to-luminosity ratios andspecific SFRs well above or similar to the median values atthe same redshifts.
The fact that the Chr04 sample is magnitude limitedand includes bright hosts may explain why the numericalcounterparts are not found among the objects with the high-est possible specific SFRs. The counterpart of GRB 970508(#6) is an example. From HST observations and other stud-ies, this host may be described as a blue compact dwarfgalaxy (Fruchter et al. 2000). Could this host be a prototypeof the general host GRB galaxy population? Interestingly,the counterpart of this host could be found in the sampleof compact galaxies at z ∼ 0.7 analyzed in Guzman et al.(1997). The counterpart #6 (z = 0.83) with an absolutemagnitude MB = −18.2, a mass close to 109 M⊙ and a spe-cific rate of ǫ ∼ 1.8 falls into the faintest and highest specificSFR population of compact galaxies in Guzman et al. (1997)(see their figures 5 and 7). Moreover, Sollerman et al. (2005)discuss three GRB host galaxies and show that they havesimilar properties as a sample of compact blue galaxies inthe local universe.
4 CONCLUSIONS
In this paper, we have discussed cosmological galaxy prop-erties and the properties of host galaxies of GRBs in partic-ular, using fully hydrodynamic simulations of galaxy for-mation and the stellar population synthesis (SPS) code,Starburst99, to infer observable properties. An importantfeature of the numerical procedure is that the star forma-tion history of galaxies entering the SPS code, comes di-rectly from the simulation, with each stellar population con-tained in a given galaxy treated as a homogeneous popula-tion, that forms instantaneously. We identify objects in thesimulation that have optical star formation rate, SFRUV ,and SFR-to-luminosity ratio, SFRUV /(LB/L∗
B), similar tothose estimated in a well-defined sample of ten observedhost galaxies (Christensen et al. 2004), the only availablehomogeneous sample focusing on this ratio. Each numericalcounterpart is selected from a simulated catalog at the sameredshift as the corresponding observed host, and is charac-terized by a number of properties: The SFR∗, mass, specificSFR, SFR∗/〈SFR〉, epoch of formation of the first stellarpopulation, and epoch of formation of the galaxy object.These are obtained directly from the simulation. In addition,B and K−band luminosities, R-band apparent magnitude,R−K color, and mass-to-light ratios are obtained from theSPS or combination of both results. It should be emphasizedthat some of these properties (e.g. mass and SFR∗) are esti-mated directly from the simulations, making their definitioninherently different from those commonly adopted in obser-vations.
The Christensen et al. (2004) sample includes hostgalaxies with redshifts in the range 0.43 < z < 2.03. Thesample is magnitude-limited (R < 25.3), with estimated ab-
10 Courty, Bjornsson & Gudmundsson
solute B−band magnitudes between −21.4 and −18.1. Ourcounterpart hosts are low-mass galaxies (M < 4 · 1010 M⊙),with low mass-to-light ratios (M/LB around 0.5); most ofthem are blue (R−K < 2.9) and young galaxies, with epochsof formation (or ages), within 40% of the age of the universeat the different redshifts. Although the SFR∗ of the coun-terparts varies between ∼ 0.4 and 8 M⊙ yr−1, the specificSFR is equal to or higher than the median values estimatedfor the different catalogs, with the lowest value being ǫ ∼ 1.Because of its strong correlation with the specific rate, theSFR∗/〈SFR〉 also has high values, around unity or higher.To outline the consistency of such an ensemble of properties,we compare the counterparts to the overall galaxy popula-tion at intermediate redshift and discuss the strong rela-tionships between the specific SFR and quantities known toreflect the star formation history of galaxies, i.e. color andmass-to-light ratio. Indeed, the bluest objects are also faintgalaxies with the highest specific rates.
Our identification of simulated galaxies with observedhosts has some limitations, both from observational and nu-merical points of view. Some of the observed hosts may, inother observational studies, be found to have slightly differ-ent SFRs or magnitudes, making their SFR-to-luminosityratios uncertain. Although the general agreement betweenthe simulation and the observations is fairly good, it shouldbe kept in mind that the moderate resolution and some-what limited number of physical processes included in thesimulation may affect the relative number of galaxies ineach sub-population. For instance, these simulations onlyaccount for a limited number of “extreme”-type galaxies,such as extreme starbursts or massive star-forming galax-ies. Furthermore, we do not include the effects of dust and,as in Christensen et al. (2004), we only consider extinctedSFRUV in the estimate of the SFRUV /(LB/L∗
B) ratio. Thatmay not be a serious drawback since our focus is on low-massgalaxies that on average suffer less attenuation than the mas-sive ones. In addition, the amount of dust has been shown tobe limited in most host galaxies of GRBs (Le Floc’h et al.2006). The main limitation of this study is the wide red-shift range of the 10 observed host galaxies, with only a fewgalaxies in each narrow redshift bin. The inferences madetherefrom need to be confirmed once the sample size hasgrown by a factor of 5-10, with a number of hosts at sim-ilar redshifts. We should expect to see still higher specificrates in low-mass objects, as the simulated catalogs tend toshow. The evolutionary effects displayed in Fig. 6 supportthis conclusion.
Comparing an expanded host galaxy sample based onSwift data with the simulated catalogs and other well-knowngalaxy sub-populations, such as compact blue galaxies maybe extremely useful. Hosts galaxies should provide a clearerview into the formation and evolution of galaxies and therole of different sub-populations therein. In particular, theywill help in investigating the faint end of the galaxy lumi-nosity function. Our results, obtained using a numerical ap-proach, are consistent with and confirm the picture of GRBhost galaxies that has emerged lately: They tend to have lowmass, be blue in color and have relatively high specific starformation rates. Host galaxies may then belong to the highspecific SFR galaxy population, rather than the high SFRpopulation. High-resolution simulations are required to de-termine, in a more quantitative way, the contribution of the
host galaxies to the overall population, and whether hostsare a part of the average normal star-forming galaxy pop-ulation or a sub-population of this one, with blue and verylow-luminosity objects.
ACKNOWLEDGMENTS
We thank Jens Hjorth and Johan Fynbo for many interestingdiscussion sessions on GRB galaxy hosts and their proper-ties. We also thank the anonymous referee for comments thathelped us improve the presentation. This research was sup-ported in part by a special grant from the Icelandic ResearchCouncil. The numerical simulations used in this paper wereperformed on NEC-SX6 of the High Performance Comput-ing Center Stuttgart (HLRS) of the University of Stuttgart(Germany).
REFERENCES
Bell E. F., de Jong R. S., 2001, ApJ, 550, 212Bell E. F., Papovich C., Wolf C., Le Floc’h E., CaldwellJ. A. R., Barden M., Egami E., McIntosh D. H., Meisen-heimer K., Perez-Gonzalez P. G., Rieke G. H., Rieke M. J.,Rigby J. R., Rix H.-W., 2005, ApJ, 625, 23
Berger E., Penprase B. E., Cenko S. B., Kulkarni S. R.,Fox D. B., Steidel C. C., Reddy N. A., 2005, arXiv:astro-ph/0511498
Berger E., Penprase B. E., Fox D. B., Kulkarni S. R., HillG., Schaefer B., Reed M., 2005, arXiv:astro-ph/0512280
Bicker J., Fritze-v. Alvensleben U., 2005, A&A, 443, L19Bloom J. S., Odewahn S. C., Djorgovski S. G., KulkarniS. R., Harrison F. A., Koresko C., Neugebauer G., ArmusL. e. a., 1999, ApJL, 518, L1
Boselli A., Gavazzi G., Donas J., Scodeggio M., 2001, AJ,121, 753
Brinchmann J., Charlot S., White S. D. M., Tremonti C.,Kauffmann G., Heckman T., Brinkmann J., 2004, MN-RAS, 351, 1151
Bruzual G., Charlot S., 2003, MNRAS, 344, 1000Cervino M., Luridiana V., 2005, astro-ph/0510411Chary R., Becklin E. E., Armus L., 2002, ApJ, 566, 229Christensen L., Hjorth J., Gorosabel J., 2004, A&A, 425,913 (Chr04)
Cole S., Norberg P., Baugh C. M., Frenk C. S., Bland-Hawthorn J., Bridges T., Cannon R., Colless M. e. a.,2001, MNRAS, 326, 255
Courty S., Bjornsson G., Gudmundsson E. H., 2004, MN-RAS, 354, 581 (Paper I)
Feulner G., Gabasch A., Salvato M., Drory N., Hopp U.,Bender R., 2005, ApJL, 633, L9
Fruchter A. S., Pian E., Gibbons R., Thorsett S. E., Fer-guson H., Petro L., Sahu K. C., Livio M. e. a., 2000, ApJ,545, 664
Fruchter A. S., Thorsett S. E., Metzger M. R., Sahu K. C.,Petro L., Livio M., Ferguson H., Pian E. e. a., 1999, ApJL,519, L13
Fynbo J. P. U., Jakobsson P., Moller P., Hjorth J., Thom-sen B., Andersen M. I., Fruchter A. S., Gorosabel J. e. a.,2003, A&A, 406, L63
Numerical counterparts of GRB host galaxies 11
Gorosabel J., Christensen L., Hjorth J., Fynbo J. U., Ped-ersen H., Jensen B. L., Andersen M. I., Lund N. e. a.,2003, A&A, 400, 127
Gorosabel J., Klose S., Christensen L., Fynbo J. P. U.,Hjorth J., Greiner J., Tanvir N., Jensen B. L. e. a., 2003,A&A, 409, 123
Gorosabel J., Perez-Ramırez D., Sollerman J., de UgartePostigo A., Fynbo J. P. U., Castro-Tirado A. J., Jakobs-son P., Christensen L. e. a., 2005, A&A, 444, 711
Grazian A., Fernandez-Soto A., Testa V., Fugazza D.,D’Avanzo P., 2006, GRB Coordinates Network, 4545, 1
Guzman R., Gallego J., Koo D. C., Phillips A. C., Lowen-thal J. D., Faber S. M., Illingworth G. D., Vogt N. P.,1997, ApJ, 489, 559
Hjorth J., Sollerman J., Møller P., Fynbo J. P. U., WoosleyS. E., Kouveliotou C., Tanvir N. R., Greiner J. e. a., 2003,Nature, 423, 847
Jakobsson P., et al. 2006, A&A, 447, 897Jaunsen A. O., Andersen M. I., Hjorth J., Fynbo J. P. U.,Holland S. T., Thomsen B., Gorosabel J., Schaefer B. E.,Bjornsson G., Natarajan P., Tanvir N. R., 2003, A&A,402, 125
Kawai N., Yamada T., Kosugi G., Hattori T., Aoki K.,2005, GRB Coordinates Network, 3937, 1
Kennicutt R. C., 1998, ARAA, 36, 189Kennicutt R. C., Tamblyn P., Congdon C. E., 1994, ApJ,435, 22
Le Floc’h E., Charmandaris V., Forrest W. J., Mirabel I. F.,Armus L., Devost D., 2006, ApJ, 642, 636
Le Floc’h E., Duc P.-A., Mirabel I. F., Sanders D. B., BoschG., Diaz R. J., Donzelli C. J., Rodrigues I., CourvoisierT. J.-L., Greiner J., Mereghetti S., Melnick J., Maza J.,Minniti D., 2003, A&A, 400, 499
Leitherer C., Schaerer D., Goldader J. D., DelgadoR. M. G., Robert C., Kune D. F., de Mello D. F., De-vost D., Heckman T. M., 1999, ApJS, 123, 3
Masetti N., Palazzi E., Pian E., Hunt L., Fynbo J. P. U.,Gorosabel J., Klose S., Benetti S. e. a., 2005, A&A, 438,841
Piran T., 2005, Reviews of Modern Physics, 76, 1143Pozzetti L., Cimatti A., Zamorani G., Daddi E., Menci N.,Fontana A., Renzini A., Mignoli M., Poli F., Saracco P.,Broadhurst T., Cristiani S., D’Odorico S., Giallongo E.,Gilmozzi R., 2003, A&A, 402, 837
Smith I. A., Tilanus R. P. J., Tanvir N., Barnard V. E.,Moriarty-Schieven G. H., Frail D. A., Wijers R. A. M. J.,Vreeswijk P. e. a., 2005, A&A, 439, 987
Sokolov V. V., Fatkhullin T. A., Castro-Tirado A. J.,Fruchter A. S., Komarova V. N., Kasimova E. R.,Dodonov S. N., Afanasiev V. L. e. a., 2001, A&A, 372,438
Sollerman J., Ostlin G., Fynbo J. P. U., Hjorth J., FruchterA., Pedersen K., 2005, New Astronomy, 11, 103
Stanek K. Z., Matheson T., Garnavich P. M., Martini P.,Berlind P., Caldwell N., Challis P., Brown W. R., SchildR. e. a., 2003, ApJL, 591, L17
Sullivan M., Mobasher B., Chan B., Cram L., Ellis R.,Treyer M., Hopkins A., 2001, ApJ, 558, 72
Tagliaferri G., Antonelli L. A., Chincarini G., Fernandez-Soto A., Malesani D., Della Valle M., D’Avanzo P.,Grazian A., Testa V., Campana S., Castro-Tirado A. J.,Romano P., 2005, A&A, 443, L1
Totani T. e., 2005, ArXiv Astrophysics e-printsVazquez G. A., Leitherer C., Heckman T. M., 2005, ApJ,621, 695