grb 021004: a massive progenitor star surrounded by shells
TRANSCRIPT

arX
iv:a
stro
-ph/
0211
189v
2 1
8 Fe
b 20
03
GRB 021004: a Massive Progenitor Star Surrounded by Shells
Bradley E. Schaefer, C. L. Gerardy, P. Hoflich, A. Panaitescu, R. Quimby, J. Mader, G. J. Hill, P.
Kumar, J. C. Wheeler
Astronomy Department, University of Texas, Austin, TX 78712
[email protected], [email protected],
[email protected], [email protected], [email protected],
[email protected], [email protected], [email protected],
M. Eracleous, S. Sigurdsson, P. Meszaros, B. Zhang
Department of Astronomy, Pennsylvania State University
[email protected], [email protected], [email protected], [email protected]
L. Wang
Lawrence Berkeley Laboratory
F. V. Hessman
Universitats-Sternwarte, Georg-August-Universitat Gottingen
and
V. Petrosian
Stanford University
ABSTRACT
We present spectra of the optical transient of GRB 021004 obtained with the Hobby-
Eberly Telescope starting 15.48, 20.31 hours, and 4.84 days after the γ-ray burst and
a spectrum obtained with the H. J. Smith 2.7 m Telescope starting 14.31 hours after
the γ-ray burst. GRB 021004 is the first burst afterglow for which the spectrum is
dominated by absorption lines from high ionization species with multiple velocity com-
ponents separated by up to 3000 km s−1. We argue that these absorption lines are

– 2 –
likely to come from shells around a massive progenitor star. The high velocities and
high ionizations arise from a combination of acceleration and flash-ionization by the
burst photons and the wind velocity and steady ionization by the progenitor. We also
analyze the broad-band spectrum and the light curve so as to distinguish the struc-
ture of gas within 0.3 pc of the burster. We delineate six components in the medium
surrounding the γ-ray burst along the line of sight: (1) The z ∼= 2.293 absorption lines
arise from the innermost region closest to the burst, where the ionization will be highest
and the 3000 km s−1 velocity comes from the intrinsic velocity of a massive star wind
boosted by acceleration from the burst flux. For a mass loss rate of ∼ 6×10⁻⁵M⊙yr−1,
this component also provides the external medium with which the jet collides over ra-
dial distances 0.004–0.3 pc to create the afterglow light. (2) A second cloud or shell
produces absorption lines with a relative velocity of 560 km s−1. This component could
be associated with the shell created by the fast massive star wind blowing a bubble in
the preceding slow wind at a radial distance of order 10 pc or by a clump at ∼ 0.5
pc accelerated by the burst. (3) More distant clouds within the host galaxy that lie
between 30-2500 pc and have been ionized by the burst will create the z ∼= 2.33 ab-
sorption lines. (4-6) If the three bumps in the afterglow light curve at 0.14, 1.1, and
4.0 days are caused by clumps or shells in the massive star wind along the line of sight,
then the radii and over-densities of these are 0.022, 0.063, and 0.12 parsecs and 50%,
10%, and 10% respectively. The immediate progenitor of the γ-ray burst could either
be a WC-type Wolf-Rayet star with a high velocity wind or a highly evolved massive
star the original mass of which was too small for it to become a WN-type Wolf-Rayet
star. In summary, the highly ionized lines with high relative velocities most likely come
from shells or clumps of material close to the progenitor and these shells were plausibly
produced by a massive star soon before its collapse.
Subject headings: gamma-rays: bursts - stars: Wolf-Rayet
1. Introduction
The large absorption line red shift measurements settled the issue that most γ-ray bursts are
at cosmological distances. The physical mechanism of the origin of the γ-ray bursts, questions of
whether there are more than one mechanism, and the issue of whether γ-ray bursts interact only
with the interstellar medium or with a circumstellar environment are still very open. Correlations
with star formation and observations of putative iron lines with the Chandra observatory (Piro et
al. 2000) have put new focus on the connection to a supernova-like core collapse event.
Currently, most observations of γ-ray burst afterglows are photometric, with the effort being
to find the power law behavior of the afterglow brightness as a function of wavelength and time.
Most of the 25 known red shifts have been measured by deep spectroscopy on the host galaxy long

– 3 –
after the afterglow has faded. Prior to GRB 021004, only eight γ-ray burst afterglows have had
early-time spectra that reveal absorption lines from the host galaxy (e.g., Vreeswijk et al. 2001).
Of these, virtually all have been low excitation lines in one velocity system that are likely to arise
in gas far from the burster. Two exceptions to this are GRB 011211 which shows C IV and Si IV
in addition to lower excitation lines (Holland et al. 2002a), and GRB 010222 which displayed two
low-ionization systems separated by ∼ 119 km s−1 that could arise from clouds at different positions
within the host galaxy (Mirabal et al. 2002a). GRB 020813 has a spectrum which displays C IV
absorption lines in both a z=1.223 and z=1.255 systems (Barth et al. 2002). With so little known,
and many afterglows revealing new properties, more prompt spectroscopy is clearly needed.
Afterglow spectra could show absorption lines arising from the host galaxy (especially the Fe
and Mg ISM lines) that will give the red shift. The red shift is the key parameter for determining
the burst energetics and hence further testing the conclusions of Frail et al. (2001) and Panaitescu
& Kumar (2001) that γ-ray bursts have a nearly constant total energy. One can also improve the
calibration (currently based on 9 events, see also Schaefer, Deng, & Band 2000) that the spectral
lags and light curve variability are Cepheid-like luminosity indicators that could turn γ-ray bursts
into a premier tool for cosmology out to z∼10 (Schaefer 2002). Intrinsic afterglow spectral features
of any kind would be a boon to interpretation. If there are underlying supernova-like explosions,
corresponding spectral features could be superposed on the continuum and revealed by careful
subtraction of the well-defined power-law continuum. Detection of, for instance, features of red
shifted Ca H & K, which tend to be among the strongest lines in all types of supernovae, would
yield both a red shift and clues to the nature of the explosion itself. Other possibilities would be to
discover Fe emission lines, which would yield temperatures, red shifts, and abundances. Perhaps
the most important possibility is that of serendipitous discovery of some unexpected feature.
GRB 021004 provided an unprecedented opportunity to obtain prompt spectroscopy of the
early afterglow of a γ-ray burst. GRB 021004 was discovered by instruments on the HETE II
satellite at 12:06 UT on 2002 October 4 (Shirasaki et al. 2002). Prompt discovery of the optical
transient by Fox et al. (2002a) allowed rapid spectroscopic observations. Fox et al. (2002b) obtained
the first spectra and identified two intervening systems at z = 1.38 and 1.60 from Mg I and Mg II
absorption. Eracleous et al. (2002) confirmed those features, noted several Fe II absorptions at
these redshifts, and pointed out four absorption lines at ∼ 4633, 4664, 5109, and 5152 A (see also
Sahu et al. 2002; Castander et al. 2002). These were identified by Chornock & Filippenko (2002)
as C IV and Si IV features at red shift of ∼ 2.3. Chornock & Filippenko also identified Lyα emission
at z = 2.323 and absorption components and perhaps Lyβ at similar red shifts. Salamanca et al.
(2002) identified four absorption components of C IV at z = 2.295, 2.298, 2.230 and 2.237, noting
that the total spread is about 3000 km s−1. They remarked that this velocity dispersion would
be difficult to interpret as due to a single cluster of galaxies and noted that if associated with a
supernova shell the supernova must have substantially preceeded the γ-ray burst to be optically
thin. Mirabal et al. (2002b) suggested the identification of one absorption feature as low excition
Al II at z = 2.328 and identified that, and the Lyα emission, as the red shift of the host galaxy.

– 4 –
They raised the issue of the velocity dispersion being due to a wind in a Wolf-Rayet like progenitor.
Djorgovski et al. (2002) noted that the Lyα flux may imply a strong star formation rate in the
host galaxy. Savaglio et al. (2002) reported a very high resolution spectrum (R = 50,000) that
revealed the complex fine structure of many of the high ionization lines. They determined that
the individual C IV features show complex flow spanning about 1000 km s−1 and conclude that
the z ∼= 2.326 system is probably close to the γ-ray burst. They note that of the four high red
shift systems, the low ionization lines, Al II and possibly Si II, only occur in the highest red shift,
z ∼= 2.326, component. Matheson et al. (2002) and Møller et al. (2002) have provided an excellent
compendium of line identifications along with detailed line profiles. Matheson et al. (2002) give a
spectral index in the optical of Fν ∝ ν0.96±0.03, and report a reddening of the continuum in the
blue region of the spectrum over the first three days.
Here we report spectra obtained within the first day after outburst and five days later. We
concentrate on constraining the circumburst medium in the context of the high ionization lines and
the afterglow light curve.
2. Observations
Spectra of the optical afterglow were obtained with both the 2.7 m Harlan J. Smith Telescope
using the IGI imaging spectrograph (Hill et al. 2003) and the 9.2 m Hobby-Eberly Telescope (HET)
with the Marcario Low-Resolution Spectrograph (Hill et al. 1998) at McDonald Observatory. Three
consecutive exposures of 900 seconds each were taken with the 2.7m telescope beginning 14.31 hours
after onset of the γ-ray burst, followed by sets of three 900 second exposures taken with the HET
beginning at 15.48 hours, 20.31 hours, and 4.84 days after the burst. A 2.5 arcsecond slit was used
for the 2.7m data, while the HET observations utilized a 2.0 arcsecond slit, giving all data sets a
16 A resolution. The spectra were reduced using IRAF1, and wavelength calibrated using Argon,
Neon, Cadmium, and Mercury lamps. The combined spectrum from the first night is displayed in
Figure 1.
Our first night spectrum shows a collection of absorption lines longward of 5800 A that arise
from iron and magnesium of relatively low ionization at red shifts of 1.38 and 1.60. These are due to
intervening galaxies with no relevance to the γ-ray burst analysis. The lines at red shifts of z ∼ 2.3
are presented with their measured properties in Table 1. The lines are separated into two primary
velocity components, with z ∼= 2.326 ± 0.001 and z ∼= 2.293 ± 0.003. We identify the 4587.2 A line
as being from Si IV (c.f. Matheson et al. 2002). There are few resonance lines from the ground
state of highly-ionized elements of high cosmic abundance in the observed wavelength range, and
the only one that has not produced a detected absorption line is N V with rest wavelengths 1238.8
1IRAF is distributed by the National Optical Astronomy Observatories, which are operated by the Association
for Research in Astronomy, Inc., under cooperative agreement with the National Science Foundation

– 5 –
and 1242.8 A for which we can only present an upper limit to its equivalent width.
The separation of the two high redshift primary velocity components corresponds to a relative
velocity of 3000 km s−1 in the frame of the host galaxy. The unblended lines for the z ∼= 2.326
velocity component are significantly resolved in our spectrum, with a FWHM of ∼ 1000 km s−1.
From our own data, this implies either multiple components or one component with a velocity range
that large. Other spectra (Savaglio et al. 2002; Mirabal et al. 2002b; Salamanca et al. 2002; Møller
et al. 2002) have resolved the high red shift component into at least two sub-components with a
velocity separation of 560 km s−1. Thus, the z ∼ 2.3 system consists of at least three separate
velocity components, with velocities of 0 km s−1, 560 km s−1, and 3000 km s−1 towards Earth
relative to the highest red shift component.
Draine & Hao (2002) presented detailed calculations of the complex of absorption lines pro-
duced from 1110-1705 A by vibrationally excited molecular hydrogen in a molecular cloud near a
γ-ray burst. Individual lines have a typical depth of 20% for normal low-resolution sprecta and
might be difficult to detect without very high signal. Fortunately, the entire pattern of lines is
characteristic of the process and so all of the lines (with their unique positions and depths) can be
simultaneously sought in any spectrum. The idea is that a spectrum in which any one line would
be highly insignificant might yet have the presence of many lines detectable at a high confidence
level. Even a noisy spectrum might have its apparent noise following the characteristic molecu-
lar hydrogen features hence resulting in a significant detection. Many of the individual lines are
extremely saturated with optical depths of 300 in the line center and with equivalent widths of
0.1 A or greater, so that the strength of the absorption is quite insensitive to the column density
of vibrationally excited molecular hydrogen, N(H∗2 ). B. Draine has kindly provided us with the
transmission spectrum for excited molecular hydrogen for our spectral resolution. We have used
this as a template to cross correlate with our spectrum. For a red shift of 2.3, we cover the range
from 1240-1705 A. We find no significant correlation peak for any red shift of the template. Within
the red shift range of 2.29–2.33, the largest peak in the cross correlation is never more than the
RMS of the cross correlation over a much wider red shift range. The implication of this negative
result will be discussed in Section 3.5.
We found no significant differences among our spectra within the first night. Specifically,
the equivalent widths of the absorption lines were all identical to within the errors. We have
constructed broad-band photometry from our reduced spectra using the photometric pass-bands
of Landolt (1992) and normalizing the colors to match the observations concurrent to the 2.7m
spectrum. The resulting synthetic photometry for the B, V, and R magnitudes yields colors that
are constant to within 0.04 mag for the first night.
For a comparison between our observations on the first and fifth nights, we are handicapped
by the poor signal on the fifth night due to the faintness of the afterglow. The only lines for which
we can quote line widths on the fifth night are the two C IV lines which have equivalent widths in
the rest frame of the host (the observed width divided by 1+z) of 1.0 ± 1.6 A and 5.7 ± 2.4 A at

– 6 –
the same wavelengths as for the first night. This is consistent with the first night. We confirm the
report by Matheson et al. (2002) that the blue end of the continuum became redder from the first
night to subsequent nights. In particular, our synthetic photometry shows the B-V color to have
reddened by 0.25 ± 0.13 mag from the first to the fifth night, while the V-R color was unchanged,
0.01 ± 0.07 mag, over the same interval.
3. The High Ionization Features
3.1. The Source of the Absorbing Gas
The Lyman alpha emission line is likely to represent the average velocity of the host galaxy,
although its exact wavelength will shift redward somewhat due to the absorption component. The
red shift of the Lyα line is variously given as 2.3351, 2.332, 2.328, and 2.323 (Møller et al. 2002;
Matheson et al. 2002; Mirabal et al. 2002b; Chornock & Filippenko 2002). The average velocity
of the host galaxy is also likely represented by the low-ionization feature of Al II at 2.328. The
highest red shift components of the C IV and Si IV lines correspond to this host galaxy velocity.
The velocity of the burster itself might vary by up to several 100 km s−1 from the average velocity
for the host. The other primary components of these high-ionization lines are at velocities of 560
km s−1 and 3000 km s−1 blueward of the host galaxy velocity.
The presence of the z ∼ 2.3 lines of C IV and Si IV shows that the absorbing gas is highly
ionized. Such lines are commonly seen in the spectra of distant quasars through intervening galaxies
where the ionized material is in a collisionally ionized halo. Could the absorbing gas for GRB 021004
just be in halos of chance galaxies along the line of sight? The presence of three velocity components
within the z ∼ 2.3 system with separation of up to 3000 km s−1 argues strongly that this cannot be.
The probability of two galaxies lying in so small a red shift range just blueward of the host is rather
small even in a cluster of galaxies, and the velocities are too large to allow for a bound cluster.
Sargent, Steidel, & Boksenberg (1988) present statistics on lines with rest frame equivalent widths
of more than 0.3 A (i.e., a threshold much smaller than the observed lines for GRB 021004), and find
that absorption systems with z ∼ 2.3 occur with a rate of ∼ 1.5 per red shift unit. The probability
of getting two absorbers within a range of 0.033 in z in front of the host galaxy is thus 0.0024.
Such an occurrence is not impossible (c.f. the z ∼ 2.85 system for Q1511+091, Sargent, Steidel,
& Boksenberg 1988), but it is too small to be plausible for GRB 021004. It is also improbable
that random intervening galaxies will have equivalent widths as thick as 1.4 A (as for the observed
C IV lines from the systems blueward of the host galaxy). The distribution of equivalent widths
(for both members of the C IV doublet) falls off exponentially such that the probability for any
one galaxy being above this threshold is ∼ 0.2, or 4% for both systems. In all, the probability of
getting two chance galaxies with a red shift within 0.033 of the host and with rest frame equivalent
widths of ≥ 1.4 A is 0.00010. We conclude that the high-ionization absorption lines are not from
intervening galaxies.

– 7 –
The only other situation for which the C IV and Si IV lines are seen in absorption is when gas
is subjected to a high flux of ionizing radiation, as in an AGN, a Wolf-Rayet star, or a γ-ray burst.
An AGN at the position of the γ-ray burst would already have been detected, and so this possibility
can be rejected. With only ∼ 3100 Wolf-Rayet stars in our own Galaxy, the odds of the line of
sight passing close to 1–3 such stars is small (ignoring clustering) provided that the star is not the
progenitor of the γ-ray burst. That the progenitor is itself a Wolf-Rayet star is plausible, because
the progenitor is likely to be a massive star just before a core-collapse. Alternatively, the ionizing
radiation could come from the γ-ray burst itself. Thus, we think that the most likely means to
ionize the gas to high levels is either radiation from the burst progenitor or the burst itself, with
both cases requiring the ionized gas to be physically associated with the burster.
3.2. Ionizing the Gas
Wolf-Rayet stars have temperatures from 30,000–70,000 K and supergiant luminosities. For
the hotter stars, this is sufficient to ionize the surrounding nebulosity to levels where a significant
fraction of the carbon and silicon atoms can produce C IV and Si IV absorption and emission.
Thus, a Wolf-Rayet-like progenitor might already ionize the surrounding gas such that later light
from the afterglow will have silhouettes of these high-excitation lines.
Alternatively, the γ-ray burst itself is an obvious source of a huge ionizing flux. The most
frequent mode of ionization of carbon and silicon will be for the γ-ray to knock out an inner
electron, whereupon autoionization will cause ejection of the valence electrons. In addition the
ejected electrons will have sufficient energy to ionize other atoms. In the remainder of this section,
we will estimate a crude distance range over which the burst flux can ionize enough gas so as to
produce the observed absorption lines.
The cross section for photoelectric interactions varies strongly with photon energy, so the
probability that any given atom is ionized by burst flux requires an integral over energy. The cross
sections for carbon and silicon are tabulated in Hoflich, Khokhlov, & Muller (1992) along with a
prescription for interpolation. For carbon, the cross sections are 0.0213, 40.3, and 44500 barns (one
barn equals 10−24 cm2) at photon energies of 100, 10, and 1 keV respectively. With this, we see
that most of the ionization will be from burst photons in the x-ray band.
The burst spectrum has only been measured down to a photon energy of 7 keV (23 keV in the
frame of the host galaxy) by HETE-2. Above 7 keV, Lamb et al. (2002) state that the spectrum
is well fit by a single power law such that dN/dE ∝ E−1.64 and has a fluence from 7–400 keV
of 3.2 × 10⁻⁶ erg cm−2. Below 7 keV, the spectrum will likely turn over to asymptote at a slope
close to the synchrotron limit of dN/dE ∝ E−2/3. Here, we will model this behavior as a broken
power law with indices of -1.64 and -0.66 above and below a break energy, Ebreak. We also impose
a lower energy cutoff in our calculations at Ecutoff , below which we assume that no flux reaches
the gas. This is to model the possible photoelectric absorption of photons before they reach the

– 8 –
gas. We normalize this spectrum to the 7–400 keV fluence reported by HETE-2 and correct the
photon energies of this observed spectrum by a factor of 1 + z to get the spectrum as seen by gas
in the host galaxy frame.
The expectation value for the number of times that a given atom will be ionized by burst
flux is∫ ∫
(dN/dE) σ dt dE, where dN/dE is the burst photon spectrum (in units of photons
cm−2s−1keV−1) as a function of distance from the burster, σ is the cross section for ionization as
a function of photon energy E, and t is the time. For these calculations, we adopt Ebreak = 7 keV.
We find that the result is highly sensitive to the value of Ecutoff (due to the large cross section
for ionization at low energies), which itself is highly uncertain since we do not know the degree of
absorption of the low energy photons before the radiation hits the gas. For Ecutoff = 0.3 keV in
our rest frame (1 keV in the host galaxy), we expect ∼ 100 ionizing interactions per carbon atom at
a distance of 1 pc. For Ecutoff = 0.03 keV in our rest frame (0.1 keV in the host galaxy), we expect
∼ 600 ionizing interactions per carbon atom at a distance of 1 pc. The expected number of ionizing
interactions will scale as the inverse square of the distance. For this range of cases, the expected
number of ionization interactions is unity at distances ranging from 10-25 pc. This provides an
order-of-magnitude estimate of the minimal range out to which the burst flux will completely ionize
carbon.
The radius at which significant high ionization absorption can be caused may be substantially
farther than this calculated distance for two reasons. First, only a small fraction of the carbon
need be ionized to result in significant absorption. Since the cross section for the C IV resonance
line is large, the intervening gas need only have a column density of 1014cm−2 in the C IV state to
account for the observed absorption line. This corresponds to a fraction of ∼ 0.0003 of the total
carbon expected in a smooth wind (see §3.4). If only 0.01% of the carbon must be ionized to C IV
to create the necessary column density, then the burst’s effective radius for ionization is larger than
the previous distance estimate by a factor of 100. This factor depends on the column density of the
cloudy ISM. Second, the electrons ejected from the neutral atoms at high velocity will also have
a high cross section for ionizing further atoms. This effect depends on the density of the gas and
the spectrum of the electrons (Lotz 1967). This effect will roughly increase the ionizing radius by
a factor of the square root of the ratio of the electron energy to the ionization energy, which might
be up to a factor of order ten. In all, there are many uncertainties and dependencies on unknown
conditions, but the effective ionization radius of the burster might be of order 10–100 times larger
than calculated in the previous paragraph. This would imply that any gas cloud within perhaps
100–2500 pc of the burster will suffer enough ionization to create a sufficient column density of
C IV so as to form a detectable absorption line.
The complementary question is how close to the burster some gas will be incompletely ionized
at the epoch of observation. This is important since we later consider the possibility of the absorbing
gas being quite close (∼ 0.2 pc) to the burst. Lazzati & Perna (2002) have presented a detailed and
extensive calculation that shows that even a very thick wind will have all of its hydrogen completely
ionized by a GRB flash on time scales of milliseconds or faster. The implication is that most (if

– 9 –
not all) of the atoms of carbon in a wind will also be completely ionized, and thus there may be
no atoms in the C IV state to create absorption lines near the burst.
Whereas Lazzati & Perna considered a smooth wind, the column density of C IV ∼ 1014 cm−2
could be accounted for by clumps in the gas. The existence of such clumps is plausible since images
of Wolf-Rayet winds show structure on all size scales. Also, the quasi-stationary flocculi (clumps
of gas created in the Wolf-Rayet progenitor wind) in Cas A and the Kepler supernova remnants
have densities of 1− 2× 104 cm−3 (Gerardy & Fesen 2001) after correcting by a factor of 4 for the
shock jump conditions, with a typical projected size of 5 × 1016 cm in width and 15 × 1016 cm in
length. For GRB 021004 in particular, the existence of clumps is indicated by the three bumps in
the afterglow light curve (see §5) where the clumps might be large in size with moderate contrast
or might be small in size yet with large central densities. The existence of clumps in the winds of
massive stars is thus expected, and these clumps can have densities >∼ 104cm−3.
Clumps can serve in two ways to allow for the existence of C IV close to the γ-ray burst. First,
the clump will shield portions of the wind material (both within the clump and within the shadow
of the clump) from the high burst flux. For example, a clump with size 1017 cm with a density of
104 cm−3 at a distance of a fraction of a parsec from the burster should absorb the ionizing flux.
Second, the higher density within clumps can allow for faster recombination that can generate
C IV a day after the burst even if the burst had completely ionized the carbon. The degree of
recombination that will have occured when we see the absorption a day or so after the burst has
ionized the gas depends strongly on the density. For ionized carbon, the recombination time scale
is ∼ 105 days for densities of 10 cm−3 that would be typical of a Wolf-Rayet wind at a distance of
∼ 0.1 pc. The recombination time scale would be ∼ 100 days for densities of 104 cm−3 that are
typical of the densities observed in supernova remnant knots that are presumed to have formed in
the progenitor’s wind. Within such clumps, the fraction of carbon in the C IV state should be ∼ 0.01
a day after the burst. A clump with density 104 cm−3 and size 1017 cm will produce a column
of 1019cm−2 in C IV. This is 105 times larger column than is required to produce the observed
absorption lines. Detailed calculations of the ionization structure are difficult without knowledge
of the density structure in the wind. Nevertheless, it appears that shadows and recombination in
the expected clumps can yield a C IV column density of 1014cm−2 even quite close to the burster.
The calculation of the ionization structure is not straight forward even if the density structure is
given. One trouble is that the burst spectrum below 7 keV is unknown, and this is the critical energy
region for ionizing the gas due to the large cross sections for photo-ionization. A related problem is
accounting for the ionizing flux from the afterglow, which is comparable to that from the burst itself.
An additional problem is that stimulated recombination will ensure that some fraction of the carbon
will not be completely ionized even in a radiation field of the highest intensity. Yet another issue
is that the photo-ionized electrons likely have roughly a power-law energy distribution, whereas
the cross sections for ordinary and stimulated recombination are calculated for thermal electron
distributions. The correct recombination rates are likely to be significantly different than the
“usual” calculations. In principle, these problems can all be surmounted by substantial theoretical

– 10 –
effort. In the mean time, we conclude that it is difficult to make any definite statements regarding
the ionization state of gas close to the burster.
A cloud far from the γ-ray burst will have a low relative velocity corresponding to ordinary
galactic rotation. Such a cloud would be an obvious candidate for creating the high-excitation low-
velocity absorption component. Another obvious candidate to contribute to the high-excitation
low-velocity lines is the shell piled up by the O main sequence star wind as it blows a bubble in the
local ISM at a distance of perhaps 30 pc. Thus, there are two adequate sources of material along
the line of sight with distances from 30–2500 pc that can be ionized by the burst flux.
3.3. Accelerating the Gas
Gas near the burster will receive a tremendous blast of photons, and interactions will transfer
some of the photons’ momentum to the gas. The total radiative acceleration of the gas that
determines its final velocity will occur during the few seconds when the burst flux passes through
the gas a few hours before the time at which the absorption lines are produced by the gas. How
much momentum gets transferred depends on the cross section of the gas, the spectrum of the
burst, and the flux of the burst photons. The final velocity will fall off as the inverse-square of the
distance from the burst. At some distance, the blast will accelerate the gas to 3000 km s−1, and this
process could account for the observed high relative velocity of one of the absorption components.
In this subsection, we present a detailed calculation of the radiation-induced velocity as a function
of distance from the burster.
The radiative acceleration gr (as a function of distance R and time t) by a central energy
source is given by
gr(R, t) = 4πc−1
∫σ(E) m−1
n HE(R, t) dE, (1)
where σ(E) is the cross section for interaction with a burst photon of energy E, mn is the mass
per nucleon, and HE is the Eddington flux which is the first moment of the intensity (with units
of erg cm−2 s−1 erg−1). The velocity due to radiative acceleration is
v = v0 +
∫∆t
grdt (2)
where v0 is the initial velocity of the gas, and ∆t is the time interval covering the burst duration as
the photons pass through the gas being accelerated. This integral over time will change the burst
flux into a fluence, which is to say that the acceleration only depends on the number of incident
photons and not on their time distribution. This change in velocity structure in the gas around the
burst will not lead to any significant changes in the density structure on time scales for which we
are concerned. That is, a parcel of gas accelerated to, say, 3000 km s−1 will move only 1.7 AU in
one day, so as to cause a ∼ 0.03% density change within a gas clump of size, for example, 1017 cm
if the backside suffers zero acceleration.

– 11 –
The γ-ray cross sections for the photon-matter interaction have been included as detailed in
Hoflich (1991). Because the photon energies far exceed the binding energies of the electrons in
atoms, the interaction of electrons and photons is given by the Klein-Nishina cross section per
nucleon. For lower energies, we determine the angle dependent Klein-Nishina cross section by a
standard rejection technique and obtain the cross section by formal integration over angle. Bound-
free cross sections have been included according to Veigel (1973). The X-ray opacities are dominated
by bound-free transitions from inner shell electrons (which are always populated since when an inner
shell electron is ejected it is rapidly filled by one of the outer electrons), and are independent of
the conditions in the gas cloud. Thus, the bound-free opacity is rather model independent.
The final velocities are a function of composition and the burst spectrum. For composition,
we adopted either a normal solar abundance (Anders & Grevesse 1989), a Wolf-Rayet composition
(Woosley, Langer, & Weaver 1993), or a pure gas of ionized hydrogen. For the spectrum, we
adopted broken power laws with a low-energy cutoff, as described in the previous subsection. The
results for v0 = 0 are displayed in Figure 2. We find that the composition of the gas has little
effect. We find that the flux around one keV (in the frame of the host galaxy) is very important,
due to the large cross sections associated with bound-free interactions. Unfortunately, the flux for
energies below 7 keV are not known and we can only assume plausible spectral shapes, as discussed
in the previous section.
Our favorite model of the final velocity as a function of the radial distance from the burster is
represented by the thick line in Figure 2. To accelerate gas from rest to 3000 km s−1 implies that
the gas is at a distance of 0.2 parsec. If the gas were already expanding at a velocity of 2500 km s−1,
then the radial distance of the gas would be ∼ 0.5 parsec. Gas initially at rest at ∼ 0.5 pc, would
be accelerated to ∼ 500 km s−1, corresponding to one of the observed absorption components.
If the cloud has a substantial extent along the line of sight, then the inner edge will be
accelerated to a higher velocity than the outer edge. This would result in a broad line, instead of
the narrow lines observed. The radiative acceleration mechanism thus requires that the intervening
cloud be physically narrow. This could arise from a small cloud (as a clumpy part of a wind) or
from a thin shell (presumably created by the progenitor). For quantitative limits, the width of the
carbon lines appears to be less than 400 km s−1, for which the dominant absorbing region in the
shell must be thinner than 7% of its radius provided the gas is accelerated from rest to around
3000 km s−1 by the burst radiation. If the gas already had an initial velocity of 2000 km s−1,
then the dominant absorbing region in the shell must be thinner than 21% of its radius. If an
absorbing gas has a wind-like density distribution (that falls off as the inverse-square of the radial
distance), then 50% of the absorption will come from between the inner edge of the absorbing
region to twice that radius. Thus, for absorption from a smooth wind, the radiative acceleration
must be small compared to the initial wind velocity to avoid excessively broad absorption lines.
However, if the absorbing gas has a significant clump superposed on a wind-like structure (see §5),
then such a clump may be sufficiently thin to form a narrow absorption line despite a large radiative
acceleration even in a wind.

– 12 –
This acceleration of gas close to the burster must occur, the only question is the size of the effect.
This will depend primarily on unknown details of the low energy photons in the burst spectrum
after they have passed through material at small radial distances. For reasonable assumptions
(Ecutoff ≪ 10 keV), the radiative acceleration will induce velocity changes of 1000 km s−1 or
greater for gas within a fraction of a parsec from the burster. This accelerated gas must include
that which is creating the afterglow, as well as the dense gas interior to the afterglow shock that
represents the inner region of any wind that was driven off the progenitor.
3.4. Massive Star Winds
Wolf-Rayet stars are very hot (30,000-70,000 K) stars shedding a thick wind for which the
characteristic spectra involve bright and broad emission lines with P Cygni profiles. They are
highly evolved stars, the main sequence masses of which were larger than 35 M⊙ or so. For
the most massive stars (∼ 60M⊙) the evolutionary path is from an O main sequence star to a
Luminous Blue Variable to a Wolf-Rayet star of the WN class to a Wolf-Rayet star of the WC class
to a supernova collapse, while a less massive star (∼ 35M⊙) progresses from an O main sequence
star to a red supergiant to a Wolf-Rayet star of the WN class to a supernova collapse. Significant
evidence and theoretical models support the hypothesis that long-duration γ-ray bursts are caused
by the collapse of massive stars (Wheeler, Yi, Hoflich, & Wang 2000; Woosley & Heger 2001),
consistent with the notion that the immediate progenitors of bursts are Wolf-Rayet stars.
Each stage in the evolution of massive stars has a distinct wind (Garcia-Segura, Mac Low,
& Langer 1996; Garcia-Segura, Langer, & Mac Low 1996). The O main sequence star wind is
characterized by a velocity of ∼ 3000 km s−1 and a mass loss rate of order 10−6 to 10−5M⊙yr−1
which lasts for a few million years. The Luminous Blue Variable phase has a massive ejection (at
a rate of up to 10−3M⊙yr−1) over a short time (roughly 10,000 years) with moderate velocities
(around 300 km s−1). The red supergiant wind is characterized by a velocity of 10-100 km s−1 and
a mass loss rate of up to 10−4M⊙yr−1 which lasts for around 200,000 years. The Wolf-Rayet wind
is characterized by velocities of 1000-3000 km s−1 and a mass loss from 10−5 to 10−4 M⊙yr−1 over
a lifetime of fractions of a million years.
The interactions between the winds in each successive stage of evolution will create shells with
various properties (Garcia-Segura, Mac Low, & Langer 1996; Garcia-Segura, Langer, & Mac Low
1996). The O main sequence star will blow a bubble into the surrounding ISM that has a thin shell
and a slow expansion velocity at a distance of order 30 pc. The massive ejection of a Luminous
Blue Variable will produce a thick shell that expands with a velocity of around 300 km s−1. The
red supergiant wind will bunch up at its outer edge and expand with a velocity of 10-100 km s−1.
The Wolf-Rayet wind blows a bubble in the slower and denser wind around it, creating a thin shell
that expands with a velocity of order 500 km s−1. This bubble will overtake the slower shell in
∼ 10, 000 years and coalesce to form a combined turbulent shell. At the time of the core collapse
of the star, the inner several parsecs will consist of the Wolf-Rayet wind expanding at 1000-3000

– 13 –
km s−1, surrounded by a dense and turbulent shell expanding at perhaps 500 km s−1 at a distance
of around 10 pc, surrounded by a relatively low density region evacuated by the O main sequence
star wind, all inside a geometrically thin bubble of material piled up from the ISM. The winds of
Wolf-Rayet stars are likely to be anisotropic, and the absorption lines in GRB 021004 were created
by only a small geometrical cross section, presumably along the rotation axis of the progenitor star.
Can this wind structure around a very massive star account for the observed velocity com-
ponents in the absorption lines of GRB 021004? The blue shifted 3000 km s−1 component would
arise from the dense inner wind driven during the Wolf-Rayet phase. The O main sequence star
wind also has a velocity of 3000 km s−1, but its density has been greatly reduced by its expansion
into space so that it should produce only negligible absorption. The requisite density in this radius
range could also be provided in principle by the slower wind of a lower mass star with lower mass
loss rate; this case would subsequently require more radiative acceleration. If the density in the
wind falls off as the inverse-square of the radial distance from the star, the absorption from the
wind will be dominated by its inner region, say 0.2–0.4 pc. This means that the absorption lines
would primarily sample a Wolf-Rayet wind emitted over a brief time interval somewhat before the
core collapse. Over its lifetime, a Wolf-Rayet wind is roughly constant in velocity, while the wind
velocity across the 0.2–0.4 pc region should be even more precisely constant. This could produce a
narrow absorption line just as is observed. The blue shifted 560 km s−1 absorption component in
GRB 021004 could arise from the dense shell created at the outer edge of a Wolf-Rayet wind. This
shell is expected to be composed of geometrically thin structures that form a turbulent front width
of which is roughly a tenth of its radius which expands at roughly 500 km s−1 (Garcia-Segura, Mac
Low, & Langer 1996; Garcia-Segura, Langer, & Mac Low 1996). The velocity structure within the
shell is chaotic and will lead to some broadening of the resultant absorption lines. Thus, expected
Wolf-Rayet wind structures can produce the observed 3000 km s−1 and 560 km s−1 components.
What are the expected column densities in the Wolf-Rayet winds? For a mass loss rate of
3 × 10⁻⁵M⊙yr−1, a wind velocity of 3000 km s−1, and an average atomic weight equal to that of
helium, a Wolf-Rayet wind will produce a column density of roughly 3 × 10¹⁷atoms cm−2. The
total column density of the shell at the outer edge of a Wolf-Rayet wind is uncertain, but it is likely
to be roughly the mass ejected (Garcia-Segura, Mac Low, & Langer 1996; Garcia-Segura, Langer,
& Mac Low 1996) in the red supergiant phase (∼ 20 M⊙) or the Luminous Blue Variable phase (∼
10 M⊙) spread over a shell of radius 10 pc. For an average atomic mass like that of helium, the
total column density will be of order 2 × 10¹⁷ atoms cm−2 or greater. The two shell components
thus have comparable column densities, just as the two absorption lines have comparable equivalent
widths.
Are these column densities enough to produce significant absorption lines? For the oscillator
strengths of C IV and an assumed velocity dispersion of order 100 km s−1, a column density of
∼ 1014 cm−2 for C IV atoms in their ground state will produce an absorption line with an optical
depth of unity. With the total column density for a component of a Wolf-Rayet wind at around
3× 10¹⁷ atoms cm−2, the carbon line would produce a significant feature provided that C IV in the

– 14 –
ground state is more than ∼ 0.0003 of the nucleons in the wind. A large fraction of the ejecta from
Wolf-Rayet stars will be carbon. The various ionization states will all spend almost all the time at
their ground level because the decay times are of order 10−8 seconds. The question of calculating
the fraction of carbon that is ionized to any particular degree (by the radiation from the burst
and from the progenitor) is a difficult problem both for the physics and for the lack of knowing
the conditions of the gas (§3.2). Nevertheless, it is plausible that some significant fraction of the
carbon will be three-times ionized. For one-tenth of the carbon being three-times ionized, the total
column of atoms capable of producing the C IV line in the Wolf-Rayet wind will be ∼ 1016 atoms
cm−2. For such a case, the line will be highly saturated. This estimate has many uncertainties,
but it is clear that Wolf-Rayet winds can have sufficient carbon to create the observed absorption
lines.
Wolf-Rayet stars often show P-Cygni line profiles, with the emission component arising from
portions of the shell off the line of sight. If the wind structure described above exists around
GRB 021004, we do not expect to see P-Cygni profiles. There are two reasons for this. The first
is that the γ-ray burst radiation is strongly beamed by the jet, so most of the shell off the line of
sight is not illuminated. The second reason is that a flash of illumination on the shell will produce
emission lines that are delayed by an amount that varies with position in the shell. For typical shell
sizes, the emission component would be spread out over many years and will become too faint to
be observable. Thus the lack of P-Cygni profiles in the high-excitation lines of GRB 021004 is not
an argument against their origin in a Wolf-Rayet wind.
What is the lower limit on the mass of the original star such that it can still produce the required
dense wind? O-type stars with masses of ∼ 30M⊙ can produce dense winds with surrounding shell
structures (Kudritzki & Puls 2000), and hence might account for the observed lines in GRB 021004.
These stars can have wind velocities up to 3000 km s−1 but with mass loss rates that might be
smaller than allowed by our analysis of the spectral energy distribution (see §4). The evolution of
such stars would be from an O main sequence star to a red supergiant to a blue supergiant with a
core collapse at some point. While such a progenitor cannot be called a Wolf-Rayet star, it is still
a massive star surrounded by shells and hence could be the progenitor of GRB 021004. Since the
clumpy density profile is so uncertain, the only rigorous lower limit we can place on this process is
that for core collapse itself, that is ∼ 8M⊙. For instance, a star that blew up as a red giant might
have a carbon-rich wind and hence have the necessary density to give the column depth of C IV.
Such a structure would have to rely on radiatively accelerated clumps of matter at ∼ 0.5 pc to
produce the lower velocity C IV features in the absence of a shell generated by the blue/red wind
boundary.
3.5. The Progenitor is a Massive Star
We now have two scenarios that can explain the velocity and ionization structure of the high-
excitation absorption lines seen in GRB 021004. The first scenario postulates two gas shells or

– 15 –
clumps initially nearly at rest at distances of ∼ 0.2 pc and ∼ 0.5 pc that are radiatively accelerated
to velocities of 3000 km s−1and 560 km s−1, respectively, as well as ionized by the flash from the
burst itself. The second scenario proposes that the progenitor is a Wolf-Rayet-like star with a wind
velocity of 3000 km s−1 that is surrounded by a shell with velocity 560 km s−1, the gas of which
is ionized by the flux from the progenitor. These two scenarios are actually part of a continuum
of similar scenarios where the ionizations and velocities vary from being caused entirely by the
progenitor to being caused entirely by the burst. For example, in the second scenario, the original
wind might have started at a lower ionization state at a velocity of 1500 km s−1 and been accelerated
and ionized to the final values by the burst. In all these related scenarios, the absorption lines with
near zero velocity are caused by chance clouds along the line of sight as far as 2500 pc from the
burster that have been ionized in part by the burst radiation.
In the first scenario, we have to ask why a γ-ray burst progenitor would have two geometrically-
thin gas clouds at distances of ∼ 0.2 pc and ∼ 0.5 pc? This is improbable unless there is some
causal connection between the clouds and the burster. The presence of two geometrically-thin
clouds along the line of sight could be caused by two shells around the progenitor or by some
number of clumps of gas around the progenitor. In the second scenario, we also have shells of gas
centered on the progenitor.
We conclude that the progenitor had shells or clumps of gas centered on it and associated with
it. Models where the γ-ray burst arises from the collision of two compact objects in close orbit are
substantially less likely because these have no ready supply of gas close to the system. The presence
of shells is an unusual situation for stars, as few have multiple shells, although clumps are more
likely. The only stellar objects with multiple shells that have any realistic hope of being associated
with γ-ray bursts are supernovae and massive stars. Any shell from a supernova would have to
be pre-existing (as in the Supranova model of Vietri & Stella, 1998) since the afterglow jet would
be far outside any normal supernova ejecta if the supernova and burst exploded simultaneously.
Salamanca et al. (2002) point out there are difficulties with producing narrow lines with the observed
equivalent width from an old supernova remnant. The narrowness of the absorption lines would
require that the ejecta has already cooled and condensed into filaments. The question is then the
likelihood of getting multiple filaments of greatly different velocity on our line of sight and the
column density of any such filaments.
Ideally, the absorption lines from the z ∼= 2.293 system can tell us about the abundances of
carbon, silicon, hydrogen, and nitrogen in the innermost shell ejected by the progenitor; and this
can then tell us about the progenitor itself. For example, if the composition is that of a Wolf-Rayet
shell of a particular type (perhaps with some swept up ISM material), then we would even get a
good idea of the mass of the progenitor. Unfortunately for this program, we have few lines from
the z ∼= 2.293 system (see the many lines for GRB 010222, Mirabal et al. (2002a)). Also, the
likelihood that our unresolved lines are saturated implies that the measured equivalent widths will
be difficult to convert to abundances. Nevertheless, a full analysis based on our data or the data
of, for example, Savaglio et al. (2002), might place useful limits on the abundances of the shell and

– 16 –
its possible origin.
An example of such an analysis can be made with respect to the carbon-to-nitrogen abundance.
Both atoms have similar ionization potentials and should have somewhat similar ionization fractions
into either C IV or N V, the oscillator strengths of the two resonance lines are similar, and the
cosmic abundance of nitrogen is down from that of carbon by a factor of three. So simplistically,
we would expect the C IV line to have an equivalent width that is roughly three times deeper
than that of N V, whereas (see Table 1) we do not see any nitrogen lines and the limit on the
equivalent widths is a factor 4.6. With the likelihood that the C IV line has a saturated core,
the implication is that nitrogen is significantly under-abundant compared to carbon. This would
appear to rule out WN type Wolf-Rayet stars. The lower mass Wolf-Rayet stars undergo core
collapse while the wind is still nitrogen rich (Garcia-Segura, Langer, & Mac Low 1996), whereas
the higher mass Wolf-Rayet stars have core collapse after the Wolf-Rayet has turned from a WN
to a WC type (Garcia-Segura, Mac Low, & Langer 1996). Thus, the lack of a N V line in the
spectrum of GRB 021004 appears to imply that the burst progenitor must be amongst the more
massive of Wolf-Rayet stars. Alternatively, the progenitor might be a star for which the original
mass was too low (< 30 M⊙) to allow it to become a WN-type star, yet it would still have fast and
dense winds that are not nitrogen-rich.
The lack of molecular hydrogen absorption can be used to place further limits on the density
of the gas near the burster. In the model of Draine & Hao (2002), the column density of excited
H2, N(H∗2 ), arises from an ionization/dissociation front the dynamics of which imply that there are
natural values of the column depth. For example, an increase in the burst fluence would produce
a similar front (only deeper into the molecular cloud) with a similar N(H∗2 ), while an increase
in the molecular density would produce a front with a narrower width yet with a similar N(H∗2 ).
The only way to produce a smaller column density is to have UV fluxes that are not sufficient
to establish a proper ionization/dissociation front in the molecular hydrogen. This could arise if
the molecular cloud were at a great distance (say, 1 kpc) from the burster or if the burster were
near the edge of the molecular cloud. Draine calculates that a typical burst will destroy molecular
hydrogen in gas with a hydrogen column density of 5 × 1022cm−2 (corresponding to AV = 20 or
so). For densities from 100–10000 cm−3, the burst will destroy the molecular hydrogen that could
serve as an absorber if it is within roughly 2–200 pc of the edge of the cloud. For the general case
of the burst erupting well inside a molecular cloud, the N(H∗2 ) will be the value used to calculate
the template (see Section 2), and this is rejected by our spectrum. We conclude that the lack of
molecular hydrogen absorption lines in our spectra indicate that the γ-ray burst is not inside a
molecular hydrogen cloud unless it is within ∼2-200 pc from its edge.
4. The Spectral Energy Distribution
We have constructed broad-band fluxes from the radio to the x-ray for several epochs (see
Figure 3) with the data collected from the GCN notices. The major features of the radio emission

– 17 –
are: i) at 0.5–3.5 days the 15 GHz light-curve rises as t0.4±0.3, ii) at 1.5 days the 15–86 GHz
spectrum is Fν ∝ ν0.6±0.2, appearing flat from 86 to 230 GHz, and iii) at 5.7 days the 1.4–8.5
GHz spectrum is Fν ∝ ν1.0±1.6. The last two features indicate that the synchrotron self-absorption
frequency νa is not significantly above 15 GHz at 1.5 days and not much below 8 GHz at 5.7
days, which would suggest a wind-like medium (for which νa ∝ t−3/5) instead of a homogeneous
environment (for which νa is constant). However, with only a few measurements and the possibility
of significant interstellar scintillation affecting the lower frequency (under 15 GHz) observations, it
is premature to favor a wind-like medium based on the apparent decrease of νa over a factor of 4 in
time. The rise of the 15 GHz emission is consistent with both the expectations from a homogeneous
medium (where Fν ∝ t1/2 irrespective of the location of νa) and a behavior intermediate to the
asymptotic Fν≪νa∝ t and Fν≫νa
= const expected for a wind-like medium.
Within the framework of relativistic fireballs, consistency between the decay rate of the optical
emission (Fν ∝ t−αO with αO ≃ 1.0) and spectral slope (Fν ∝ ν−βO with βO ≃ 1.0) requires that the
cooling frequency νc is below or within the optical range, as in this case the expected relationship
(βO = (2αO + 1)/3, irrespective of the type of external medium) is satisfied. Furthermore, that
νc is below optical is also consistent with the equality of the optical and X-ray decay indices
(αX = 1.0 ± 0.2; Sako & Harrison 2002) and spectral slopes (βX = 1.1 ± 0.1). We note, however
that the difference between the observed optical and X-ray decay indices, αX − αO = 0.2, is also
consistent (even if only marginally) with the theoretically expected value αX − αO = 0.25 in the
case where νc is above the optical domain but below X-rays, and that the intrinsic optical spectral
slope βo can be smaller than observed if there is a significant dust reddening within the host galaxy.
Therefore, the cooling frequency could be above the optical domain, in which case one expects that
βo = 2αO/3 = 2/3 for a homogeneous medium, and βo = (2αO−1)/3 = 1/3 for a wind-like medium.
Furthermore it is also expected that βo = βX −0.5 = 0.6±0.1, which favors a homogeneous medium
when compared with the above βo inferred from the optical decay.
Concluding, the currently available radio and optical data for GRB 021004 do not constrain
sufficiently the type of external medium, homogeneous or wind-like. However, the average density
of the medium or the mass-loss rate–to–wind speed ratio can be determined if the cooling frequency
lies within the optical range at about 2 days, as suggested by Matheson et al 2002. Together with
the optical measurements, the 15, 86 and 230 GHz fluxes reported by Pooley (2002) and Bremer
& Castro-Tirado (2002) indicate that, at 1.5 days, the peak of the spectrum of GRB 021004 is ∼ 3
mJy, at a frequency between 1011 and 1012 Hz. Adding that νa ≃ 10 GHz at a few days, these four
constraints on the synchrotron spectrum are sufficient to determine the external medium density,
fireball isotropic-equivalent energy, and fractional energies in electrons and magnetic fields. We
obtain an external density in the range 100.5 − 102.5 cm−3 for a homogeneous medium, consistent
with the values found by Panaitescu & Kumar (2002) for other GRB afterglows. For a wind-like
medium, we find that density of the wind corresponds to that resulting from a mass-loss rate–to–
wind speed ratio in the range 1 to several times 10−5(M⊙yr−1)/(1000 km s−1), within the range
expected for WR stars.

– 18 –
5. The Light Curve
We have constructed light curves and color curves for GRB 021004 from data published in
the GCN notices (see Figure 4). Overall, the light curve behaves approximately as a t−1 power
law which is normal for many afterglows. However, there are many significant bumps and wiggles
about any simple single power law. To help visualize these bumps, the middle panel of Figure 4
shows the R-band light curve after a t−1 power law has been subtracted, and we see three bumps
with peaks at 0.14, 1.1, and 4.0 days after the burst. The V-R color is plotted in the lower panel
of Figure 4. The color appears to remain essentially constant from 0.2 to 10 days.
Afterglow models suggest that light curves should consist of broken power laws, so there is
an urge to try to interpret Figure 4 in terms of broken power laws. Perhaps the basic behavior is
t−1 with bumps and some separate mechanism for the dimness at the earliest times. Alternatively,
perhaps the basic behavior is a t−0.7 power law up until a break at 3 days to a t−1.5 power law with
a particularly strong bump from 0.1–0.7 days. For a third alternative, perhaps the basic behavior
is a t−1.5 decline over the entire time range except that some mechanism inserts more energy three
times during the decline (at 0.14, 1.1, and 4.0 days).
In general, γ-ray burst afterglows have simple power law declines in brightness, often with
a break ascribed to collimation of the outflow. Nevertheless, many γ-ray bursts have bumps in
their afterglows. For example, the optical brightness of the afterglow of GRB 970508 increased by
1.5 magnitudes 1–2 days after the γ-ray burst (Garcia et al. 1998). GRB 970508 was seen by the
BeppoSAX satellite to have a significant brightening in its x-ray light curve starting at 16 hours
after the burst (Piro et al. 1999). GRB 000301c displayed an achromatic bump that peaked around
4 days after the burst that has been ascribed to gravitational microlensing by Garnavich, Loeb, &
Stanek (2000). In addition, three γ-ray bursts with bumps around 30 days after the burst have
been ascribed to an underlying supernova (Reichart 1999, Bloom et al. 1999; 2002; but see Dermer
2002) or dust echos (Reichart 2001).
The presence of bumps in otherwise-smooth afterglow light curves has previously been at-
tributed to microlensing, dust echos and supernovae. Now we have a burst with three bumps,
and they cannot all be due to microlensing, dust echos, or supernovae, so we have a proof that
afterglows can makes bumps on various time scales for other reasons. Thus, the mere presence
of a single bump can only provide poor support for any particular proposed cause unless other
possibilities can be excluded by some means. For example, the red color of a bump (compared to
the underlying afterglow) cannot be taken as substantial evidence of a supernova origin until the
cause and color-distribution of other classes of bumps are known.
There are two generic scenarios (in addition to microlensing, dust echos, and supernovae) for
producing variability in the afterglow emission: an inhomogeneous circumburst medium and non-
uniform properties of the γ-ray burst ejecta (see also Nakar, Piran & Granot 2003). Inhomogeneities
in the external gas could be either in the form of clumps of denser material (Wang & Loeb 2000),
which enhance the dissipation of the kinetic energy of the γ-ray burst remnant and, implicitly, the

– 19 –
afterglow brightness, or in the form of a stratified medium, consisting of shells of various densities
(Lazzati et al. 2002), perhaps produced by fluctuations in the wind blown by the γ-ray burst
progenitor not long before the release of the γ-ray burst ejecta. Non-uniformities in the γ-ray burst
ejecta could be manifest either as a range of initial Lorentz factors within an impulsive ejection
or as a non-isotropic distribution of the ejecta energy per solid angle. In the former case, the
slower part of the outflow catches up with the faster part as the latter is decelerated, enhancing the
afterglow kinetic energy and, hence, its brightness. In the latter case, the regions of higher angular
energy density are bright spots on the ejecta surface, moving slightly off the direction toward the
observer, so that fluctuations in the afterglow emission are produced as the spots decelerate and
the widening cone of their relativistically beamed emission starts to include the direction toward
the observer. The variable-Lorentz-factor and anisotropic outflow scenarios have been used to
explain the brightening of the afterglow of GRB 970508 by Panaitescu, Meszaros, & Rees (1998)
and Panaitescu & Kumar (2002), repectively.
An energy input that is extended in time prior to the brightening at 0.14 days could explain
the shallower decline prior to 0.14 days, while an inhomogeneous shell with a density decreasing
with radius (Lazzati et al. 2002) could account for the steeper light-curve decay after 0.1 days
in the stratified medium scenario. The faster decline after a brightening is consistent with the
expectations from scenarios involving dense clumps or bright spots, where the contribution of the
clump or spot to the total afterglow emission decreases in time as the fireball decelerates, and more
of the uniform ejecta surface becomes visible for the observer.
In the latter two scenarios where the afterglow emission from clumps or spots declines with
time, the afterglow light curve should eventually recover its initial decay rate. In this context, the
observed light curve is consistent with the proposal that the t−0.7 fall-off seen in the first 15 minutes
reappeared at 0.7 days, just about the time the spectra reported here were obtained, and lasted
until 1–3 days after the burst, when the light curve steepened to t−1.0. If this interpretation is
correct, GRB 021004 would display the shallowest light-curve break ever observed. The change in
the break index would be ≃ 0.3, suggesting that the break is caused by the passage of the cooling
break through the optical domain (Panaitescu & Kumar 2001). The existence of a break in the
optical spectrum at 1–3 days is supported by the spectroscopic observations by Matheson et al.
(2002) and this paper (see §2), that the blue part of the optical spectrum reddens between < 1
and > 2.8 days. This interpretation is consistent with a break frequency that decreases in time,
implying that the external medium is homogeneous rather than wind-like. In the case of a wind,
the cooling frequency should increase at least as fast as t1/2 (Panaitescu & Kumar 2001). We note,
however, that the break in the optical spectrum seems too sharp in wavelength to be due to the
cooling break (across which the slope of the power-law spectrum changes by 0.5), and that the
spectral changes may not sufficiently affect the R-band light-curve at a few days to explain the
R-band light curve behavior.
The radial distance of the jet from the center of the progenitor as a function of the observer’s
time should be correlated with the location of clumps and the epoch of the light curve bumps. This

– 20 –
can be modelled given both the broad-band spectrum and the light curve by the methods presented
in Panaitescu & Kumar (2001, 2002). Unfortunately, only preliminary input numbers are available
(for example, no jet break has yet been definitely timed) and details of the external medium are
not known (for example, whether or not the average density falls off like a wind). Nevertheless, it
is possible to give estimates that are useful for producing a reasonable picture. For this, we adopt
the isotropic equivalent energy of the fireball equal to 5.6× 1052 erg (Malesani et al. 2002a). If the
jet is expanding into an external medium with a wind-like structure, then we found in the previous
section that the mass-loss-rate to wind-speed ratio is roughly 2×10⁻⁵M⊙ per 1000 km s−1. In this
case, the radius of the jet will be t0.5×0.06 pc, with t measured in days. If the jet is expanding into
a homogenous medium of constant density, then we found in the previous section that the density
is roughly 30 cm−3. In this case, the radius of the jet will be t0.25 × 0.07 pc.
If the light curve bumps are due to density enhancements in the surrounding medium, then
we can estimate the approximate radial distances from the burst and over-densities for each clump.
For peaks in the light curve at 0.14, 1.1, and 4.0 days, we find approximate radii for the density
clumps of 0.022, 0.063, and 0.12 pc, respectively, for a wind-like medium. We get similar results
for expansion into a homogenous medium with parameters as derived above. The excess light in
the light curve bumps will scale roughly as the square root of the over-density compared to the
“background” density, for the case where the clump is relatively large compared to the visible region
(as for a shell). From Figure 4, the extra light in each of the bumps is roughly 0.6, 0.3, and perhaps
0.3 mag; this corresponds to over-densities of roughly 50%, 10%, and 10%. If the bumps are due
to clumps, the broad-band spectral slopes should remain the same and thus the colors would not
change across the bump, as observed.
At some time the afterglow jet will collide with the gas that is causing the z ∼= 2.293 absorption.
When this happens, we would expect that the afterglow will brighten significantly if the gas is in a
relatively narrow shell. We also expect that the associated absorption lines will disappear. We note
that our late HET spectrum still showed the z ∼= 2.293 C IV line with moderately low significance
at a time of 4.84 days after the burst when the jet would have reached ∼ 0.13 pc. In principle,
we can predict the date at which this bump in the afterglow decline should occur. In practice,
such a prediction will have substantial uncertainties, primarily in the exact radius of the shell and
the density structure of the medium inside the shell. In the case where a shell of material has
been radiatively accelerated to 3000 km s−1, the shell will have a radius not much larger than 0.1
pc and it should be over-run sometime between roughly 2–40 days after the burst. In the case
where the absorption is due to a Wolf-Rayet wind that extends out to several parsecs, the 3000
km s−1 component will be completely eliminated only after many years. The absorption will slowly
diminish during the first few months after the burst as the jet catches up with the densest inner
part of the wind. In summary, the absorbing gas might be eliminated during the early days after
the burst (an event that could be directly observable) or it might take many years to be eliminated
(and be totally unobservable).

– 21 –
6. Conclusions
The GRB 021004 spectrum displays high-ionization and high-velocity absorption lines. We
argue that these lines are likely to have arisen from shells of gas around the progenitor star, and
further, that these shells plausibly come from a progenitor that was descended from a massive star.
The gas in these shells was partially ionized and accelerated by the photons from the burst.
We have used the optical spectrum, the broad-band spectrum, and the light curve to identify
six components in the medium external to the γ-ray burst. The z ∼= 2.293 absorption lines arise
from a shell at a radial distance of less than a parsec that is moving at a velocity of 3000 km s−1after
being ionized and accelerated by the burst radiation. We identify this component as being the wind
from the progenitor star, perhaps a Wolf-Rayet star with a mass loss rate of ∼ 6×10⁻⁵M⊙yr−1 or a
lower mass star wind accelerated by the bust. This same component provides the external medium
with which the jet is colliding to produce the afterglow light. This inner component is probably
significantly clumped in order to prevent complete ionization and to facilitate recombination, thus
allowing a significant column depth of C IV. The second component is associated with the absorption
lines moving 560 km s−1 with respect to the host galaxy velocity. We identify this component as
arising from a shell of material plowed up by the Wolf-Rayet-like wind at a radius of order 10
parsecs. Alternatively, this feature could be a shell or clump at ∼ 0.5 pc accelerated by the burst.
The third component gives rise to the low-velocity high-excitation absorption lines which must
come from a distance between tens and hundreds of parsecs from the burster. This component
might be from the shell created by the O main sequence star wind or it might be from chance ISM
clouds along the line of sight, perhaps part of the same star forming region that gave birth to the
γ-ray burst progenitor. The fourth, fifth, and sixth components are three density enhancements
that occur in the Wolf-Rayet-like wind at radial distances of 0.022, 0.063, and 0.12 pc so as to
produce the three bumps in the light curve. These clumps could be related to the clumping we
deduce for component 1, that is, all could be associated with knots in the progenitor wind.
The results summarized in the previous paragraph offer a plausible description of the density
structure near this burst. What we see is a variety of density enhancements along the line of
sight, with the evidence coming from bumps in the light curve decline and absorption lines in the
spectrum. This picture is apparently not universal for γ-ray bursts, since only two out of nine
bursts with well-observed afterglow spectra show both high-excitation and high-velocity lines. The
other bursts must have some mechanism for suppressing similar absorption lines.
A full analysis is needed for the z ∼ 2.3 lines of GRB 021004, with the possibility of determining
the abundance of the progenitor’s shell and hence to obtain information about the progenitor itself.
As a start to this program, we have shown that the nitrogen in the shell is under-abundant with
respect to the carbon, and this demonstrates that the progenitor was not a WN-type Wolf-Rayet
star and further that the progenitor was either one of the more massive Wolf-Rayet stars or a
massive star that is below that required to make a WN-type star. A further program for our
community is to obtain high dispersion spectroscopy so as to be able to measure fine velocity

– 22 –
structures and faint lines in the afterglow spectra of many bursts.
The most important result from our data and analysis is that a plausible way to create the
high-excitation and high-velocity absorption lines is to have shells of gas surrounding the progenitor,
and that a realistic way to achieve this is for the progenitor to be a star descended from a massive
O-type main sequence star. This strongly suggested connection to a massive star is much more
direct than the moderate statistical association of γ-ray bursts with parts of galaxies undergoing
star formation and is much more convincing than attributing poorly observed bumps in afterglow
light curves to some associated supernova event. As such, we believe that the absorption lines in
the GRB 021004 spectra provide the first strong and direct argument for associating a normal γ-ray
burst with a massive progenitor star surrounded by shells.
We thank Bruce Draine, Bev Wills, Greg Shields, and D. J. Hillier for their discussion on a
wide range of topics. This work was supported in part by NASA Grant NAG59302 and NSF Grant
AST-0098644. The Marcario Low Resolution Spectrograph is a joint project of the Hobby - Eberly
Telescope partnership and the Instituto de Astronomia de la Universidad Nacional Autonoma de
Mexico. The Hobby - Eberly Telescope is operated by McDonald Observatory on behalf of The
University of Texas at Austin, the Pennsylvania State University, Stanford University, Ludwig-
Maximilians-Universitat Munchen, and Georg-August-Universitat Gottingen.
REFERENCES
Anders, E. & Grevesse, N. 1989, Geochim. Cosmochim. Acta, 53, 197
Balman, S. et al. 2002, GCN Circ. 1580
Barsukova, E. A. et al. 2002a, GCN Circ. 1606
Barsukova. et al. 2002b, GCN Circ. 1654
Barth, A. J. et al. 2002, astro-ph/0212554
Berger, E. et al. 2002, GCN Circ. 1613
Bersier, D., Winn, J., Stanek, K. Z., & Garnavich, P. 2002, GCN Circ. 1586
Bloom, J. S. et al. 1999, Nature, 401, 453
Bloom, J. S. et al. 2002, ApJ, 572, L45
Bremer, M. & Castro-Tirado, A. 2002, GCN 1590
Castander, F. J. et al. 2002, GCN Circ. 1599
Chornock, R. & Filippenko, A. V. 2002, GCN Circ. 1605

– 23 –
Cool, R. J. et al. 2002, GCN Circ. 1584
Covino, S. et al. 2002a, GCN Circ. 1595
Covino, S. et al. 2002b, GCN Circ. 1622
Dermer, C. D. 2002, astro-ph/0204037
Di Paola, A. et al. 2002, GCN Circ. 1616
Djorgovski, S. G. et al. 2002, GCN Circ. 1620
Draine, B. T. & Hao, L. 2002, ApJ, 569, 780
Eracleous, M. et al. 2002, GCN Circ. 1579
Fox, D. W. et al. 2002a, GCN Circ. 1564
Fox, D. W. et al. 2002b, GCN Circ. 1569
Frail, D. A. et al. 2001, ApJ, 562, L55
Garcia-Segura, G., Mac Low, M.-M., & Langer, N. 1996, A&A, 305, 229
Garcia-Segura, G., Langer, N., & Mac Low, M.-M. 1996, A&A, 316, 133
Garcia, M. et al. 1998, ApJ, 500, L105
Garnavich, P. & Quinn, J. 2002, GCN Circ. 1661
Garnavich, P. L., Loeb, A., & Stanek, K. Z. 2000, ApJ, 544, L11
Gerardy, C. L. & Fesen, R. A. 2001, AJ, 121, 2781
Halpern, J. P. et al. 2002a, GCN Circ. 1578
Halpern, J. P. et al. 2002b, GCN Circ. 1593
Hill, G.J., Nicklas, H., MacQueen, P.J., Tejada de V., C., Cobos D., F.J., & Mitsch, W. 1998, in
Optical Instrumentation, S. D’Odorico, Ed., Proc. SPIE, 3355, 375
Hill, G.J., Wolf, M.J., Tufts, J.R., & Smith, E.C. 2003, Proc. SPIE, in press
Hoflich P., Khokhlov A., & Muller M. 1992, A&A 259, 549
Holland, S. T. et al. 2002a, AJ, 124, 639
Holland, S. T. et al. 2002b, GCN Circ. 1578
Holland, S. T. et al. 2002c, GCN Circ. 1597

– 24 –
Klotz, A. et al. 2002a, GCN Circ. 1614
Klotz, A. et al. 2002b, GCN Circ. 1615
Kudritzki, R.-P. & Puls, J. 2000, ARA&A, 38, 613
Lamb, D. Q. et al. 2002, GCN Circ. 1600
Landolt, A. U. 1992, AJ, 104, 340
Lazzati, D. & Perna, R. 2002, MNRAS submitted, astro-ph/0212105
Lazzati, D., Rossi, E., Covino, S., Ghisellini, G., & Malesani, D. 2002, A&A, in press, astro-
ph/0210333
Lindsay, K., Hartmann, D. H., & Tassinari, J. 2002a, GCN Circ. 1628
Lindsay, K., Hartmann, D. H., Davis, K., & Leising, M. 2002, GCN Circ. 1638
Lotz, W. 1967, ApJSupp, 14, 207
Malesani, D. et al. 2002a, GCN Circ. 1607
Malesani, D. et al. 2002b, GCN Circ. 1645
Masetti, N. et al. 2002, GCN Circ. 1603
Matheson, T. et al. 2002, submitted to ApJ, astro-ph/0210403
Matsumoto, K. et al. 2002, GCN Circ. 1594
Mirabal, N. et al. 2002a, ApJ, 578, 818
Mirabal, N., Halpern, J. P., Chornock, R., & Filippenko, A. V. 2002b, GCN Circ. 1618
Mirabal, N. et al. 2002c, GCN Circ. 1602
Møller, P. et al. 2002, A&A, in press
Nakar, E., Piran, T., & Granot, J. 2002, New Astronomy, submitted, astro-ph/0210631
Oksanen, A., et al. 2002a, GCN Circ. 1570
Oksanen, A. et al. 2002b, GCN Circ. 1591
Panaitescu, A. & Kumar, P. 2001, ApJ, 554, 667
Panaitescu, A. & Kumar, P. 2002, ApJ, 571, 779
Panaitescu, A., Meszaros, P., & Rees, M.J. 1998, ApJ, 503, 314

– 25 –
Piro, L. et al. 1999, ApJ, 514, L73
Piro, L. et al. 2000, Science, 290, 955
Pooley, G. 2002, GCN 1588
Reichart, D. E. 1999,ApJ, 521, L111
Reichart, D. E. 2001,ApJ, 554, 643
Sahu, D. K. et al. 2002, GCN Circ. 1587
Sako, M. & Harrison, F. 2002, GCN 1624
Salamanca, I., Rol., E., Wijers, R., Ellison, S., Kaper, L., & Tanvir, N. 2002, GCN Circ. 1611
Sargent, W. L. W., Steidel, C. C., & Boksenberg, A. 1988, ApJSupp, 68, 539
Savaglio, S. et al. 2002, GCN Circ. 1633
Schaefer, B. E. 2002, ApJLett, 583, in press (astro-ph/0212454)
Schaefer, B. E., Deng, M., & Band, D. L. 2001, ApJ, 563, L123
Shiraski, Y. et al. 2002, GCN Circ. 1565
Stanek, K. Z., Bersier, D., Winn, J., & Garnavich, P. 2002, GCN Circ. 1598
Stefanon, M. et al. 2002, GCN Circ. 1623
Uemura, M. et al. 2002, GCN Circ. 1566
Veigle W.J. 1973, Atomic Data Tables 5, 51
Vietri, M. & Stella, L. 1998, ApJ, 507, L45
Vreeswijk, P. M. et al. 2001, ApJ, 546, 672
Wang, X. & Loeb, A. 2000, ApJ, 535, 788
Weidinger, M. et al. 2002, GCN Circ. 1573
Wheeler, J. C., Yi, I., Hoflich, P., & Wang, L. 2000, ApJ, 537, 810
Williams, G., Lindsay, K., & Milne, P. 2002, GCN Circ. 1652
Winn, J. et al. 2002, GCN Circ. 1576
Woosley, S. E. & Heger, A. 2001, AAS, 198, 3801
Woosley, S. E., Langer, N., & Weaver, T. A. 1993, ApJ, 411, 823

– 26 –
Zharikov, S., Vazquez, R., Benitez, G., & del Rio, S. 2002, GCN Circ. 1577
This preprint was prepared with the AAS LATEX macros v5.0.

– 27 –
Table 1. Line list for z ∼ 2.3 component.
λobs(A) Line Identification λrest(A) EWobs/(1 + z)(A)a zb
4587.2 ± 3.6 Si IV 1393.8 0.60 ± 0.24 2.291
4628.8 ± 1.3 Si IVc 1393.8 2.44 ± 0.30 2.321
4628.8 ± 1.3 Si IVc 1402.8 2.44 ± 0.30 2.299
4665.9 ± 1.8 Si IV 1402.8 1.17 ± 0.24 2.326
5106.2 ± 0.9 C IV 1548.2 & 1550.8 1.39 ± 0.12 2.296
5149.9 ± 0.4 C IV 1548.2 & 1550.8 5.42 ± 0.18 2.325
5559.9 ± 3.5 Al II 1670.8 0.66 ± 0.33d 2.328
∼ 4095 N V 1238.8 & 1242.8 ≤ 0.30 ∼ 2.3
aThe observed equivalent width measured in Angstroms corrected to the rest frame of
the burst.
bThe uncertainty in red shift z is 0.001 – 0.002.
cThe 4628.8 A line is a blend of the two Si IV doublet lines from the two red shift
components.
dThis line is close to the bright night sky line at 5575 A, so there might be significant
systematic uncertainties in the equivalent width due to imperfect night sky subtraction.

– 28 –
Fig. 1.— Combined spectrum for the first night. The absorption lines longward of 5800 A are due
to intervening galaxies at red shifts of 1.38 and 1.60. The primary lines of interest are the C IV
lines from 5106–5150 A and the Si IV doublet from 4587–4666 A. Key points in our analysis are
that these are highly ionized lines and that there are multiple velocity components which span a
velocity of 3000 km s−1. We identify the lines with red shift of around 2.293 as coming from a shell
around the progenitor at a distance of less than a parsec.

– 29 –
Fig. 2.— The terminal velocity induced by GRB 021004 radiation as a function of distance for three
abundances (normal solar abundance, a Wolf-Rayet abundance with little hydrogen and enriched
CNO elements, and a pure H II gas) and two values of Ebreak (see text), 10 keV and 23 keV in
the frame of the host galaxy (3 keV and 7 keV in the Earth frame). The low energy cutoff in the
spectrum, Ecutoff , (0.01, 1.0, and 10 keV in the host galaxy frame) below which we assume there
is zero flux was also varied. The thick solid line represents the case (WR composition, the highest
break energy, and flux continuing to 1 keV) that we think is most applicable to GRB 021004. for
which gas at a distance of around 0.2 pc could be accelerated from rest to 3000 km s−1 by the
burst. The derived radial distances depend little on the gas composition. The two lowest curves
correspond to cases where the low energy photons do not interact with the gas by bound-free
collisions, demonstrating that most of the acceleration arises from bound-free interactions with low
energy photons. The case with Ecutoff = 0.01 keV is an extreme situation that we do not think is
likely since even a small amount of gas will produce much higher cutoff energies.
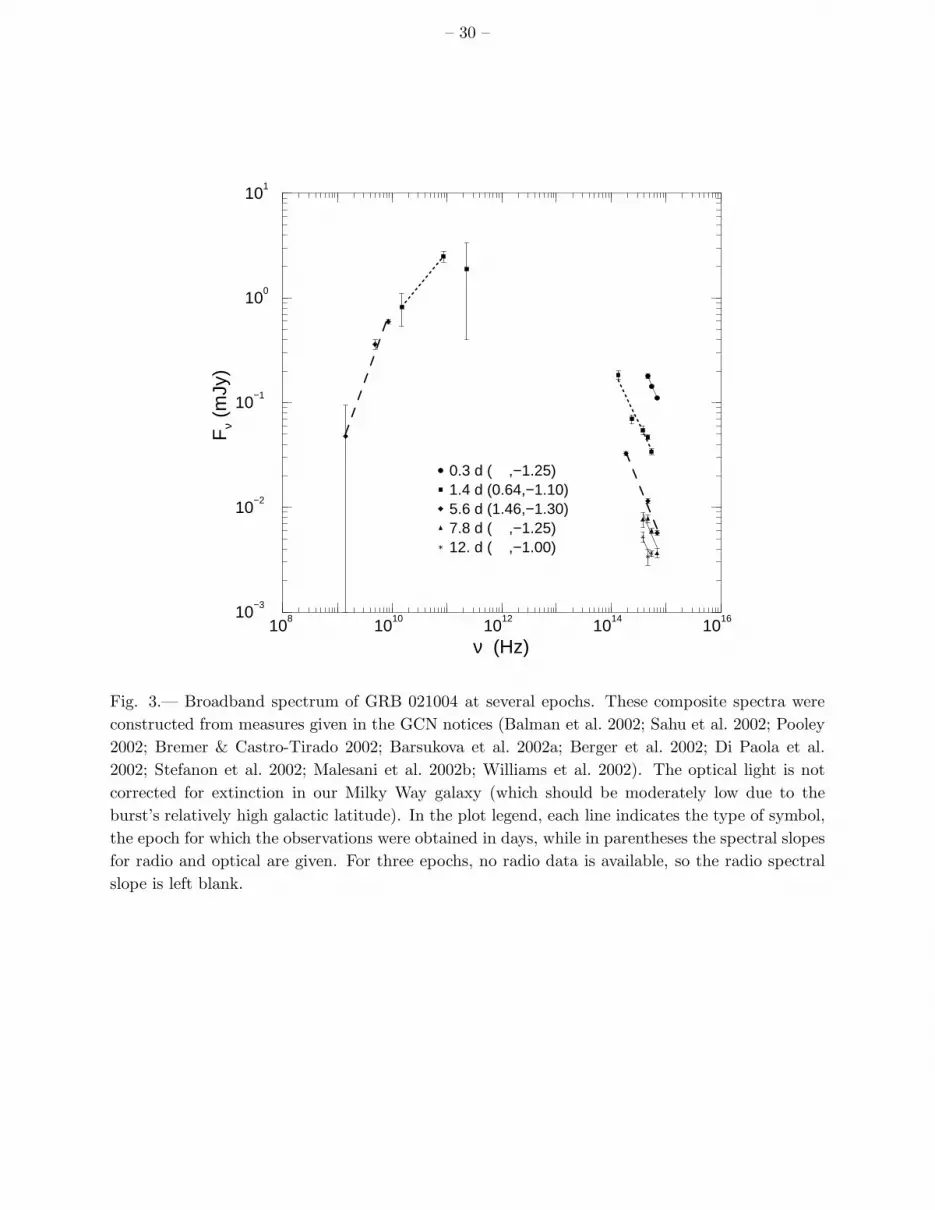
– 30 –
108
1010
1012
1014
1016
ν (Hz)
10−3
10−2
10−1
100
101
Fν
(mJy
)
0.3 d ( ,−1.25)1.4 d (0.64,−1.10)5.6 d (1.46,−1.30)7.8 d ( ,−1.25)12. d ( ,−1.00)
Fig. 3.— Broadband spectrum of GRB 021004 at several epochs. These composite spectra were
constructed from measures given in the GCN notices (Balman et al. 2002; Sahu et al. 2002; Pooley
2002; Bremer & Castro-Tirado 2002; Barsukova et al. 2002a; Berger et al. 2002; Di Paola et al.
2002; Stefanon et al. 2002; Malesani et al. 2002b; Williams et al. 2002). The optical light is not
corrected for extinction in our Milky Way galaxy (which should be moderately low due to the
burst’s relatively high galactic latitude). In the plot legend, each line indicates the type of symbol,
the epoch for which the observations were obtained in days, while in parentheses the spectral slopes
for radio and optical are given. For three epochs, no radio data is available, so the radio spectral
slope is left blank.

– 31 –
Fig. 4.— Light curve and color curve for GRB 021004. The top panel displays all R-band magni-
tudes reported to date in the GCN notices (Fox et al. 2002a; Uemura et al. 2002; Oksanen et al.
2002a; Weidinger et al. 2002; Winn et al. 2002; Zharikov et al. 2002; Halpern et al. 2002b; Balman
et al. 2002; Cool et al. 2002; Halpern et al. 2002a; Bersier et al. 2002; Sahu et al. 2002; Oksanen et
al. 2002b; Halpern et al. 2002b; Matsumoto et al. 2002; Covino et al. 2002a; Holland et al. 2002c;
Stanek et al. 2002; Mirabal et al. 2002c; Masetti et al. 2002; Barsukova et al. 2002a; Malesani et al.
2002a; Klotz et al. 2002a,b; Di Paola et al. 2002; Mirabal et al. 2002b; Covino et al. 2002b; Stefanon
et al. 2002; Lindsay et al. 2002a,b; Malesani et al. 2002b; Williams et al. 2002; Barsukova et al.
2002b; Garnavich & Quinn 2002). The magnitudes have all been reduced to the system reported
by Henden (2002). For comparison, a t−1 power law is shown. The middle panel shows the same
data with the t−1 power law subtracted. The important point is that the brightness displays three
peaks or bumps, centered at times of roughly 0.14, 1.1, and 4.0 days after the burst. The bottom
panel shows the V-R color. Most of the V magnitudes reported in the GCN are from one single
interval (0.3–0.6 days after the burst). Our V-R colors from synthetic photometry of the HET and
McDonald 2.7m spectra are marked as ‘H’ and ‘M’ respectively. We see that the V-R color does
not change significantly over the interval from 0.2–10 days.