wide hi profile galaxies
TRANSCRIPT
arX
iv:1
103.
2910
v1 [
astr
o-ph
.GA
] 1
5 M
ar 2
011
Galaxies with wide HI profiles
Noah Brosch, Oded Spector and Adi Zitrin
The Wise Observatory and the Raymond and Beverly Sackler School of Physics and
Astronomy, the Faculty of Exact Sciences,
Tel Aviv University, Tel Aviv 69978, Israel
ABSTRACT
We investigate the nature of objects in a complete sample of 28 galaxies se-
lected from the first sky area fully covered by ALFALFA, being well-detected and
having HI profiles wider than 550 km s−1. The selection does not use brightness,
morphology, or any other property derived from optical or other spectral bands.
We investigate the degree of isolation, the morphology, and other properties
gathered or derived from open data bases and show that some objects have wide
HI profiles probably because they are disturbed or are interacting, or might be
confused in the ALFALFA beam. We identify a sub-sample of 14 galaxies lacking
immediate interacting neighbours and showing regular, symmetric, two-horned
HI profiles that we propose as candidate high-mass disk systems (CHMDs).
We measure the net-Hα emission from the CHMDs and combine this with
public multispectral data to model the global star formation (SF) properties of
each galaxy. The Hα observations show SFRs not higher than a few M⊙ yr−1.
Simple SF models indicate that the CHMDs formed most of their stars almost
a Hubble time ago, but most also underwent an SF event in the last ∼ 106−7
yrs; the young stars now produce 10 to 30% of the visible light. The spatial
distribution of the SF-regions is compatible with recycled stellar ejecta.
We calculate representative dynamical masses Mdyn for the CHMDs ranging
from ∼ 1011 M⊙ to ∼ 7 × 10¹¹ M⊙. The Mdyn values are larger by factors of 2.5
to 7.5 than the baryonic masses of the luminous stars and gas but are affected by
rather large errors. We test the Tully-Fisher relation for the CHMDs and show
that these lie below the relation defined by lower mass galaxies, i.e., that their
Mdyn is lower than expected when extrapolating the relation from lower mass
galaxies to higher HI line widths.
Subject headings: galaxies: star formation, galaxies: spiral, galaxies: evolution,
galaxies: kinematics and dynamics, galaxies: ISM
– 2 –
1. Introduction
Two basic cosmological questions are how do galaxies form and how do they achieve their
present structure. The current approach to answer these questions involves the comparison
of structure-formation models to galaxy observations at low- and high-redshift. The stellar
masses of galaxies can increase through major mergers, accretion of smaller satellite systems,
and star formation by converting gas into stars; some of this gas can be externally accreted.
Guo & White (2008) showed that the relative importance of these three modes is a strong
function of the stellar mass in the specific galaxy. Galaxy growth through major mergers
depends strongly on stellar mass, minor mergers contribute more to galaxy growth than
major mergers at all redshifts and stellar masses, and in galaxies significantly less massive
than the Milky Way, star formation dominates the growth.
Gavazzi & Scodeggio (1996) found that the star formation in late-type galaxies (Sa and
later) is most probably regulated by the total mass of a galaxy. Their assumptions in reaching
this conclusion were that galaxies develop in isolation, that they all have solar metallicity,
that the star formation rate (SFR) decreases exponentially with time with an e-folding time
depending on the galaxy mass, and that the initial mass function is “Salpeter”, with stars
from 0.1 to 120 M⊙.
Balogh et al. (2004) identified two galaxy families in the colour distribution of Sloan
Digital Sky Survey (SDSS) objects; a blue star-forming family and a red, passively-evolving
population. They concluded that transitions between the two families can take place on
short timescales of a few Gyr. Such transitions can be caused by mass influx from a merger
with a small, gas-rich galaxy (Martin et al. 2007).
In normal, inactive galaxies, the stellar velocity dispersion of the bulge σ∗ tracks the
maximal rotation velocity of the disk roughly as vm ≃ 1.7 × σ∗ (Whitmore et al. 1979).
Although the theoretical basis of this correlation is still not clear, and the vm − σ∗ relation
is not as tight as has been claimed (e.g., Pizzella et al. 2005, specifically for LSB galaxies),
nevertheless an empirical relation between vm and σ∗ does exist (Courteau et al. 2007).
This implies that σ∗ can, in principle, be estimated from vm. Since vm can be measured
from HI observations for galaxies that are sufficiently gas-rich, in the absence of a resolved
rotation curve vm can be estimated from a single-dish HI measurement while the inclination
angle of the disk can be derived from optical observations. Given the rotation velocity, it
is possible to deduce the total galaxy luminosity through the Tully-Fisher relation (Tully &
Fisher 1977) and the dynamical mass of the system given an estimate of the disk size from
optical imaging. It is not clear, however, whether these assumptions can be applied also
to any random sample of galaxies, although this seems to be the case at least for the “All
Digital HI catalog” objects (ADHIC: Courtois et al. 2009).

– 3 –
The Arecibo Legacy Fast ALFA (ALFALFA) survey is an on-going, second generation,
blind extragalactic HI survey using the seven-feed L-band focal plane array (ALFA) at the
Arecibo Observatory (AO). The seven beams have sizes of 3′.3 along the azimuth direction
and 3′.8 along the zenith angle direction. ALFALFA is performed by drift-scanning ribbons of
the sky and repeating these after a few months. The combination of multiple scans with the
fast one-second sampling (14 samples per source beam transit time) allows the centroiding
of HI sources to much less than a beam width (Giovanelli et al. 2005a, b). ALFALFA
will eventually survey more than 7000 square degrees of the high galactic latitude sky and is
expected to detect more than 25000 extragalactic HI sources up to a redshift of 18000 km s−1
exploiting AO’s superior sensitivity, angular resolution and digital technology. The survey
aims primarily to probe the faint end of the HI mass function (HIMF) and will provide a
complete HI census in the surveyed sky area. The ALFALFA survey strategy was described
by Giovanelli et al. (2005a) and survey results for selected sky regions were presented by
Giovanelli et al. (2005b, 2007), Saintonge et al. (2007) and Kent et al. (2008). A revision of
the HI mass function and a determination of ΩHI from the 40% of the total survey area with
complete source extraction was published by Martin et al. (2010). The source detection
algorithm and method were described by Saintonge (2007). ALFALFA is the best deep and
unbiased HI survey now in existence.
The ALFALFA survey yields a number of parameters for each detection. The ones most
often used are the position and radial velocity (to characterize the location of each object
in 3D space), and the total HI flux (to derive the HI mass). We use here an additional
parameter, w(50) that is the width of the HI profile at 50% of the peak flux density, to select
a sample of objects with HI profiles wider than 550 km s−1 from the published ALFALFA
catalogs and associated data products, and study it. The w(50) parameter can be used to
estimate the maximal rotation velocity of the gas in a galaxy (e.g., Courtois et al. 2009),
since for disk galaxies w(50) = 2× vmaxsin(i).
There could be a number of reasons why a galaxy should show a very wide HI profile
in a single-dish observation: it could have a high mass implying a fast asymptotic rotation
velocity, it could originate in a galaxy showing not only regular rotation but also some chaotic
dynamics, or it could result from the detection of a confused binary or multiple galaxy system
where the entire HI profile in the relatively wide ALFALFA beam is contributed by two or
more objects that may be strongly interacting (as found by e.g., Bothun et al. 1982). We
expect to be able to distinguish between these two possibilities from inspecting the optical
galaxy images and the galaxies’ HI profiles, and from the characterization of the CHMD’s
galaxy neighbourhood, thus being able to select a clean, HI-based, sample of high-mass
objects.
– 4 –
Trachternach et al. (2009) studied the baryonic Tully-Fisher (TF) relation in a sample of
very low-mass dwarf galaxies. They concluded that the baryonic TF relation is followed by all
rotationally-dominated galaxies. Since the relation was established using low-to-intermediate
rotational velocities, it is interesting to see how well it reproduces the behaviour of high
rotational velocities galaxies.
High-mass objects observed at present represent strong deviations of the initial density
fluctuation field in the early Universe. It is possible that interacting galaxies also originate
from such strong density fluctuations. In this case, the surroundings of galaxies with wide
HI profiles should be characterized by a higher galaxy density than at random locations.
This also is tested in our paper, where we adopt cosmology-corrected quantities: H0 = 73
km s−1 Mpc−1, Ωmatter=0.27 and Ωvacuum=0.73, as in NED.
The connection between HI gas and galaxy mass at the high-mass end was recently
studied by Catinella et al. (2010). They found that the gas-to-stellar-mass ratio decreases
with stellar mass and stellar surface mass density. Since we will be deriving both quantities
here, it will be interesting to compare our results with those of Catinella et al.
2. The sample
The sample studied here consists of 28 objects selected from the ALFALFA observations.
We stress that the selection was done on the ALFALFA data set available only to the
ALFALFA collaboration, including sources not yet published. All the objects with recession
velocity smaller than 12000 km s−1, HI profile width w(50) ≥550 km s−1 and ALFALFA
detection code 1 (implying high signal-to-noise and high confidence detection) were selected
from the ALFALFA region that has been fully covered by the survey, i.e., 7h.5≤RA≤16h.5
and +4 ≤Dec≤ +16, which is ∼20% of the final ALFALFA survey coverage. An ALFALFA
detection code of 1 implies a S/N≥6.5, but this cannot be translated into a flux density limit
since the S/N depends, among others, on the HI line width (see e.g. Giovanelli et al. 2007).
As an example, a source with a flux density of 0.72 Jy km sec−1 would be detected at 5σ if
its line width would be 200 km sec−1 (Giovanelli et al. 2005b, Figure 8).
The sample is therefore complete according to the selection criteria listed here and is
unbiased regarding optical brightness or surface brightness criteria. The volume surveyed
to detect these 28 objects is 7.2×10⁵ Mpc3; the corresponding volume density of these very
rare objects is 3.9×10⁻⁵ Mpc−3. By selecting objects closer than 12000 km sec−1 we avoid
the outer edge of the ALFALFA survey, which is the velocity bin 120000≤ v ≤18000 km
s−1. The lowest recession velocity present in our sample is 4933 km s−1 excluding also the
– 5 –
low-velocity segment of each ALFALFA data cube that contains “local” objects, such as the
Virgo Cluster.
The region has full SDSS coverage; it is thus possible to extract broad-band total mag-
nitudes and colors as well as images with reasonable resolution for the morphological clas-
sification of the selected objects. SDSS also yields radial velocities for the sample objects
and for some of their optical neighbours, while ALFALFA yields radial velocities for the
optically-faint but HI-rich neighbours. We aim to characterize the neighbourhood galaxy
density of each object by the distance to its nearest catalogued neighbor and by the num-
ber of objects in a preset volume, say within 3h−1 Mpc projected distance and 300 km s−1
velocity difference.
The galaxies selected from the ALFALFA survey are listed in Table 1. We give there
the name of the object as used in the ALFALFA survey (the AGC designator), the derived
HI position and the optical center of the galaxy from SDSS (both in J2000 coordinates),
its heliocentric recession velocity and error (in parentheses) in km s−1, the full width at
half-maximum of the HI line profile and its error (in parentheses) in km s−1, and the HI flux
integral FI and its error (in parentheses) in Jy km s−1. The heliocentric velocity is measured
as the midpoint between the channels where the flux density drops to 50% of each of the two
peaks (or of one, if only one is present) at each side of the spectral feature and is measured
in km s−1, as explained e.g., in Giovanelli et al. (2007). The velocity width of the source line
profile, w(50), is measured at the 50% outer level of each of the two peaks and is corrected
for instrumental broadening.
We checked carefully all 28 objects in the original selection to reject those that could
have a wide HI profile by being a confused pair or multiple object, or by being affected
by interactions to show a disturbed appearance. This was done by retaining only galaxies
where a two-horned profile could clearly be seen, and by inspecting the SDSS image and
radial velocity data to identify morphological disturbances or possible nearby companions.
Information about the inspection of SDSS images and spectral data is given in Appendix A;
the HI profiles are shown in Appendix B. The galaxies identified here as having an intrinsic
wide HI profile, and retained as such, are marked in bold font in Table 1.
We identified 14 galaxies with wide HI profiles that did not show signs of interaction
nor had nearby “significant” neighbour galaxies; these might be truly high-mass objects.
The objects chosen from the ALFALFA selection as candidate high-mass galaxies (CHMGs,
see below) were observed in the R-band and in rest-frame Hα, using the Wise Observatory
narrow-band filter set. These observations allow the determination of the Hα equivalent
width. This, together with the absolutely calibrated ugriz magnitudes from SDSS and other
public-domain data where available, allows the determination of the total Hα emission line

– 6 –
Table 1: ALFALFA galaxies with wide HI profilesObject HI ellipse Optical v50 w(50) FI
AGC name (J2000) α, δ (J2000) α, δ km s−1 km s−1 Jy km s−1
181756 082656.0+073011 082654.6+072953 9323(43) 685(86) 4.26(0.13)
192281 095900.0+130305 095859.9+130309 10470(3) 885(5) 3.62(0.17)
205190 104801.9+142431 104802.2+142429 9683(4) 698(7) 2.6(0.12)
200589 104837.6+125846 104834.1+125859 10768(3) 553(7) 1.73(0.11)
006042 105611.8+094544 105615.4+094515 9921(6) 568(12) 1.61(0.1)
201697 105744.9+151755 105744.8+151827 10955(3) 650(7) 1.48(0.1)
006066 105859.7+063141 105859.3+063121 11807(2) 667(4) 6.25(0.14)
222042 120305.6+051023 120305.0+051028 11569(5) 555(9) 2.37(0.14)
226077 122518.4+160740 122514.2+160713 9250(2) 582(4) 2.1(0.12)
226111 125934.9+150248 125936.0+150257 10678(1) 566(3) 2.38(0.1)
233609 130711.6+133918 130711.6+133933 8143(6) 624(11) 2.53(0.13)
008375 131954.6+155105 131956.3+155101 7007(34) 696(68) 2.39(0.14)
008379 132021.8+062019 132020.3+062010 11967(6) 569(11) 2.93(0.12)
008475 132925.7+110015 132925.8+110028 6835(1) 591(2) 15.71(0.14)
008488 133003.3+132511 133002.3+132458 7363(5) 596(11) 4.03(0.13)
008559 133453.9+135008 133455.9+134956 7025(12) 572(23) 4.31(0.12)
008766 135133.1+140515 135130.9+140530 6996(8) 622(16) 3.1(0.13)
008902 135903.1+153411 135902.8+153357 7559(3) 691(6) 20.14(0.13)
230914 140004.6+120630 140004.4+120641 11848(5) 580(11) 3.89(0.13)
008943 140213.5+080235 140213.1+080212 4933(49) 669(98) 1.67(0.1)
009031 140740.4+145204 140739.3+145151 11864(3) 709(6) 2.76(0.16)
248977 144110.9+145327 144112.3+145324 9153(19) 560(38) 2.13(0.13)
009624 145735.0+081726 145735.8+081706 11068(18) 599(36) 2.74(0.12)
009788 151536.1+081735 151538.7+081803 10178(9) 564(17) 3.77(0.14)
009794 1516 9.1+103033 151610.8+103034 6406(2) 630(5) 22.03(0.13)
009838 152512.3+070823 152512.2+070916 10267(9) 575(19) 2.59(0.15)
260110 160448.5+140741 160448.1+140744 10160(8) 610(15) 5.99(0.16)
010272 161257.3+095143 161256.9+095201 5124(31) 580(62) 1.72(0.1)
– 7 –
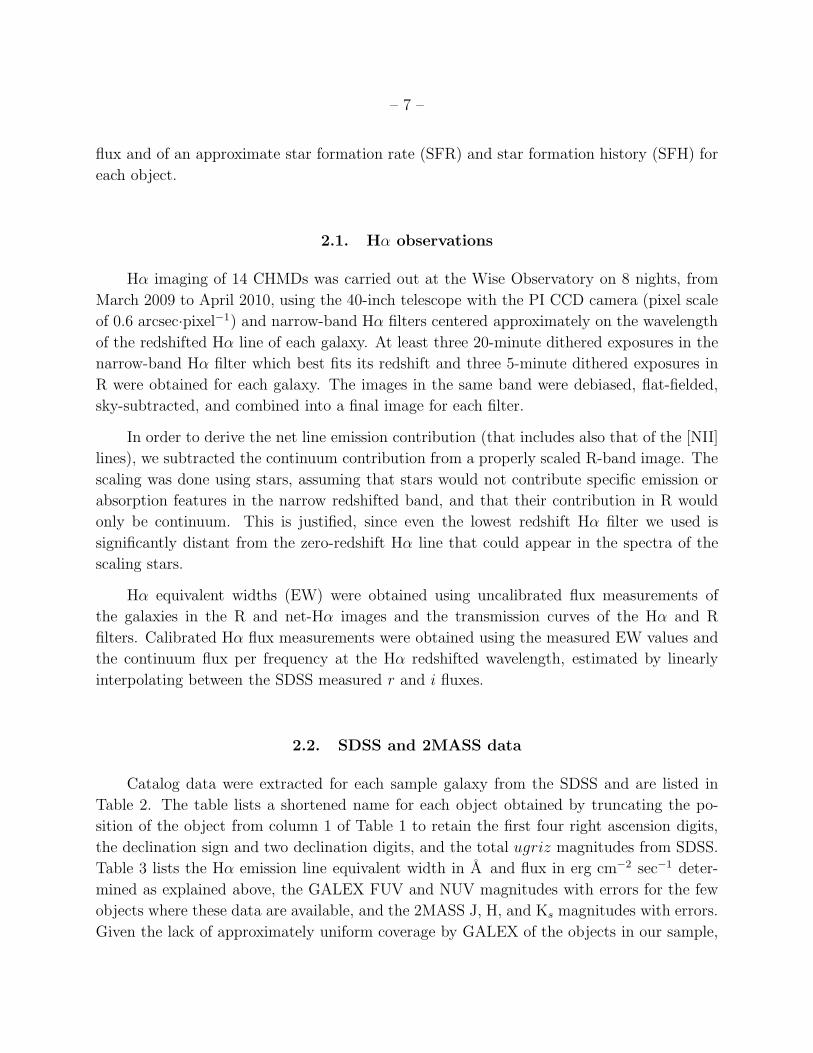
flux and of an approximate star formation rate (SFR) and star formation history (SFH) for
each object.
2.1. Hα observations
Hα imaging of 14 CHMDs was carried out at the Wise Observatory on 8 nights, from
March 2009 to April 2010, using the 40-inch telescope with the PI CCD camera (pixel scale
of 0.6 arcsec·pixel−1) and narrow-band Hα filters centered approximately on the wavelength
of the redshifted Hα line of each galaxy. At least three 20-minute dithered exposures in the
narrow-band Hα filter which best fits its redshift and three 5-minute dithered exposures in
R were obtained for each galaxy. The images in the same band were debiased, flat-fielded,
sky-subtracted, and combined into a final image for each filter.
In order to derive the net line emission contribution (that includes also that of the [NII]
lines), we subtracted the continuum contribution from a properly scaled R-band image. The
scaling was done using stars, assuming that stars would not contribute specific emission or
absorption features in the narrow redshifted band, and that their contribution in R would
only be continuum. This is justified, since even the lowest redshift Hα filter we used is
significantly distant from the zero-redshift Hα line that could appear in the spectra of the
scaling stars.
Hα equivalent widths (EW) were obtained using uncalibrated flux measurements of
the galaxies in the R and net-Hα images and the transmission curves of the Hα and R
filters. Calibrated Hα flux measurements were obtained using the measured EW values and
the continuum flux per frequency at the Hα redshifted wavelength, estimated by linearly
interpolating between the SDSS measured r and i fluxes.
2.2. SDSS and 2MASS data
Catalog data were extracted for each sample galaxy from the SDSS and are listed in
Table 2. The table lists a shortened name for each object obtained by truncating the po-
sition of the object from column 1 of Table 1 to retain the first four right ascension digits,
the declination sign and two declination digits, and the total ugriz magnitudes from SDSS.
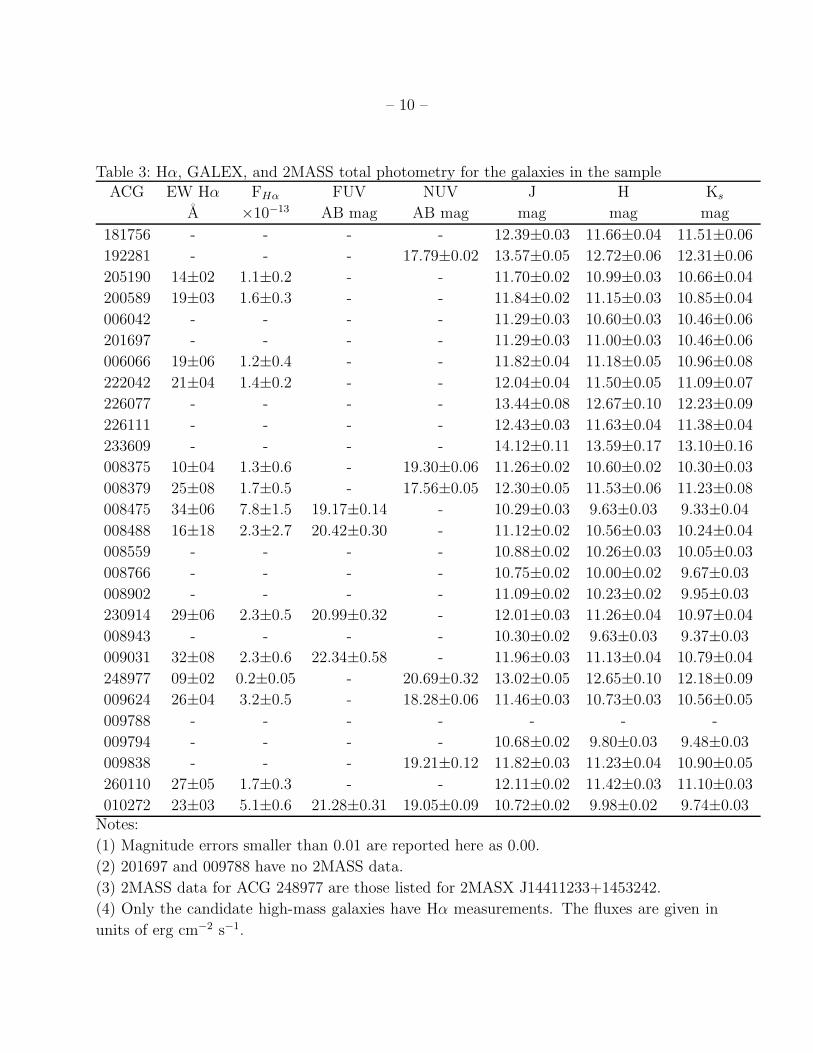
Table 3 lists the Hα emission line equivalent width in A and flux in erg cm−2 sec−1 deter-
mined as explained above, the GALEX FUV and NUV magnitudes with errors for the few
objects where these data are available, and the 2MASS J, H, and Ks magnitudes with errors.
Given the lack of approximately uniform coverage by GALEX of the objects in our sample,
– 8 –
we decided to only list the FUV and/or NUV magnitudes without using them for further
investigations.
3. Results
The basic question stated above is whether the wide HI profiles detected by the AL-
FALFA survey are produced by single, non-interacting galaxies or by two or more galaxies
that are interacting and are too close together to be resolved by the rather wide ALFALFA
beam. This has been shown to be the case for the galaxy with the widest HI profile reported
by Bothun et al. (1982).
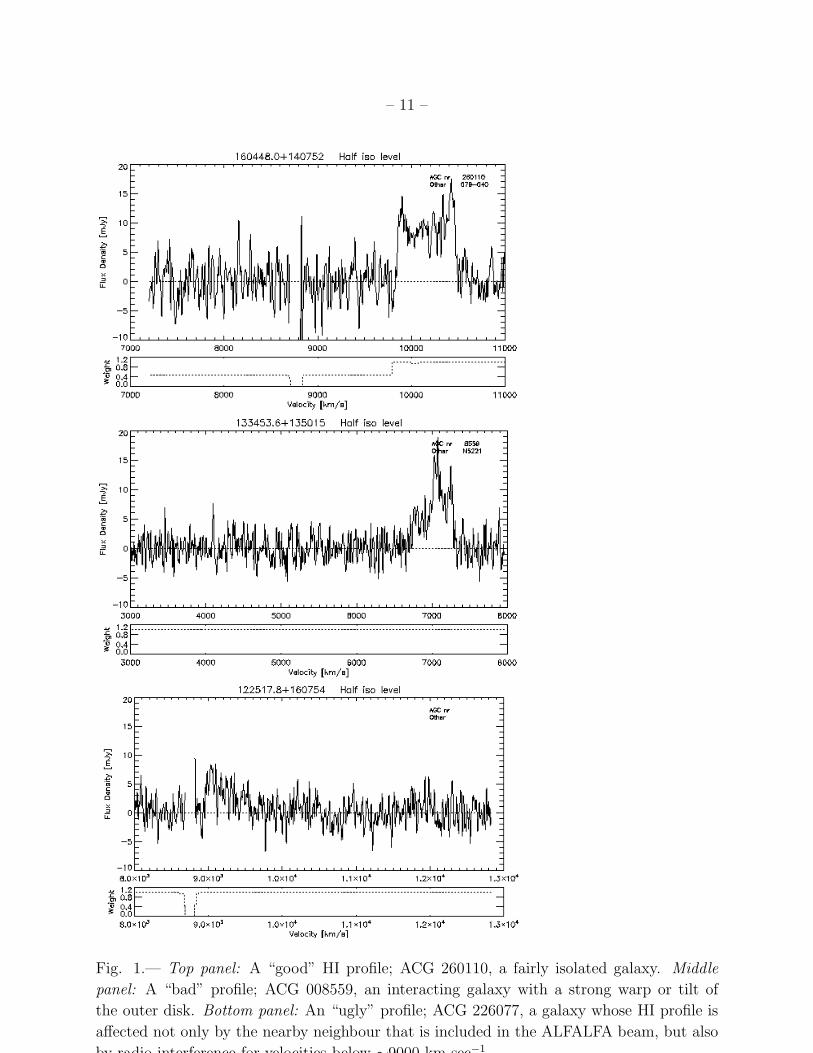
The relevant information is contained in the ALFALFA HI profile. We expect this profile
to have a clean two-horned shape for non-interacting disky galaxies. Courtois et al. (2009)
explained this in their description of some “good, bad, and ugly” profiles in the ADHIC:
PGC 71392, in their Figure 6, shows a clean profile with w(50)=989 km sec−1 and is a
high inclination S0/Sa (see also Giovanelli et al. 1986); PGC 10314 has w(50)=33 km sec−1
and appears to be face-on, and the two nearby galaxies PGC 68870 and PGC 68878 show
contamination of the HI profile of one galaxy by that of the other.
We checked the ALFALFA profiles of all galaxies in Table 1 and show in Figure 1
examples of the three kinds of profiles from among the objects in our sample.
3.1. High-mass candidate galaxies and their neighbourhoods
We found here that, in general, the 28 sample galaxies have large physical sizes and are
very luminous. The largest object is 82 kpc wide while the smallest is only ∼12 kpc. In many
cases the target galaxy had nearby objects that would have been included in the ALFALFA
beam. In cases where redshifts were available, some objects were shown to be physical
companions of the target galaxy. We also found that some companions showed emission-line
spectra and blue continua, indicating fairly recent star formation possibly triggered by a past
interaction. Other companions had spectra of early-type galaxies but showed also Balmer
absorption lines; such cases could possibly be similar to E+A galaxies (Dressler & Gunn
1983) indicating the presence of a relatively large population of A and B stars along with
an old population dominated by G, K, and M spectral types, representing possibly a star
formation episode about 1 Gyr ago, with the stellar bulk being much older.
Only 14 galaxies among the 28 selected from the ALFALFA data set appear to be fairly
isolated, since they do not seem to have SDSS companions closer than ∼10 arcmin that could

– 9 –
Table 2: SDSS total photometry for the sample galaxiesACG u g r i z
181756 17.42±0.02 15.42±0.00 14.48±0.00 14.05±0.00 13.66±0.00
192281 17.95±0.02 16.35±0.00 15.51±0.00 15.05±0.00 14.71±0.01
205190 17.09±0.02 14.93±0.00 13.82±0.00 13.52±0.00 12.92±0.00
200589 16.76±0.01 14.77±0.00 13.87±0.00 13.42±0.00 13.10±0.00
006042 16.35±0.01 14.40±0.00 13.54±0.00 13.15±0.00 12.81±0.00
201697 17.82±0.03 16.07±0.00 15.22±0.00 14.79±0.00 14.44±0.00
006066 16.98±0.02 15.02±0.00 14.16±0.00 13.75±0.00 13.38±0.00
222042 17.00±0.02 15.00±0.00 14.12±0.00 13.68±0.00 13.35±0.00
226077 17.10±0.02 15.59±0.00 14.85±0.00 14.47±0.00 14.17±0.00
226111 17.07±0.01 15.27±0.00 14.40±0.00 13.97±0.00 13.59±0.00
233609 17.71±0.02 16.71±0.00 16.41±0.00 16.22±0.01 15.92±0.01
008375 16.11±0.01 14.16±0.00 13.32±0.00 12.87±0.00 12.54±0.00
008379 16.68±0.02 14.91±0.00 14.08±0.00 13.66±0.00 13.33±0.00
008475 15.74±0.01 13.70±0.00 12.74±0.00 12.33±0.00 11.93±0.00
008488 16.20±0.01 14.15±0.00 13.25±0.00 12.80±0.00 12.49±0.00
008559 16.11±0.01 14.05±0.00 13.07±0.00 12.58±0.00 12.23±0.00
008766 15.66±0.01 13.78±0.00 12.90±0.00 12.41±0.00 12.01±0.00
008902 16.10±0.01 14.09±0.00 13.21±0.00 12.81±0.00 12.41±0.00
230914 16.57±0.01 14.71±0.00 13.89±0.00 13.48±0.00 13.18±0.00
008943 15.25±0.01 13.30±0.00 12.45±0.00 12.03±0.00 11.74±0.00
009031 16.83±0.01 14.98±0.00 14.07±0.00 13.58±0.00 13.13±0.00
248977 17.77±0.02 15.94±0.00 15.14±0.00 14.74±0.00 14.40±0.00
009624 16.22±0.01 14.32±0.00 13.45±0.00 12.99±0.00 12.64±0.00
009788 16.83±0.02 15.13±0.00 14.22±0.00 13.70±0.00 13.28±0.00
009794 19.14±0.03 17.13±0.00 16.18±0.00 15.62±0.00 14.96±0.00
009838 16.73±0.02 14.82±0.00 13.89±0.00 13.42±0.00 13.04±0.00
260110 17.13±0.01 15.10±0.00 14.18±0.00 13.72±0.00 13.33±0.00
010272 15.79±0.01 13.78±0.00 12.86±0.00 12.34±0.00 11.98±0.00Note: Magnitude errors smaller than 0.01 are reported here as 0.00.
– 10 –
Table 3: Hα, GALEX, and 2MASS total photometry for the galaxies in the sampleACG EW Hα FHα FUV NUV J H Ks
A ×10−13 AB mag AB mag mag mag mag
181756 - - - - 12.39±0.03 11.66±0.04 11.51±0.06
192281 - - - 17.79±0.02 13.57±0.05 12.72±0.06 12.31±0.06
205190 14±02 1.1±0.2 - - 11.70±0.02 10.99±0.03 10.66±0.04
200589 19±03 1.6±0.3 - - 11.84±0.02 11.15±0.03 10.85±0.04
006042 - - - - 11.29±0.03 10.60±0.03 10.46±0.06
201697 - - - - 11.29±0.03 11.00±0.03 10.46±0.06
006066 19±06 1.2±0.4 - - 11.82±0.04 11.18±0.05 10.96±0.08
222042 21±04 1.4±0.2 - - 12.04±0.04 11.50±0.05 11.09±0.07
226077 - - - - 13.44±0.08 12.67±0.10 12.23±0.09
226111 - - - - 12.43±0.03 11.63±0.04 11.38±0.04
233609 - - - - 14.12±0.11 13.59±0.17 13.10±0.16
008375 10±04 1.3±0.6 - 19.30±0.06 11.26±0.02 10.60±0.02 10.30±0.03
008379 25±08 1.7±0.5 - 17.56±0.05 12.30±0.05 11.53±0.06 11.23±0.08
008475 34±06 7.8±1.5 19.17±0.14 - 10.29±0.03 9.63±0.03 9.33±0.04
008488 16±18 2.3±2.7 20.42±0.30 - 11.12±0.02 10.56±0.03 10.24±0.04
008559 - - - - 10.88±0.02 10.26±0.03 10.05±0.03
008766 - - - - 10.75±0.02 10.00±0.02 9.67±0.03
008902 - - - - 11.09±0.02 10.23±0.02 9.95±0.03
230914 29±06 2.3±0.5 20.99±0.32 - 12.01±0.03 11.26±0.04 10.97±0.04
008943 - - - - 10.30±0.02 9.63±0.03 9.37±0.03
009031 32±08 2.3±0.6 22.34±0.58 - 11.96±0.03 11.13±0.04 10.79±0.04
248977 09±02 0.2±0.05 - 20.69±0.32 13.02±0.05 12.65±0.10 12.18±0.09
009624 26±04 3.2±0.5 - 18.28±0.06 11.46±0.03 10.73±0.03 10.56±0.05
009788 - - - - - - -
009794 - - - - 10.68±0.02 9.80±0.03 9.48±0.03
009838 - - - 19.21±0.12 11.82±0.03 11.23±0.04 10.90±0.05
260110 27±05 1.7±0.3 - - 12.11±0.02 11.42±0.03 11.10±0.03
010272 23±03 5.1±0.6 21.28±0.31 19.05±0.09 10.72±0.02 9.98±0.02 9.74±0.03Notes:
(1) Magnitude errors smaller than 0.01 are reported here as 0.00.
(2) 201697 and 009788 have no 2MASS data.
(3) 2MASS data for ACG 248977 are those listed for 2MASX J14411233+1453242.
(4) Only the candidate high-mass galaxies have Hα measurements. The fluxes are given in
units of erg cm−2 s−1.
– 11 –
Fig. 1.— Top panel: A “good” HI profile; ACG 260110, a fairly isolated galaxy. Middle
panel: A “bad” profile; ACG 008559, an interacting galaxy with a strong warp or tilt of
the outer disk. Bottom panel: An “ugly” profile; ACG 226077, a galaxy whose HI profile is
affected not only by the nearby neighbour that is included in the ALFALFA beam, but also
by radio interference for velocities below ∼9000 km sec−1.
– 12 –
be confused in the derivation of the HI line width; these are candidates for being high-mass
objects and are listed in Table 4. Here and in Appendix A we give additional details about
each object and about their neighbourhood properties. In particular, we add in column 10
of Table 4 the number of identified neighbours in a 3h−1 Mpc and 300 km sec−1 volume
around the galaxy; these could well be physical companions that may have interacted with
the galaxy in the not-too-distant past. The data for the neighbourhood search are primarily
from NED, supplemented by information from ALFALFA.
Table 4 lists the luminosity of the candidate galaxies in the r-band using M⊙(r)=+4.52
mag (from www.ucolick.org/∼cnaw/sun.html), the size of their major axes in kpc using the
angular size and the luminosity-distance from NED, the inclination i calculated from the
SDSS isophotal axes a and b and cos(i)=b/a, the maximal rotation velocity corrected for
inclination from vmax = w(50)2×sin(i)
, where w(50) is the HI profile width listed in Table 1, the
dynamical mass from Mdyn = v2maxR
G, where R is the maximal extent of the visible galaxy with
the power-of-ten of the value shown in parentheses, M∗ an indicative stellar mass derived from
the r-band luminosity by assuming all stars are K5V (this estimate will be refined below),
and MHI , the mass in atomic hydrogen from the ALFALFA flux integral and the luminosity
distance listed in NED, using MHI=2.36×10⁵ D2Mpc×FI, where DMpc is the distance to the
object in Mpc. Note that all estimates were made disregarding Milky Way and internal
extinction, and also not correcting MHI for the helium content to arrive at an estimate of the
diffuse baryon masses. Also, Bernardi et al. (2010) list the r-band absolute magnitude of
the Sun as +4.67; this would imply a 15% brighter luminosity for all the objects. Column 9
of the table shows F=Mdyn
Mgas+Mstars, the ratio of the dynamical mass to the total baryonic mass
(stars and gas, now correcting for the helium content with Mgas=1.3×MHI). Figures 3, 4, 5,
and 6 in Appendix B show the HI profiles of these CHMD. The table also lists the error in
the derived parameters; in some cases e.g. ACG 009624, the error in the derived dynamical
mass is similar to the value itself. In most cases, the rather large errors are dominated by
the error in the inclination.
We stress that the calculated value for Mdyn is a lower limit, since it assumes that the
HI distribution extends only as far as the 25 mag arcsec−1 isophote of the optical image; in
most disk galaxies this is not the case and the HI extends further out of the luminous disk
by a factor of a few. On the other hand, this calculation also assumes that the gas dynamics
are dominated by circular rotation. M∗ is also a lower limit, since we did not correct the
photometry for Milky Way and internal extinction.
– 13 –
4. Discussion
4.1. Simplified star formation history for CHMDs
The availability of the integrated SDSS colours allows a comparison of the 14 candidate
high-mass galaxies with the relations found by Wu et al (2007) between the SDSS colour
indices and the absolute magnitudes of galaxies. This indicates that, in most cases, the
integrated colours can be produced by evolved stellar populations (SPs). In disk galaxies
such colours correspond to high-luminosity systems, as their Figure 3 shows. The CHMDs
are thus definitely on the “red sequence” of galaxies.
The present star formation rate (SFR) can be derived from the Hα luminosity, following
e.g., Pflamm-Altenburg, Weidner, & Kroupa (2007). They give a formula to convert the Hα
luminosity to an SFR (in M⊙ yr−1) valid for L(Hα) ≥ 2.8× 1036 erg s−1:
SFR = L(Hα)/X (1)
where X=1.89×1041 erg s−1 for a canonical (broken) IMF, or 3.3×1041 erg s−1 for a Salpeter
IMF.
The resultant SFRs for the objects with Hα line emission, listed in the last column
of Table 4 for a canonical IMF, are rather modest with the median SFR=2 M⊙ yr−1 and
the highest value at 4.3 M⊙ yr−1 (for 009624), or ∼40% lower for a Salpeter IMF. We are,
therefore, not witnessing very strong SF events but rather mild ones, implying a possibility
to maintain the SF process at its present level, given the detected total HI content, over
many Gyr by having many and frequent such SF events. In fact, among all galaxies we find
the shortest HI consumption time (for 009624) to be ∼4 Gyr.
Given this result, we decided to test first a possibility that the CHMDs have been forming
stars at a constant rate since their formation. Our data set, in particular the availability
of SDSS and 2MASS colours, allows a rough estimation of the global star formation history
(SFH) in the candidate high-mass disk galaxies. This procedure aims to best-fit the measured
global colours of a CHMD with colours predicted by accepted population synthesis programs
and has been explained in Zitrin & Brosch (2008) and in Zitrin, Brosch & Bilenko (2009).
The baseline synthesized colours originate from the Bruzual & Charlot (2003) GALAXEV
library. To allow for slight variations in the simplest scenario, we modeled a composite of
two constant SFR models where we allowed each SF process to start at a different time and
to produce different fractions of the light detected at present from each galaxy. Note that a
single stellar population (SP) formed with a constant SFR would result automatically from
such a procedure as one of the two SPs, where the second population would not contribute
to the present-day light. The criterion by which the proper population mix was chosen was

– 14 –
the lowest reduced-χ2 of the fit. We can reject this constant SFR scenario, based on the
resultant χ2 values, when comparing with the χ2 values of the other tested scenarios.
Since we could not reproduce the colours with a constant SFR, even when involving two
SPs formed at different times with constant SFRs, we tested two other possible SF scenarios;
scenario A combining a continuous star formation process with a single δ-function SF burst
while allowing any metallicity value for each of the two SPs, and scenario B assuming two
“instantaneous” δ-function bursts occuring at different times, but fixing the metallicity value
to either solar or 2.5 times higher. The parameters that change are the start times of the two
processes and their relative proportions in the present-day light collected from the CHMD.
We found that scenario A produced exclusively “old” galaxies, where only ∼1/3 of
the objects showed a relatively young population that was nevertheless ∼3 Gyr old and
contributed up to 34% of the present light. Scenario B, on the other hand, allowed the
presence of a reasonable fraction of young to very young stars in most objects, less than 10
Myr old, producing ∼10-30% of the observed light and yielded ∼ 3× lower reduced χ2 values
than scenario A.
Based on the resultant minimal χ2 we can, therefore, reject the scenario of a SP formed
with a constant SFR combined with an SP formed by a recent SF burst, We thus adopt a
scenario where most of the stars in a CHMD were formed a long time ago, perhaps close to
a Hubble time ago, during a short period but a small fraction of their SP formed in a recent
SF event. This fraction of young stars now produces 10-30% of the light collected from the
galaxy.
It is tempting at this point to speculate what could be the possible very recent SF
trigger, a few tens of Myr at most, in a galaxy that seems to have been simply aging with
time. One possibility is that the SF process is fed by stellar ejecta and not by externally
accreted material. This recycling of material through stars can be done by gentle mass loss
via stellar winds and planetary nebulae formation, with ∼40-50% of the stellar mass returned
to the ISM and only a small fraction of ISM (∼10% of the total) coming from supernovae
(e.g., Pozzetti et al. 2007, Matig & Bournaud 2010).
Another option could be a minor merger with a gas-rich companion that rejuvenated
the old disk, since our optical survey and the shapes of the HI profiles do not seem to support
major mergers. We point out that signs of a past but recent interaction could possibly be
detected with 2D kinematic mapping, either optically or by mapping the HI with a synthesis
telescope. It is also possible that some of the other 14 galaxies not identified as CHMDs
could be transition objects, following the recent accretion of a gas-rich object, indicating
that with this sample we are seeing “real-time” evolution of massive disks from the red to
– 15 –
the blue sequence, or at least into the green valley.
These two options can be checked against the location of the star-forming regions. If
the SF trigger is accumulation of stellar ejecta, then the SF should be more concentrated
that the general galaxy light. If the trigger is external gas accumulation by IGM accretion
(e.g., Salim & Rich 2010) then the young stars are expected form outside (most of) the disk
and not show a particular central condensation.
We tested this by blinking the net-Hα images against the R-band images and indicate
the results in the last column of Table 4. Code C implies that the line emission is centrally
concentrated while code D indicates that it is diffuse. The results show that in most cases the
Hα emission is centrally concentrated, supporting the possibility that the source of material
for the formation of the young stellar population is recycling of internal ISM produced by
stellar ejecta. We cannot rule out influx of fresh material, at least for the objects with a
mixed classification (C/D). However, it is significant that in no case have we observed a
galaxy where the HII regions were exclusively relegated to the periphery of the object.
4.2. Stellar mass estimate
We estimated above the stellar mass by assuming that all stars were K5V; this is cer-
tainly not the case, since the stellar population models showed the best fits to be a composite
of a population almost a Hubble time ago with a small fraction formed at most a few tens
of Myr ago. The young population contributes 10-30% of the visible light. We can use this
result to refine the estimate of the stellar mass of each galaxy. We shall first explain the
method, then apply it to each CHMG.
The mass estimate uses a value for the M/L to convert from measured luminosity to
mass; above we used the value for a K5V star. However, the M/L values for different
populations e.g., by using the top panel from Figure 5 of Anders et al. (2009), indicate that
M/LV ≃ 2 × 10⁻² M⊙L−1⊙ for a stellar population 10 Myr old, while it is ∼5 M⊙L
−1⊙ for a
population ∼ 1010 yr old.
If the stellar composition of a galaxy of total luminosity L is produced by only two
stellar populations, say population 1 (young) and population 2 (old), which have (M/L)1and (M/L)2 respectively, and if each population produces a fraction X or (1-X) of the total
luminosity recorded for the galaxy, then the mass of first population is:
M1 = X × L× (M/L)1 (2)
– 16 –
whereas for the second population
M2 = (1−X)× L× (M/L)2 (3)
The mass ratio of the two stellar populations, for the CHMGs studied here, is
M1/M2 =X
1−X×
(M/L)1(M/L)2
≃0.2
0.8×
0.02
5(4)
The young population contributes ∼0.1% to the total mass, thus assuming that all the mass
is in the old stars is certainly not a bad approximation. Since the total stellar mass in the
CHMGs is of order 9×10¹⁰ M⊙, the mass of the newly formed stellar population should be
∼ 108 M⊙ and the time to form it, at a typical rate of 2 M⊙ yr−1 would be some 50 Myr.
This rough estimate justifies our conclusion that in these CHMGs we see a recent SF event
in an old galaxy.
4.3. CHMDs and the Tully-Fisher relation
Catinella et al. (2010) studied a sub-sample of an unbiased collection of galaxies with
stellar masses M∗ ≥1010 M⊙ at nearby redshifts (0.025≤z≤0.05). The objects were primarily
selected from the GALEX and SDSS data sets; those analyzed in the paper, some 200
galaxies, have HI measurements from Arecibo. The preliminary results of Catinella et al.
show a strong decrease in the MHI/M∗ ratio with stellar mass and with the stellar surface
density in M⊙ kpc−2, µ∗=M∗/(2πR250,z), with R50,z being the radius containing 50% of the
Petrosian flux in the z-band. Specifically, MHI/M∗ decreases by about one order of magnitude
for 10≤log M∗ ≤11.3 and by two orders of magnitude for 8.0≤log µ∗ ≤9.5 (see their Figure
10). The CHMD behaviour shows a similar trend of the HI-to-stellar mass ratio to decrease
with the stellar mass increase, except for the aberrant object 248977 discussed below.
We found that in all cases Mdyn was 2.5–7.5× larger than the sum of M∗ and MHI
corrected for the helium content albeit with rather large errors (see Table 4).This seems to
indicate that all galaxies studied here have significant but not excessive amounts of dark
matter. The stellar mass to gas mass ratios found here are similar to those of field Sa and
Sab galaxies (Read & Trentham 2005).
Another interesting result concerns the immediate neighbourhood of the high-mass can-
didate galaxies. One would expect massive galaxies to reside in high galaxy density regions
yet, as column 10 of Table 4 shows, these neighbourhoods are relatively sparse. In fact, some
of the more massive candidates (e.g., 006066 or 009624) have very few possible neighbours
within 3h−1 Mpc and 300 km sec−1.
– 17 –
The shape of HI profiles themselves is an accepted criterion to indicate possible signs
of interaction (e.g., Haynes et al. 1998). Although the ALFALFA profiles shown in Fig-
ures 3, 4, 5, and 6 of Appendix B are not as clean and “high-quality” as those shown by
Haynes et al., we can state with reasonable confidence that the profiles appear to be sym-
metric in the areal symmetry criterion. We thus identified a small population of high-mass
disk galaxies that are fairly isolated and do not appear to have had interactions in the last
few Gyr.
The sub-sample of candidate high-mass objects that do not appear to show obvious signs
of interaction offers a possibility to check the mass vs. rotational velocity at the high-vmax
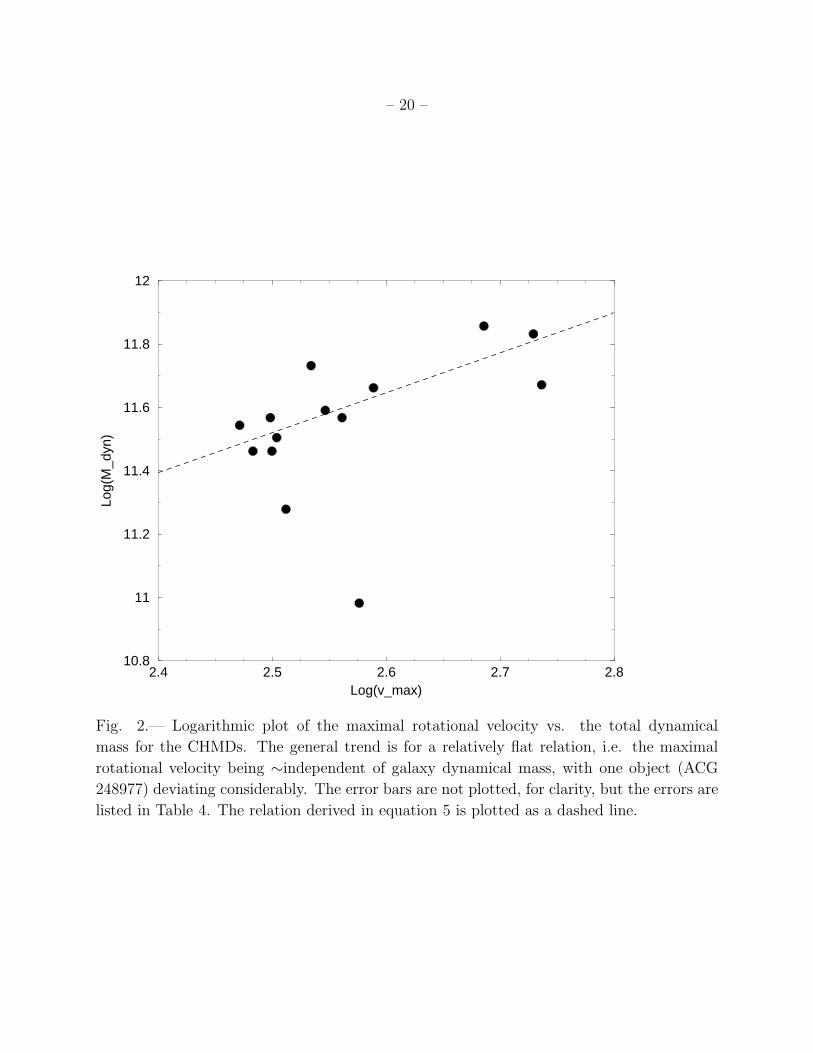
end. The mass vs. rotational velocity (a.k.a., the Tully-Fisher=TF) relation, was shown
e.g., in Figure 4 of Giovanelli et al. (1986) and is shown here for the CHMDs in Figure 2.
ACG 248977, a small galaxy extending less than 10 kpc as shown in the SDSS images,
yet with a very wide HI profile (Figure 5, 3rd row-right), is one of the objects that deviates
significantly from the Giovanelli et al. (1986) relation and from the relation suggested here
for the high vmax galaxies, rotating ∼ 3× faster than what its r-band luminosity would allow,
or by being fainter by one order of magnitude than its vmax would predict. It is possible
that we are not observing pure rotation in this object and that HI synthesis observations,
or a single-dish observation with significantly higher S/N will indicate chaotic motion of HI
clouds. Note also that the apparent size of HI14110.4+145339, as inspected by us, seems to
be about three times larger overall than the listed SDSS major axis (Appendix A). If this
is true, then its Mdyn would be larger by the same factor alleviating the discrepancy. On
the other hand, we also note that the HI profile is affected by RFI, as the plotted baseline
shows. In adopting the listed w(50) we have, therefore, accepted essentially a lower limit to
the profile width implying a lower limit to Mdyn.
Eliminating ACG 248977, and fitting a linear regression to the log(Mdyn) vs. log(vmax)
distribution, yields a correlated set (correlation coeffcient 0.73) with
log(Mdyn) = (8.4± 0.9) + (1.25± 0.35)× log(vmax) (5)
We plotted this relation with a dashed line in Figure 2.
Many of the 14 galaxies discussed here appear to fit well the upper-right part of the
Giovanelli et al. (1986) plot but the three objects with the highest vmax values lie below
the extrapolation of the Giovanelli et al. relation. This was also the case for UGC 12591
(see Giovanelli et al. 1986). We note in this context that the study of the high-mass end of
the TF relation (Noordermeer & Verheijen 2007) found a similar result, that galaxies with
vmax ≥200 km sec−1 were rotating faster than expected (or were less luminous). However,
Meyer et al. (2008) found slopes of ∼4 for lower mass galaxies (vmax ≤300 km sec−1)
– 18 –
measured by HIPASS, as also found by Trachternach et al. (2009) for 11 very low-mass
dwarf galaxies for which they have HI synthesis maps. Our result, a slope of approximately
unity, together with the results of Giovanelli et al. and of Noordermeer & Verheijen, indicate
a fundamental difference between the high-mass and lower mass galaxies in the definition of
the TF relation at the high-mass end of the disks.
We stress that in Figure 2 we have not plotted the error bars; these are relatively
large and their inclusion (in a log-log plot) would result in a figure that would not be
understandable. However, as mentioned above, the formal errors are listed in Table 4.
5. Summary
1. We described a complete sample of 28 galaxies with wide HI profiles selected from the
ALFALFA HI survey that could be candidate high-mass objects.
2. Using on-line data bases, we showed that some of the objects could have been confused
by nearby neighbour galaxies that could have been included in the radio telescope
beam producing the wide HI profiles.
3. We eliminated those, as well as objects showing obvious signs of interaction in SDSS
images, and reduced the sample to 14 objects lacking visible signs of interaction
and/or very close neighbours. We propose these as candidate high-mass disk galaxies
(CHMDs).
4. We checked the degree of isolation of the CHMDs and found that some may indeed be
located in low galaxy density neighbourhoods, contrary to expectations that high-mass
galaxies would be found in high galaxy density regions.
5. We investigated simple models for the star formation histories of the CHMDs and found
that, in most cases, these objects show signs of young and massive star formation. Tests
with different star formation scenarios indicated that most of the stars formed about
a Hubble time ago, with 10-30% of the light produced by very young stars formed at
most a few 10s of Myrs ago.
6. We found that the mass of the young stellar component is a small fraction of the total
stellar mass; the CHMGs are thus showing signs of rejuvenation of their old stellar
populations. With the current star formation rate, the young stellar population can
be produced in a few tens of Myr; the HI reservoir detected by ALFALFA suffices to
maintain the star formation for about a Hubble time.

– 19 –
Table 4: Candidate high-mass galaxiesACG Lr a i vmax Mdyn M∗ MHI F N SFR HII
L⊙ kpc km s−1 M⊙ M⊙ M⊙ 3h−1Mpc M⊙yr−1
205190 3.8(10) 25 46 485 7.2(11) 8.1(10) 1.2(10) 7.5 24 1.1 C
14 115 2.4 0.06 2.5 0.2
200589 4.5(10) 26 61 316 2.9(11) 9.6(10) 1.0(10) 2.7 14 2.0 C
10 29 0.4 0.06 0.4 0.4
006066 4.3(10) 41 77 342 5.4(11) 9.1(10) 4.4(10) 3.6 3 1.8 C
07 11 0.4 0.09 0.3 0.6
222042 4.1(10) 28 66 304 2.9(11) 8.7(10) 1.6(10) 2.7 18 2.1 C
09 22 0.3 0.10 0.3 0.3
008375 3.1(10) 25 73 364 3.7(11) 6.6(10) 5.9(09) 7.3 6 0.7 C
07 37 0.6 0.35 1.3 0.3
008379 4.4(10) 33 74 296 3.5(11) 9.4(10) 2.1(10) 2.9 7 2.7 C
07 46 0.7 0.08 0.6 0.8
008475 5.1(10) 28 57 352 3.9(11) 1.1(11) 3.7(10) 2.5 60 4.0 D
12 46 0.7 0.04 0.4 0.8
008488 3.7(10) 28 69 319 3.2(11) 7.9(10) 1.1(10) 4.0 48 1.4 C
09 25 0.4 0.03 0.6 1.6
230914 5.2(10) 33 67 315 3.7(11) 1.1(11) 2.7(10) 2.5 14 3.6 C
09 11 0.4 0.08 0.3 0.8
009031 4.4(10) 27 66 388 4.6(11) 9.4(10) 1.9(10) 3.9 8 3.6 C/D
09 30 0.6 0.11 0.6 0.9
248977 1.0(10) 6 48 377 9.6(10) 2.1(10) 9.0(09) 2.9 5 0.2 C
14 85 3.1 0.54 0.9 0.05
009624 7.0(10) 21 34 536 6.8(11) 1.5(11) 1.7(10) 4.0 5 4.3 C
20 270 4.9 0.07 2.9 0.7
260110 2.9(10) 14 34 545 4.7(11) 6.2(11) 2.9(10) 4.7 19 1.9 C/D
20 273 3.3 0.09 3.3 0.3
010272 2.5(10) 16 63 325 1.9(11) 5.3(10) 2.2(09) 3.4 14 1.5 C
10 43 0.4 0.13 0.7 0.2Notes:
(a) Powers-of-ten are given in parentheses.
(b) The last column, HII, gives the classification of the HII region distribution:
C=concentrated and D=diffuse.
(c) The second line for each entry gives the error in the parameter listed immediately above
it, in the same units and with the same power-of-ten as in the first line.
– 20 –
2.4 2.5 2.6 2.7 2.8Log(v_max)
10.8
11
11.2
11.4
11.6
11.8
12
Log(
M_d
yn)
Fig. 2.— Logarithmic plot of the maximal rotational velocity vs. the total dynamical
mass for the CHMDs. The general trend is for a relatively flat relation, i.e. the maximal
rotational velocity being ∼independent of galaxy dynamical mass, with one object (ACG
248977) deviating considerably. The error bars are not plotted, for clarity, but the errors are
listed in Table 4. The relation derived in equation 5 is plotted as a dashed line.
– 21 –
7. We calculated dynamical masses from the HI profile width, the optical inclination, and
the optical radius, and compared those with the HI and stellar masses, finding that
the luminous matter makes up only ∼30% of the dynamical mass.
8. We investigated the location of these CHMDs in the Tully-Fisher relation and found
that they deviate significantly from the relation defined by lower-mass galaxies.
Acknowledgments
The authors would like to acknowledge the work of the entire ALFALFA collaboration
team in observing, flagging, and extracting the catalog of galaxies used in this work. We are
grateful for the selection of galaxies from the ALFALFA data set provided by Martha Haynes
and Riccardo Giovanelli. We acknowledge some constructive remarks from an anonymous
referee.
Funding for the Sloan Digital Sky Survey (SDSS) has been provided by the Alfred P.
Sloan Foundation, the Participating Institutions, the National Aeronautics and Space Ad-
ministration, the National Science Foundation, the U.S. Department of Energy, the Japanese
Monbukagakusho, and the Max Planck Society. The SDSS Web site is http://www.sdss.org/.
The SDSS is managed by the Astrophysical Research Consortium (ARC) for the Partic-
ipating Institutions. The Participating Institutions are the University of Chicago, Fermilab,
the Institute for Advanced Study, the Japan Participation Group, the Johns Hopkins Univer-
sity, Los Alamos National Laboratory, the Max-Planck-Institute for Astronomy (MPIA), the
Max-Planck-Institute for Astrophysics (MPA), New Mexico State University, University of
Pittsburgh, Princeton University, the United States Naval Observatory, and the University
of Washington.
This publication makes use of data products from the Two Micron All Sky Survey,
which is a joint project of the University of Massachusetts and the Infrared Processing and
Analysis Center/California Institute of Technology, funded by the National Aeronautics and
Space Administration and the National Science Foundation.
This research has made use of the NASA/IPAC Extragalactic Database (NED) which
is operated by the Jet Propulsion Laboratory, California Institute of Technology, under
contract with the National Aeronautics and Space Administration.
– 22 –
REFERENCES
Balogh M. L., Baldry I. K., Nichol R., Miller C., Bower R., Glazebrook K., 2004, ApJ, 615,
L101
Bothun G. D., Mould J., Heckman T., Balick B., Schommer R. A., Kristian J., 1982, AJ,
87, 1621
Bruzual, G., Charlot, S., 2003, GALAXEV version 2003 at
http://www.cida.ve/bruzual/bc2003
Catinella B., et al., 2010, MNRAS, 403, 683
Courteau S., McDonald M., Widrow L. M., Holtzman J., 2007, ApJ, 655, L21
Courtois H. M., Tully R. B., Fisher J. R., Bonhomme N., Zavodny M., Barnes A., 2009, AJ,
138, 1938
Dressler, A., Gunn, J. 1983, ApJ, 270, 7
Giovanelli R., Haynes M. P., Rubin V. C., Ford W. K., Jr., 1986, ApJ, 301, L7
Giovanelli R., et al., 2005a, AJ, 130, 2598
Giovanelli R., et al., 2005b, AJ, 130, 2613
Giovanelli R., et al., 2007, AJ, 133, 2569
Gavazzi G., Scodeggio M., 1996, A&A, 312, L29
Guo Q., White S. D. M., 2008, MNRAS, 384, 2
Kent B. R., et al., 2008, AJ, 136, 713
Martin D. C., et al., 2007, ApJS, 173, 342
Martin A. M., Papastergis E., Giovanelli R., Haynes M. P., Springob C. M., Stierwalt S.,
2010, arXiv, arXiv:1008.5107
Martig, M.,Bournaud, F., 2010,ApJ,714, L275
Pflamm-Altenburg J., Weidner C., Kroupa P., 2007, ApJ, 671, 1550
Pizzella A., Corsini E. M., Dalla Bonta E., Sarzi M., Coccato L., Bertola F., 2005, ApJ, 631,
785
– 23 –
Pozzetti, L., et al. 2007, A&A, 474, 443
Read J. I., Trentham N., 2005, RSPTA, 363, 2693
Saintonge A., 2007, AJ, 133, 2087
Saintonge A., Giovanelli R., Haynes M. P., Hoffman G. L., Kent B. R., Martin A. M.,
Stierwalt S., Brosch N., 2008, AJ, 135, 588
Salim S., Rich R. M., 2010, ApJ, 714, L290
Skrutskie M. F., et al., 2006, AJ, 131, 1163
Springob C. M., Haynes M. P., Giovanelli R., Kent B. R., 2005, ApJS, 160, 149
Trachternach C., de Blok W. J. G., McGaugh S. S., van der Hulst J. M., Dettmar R.-J.,
2009, A&A, 505, 577
Tully R. B., Fisher J. R., 1977, A&A, 54, 661
Zitrin A., Brosch N., 2008, MNRAS, 390, 408
Zitrin A., Brosch N., Bilenko B., 2009, MNRAS, 399, 924
White R. A., Bliton M., Bhavsar S. P., Bornmann P., Burns J. O., Ledlow M. J., Loken C.,
1999, AJ, 118, 2014
Whitmore B. C., Schechter P. L., Kirshner R. P., 1979, ApJ, 234, 68
Wu H.-B., Liu C.-Z., Zhang B., Chang R.-X., 2007, ChA&A, 31, 236
6. Appendix A: Information on individual objects
This Appendix presents an independent estimate of each object’s morphology derived
from the SDSS images, and reports results of a search for possible neighbours using primarily
SDSS information. In the individual comments below we adopt SDSS isophotal radii a and
b as listed in SDSS DR7; these are defined at the 25 mag arcsec−1 isophote level. As second
choice, when SDSS isophotal data are not available, we adopt the RC3 blue major and minor
axes at the 25 mag arcsec−1 isophote level. We also adopt for each object the NED conversion
This preprint was prepared with the AAS LATEX macros v5.2.

– 24 –
from angular size to linear size, called here “the plate scale”. The object identifier is from
Table 1, and we repeat next to the name the HI redshift from column 4 of the table.
181756 (9323 km s−1): The SDSS r image has isophotal radii a=24′′.20 and b=10′′.48
with a major axis position angle PA=59. With the NED plate scale of 1′≃36 kpc and the
major axis size is 29 kpc. The SDSS image shows a featureless disk with a central bulge.
A number of nearby bluish diffuse features may, or may not, be connected with the galaxy.
The morphological impression is of an S0 galaxy, since no arms or dark lanes are seen. The
SDSS spectrum shows nebular emission lines with strong Hα+[NII] and [OII] on top of a
typical absorption spectrum.
This object has a nearby neighbour, SDSS J082656.50+073053.0 about one arcmin and
300 km sec−1 away, considered here to be a physical companion. This is the brightest and
bluest of the nearby diffuse blobs. Its SDSS spectrum is that of a very late-type galaxy, with
a strong blueward sloping continuum, strong emission lines of Hα, [NII], [OIII], [SII], and
[OII]. Hβ shows a narrow emission line on top of a wide absorption feature.
192281 (10470 km s−1): The SDSS image shows a disk with possible isophote twist-
ing outside the brighter central part. With a cosmology-corrected plate scale of 42.34 kpc
arcmin−1 and isophotal radii of a=22′′.86 and b=6′′.95, the major axis is 32 kpc at position
angle 6.5. With g=16.2 this is a fairly bright galaxy, but not the brightest in the neigh-
bourhood. The SDSS spectrum exhibits strong emission lines, the strongest being Hα+[NII]
and [OII], and weak absorptions. Hβ shows narrow emission in a wider absorption profile.
This object has a close neighbour, 2MASX J09590327+1302211= SDSS J095903.29+130221.0,
which at 10689 km s−1 is 1′.2 and 220 km s−1 away. This is an r=15.2 elliptical galaxy, with
weak Hα and [OII] emission and Hβ and higher Balmer lines in absorption. There are other
similar galaxies in the neighbourhood, within a few galactic radii, but they lack SDSS red-
shifts thus it is not possible at this time to evaluate whether this is a compact galaxy group
or a projection effect.
205190 (9683 km s−1): This object is known also as MCG +03-28-009=2MASXi
J1048021+142428 and is a NVSS radio source. The major axis of 2a=77.4 arcsec (using
the 2MASS Ks measure) and the plate scale of 38.50 kpc arcmin−1 imply a 50 kpc wide
galaxy. The SDSS image shows an elliptical or lenticular galaxy with a strong dark lane that
has a pronounced warp at its outer half-radius. The extensions of the dark lane appear as
luminous ansae on both sides of the galaxy. The galaxy appears to have undertaken a major
merger, or to have accreted recently a dust-and-gas rich galaxy, with the accreted material
not yet relaxed to the equatorial plane of the galaxy. Note that the bluish object visible on
the SDSS image near the northern end of the dark lane is a foreground star. The object does
– 25 –
not have an SDSS spectrum. The few diffuse objects within 10 arcmin are all background
galaxies.
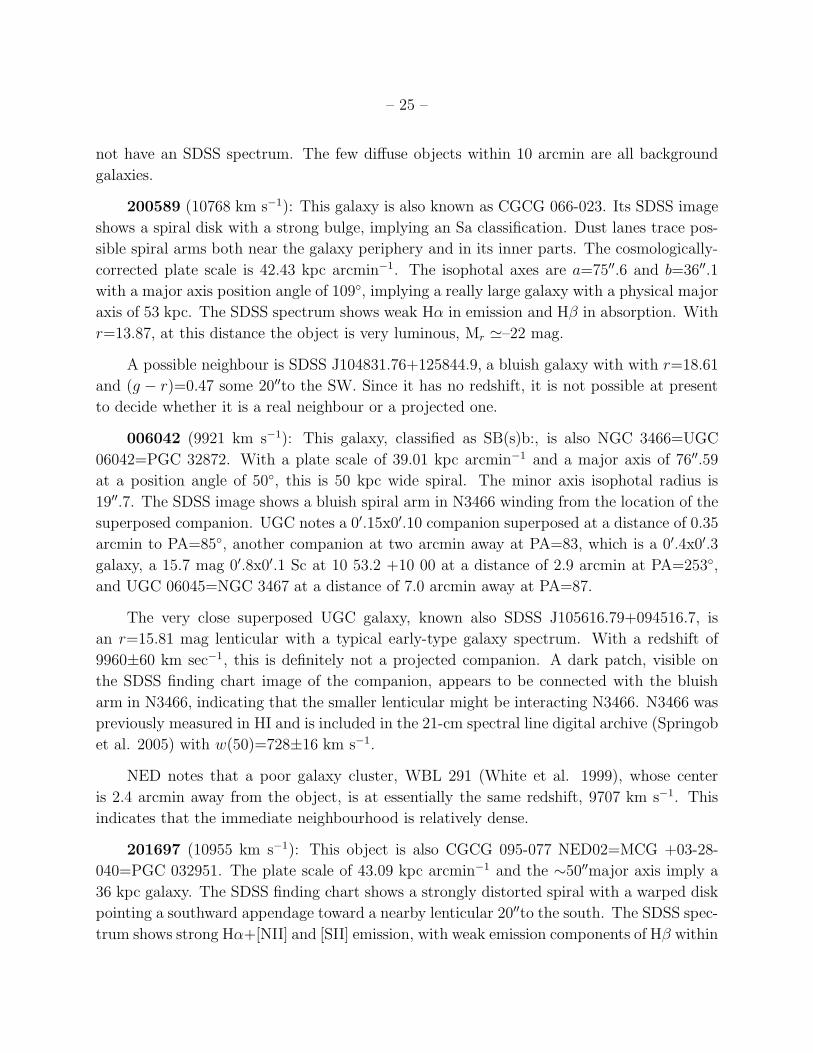
200589 (10768 km s−1): This galaxy is also known as CGCG 066-023. Its SDSS image
shows a spiral disk with a strong bulge, implying an Sa classification. Dust lanes trace pos-
sible spiral arms both near the galaxy periphery and in its inner parts. The cosmologically-
corrected plate scale is 42.43 kpc arcmin−1. The isophotal axes are a=75′′.6 and b=36′′.1
with a major axis position angle of 109, implying a really large galaxy with a physical major
axis of 53 kpc. The SDSS spectrum shows weak Hα in emission and Hβ in absorption. With
r=13.87, at this distance the object is very luminous, Mr ≃–22 mag.
A possible neighbour is SDSS J104831.76+125844.9, a bluish galaxy with with r=18.61
and (g − r)=0.47 some 20′′to the SW. Since it has no redshift, it is not possible at present
to decide whether it is a real neighbour or a projected one.
006042 (9921 km s−1): This galaxy, classified as SB(s)b:, is also NGC 3466=UGC
06042=PGC 32872. With a plate scale of 39.01 kpc arcmin−1 and a major axis of 76′′.59
at a position angle of 50, this is 50 kpc wide spiral. The minor axis isophotal radius is
19′′.7. The SDSS image shows a bluish spiral arm in N3466 winding from the location of the
superposed companion. UGC notes a 0′.15x0′.10 companion superposed at a distance of 0.35
arcmin to PA=85, another companion at two arcmin away at PA=83, which is a 0′.4x0′.3
galaxy, a 15.7 mag 0′.8x0′.1 Sc at 10 53.2 +10 00 at a distance of 2.9 arcmin at PA=253,
and UGC 06045=NGC 3467 at a distance of 7.0 arcmin away at PA=87.
The very close superposed UGC galaxy, known also SDSS J105616.79+094516.7, is
an r=15.81 mag lenticular with a typical early-type galaxy spectrum. With a redshift of
9960±60 km sec−1, this is definitely not a projected companion. A dark patch, visible on
the SDSS finding chart image of the companion, appears to be connected with the bluish
arm in N3466, indicating that the smaller lenticular might be interacting N3466. N3466 was
previously measured in HI and is included in the 21-cm spectral line digital archive (Springob
et al. 2005) with w(50)=728±16 km s−1.
NED notes that a poor galaxy cluster, WBL 291 (White et al. 1999), whose center
is 2.4 arcmin away from the object, is at essentially the same redshift, 9707 km s−1. This
indicates that the immediate neighbourhood is relatively dense.
201697 (10955 km s−1): This object is also CGCG 095-077 NED02=MCG +03-28-
040=PGC 032951. The plate scale of 43.09 kpc arcmin−1 and the ∼50′′major axis imply a
36 kpc galaxy. The SDSS finding chart shows a strongly distorted spiral with a warped disk
pointing a southward appendage toward a nearby lenticular 20′′to the south. The SDSS spec-
trum shows strong Hα+[NII] and [SII] emission, with weak emission components of Hβ within
– 26 –
an absorption profile, and [OII]. The lenticular neighbour is SDSS J105743.81+151740.2, with
no SDSS redshift but with a size similar to that of the target galaxy, hinting that it might
be a physical and interacting neighbour. Other galaxies in the neighbourhood, also lacking
SDSS spectra, appear to form a chain of galaxies. SDSS J105741.28+152003.2, a tiny 10 arc-
sec bluish spiral at 11040±30 km s−1, is a physical companion and shows a blueward-sloping
spectrum with strong Hα, Hβ, [NII], [SII], [OIII] and [OII] emission lines. The Balmer lines
from Hβ and higher are narrow and visible in wide absorption troughs.
006066 (11807 km s−1): This galaxy, classified in NED as SAab: sp, is also UGC 06066.
The plate scale at its redshift is 46.25 kpc arcmin−1 and the isophotal major axis a=105′′.15
implies a physical size of 81 kpc at PA=41. The SDSS spectrum of the central region shows
only absorption features, including fairly pronounced Balmer lines. The SDSS finding chart
shows a disk galaxy with tightly wound spiral arms and with no obvious signs of interaction.
No immediate neighbours were identified in the SDSS data.
222042 (11569 km s−1): This is CGCG 041-030. The SDSS finding chart shows a disk
galaxy with an inner dark ring encircled by a luminous outer ring. The inner regions show
that this might be a barred galaxy with the arms emerging from the ends of the bar, with a
possible SBb morphological classification. A bright nucleus is visible at the center of the bar.
The SDSS spectrum shows a narrow Hα in emission and higher Balmer lines in absorption.
The plate scale of 45.35 kpc arcmin−1 and the major axis of 74′′.42 imply a 56 kpc size. The
object shows no obvious signs of interaction.
226077 (9250 km s−1): The plate scale at the redshift of this object is 36.53 kpc
arcmin−1; with a major axis of 36′′.99 at a position angle of 46 this is not a very big galaxy,
only 23 kpc wide. The SDSS image shows a spiral galaxy with an inner ring, possibly
warranting an Sa(r) classification. The spectrum shows strong Hα+[NII] and [SII] emissions
on a typical absorption spectrum, with Hβ and higher Balmer lines also in absorption. This
galaxy has a nearby neighbour, SDSS J122512.55+160536.0 about 1.5 arcmin to the south at
9180±60 km s−1. The companion also shows Hα+[NII] and [SII] emissions, although these
are weaker than in the primary target.
226111 (10678 km s−1): This galaxy, also known as CGCG 100-019 and MCG +03-33-
020, The plate scale of 41.98 kpc arcmin−1 and the major axis of 59′′.83 at PA=69 imply a
size of 44.2 kpc. The SDSS image shows a highly inclined disk with dark truncations of the
inner disk with a possible morphological classification of Sc. A nearby physical neighbour,
SDSS J125932.41+150413.5=2MASX J12593238+1504138 at 10920±60 km s−1 is visible 1.2
arcmin to the north-west. The main object shows weak Hα and [SII] emission on a spectrum
with strong absorption lines. The SDSS companion has relatively strong Hα+[NII], [SII] and
[OII] emissions on a spectrum with shallow absorption lines. Another physical companion is
– 27 –
SDSS J125928.98+145958.1, a blue 10 arcsec disk at 10800±60 km s−1 and 3′.3 away, with
a blueward-sloping continuum and Hα+[NII], [OII] and [SII] emission lines.
233609 (8143 km s−1): The SDSS finding chart shows a featureless bluish disk, possibly
face-on and devoid of spiral arms, with a superposed star. The plate scale is 32.57 kpc
arcmin−1. It, and the isophotal r major axis of 28′′.48 at PA=150, imply a smallish 15 kpc
galaxy. No SDSS spectrum exists in the archives, but the object has as real neighbour SDSS
J130717.44+133847.8 1.5 arcmin to the south-east as an amorphous disk at 8070±60 km
s−1. SDSS J130712.74+133848.2 about 50′′to the south is a background object at 30030±60
km s−1 with a blueward-sloping continuum and Hα+[NII], [SII] and [OII] emissions, and
another background object, SDSS J130709.55+133804.6, is about 1.5 arcmin to the south
south-west and at 43110±60 km s−1.
008375 (7007 km s−1): This galaxy is IC 0881=UGC 08375=CGCG 101-025, classified
Sa in NED, with an isophotal major axis of 2a=108′′.33 at PA=11. With the plate scale
of 28.17 kpc arcmin−1, this galaxy has a semi-major axis of 25 kpc. The SDSS finding
chart shows an edge-on disk with a strong bulge, warranting the Sa classification. Dust
lanes are visible in the disk. The SDSS spectrum shows strong absorption lines, including
Balmer absorptions. A physical neighbour is SDSS J132006.93+155353.2=IC 0882, about
four arcmin to the north-east at 6930±60 km s−1, with an absorption SDSS spectrum. This
is a face-on disk with a bright bulge, perhaps classifiable as S0. Other galaxies within a few
arcmin are all in the background.
008379 (11967 km s−1): This object is also UGC 08379=CGCG 044-071, classified Sbc
in NED. The plate scale is 46.49 kpc arcmin−1 and the major axis being 84′′.09 at PA=79
implies that the galaxy has a 33 kpc radius. The SDSS spectrum shows weak Hα in emission
along with [SII] and higher Balmer lines in absorption. The SDSS finding chart shows a
two-arm spiral that appears to be fairly isolated.
008475 (6835 km s−1): This object is NGC 5162=NGC 5174=UGC 08475=CGCG
072-087=MCG +02-34-018, an Scd:, according to NED. The double NGC assignment is
mentioned in UGC as ‘Listed in CGCG as “double nebula”, which is incorrect. Star super-
imposed south center.’ The SDSS isophotal major axis is 123′′.16 at PA=165; at a plate
scale of 27.63 kpc arcmin−1 this implies a 76 kpc wide galaxy. The SDSS spectrum shows
weak Hα+[NII], [SII] and [OII] emission lines over a strong, absorption-feature continuum.
A physical companion is some eight arcmin to the south-west: this is SDSS J132902.43+105455.7,
an r=17.71 mag bluish disk or flat irregular with a blueward-sloping continuum and strong
Hα, Hβ, [NII], [SII], [OIII] and [OII] emission lines. A more distant physical neighbour is
SDSS J132956.72+110419.5, about seven arcmin to the north-east at 6750±30 km s−1; the
– 28 –
SDSS spectrum shows Hα, [NII] and [SII] emissions on a blueward sloping continuum. A
foreground object, some eight arcmin to the north-west and at 4290±30 km s−1, is SDSS
J132852.20+110549.2, a bluish disk with blue continuum and Hα, Hβ, [NII], [SII], and [OIII]
emission lines. Another bluish disk, SDSS J132848.66+110156.6, is eight arcmin to the west
and at 6060±30 km s−1. All these possible real neighbours appear to be forming stars in-
tensively and in the same region of space; yet the neighbours are between one tenth and two
tenths the size of N5162 and would not be considered “significant neighbours”, according to
the Karachentseva (1973) isolation criteria. For this reason we include it in our selection of
possible high-mass galaxies.
008488 (7363 km s−1): This object is NGC 5185=UGC 08488=CGCG 072-104=MCG
+02-34-025, an Sb galaxy according to NED, with a major axis of 111′′.70 (from RC3) at
PA=58; with the plate scale of 29.62 kpc arcmin −1, this implies a galaxy with a semi-
major axis of 28 kpc. The SDSS finding chart shows a tilted spiral, possibly barred, where
the north-east side is more open than the south-west side.
SDSS J133001.26+131839.4 is a physical companion; this is a blue disky ∼10 arcsec wide
object, r=17.88 mag galaxy some five arcmin south and 7350±30 km s−1 with a blueward-
sloping continuum, Hα, [NII], and [SII] emission lines. A more distant companion, some 10
arcmin to the south south-east, is SDSS J133025.61+131148.2 at 7380±60 km s−1 with the
appearance of a nucleated dE but whose spectrum shows weak Hα, strong [NII], and even
stronger [OIII] emission lines. Another emission-line object is SDSS J133011.83+133623.2,
some 10 arcmin to the north north-east at 7560±60 km s−1, showing Hα, [NII] and [SII]
emission lines on a blueward-sloping continuum. The appearance of this ∼10 arcsec blue
disk is of a nucleated dE object. 008488 is another case of a large galaxy with very small,
star-forming galaxies in its immediate surroundings.
008559 (7025 km s−1): This galaxy is NGC 5221=UGC 08559=ARP 288=VV 315b=VIII
Zw 325=CGCG 073-040=MCG+02-35-006 classified as Sb: in NED. The SDSS finding chart
shows a disky galaxy with a strong bulge and a circum-nuclear dark lane. The outer parts
of the object are strongly warped with bright bluish features to the west and south. To
the north-east the warp appears softer and less bright and blue than the other parts of the
warped disk. A reddish diffuse concentration is visible in the outermost northward part of
the warp. The plate scale is 28.12 kpc arcmin −1 and, together with the isophotal major axis
of 143′′.90 (from RC3), implies a 67 kpc object.
Possible neighbours include SDSS J133503.61+135519.7 a nucleated dE five arcmin
to the north north-east at 7350±60 km s−1 with the spectrum of an early-type galaxy,
the larger SDSS J133455.94+134431.7=NGC 5222, a seemingly elliptical with a superposed
distorted spiral, four arcmin south at 6960±60 km s−1, with Hα, [NII], strong [SII], and
– 29 –
[OII] emission and and with whom the primary galaxy is assumed to have interacted, and
SDSS J133430.04+134814.8, another possible nucleated dE some five arcmin to the west
south-west at 7290 km s−1. SDSS J133448.16+134439.4, a diffuse bluish disk, is two arcmin
to the west of N5222; it is at 6630±30 km s−1 and shows an early-type galaxy spectrum,
while SDSS J133443.53+134507.3, some five arcmin to the south-west and at 7590±60 km
s−1, shows Balmer absorptions. The region seems to have more than its share of objects at
redshifts similar to that of the primary target, indicating that some of the small galaxies
might be fragments created by the galaxy interaction.
008766 (6996 km s−1): This galaxy is IC 0944=UGC 08766=CGCG 073-085=MCG+02-
35-019, classified in NED as Sa, with an isophotal r-band major axis of 138′′.55 at PA=106.
Since the plate scale is 28.13 kpc arcmin−1, this implies a 65 kpc galaxy. The SDSS spec-
trum shows Hα in emission and higher Balmer lines in absorption on a continuum with
shallow absorption lines. The SDSS finding chart shows the nearby physical companion,
SDSS J135132.95+140639.0, which is an SBb (or SAB(s)b:, as listed in the UGC note)
galaxy at 7380±30 km s−1 about one arcmin away,with Hα, [NII] and [SII] in emission, Hβ
emission with narrow emission in a wide absorption trough and the higher Balmer lines in
absorption, on a blueward-sloping continuum. Smaller objects in the same neighbourhood
are SDSS J135117.73+140630.8 3.5 arcmin to the west north-west and at 6180±30 km s−1
being more than 500 km s−1 away, with a blueward-sloping continuum and strong Hα, Hβ,
[NII], [OIII] and [SII], and SDSS J135211.55+135959.6, a spiral at 7350±30 km s−1 some
eight arcmin to the south-west. Another spiral, SDSS J135219.28+141618.8 about 12 arcmin
to the north-east and at 7260±60 km s−1, shows an absorption spectrum including Balmer
lines.
008902 (7559 km s−1): This object, classified in NED as Sb:, has a 70′′.50 major axis
(from RC3 at 25 mag arcsec−1). With a plate scale of 30.60 kpc arcmin−1, this makes it a 36
kpc object. The SDSS finding chart shows a spiral galaxy very close to a bright star, and a
number of galaxies of similar size nearby. The galaxy itself shows Hα and [SII] in emission on
an absorption spectrum, whereas SDSS J135906.56+153434.2, a diffuse irregular neighbour
one arcmin to the north-east at 7260±30 km s−1, shows a blueward-sloping continuum with
strong Balmer, [NII], [SII], and [OIII] emission lines. Another physical companion, SDSS
J135909.06+153336.9, an edge-on Sb with a prominent equatorial dark lane 1.5 arcmin east
and at 7440±30 km s−1, shows Hα and [SII] in emission and other Balmer lines in absorption.
A more distant object, SDSS J135855.46+153808.7, a bluish flocculent spiral at 7650±30
km s−1, shows Hα, [OII] and [SII] in emission and other Balmer lines in absorption. Hβ
shows a narrow emission component within the absorption profile, all on a fairly flat (in Fλ)
continuum.
– 30 –
230914 (11848 km s−1): This galaxy is also CGCG 074-030 and has an 85′′.06 major
axis at PA=115. With a plate scale of 45.96 kpc arcmin−1, this is a 65 kpc galaxy that can be
classified as Sb. SDSS shows an absorption spectrum. Two galaxies are within three arcmin;
one is SDSS J135955.08+120319.2, a 20 arcsec face-on spiral at 11670±30 km s−1 with
Balmer, [NII], [SII], [OII] and [OIII] emission lines on a blueward-sloping continuum. Others
are SDSS J140031.27+120451.8, a face-on Sc at 11610±30 km s−1 also showing Balmer,
[NII], [SII], [OII] and [OIII] emission lines, and SDSS J140025.49+120848.6, a nucleated dE
some four arcmin to the north-east at 11820±60 km s−1 with Hα and [NII] emission on a
general absorption spectrum.
008943 (4933 km s−1): This object is NGC 5417=UGC 08943=CGCG 046-039, an Sa
galaxy with 105′′.81 major axis in PA=117. With a plate scale of 20.09 kpc arcmin−1, this
is 35 kpc object. The SDSS spectrum shows absorptions only. A physical companion, SDSS
J140215.25+080022.9, a featureless 10′′blob two arcmin south of N5417 and at 5190±60 km
s−1, shows Balmer lines in absorption on a blueward-sloping continuum.
009031 (11864 km s−1): This galaxy is UGC 09031=CGCG 103-076=MCG +03-36-
053, classified as a possible spiral (S?) in NED. With an isophotal r major axis of 69′′.80 at
PA=40, and a plate scale of 46.03 kpc arcmin−1, this is a 27 kpc (semi-major axis) disk.
The SDSS finding chart shows an almost edge-on disk with a prominent equatorial dark
lane. The general appearance is of an Sb galaxy. The SDSS spectrum shows an absorption
line spectrum and emission at Hα and [NII], and absorption at higher Balmer lines. A small
galaxy about 20 arcsec to the north-west shows a warped disk; with no redshift it is not
possible to establish whether this is a physical companion or is projected. There are other
small galaxies at slightly larger distances, most lacking redshifts and those that have one,
are in the background.
248977 (9153 km s−1): The SDSS finding chart shows a ∼30 arcsec diffuse image with
a very bright center reminiscent of a nucleated dE (ndE), significantly larger than the size
given in SDSS. This object is SDSS J144112.34+145324.4 with an optical redshift of 9150±60
km s−1 and with an absorption spectrum that includes also Hα and β in absorption. At this
redshift, the 10′′.55 size from SDSS translates into some 6 kpc; this is a relatively small galaxy
that would be ∼20 kpc if the size shown in the SDSS image would be adopted. Two diffuse
∼5 arcsec blobs are nearby: SDSS J144110.38+145331.5 with r=15.6 and (g− r)=0.42 that
might be a dark-lane galaxy, and SDSS J144110.79+145333.9 with r=16.81 and (g−r)=0.30.
These do not have optical redshifts and there is a possibility they are associated with the
main galaxy and may have been confused in the same ALFALFA beam.
009624 (11068 km s−1): This object is NGC 5790=UGC 09624=CGCG 048-076=MCG
+01-38-022. Classified in NED as (R)SA0/a and in UGC as S0/Sa, it shows an inner
– 31 –
yellowish spiral with an outer bluish ring with dust lanes and spiral structure on the SDSS
finding chart. The SDSS spectrum shows Hα, [NII], [SII], [OI], [OIII] and [OII] in emission,
while Hβ and higher Balmer lines are in absorption. There are a number of nearby galaxies
without redshifts, but a physical companion is SDSS J145730.93+082326.3, a 10′′nucleated
dE or dwarf S0 about six arcmin north at 11130±60 km s−1. The main galaxy has a major
axis of 57′′.30 (RC3, isophotal at 25 mag arcsec−1) and, with a plate scale of 43.57 kpc
arcmin−1, is 42 kpc wide (21 kpc semi-major axis).
009788 (10176 km s−1): The galaxy is UGC 09788=CGCG 049-079, classified Im? in
NED. The plate scale of 39.68 kpc arcmin−1 and major axis of 54′′.70 (RC3) imply a 36
kpc object. The SDSS finding chart shows a disky galaxy with a number of dust lanes
meandering along the equatorial plane. A faint and fuzzy extension is visible to the north,
extending some 15 arcsec from the nucleus, and a bluish extension is visible at the north-
west end of the equatorial dark lane. This extension points to a physical companion, SDSS
J151534.35+081839.2, a flattened disk one arcmin to the north-west and at 10410±30 km
s−1, that shows a flat spectrum (in Fλ) with emission lines at Hα, [NII], [SII], [OIII] (weak),
Hβ in a wide absorption trough, and [OII].
Another physical companion is SDSS J151543.03+081710.0, a nucleated dE about 70′′to
the south-east and on the extension of the major axis of the primary galaxy at 10230±60 km
s−1, showing deep Balmer absorptions. SDSS J151543.06+082027.3 is further away about two
minutes to the north-east. This is a ndE with a 15 arcsec size and a redshift of 10350±60 km
s−1. It has a similar spectrum, indicating a significant population of early-type stars. Even
more distant physical companions can be found: SDSS J151522.00+082127.3 five arcmin to
the north-west at 10260±60 km s−1, with a similar morphology and spectrum as the two
nearer companions, and SDSS J151540.51+081303.6, an edge-on 30 arcsec Sc that is five
arcmin to the south at 9900 ±60 km s−1, has a blueward-sloping continuum, and shows Hα,
Hβ, [NII], [SII], [OIII] and [OII] emission lines.
009794 (6406 km s−1): This extremely disturbed object is UGC 09794=VIII Zw
461=CGCG 077–54=MCG +02-39-009. NED classifies it as SBdm: whereas UGC notes
it as SBc-IRR. The r band isophotal major axis quoted in NED, 7′′.30, is an obvious mis-
take; the corresponding value for the B isophotal major axis in RC3 is 181′′.20 at PA=42,
which we adopt. With a plate scale of 25.75 kpc arcmin−1, this is a 78 kpc galaxy. The
SDSS finding chart shows a possible Sc with a strong warp or arm kink at the north-east end
and a less pronounced warp at the opposite end. Dust lanes along the equatorial plane and
parallel to it are visible. The SDSS fiber was not set on the nucleus but a small distance to
the south-west; the resultant spectrum shows a redward-sloping continuum with Hα, [NII],
[SII] emission lines, and with Hβ in narrow emission superposed on a wide absorption. An
– 32 –
immediate physical neighbour is SDSS J151603.23+103023.4, a 15′′nucleated dE about two
arcmin to the west at 6630±60 km s−1 and with an absorption spectrum. Other nearby
galaxies are in the background.
009838 (10267 km s−1): This galaxy is known also as UGC 09838=CGCG 049-158 and
is classified Sab in NED and in UGC. The RC3 isophotal major axis is 77′′.30; this translates
into 51 kpc at a plate scale of 39.75 kpc arcmin−1. The galaxy looks like an Sb with an inner
ring about half-way from the center to the edge. SDSS J152502.75+071056.2 is a physical
neighbour two arcmin to north-west at 10380±60 km s−1, with Hα, [NII], [SII] and [OII]
emission lines on a slightly blueward-sloping continuum, and SDSS J152506.35+070552.5, a
30” blue irregular galaxy three arcmin to the south-west at 10410±30 km s−1 with Hα,
Hβ, [NII], [SII], [OIII] and [OII] emission lines. Other physical companions are SDSS
J152526.14+070504.9, a 30′′spiral at 10440±30 km s−1, with Hα, [NII] and [SII] emission
lines and with a number of condensations in the arms, and SDSS J152449.46+070845.2,
a blue face-on 25′′two-arm spiral with Hα, [NII] and [OII] emission on a blueward-sloping
continuum five arcmin to the west.
260110 (10160 km s−1): This galaxy is also CGCG 079-040, whose SDSS finding chart
shows an elliptical featureless body. With a major axis of 43′′.13 at PA=56 and a plate scale
of 39.25 kpc arcmin−1 this is a 28 kpc galaxy. The SDSS spectrum shows weak Hα, [NII], [SII]
and [OII] emission on a general absorption spectrum. A physical but distant companion is
SDSS J160514.09+141320.1, an edge-on 30′′disk seven arcmin to the north-east at 10410±30
km s−1. Other nearby (projected) companions are SDSS J160457.91+140815.2, a galaxy
classifiable as Sb(r) with two spiral arms emerging from the inner ring, is two arcmin to
the east at 11160±30 km s−1 and shows Hα, Hβ (in an absorption trough), [NII], [SII] and
[OII] emission, SDSS J160512.92+140910.6, an edge-on blue 25′′disk four arcmin to the east
north-east at 11430±30 km s−1 with Hα, Hβ (in an absorption trough), [NII], [SII], [OIII]
and [OII] emission, and SDSS J160504.78+141005.9, a blue nucleated disk four arcmin to
the north-east at 10770±30 km s−1 with Hα, Hβ, [NII], [SII], [OIII] and [OII] emission on
a blueward-sloping continuum; although more than 500 km s−1 this might be a physical
companion.
010272 (5124 km s−1): This galaxy is NGC 6081=IC 1202=UGC 10272=CGCG 079-
078=MCG +02-41-019, classified S0 in NED, with an isophotal r-band major axis of 96′′.37
at PA=129, which at a plate scale of 20.54 kpc arcmin−1 implies a 16 kpc semi-major
axis galaxy. The object shows an SDSS spectrum with Hα, [NII], and [SII] in emission on
a general absorption spectrum. A physical companion is SDSS J161311.43+094952.0, an
elongated blue irregular four arcmin to the south-east at 4890 km s−1 with strong Hα, Hβ,
[NII], [SII], and [OIII] emission on a blueward-sloping continuum.
– 33 –
7. Appendix B: HI profiles of the candidate massive disks
In this Appendix we show the HI profiles of all the CHMDs obtained by the ALFALFA
survey. The ACG numbers of the CHMGs are shown in bold font.
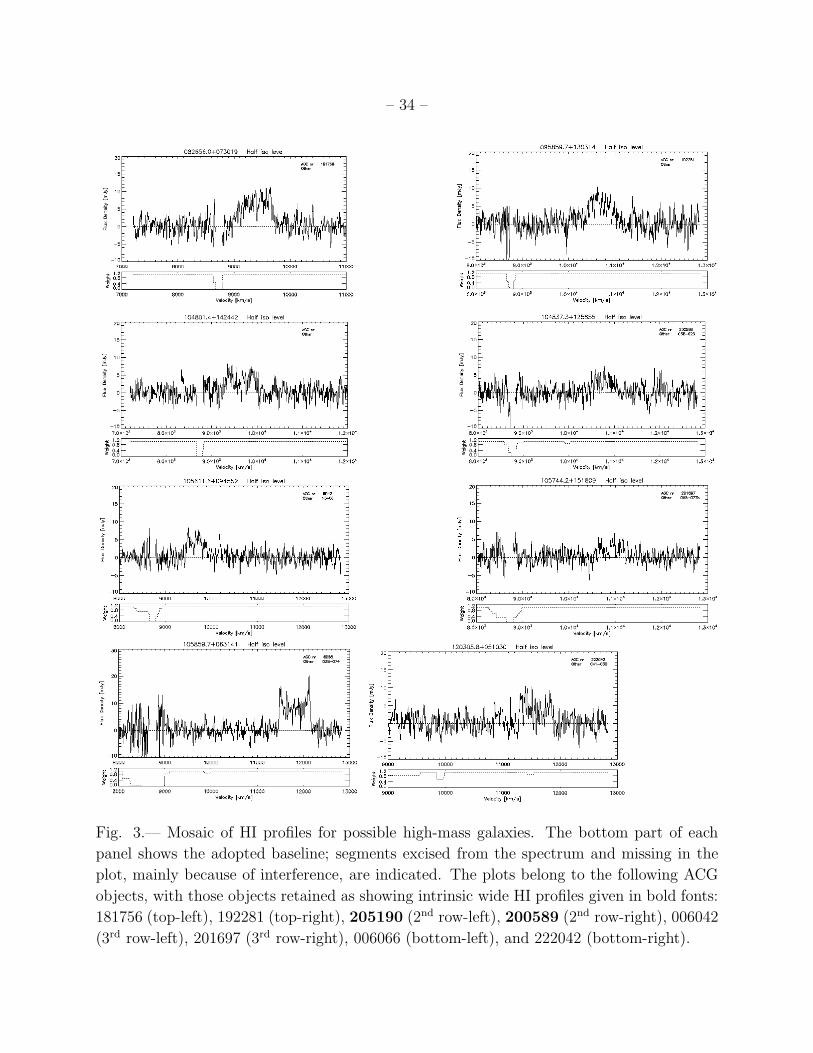
– 34 –
Fig. 3.— Mosaic of HI profiles for possible high-mass galaxies. The bottom part of each
panel shows the adopted baseline; segments excised from the spectrum and missing in the
plot, mainly because of interference, are indicated. The plots belong to the following ACG
objects, with those objects retained as showing intrinsic wide HI profiles given in bold fonts:
181756 (top-left), 192281 (top-right), 205190 (2nd row-left), 200589 (2nd row-right), 006042
(3rd row-left), 201697 (3rd row-right), 006066 (bottom-left), and 222042 (bottom-right).
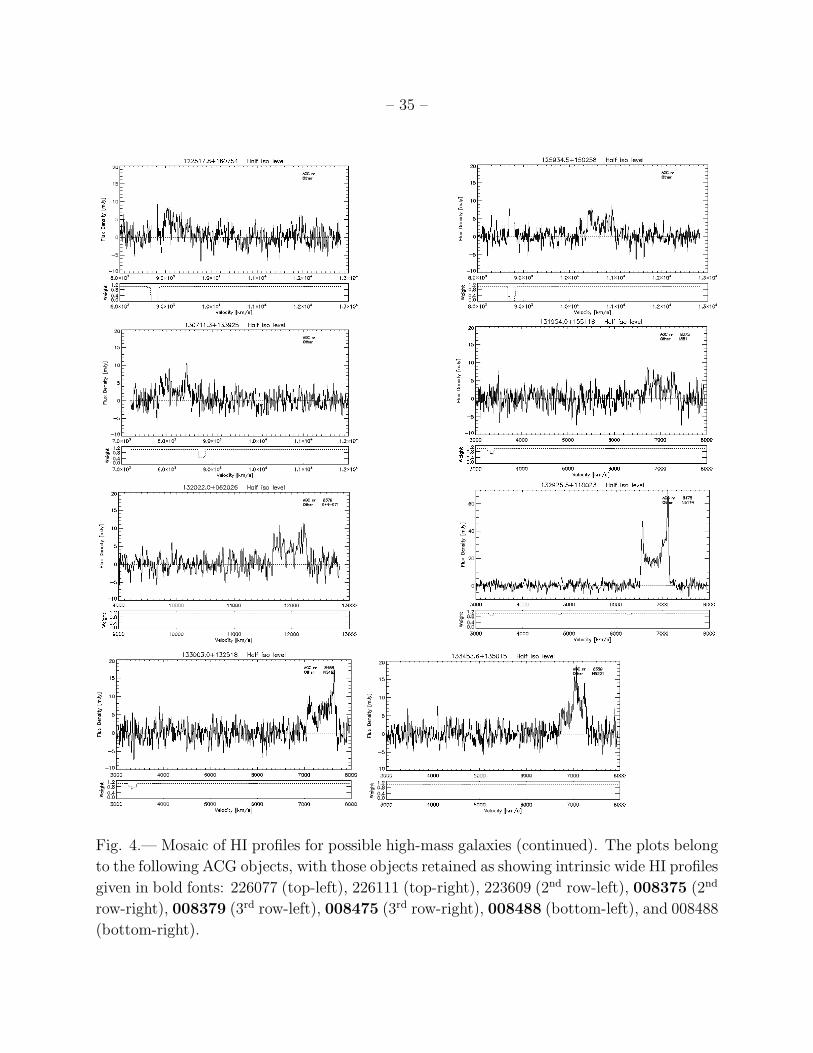
– 35 –
Fig. 4.— Mosaic of HI profiles for possible high-mass galaxies (continued). The plots belong
to the following ACG objects, with those objects retained as showing intrinsic wide HI profiles
given in bold fonts: 226077 (top-left), 226111 (top-right), 223609 (2nd row-left), 008375 (2nd
row-right), 008379 (3rd row-left), 008475 (3rd row-right), 008488 (bottom-left), and 008488
(bottom-right).
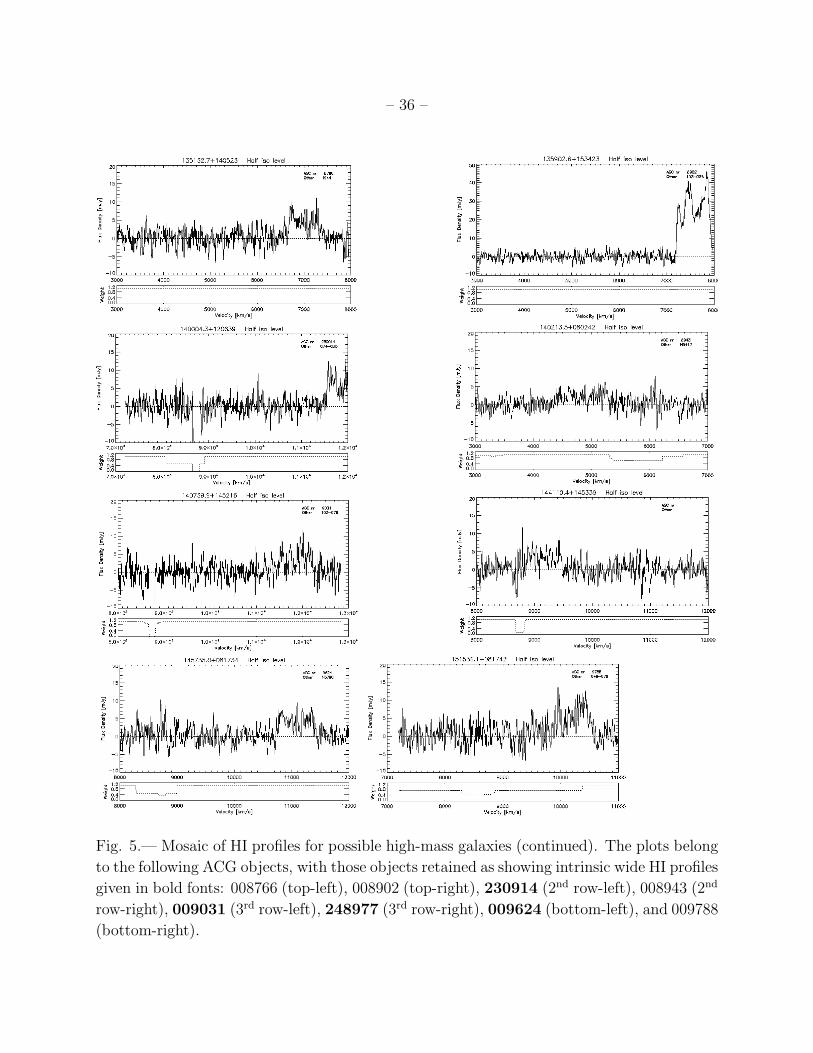
– 36 –
Fig. 5.— Mosaic of HI profiles for possible high-mass galaxies (continued). The plots belong
to the following ACG objects, with those objects retained as showing intrinsic wide HI profiles
given in bold fonts: 008766 (top-left), 008902 (top-right), 230914 (2nd row-left), 008943 (2nd
row-right), 009031 (3rd row-left), 248977 (3rd row-right), 009624 (bottom-left), and 009788
(bottom-right).
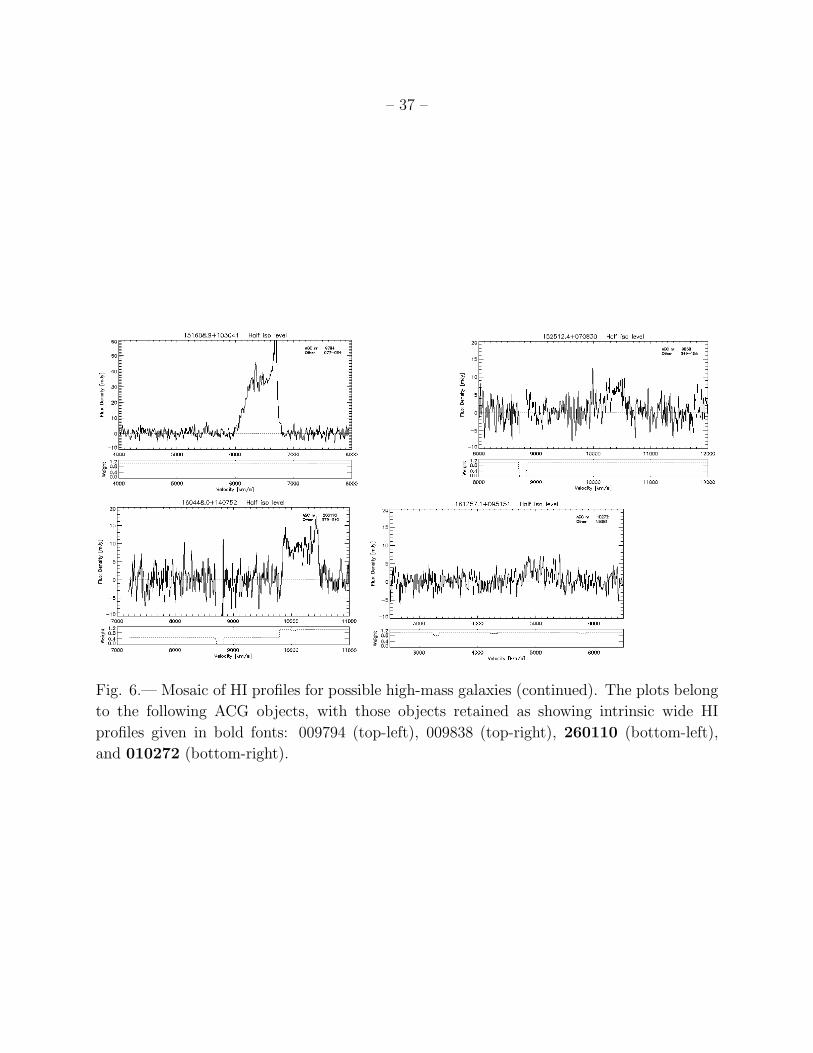
– 37 –
Fig. 6.— Mosaic of HI profiles for possible high-mass galaxies (continued). The plots belong
to the following ACG objects, with those objects retained as showing intrinsic wide HI
profiles given in bold fonts: 009794 (top-left), 009838 (top-right), 260110 (bottom-left),
and 010272 (bottom-right).