noise abatement schemes for shielded canyons
TRANSCRIPT

This article appeared in a journal published by Elsevier. The attachedcopy is furnished to the author for internal non-commercial researchand education use, including for instruction at the authors institution
and sharing with colleagues.
Other uses, including reproduction and distribution, or selling orlicensing copies, or posting to personal, institutional or third party
websites are prohibited.
In most cases authors are permitted to post their version of thearticle (e.g. in Word or Tex form) to their personal website orinstitutional repository. Authors requiring further information
regarding Elsevier’s archiving and manuscript policies areencouraged to visit:
http://www.elsevier.com/copyright

Author's personal copy
Noise abatement schemes for shielded canyons
M. Hornikx *, J. ForssénChalmers University of Technology, Department of Civil and Environmental Engineering, Division of Applied Acoustics, SE-41296 Göteborg, Sweden
a r t i c l e i n f o
Article history:Received 12 October 2007Received in revised form 20 March 2008Accepted 2 April 2008Available online 27 May 2008
PACS:43.28.Js43.50.Gf
Keywords:Noise abatement schemesShielded urban areasEquivalent sources methodIncoherent line source
a b s t r a c t
Access to quiet areas in cities is important to avoid adverse health effects due to road traffic noise. Mosturban areas which are or can become quiet (LA,eq < 45 dB) are shielded from direct road traffic noise. Bytransfer paths over roof level, many road traffic noise sources contribute to the level in these shieldedareas and noise abatement schemes may be necessary to make these areas quiet. Two real life shieldedcourtyards in Göteborg have been selected as reference cases for a numerical investigation of noise abate-ment schemes. The selected areas are modelled as canyons with a road traffic noise source modelled out-side the canyon by a finite incoherent line source, which is more realistic than both a coherent and anincoherent line source of infinite length. The equivalent sources method has been used for the calcula-tions. For all studied noise abatement schemes in the shielded canyon, the reductions are largest forthe lower canyon observer positions. Façade absorption is the most effective when placed in the upperpart of the canyon and can typically yield a reduction of 4 dB(A). Constructing 1 m wide walkways withceiling absorption reduces the level typically by 3 dB(A). These effects are most effective for narrowercanyons. For treatments at the canyon roof, reductions are independent of the canyon observer positionand amount to 4 dB(A) for a 1 m tall screen and 2 dB(A) for a grass covering of a saddle roof. Downwardrefracting conditions increase the levels for the lower canyon observer positions and higher frequencies.For sources located in canyons, abatement schemes therein are more effective for noise reduction in theshielded canyon than similar abatement schemes in the shielded canyon itself, given that all contributingsource canyons are treated.
� 2008 Elsevier Ltd. All rights reserved.
1. Introduction
Noise from road traffic can lead to annoyance and adversehealth effects such as sleep disturbance, disturbed relaxation andstress related effects [1]. For a ‘good and healthy’ environmentfor citizens, the sound level in LA,eq outdoors should be below45 dB1 [2]. Equivalent sound level often exceed 45 dB, however,especially in urban areas directly exposed to road traffic noise.Öhrström et al. [2] give evidence on health benefits of the presenceof a relatively quiet outdoor section bordering a dwelling; when thesound level in LA,eq due to road traffic noise does not exceed 60 dB atthe most-exposed side of the dwelling, 80% of the occupants are pro-tected from annoyance and adverse health effects if they also haveaccess to a side where the LA,eq does not exceed 45 dB. Within theSwedish research program Soundscape Support to Health, an area
bordering a dwelling where the LA,eq does not exceed 45 dB is de-fined as a quiet side [3]. Access to quiet areas can thus be concludedto be a contribution to solve the urban road traffic noise problem.Quiet urban areas are often shielded from direct road traffic noise,e.g. closed courtyards. When inspecting maps of urban city centresin Europe, such enclosed areas are often present, or could be createdby filling in openings in building blocks. The LA,eq at shielded sidesdoes however often exceed 45 dB. As an example, the environmentaladministration of the city of Göteborg executed more than 600 indic-ative measurements at courtyards in the city [4]. The percentage ofcases where LA,eq exceeded 45 dB was 60%. If noise from fans is dis-regarded and no openings to streets are assumed, the backgroundnoise level at shielded sides is determined by noise from road trafficin a wide area that reaches the shielded sides by propagation overthe building roof level [5].
To be able to create shielded urban areas where the backgroundnoise level due to road traffic noise does not exceed 45 dB, a studyof possible noise abatement schemes is an obvious issue. The accu-rate prediction of the effect of such noise abatement schemes re-quires a calculation model which includes material impedance,boundary roughness, edge diffraction and multiple reflections.Also, the influence of meteorological effects such as wind, temper-ature and turbulence on noise abatement schemes is of relevance
0003-682X/$ - see front matter � 2008 Elsevier Ltd. All rights reserved.doi:10.1016/j.apacoust.2008.04.002
* Corresponding author. Tel.: +46 31 772 8605; fax: +46 31 772 2212.E-mail address: [email protected] (M. Hornikx).
1 We remark that 45 dB is here used as a guideline level. Since other effects, as thefrequency content of noise, its time variations and non-acoustical aspects as, e.g.individual perception, also influence the adverse effects, 45 dB does not guarantee a‘good and healthy’ environment for all citizens. Here, LA,eq means the 24 h equivalentsound level, given as a so-called free field value.
Applied Acoustics 70 (2009) 267–283
Contents lists available at ScienceDirect
Applied Acoustics
journal homepage: www.elsevier .com/locate /apacoust

Author's personal copy
and should be included. An accurate sound level prediction atshielded urban areas is also of importance to assess shielded sidespsycho-acoustically, since such studies are still ongoing.
The study of sound propagation to shielded urban areas has gotits main attention in recent years. Accurate two-dimensional (2D)prediction models have successfully been developed: the finite dif-ference time domain model by, e.g. Van Renterghem and Bottel-dooren [6], and the frequency domain equivalent sources method(2D ESM) by Ögren and Kropp [7]. Both methods model a coherentline source of infinite length in the geometry of parallel urban can-yons, a source canyon and a shielded canyon. Since it has beenshown in e.g. [8] that the use of a coherent line source instead ofthe more realistic incoherent line source to represent a traffic flowcould lead to different results of a noise abatement treatment, a2.5D ESM was recently presented by Hornikx and Forssén [9]. Thismethod allows for calculating the response of a point source or anincoherent line source of arbitrary length in the geometry of paral-lel urban canyons, with an arbitrary position of the observer.
Concerning noise abatement schemes, Hornikx and Forssénshowed in a scale model study of parallel urban canyons that faç-ade treatments are more effective for observer positions in theshielded canyon compared to observer positions in the directly ex-posed canyon due to the larger importance of higher order façadereflections at the shielded side [10]. Façade treatments as absorp-tion and diffusion were shown to lead to a reduction of the level atthe shielded canyon [11,12]. Besides the effect of absorption anddiffusion, Van Renterghem et al. showed that a wind velocity gra-dient above the urban roof level influences the level at the shieldedcanyon substantially [11]. In addition, the level at the shielded can-yon was found to increase due to scattering by atmospheric turbu-lence [11,13]. The above results were mainly based on studies withreference situations of acoustically hard and smooth façade sur-faces and, concerning the numerical studies, a coherent line source.Real life façades already have some degree of absorption and diffu-sion, leading to a different effect of adding treatments.
To make a step forward from the existing valuable studies of thebenefits of absorption and diffusion for noise abatement in shieldedareas, it is essential to use reference geometries and materials takenfrom real life cases and use a more realistic line source outside theshielded canyon. This is what this paper aims at. As an additionalextension to the former studies, treatments at roof level are studied,the favourable location of façade absorption in the shielded canyonis investigated and the effects of treatments are evaluated at multi-ple observer positions in the shielded canyon. The effect of the can-yon height to width ratio on treatments is also regarded, and theinfluence of a downward refracting wind condition is investigatedfor some situations. Finally, mean results per treatment are shownand the effect of treatments in a source canyon is discussed sepa-rately from treatments in the shielded canyon. It is important tomention that the main limitation of this study is the approximatedgeometry of the shielded areas. They have been treated as long can-yons, instead of closed yards in a three-dimensional sense. Resultsfrom scale model measurements indicated that façade treatmentsfor canyons are less efficient than corresponding ones for closedyards. The results of the current study can thus be seen as an under-estimation of the real treatment effects [10].
The paper is organised as follows. In Section 2.1, the two se-lected city environments for study are presented. The source andobserver positions in the environments are discussed in Section2.2 and the chosen noise abatement schemes are shown in Section2.3. Section 3 gives an explanation of the used calculation model,the 2.5D ESM. The chosen source type, a finite incoherent linesource, is motivated by comparing its results with those from acoherent and an incoherent line source of infinite length. The re-sults of the investigated noise abatement schemes are presentedin Section 4 and are summarized in a table.
2. Situations of study
2.1. Selected courtyard geometries
From the city of Göteborg, two areas have been selected as ref-erence geometries for investigating the effect of noise abatementschemes. Göteborg is a city located at the west-coast of Sweden,as of 2006 populated by 489,000 inhabitants. Several parts of thecity are characterised by building blocks containing a closed or apartially closed yard. A typical part is the area Linnéstaden. Fig. 1shows a map of a part of this area, and a picture of the façades ofthe buildings at Linnégatan, the busiest road in the neighbourhoodwith an average traffic flow of 12,800 vehicles per 24 h (as of 2006)[14]. For this study, the courtyard marked in the map has been se-lected. The buildings consist of 8 floors with a total height ofaround 26 m. Their façades mainly consist of brickwork, windowsand doors (see Fig. 2).
Other typical areas in Göteborg characterised by their closedcourtyards are the ones containing houses called Landshövdinge-hus. There are more than 20 areas in Göteborg with such buildings.These buildings were erected in the first half of the 20th centuryand are characterised by a ground floor façade of plastered brick-work and two floors with a wooden façade. The second chosencourtyard is located in the street Bomgatan and is indicated inFig. 3, its cross-section is shown in Fig. 4. The busiest road closeto Bomgatan is Mölndalsvägen, with an average traffic flow of12,400 vehicles per 24 h (as of 2004) [14]. The height of the build-ings is around 14 m. Both at Bomgatan and Linnégatan, the court-yard width is approximated by 25 m. The presence of narrowercourtyards leads to the choice of a second geometry with a court-yard width of 14 m. The total of four courtyard geometries aremodelled as canyons and summarised in Table 1 including theheight to width ratio (H/W) of the canyons. For all reference canyongeometries, asphalt has been chosen as the ground surface and(saddle) roofs have been treated as being non-absorptive. Table 2shows the used absorption coefficients of the materials, mostly ta-ken from literature.
2.2. Source and observer positions
Noise abatement schemes are studied in two parts:
(I) By shielded canyon treatments (see Fig. 5a).(II) By source canyon treatments (see Fig. 5b).
Source and shielded canyon situations have been chosen suchthat, by reciprocity, parts of the calculations are equal, which cutscomputational costs. There is a notable difference between the twoparts. Whereas shielded canyon treatments will affect levels with aweak dependence on the source position(s), source canyon treat-ments only affect the levels due to that particular source canyon;contributions from other source canyons are not reduced in levelat the immission point. By separating source and observer by alarge distance (here >500 m), the effect of treatments in both can-yons can be added (taking into account the double roof reflection[5]), which can be seen as a far field approximation. The calculatedresults can from that point of view be generalized and they do notsuffer from near-field effects as present when the distance to theclosest busy road as of Figs. 1 and 3 would have been used in thecalculations. The effect of treatments in the shielded canyon hasbeen evaluated at a number of relevant observer positions in theshielded canyon (see Figs. 2 and 4); along the canyon ground sur-face at a height of 1.5 m and at window surfaces.
The sources are modelled as incoherent line sources of finitelength. For the source spectrum, a road traffic distribution of 90%
268 M. Hornikx, J. Forssén / Applied Acoustics 70 (2009) 267–283

Author's personal copy
Fig. 1. (a) View in Linnégatan and (b) map with the chosen Linnégatan courtyard, indicated by a dot.
Fig. 2. Cross-section of the investigated courtyard geometries at Linnégatan with source and observer positions. (a) Linnégatan narrow (LN) and (b) Linnégatan wide (LW).The source positions at ground level are only used when studying abatement schemes within a source canyon.
M. Hornikx, J. Forssén / Applied Acoustics 70 (2009) 267–283 269

Author's personal copy
light and 10% heavy vehicles with a speed of 50 km/h has been cho-sen. The traffic spectra have been taken from Danish measurementdata [19]. Concerning the source canyon treatments, road trafficmay be represented by sources at several heights (see e.g. [19]).However, since 1/3-octave band results are of interest here, the dif-
ference between modelling one or multiple source heights is notexpected to be significant. One source height of 0.15 m will there-fore be used here and two road traffic lanes are modelled. For theshielded canyon treatments, a single line source is placed at rooflevel.
Fig. 3. (a) Façade of a Landshövdingehus in Göteborg [15] and (b) map with the chosen Bomgatan courtyard, indicated by a dot.
Fig. 4. Cross-section of the investigated courtyard at Bomgatan with source and observer positions. (a) Bomgatan narrow (BN) and (b) Bomgatan wide (BW).
270 M. Hornikx, J. Forssén / Applied Acoustics 70 (2009) 267–283
Author's personal copy
2.3. Noise abatement schemes
Treatments to reduce the sound pressure level in shielded can-yons are here divided into absorption and screen treatments. Forsome screen treatments, additional absorption has been appliedas well. The investigated noise abatement schemes are additionsto the reference canyon geometries of Figs. 2 and 4 and are shownin a pictorial description in Fig. 6. The scheme numbers (e.g. A2)are used in Table 3, where results have been averaged per scheme.
The effect of increasing façade absorption is investigated bysuccessively increasing the absorption coefficient of the façadematerials to the frequency independent values 0.4, 0.6 and 0.8,for a normal incident sound wave (schemes A1, A2 and A3). Noticethat already 0.4 is larger than the largest absorption coefficient ofthe existing materials (see Table 1). The new absorption coefficienthas only been assigned to the parts of the façades not being win-dows. In the geometries of Linnégatan, 32% of the façades are cov-ered by façade absorption treatments and in the Bomgatangeometries, this portion is 48%.
The effect of the ground surface has been investigated by chang-ing its impedance from that of asphalt to that of grass (scheme A4).The combined change of the ground surface and an increase of thefaçade absorption coefficient to 0.8 has also been studied (schemeA5).
When applying façade absorption material, it is of interest toknow its most favourable position. With schemes A1, A6, A7, A8and A9, this preferable position has been investigated. A constantabsorption area has been used and the absorption material hasbeen located on both façades, the upper part of both façades, thelower part of both façades, the left façade or the right façade. Sincethe total absorption area of these schemes are equal, the absorp-tion coefficient of the applied absorption varies over the schemes.
The effect of a change of the rigid roof to that of a grass coveredroof, e.g. a vegetation roof, has been studied in scheme A10. Theimpedance of a layer of 0.15 m soft grass on a rigid surface has thenbeen used, see Table 2.
The first type of screen treatment is the addition of horizontalscreens above the windows (schemes S1, S2, S3 and S4). A thin hor-izontal screen may represent a (stiff) sunscreen or a walkway (notethat we do not model geometrical changes along the canyon, i.e. inthe y-direction). Three screens have been used per façade for theBomgatan geometries and seven per façade for the Linnégatangeometries. Absorption material covers the lower face of thescreens, with an absorption coefficient of either 0.1 or 0.8, for anormal incident sound wave. The screens are 1 m wide in schemesS1 and S2, and 2 m wide in schemes S3 and S4.
With schemes S5 and S6, the influence of a thin vertical screenat the roof top is studied, either 1 or 2 m tall, respectively.
The canyon shielding could be reduced under downwardrefracting conditions. To model this, a linear horizontal wind veloc-ity profile with a gradient of 1 s�1 is assumed which causes thesound waves to bend over the roof top (see Fig. 7). For the refer-ence canyon geometries and scheme A3, this downward refractingatmosphere has been studied. These situations are referred to assituations D1 and D2, respectively.
3. The 2.5D ESM calculation model
3.1. Description of the calculation model
The method used to assess the proposed noise abatementschemes is the 2.5D ESM for urban canyons [9]. With this method,the response of a point source or an incoherent line source in ageometry that is invariant in one direction (here the y-direction)can be calculated in the frequency domain. The 2.5D ESM solutionis obtained by an integration over 2D ESM solutions. In the ESM,the computational domain is split into sub-domains in which theGreen’s functions are known. The interfaces of the sub-domainsare populated by equivalent sources. Fig. 8 shows the position ofthe equivalent sources at the interfaces for scheme S4 and exem-plifies the various sub-domains; a rectangular cavity (the canyon),a free space above the cavity, minor rectangular cavities andimpedance patches.
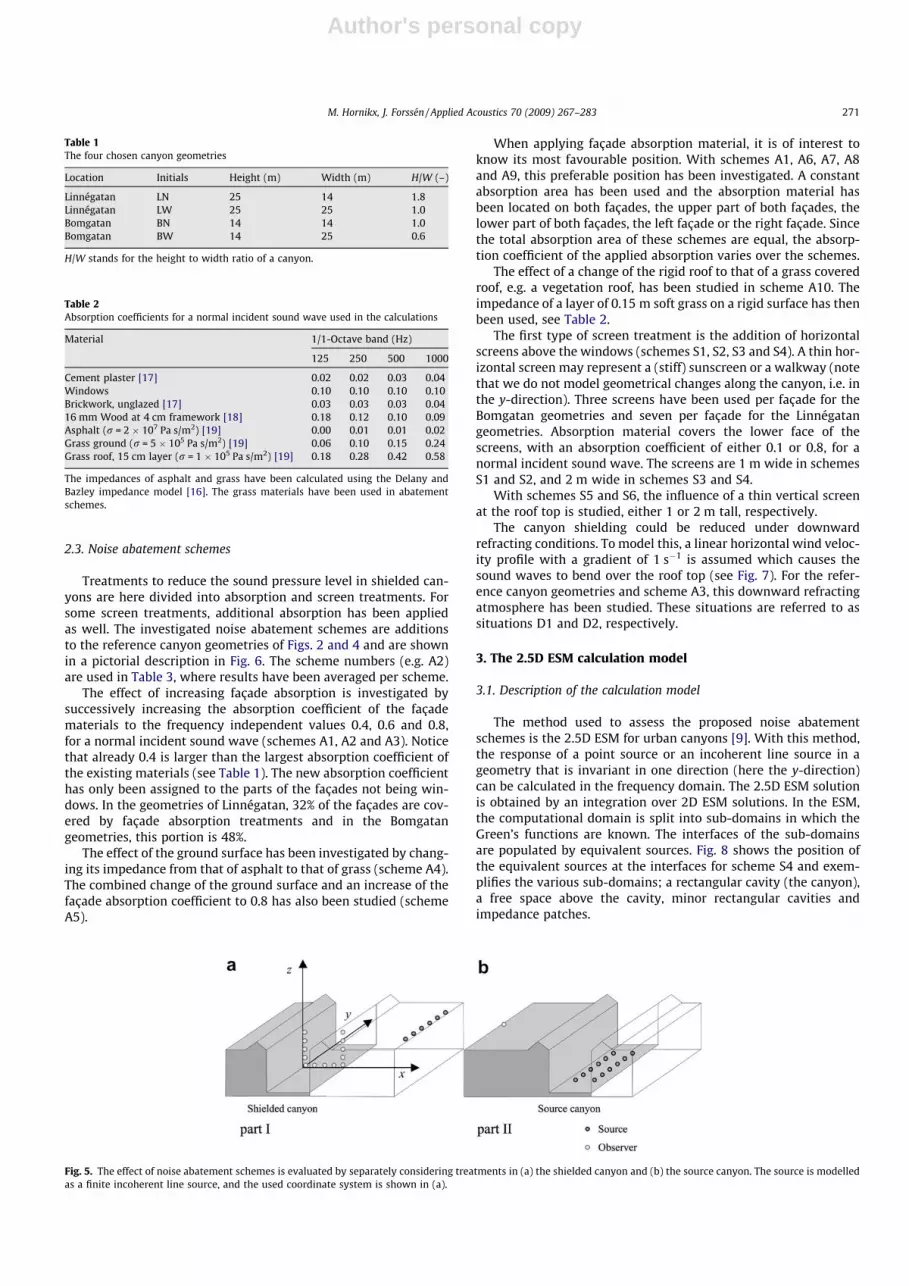
Table 1The four chosen canyon geometries
Location Initials Height (m) Width (m) H/W (–)
Linnégatan LN 25 14 1.8Linnégatan LW 25 25 1.0Bomgatan BN 14 14 1.0Bomgatan BW 14 25 0.6
H/W stands for the height to width ratio of a canyon.
Table 2Absorption coefficients for a normal incident sound wave used in the calculations
Material 1/1-Octave band (Hz)
125 250 500 1000
Cement plaster [17] 0.02 0.02 0.03 0.04Windows 0.10 0.10 0.10 0.10Brickwork, unglazed [17] 0.03 0.03 0.03 0.0416 mm Wood at 4 cm framework [18] 0.18 0.12 0.10 0.09Asphalt (r = 2 � 107 Pa s/m2) [19] 0.00 0.01 0.01 0.02Grass ground (r = 5 � 105 Pa s/m2) [19] 0.06 0.10 0.15 0.24Grass roof, 15 cm layer (r = 1 � 105 Pa s/m2) [19] 0.18 0.28 0.42 0.58
The impedances of asphalt and grass have been calculated using the Delany andBazley impedance model [16]. The grass materials have been used in abatementschemes.
Fig. 5. The effect of noise abatement schemes is evaluated by separately considering treatments in (a) the shielded canyon and (b) the source canyon. The source is modelledas a finite incoherent line source, and the used coordinate system is shown in (a).
M. Hornikx, J. Forssén / Applied Acoustics 70 (2009) 267–283 271

Author's personal copy
Fig. 6. Pictorial description of the investigated noise abatement schemes. The figures exemplify calculation part I (see Fig. 5a).
Table 3Effect of the investigated shielded canyon noise abatement schemes DLref in dB(A), averaged over observer positions and all four canyon geometries
Scheme Treatment description FILS Stdev FILSsc ILS CLS
Absorption treatmentsA1 afac = 0.4 �1.8 0.8 �2.4 �2.3 �1.6A2 afac = 0.6 �2.7 1.3 �4.0 �2.9 �2.6A3 afac = 0.8 �3.6 1.8 �5.5 �3.2 �3.5A4 Grass ground �0.8 0.5 �2.0 �1.1 �0.7A5 afac = 0.8 and grass ground �4.1 2.0 �7.1 �4.8 �3.9A6 Façade absorption in upper canyon half �2.1 0.9 �2.5 �2.5 �2.0A7 Façade absorption in lower canyon half �1.4 0.8 �2.8 �1.2 �1.4A8 Absorption at left canyon façade �1.9 1.0 �2.5 �1.8 �1.8A9 Absorption at right canyon façade �1.6 0.8 �2.7 �1.6 �1.6A10 Grass roof �2.2 0.4 �2.2 �4.6 �2.0
Screen treatmentsS1 1 m horizontal screen, ascreen = 0.1 �0.9 1.0 �1.7 �1.4 �0.8S2 1 m horizontal screen, ascreen = 0.8 �2.5 1.8 �4.4 �2.7 �2.3S3 2 m horizontal screen, ascreen = 0.1 �3.0 2.2 �4.5 �3.2 �2.8S4 2 m horizontal screen, ascreen = 0.8 �5.5 3.7 �9.4 �4.8 �5.4S5 1 m vertical screen at roof �4.3 0.4 �4.4 �4.3 �4.3S6 2 m vertical screen at roof �5.6 0.4 �5.7 �5.4 �5.6
Reference schemeDownward refractionD1 Reference canyon geometry 0.6 2.6 1.2 �0.5 0.9D2 Scheme A3 1.3 2.6 2.8 �0.2 1.5
Results are given for the finite incoherent line source (FILS), the corresponding standard deviation (Stdev), the incoherent line source (ILS) and the coherent line source (CLS).Results of source canyon treatments for the finite incoherent line source (FILSsc) are averaged over the two source positions and four canyon geometries.
Fig. 7. For the reference canyon geometries and scheme A3, a downward refracting wind velocity is modelled such that canyon shielding is absent. The figures exemplifycalculation part I (see Fig. 5a).
272 M. Hornikx, J. Forssén / Applied Acoustics 70 (2009) 267–283

Author's personal copy
The amplitudes of the equivalent sources are calculated by ful-filling the Helmholtz equation in the sub-domains, the locallyreacting boundary conditions at the impedance patches and thecontinuity of pressure and normal velocity across the sub-domaininterfaces. The pressure for an arbitrary observer position in thecomputational domain can then be calculated by the contributionsfrom the equivalent sources bordering the respective sub-domain(and the primary source if located in the same sub-domain). Thefaçade absorption has here been modelled as a real valued imped-ance and the ground surface material as a complex impedance.
3.2. Green’s functions
Compared with a previous ESM [7], some different Green’sfunctions have been used here. The major part of the ESM calcu-lation time is caused by calculating the Green’s functions betweenthe equivalent sources in the cavities. It is therefore computation-ally attractive to use a faster Green’s function than the formerlyused modal summation in two-dimensions; a combination of amodal and a wave approach. A single term expression based ona wave approach is used in one direction, the x-direction, and amodal summation is used in the z-direction. Since the expressionfor the wave approach is a single term, only one summation re-mains in this method. Formulas for such a Green’s function havebeen published among others by Morse and Feshbach [20]. Forthe situation studied here, the Green’s function can be formulatedas
Gðxjxs; zjzsÞ
¼� 2
lz
PNn¼0� cosðknðlx�xsÞÞ cosðknxÞÞ cosðnpzs=lzÞ cosðnpz=lzÞ
kn sinðknlxÞ for 0 6 x 6 xs;
� 2lz
PNn¼0� cosðknðlx�xÞÞ cosðknxsÞÞ cosðnpzs=lzÞ cosðnpz=lzÞ
kn sinðknlxÞ for xs 6 x 6 lx;
8>>><>>>:
ð1Þ
where xs and zs are the source coordinates, lx and lz the cavitydimensions and kn the modal wave number, which may includeair absorption. Since, for a certain maximum mode number N, thisexpression is more accurate than the modal solution in both direc-tions, the Green’s function calculation time has been sped up morethan quadratically with the number of equivalent sources.
Another different Green’s function concerns the one above theroof level. In the current application, we model a saddle roof and,in some schemes, a thin screen. Numerically, a wedge diffractionsolution is used to obtain the Green’s function from a point outsidethe canyon to the equivalent sources at canyon roof level. Calculat-ing a 2D wedge diffraction solution is however much slower thancalculating a 3D wedge diffraction solution. Since the insertion lossof a 3D wedge equals the insertion loss of a 2D wedge in the farfield (kr > 1) and for a spherical wave divergence correction [21],a 3D wedge diffraction solution has here been used according to[22]. The Green’s function becomes
G2D;wedge �G3D;wedge
G3D;freeG2D;free
ffiffiffiffiffiffiffiffiffiffiffiffirwedge
rfree
r; ð2Þ
where G2D,wedge and G3D,wedge are the Green’s functions for a wedgein 2D and 3D, G2D,free and G3D,free are the free field Green’s functionsin 2D and 3D, rfree is the free field distance between two field pointsand rwedge the shortest distance between two field points via thewedge. For the Green’s functions among the equivalent sources atthe canyon roof level, diffraction components at the wedge topand wedge base have been neglected, i.e. here a flat roof has beenassumed.
For refraction schemes D1 and D2, the Green’s functions abovethe canyon roof level have been calculated according to a ray ap-proach as described by Salomons [23, Chapter L].
Air absorption has not been included in this study. Since airabsorption increases with propagation distance and frequency, ithas to be kept in mind that abatement schemes are of larger impor-tance for lower frequencies here.
3.3. Convergence and accuracy
The 2D ESM has successfully been compared with the boundaryelement method (BEM) for the case of rigid walls with the sourceand observer in the same canyon [12]. Accuracy and convergenceof the 2.5D ESM has been discussed in [9]. In addition, AppendixA shows a comparison between 2.5D ESM results and those froma previously performed scale model study for a point source andtwo parallel canyons [10]. Cases with rigid boundaries, façadeabsorption and façade diffusion have been compared, showinggood agreement.
Fig. 8. Equivalent sources in the ESM, placed in the LN geometry with 2 m wide screens (scheme S4). The equivalent sources are placed at sub-domain interfaces. Note thatthe screens only have absorption at their lower face.
M. Hornikx, J. Forssén / Applied Acoustics 70 (2009) 267–283 273

Author's personal copy
The number of 2D solutions required to calculate the incoherentline source solutions is taken as proposed by Hornikx and Forssén[9]. Six equivalent sources per wavelength have been used, whichis a trade-off between accuracy and computation time. Thirty log-arithmically spaced frequencies per 1/3-octave band have beenused. For abatement schemes with horizontal screens (i.e. S1, S2,S3 and S4), the sub-domain complexity is higher than for previ-ously implemented ESM codes. To verify these implementations,results in the limit of small horizontal screen widths were foundto led to the results without screens.
3.4. Relative sound pressure level DLref
Calculation results are presented by the relative sound pressurelevel DLref
DLref ¼ Lp � Lp;ref ð3Þ
with Lp the level for a certain noise abatement scheme and withLp,ref the level in the reference canyon geometry. The relative soundpressure levels DLfree and DLrigid are also used and represent levelsrelative to, respectively, the free field situation and the situation of acanyon with smooth and acoustically hard boundaries. When re-sults averaged over observer positions are presented, the averaginghas been done over DL in dB(A), or in dB when frequency dependentresults are presented.
3.5. Finite incoherent line source (FILS)
The use of a proper type of line source is highly relevant in thisstudy. An incoherent line source (ILS) is more suitable to representa traffic flow than a coherent line source (CLS), but is not appropri-ate for the current application. A finite incoherent line source (FILS)has instead been used, which will be motivated below by compar-ing results from using the three different source types. The FILSsolution can be obtained by using the 2.5D ESM, see Appendix B.
Fig. 9 illustrates the behaviour of the results from using the threedifferent source types by a frequency excerpt of the relative level forthe BN canyon geometry for calculation part I with smooth non-absorptive façades and the observer at position O7 (see Fig. 4). Thedominance of the modes for the CLS is clear whereas modes arehardly visible in the ILS results due to the incoherent addition ofpoint sources. The FILS with a maximum horizontal angle betweensource and observer of hmax = 45�, see Fig. B.1, does not exhibit theextreme results of either the CLS or the ILS.
Fig. 10 shows the effect of absorption (scheme A3 relative to thereference canyon geometry) and diffusion (reference canyongeometry with non-absorbing boundaries relative to reference
canyon geometry with smooth and non-absorbing boundaries)for several maximum angles in the FILS. For a zero maximum angle,the FILS technically represents a point source solution, which has arelative level similar to the relative level of the CLS for screened ob-server positions [21]. The results indeed show that the FILS tendsto the CLS results for a decreasing hmax. On the other hand, the FILSresults approach the ILS results when hmax approaches 90�. Study-ing the FILS and the CLS results, a substantial deviation can be seenfor hmax > 70�. However, for most real life canyons, with finitedimensions, the use of sources at these large angles is probablynot realistic, but could be modelled for specific situations. A mod-erate choice of hmax = 45� has therefore been made here,2 with theaim of receiving more generalized results.
4. Results
Calculation results are presented in 1/3-octave bands rangingfrom 100 to 1000 Hz, where the computation time has limitedthe upper frequency. Even though road traffic noise emission isimportant above 1000 Hz, the most difficult noise reduction atthe immission points is for the lower frequencies. Furthermore,for all cases studied here, the A-weighted noise level is dominatedby the 1/3-octave bands up to 1000 Hz. The results of all noiseabatement schemes are presented and discussed in Sections 4.1–4.4 for treatments in the shielded canyon, i.e. calculation part I asof Fig. 5a. The results have been averaged over all observer posi-tions and four canyon geometries (LN, LW, BN, BW) and are sum-marised in Table 3. The results of the noise abatement schemesin the source canyon, i.e. calculation part II as of Fig. 5b, are alsoincluded in Table 3 and are discussed in Section 4.5.
4.1. Reference canyon results for the shielded canyon
The average results for the reference canyon geometries relativeto free field, DLfree, are shown in Fig. 11a. The thick line is DLfree andthe thin line its standard deviation (with value axis on the righthand side). The DLfree decreases with frequency owing to the can-yon edge diffraction. Fig. 11b shows the DLfree averaged per canyongeometry in dB(A) with the standard deviation illustrated by errorbars. The DLfree is similar for all canyon geometries. To illustratethe variation of the level over the observer positions, Fig. 11cshows the average DLfree for observer positions along the groundfloor for the wide canyons, i.e. BW and LW, and Fig. 11d displaysthe average DLfree for observer positions over the height of the can-yon. For the latter, an average for façade positions in Linnégatanhas been taken over both canyon widths, i.e. LN and LW, and bothfaçades. The results in Fig. 11c exhibit a rather weak dependenceover the width of the canyon, whereas the levels decrease withdecreasing observer height in Fig. 11d. The high values for theupper observer positions in Fig. 11d are caused by the large depres-sion of the windows there, see Fig. 2. One has to keep in mind that,owing to the presence of the boundary, levels for façades observerpositions are higher than for canyon observer positions (up to 3 dBhigher levels for a diffuse sound field).
4.2. Absorption schemes for the shielded canyon
Results of noise abatement schemes in this Section and Sections4.3 and 4.4 are presented in a similar way as in Fig. 11. Fig. 12ashows DLref as a function of frequency for the three absorptiontreatments A1, A2 and A3. The effect of absorption increases with
65 70 75 80 85–40
–30
–20
–10
0
10
20
frequency (Hz)
Δ L
free
(dB
)
CLSFILS, θ
max = 45 °
ILS
Fig. 9. Relative levels, DLfree, for three different source types. Canyon geometry BNfor calculation part I (Fig. 5a) with observer position O7. Façades are smooth andnon-absorbing.
2 Note that for the modelled FILS, 45� stands for the maximum angle betweensource and observer as well as all image observers in the canyon, which are implicitlyincluded in the ESM solution.
274 M. Hornikx, J. Forssén / Applied Acoustics 70 (2009) 267–283

Author's personal copy
the absorption coefficient and is rather constant over frequency.Fig. 12b shows the average of scheme A3 per geometry. Althoughdifferences are smaller than 1 dB(A), it can be concluded that theeffect of façade absorption is more effective for the narrower can-yons. Fig. 12c shows that the DLref is rather equal over the width ofthe canyon. From Fig. 12d, it can be concluded that the reductionweakens with increasing observer height. The reason is that thelevels at the lower observer positions are more dependent on thehigher order reflections (as explained by the rise time in [10]).The standard deviations show to be larger for larger reductions.
Fig. 13 shows the results of the treatments A4 and A5. Theupper curve in Fig. 13a is the effect of changing the ground surfacefrom asphalt to grass. Although the absorption of grass is larger forthe higher frequencies (for normal incidence), this is not very obvi-
ous from the results. Compared to the façade absorption schemeA3, the change to a grass ground surface (scheme A5) does not leadto a large further reduction. Fig. 13b displays the results for thescheme with a grass ground surface, scheme A4. Although differ-ences are smaller than 1 dB(A), it shows that the ground surfacehas a larger effect in the wider canyons. This is an expected result,since the grass absorption area is larger for the wider canyons.Ground absorption does not lead to a large variation of DLref overthe width of the canyon, see Fig. 13c, and affects the lowest obser-ver positions most, see Fig. 13d.
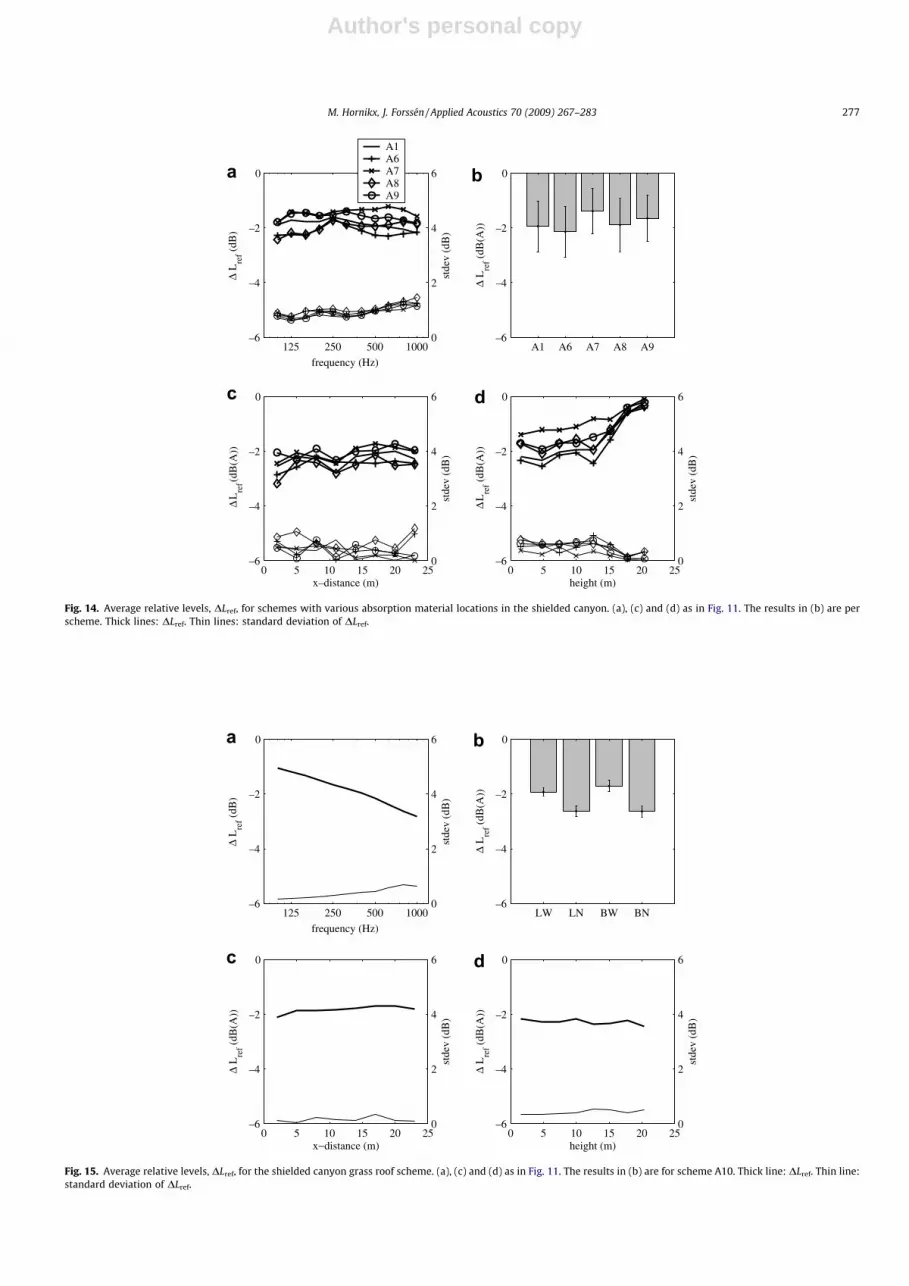
Fig. 14 shows the effect of five different absorption materialplacements, according to the sketches in Fig. 6. The differencesamong the five schemes are in general not large. Note that, for a re-sult averaged over all observer positions, the effect of absorption at
125 250 500 1000–10
–8
–6
–4
–2
0
2
frequency (Hz)
Δ L
ref (
dB)
125 250 500 1000–10
–8
–6
–4
–2
0
2
frequency (Hz)
Δ L
rigi
d (dB
)
ILSCLSFILS, θ
max = 45°
FILS, θmax
= 70°FILS, θ
max = 85°
FILS, θmax
= 89°
Fig. 10. Relative levels, DLref and DLrigid, for various source types, for (a) an absorption coefficient of 0.8, i.e. scheme A3, and (b) the reference canyon geometries with non-absorbing boundaries. Results are for calculation part I (Fig. 5a) and averaged over all observer positions and all canyon geometries.
125 250 500 1000–24
–18
–12
–6
0
frequency (Hz)
Δ L
free (
dB)
0
2
4
6
8st
dev
(dB
)
LW LN BW BN–24
–18
–12
–6
0
Δ L
free (
dB(A
))
2520151050–24
–18
–12
–6
0
x–distance (m)
Δ L
free
(dB
(A))
0
2
4
6
8
stde
v (d
B)
0 5 10 15 20 25–24
–18
–12
–6
0
height (m)
Δ L
free (
dB(A
))
0
2
4
6
8
stde
v (d
B)
Fig. 11. Average relative levels, DLfree, for the reference canyon geometries for calculation part I (see Fig. 5a). (a) Observer positions for all canyon geometries, (b) observerpositions per canyon geometry with standard deviations, (c) observer positions at a height of 1.5 m in the wide canyons geometries, and (d) observer positions in theLinnégatan canyon geometries for façade observer positions. Thick line: DLfree. Thin line: standard deviation of DLfree.
M. Hornikx, J. Forssén / Applied Acoustics 70 (2009) 267–283 275

Author's personal copy
125 250 500 1000–12
–10
–8
–6
–4
–2
0
frequency (Hz)
Δ L
ref (
dB)
0
2
4
6
stde
v (d
B)
LW LN BW BN–12
–10
–8
–6
–4
–2
0
Δ L
ref (
dB(A
))
2520151050–12
–10
–8
–6
–4
–2
0
x–distance (m)
Δ L
ref (
dB(A
))
0
2
4
6
stde
v (d
B)
0 5 10 15 20 25–12
–10
–8
–6
–4
–2
0
height (m)
Δ L
ref (
dB(A
))
0
2
4
6
stde
v (d
B)
A1A2A3
Fig. 12. Average relative levels, DLref, for façade absorption schemes in the shielded canyon. (a), (c) and (d) as in Fig. 11. The results in (b) are for scheme A3. Thick lines: DLref.Thin lines: standard deviation of DLref.
125 250 500 1000–12
–10
–8
–6
–4
–2
0
frequency (Hz)
Δ L
ref (
dB)
0
2
4
6
stde
v (d
B)
LW LN BW BN–12
–10
–8
–6
–4
–2
0
Δ L
ref (
dB(A
))
2520151050–12
–10
–8
–6
–4
–2
0
x–distance (m)
Δ L
ref (
dB(A
))
0
2
4
6
stde
v (d
B)
0 5 10 15 20 25–12
–10
–8
–6
–4
–2
0
height (m)
Δ L
ref (
dB(A
))
0
2
4
6
stde
v (d
B)
A4A5
Fig. 13. Average relative levels, DLref, for ground absorption schemes in the shielded canyon. (a), (c) and (d) as in Fig. 11. The results in (b) are for scheme A4. Thick lines: DLref.Thin lines: standard deviation of DLref.
276 M. Hornikx, J. Forssén / Applied Acoustics 70 (2009) 267–283
Author's personal copy
125 250 500 1000–6
–4
–2
0
frequency (Hz)
Δ L
ref (
dB)
0
2
4
6
stde
v (d
B)
A1 A6 A7 A8 A9–6
–4
–2
0
Δ L
ref (
dB(A
))
2520151050–6
–4
–2
0
x–distance (m)
Δ L
ref (
dB(A
))
0
2
4
6
stde
v (d
B)
0 5 10 15 20 25–6
–4
–2
0
height (m)
Δ L
ref (
dB(A
))
0
2
4
6
stde
v (d
B)
A1A6A7A8A9
Fig. 14. Average relative levels, DLref, for schemes with various absorption material locations in the shielded canyon. (a), (c) and (d) as in Fig. 11. The results in (b) are perscheme. Thick lines: DLref. Thin lines: standard deviation of DLref.
125 250 500 1000–6
–4
–2
0
frequency (Hz)
Δ L
ref (
dB)
0
2
4
6
stde
v (d
B)
LW LN BW BN–6
–4
–2
0
Δ L
ref (
dB(A
))
2520151050–6
–4
–2
0
x−distance (m)
Δ L
ref (
dB(A
))
0
2
4
6
stde
v (d
B)
0 5 10 15 20 25–6
–4
–2
0
height (m)
Δ L
ref (
dB(A
))
0
2
4
6
stde
v (d
B)
Fig. 15. Average relative levels, DLref, for the shielded canyon grass roof scheme. (a), (c) and (d) as in Fig. 11. The results in (b) are for scheme A10. Thick line: DLref. Thin line:standard deviation of DLref.
M. Hornikx, J. Forssén / Applied Acoustics 70 (2009) 267–283 277

Author's personal copy
the left and at the right façade have to be averaged when multipleroads with arbitrary location contribute to the canyon level.According to Fig. 14b, absorption material placed in the upper partof the canyon façades gives the best results and absorption mate-rial placed in the lower half of the canyon gives the smallest effect.One reason is that for the latter scheme, only the lower observerpositions are largely affected by the façade absorption material.
The effect of a grass covered saddle roof is presented in Fig. 15.The frequency dependence in Fig. 15a is caused by the properties ofthe used material (see Table 2). The grass roof causes larger lossesfor narrower canyons, see Fig. 15b, and does not exhibit a cleardependence on the observer position. This is in contrast with theheight dependent results of the former schemes. The losses dueto the grass roof are likely additive to in-canyon treatments.
4.3. Screen schemes for the shielded canyon
The horizontal screens make the sound field more diffuse bybreaking up the modes in the canyon. In addition, the screens pre-vent the sound waves from being scattered down into the canyonby reflecting waves upwards and absorbing them at the lowerscreen faces. Finally, façade observer positions will become moreshielded for noise immission. Fig. 16 shows the results for thetreatments S1–S4. For the 1 and 2 m wide screens with an absorp-tion coefficient of 0.1 (schemes S1 and S3, respectively), there is noclear frequency dependent effect (see Fig. 16a). The increase of theabsorption coefficient at the lower faces of the screens has a largeeffect as can be seen in the results for a 1 and 2 m wide screen withan absorption coefficient of 0.8 (schemes S2 and S4, respectively).This effect is larger for the lower frequencies. Fig. 16b shows theresults of scheme S4 and illustrates that the effect of horizontalscreens at façades is more effective for the narrow canyons. Thestronger effect for Linnégatan may be attributed to the fact that alarger number of screens has been applied than for Bomgatan. Overthe width of the canyon, the effect of the treatments is rather even,
see Fig. 16c. From Fig. 16d, we see that the effect of the screens isstrongly height dependent. The highest observer positions undergoa negative effect due to reflections from the screens.
The effect of a thin vertical screen on top of the canyon roof,schemes S5 and S6, is shown in Fig. 17. Fig. 17a shows that the ef-fect of a 1 m tall screen (scheme S5) is somewhat more that 4 dBand quite even over frequency. The 2 m tall screen reduces the lev-els only a little more compared to the 1 m tall screen. The excessscreen reduction can be attributed to the rooftop being elevatedand the shape of the roof being changed. The small difference be-tween the effect of the 1 and 2 m tall screens might indicate thelarger influence of the roof shape change. Fig. 17b displays the ef-fect of the 2 m tall screen per canyon geometry. The narrow can-yons benefit to a slightly larger extent from the screens than thewide canyons. Fig. 17c and d show that the effect of the screensis rather independent on the observer position, owing to the factthat the screen is located outside the canyon. The low standarddeviation of the results also gives evidence to the weak positionand frequency dependence. The effect of the roof top screen islikely additive to in-canyon treatments.
4.4. Downward refraction for the shielded canyon
Fig. 19 shows the influence of a downward refracting atmo-sphere on the canyon observer levels, schemes D1 and D2. Forthe D1 scheme, the results are presented relative to the referencecanyon geometry, whereas for the D2 scheme, results are pre-sented with scheme A3 as reference. There are basically two effectsoccurring in the downward refracting case that explain the results(see Fig. 18).
(1) The role of the absence of canyon shielding. Whereas allwave contributions to canyon observer positions in thenon-refracting case are diffracted by the saddle roof, canyonobserver positions have direct or reflected wave contribu-
125 250 500 1000–14
–12
–10
–8
–6
–4
–2
0
frequency (Hz)
Δ L
ref (
dB)
0
2
4
6
8
10
12
14
stde
v (d
B)
LW LN BW BN–14
–12
–10
–8
–6
–4
–2
0
Δ L
ref (
dB(A
))
2520151050–12
–10
–8
–6
–4
–2
0
2
4
x–distance (m)
Δ L
ref (
dB(A
))
0
2
4
6
8
stde
v (d
B)
0 5 10 15 20 25–12
–10
–8
–6
–4
–2
0
2
4
height (m)
Δ L
ref (
dB(A
))
0
2
4
6
8
stde
v (d
B)
S1S2S3S4
Fig. 16. Average relative levels, DLref, for horizontal screens schemes in the shielded canyon. (a), (c) and (d) as in Fig. 11. The results in (b) are for scheme S4. Thick lines: DLref.Thin lines: standard deviation of DLref.
278 M. Hornikx, J. Forssén / Applied Acoustics 70 (2009) 267–283

Author's personal copy
tions in the calculated downward refracting case. Since can-yon shielding is stronger for the higher frequencies andlower observer positions, downward refraction is impairingfor these regions, see Fig. 19a and d.
(2) The role of multiple reflections. In the downward refractingcase, the angle of the incoming sound waves is such thatwaves are being reflected out of the canyon after a smallnumber of reflections, if reflections are being regarded asspecular. In the non-refracting case, waves diffracted bythe wedge top under low angles will reflect many times inthe canyon and excite the canyon modes very well. Theresult of this phenomenon is that the downward refracting
case can be favourable for low frequencies (see Fig. 19a)and high observer positions (see Fig. 19d), where canyonshielding is low in the non-refracting case.
The second effect also explains the fact that the influence ofdownward refracted sound waves on the façade absorptionscheme A3 is more impairing than on the reference canyon geom-etry, see Fig. 19; in a downward refracting case, the sound pressurelevel at the canyon observer positions is less influenced by thehigher order reflections than for the non-refracting case, makingfaçade treatments less effective. Finally, the first effect explainsthe difference between wide and narrow canyon results, see
125 250 500 1000–12
–10
–8
–6
–4
–2
0
frequency (Hz)
Δ L
ref (
dB)
0
2
4
6
stde
v (d
B)
LW LN BW BN–12
–10
–8
–6
–4
–2
0
Δ L
ref (
dB(A
))
2520151050–12
–10
–8
–6
–4
–2
0
x–distance (m)
Δ L
ref (
dB(A
))
0
2
4
6
stde
v (d
B)
0 5 10 15 20 25–12
–10
–8
–6
–4
–2
0
height (m)
Δ L
ref (
dB(A
))
0
2
4
6
stde
v (d
B)
S5S6
Fig. 17. Average relative levels, DLref, for the vertical screens schemes outside the shielded canyon. (a), (c) and (d) as in Fig. 11. The results in (b) are for scheme S6. Thick lines:DLref. Thin lines: standard deviation of DLref.
Fig. 18. Sketches of the two dominant effects under a downwind refracting atmosphere: (1) the absence of canyon shielding for canyon observer positions and (2) thedifferent number of reflections for the downwind refracting atmosphere and the non-refracting atmosphere.
M. Hornikx, J. Forssén / Applied Acoustics 70 (2009) 267–283 279

Author's personal copy
Fig. 19b, since the absence of canyon shielding is more relevant fornarrow canyons.
4.5. Average results and source canyon schemes
The results of all studied shielded canyon noise abatementschemes using the finite incoherent line source (FILS) are summa-rised in Table 3. The results for the source canyon schemes (FILSsc)as well as the results for the incoherent and coherent line sources(ILS and CLS) for shielded canyon schemes are also listed in thetable.
The standard deviations are given for the shielded canyon FILSresults and display what we have seen before: for in-canyon treat-ments, the standard deviation is larger for treatments with a largerreduction. The standard deviations are smaller for treatments out-side the canyon (i.e. grass roof and canyon roof screens).
For all in-canyon treatments, the source canyon treatments(FILSsc) give a larger effect than the shielded canyon treatments(FILS). The reason is that the sources for the source canyon treat-ments are located closer to the ground surface than the chosen ob-server positions for the shielded canyon treatments. When a singlesource canyon is dominating the sound pressure level at a shieldedcanyon, treatments in that particular source canyon are thus moreeffective than similar treatments in the shielded canyon itself formost observer positions.
For most shielded canyon treatments, the FILS results are in-be-tween the ILS and CLS results. Although the CLS was not expectedto give realistic results, calculation results show that the use of amore realistic FILS yields similar results. In addition, the effect ofabsorption treatments is larger using the ILS than using the FILS,and the vertical screen effects are rather similar for all sourcetypes. Furthermore, downward refraction is less unfavourable fornoise abatement for the ILS case since canyon shielding, as partiallyabsent by downward refraction, was smaller than for the FILS.
5. Conclusions
Noise abatement schemes for two real life courtyards in Göte-borg, shielded from direct road traffic noise, have been investi-gated numerically using the 2.5D equivalent sources method(2.5D ESM). The abatement schemes involve façade absorption,horizontal screens at façades, a vertical screen on the roof andgrass surfaces on ground and roof, all compared with the reallife courtyards as reference. The grass surfaces have been mod-elled as complex-valued impedances in the ESM. In addition, ef-fects of a downward refracting atmosphere have been studied.The courtyards have been modelled as long canyons. The resultstherefore represent the effect of noise abatement schemes forroad traffic noise sources outside an elongated shielded area. Aline source with a road traffic noise spectrum outside theshielded area has been used as the sound source. Calculationswith the chosen canyon geometries show that the source mod-elled as a coherent or incoherent line source represent extremesituations. The more realistic finite incoherent line source (FILS)has therefore been used here with a chosen length correspond-ing to an angular coverage of ±45�. The results of the noiseabatement schemes however show that the coherent line sourceresults are within 0.3 dB (A) of the FILS results.
The effects of the noise abatement schemes have been evalu-ated depending on frequency, observer position and height towidth ratio of the canyon geometries. Noise abatement schemesin the source canyon have been separately studied from schemesin the shielded canyon, with the following conclusions from thelatter study.
The sound pressure level in the reference canyon geometries isthe lowest for the lower observer positions in the canyon and forthe highest frequencies. Applying additional façade absorptionwith a frequency independent absorption coefficient can be con-cluded to yield a:
125 250 500 1000–6
–4
–2
0
2
4
6
frequency (Hz)
Δ L
ref (
dB)
0
4
8
12
stde
v (d
B)
2520151050–6
–4
–2
0
2
4
6
x–distance (m)
Δ L
ref (
dB(A
))
0
4
8
12
stde
v (d
B)
0 5 10 15 20 25–6
–4
–2
0
2
4
6
height (m)
Δ L
ref (
dB(A
))
0
4
8
12
stde
v (d
B)
LW LN BW BN–6
–4
–2
0
2
4
6
Δ L
ref (
dB(A
))
D1D2
Fig. 19. Average relative levels, DLref, for downward refraction in the shielded canyon calculation part. For D2, DLref = Lp,D2 � Lp,A3. (a), (c) and (d) as in Fig. 11. The results in (b)are for scheme D1. Thick lines: DLref. Thin lines: standard deviation of DLref.
280 M. Hornikx, J. Forssén / Applied Acoustics 70 (2009) 267–283
Author's personal copy
� larger level reduction for the lower canyon observer positions;� larger level reduction for the narrower canyons (although differ-
ences are smaller than 1 dB(A));� rather similar reduction over frequency.
For the situations studied here, a change of the façade absorp-tion coefficient, a, to 0.8 leads to a reduction of around 4 dB(A)for most canyon observer positions. From a study of the preferablefaçade absorber location, it can be concluded that absorption ap-plied in the upper part of the façades is slightly favourable for noiseabatement. A grass ground surface instead of an asphalt groundsurface amounts to an average reduction of 1 dB(A). A grass cov-ered saddle roof reduces the levels rather independently on thecanyon observer position by 2 dB(A).
A combination of horizontal screens, like walkways, andabsorption at the lower face of the screens has an effect thatstrongly decreases with canyon observer height. In addition, the ef-fect of horizontal screens is largest for the narrower canyons andmore effective for the lower frequencies when absorption has beenapplied. An average level reduction of 2.5 dB(A) is obtained for 1 mwide horizontal screens with absorption material underneaththem (a = 0.8). Applying a vertical screen at the top of the saddleroof is more cost effective than applying the horizontal screens; a1 m tall screen reduces the level for all canyon observer positionsby more than 4 dB(A). The effect of a vertical screen at the roof-top is slightly more effective for narrower canyon geometries.
For downward refracting conditions, the canyon shielding effectis partly cancelled for the highest frequencies and lowest observerpositions. For lower frequencies and high observer positions how-ever, downward refraction could result in lower levels. The narrowcanyons are, on average, the most negatively affected by down-ward refracting conditions. Also, a façade absorption treatment isless effective under downward refracting conditions.
The effect of the noise abatement schemes in the source canyon,for an observer outside the canyon, is larger than for shielded can-yon schemes owing to the low source positions. The relevance of asource canyon abatement scheme however depends on the contri-bution of this source canyon to the total noise level in the shieldedcanyon.
This study is limited to the chosen courtyard geometries mod-elled as 2D canyons. For a more accurate prediction of the effectof noise abatement schemes for a closed courtyard in a 3D sense,a 3D calculation model is necessary.
Acknowledgements
The work behind this paper has been supported by the SwedishFoundation for Strategic Environmental Research (MISTRA). Theauthors would like to thank Wolfgang Kropp for his ideas and fruit-ful discussions.
Appendix A. Validation of the 2.5D equivalent sources method(2.5D ESM) by scale model measurements
A 1–40 scale model study of parallel street canyons was exe-cuted to investigate the sound field in both streets [10], with a
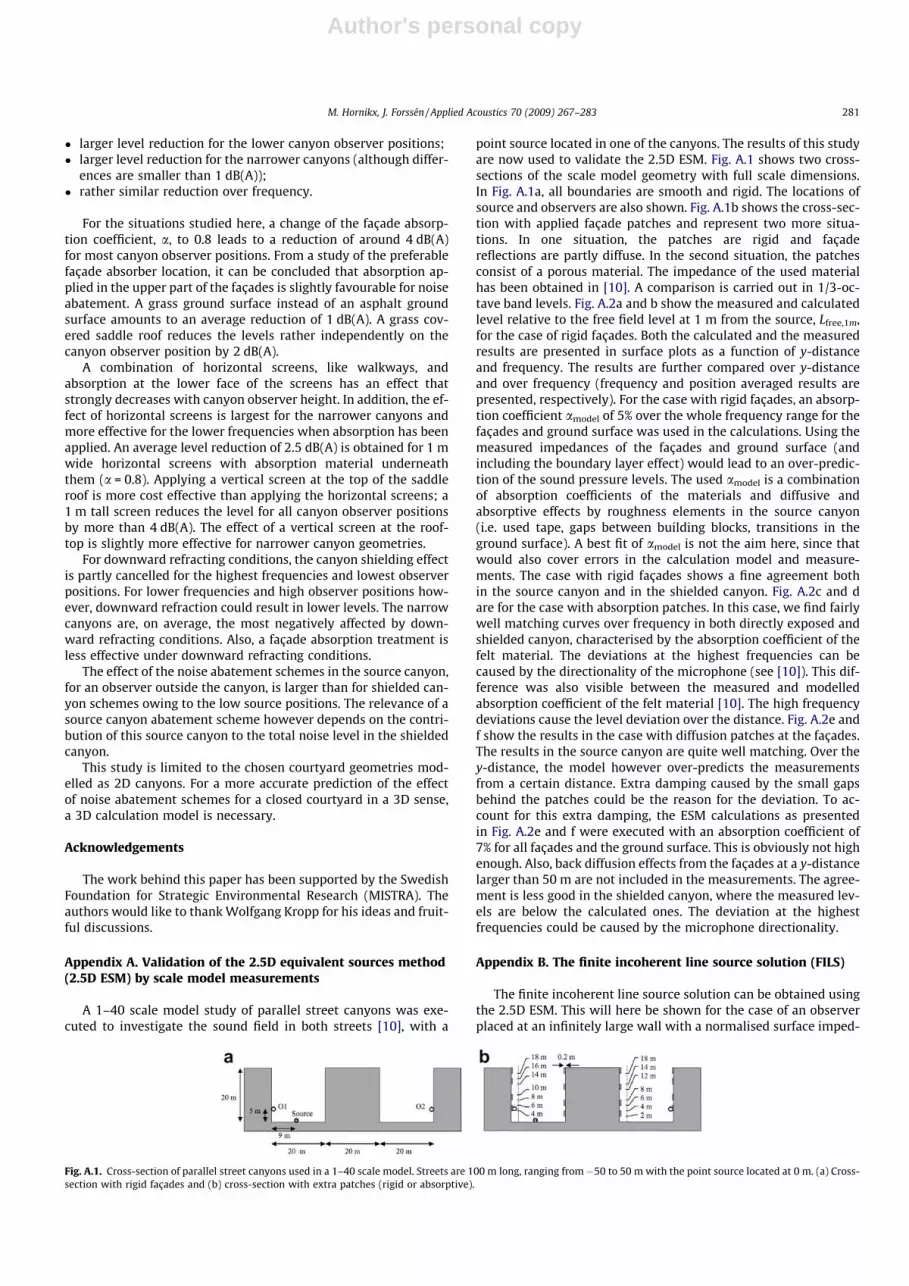
point source located in one of the canyons. The results of this studyare now used to validate the 2.5D ESM. Fig. A.1 shows two cross-sections of the scale model geometry with full scale dimensions.In Fig. A.1a, all boundaries are smooth and rigid. The locations ofsource and observers are also shown. Fig. A.1b shows the cross-sec-tion with applied façade patches and represent two more situa-tions. In one situation, the patches are rigid and façadereflections are partly diffuse. In the second situation, the patchesconsist of a porous material. The impedance of the used materialhas been obtained in [10]. A comparison is carried out in 1/3-oc-tave band levels. Fig. A.2a and b show the measured and calculatedlevel relative to the free field level at 1 m from the source, Lfree,1m,for the case of rigid façades. Both the calculated and the measuredresults are presented in surface plots as a function of y-distanceand frequency. The results are further compared over y-distanceand over frequency (frequency and position averaged results arepresented, respectively). For the case with rigid façades, an absorp-tion coefficient amodel of 5% over the whole frequency range for thefaçades and ground surface was used in the calculations. Using themeasured impedances of the façades and ground surface (andincluding the boundary layer effect) would lead to an over-predic-tion of the sound pressure levels. The used amodel is a combinationof absorption coefficients of the materials and diffusive andabsorptive effects by roughness elements in the source canyon(i.e. used tape, gaps between building blocks, transitions in theground surface). A best fit of amodel is not the aim here, since thatwould also cover errors in the calculation model and measure-ments. The case with rigid façades shows a fine agreement bothin the source canyon and in the shielded canyon. Fig. A.2c and dare for the case with absorption patches. In this case, we find fairlywell matching curves over frequency in both directly exposed andshielded canyon, characterised by the absorption coefficient of thefelt material. The deviations at the highest frequencies can becaused by the directionality of the microphone (see [10]). This dif-ference was also visible between the measured and modelledabsorption coefficient of the felt material [10]. The high frequencydeviations cause the level deviation over the distance. Fig. A.2e andf show the results in the case with diffusion patches at the façades.The results in the source canyon are quite well matching. Over they-distance, the model however over-predicts the measurementsfrom a certain distance. Extra damping caused by the small gapsbehind the patches could be the reason for the deviation. To ac-count for this extra damping, the ESM calculations as presentedin Fig. A.2e and f were executed with an absorption coefficient of7% for all façades and the ground surface. This is obviously not highenough. Also, back diffusion effects from the façades at a y-distancelarger than 50 m are not included in the measurements. The agree-ment is less good in the shielded canyon, where the measured lev-els are below the calculated ones. The deviation at the highestfrequencies could be caused by the microphone directionality.
Appendix B. The finite incoherent line source solution (FILS)
The finite incoherent line source solution can be obtained usingthe 2.5D ESM. This will here be shown for the case of an observerplaced at an infinitely large wall with a normalised surface imped-
Fig. A.1. Cross-section of parallel street canyons used in a 1–40 scale model. Streets are 100 m long, ranging from �50 to 50 m with the point source located at 0 m. (a) Cross-section with rigid façades and (b) cross-section with extra patches (rigid or absorptive).
M. Hornikx, J. Forssén / Applied Acoustics 70 (2009) 267–283 281

Author's personal copy
ance Z. An incoherent line source is located at x, the shortest dis-tance to the observer, and the maximum transverse distance tothe observer is ymax (see Fig. B.1). Both source and observer areplaced at a hard ground surface. The finite incoherent line sourcelevel (re. 1 Pa) now reads
LFILSðx;0; 0Þ ¼ 10 logZ ymax
�ymax
jð1þ RÞG3Dðx; ys;0Þj2dys
!
¼ 10 logZ ymax
�ymax
j1þ Rj2
x2 þ y2s
dys
!ðB:1Þ
with half-space G3D the Green’s function of the inhomogeneous 3DHelmholtz equation with source strength 2p and R the plane wave
reflection coefficient, (Z cos(h) � 1)/(Z cos(h) + 1), which is the lo-cally reacting far field approximation. The integration variable willnow be changed to h. Using the relation y = x tan(h), we find
LFILSðx;0;0Þ ¼ 10 logZ hmax
�hmax
j1þ Rj2 secðhÞ2
x secðhÞ2dh
!
¼ 10 logZ hmax
�hmax
j1þ Rj2
xdh
!: ðB:2Þ
We will now show that this solution for a finite incoherent line sourcecan be calculated using a 2.5D calculation method. In a 2.5D calcula-tion method (the 2.5D ESM has been used in the paper), we have aFourier transform pair (see [10]). Using Parseval’s theorem, we cancalculate the incoherent line source level, denoted by LILS,ESM
LILS;ESMðx;0; 0Þ ¼ 10 log1
2p
Z 1
�1jð1þ RESMÞG2Dðx;K;0Þj2dky
� �ðB:3Þ
with K ¼ffiffiffiffiffiffiffiffiffiffiffiffiffiffiffiffik2 � k2
y
q, the wave number ky is the projection of k onto
the y-axis such that ky = ksin(h) and the reflection coefficient RESM
is the plane wave reflection coefficient using the impedance Z2D
as in the 2.5D ESM [9]
RESM ¼Z2D � 1Z2D þ 1
¼Kk Z � 1Kk Z þ 1
: ðB:4Þ
125250
5001000
010
2030
40
–40–30–20–10
0
Δ Lfree,1m
(dB) measured
125250
5001000
010
2030
40
–40–30–20–10
0
Δ Lfree,1m
(dB) 2.5D ESM
0 10 20 30 40–40
–30
–20
–10
0
Δ Lfree,1m
(dB(A))
125 250 500 1000–40
–30
–20
–10
0
Δ Lfree,1m
(dB)
125250
5001000
010
2030
40
–70–60–50–40–30
125250
5001000
010
2030
40
–70–60–50–40–30
0 10 20 30 40–70
–60
–50
–40
–30
125 250 500 1000–70
–60
–50
–40
–30
125250
5001000
010
2030
40
–40–30–20–10
0
125250
5001000
010
2030
40
–40–30–20–10
0
0 10 20 30 40–40
–30
–20
–10
0
125 250 500 1000–40
–30
–20
–10
0
125250
5001000
010
2030
40
–70–60–50–40–30
125250
5001000
010
2030
40
–70–60–50–40–30
0 10 20 30 40–70
–60
–50
–40
–30
125 250 500 1000–70
–60
–50
–40
–30
125250
5001000
010
2030
40
–40–30–20–10
0
125250
5001000
010
2030
40
–40–30–20–10
0
0 10 20 30 40–40
–30
–20
–10
0
125 250 500 1000–40
–30
–20
–10
0
125250
5001000
010
2030
40
–70–60–50–40–30
frequency (Hz)
125250
5001000
010
2030
40
–70–60–50–40–30
y–distance (m)0 10 20 30 40
–70
–60
–50
–40
–30
ydistance (m)–
125 250 500 1000–70
–60
–50
–40
–30
frequency (Hz)
Fig. A.2. Comparison between results from a scale model study and 2.5D ESM calculations. (a) Rigid façades, observer position O1, (b) rigid façades, observer position O2, (c)façades with absorption patches, observer position O1, (d) façades with absorption patches, observer position O2, (e) façades with diffusion patches, observer position O1, and(f) façades with diffusion patches, observer position O2. Circles: measurements and solid lines: 2.5D ESM results.
Fig. B.1. Finite incoherent line source calculation setup. Observer placed at an in-finitely large wall with normalized surface impedance Z.
282 M. Hornikx, J. Forssén / Applied Acoustics 70 (2009) 267–283
Author's personal copy
We approximate G2D(x,K, 0) by its far field approximationG2Dðx;K;0Þ ¼ p=j �
ffiffiffiffiffiffiffiffiffiffiffiffiffiffiffiffiffiffið2=KxpÞ
pe�jKxejp=4 and use integration limits
�ky,max and ky,max to get the finite incoherent line source level
LFILS;ESMðx;0; 0Þ ¼ 10 log1
2p
Z ky;max
�ky;max
jð1þ RESMÞG2Dðx;K;0Þj2dky
!
¼ 10 logZ ky;max
�ky;max
j1þ RESMj2
Kxdky
!: ðB:5Þ
As for the calculation of the first finite incoherent line source level,we will here substitute the integration variable to h
LFILS;ESMðx;0; 0Þ ¼ 10 logZ hmax
�hmax
j1þ RESMj2 cosðhÞkKx
dh
!
¼ 10 logZ hmax
�hmax
j1þ RESMj2 cosðhÞffiffiffiffiffiffiffiffiffiffiffiffi1� k2
y
k2
rx
dh
0BB@
1CCA
¼ 10 logZ hmax
�hmax
j1þ RESMj2
xdh
!: ðB:6Þ
Since RESM = R for ky = ksin(h), both methods are identical. Since thelatter method is based on solutions of the 2D Helmholtz equation,whereas the former is based on solutions of the 3D Helmholtz equa-tion, the latter is much less time consuming than the former in thecanyon geometries of this paper. Note that, since ky,max has beenkept constant during 2.5D ESM calculations, the line source lengthvirtually increases for image source contributions.
References
[1] Berglund B, Lindvall T, Schwela D, editors. Guidelines for communitynoise. Geneva: World Health Organization (WHO); 2000.
[2] Öhrström E, Skånberg A, Svensson H, Gidlof-Gunnarsson A. Effects of roadtraffic noise and the benefit of access to quietness. J Sound Vib2006;295(1):40–59.
[3] The Swedish Research Programme Soundscape Support to Health.<www.soundscape.nu>.
[4] Data obtained from the environmental administration of Göteborg.<www.miljo.goteborg.se>.
[5] Thorsson PJ, Ögren M, Kropp W. Noise levels on the shielded side in cities usinga flat city model. Appl Acoust 2004;65(4):313–23.
[6] Van Renterghem T, Botteldooren D. Numerical simulation of soundpropagation over rows of houses in the presence of wind. In: Proceedings ofthe 10th international conference on sound and vibration, Stockholm, Sweden;2003. p. 1381–8.
[7] Ögren M, Kropp W. Road traffic noise propagation between two dimensionalcity canyons using an equivalent sources approach. Acust Acta Acust2004;90(2):293–300.
[8] Jean P, Defrance J, Gabillet Y. The importance of source type on the assessmentof noise barriers. J Sound Vib 1999;226(2):201–16.
[9] Hornikx M, Forssén J. The 2.5-dimensional equivalent sources method fordirectly exposed and shielded urban canyons. J Acoust Soc Am2007;122(5):2532–41.
[10] Hornikx M, Forssén J. A scale model study of parallel urban canyons. Acust ActaAcust 2008;94(2):265–81.
[11] Van Renterghem T, Salomons E, Botteldooren D. Parameter study of soundpropagation between city canyons with a coupled FDTD-PE model. ApplAcoust 2006;67(6):487–510.
[12] Ögren M. Prediction of traffic noise shielding by city canyons. Göteborg, Ph.D.thesis. Chalmers University of Technology; 2004.
[13] Ögren M, Forssén J. Modelling of a city canyon problem in a turbulentatmosphere using an equivalent sources approach. Appl Acoust2004;65(6):629–42.
[14] Traffic flow data obtained from the traffic agency of the GöteborgMunicipality. <www.trafikkontoret.goteborg.se/Statistik/>.
[15] Photo material obtained from the Building Department of the GöteborgMunicipality.
[16] Delany ME, Bazley EN. Acoustical properties of fibrous absorbent materials.Appl Acoust 1970;3(2):105–16.
[17] Cox TJ, D’Antonio P. Acoustic absorbers and diffusers: theory, design andapplication. Spon Press; 2004.
[18] Brandt O. Akustisk Planering, Handbok nr 1 Statens Nämd förByggnadsforskning, Stockholm; 1958 [in Swedish].
[19] Jonasson H, Storeheier S. Nord 2000. New Nordic Prediction Method for RoadTraffic Noise. SP Rapport 2001:10, Borås, Sweden; 2001.
[20] Morse P, Feshbach H. Method of theoretical physics. McGraw-Hill; 1953. p.1369.
[21] Van Renterghem T, Salomons E, Botteldooren D. Efficient FDTD-PE model forsound propagation in situations with complex obstacles and wind profiles.Acust Acta Acust 2005;91(4):671–9.
[22] Hadden JW, Pierce AD. Sound diffraction around screens and wedges forarbitrary point source locations. J Acoust Soc Am 1981;69(5):1266–76[Erratum, J Acoust Soc Am 1982;71(5):1290].
[23] Salomons EM. Computational atmospheric acoustics. Dordrecht: KluwerAcademic Publishers; 2001.
M. Hornikx, J. Forssén / Applied Acoustics 70 (2009) 267–283 283