nitrogen losses from entire plants of spring wheat ( triticum aestivum) from tillering to maturation
TRANSCRIPT
ELSEVIER
EuropeanJournal ofAgronomy
European Journal of Agronomy 13 (2000) 101-110www.elsevier.corn/Iocate/eja
Nitrogen losses from entire plants of spring wheat (Triticumaestivum) from tillering to maturation
Evan Rroco, Konrad Mengel *Institute of Plant Nutrition, Justus-Liebig-Unioersity, Siidanlage 6, 35390, Giessen, Germany
Received 19 February 1999; received in revised form 26 July 1999; accepted 9 November 1999
Abstract
The release of nitrogen by roots of intact spring wheat plants into the soil and other losses, mainly of volatile N,have been investigated in two subsequent years from tillering until maturation, by use of a new technique for plantlabelling with 15N. Plants were at first labelled by growing them in a 15N nutrient solution until tillering and then afterthoroughly washing the roots with distilled water, the entire plants were transplanted into pots filled with a silty loam.15N release was analysed throughout the growth of the plants at 6 days after transplantation (tillering), ear emergence,beginning of grain filling, and full maturation. At these stages 15N was analysed in the plant and in the soil. Releaserates of labelled N into the soil were low in the period from tillering to ear emergence and increased progressivelyattaining maximum rates in the phase from ear emergence to grain filling. The non-accounted for losses of labelledN, mainly volatile losses, were also found to be highest from ear emergence to the beginning of grain filling. © 2000Elsevier Science B.V. All rights reserved.
Keywords: Nitrogen; N release by roots; Wheat; N loss
1. Introduction
As yet little is known in quantitative terms ofthe loss of nitrogen from entire plants at variousstages throughout their growth. Different formsof N loss may be distinguished, such as N recy-cled by plant roots into the soil, N released byupper plant parts into the atmosphere, mainly asgases such as NH3 and NOx (Farquhar et a!.,
* Corresponding author. Tel.: + 49-6403-62313; fax: + 49-6403-62313.
E-mail address:[email protected](K. Mengel).
1983), and the loss of N by the removal of plantparts as pollen, flowers, leaves and fruits (Wetse-laar and Farquhar, 1980). Nitrogen loss may alsooccur by leaching of N from upper plant parts,e.g. by rainfall. The quantitative evaluation ofthese losses is of fundamental importance in es-tablishing reliable N balance sheets. Nitrogen re-lease from plant roots into soil has been studiedby various authors and losses have been found torange from 6 to 33% of the total plant N (Janzen,1990; Lynch and Whipps, 1990; Janzen and Bru-insma, 1993; Reining et a!., 1995; Toussaint et a!.,1995). This wide variation in results may partly beaccounted for by different experimental condi-
I1161-0301/00/$ - see front matter © 2000 Elsevier Science B.V. All rights reserved.PH: S1161-0301 (00)00068-X
102 E. Rroco, K. Mengel / Europ. J. Agronomy 13 (2000) 101-110
tions but additionally it may originate from thedifferent experimental techniques used.
In order to distinguish between the soil Nandroot borne N, plant N must be labelled and this isgenerally done using 15N. Reining et al. (1995)used the 'split-root-technique' in order to label theplant N. This method allows the precise quantifi-cation of released N from the root part not incontact with the labelled soil N. This procedure,however, does not allow the quantitative determi-nation of labelled N released by the entire rootsystem. Janzen and Bruinsma (1989) labelled theirplants by the uptake of 15NH3by the upper plantparts. Unfortunately the amount of labelled Ntaken up is small and therefore it is difficult toquantify the release of labelled N by the rootsover longer periods of time. Since the labellingmethods used to date all have their shortcomings(Palta et aI., 1991), we have developed a newtechnique for labelling entire plants with 15Nwhich is particularly suitable for measuring Nlosses from tillering until maturation. The princi-ple of our method is the labelling of seedlings in15N nutrient solution prior to planting into potsfilled with soil.
The objective of our investigation was to quan-tify the labelled N released from intact wheatroots into the soil as well as other losses mainlyinto the atmosphere at distinct growth stages ofthe plants: tillering, ear emergence, beginning ofgrain filling, and maturation.
2. Materials and method
The experiments were carried out in 1997 and1998. In the 1st year the plants were cultivated in
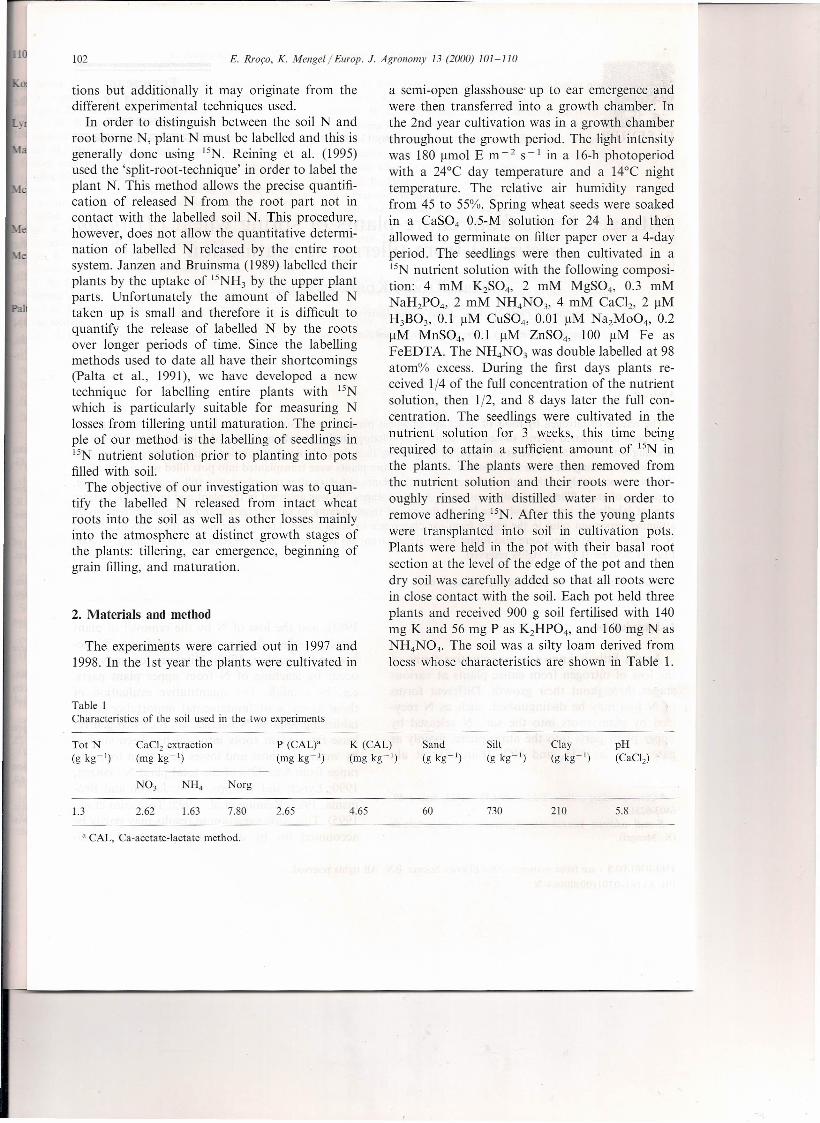
Table 1Characteristics of the soil used in the two experiments
a semi-open glasshouse' up to ear emergence andwere then transferred into a growth chamber. Inthe 2nd year cultivation was in a growth chamberthroughout the growth period. The light intensitywas 180 umol E m-2 S-l in a 16-h photoperiodwith a 24°C day temperature and a 14°C nighttemperature. The relative air humidity rangedfrom 45 to 55%. Spring wheat seeds were soakedin a CaS04 0.5-M solution for 24 h and thenallowed to germinate on filter paper over a 4-dayperiod. The seedlings were then cultivated in alsN nutrient solution with the following composi-tion: 4 mM K2S04, 2 mM MgS04, 0.3 mMNaH2P04, 2 mM NH4N03, 4 mM CaCI2, 2 J.1MH3B03, 0.1 J.1MCuS04, 0.01 J.1MNa2Mo04, 0.2J.1M MnS04, 0.1 J.1M ZnS04, 100 J.1M Fe asFeEDTA. The NH4N03 was double labelled at 98atom% excess. During the first days plants re-ceived 1/4 of the full concentration of the nutrientsolution, then 1/2, and 8 days later the full con-centration. The seedlings were cultivated in thenutrient solution for 3 weeks, this time beingrequired to attain a sufficient amount of 15N inthe plants. The plants were then removed fromthe nutrient solution and their roots were thor-oughly rinsed with distilled water in order toremove adhering lsN. After this the young plantswere transplanted into soil in cultivation pots.Plants were held in the pot with their basal rootsection at the level of the edge of the pot and thendry soil was carefully added so that all roots werein close contact with the soil. Each pot held threeplants and received 900 g soil fertilised with 140mg K and 56 mg P as K2HP04, and 160 mg N asNH4N03. The soil was a silty loam derived fromloess whose characteristics are shown in Table 1.
P (CAL)a(mg kg : ')
K (CAL)(mg kg"')
CaClz extraction(mg kg-I)
Norg
1.3 2.62 2.65 601.63 7.80 4.65 730 5.8210
a CAL, Ca-acetate-lactate method.
E. Rroco, K. Mengel I Europ, J. Agronomy 13 (2000) 1OJ-110
Since the plants had to grow for 3 weeks innutrient solution and because of the high cost of15N it was decided not to change the nutrientsolution and thus discard the 1sN, but to add thenitrogen to the nutrient solution according to itsuptake by the plants.
It is known that nitrogen uptake by plants hasan impact on the pH of the nutrient solution,ammonium uptake depressing the solution pHand nitrate uptake raising it (Mengel et al., 1983).According to this finding preferential utilisationof ammonium in the nutrient solution is associ-ated with a pH decrease and likewise that ofnitrate is indicated by an increase in pH in thenutrient solution. In order to confirm this rela-tionship for our experimental set-up a preliminaryexperiment was carried out with 104 spring wheatseedlings which were set in a 20-1plastic containerand cultivated in the nutrient solution describedabove with the exception that the nitrogen wasnot labelled with 1sN. Cultivation lasted 22 daysand during this period, pH of the nutrient solu-tion was measured twice a day and the pH wasadjusted to the initial pH level by adding KOH orH2S04 0.1 M, respectively. At the same timesamples were taken from the nutrient solution todetermine the ammonium and nitrate concentra-tions. The volume of nutrient solution was filledup twice a day to 20 1 by adding distilled water.
The total N content in the plants (roots +shoots) of the preliminary experiment wasanalysed by the Kjeldahl method and the NHtand NO; concentrations in nutrient solution werealso ana lysed by the Kjeldahl method using MgOfor distillation and Devarda alloy for reduction ofnitrate.
The 15Nrelease into the soil in the 15Nexperi-ments was analysed at tillering, ear emergence,beginning of grain filling and full maturation. Ateach development stage plants of two pots wereharvested and analysed. In one pot shoots androots were ana lysed separately for total Nand15N after the soil was washed carefully from theroots. In the other pot roots + soil were takentogether, ground and ana lysed for 1sN enrichmentand total N. 15Nof this pot + the 15Nin the shootgave the total amount of 15N in the soil-plantsystem. The 15N amounts released into the soilwere calculated according the following equation:
103
15Nreleased in the soil =
[15N(soil+ roots) + 15Nshoots]
- eSN shoots + 15Nroots] (1)
Losses unaccounted for which could not bemeasured directly were calculated according tothe second equation:
Unaccounted for losses =
{ISN(soil+ roots) + 15Nshoots} at tillering
- {15N(soil+ roots) + 15Nshoots}
at different growth stages (2)
These losses include gaseous N losses and lossesof plant material.
According to Handley and Raven (1992) en-zymes discriminate 15Nrelative to 14Nwhich maylead to difference in J 15Nof maximum 12%0.Thismeans that in an enzymic reaction the quantity ofa 15N metabolite converted is ~ 1% lower thanthe same amount of a 14N analogue metabolite.Assuming that 15N nitrate assimilation and fur- .ther conversions of the 15N metabolite wouldcomprise the reactions nitrate reduction, nitritereduction, ammonium assimilation and polypep-tide synthesis (four reactions), the discriminationwould be ~ 4% and the data found would be 4%lower than the real amount. In the case of ammo-nium assimilation the discrimination would be~ 2% since here the steps of nitrate and nitritereductions are not involved. This small differencehas no major impact on our results and theconclusions drawn.
The washing of soil from roots was done verycarefully in order to keep to a minimum the lossesof plant material. This process was carried outusing a very slight water flow, over a sieve systemcontaining two sieves the first of 1 mm and thesecond of 0.15 mm. The separated root pieces,were collected in the two sieves and put togetherwith the other roots. To quantify the possiblelosses of labelled N through root washing a finersieve of 0.06 mm was tested for some pots forplants harvested at the beginning of grain fillingand full maturation. This test showed that usingthe 0.06-mm sieve only 0.026 and 0.084 mg 15Npot - 1 were recovered at the beginning of grain
104 E. Rroco, K. Mengel iEurop. J. Agronomy 13 (2000) 101-110
50.------------------------------------------------------,8
· N \\N~\\'\ \ \: lAddition of 1/1 cone. sol. 4:Jl
+
45
_40'01b, 35Ec: 30o:;:;;j
'0 25III
C.s 20.l:;;j
c 15.Sz
Addition of 1/2 cone. sol.
10
·3
10 12Days
OL---~~~~~L---~--~----~~~------~~~~--~.·-o222014 16 18
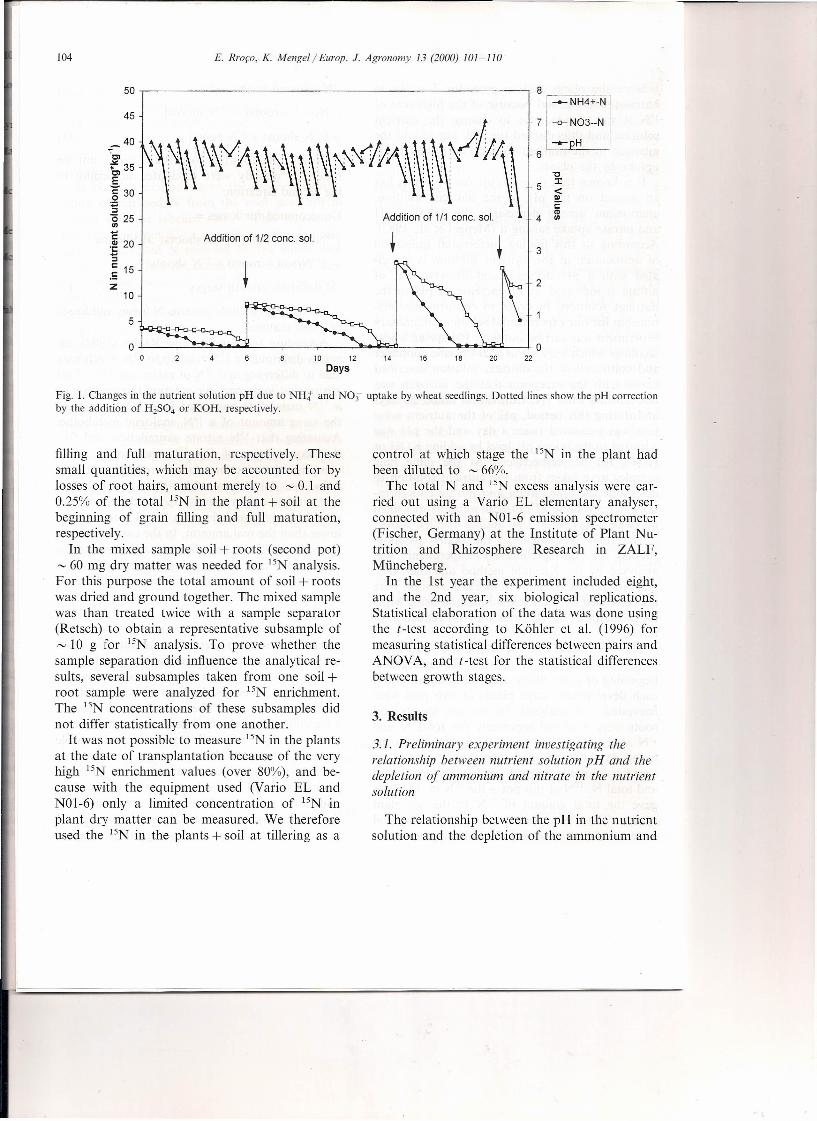
Fig. 1. Changes in the nutrient solution pH due to NHt and NO) uptake by wheat seedlings. Dotted lines show the pH correctionby the addition of H2S04 or KOH, respectively.
filling and full maturation, respectively. Thesesmall quantities, which may be accounted for bylosses of root hairs, amount merely to ~ 0.1 and0.25% of the total 15N in the plant + soil at thebeginning of grain filling and full maturation,respectively.
In the mixed sample soil + roots (second pot)~ 60 mg dry matter was needed for 15N analysis.For this purpose the total amount of soil + rootswas dried and ground together. The mixed samplewas than treated twice with a sample separator(Retsch) to obtain a representative subsample of~ 10 g for J5N analysis. To prove whether thesample separation did influence the analytical re-sults, several subsamples taken from one soil +root sample were analyzed for 15N enrichment.The 15N concentrations of these subsamples didnot differ statistically from one another.
It was not possible to measure 15N in the plantsat the date of transplantation because of the veryhigh 15N enrichment values (over 80%), and be-cause with the equipment used (Vario EL andNOI-6) only a limited concentration of 15N inplant dry matter can be measured. We thereforeused the 15N in the plants + soil at tillering as a
control at which stage the 15N in the plant hadbeen diluted to ~ 66'%.
The total Nand 15N excess analysis were car-ried out using a Vario EL elementary analyser,connected wi th an NO1-6 emission spectrometer(Fischer, Germany) at the Institute of Plant Nu-trition and Rhizosphere Research in ZALF,M imcheberg.
In the 1st year the experiment included eight,and the 2nd year, six biological replications.Statistical elaboration of the data was done usingthe t-test according to Kohler et al. (1996) formeasuring statistical differences between pairs andANOVA, and t-test for the statistical differencesbetween growth stages.
3. Results
3.1. Preliminary experiment investigating therelationship between nutrient solution pH and thedepletion of ammonium and nitrate in the nutrientsolution
The relationship between the pH in the nutrientsolution and the depletion of the ammonium and
E. Rroco, K. Mengel i Europ, 1. Agronomy 13 (2000) 101-110
nitrate in the nutrient solution is shown in Fig. 1for the three nutrient concentration levels applied:1/4, 1/2 and full strength nutrient solution. In allthree cases the concentration of ammonium de-clined and as soon as the ammonium concentrationattained zero level a stronger decline of the nitrateconcentration was found. From this pattern it isclear that ammonium was preferentially taken upby plants. Ammonium uptake was associated witha pH decrease, nitrate uptake in the later phasewith a pH increase of the nutrient solution. Hencethe pH increase indicated that the N in the nutrientsolution was going to be depleted and new additionof 15N in the form of ammonium nitrate wasrequired.
3.2. 15N release into the soil and unaccounted forlosses
Table 2 shows the cumulative 15N amountsreleased into the soil and losses measured indirectlyby difference (Eq. (2)) for the 1st and 2nd years.The difference found at tillering between 15N in theplant and 15N in the plant + soil was not statisti-cally significant, while these differences at later
105
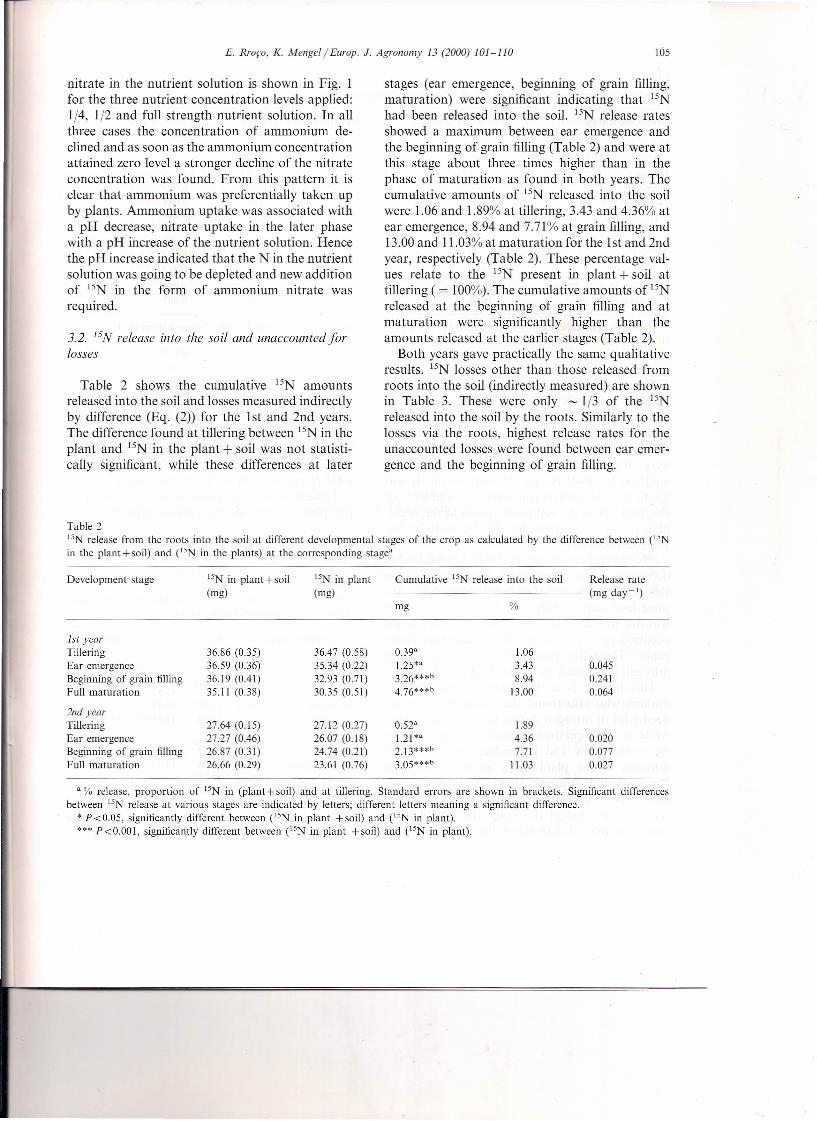
stages (ear emergence, beginning of grain filling,maturation) were significant indicating that 15N
had been released into the soil. 15N release ratesshowed a maximum between ear emergence andthe beginning of grain filling (Table 2) and were atthis stage about three times higher than in thephase of maturation as found in both years. Thecumulative amounts of 15N released into the soilwere l.06 and l.89% at tillering, 3.43 and 4.36% atear emergence, 8.94 and 7.71% at grain filling, and13.00 and 1l.03% at maturation for the 1st and 2ndyear, respectively (Table 2). These percentage val-ues relate to the 15N present in plant + soil attillering ( = 100%).The cumulative amounts of 15N
released at the beginning of grain filling and atmaturation were significantly higher than theamounts released at the earlier stages (Table 2).
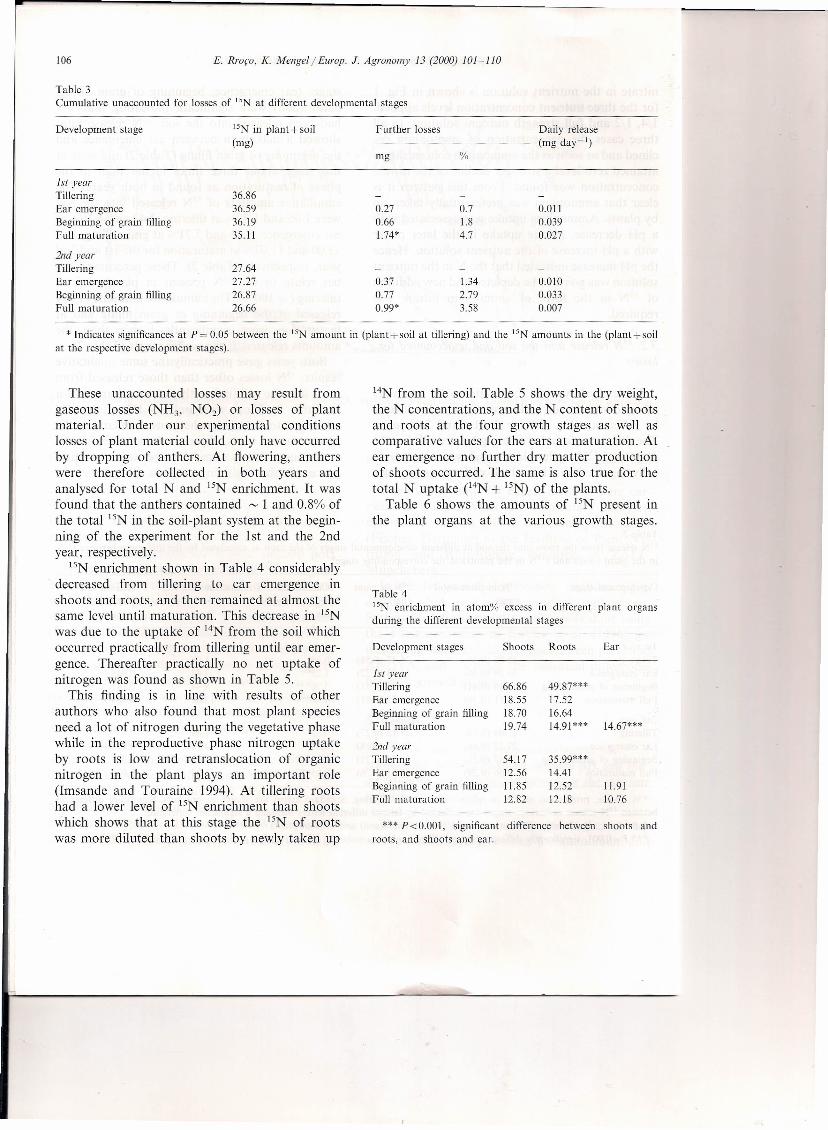
Both years gave practically the same qualitativeresults. 15N losses other than those released fromroots into the soil (indirectly measured) are shownin Table 3. These were only ~ 1/3 of the 15N
released into the soil by the roots. Similarly to thelosses via the roots, highest release rates for theunaccounted losses were found between ear emer-gence and the beginning of grain filling.
Table 215N release from the roots into the soil at different developmental stages of the crop as calculated by the difference between (' 5Nin the plant-j-soil) and ('5N in the plants) at the corresponding stage"
Development stage 15N in plant + soil I5N in plant Cumulative 15 release into the soil Release rate(mg) (mg) (mg day-I)
mg %
1st yearTillering 36.86 (0.35) 36.47 (0.58) 0.39a 1.06Ear emergence 36.59 (0.36) 35.34 (0.22) 1.25*a 3.43 0.045Beginning of grain filling 36.19 (0.41) 32.93 (0.71) 3.26***b 8.94 0.241Full maturation 35.11 (0.38) 30.35 (0.51) 4.76***b 13.00 0.064
2nd yearTillering 27.64 (0.15) 27.12 (0.27) 0.52a 1.89Ear emergence 27.27 (0.46) 26.07 (0.18) 1.21 *a 4.36 0.020Beginning of grain filling 26.87 (0.31) 24.74 (0.21) 2.13***b 7.71 0.077Full maturation 26.66 (0.29) 23.61 (0.76) 3.05***b 11.03 0.027
a % release, proportion of 15N in (plant+ soil) and at tillering, Standard errors are shown in brackets. Significant differencesbetween 15N release at various stages are indicated by letters; different letters meaning a significant difference.
* P<O.05, significantly different between ('5N in plant {-soil) and ('5N in plant).*** P<O.OOI, significantly different between ('5N in plant +soil) and (15N in plant).
106 E. Rroco, K. Mengel/ Europ. J. Agronomy 13 (2000) 101-110
Table 3Cumulative unaccounted for losses of 15N at different developmental stages
Development stage 15N in plant -l-soil Further losses Daily release(mg) (mg day-I)
mg %
1st yearTillering 36.86Ear emergence 36.59 0.27 0.7 0.011Beginning of grain filling 36.19 0.66 1.8 0.039Full maturation 35.11 1.74* 4.7 0.027
2nd yearTillering 27.64Ear emergence 27.27 0.37 1.34 0.010Beginning of grain filling 26.87 0.77 2.79 0.033Full maturation 26.66 0.99* 3.58 0.007
* Indicates significances at P = 0.05 between the 15N amount in (plant-s-soil at tillering) and the 15N amounts in the (plant + soilat the respective development stages).
These unaccounted losses may result fromgaseous losses (NH3' N02) or losses of plantmaterial. Under our experimental conditionslosses of plant material could only have occurredby dropping of anthers. At flowering, antherswere therefore collected in both years andanalysed for total Nand 15N enrichment. It wasfound that the anthers contained ~ 1 and 0.8% ofthe total 15N in the soil-plant system at the begin-ning of the experiment for the 1st and the 2ndyear, respectively.
15N enrichment shown in Table 4 considerablydecreased from tillering to ear emergence inshoots and roots, and then remained at almost thesame level until maturation. This decrease in 15Nwas due to the uptake of 14N from the soil whichoccurred practically from tillering until ear emer-gence. Thereafter practically no net uptake ofnitrogen was found as shown in Table 5.
This finding is in line with results of otherauthors who also found that most plant speciesneed a lot of nitrogen during the vegetative phasewhile in the reproductive phase nitrogen uptakeby roots is low and retranslocation of organicnitrogen in the plant plays an important role(Imsande and Touraine 1994). At tillering rootshad a lower level of 15N enrichment than shootswhich shows that at this stage the 15N of rootswas more diluted than shoots by newly taken up
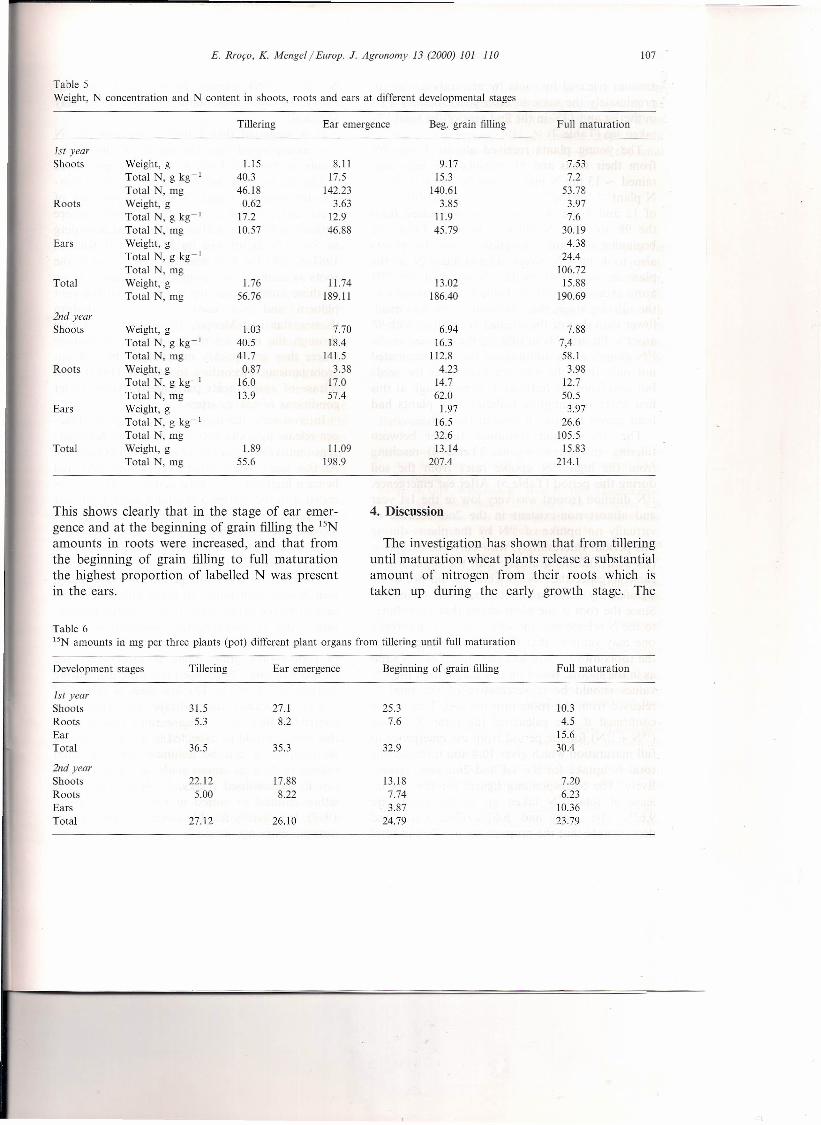
14N from the soil. Table 5 shows the dry weight,the N concentrations, and the N content of shootsand roots at the four growth stages as well ascomparative values for the ears at maturation. Atear emergence no further dry matter productionof shoots occurred. The same is also true for thetotal N uptake e4N + 15N) of the plants.
Table 6 shows the amounts of 15N present inthe plant organs at the various growth stages.
Table 415N enrichment in atom% excess in different plant organsduring the different developmental stages
Development stages Shoots Roots Ear
1st yearTillering 66.86 49.87***Ear emergence 18.55 17.52Beginning of grain filling 18.70 16.64Full maturation 19.74 14.91*** 14.67***
2nd yearTillering 54.17 35.99***Ear emergence 12.56 14.41Beginning of grain filling 11.85 12.52 11.91Full maturation 12.82 12.18 10.76
*** P<O.OOI, significant difference between shoots androots, and shoots and ear.
E. Rroco, K. Mengei f Europ, J. Agronomy 13 (2000) 101-110 107
Table 5Weight, N concentration and N content in shoots, roots and ears at different developmental stages
Tillering Ear emergence Beg. grain filling Full maturation
1st yearShoots Weight, g 1.15 8.11 9.17 7.53
Total N, g kg-1 40.3 17.5 15.3 7.2Total N, mg 46.18 142.23 140.61 53.78
Roots Weight, g 0.62 3.63 3.85 3.97Total N, g kg-1 17.2 12.9 11.9 7.6Total N, mg 10.57 46.88 45.79 30.19
Ears Weight, g 4.38Total N, g kg-1 24.4Total N, mg 106.72
Total Weight, g 1.76 11.74 13.02 15.88Total N, mg 56.76 189.11 186.40 190.69
2nd yearShoots Weight, g 1.03 7.70 6.94 7.88
Total N, g kg-1 40.5 18.4 16.3 7,4Total N, mg 41.7 141.5 112.8 58.1
Roots Weight, g 0.87 3.38 4.23 3.98Total N, g kg-1 16.0 17.0 14.7 12.7Total N, mg 13.9 57.4 62.0 50.5
Ears Weight, g 1.97 3.97Total N, g kg-1 16.5 26.6Total N, mg 32.6 105.5
Total Weight, g 1.89 11.09 13.14 15.83Total N, mg 55.6 198.9 207.4 214.1
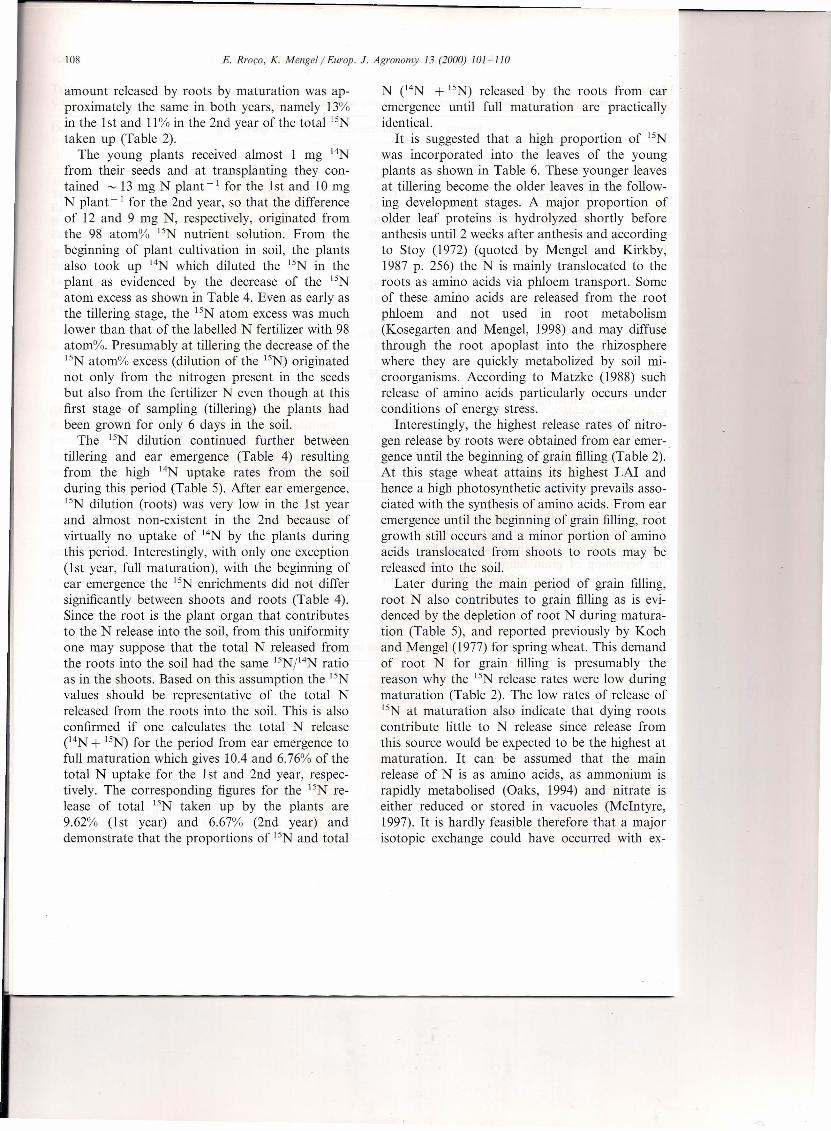
This shows clearly that in the stage of ear emer-gence and at the beginning of grain filling the 15N
amounts in roots were increased, and that fromthe beginning of grain filling to full maturationthe highest proportion of labelled N was presentin the ears.
4. Discussion
The investigation has shown that from tilleringuntil maturation wheat plants release a substantialamount of nitrogen from their roots which istaken up during the early growth stage. The
Table 6lSN amounts in mg per three plants (pot) different plant organs from tillering until full maturation
Development stages Tillering Ear emergence Beginning of grain filling Full maturation
1st yearShoots 31.5 27.1 25.3 10.3Roots 5.3 8.2 7.6 4.5Ear 15.6Total 36.5 35.3 32.9 30.4
2nd yearShoots 22.12 17.88 13.18 7.20Roots 5.00 8.22 7.74 6.23Ears 3.87 10.36Total 27.12 26.10 24.79 23.79
108 E. Rror;o, K. Mengel / Europ. J. Agronomy 13 (2000) 101-110
amount released by roots by maturation was ap-proximately the same in both years, namely 13%in the 1st and 11% in the 2nd year of the total IsNtaken up (Table 2).
The young plants received almost 1 mg J4Nfrom their seeds and at transplanting they con-tained ~ 13 mg N plant - J for the 1st and 10 mgN plant - 1 for the 2nd year, so that the differenceof 12 and 9 mg N, respectively, originated fromthe 98 atom% 15N nutrient solution. From thebeginning of plant cultivation in soil, the plantsalso took up J4N which diluted the 15N in theplant as evidenced by the decrease of the J5Natom excess as shown in Table 4. Even as early asthe tillering stage, the JSN atom excess was muchlower than that of the labelled N fertilizer with 98atom%. Presumably at tillering the decrease of theJ5N atom% excess (dilution of the J5N) originatednot only from the nitrogen present in the seedsbut also from the fertilizer N even though at thisfirst stage of sampling (tillering) the plants hadbeen grown for only 6 days in the soil.
The 15N dilution continued further betweentillering and ear emergence (Table 4) resultingfrom the high 14N uptake rates from the soilduring this period (Table 5). After ear emergence,J5N dilution (roots) was very low in the 1st yearand almost non-existent in the 2nd because ofvirtually no uptake of 14N by the plants duringthis period. Interestingly, with only one exception(1st year, full maturation), with the beginning ofear emergence the 15N enrichments did not differsignificantly between shoots and roots (Table 4).Since the root is the plant organ that contributesto the N release into the soil, from this uniformityone may suppose that the total N released fromthe roots into the soil had the same 15Nj14N ratioas in the shoots. Based on this assumption the 15Nvalues should be representative of the total Nreleased from the roots into the soil. This is alsoconfirmed if one calculates the total N releaseC4N + 15N) for the period from ear emergence tofull maturation which gives 10.4 and 6.76% of thetotal N uptake for the 1st and 2nd year, respec-tively. The corresponding figures for the 15N re-lease of total 15N taken up by the plants are9.62% (1st year) and 6.67% (2nd year) anddemonstrate that the proportions of 15N and total
N C4N + 15N) released by the roots from earemergence until full maturation are practicallyidentical.
It is suggested that a high proportion of 15Nwas incorporated into the leaves of the youngplants as shown in Table 6. These younger leavesat tillering become the older leaves in the follow-ing development stages. A major proportion ofolder leaf proteins is hydrolyzed shortly beforeanthesis until 2 weeks after anthesis and accordingto Stoy (1972) (quoted by Mengel and Kirkby,1987 p. 256) the N is mainly translocated to theroots as amino acids via phloem transport. Someof these amino acids are released from the rootphloem and not used in root metabolism(Kosegarten and Mengel, 1998) and may diffusethrough the root apoplast into the rhizospherewhere they are quickly metabolized by soil mi-croorganisms. According to Matzke (1988) suchrelease of amino acids particularly occurs underconditions of energy stress.
Interestingly, the highest release rates of nitro-gen release by roots were obtained from ear emer- .gence until the beginning of grain filling (Table 2).At this stage wheat attains its highest LAI andhence a high photosynthetic activity prevails asso-ciated with the synthesis of amino acids. From earemergence until the beginning of grain filling, rootgrowth still occurs and a minor portion of aminoacids translocated from shoots to roots may bereleased into the soil.
Later during the main period of grain filling,root N also contributes to grain filling as is evi-denced by the depletion of root N during matura-tion (Table 5), and reported previously by Kochand Mengel (1977) for spring wheat. This demandof root N for grain filling is presumably thereason why the 15N release rates were low duringmaturation (Table 2). The low rates of release of15N at maturation also indicate that dying rootscontribute little to N release since release fromthis source would be expected to be the highest atmaturation. It can be assumed that the mainrelease of N is as amino acids, as ammonium israpidly metabolised (Oaks, 1994) and nitrate iseither reduced or stored in vacuoles (McIntyre,1997). It is hardly feasible therefore that a majorisotopic exchange could have occurred with ex-
E. Rroco, K. MengeljEurop. J. Agronomy 13 (2000) 101-110
change of 15 ammonium or nitrate released bythe roots with 14 homologues in the soil. Haduch an isotopic exchange occurred it would have
resulted in a decrease of the 15Nexcess from earemergence until maturation, which was not thecase (Table 4).
Our investigation has shown that the labelled Nwas almost homogeneously distributed in theplant (Table 4) and for this reason the percent oflabelled N released into the soil may be used tocalculate the total N released by the roots into thesoil. The amount of total N C4N + 15N)releasedwas 13% (1st year) and 11% (2nd year) of thetotal N uptake of the plants. The percentagerelease mediated by roots of '" 12% of the total Nuptake C4N + 15N) seems to be a realistic figureand also representative of wheat stands in thefield. This means that a wheat crop with a grainyield of 8 Mg (megagram) taking up '" 240 kg Nha - I would release ~ 29 kg N into the soil byroots over the growing period. This is in the rangeof N which is found frequently in the soil profileafter the harvest of the wheat crop if nitrogenfertilization is adjusted to the available soil nitro-gen and the demand of the crop (Baumgartel etaI., 1989).
Interestingly, the highest rates of unaccountedlosses (losses not via the roots) appeared from earemergence until the beginning of grain filling.Anthers contained ~ 1% of the 15Npresent in the(plant + soil) at the beginning of the experimentwhich means a substantial proportion of the un-accounted for loss was due to the loss of anthers.The rest is supposed to be lost mainly in gaseousform (Farquhar et a!., 1983). During the periodfrom ear emergence until grain filling, high photo-synthetic rates occur which in C3 crops such aswheat are associated with high rates of photores-piration (Geiger and Servaites, 1994) with theproduction of NH3, some of which may be re-leased into the atmosphere. It should be borne inmind, however, that 15NH3released into the leafapoplast may be subject to isotopic exchange withthe 14NH3 already present in the atmosphere(Schjerring, 1997). Such an isotopic exchange willmimic a loss of nitrogen which actually is no loss.Considering this isotopic effect and the loss ofanthers, presumably the gaseous nitrogen losses
109
were less than 3% of total nitrogen uptake of thewheat. This assumption is in agreement with thefindings of O'Deen and Porter (1986) and O'Deen(1989) who report NH3-N losses from wheatplants in the atmosphere of '" 3-4% of the totalplant N.
Acknowledgements
The authors are much indebted to the DeutscheForschungsgemeinschat for financial support.They express their thanks to Professor Merbach,University of Halle and Miss Remus at the Insti-tute of Plant Nutrition and Rhizosphere Researchin ZALF, Miincheberg for their support in 15Nanalyses and to E.A. Kirkby, University of Leeds,for his valuable assistance in preparing the En-glish text.
References
Baumgartel, G., Engels, T., Kuhlman, H., 1989. Wie kannman die ordnungsgemafse N-Diingung iiberprufen? DLG-Mitteilung 9, 474-484.
Farquhar, G.D., Wetselaar, R., Weir, B., 1983. Gaseous nitro-gen losses from plants. In: Freney, J.R., Simpson, J.R.(Eds.), Gaseous Loss of Nitrogen from Plant-Soil System.Martinus Nijhof, The Hague, pp. 159-180.
Geiger, D.R., Servaites, J.e., 1994. Diurnal regulation ofphotosynthetic carbon metabolism in C3 plants. Annu.Rev. Plant Physiol. Plant Mol. BioI. 45, 235-256.
Handley, L.L., Raven, J.A., 1992. The use of natural abun-dance of nitrogen isotopes in plant physiology and ecology.Plant Cell Environ. 15, 965-985.
Imsande, L., Touraine, B.N., 1994. N demand and regulationof nitrate uptake. Plant Physio!. 105, 3-7.
Janzen, H.H., 1990. Deposition of nitrogen into rhizosphereby wheat roots. Soil BioI. Biochem. 22, 1155-1160.
Janzen, H.H., Bruinsma, Y., 1989. Methodology for the quan-tification of root and rhizosphere nitrogen dynamics byexposure of shoots of 15N-Iabelled ammonia. Soil BioI.Biochem. 21, 189-196.
Janzen, H.H., Bruinsma, Y., 1993. Rhizosphere N-depositionby wheat under varied water stress. Soil BioI. Biochem. 25,631-632.
Koch, K., Mengel, K., 1977. The effect of K on N utilizationby spring wheat during grain formation. Agron. J. 69,477-480.
Kohler, W., Schachtel, G., Voleske, P., 1996. Biostatistic.Einfiihrung in die Statistik fur Biologen und Agrarwis-senschaftler, second ed. Springer, Berlin.
110 E. Rroco, K. Mengel / Europ. J. Agronomy 13 (2000) 101- 110
Kosegarten, R., Mengel, K., 1998. Starch depositions in stor-age organs and the importance of nutrients and externalfactors. Z. Pflanzenerniihr. Bodenkd. 161, 273-287.
Lynch, J.M., Whipps, L.M., 1990. Substrate flow in the rhizo-sphere. Plant Soil 129, 1-10.
Matzke, H., 1988. Anionenabscheidung der Wurzel bei symbi-otisch erniihrtem Trifolium pratense. Ph.D. thesis, JustusLiebig University, Giessen, Germany.
McIntyre, G.!., 1997. The role of nitrate in the osmotic andnutritional control of plant development. Aust. J. PlantPhysiol. 24, 103-118.
Mengel, K., Kirkby, E.A., 1987. Principles of Plant Nutrition.International Potash Institute, Berne, Switzerland.
Mengel, K., Robin, P., Salsac, L., 1983. Nitrate reductaseactivity in shoots and roots of maize seedlings as affectedby the form of nitrogen nutrition and the pH of thenutrient solution. Plant Physiol. 71, 618-622.
Palta, J.A., Fillery, !.R., Mathews, E.L., Turner, N.C., 1991.Leaf feeding of [15N]urea for labelling wheat with nitrogen.Aust. J. Plant Physiol. 18, 627-636.
Oaks, A., 1994. Primary nitrogen assimilation in higher plantsand its regulation. Can. J. Bot. 72, 739-750.
O'Deen, W.A., 1989. Wheat volatilized ammonia and resultingnitrogen isotopic fractionation. Agr. J. 81, 980-985.
O'Deen, W.A., Porter, L.K., 1986. Continuous flow system forcollecting volatile ammonia and amines from scenescingwinter wheat. Agron. J. 78, 746-749.
Reining, E., Merbach, W., Knof, G., 1995. 15Ndistribution inwheat and chemical fractionation of root borne 15Nin thesoil. Isot. Environ. Health Stud. 31, 345-349.
Schjerring, J.K., 1997. Plant-atmosphere ammonia ex-change. Quantification, physiological regulation and inter-actions with environmental factors. D.Sc. degree, pp. 21-23.
Toussaint, V., Merbach, W., Reining, E., 1995. Deposition of15Ninto soil layers of different proximity to roots by wheatplants. Isot. Environ. Health Stud. 31, 351-355.
Wetselaar, R., Farquhar, G.D., 1980. Nitrogen losses fromtops of plants. Adv. Agron. 33, 263-302.