network diffusion accurately models the relationship between structural and functional brain...
TRANSCRIPT

This article appeared in a journal published by Elsevier. The attachedcopy is furnished to the author for internal non-commercial researchand education use, including for instruction at the authors institution
and sharing with colleagues.
Other uses, including reproduction and distribution, or selling orlicensing copies, or posting to personal, institutional or third party
websites are prohibited.
In most cases authors are permitted to post their version of thearticle (e.g. in Word or Tex form) to their personal website orinstitutional repository. Authors requiring further information
regarding Elsevier’s archiving and manuscript policies areencouraged to visit:
http://www.elsevier.com/authorsrights
Author's personal copy
Network diffusion accurately models the relationship between structuraland functional brain connectivity networks
Farras Abdelnour ⁎, Henning U. Voss, Ashish RajDepartment of Radiology, Weill Cornell Medical College, New York, NY, USA
a b s t r a c ta r t i c l e i n f o
Article history:Accepted 16 December 2013Available online 30 December 2013
Keywords:NetworksBrain connectivityFunctional connectivityStructural connectivity
The relationship between anatomic connectivity of large-scale brain networks and their functional connectivity isof immense importance and an area of active research. Previous attempts have required complex simulationswhich model the dynamics of each cortical region, and explore the coupling between regions as derived by ana-tomic connections.While much insight is gained from these non-linear simulations, they can be computationallytaxing tools for predicting functional from anatomic connectivities. Little attention has been paid to linearmodels. Here we show that a properly designed linear model appears to be superior to previous non-linear ap-proaches in capturing the brain's long-range second order correlation structure that governs the relationship be-tween anatomic and functional connectivities. We derive a linear network of brain dynamics based on graphdiffusion, whereby the diffusing quantity undergoes a randomwalk on a graph.We test ourmodel using subjectswho underwent diffusionMRI and resting state fMRI. The network diffusionmodel applied to the structural net-works largely predicts the correlation structures derived from their fMRI data, to a greater extent than other ap-proaches. The utility of the proposed approach is that it can routinely be used to infer functional correlation fromanatomic connectivity. And since it is linear, anatomic connectivity can also be inferred from functional data. Thesuccess of our model confirms the linearity of ensemble average signals in the brain, and implies that their long-range correlation structuremay percolate within the brain via purelymechanistic processes enacted on its struc-tural connectivity pathways.
© 2013 Elsevier Inc. All rights reserved.
Introduction
Whole brain connectivity networks or “connectomes” come in twoflavors: structural networks extracted from tractography algorithms ap-plied to diffusion MRI (dMRI) (Gong et al., 2009; Iturria-Medina et al.,2007); and (resting-state) functional networks, inferred from thestrength of long-range second order temporal correlation structure ofactivation signals in various brain regions (Cabeza and Kingstone,2006). Subsequent analysis using ICA (Calhoun et al., 2009) or graphclustering techniques (Shi and Malik, 2000), indicates the presence ofdistinct sub-networks, prominently the default mode and salience net-works (Greicius et al., 2009). Diffusion tensor imaging (DTI) has beenextensively used as an estimate of structural connectivity (Bullmoreand Sporns, 2009; Bullmore and Bassett, 2011; van den Heuvel andPol, 2010). Probabilistic tractography methods for estimating structuralconnectivity from DTI have been adopted in the literature, e.g. (Iturria-Medina et al., 2007, 2008). Both forms of connectivity have experiencedgreat interest from the neuroscience community, as shown in Achardand Ed (2007); Bassett et al. (2010); Honey et al. (2007, 2009) andJoyce et al. (2013).
A major goal of connectome research is to discover whether, andhow, the structural and functional networks of the brain are related —
an active area with tremendous interest and wide ramifications in neu-roscience and computational biology (Cabral et al., 2011; Deco et al.,2009, 2012; Ghosh et al., 2008a; Honey et al., 2007, 2009, 2010; Marset al., 2011). Previous investigations have relied on non-linear modelsof cortical activity whichwere extended tomodel whole-brain behaviorvia coupling between regions based on structural connectivity (Honeyet al., 2009). Other studies place non-linear oscillators at each corticallocation and likewise couple themusing anatomic connectivity strength(Cabral et al., 2011; Deco et al., 2009, 2012; Ghosh et al., 2008a). Sincethese powerful generative simulation models are only revealed throughlarge scale, fine-grained finite difference stochastic simulations overthousands of time samples, they present a practical challenge for thetask of inferring functional connectivity from anatomic. The field hasnot actively considered linear graph-theoretic dynamic models for thispurpose, with a few exceptions described below. Although complexbrain dynamics preclude completely linear responses, ensemble-aver-aged behavior of large connected but individually non-linear neuralpopulations can be quite linear (Stephan et al., 2008).
In this paper we (re)introduce a class of linear models capturing thecorrelation structure of whole brain dynamics at low frequency BOLDlevels (Galán, 2008; Honey et al., 2007, 2010). We argue that whilelocal brain dynamics are not linear or stationary (Bassett et al., 2010;
NeuroImage 90 (2014) 335–347
⁎ Corresponding author at: Department of Radiology, Weill Cornell Medical College,515 E. 71st St., S-125, New York, NY 10065, USA.
E-mail addresses: [email protected] (F. Abdelnour).
1053-8119/$ – see front matter © 2013 Elsevier Inc. All rights reserved.http://dx.doi.org/10.1016/j.neuroimage.2013.12.039
Contents lists available at ScienceDirect
NeuroImage
j ourna l homepage: www.e lsev ie r .com/ locate /yn img
Author's personal copy
Jones et al., 2012;Hutchison et al., 2013), the emergent behavior of long-range steady state 2nd order correlations should be insensitive to detailedlocal dynamics, and dependent only on the topology of structural net-works. Thus, our hypothesis is that linear macroscopic models are suffi-cient to infer the long-range correlation structure of brain activity,without requiring detailed non-linear simulation models. Specifically,we present a simple, low-dimensional network diffusion model produc-ing an accurate description of the structure–function relationship.Network diffusionmodels randomwalks on a graph, covering phenom-ena from image noise removal (Zhang and Hancock, 2008) to Markovrandom fields (Smolka and Wojciechowski, 2001). Interestingly, net-work diffusion successfully captured the progression of misfolded pro-teins within brain networks, and recapitulated patterns of dementiaslike Alzheimer's disease (Raj et al., 2012). We hypothesize thatresting-state functional relationships between brain regions can be cap-tured by a similar diffusion process applied to the structural network.While the proposedmodel is linear, similar to Galán (2008), we imposeconstraints modeled after the interaction of the various cortical regionsby taking the Laplacian of the connectivitymatrix.We test the proposedmodel using dMRI and fMRI brain scans of healthy subjects, and demon-strate higher structure–function correspondence than other competingmethods including neural mass models (Breakspear et al., 2003; Decoet al., 2008; Moran et al., 2007). Our work could provide impetus forsimilar parsimonious approaches in modeling other complex biophysi-cal phenomena.
Our key idea is that functional signals at the spatial and temporalresolutions of BOLD signals in brain regions are an ensemble averageof millions of neurons, and are therefore governed mainly by the num-ber of neurons firing at any time rather than by the complex behavior ofindividual neuronal activity. The non-linearities associated in neurons'individual firing patterns are largely obliterated in the ensemble signal.Thus, the signal correlation between two large connected regions oughtto be governed dominantly by linear processes. We show that the sim-plest linear and purely mechanistic process enacted on the network canreproduce the functional relationship between brain regions. Sincefunctional relationships appear to be enacted on a physical substratethe brain structural connectivity our work implies that the former is aderivative property of brain structure rather than an independentproperty.
Theory
Network notation
In a brain network eachnode represents a graymatter region locatedon either the neocortex or in deep brain subcortical areas. We define anetwork G ¼ V;ℰð Þ with a set of N nodes V ¼ viji∈1;…;Nf g and a setof edges given by an ordered node pair ℰ ¼ i; jð Þji∈V; j∈Vf g (Agaskarand Lu, 2011). Between any two nodes i and j there is a fiber pathwaywhose connectivity weight ci,j ∈ [0, ∞) can be measured from dMRItractography. The structural connectivity matrix C = {ci,j|(i,j) ∈ ℰ} isobtained via anatomical connection probability (ACP),where thematrixelements are obtained as a function of weighted fiber densities betweennodes (Iturria-Medina et al., 2008). Although some individual neuronsare known to be directional, dMRI does not allow measurement of di-rectionality. Major fiber bundles resolvable by dMRI, especiallycortico-cortical pathways are generally bidirectional, having roughlyequal number of connections in either direction (Albright, 1984). Wedefine the connectivity strength or the weighted degree of a node i inthis graph as the sum of all connection weights: δi = ∑ j|(i,j) ∈ ℰci,j.
Linear network models
A previous implementation of a linearmodel for achieving the struc-ture–function correspondence by Honey et al. (2009) is used in thispaper as a comparison, following Galán (2008) where an i.i.d. Gaussian
noise source ξ(n) drives a discretized multivariate autoregressive linearsystem given as:
u nþ 1ð Þ ¼ Au nð Þ þ ξ nð Þ: ð1Þ
Here vector u(n) is the activation signal at time point n of all net-work nodes corresponding to the regions of the brain. The matrix Aserves to relate the mixing between signals at different nodes, as perA = (1 − α)I + C, where α is some leak parameter from the activityof each node, and C is the anatomic connectivity matrix described earli-er. Since a single “mixing” parameter α cannot access many interestingregimes in the space of linearmodels, herewemodify A via two param-eters:
A ¼ 1−αð ÞIþ βC:
By allowing two degrees of freedom instead of one, we obtain abroader range of linear models than the one proposed by Galán. Inorder for the simulation to be stable, the matrix A is normalized tohave unit norm, or ∥ A ∥ = 1. Following Honey et al. (2009), restingstate functional connectivity was obtained via stochastic discrete-timesimulation over a range of α ∈ [−3, 3] and β ∈ [0,6] in steps of 0.1for both parameters. At each point (α, β), the ℓ1 error with respect tothe true functional connectivity was computed. We chose the (α, β)pair that gives the smallest error for final computation of functionalconnectivity.
Non-linear neural mass models (NMMs)
NMMsmodel neural activity in localized populations (minicolumns)in terms of second order state–space differential equations, where thepost-synaptic potential (PSP) of neuronal populations is the hiddenstate, and the activation signal, whether measured via EEG, MEG orBOLD, is the output variables. Themodel gives rise to systems of coupledsecond order non-linear differential equations, whose coupling coeffi-cients are determined by the amount of connectivity between them,which is not known a priori. Since no closed-form solution exists forthese equations, the model is a simulated generative model, whose be-havior is accessed via large-scale simulations over thousands of timepoints, starting from stochastic endogenous and exogenous signalsrepresenting mean firing rates.
An NMMdefined in terms of voltages and conductanceswas utilized(Breakspear et al., 2003), and applied to networks ranging from 66 to1000 nodes. In a more complex recent model, a set of coupled NMMswere instantiated at each node of a connected brain network, withinter-regional couplings determined by anatomic connectivity (Honeyet al., 2009). In the proposedmodel, inter-regional coupling is modulat-ed by a single coupling parameter c, whose chosen value greatly affectsthe behavior of this highly non-linear coupled system. Here we imple-ment this approach using the original computer code used in Honeyet al. (2009). Values of c were varied over a range c = {0.02, 0.07,0.12, 0.17, 0.22, 0.27, 0.32} for each subject and the value yielding thehighest match with empirical functional connectivity was chosen.
Proposed network diffusion model
We now introduce from first principles a physically realistic lineardynamic network model of functional connectivity relying on its emer-gent linearity, and obtain a closed-form solution which obviates theneed for generating simulated signals. Consider first an isolated corticalregion R1.We assume that the average activation signal over all neuronsin this region, denoted by x1(t), is proportional to the number of firingneurons per voxel (rather than to the actual action potentials thereof).Although the internal dynamics of this isolated neural population iscomplex and likely chaotic, in keepingwith our emphasis on simple lin-ear models, we allow the simplest possible dynamic behavior of a
336 F. Abdelnour et al. / NeuroImage 90 (2014) 335–347
Author's personal copy
damped system, given by dx1(t)/dt = −βx1(t). This behavior is consis-tent with a highly damped systemwhose impulse response to transientsignals dies away as an exponential decay, whose rate is controlled bythe decay rate β. This behavior could arise by a number of mechanisms;for instance the refractory period after neural dischargewhich effective-ly acts as a damping function on the neural activation signal.
Now we expand the model to cover an isolated pair of cortical re-gions R1 and R2 connected by a single fiber population, whose connec-tivity weight is given by c1,2. The number of firing neurons in R2 is V2x2,where V2 is the number of voxels in R2. Of these, the number of axonalprojections from R2 to R1 is proportional to c1;2 1
δ2V2x2, where we divide
the connectivity by the degree of R2, δ2, to get a ratio. The proportion ofneurons in R1which experience a firing afferent from R2, assuming uni-form mixing of afferents, is then given by 1
V1c1;2 1
δ2V2x2. If there are no
other afferents into R1, the number of neuronswhich undergoes activa-tion secondary to depolarization due to the enervating active neuronsfrom R2, followed by super-threshold post-synaptic integration, will ingeneral depend in a highly complicated and non-linear fashion, well-characterized by the neural mass equations. However, under the emer-gent linear assumption, the net change in the number of firing neuronsin R1may be considered a linear proportion of the number of active en-ervating neurons from R2. After accounting for the internal first orderdynamics of R1, this gives
dx1 tð Þdt
¼ β1V1
c1;21δ2
V2x2 tð Þ−x1 tð Þ� �
: ð2Þ
There is, of course, no reasonwhy the rate constantβ should be iden-tical for both the internal and external signals contributing to the dy-namics of R1, but in the interest of simplicity and in the absence ofevidence to the contrary we have assumed identical rates. This then isthe first order dynamics of an isolated pair of neuronal populations.For multiple afferents into R1, we modify this to
dxi tð Þdt
¼ β1Vi
Xj
ci; j1δ j
V jx j tð Þ−xi tð Þ0@
1A: ð3Þ
Since the regional parcellation in fMRI-based functional networks issomewhat arbitrary, the regional volumes Vi are not germane to themodel, and must be replaced by graph quantities since our goal is agraph model for this dynamics. Clearly, the regional degree δi is closelyrelated to the volumes Vi, and for cortical sheets, the relationshipwill beroughly linear. Unfortunately, limitations of connectivity and regionalvolumemeasurements, combinedwith the need to integrate both corti-cal and subcortical nuclei, preclude a straightforward relationship. Thus,for the purpose of this paperwepropose two simple alternatives: linear:Vi ∝ δi, and sub-linear: Vi∝
ffiffiffiffiδi
p. The former is preferable if considering
only the cortical sheet, the latter if considering subcortical nuclei aswell(since their size is disproportionally lower than their inter-regional con-nectivity would suggest).
After substituting regional volumes by their respective degree andconcatenating over i, Eq. (3) easily expands to the entire network witharbitrary topology:
dx tð Þdt
¼ −βLx tð Þ; ð4Þ
where the matrix L is the well-known network Laplacian, whose exactformwill depend on which of the above two definitions of regional vol-ume is used. For the former definition, we obtainL = I − Δ−1C, whereΔ is the diagonal matrix with δi = Σjci,j as the ith diagonal element. Forthe latter definition, we have
L ¼ I−Δ−1=2CΔ−1=2: ð5Þ
In the remainder of this paper we use the second definition becauseit is preferablewhen including subcortical regions, and empirically givesnetworks with a closer match to resting state data. On numericalgrounds too it is preferable, since it is symmetric and nonnegative defi-nite, as described in previous graph studies (Agaskar and Lu, 2011). Thecorresponding eigenvalues are all between 0 and 2.
The network diffusion Eq. (4) has an explicit solution
x tð Þ ¼ exp −βLtð Þx0;
which defines the evolution of the initial configuration x0 under subse-quent graph diffusion process on G.
A closed form solution of the graph diffusion model for functional brainnetworks
At time t the effect of an initial configuration, with only region i ac-tive, is given by x(t) = exp(−βLt)ei, where ei is the cardinal unit vectorin the ith direction. Collecting the configurations due to all regions weobtain
x tð Þ ¼ exp −βLtð Þ e1j…jeNð Þ:
We hypothesize that the configuration at time t of an initial configu-ration involving only region i is simply the functional connectivity of iwith all other regions. Therefore we obtain
C f tð Þ ¼ exp −βLtð Þ:
Here the functional connectivity matrix C f is shown as a function ofnetwork diffusion time. Note that due to the eigen-decomposition of Ldescribed above, we have C f 0ð Þ ¼ I, and C f ∞ð Þ ¼ 0. That is, regardlessof the underlying structural network (as long as it is not disconnected),if no time is allowed for diffusion, there are simply no connections be-tween brain regions; and in the steady state, all regions are connectedto all other regions equally. Between these two extremes, a spectrumof functional networks exists. We hypothesize that the network diffu-sion time necessary to match the observed functional network will de-pend on the signal being interrogated (whether BOLD, EEG or MEG)and various details regarding action potentials and their speed of prop-agation through various neuronal populations. Rather than minutelymodeling these parameters, we simply hypothesize that at a criticaltime constant tcrit, to be determined experimentally, the network C f
tcritð Þ will match the observed functional network, or we have
C f tcritð Þ ¼ exp −βLtcritð Þ: ð6Þ
Since the eigen decompositionL = UΛUt is dominated by a few verysmall eigenvalues, the hypothesized functional networks should also besimilarly dominated by these eigenmodes. At a small diffusion time,only the first eigenmode will be present, giving
C f tsmallð Þ≈e−βλ1tu1ut1;
where λ1 and u1 are known from L = UΛUt.
Model inversion: inferring structural from functional connectivity
An intriguing possibility raised by our proposal is that due to linear-ity it may be inverted, i.e. to partially (due to the presence of noisy ei-genvectors) obtain structural connectivity C from the functionalconnectivity matrix C f , as follows
L̂ ¼ −log C f
� �βtcrit
; ð7Þ
337F. Abdelnour et al. / NeuroImage 90 (2014) 335–347
Author's personal copy
where it is understood that log C f
� �is the principal logarithmof thema-
trix C f , and where the structural connectivity matrix C is obtained from
L̂ ¼ I−Δ−1C; ð8Þ
or
L̂ ¼ I−Δ−1=2CΔ−1=2; ð9Þ
whichever is appropriate. The inversion is specified only up to the nor-malized Laplacian, and going from there to the connectivity matrixwould require knowledge of node degree. However, this can be obtain-ed a priori, either from the given functional matrix or prior structuralmatrices. Although a detailed investigation of this application will war-rant a separate study, here we provide a sketch of preliminary resultsand show two estimated structural connectivity matrices obtainedfrom the functional connectivity. First the functional connectivity ma-trix C f is regularized by factoring it into its SVD components, or
C f ¼XKk¼1
ukvtkλk:
We next apply a threshold to the singular values λk, keeping thevalues above the threshold, obtaining
Crf ¼Xk∈K
ukvtkλk;
where Crf is the regularized functional connectivity matrix and K is theset of all singular values λk exceeding a given threshold. Matrix Crf isthen used in Eqs. (7)–(9) to obtain an estimate of the structural connec-tivity. Threshold is defined as αλmax, where λmax is the largest singularvalue in C f , and α (0 b α ≤ 1) is chosen by the user.
Methods
Subjects and MR imaging
T1-weighted structuralMR andHighAngular ResolutionDiffusion Im-aging (HARDI) data were collected on 8 healthy adults on a 3 Tesla GESigna EXCITE scanner (GE Healthcare, Waukesha, WI, USA). HARDI datawere acquired using 55 isotropically distributed diffusion-encodingdirections at b = 1000 s/mm2 and one at b = 0 s/mm2, acquired at 721.8-mm thick interleaved slices with no gap between slices and128 × 128 matrix size that was zero-filled during reconstruction to256 × 256 with a field of view (FOV) of 230 mm. The structural scanwas an axial 3D inversion recovery fast spoiled gradient recalled echo(FSPGR) T1 weighted protocol (TE = 1.5 ms, TR = 6.3 ms, TI =400 ms, flip angle of 15) with 230 mm FOV and 156 1.0-mm contiguouspartitions at a 256 × 256 matrix.
Resting state fMRI was performed, together with anatomical MRI,with an eight-channel head coil using echo-planar imaging based func-tional MRI pulse sequences (repetition time TR = 2 s, echo timeTE = 30 ms, flip angle 70, matrix size 64 × 64 × 28, axial field ofview 24 cm, 5 mm slice thickness); rs-fMRI was acquired with 180samples. 10 samples at the beginning were discarded. Before rs-fMRI,the subjectwas instructed to think of nothing in particular. The subjects'ages range from 23 to 60, with three females and five males. Subjectswere scanned under normal subject protocol approved by the institu-tional review board (IRB).
Extraction of structural and functional brain networks
Diffusion tractography processing closely followed established pipe-lines (Ivković et al., 2012; Raj et al., 2012). Briefly, structural and diffu-sion MR volumes were co-registered using SPM tools in MATLAB
(Alemán-Gómez et al., 2006; Friston et al., 1994), then parcellated into90 cerebral cortical structures as per (Tzourio-Mazoyer et al., 2002).Parcellated regions were used to seed probabilistic tractography in co-registered diffusion MRI volumes. Connectivity weight between anytwo regions was given by a weighted sum of tracts going betweenthem, as per Iturria-Medina et al. (2007). Simple statistical thresholdingwas performed to remove spurious weak connections, defined as thosebelow the p = 0.001 level of significance.
The SPM-based package DPARSF (Song et al., 2010) was used toperform the standard resting-state preprocessing steps. For all sub-jects the first 10 out of 180 time points each were discarded. Spatialresolution was set at 2 × 2 × 2 mm3. The images were realigned,then normalized using DARTEL (Ashburner, 2007). The imageswere next smoothened with Gaussian smoothing kernel with fullwidth at half max FWHM = [444] mm. This was followed bydetrending the images over the range of 0.01–0.08 Hz. Finally, thenoise covariates were regressed out. The functional connectivity net-works and resulting matrices were obtained from resting state fMRIscans using the CONN functional connectivity toolbox (Whitfield-Gabrieli and Nieto-Castanon, 2012). Weak functional connectivity,defined as smaller than 0:05Cmax
f , is set to zero, with Cmaxf the largest
absolute value of interregional functional connectivity matrix C f .Both the linear and non-linear generative models were evaluated by
comparing the similarity between the functional connectivity predictedby the model and the empirical functional connectivity measured fromresting state fMRI data. Themeasure of similaritywe chose is the simplePearson correlation coefficient, evaluated only over thresholded node-pairs, in a manner similar to Honey et al. (2009). This avoids the noiseintroduced by the spurious connectivity between weakly connected ornon-connected regions.
Results
Performance of model depends on global connectivity coupling parameter
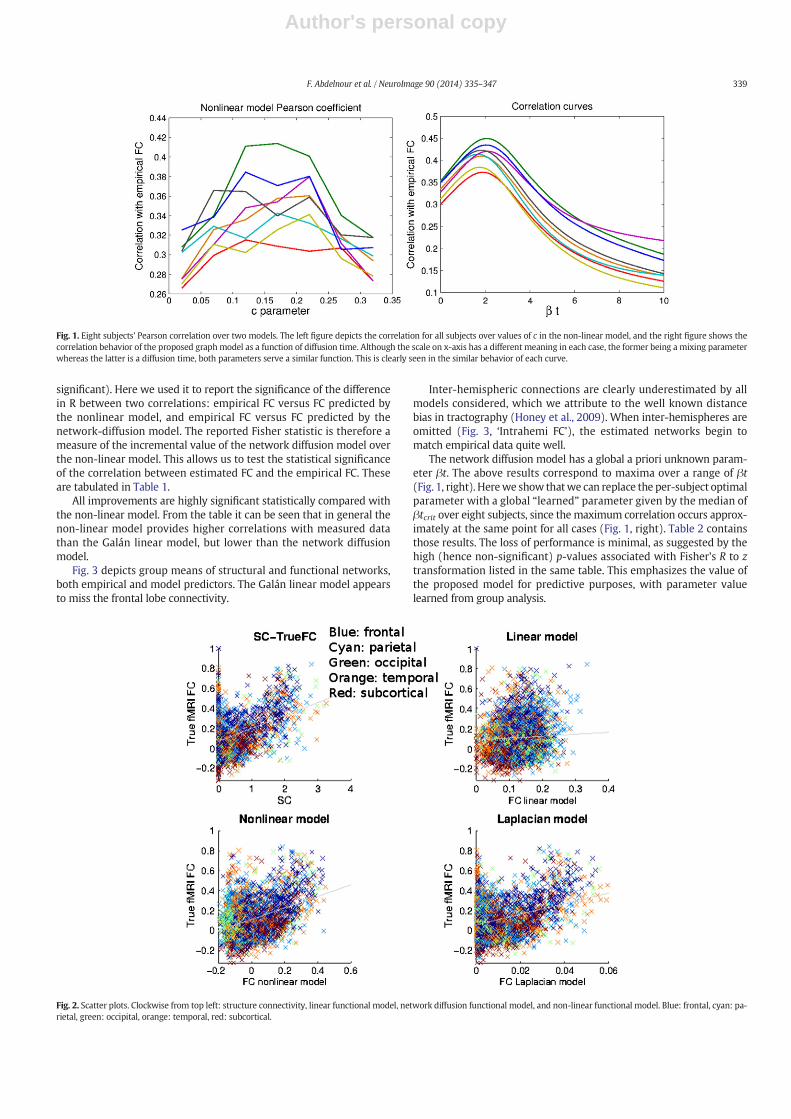
Fig. 1 (left) depicts the Pearson correlation between true FC and thenonlinear model prediction for all subjects over the values of c in thenon-linear model. The resulting curve takes on a bell shape. A strikinglysimilar behavior is seen in the linear network diffusion model (Fig. 1,right), whose agreement with true FC also varies with the global “con-nectivity coupling” parameter βt, follows a bell shape, similar to thenon-linear model. In the Discussion section we explain how this behav-ior is observed in almost all computational models of brain dynamics,including coupled oscillator models (Deco and Jirsa, 2012).
Correlation of rsFC with FC predicted by each model
We compare the performance of the linear Galán and non-linearHoney et al. (Honey et al., 2009) models with the proposed functionalconnectivity estimates by evaluating the Pearson coefficient of the cor-relation between eachmodel prediction and the true functional connec-tivity matrix rsFC. Fig. 2 reflects the scatter plot of each of the meanfunctional connectivity estimates over all eight subjects relative to theempirical matrix. The figure suggests that in the case of the linearmodel estimate of functional connectivity the estimate is poor, whilethe alternate methods nonlinear and Laplacian models offer a tighterscattering of the estimates relative to the true functional connectivity.For the nonlinear model, the estimated FC is evaluated at the value ofthe parameter c yielding the highest correlation with true FC. Table 1summarizes the performance of each approach over all eight subjects.Clearly, FC predicted by the network diffusion model is more closelycorrelated to the true FC matrix than possible with the other models.In order to statistically validate this, we performed Fisher's R to z trans-formation, and obtained its p-value. The Fisher R to z transformation is atool that measures whether two given values of Pearson R are statisti-cally different or not (quite apart from whether each R is by itself
338 F. Abdelnour et al. / NeuroImage 90 (2014) 335–347
Author's personal copy
significant). Here we used it to report the significance of the differencein R between two correlations: empirical FC versus FC predicted bythe nonlinear model, and empirical FC versus FC predicted by thenetwork-diffusion model. The reported Fisher statistic is therefore ameasure of the incremental value of the network diffusion model overthe non-linear model. This allows us to test the statistical significanceof the correlation between estimated FC and the empirical FC. Theseare tabulated in Table 1.
All improvements are highly significant statistically compared withthe non-linear model. From the table it can be seen that in general thenon-linear model provides higher correlations with measured datathan the Galán linear model, but lower than the network diffusionmodel.
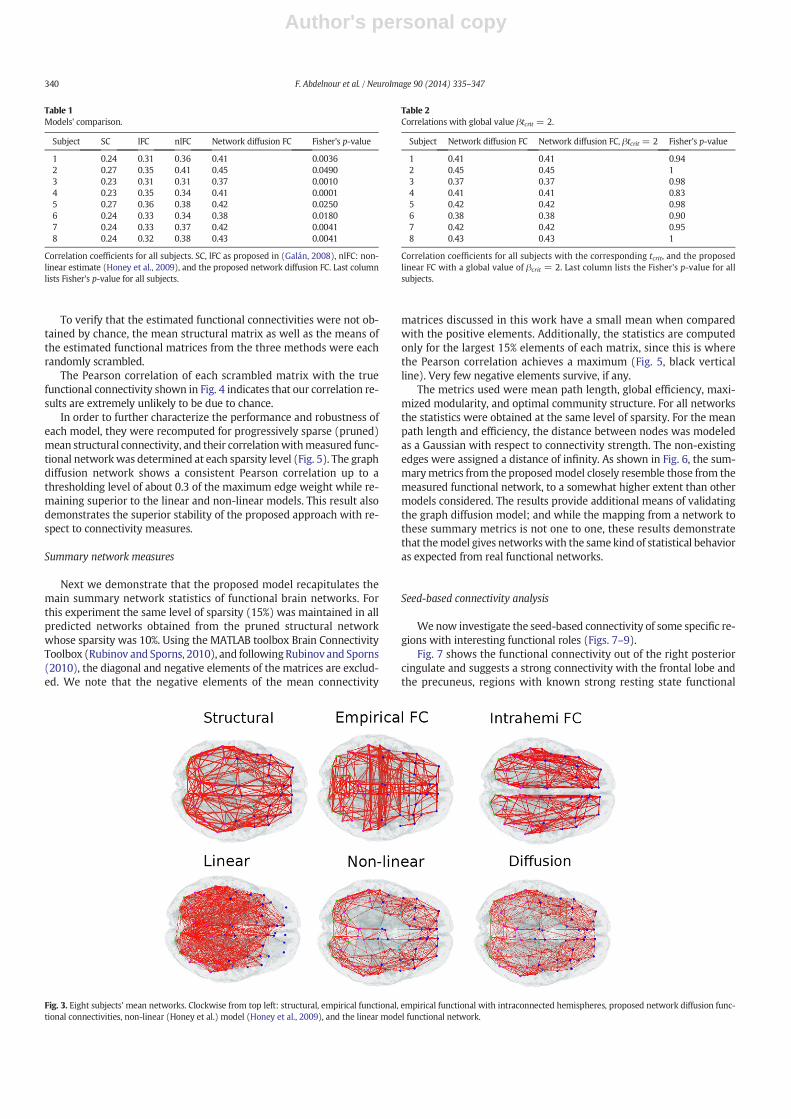
Fig. 3 depicts group means of structural and functional networks,both empirical and model predictors. The Galán linear model appearsto miss the frontal lobe connectivity.
Inter-hemispheric connections are clearly underestimated by allmodels considered, which we attribute to the well known distancebias in tractography (Honey et al., 2009). When inter-hemispheres areomitted (Fig. 3, ‘Intrahemi FC’), the estimated networks begin tomatch empirical data quite well.
The network diffusion model has a global a priori unknown param-eter βt. The above results correspond to maxima over a range of βt(Fig. 1, right). Herewe show thatwe can replace the per-subject optimalparameter with a global “learned” parameter given by the median ofβtcrit over eight subjects, since the maximum correlation occurs approx-imately at the same point for all cases (Fig. 1, right). Table 2 containsthose results. The loss of performance is minimal, as suggested by thehigh (hence non-significant) p-values associated with Fisher's R to ztransformation listed in the same table. This emphasizes the value ofthe proposed model for predictive purposes, with parameter valuelearned from group analysis.
Fig. 1. Eight subjects' Pearson correlation over two models. The left figure depicts the correlation for all subjects over values of c in the non-linear model, and the right figure shows thecorrelation behavior of the proposed graph model as a function of diffusion time. Although the scale on x-axis has a different meaning in each case, the former being a mixing parameterwhereas the latter is a diffusion time, both parameters serve a similar function. This is clearly seen in the similar behavior of each curve.
Fig. 2. Scatter plots. Clockwise from top left: structure connectivity, linear functional model, network diffusion functional model, and non-linear functional model. Blue: frontal, cyan: pa-rietal, green: occipital, orange: temporal, red: subcortical.
339F. Abdelnour et al. / NeuroImage 90 (2014) 335–347
Author's personal copy
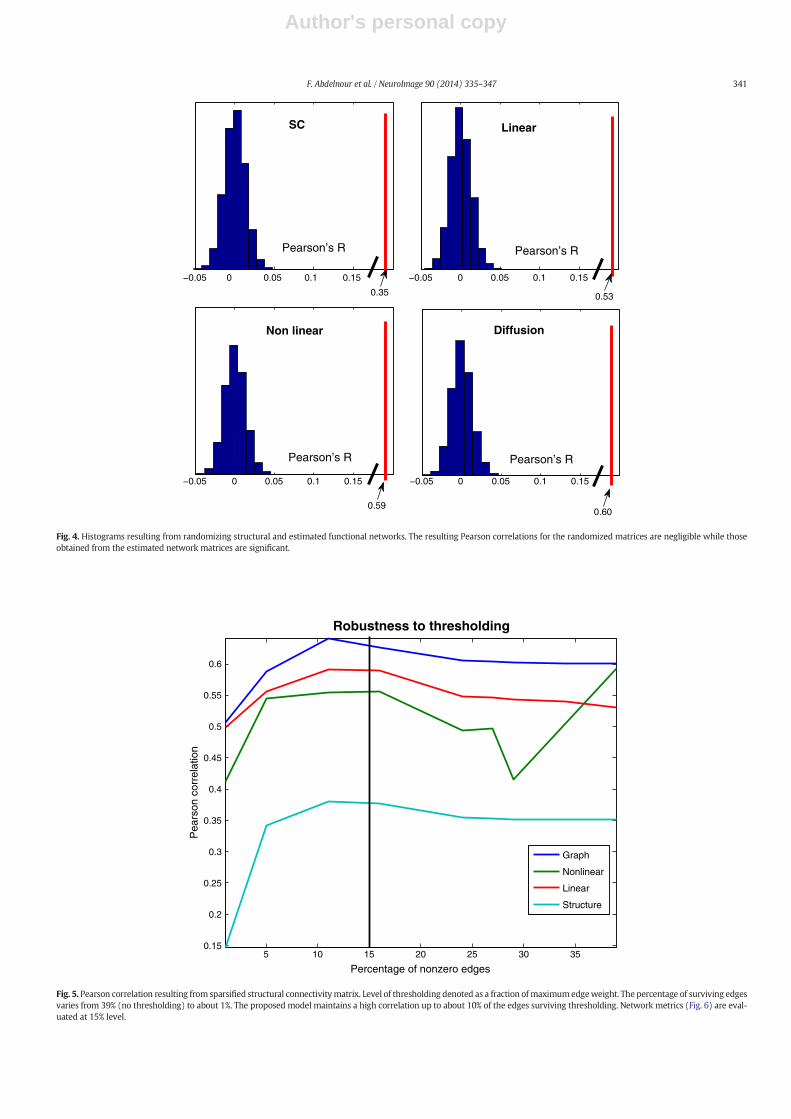
To verify that the estimated functional connectivities were not ob-tained by chance, the mean structural matrix as well as the means ofthe estimated functional matrices from the three methods were eachrandomly scrambled.
The Pearson correlation of each scrambled matrix with the truefunctional connectivity shown in Fig. 4 indicates that our correlation re-sults are extremely unlikely to be due to chance.
In order to further characterize the performance and robustness ofeach model, they were recomputed for progressively sparse (pruned)mean structural connectivity, and their correlationwithmeasured func-tional networkwas determined at each sparsity level (Fig. 5). The graphdiffusion network shows a consistent Pearson correlation up to athresholding level of about 0.3 of the maximum edge weight while re-maining superior to the linear and non-linear models. This result alsodemonstrates the superior stability of the proposed approach with re-spect to connectivity measures.
Summary network measures
Next we demonstrate that the proposed model recapitulates themain summary network statistics of functional brain networks. Forthis experiment the same level of sparsity (15%) was maintained in allpredicted networks obtained from the pruned structural networkwhose sparsity was 10%. Using the MATLAB toolbox Brain ConnectivityToolbox (Rubinov and Sporns, 2010), and followingRubinov and Sporns(2010), the diagonal and negative elements of the matrices are exclud-ed. We note that the negative elements of the mean connectivity
matrices discussed in this work have a small mean when comparedwith the positive elements. Additionally, the statistics are computedonly for the largest 15% elements of each matrix, since this is wherethe Pearson correlation achieves a maximum (Fig. 5, black verticalline). Very few negative elements survive, if any.
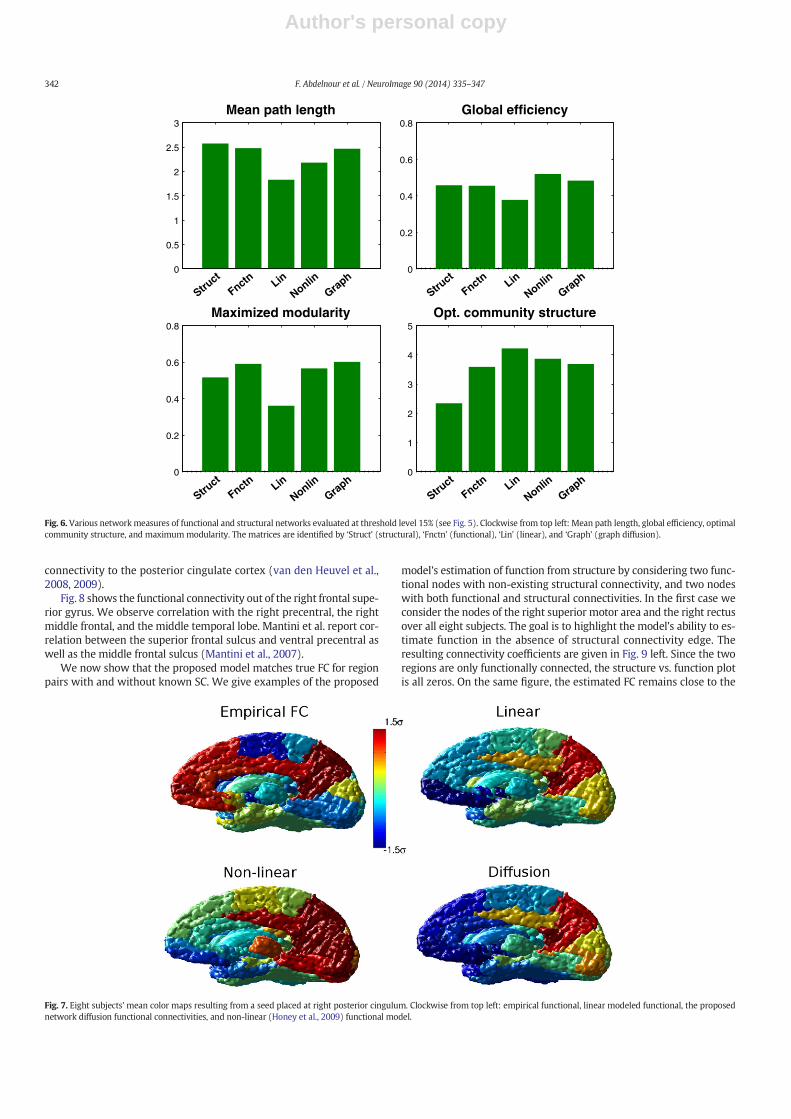
The metrics used were mean path length, global efficiency, maxi-mized modularity, and optimal community structure. For all networksthe statistics were obtained at the same level of sparsity. For the meanpath length and efficiency, the distance between nodes was modeledas a Gaussian with respect to connectivity strength. The non-existingedges were assigned a distance of infinity. As shown in Fig. 6, the sum-marymetrics from the proposedmodel closely resemble those from themeasured functional network, to a somewhat higher extent than othermodels considered. The results provide additional means of validatingthe graph diffusion model; and while the mapping from a network tothese summary metrics is not one to one, these results demonstratethat themodel gives networkswith the samekind of statistical behavioras expected from real functional networks.
Seed-based connectivity analysis
Wenow investigate the seed-based connectivity of some specific re-gions with interesting functional roles (Figs. 7–9).
Fig. 7 shows the functional connectivity out of the right posteriorcingulate and suggests a strong connectivity with the frontal lobe andthe precuneus, regions with known strong resting state functional
Table 1Models' comparison.
Subject SC lFC nlFC Network diffusion FC Fisher's p-value
1 0.24 0.31 0.36 0.41 0.00362 0.27 0.35 0.41 0.45 0.04903 0.23 0.31 0.31 0.37 0.00104 0.23 0.35 0.34 0.41 0.00015 0.27 0.36 0.38 0.42 0.02506 0.24 0.33 0.34 0.38 0.01807 0.24 0.33 0.37 0.42 0.00418 0.24 0.32 0.38 0.43 0.0041
Correlation coefficients for all subjects. SC, lFC as proposed in (Galán, 2008), nlFC: non-linear estimate (Honey et al., 2009), and the proposed network diffusion FC. Last columnlists Fisher's p-value for all subjects.
Fig. 3. Eight subjects' mean networks. Clockwise from top left: structural, empirical functional, empirical functional with intraconnected hemispheres, proposed network diffusion func-tional connectivities, non-linear (Honey et al.) model (Honey et al., 2009), and the linear model functional network.
Table 2Correlations with global value βtcrit = 2.
Subject Network diffusion FC Network diffusion FC, βtcrit = 2 Fisher's p-value
1 0.41 0.41 0.942 0.45 0.45 13 0.37 0.37 0.984 0.41 0.41 0.835 0.42 0.42 0.986 0.38 0.38 0.907 0.42 0.42 0.958 0.43 0.43 1
Correlation coefficients for all subjects with the corresponding tcrit, and the proposedlinear FC with a global value of βcrit = 2. Last column lists the Fisher's p-value for allsubjects.
340 F. Abdelnour et al. / NeuroImage 90 (2014) 335–347
Author's personal copy
−0.05 0 0.05 0.1 0.15
Pearson’s R
SC
−0.05 0 0.05 0.1 0.15
Pearson’s R
Linear
−0.05 0 0.05 0.1 0.15
Non linear
Pearson’s R
−0.05 0 0.05 0.1 0.15
Diffusion
Pearson’s R
0.35 0.53
0.590.60
Fig. 4. Histograms resulting from randomizing structural and estimated functional networks. The resulting Pearson correlations for the randomized matrices are negligible while thoseobtained from the estimated network matrices are significant.
5 10 15 20 25 30 350.15
0.2
0.25
0.3
0.35
0.4
0.45
0.5
0.55
0.6
Percentage of nonzero edges
Pea
rson
cor
rela
tion
Robustness to thresholding
Graph
Nonlinear
Linear
Structure
Fig. 5. Pearson correlation resulting from sparsified structural connectivitymatrix. Level of thresholding denoted as a fraction of maximumedgeweight. The percentage of surviving edgesvaries from 39% (no thresholding) to about 1%. The proposed model maintains a high correlation up to about 10% of the edges surviving thresholding. Network metrics (Fig. 6) are eval-uated at 15% level.
341F. Abdelnour et al. / NeuroImage 90 (2014) 335–347
Author's personal copy
connectivity to the posterior cingulate cortex (van den Heuvel et al.,2008, 2009).
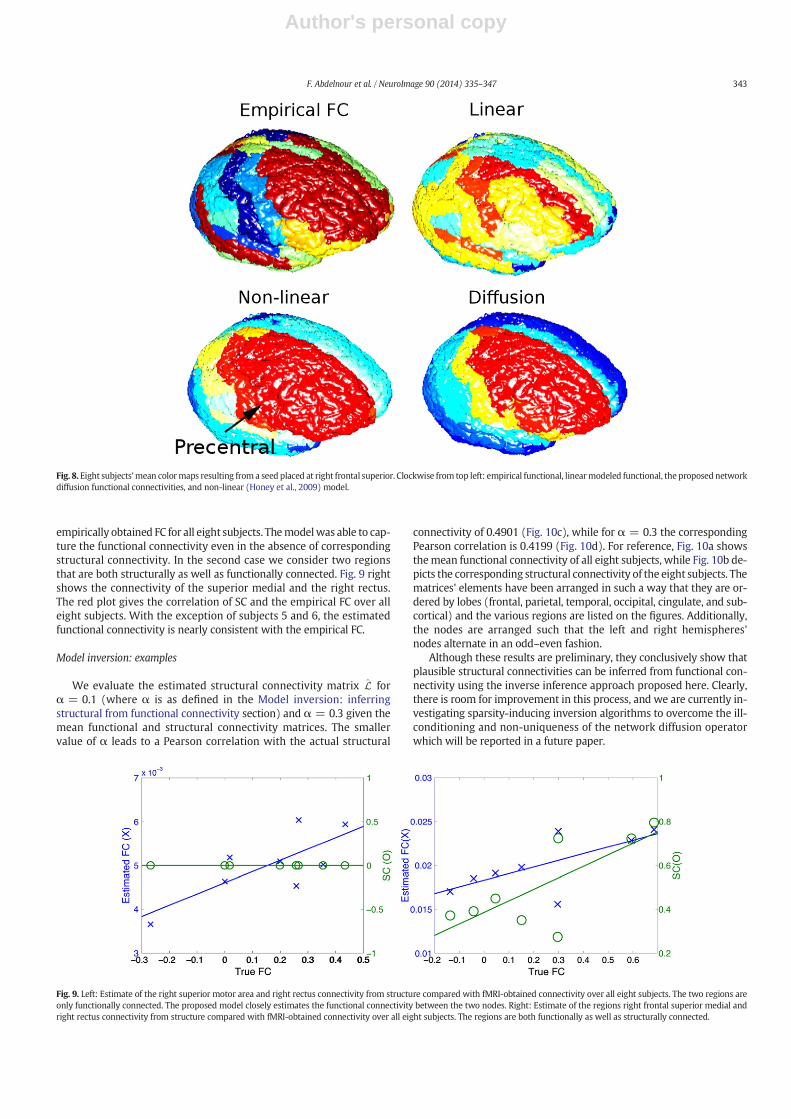
Fig. 8 shows the functional connectivity out of the right frontal supe-rior gyrus. We observe correlation with the right precentral, the rightmiddle frontal, and the middle temporal lobe. Mantini et al. report cor-relation between the superior frontal sulcus and ventral precentral aswell as the middle frontal sulcus (Mantini et al., 2007).
We now show that the proposed model matches true FC for regionpairs with and without known SC. We give examples of the proposed
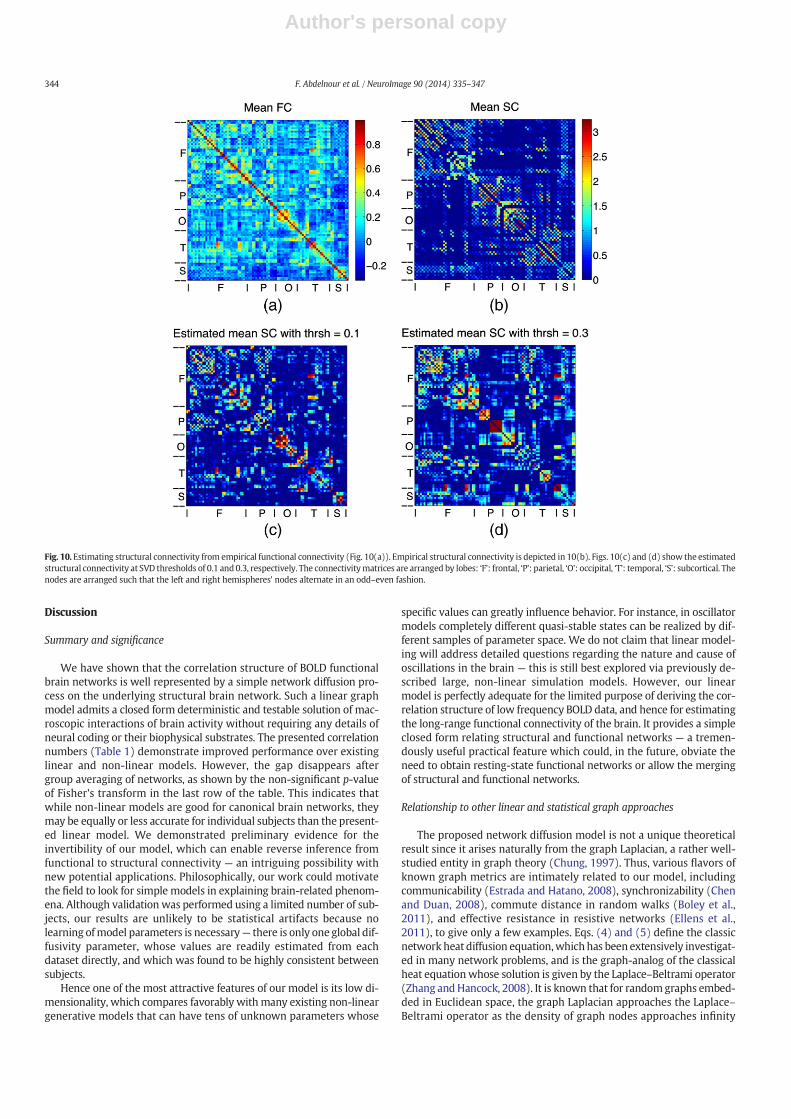
model's estimation of function from structure by considering two func-tional nodes with non-existing structural connectivity, and two nodeswith both functional and structural connectivities. In the first case weconsider the nodes of the right superior motor area and the right rectusover all eight subjects. The goal is to highlight the model's ability to es-timate function in the absence of structural connectivity edge. Theresulting connectivity coefficients are given in Fig. 9 left. Since the tworegions are only functionally connected, the structure vs. function plotis all zeros. On the same figure, the estimated FC remains close to the
0
0.5
1
1.5
2
2.5
3
Struct
Fnctn Lin
Nonlin
Graph
Mean path length
0
0.2
0.4
0.6
0.8
Struct
Fnctn Lin
Nonlin
Graph
Global efficiency
0
0.2
0.4
0.6
0.8
Struct
Fnctn Lin
Nonlin
Graph
Maximized modularity
0
1
2
3
4
5
Struct
Fnctn Lin
Nonlin
Graph
Opt. community structure
Fig. 6. Various networkmeasures of functional and structural networks evaluated at threshold level 15% (see Fig. 5). Clockwise from top left: Mean path length, global efficiency, optimalcommunity structure, and maximummodularity. The matrices are identified by ‘Struct’ (structural), ‘Fnctn’ (functional), ‘Lin’ (linear), and ‘Graph’ (graph diffusion).
Fig. 7. Eight subjects' mean color maps resulting from a seed placed at right posterior cingulum. Clockwise from top left: empirical functional, linear modeled functional, the proposednetwork diffusion functional connectivities, and non-linear (Honey et al., 2009) functional model.
342 F. Abdelnour et al. / NeuroImage 90 (2014) 335–347
Author's personal copy
empirically obtained FC for all eight subjects. Themodelwas able to cap-ture the functional connectivity even in the absence of correspondingstructural connectivity. In the second case we consider two regionsthat are both structurally as well as functionally connected. Fig. 9 rightshows the connectivity of the superior medial and the right rectus.The red plot gives the correlation of SC and the empirical FC over alleight subjects. With the exception of subjects 5 and 6, the estimatedfunctional connectivity is nearly consistent with the empirical FC.
Model inversion: examples
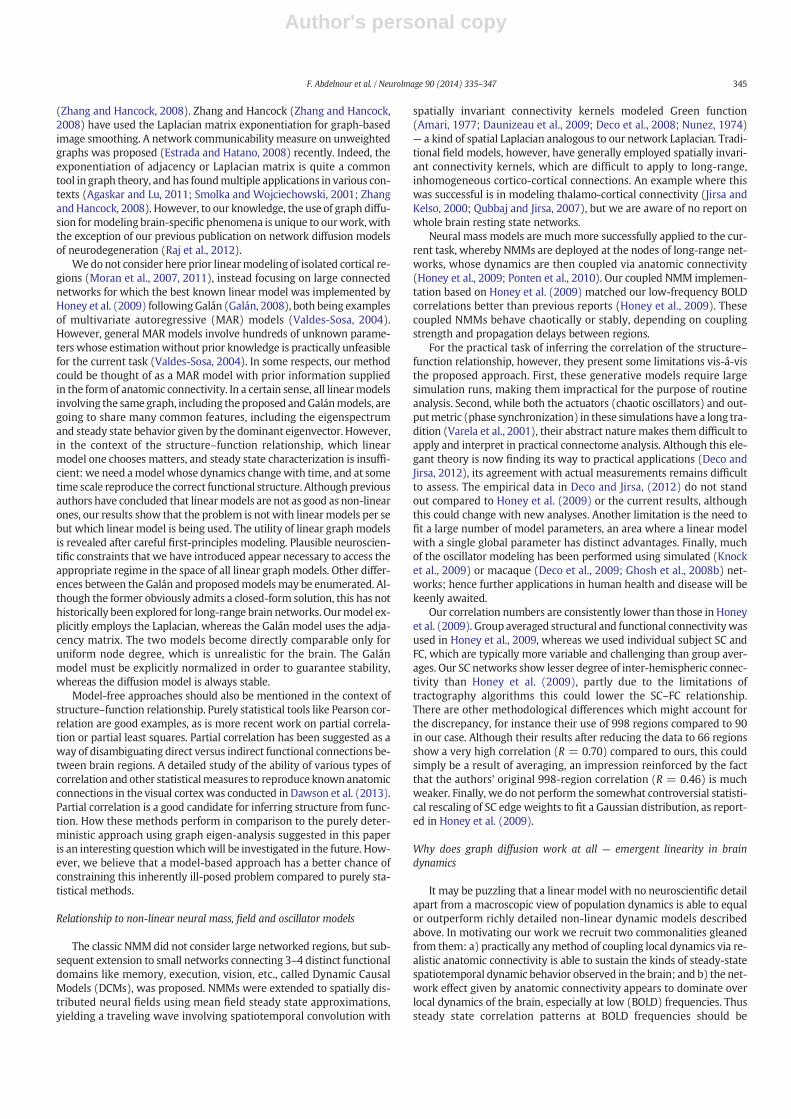
We evaluate the estimated structural connectivity matrix L̂ forα = 0.1 (where α is as defined in the Model inversion: inferringstructural from functional connectivity section) and α = 0.3 given themean functional and structural connectivity matrices. The smallervalue of α leads to a Pearson correlation with the actual structural
connectivity of 0.4901 (Fig. 10c), while for α = 0.3 the correspondingPearson correlation is 0.4199 (Fig. 10d). For reference, Fig. 10a showsthemean functional connectivity of all eight subjects, while Fig. 10b de-picts the corresponding structural connectivity of the eight subjects. Thematrices' elements have been arranged in such a way that they are or-dered by lobes (frontal, parietal, temporal, occipital, cingulate, and sub-cortical) and the various regions are listed on the figures. Additionally,the nodes are arranged such that the left and right hemispheres'nodes alternate in an odd–even fashion.
Although these results are preliminary, they conclusively show thatplausible structural connectivities can be inferred from functional con-nectivity using the inverse inference approach proposed here. Clearly,there is room for improvement in this process, and we are currently in-vestigating sparsity-inducing inversion algorithms to overcome the ill-conditioning and non-uniqueness of the network diffusion operatorwhich will be reported in a future paper.
Fig. 8. Eight subjects'mean colormaps resulting from a seed placed at right frontal superior. Clockwise from top left: empirical functional, linearmodeled functional, the proposed networkdiffusion functional connectivities, and non-linear (Honey et al., 2009) model.
Fig. 9. Left: Estimate of the right superior motor area and right rectus connectivity from structure compared with fMRI-obtained connectivity over all eight subjects. The two regions areonly functionally connected. The proposed model closely estimates the functional connectivity between the two nodes. Right: Estimate of the regions right frontal superior medial andright rectus connectivity from structure compared with fMRI-obtained connectivity over all eight subjects. The regions are both functionally as well as structurally connected.
343F. Abdelnour et al. / NeuroImage 90 (2014) 335–347
Author's personal copy
Discussion
Summary and significance
We have shown that the correlation structure of BOLD functionalbrain networks is well represented by a simple network diffusion pro-cess on the underlying structural brain network. Such a linear graphmodel admits a closed form deterministic and testable solution of mac-roscopic interactions of brain activity without requiring any details ofneural coding or their biophysical substrates. The presented correlationnumbers (Table 1) demonstrate improved performance over existinglinear and non-linear models. However, the gap disappears aftergroup averaging of networks, as shown by the non-significant p-valueof Fisher's transform in the last row of the table. This indicates thatwhile non-linear models are good for canonical brain networks, theymay be equally or less accurate for individual subjects than the present-ed linear model. We demonstrated preliminary evidence for theinvertibility of our model, which can enable reverse inference fromfunctional to structural connectivity — an intriguing possibility withnew potential applications. Philosophically, our work could motivatethe field to look for simple models in explaining brain-related phenom-ena. Although validation was performed using a limited number of sub-jects, our results are unlikely to be statistical artifacts because nolearning ofmodel parameters is necessary— there is only one global dif-fusivity parameter, whose values are readily estimated from eachdataset directly, and which was found to be highly consistent betweensubjects.
Hence one of the most attractive features of our model is its low di-mensionality, which compares favorably withmany existing non-lineargenerative models that can have tens of unknown parameters whose
specific values can greatly influence behavior. For instance, in oscillatormodels completely different quasi-stable states can be realized by dif-ferent samples of parameter space. We do not claim that linear model-ing will address detailed questions regarding the nature and cause ofoscillations in the brain — this is still best explored via previously de-scribed large, non-linear simulation models. However, our linearmodel is perfectly adequate for the limited purpose of deriving the cor-relation structure of low frequency BOLD data, and hence for estimatingthe long-range functional connectivity of the brain. It provides a simpleclosed form relating structural and functional networks — a tremen-dously useful practical feature which could, in the future, obviate theneed to obtain resting-state functional networks or allow the mergingof structural and functional networks.
Relationship to other linear and statistical graph approaches
The proposed network diffusion model is not a unique theoreticalresult since it arises naturally from the graph Laplacian, a rather well-studied entity in graph theory (Chung, 1997). Thus, various flavors ofknown graph metrics are intimately related to our model, includingcommunicability (Estrada and Hatano, 2008), synchronizability (Chenand Duan, 2008), commute distance in random walks (Boley et al.,2011), and effective resistance in resistive networks (Ellens et al.,2011), to give only a few examples. Eqs. (4) and (5) define the classicnetwork heat diffusion equation,whichhas been extensively investigat-ed in many network problems, and is the graph-analog of the classicalheat equationwhose solution is given by the Laplace–Beltrami operator(Zhang andHancock, 2008). It is known that for randomgraphs embed-ded in Euclidean space, the graph Laplacian approaches the Laplace–Beltrami operator as the density of graph nodes approaches infinity
Fig. 10. Estimating structural connectivity from empirical functional connectivity (Fig. 10(a)). Empirical structural connectivity is depicted in 10(b). Figs. 10(c) and (d) show the estimatedstructural connectivity at SVD thresholds of 0.1 and 0.3, respectively. The connectivitymatrices are arranged by lobes: ‘F’: frontal, ‘P’: parietal, ‘O’: occipital, ‘T’: temporal, ‘S’: subcortical. Thenodes are arranged such that the left and right hemispheres' nodes alternate in an odd–even fashion.
344 F. Abdelnour et al. / NeuroImage 90 (2014) 335–347
Author's personal copy
(Zhang and Hancock, 2008). Zhang and Hancock (Zhang and Hancock,2008) have used the Laplacian matrix exponentiation for graph-basedimage smoothing. A network communicability measure on unweightedgraphs was proposed (Estrada and Hatano, 2008) recently. Indeed, theexponentiation of adjacency or Laplacian matrix is quite a commontool in graph theory, and has foundmultiple applications in various con-texts (Agaskar and Lu, 2011; Smolka and Wojciechowski, 2001; ZhangandHancock, 2008). However, to our knowledge, the use of graph diffu-sion formodeling brain-specific phenomena is unique to ourwork,withthe exception of our previous publication on network diffusion modelsof neurodegeneration (Raj et al., 2012).
We do not consider here prior linearmodeling of isolated cortical re-gions (Moran et al., 2007, 2011), instead focusing on large connectednetworks for which the best known linear model was implemented byHoney et al. (2009) followingGalán (Galán, 2008), both being examplesof multivariate autoregressive (MAR) models (Valdes-Sosa, 2004).However, general MAR models involve hundreds of unknown parame-ters whose estimationwithout prior knowledge is practically unfeasiblefor the current task (Valdes-Sosa, 2004). In some respects, our methodcould be thought of as a MAR model with prior information suppliedin the formof anatomic connectivity. In a certain sense, all linearmodelsinvolving the same graph, including theproposed andGalánmodels, aregoing to share many common features, including the eigenspectrumand steady state behavior given by the dominant eigenvector. However,in the context of the structure–function relationship, which linearmodel one chooses matters, and steady state characterization is insuffi-cient: we need amodel whose dynamics changewith time, and at sometime scale reproduce the correct functional structure. Although previousauthors have concluded that linearmodels are not as good as non-linearones, our results show that the problem is not with linearmodels per sebut which linear model is being used. The utility of linear graph modelsis revealed after careful first-principles modeling. Plausible neuroscien-tific constraints that we have introduced appear necessary to access theappropriate regime in the space of all linear graphmodels. Other differ-ences between the Galán and proposedmodels may be enumerated. Al-though the former obviously admits a closed-form solution, this has nothistorically been explored for long-range brain networks. Ourmodel ex-plicitly employs the Laplacian, whereas the Galán model uses the adja-cency matrix. The two models become directly comparable only foruniform node degree, which is unrealistic for the brain. The Galánmodel must be explicitly normalized in order to guarantee stability,whereas the diffusion model is always stable.
Model-free approaches should also be mentioned in the context ofstructure–function relationship. Purely statistical tools like Pearson cor-relation are good examples, as is more recent work on partial correla-tion or partial least squares. Partial correlation has been suggested as away of disambiguating direct versus indirect functional connections be-tween brain regions. A detailed study of the ability of various types ofcorrelation and other statisticalmeasures to reproduce known anatomicconnections in the visual cortex was conducted in Dawson et al. (2013).Partial correlation is a good candidate for inferring structure from func-tion. How these methods perform in comparison to the purely deter-ministic approach using graph eigen-analysis suggested in this paperis an interesting questionwhichwill be investigated in the future. How-ever, we believe that a model-based approach has a better chance ofconstraining this inherently ill-posed problem compared to purely sta-tistical methods.
Relationship to non-linear neural mass, field and oscillator models
The classic NMMdid not consider large networked regions, but sub-sequent extension to small networks connecting 3–4 distinct functionaldomains like memory, execution, vision, etc., called Dynamic CausalModels (DCMs), was proposed. NMMs were extended to spatially dis-tributed neural fields using mean field steady state approximations,yielding a traveling wave involving spatiotemporal convolution with
spatially invariant connectivity kernels modeled Green function(Amari, 1977; Daunizeau et al., 2009; Deco et al., 2008; Nunez, 1974)— a kind of spatial Laplacian analogous to our network Laplacian. Tradi-tional field models, however, have generally employed spatially invari-ant connectivity kernels, which are difficult to apply to long-range,inhomogeneous cortico-cortical connections. An example where thiswas successful is in modeling thalamo-cortical connectivity (Jirsa andKelso, 2000; Qubbaj and Jirsa, 2007), but we are aware of no report onwhole brain resting state networks.
Neural mass models are much more successfully applied to the cur-rent task, whereby NMMs are deployed at the nodes of long-range net-works, whose dynamics are then coupled via anatomic connectivity(Honey et al., 2009; Ponten et al., 2010). Our coupled NMM implemen-tation based on Honey et al. (2009) matched our low-frequency BOLDcorrelations better than previous reports (Honey et al., 2009). Thesecoupled NMMs behave chaotically or stably, depending on couplingstrength and propagation delays between regions.
For the practical task of inferring the correlation of the structure–function relationship, however, they present some limitations vis-á-visthe proposed approach. First, these generative models require largesimulation runs, making them impractical for the purpose of routineanalysis. Second, while both the actuators (chaotic oscillators) and out-putmetric (phase synchronization) in these simulations have a long tra-dition (Varela et al., 2001), their abstract nature makes them difficult toapply and interpret in practical connectome analysis. Although this ele-gant theory is now finding its way to practical applications (Deco andJirsa, 2012), its agreement with actual measurements remains difficultto assess. The empirical data in Deco and Jirsa, (2012) do not standout compared to Honey et al. (2009) or the current results, althoughthis could change with new analyses. Another limitation is the need tofit a large number of model parameters, an area where a linear modelwith a single global parameter has distinct advantages. Finally, muchof the oscillator modeling has been performed using simulated (Knocket al., 2009) or macaque (Deco et al., 2009; Ghosh et al., 2008b) net-works; hence further applications in human health and disease will bekeenly awaited.
Our correlation numbers are consistently lower than those in Honeyet al. (2009). Group averaged structural and functional connectivitywasused in Honey et al., 2009, whereas we used individual subject SC andFC, which are typically more variable and challenging than group aver-ages. Our SC networks show lesser degree of inter-hemispheric connec-tivity than Honey et al. (2009), partly due to the limitations oftractography algorithms this could lower the SC–FC relationship.There are other methodological differences which might account forthe discrepancy, for instance their use of 998 regions compared to 90in our case. Although their results after reducing the data to 66 regionsshow a very high correlation (R = 0.70) compared to ours, this couldsimply be a result of averaging, an impression reinforced by the factthat the authors' original 998-region correlation (R = 0.46) is muchweaker. Finally, we do not perform the somewhat controversial statisti-cal rescaling of SC edge weights to fit a Gaussian distribution, as report-ed in Honey et al. (2009).
Why does graph diffusion work at all — emergent linearity in braindynamics
It may be puzzling that a linear model with no neuroscientific detailapart from a macroscopic view of population dynamics is able to equalor outperform richly detailed non-linear dynamic models describedabove. In motivating our work we recruit two commonalities gleanedfrom them: a) practically anymethod of coupling local dynamics via re-alistic anatomic connectivity is able to sustain the kinds of steady-statespatiotemporal dynamic behavior observed in the brain; and b) the net-work effect given by anatomic connectivity appears to dominate overlocal dynamics of the brain, especially at low (BOLD) frequencies. Thussteady state correlation patterns at BOLD frequencies should be
345F. Abdelnour et al. / NeuroImage 90 (2014) 335–347
Author's personal copy
insensitive to higher order non-linearities like multistable transientstates driven by stochastic noise. This impression is reinforced by com-paring Fig. 1, which shows how long-range correlations changewith theglobal connectivity coupling parameter βt, with a similar figure fromthe coupled oscillator paper (Deco and Jirsa, 2012) and indeed withcomputational models of various vintages and frequency ranges(Cabral et al., 2011; Ghosh et al., 2008b; Knock et al., 2009). Most ofthese models exhibit the characteristic bell-shaped behavior with re-spect to the global coupling parameter. A consistent finding of theseinvestigations is a “quiescent” ground state characterized by low fre-quency correlations — we speculate that it is this regime that allowsour linear model to recapitulate second-order functional correlationsfrom quasi-chaotic signals. This does not imply that the previous non-linear oscillator models are approximately linear (they are not, sincethey displaymulti-stable quasi-chaotic behavior), but that the gross be-havior of networked sites has a surprisingly consistent pattern over arange ofmodels. Ultimately, the best argument for ourmodel is perhapssimply that it seems to work.
The literature on complex systems suggests that just as simple localinteractions can give rise to highly complex global effects; conversely,simplemacroscopic behavior can emerge from complex local processes.The emergent behavior of large scale complex systems can be surpris-ingly linear within large phase domains bounded by (non-linear)phase transitions. Indeed, the emergence of predictable and regular be-havior from chaotic ensembles is considered a hallmark of complexity(Shalizi, 2001). For example, the admittance of large electrical networksof capacitative and resistive elements is known to be chaotic, yet its fre-quency response is essentially linear in large frequency ranges (Almondet al., 2011). This kind of predictable, regular emergent behavior is seenin complex systems as varied as the flocking of geese (Martinez et al.,2007) and complex biological signalingnetworks (Bhalla, 2003). Our re-sults similarly suggest that themacroscopic consequence of the interac-tion of complex but coupled neuronal processes in the brain issurprisingly amenable to coarse mechanistic modeling.
Limitations and future work
The second order correlation of the linear Galán model is comput-able in closed form via the network's eigen decomposition; howeverhere it was investigated via stochastic simulations in keeping withprior work to ensure effective comparison with earlier results. Networkextraction requires a lengthy, involved process (Iturria-Medina et al.,2007) whose deficiencies are inherited by our results. Our choice ofthe AAL atlas was motivated by its proven anatomic specificity andwidespread use in related network analysis work. With only 90 nodes,our network might be considered “lumpy”; yet it is unclear if a finerscale networkwithmore nodeswill yield improvements.While a coarseatlas precludes finer scales of functional patterning, it improves the re-liability of network connectivity. Variations in size and shape of corticalregions were not accounted for in our model. We did not consider re-gionally varying model parameters.
We note that the results reported in this work are limited by distancebias. Distance bias is inherent to tractography from which the structuralconnectivity matrix is obtained, and is a constrain of current technology.Another potential issue is the thresholding operationwe used to removeconnections considered to be zero. Fig. 5 suggests that the proposedmodel is not very sensitive to edge thresholding— a strength of the linearapproach.We further employed a statistical significance threshold basedon variance over all subjects, but due to their small number a bootstrapresampling technique might be more effective, and will be consideredin future work. Our model does not possess oscillatory behavior, whichwould require accurate knowledge of path delays – in systems termsthe Laplace transformhas a real-valuedpole – because the rich frequencycontent of neural populations is difficult to access and interpret fromlow-frequency BOLD signals. Our results support the view that frequencycharacterization is not necessary in capturing thewhole brain correlation
structure of BOLD activation. However, a fuller characterization wouldrequire path delays, which we will pursue in future work. This wouldbe especially critical for modeling richer frequency signals, for examplefrom magnetoencephalograhy (MEG). MEG can facilitate an inves-tigation of the frequency response of the diffusion model and its eigen-modes — an aspect we are unable to explore due to BOLD's poortemporal resolution. Finally, we are cognizant of the inherent limitationsof linear approximations of complex dynamic phenomena, and the risksassociated with overinterpretation.
We emphasize that this work is only aimed at capturing the station-ary correlation structure of functional activation, i.e. its functional con-nectivity, and it has no ability to generate actual time series offunctional activity. The precise time series is neither germane nor acces-sible by any othermethod either, since an infinite number of time-seriescan have the same functional connectivity. A more serious limitation ofour model is that it currently does not provide frequency information ofthe kind a generative simulationmodel can deliver. However, this is nota fundamental feature of linear modeling, and in future work we willdevelop frequency-resolved network diffusion models. Low frequencyBOLD data are not adequate for that purpose, and this effort will neces-sitate EEG and MEG acquisitions.
Acknowledgments
The authors would like to thank Olaf Sporns for supplying the com-puter scripts that allowed the simulation of the non-linear model. ARand FA were supported by the NIH grant R01 NS075425. HUV is sup-ported by the NSF grant 0956306.
References
Achard, S., Ed, B., 2007. Efficiency and cost of economical brain functional networks. PLoSComput. Biol. 3, e17.
Agaskar, A., Lu, Y.M., 2011. An uncertainty principle for functions defined on graphs. SPIE8138, 81380T.
Albright, T.D., 1984. Direction and orientation selectivity of neurons in visual area MT ofthe macaque. J. Neurophysiol. 52, 1106–1130.
Alemán-Gómez, Y., Melie-García, L., Valdés-Hernandez, P., 2006. Ibaspm: Toolbox for au-tomatic parcellation of brain structures. In: 12th Annual Meeting of the Organizationfor Human Brain Mapping.
Almond, D., Budd, C., McCullen, N., 2011. Emergent behaviour in large electrical networks.In: Georgoulis, E.H., Iske, A., Levesley, J. (Eds.), Approximation Algorithms for ComplexSystems, Vol. 3 of Springer Proceedings in Mathematics. Springer, Berlin Heidelberg,pp. 3–26.
Amari, S., 1977. Dynamics of pattern formation in lateral-inhibition type neural fields.Biol. Cybern. 27, 77–87.
Ashburner, J., 2007. A fast diffeomorphic image registration algorithm. Neuroimage 38,95–113.
Bassett, D.S., Greenfield, D.L., Meyer-Lindenberg, A., Weinberger, D.R., Moore, S.W.,Bullmore, E.T., 2010. Efficient physical embedding of topologically complex informa-tion processing networks in brains and computer circuits. PLoS Comput. Biol. 6,e1000748.
Bhalla, U.S., 2003. Understanding complex signaling networks through models andmetaphors. Progress in Biophysics and Molecular Biology 81 (1), 45–65 ISSN 0079-6107, http://dx.doi.org/10.1016/S0079-6107(02)00046-9.
Boley, D., Ranjan, G., Zhang, Z.L., 2011. Commute times for a directed graph using anasymmetric Laplacian. Linear Algebra Appl. 435, 224–242.
Breakspear, M., Terry, J., Friston, K., 2003. Modulation of excitatory synaptic coupling facil-itates synchronization and complex dynamics in a biophysical model of neuronal dy-namics. Neurocomputing 52–54, 151–158.
Bullmore, E.T., Bassett, D.S., 2011. Brain graphs: graphical models of the human brainconnectome. Annu. Rev. Clin. Psychol. 7, 113–140.
Bullmore, E., Sporns, O., 2009. Complex brain networks: graph theoretical analysis ofstructural and functional systems. Nat. Rev. Neurosci. 10, 186–198.
Cabeza, R., Kingstone, A., 2006. Handbook of Functional Neuroimaging of Cognition, 2ndedition. MIT Press.
Cabral, J., Hugues, E., Sporns, O., Deco, G., 2011. Role of local network oscillations inresting-state functional connectivity. Neuroimage 57, 130–139.
Calhoun, V.D., Liu, J., Adal, T., 2009. A review of group ICA for fMRI data and ICA for jointinference of imaging, genetic, and ERP data. Neuroimage 45, S163–S172.
Chen, G., Duan, Z., 2008. Network synchronizability analysis: a graph-theoretic approach.Chaos: Interdiscip. J. Nonlinear Sci. 18, 037102.
Chung, F.R.K., 1997. Spectral Graph Theory Number 92 in Regional Conference Series inMathematics. AMS.
Daunizeau, J., Kiebel, S.J., Friston, K.J., 2009. Dynamic causal modelling of distributed elec-tromagnetic responses. Neuroimage 47, 590–601.
346 F. Abdelnour et al. / NeuroImage 90 (2014) 335–347
Author's personal copy
Dawson, D.A., Cha, K., Lewis, L.B., Mendola, J.D., Shmuel, A., 2013. Evaluation and calibra-tion of functional network modeling methods based on known anatomical connec-tions. Neuroimage 67, 331–343.
Deco, G., Jirsa, V.K., 2012. Ongoing cortical activity at rest: criticality, multistability, andghost attractors. J. Neurosci. 32, 3366–3375.
Deco, G., Jirsa, V.K., Robinson, P.A., Breakspear, M., Friston, K., 2008. The dynamic brain:from spiking neurons to neural masses and cortical fields. PLoS Comput. Biol. 4,e1000092.
Deco, G., Jirsa, V., McIntosh, A.R., Sporns, O., Kötter, R., 2009. Key role of coupling, delay,and noise in resting brain fluctuations PNAS 2009 published ahead of print June 3,2009, http://dx.doi.org/10.1073/pnas.0901831106.
Deco, G., Senden, M., Jirsa, V., 2012. How anatomy shapes dynamics: a semi-analyticalstudy of the brain at rest by a simple spin model. Front. Comput. Neurosci. 6.
Ellens, W., Spieksma, F., vanMieghem, P., Jamakovic, A., Kooij, R., 2011. Effective graph re-sistance. Linear Algebra Appl. 435, 2491–2506.
Estrada, E., Hatano, N., 2008. Communicability in complex networks. Phys. Rev. E 77,036111.
Friston, K., Holmes, A., Worsley, K., Poline, J.P., Frith, C.D., Frackowiak, R.S.J., 1994. Statisti-cal parametric maps in functional imaging: a general linear approach. Hum. BrainMapp. 2, 189–210.
Galán, R.F., 2008. On how network architecture determines the dominant patterns ofspontaneous neural activity. PLoS One 3, e2148.
Ghosh, A., Rho, Y., McIntosh, A., Kötter, R., Jisra, V., 2008a. Cortical network dynamics withtime delays reveals functional connectivity in the resting brain. Cogn. Neurodyn. 2,115–120.
Ghosh, A., Rho, Y., McIntosh, A.R., Kötter, R., Jirsa, V.K., 2008b. Noise during rest enablesthe exploration of the brain's dynamic repertoire. PLoS Comput. Biol. 4, e1000196.
Gong, G., He, Y., Concha, L., Lebel, C., Gross, D., 2009. Mapping anatomical connectivitypatterns of human cerebral cortex using in vivo diffusion tensor imagingtractography. Cereb. Cortex 19, 524–536.
Greicius, M.D., Supekar, K., Menon, V., Dougherty, R.F., 2009. Resting-state functional con-nectivity reflects structural connectivity in the default mode network. Cereb. Cortex19, 72–78.
Honey, C.J., Kötter, R., Breakspear, M., Sporns, O., 2007. Network structure of cerebral cor-tex shapes functional connectivity on multiple time scales. Proc. Natl. Acad. Sci. 104,10240–10245.
Honey, C., Sporns, O., Cammoun, L., Gigandet, X., Thiran, J., Meuli, R., Hagmann, P., 2009.Predicting human resting-state functional connectivity from structural connectivity.Proc. Natl. Acad. Sci. 106, 2035–2040.
Honey, C.J., Thivierge, J.P., Sporns, O., 2010. Can structure predict function in the humanbrain? Neuroimage 52, 766–776.
Hutchison, R.M., Womelsdorf, T., Gati, J.S., Everling, S., Menon, R.S., 2013. Resting-statenetworks show dynamic functional connectivity in awake humans and anesthetizedmacaques. Hum. Brain Mapp. 34, 2154–2177.
Iturria-Medina, Y., Canales-Rodríguez, E., Melie-García, L., Valdés-Hernández, P.,Martínez-Montes, E., Alemán-Gómez, Y., Sánchez-Bornot, J., 2007. Characterizingbrain anatomical connections using diffusion weighted MRI and graph theory.Neuroimage 36, 645–660.
Iturria-Medina, Y., Sotero, R.C., Canales-Rodríguez, E.J., Alemán-Gómez, Y., Melie-García,L., 2008. Studying the human brain anatomical network via diffusion-weighted MRIand graph theory. Neuroimage 40, 1064–1076.
Ivković, M., Kuceyeski, A., Raj, A., 2012. Statistics of weighted brain networks reveal hier-archical organization and Gaussian degree distribution. PLoS One 7, e35029.
Jirsa, V.K., Kelso, J.A.S., 2000. Spatiotemporal pattern formation in neural systems withheterogeneous connection topologies. Phys. Rev. E 62, 8462–8465.
Jones, D.T., Vemuri, P., Murphy, M.C., Gunter, J.L., Senjem, M.L., Machulda, M.M.,Przybelski, S.A., Gregg, B.E., Kantarci, K., Knopman, D.S., Boeve, B.F., Petersen, R.C.,Jack, J.C.R., 2012. Non-stationarity in the resting brain modular architecture. PLoSOne 7, e39731.
Joyce, K.E., Satoru, H., LP, J., 2013. The human functional brain network demonstratesstructural and dynamical resilience to targeted attack. PLoS Comput. Biol. 9,e1002885.
Knock, S., McIntosh, A., Sporns, O., Kötter, R., Hagmann, P., Jirsa, V., 2009. The effects ofphysiologically plausible connectivity structure on local and global dynamics inlarge scale brain models. J. Neurosci. Methods 183, 86–94.
Mantini, D., Perrucci, M.G., Del Gratta, C., Romani, G.L., Corbetta, M., 2007. Electrophysio-logical signatures of resting state networks in the human brain. Proc. Natl. Acad. Sci.104, 13170–13175.
Mars, R.B., Jbabdi, S., Sallet, J., O'Reilly, J.X., Croxson, P.L., Olivier, E., Noonan, M.P., Bergmann,C., Mitchell, A.S., Baxter, M.G., Behrens, T.E.J., Johansen-Berg, H., Tomassini, V., Miller,K.L., Rushworth, M.F.S., 2011. Diffusion-weighted imaging tractography-basedparcellation of the human parietal cortex and comparison with human and macaqueresting-state functional connectivity. J. Neurosci. 31, 4087–4100.
Martinez, S., Cortes, J., Bullo, F., 2007. Motion coordination with distributed information.IEEE Control. Syst. 27, 75–88.
Moran, R., Kiebel, S., Stephan, K., Reilly, R., Daunizeau, J., Friston, K., 2007. A neural massmodel of spectral responses in electrophysiology. Neuroimage 37, 706–720.
Moran, R.J., Stephan, K.E., Dolan, R.J., Friston, K.J., 2011. Consistent spectral predictorsfor dynamic causal models of steady-state responses. Neuroimage 55,1694–1708.
Nunez, P.L., 1974. The brain wave equation: a model for the EEG. Math. Biosci. 21,279–297.
Ponten, S., Daffertshofer, A., Hillebrand, A., Stam, C., 2010. The relationship between struc-tural and functional connectivity: graph theoretical analysis of an EEG neural massmodel. Neuroimage 52, 985–994.
Qubbaj, M.R., Jirsa, V.K., 2007. Neural field dynamics with heterogeneous connection to-pology. Phys. Rev. Lett. 98, 238102.
Raj, A., Kuceyeski, A., Weiner, M., 2012. A network diffusion model of disease progressionin dementia. Neuron 73, 1204–1215.
Rubinov, M., Sporns, O., 2010. Complex networkmeasures of brain connectivity: uses andinterpretations. Neuroimage 52, 1059–1069.
Shalizi, C., 2001. Causal Architecture, Complexity and Self-Organization in Time Series andCellular Automata (Ph.D. diss).
Shi, J., Malik, J., 2000. Normalized cuts and image segmentation. IEEE Trans. Pattern Anal.Mach. Intell. 22, 888–905.
Smolka, B., Wojciechowski, K., 2001. Random walk approach to image enhancement. Sig-nal Process. 81, 465–482.
Song, X., Dong, Z., Long, X., LI, S., Zuo, X., et al., 2010. DPARSF: a MATLAB toolbox for “pipe-line” data analysis of resting-state fMRI. Front. Syst. Neurosci. 4.
Stephan, K.E., Kasper, L., Harrison, L.M., Daunizeau, J., den Ouden, H.E., Breakspear, M.,Friston, K.J., 2008. Nonlinear dynamic causal models for fMRI. Neuroimage 42,649–662.
Tzourio-Mazoyer, N., Landeau, B., Papathanassiou, D., Crivello, F., Etard, O., Delcroix, N.,Mazoyer, B., Joliot, M., 2002. Automated anatomical labeling of activations in SPMusing a macroscopic anatomical parcellation of the MNI MRI single-subject brain.Neuroimage 15, 273–289.
Valdes-Sosa, P., 2004. Spatio-temporal autoregressive models defined over brain mani-folds. Neuroinformatics 2, 239–250.
van den Heuvel, M.P., Pol, H.E.H., 2010. Exploring the brain network: a review onresting-state fMRI functional connectivity. Eur. Neuropsychopharmacol. 20,519–534.
van den Heuvel, M., Mandl, R., Luigjes, J., Pol, H.H., 2008. Microstructural organization ofthe cingulum tract and the level of default mode functional connectivity.J. Neurosci. 28, 10844–10851.
van den Heuvel, M.P., Mandl, R.C., Kahn, R.S., Pol, H.E.H., 2009. Functionally linked resting-state networks reflect the underlying structural connectivity architecture of thehuman brain. Hum. Brain Mapp. 30, 3127–3141.
Varela, F., Rodriguez, E., Martinerie, J., 2001. The brainweb: phase synchronization andlarge-scale integration. Nat. Rev. Neurosci. 2, 229–239.
Whitfield-Gabrieli, S., Nieto-Castanon, A., 2012. Conn: a functional connectivity toolboxfor correlated and anticorrelated brain networks. Brain Connectivity 2 (3),125–141. http://dx.doi.org/10.1089/brain.2012.0073.
Zhang, F., Hancock, E.R., 2008. Graph spectral image smoothing using the heat kernel. Pat-tern Recogn. 41, 3328–3342.
347F. Abdelnour et al. / NeuroImage 90 (2014) 335–347