field methods of accurately determining the percent body fat of
TRANSCRIPT
FIELD METHODS OF ACCURATELY DETERMINING THE PERCENT BODY FAT OF
MALE JOCKEY APPRENTICES AT THE SOUTH AFRICAN JOCKEY ACADEMY, THE
WEIGHT-MAKING TECHNIQUES REPORTED AND THE RISK OF EATING DISORDERS
BY
EMMA LOUISE ILLIDGE
B.Sc Diet, PGDip Diet (UKZN)
Dissertation submitted in fulfilment of the academic requirements for the degree of
MASTER OF SCIENCE IN DIETETICS
Dietetics and Human Nutrition
School of Agricultural, Earth and Environmental Sciences
College of Agriculture, Engineering and Science
University of KwaZulu-Natal
Pietermaritzburg
SOUTH AFRICA
April 2018
ii
ABSTRACT
Background: The South African Jockey Academy (SAJA) apprentices need to meet
handicapping requirements for body weight. To avoid various deleterious weight-making
practices, which increase the risk of occupational injury, excess body fat has to be eliminated
while maintaining an acceptable fat-free mass. A practical, affordable and accurate
measurement of percent body fat (%BF) is therefore essential.
Objectives: To determine the most appropriate field techniques to measure %BF when
euhydrated and dehydrated; weight-making practices reported; and risk of eating disorders.
Methods: Seventeen male apprentices’ (mean age 18.7 ± 1.7 years) %BF was calculated
when both dehydrated and euhydrated, using equations extrapolated from body mass index
(BMI), skinfold measurements and bioelectric impedance analysis (BIA) and compared to
euhydrated deuterium dilution (eDD) (reference method). A lifestyle questionnaire and the
EAT-26 questionnaire investigated weight-making methods and the risk of eating disorders.
Results: Mean BMI was 19.2 ± 1.2 kg/m2. Mean %BF according to the reference method
was 9.51 ± 2.85 % and 88% were underfat. Both BMI and BIA were not as accurate as
skinfold measurements. The Slaughter, Lohman, Boileau, Horswill, Stillman, Van Loan &
Bemben (1988) skinfold equation and the Durnin & Womersley (1974) skinfold equation using
Brozek et al. (1963) were the only methods with acceptable levels of bias in both hydration
states. Restricting food intake (75%), daily weighing (69%), keeping busy to avoid eating
(44%) and exercising (44%) were the most commonly reported chronic weight-making
methods. The most common acute weight-making methods were hot baths (50%), sauna
(37.5%) and wearing plastic to sweat during exercise (31%). The mean EAT-26 score was
4.87 ± 5.84.
Conclusion: When dehydrated, the Slaughter et al. (1988) equation for those under 18 years
or the Durnin & Womersley (1974) skinfold equation for those above 16 years was
recommended for measuring %BF of the SAJA. The weight-making techniques were similar
to those of professional jockeys although not as diverse. The risk of eating disorders was
low.

iii
PREFACE
This dissertation was written between February 2016 and December 2017 under the
supervision of Dr Chara Biggs using data collected from the male jockey apprentices training
at the South African Jockey Academy in Summerveld between June and September 2016.
Signed: __________________________ Date: __________________
Emma Illidge (candidate)
As supervisor of the candidate, I agree to the submission of this dissertation.
Signed: __________________________ Date: __________________
Dr Chara Biggs (supervisor)

iv
DECLARATION OF ORIGINALITY
I, Emma Louise Illidge, declare that:
1. The entirety of the work contained in this dissertation is my original work, except where
otherwise stated.
2. This dissertation, or any part of it, has not been submitted for any degree or examination
at any other university.
3. Where other sources have been used they have not been copied and have been properly
acknowledged.
4. This dissertation does not contain text, graphics or tables copied and pasted from the
internet, unless specifically acknowledged, and the source being detailed in the dissertation
and in the relevant reference section.
Signed: __________________________ Date: __________________
Emma Illidge (candidate)
v
ACKNOWLEDGEMENTS
I would like to express my sincerest gratitude to the following individuals that have supported
me and contributed to the completion of this study:
• Dr Chara Biggs, for support and guidance throughout this study. Thank you for excellent
supervision, the time and devotion you provided to helping with the data collection and your
patience and understanding throughout the write-up.
• The research team: Mrs Kathleen Krog, Mrs Tarryn Mason, Ms Mandy Reed and Mrs Sarah
Olds, for their tremendous efforts to assist with data collection and concerns throughout the
write-up.
• Mr Graham Bailey, for approval to conduct this study at the South African Jockey Academy.
• Dr Helen Mulol for her assistance in sample analysis at the Doris Duke Medical Research
Institute (DDMRI).
• Dr Gill Hendry for providing her expertise in statistical analysis.
• My family for their love, encouragement and support throughout.
vi
TABLE OF CONTENTS
ABSTRACT .......................................................................................................................... ii
PREFACE ........................................................................................................................... iii
DECLARATION OF ORIGINALITY..................................................................................... iv
ACKNOWLEDGEMENTS .................................................................................................... v
LIST OF FIGURES ............................................................................................................ xiii
LIST OF TABLES............................................................................................................... xv
LIST OF APPENDICES .................................................................................................... xvii
LIST OF ABBREVIATIONS ............................................................................................ xviii
CHAPTER 1: INTRODUCTION, THE PROBLEM AND ITS SETTING ................................ 1
1.1 IMPORTANCE OF THE STUDY..................................................................................... 1
1.2 STATEMENT OF RESEARCH PROBLEM ..................................................................... 2
1.3 TYPE OF STUDY ........................................................................................................... 2
1.4 OBJECTIVES ................................................................................................................ 3
1.5 HYPOTHESES .............................................................................................................. 3
1.6 STUDY PARAMETERS .................................................................................................. 4
1.7 STUDY ASSUMPTIONS ................................................................................................ 4
1.8 DEFINITION OF TERMS ................................................................................................ 4
1.9 SUMMARY ..................................................................................................................... 8
1.10 DISSERTATION OUTLINE ........................................................................................... 9
CHAPTER 2: REVIEW OF RELATED LITERATURE ........................................................ 10
2.1 INTRODUCTION .......................................................................................................... 10
2.2 BACKGROUND TO HORSE RACING ......................................................................... 11
2.3 THE JOCKEY APPRENTICE ....................................................................................... 11
2.3.1 A day in the life of a jockey apprentice ...................................................................... 12
2.3.2 Merit handicapping .................................................................................................... 13
2.4 WEIGHT-MAKING TECHNIQUES ................................................................................ 14
2.4.1 Dehydration ............................................................................................................... 17
vii
2.4.2 Food restriction .......................................................................................................... 18
2.4.2.1 Relative energy deficiency in sport ......................................................................... 18
2.4.2.2 Bone health............................................................................................................. 19
2.4.2.3 Abnormal eating behaviours ................................................................................... 20
2.5. PERCENT BODY FAT OF JOCKEYS AND APPRENTICES ...................................... 21
2.6 IMPORTANCE OF ACCURATE MEASUREMENT OF PERCENT BODY FAT............ 25
2.6.1 Importance of fat-free mass ....................................................................................... 25
2.6.2 Importance of fat mass .............................................................................................. 26
2.7 METHODS OF MEASURING PERCENT BODY FAT .................................................. 27
2.7.1 Laboratory methods ................................................................................................... 27
2.7.1.1 Duel X-ray Absorptiometry ...................................................................................... 28
2.7.1.2 Deuterium Dilution .................................................................................................. 28
2.7.2 Field methods ............................................................................................................ 29
2.7.2.1 Body Mass Index .................................................................................................... 29
2.7.2.2 Skinfold measurements .......................................................................................... 31
2.7.2.2.1 The impact of age and sex .................................................................................. 32
2.7.2.2.2 The impact of race ............................................................................................... 33
2.7.2.2.3 The impact of adiposity ........................................................................................ 34
2.7.2.2.4 The impact of dehydration ................................................................................... 34
2.7.2.2.5 The impact of measurement technique ................................................................ 35
2.7.2.2.6 The impact of inter-observer variability ................................................................ 36
2.7.2.2.7 Regression equations .......................................................................................... 36
2.7.2.2.8 Regression equations used in the jockey population ........................................... 36
2.7.2.2.9 Regression equations not yet used in jockeys ..................................................... 38
2.7.2.2.10 Quality of equipment .......................................................................................... 44
2.7.2.3 Bioelectrical Impedance Analysis ........................................................................... 44
2.7.2.3.1 The impact of age and sex .................................................................................. 45
viii
2.7.2.3.2 The impact of race ............................................................................................... 46
2.7.2.3.3 The impact of adiposity ........................................................................................ 46
2.7.2.3.4 The impact of dehydration ................................................................................... 46
2.7.2.3.5 Choice of machine ............................................................................................... 47
2.7.2.3.6 The impact of height ............................................................................................ 48
2.7.2.3.7 Regression equations .......................................................................................... 49
2.7.2.4 The prediction of percent body fat by bioelectrical impedance analysis compared to
skinfolds .............................................................................................................................. 55
2.8 CONCLUSION .............................................................................................................. 56
CHAPTER 3: METHODOLOGY ......................................................................................... 58
3.1 INTRODUCTION .......................................................................................................... 58
3.2 BACKGROUND INFORMATION ON THE STUDY SITE ............................................. 58
3.3 STUDY DESIGN ........................................................................................................... 58
3.4 STUDY POPULATION AND SAMPLE SELECTION .................................................... 59
3.4.1 Inclusion criteria ......................................................................................................... 59
3.4.2 Exclusion criteria ........................................................................................................ 59
3.5 OUTCOME VARIABLES .............................................................................................. 60
3.6 CONFOUNDING VARIABLES ...................................................................................... 60
3.7 STUDY MATERIALS AND METHODS ......................................................................... 60
3.7.1 Urine specific gravity .................................................................................................. 60
3.7.2 Anthropometry measurements................................................................................... 61
3.7.2.1 Weight .................................................................................................................... 61
3.7.2.2 Height ..................................................................................................................... 62
3.7.2.3 Body mass index calculations and equations ......................................................... 62
3.7.3 Skinfold method ......................................................................................................... 64
3.7.3.1 Triceps skinfold ....................................................................................................... 66
3.7.3.2 Biceps skinfold site ................................................................................................. 67
ix
3.7.3.3 Subscapular skinfold ............................................................................................... 68
3.7.3.4 Supra-iliac skinfold site ........................................................................................... 69
3.7.3.5 Abdominal skinfold site ........................................................................................... 70
3.7.3.6 Medial calf skinfold site ........................................................................................... 71
3.7.3.7 Frontal thigh skinfold ............................................................................................... 72
3.7.3.8 Equations to calculate percent body fat from skinfold measurements .................... 73
3.7.4 Bioelectric impedance analysis .................................................................................. 75
3.7.4.1 Equations used to calculate percent body fat from impedance ............................... 77
3.7.5 Deuterium dilution ...................................................................................................... 79
3.7.5.1 Preparation of the deuterium dose .......................................................................... 79
3.7.5.2 Saliva collection ...................................................................................................... 80
3.7.5.3 Preparation of the calibration standards ................................................................. 82
3.7.5.4 Measurement of the deuterium concentration in the saliva samples ...................... 82
3.7.5.5 Calculation of body composition ............................................................................. 83
3.7.5.6 Classification of percent body fat ............................................................................ 84
3.7.6 Classification of fat mass index and fat-free mass index ........................................... 85
3.7.7 Lifestyle questionnaire ............................................................................................... 87
3.7.8 Eating Attitudes Test questionnaire ........................................................................... 88
3.8 METHODOLOGY ......................................................................................................... 90
3.8.1 Preliminary training .................................................................................................... 90
3.8.2 Pilot Study ................................................................................................................. 91
3.8.3 Data collection ........................................................................................................... 92
3.8.4 Statistical analysis ..................................................................................................... 94
3.8.5 Reduction of bias ....................................................................................................... 94
3.8.5.1 Sampling ................................................................................................................. 96
3.8.5.2 Urine specific gravity ............................................................................................... 97
3.8.5.3 Anthropometry ........................................................................................................ 97
x
3.8.5.4 Bioelectric impedance analysis ............................................................................... 98
3.8.5.5 Deuterium dilution ................................................................................................... 98
3.8.5.6 Questionnaires ........................................................................................................ 98
3.8.6 RELIABILITY ............................................................................................................. 98
3.8.7 VALIDITY ................................................................................................................... 99
3.8.8 Ethical considerations ................................................................................................ 99
CHAPTER 4: RESULTS .................................................................................................. 101
4.1 INTRODUCTION ........................................................................................................ 101
4.2 RESPONSE RATE ..................................................................................................... 101
4.3 SAMPLE DEMOGRAPHICS ....................................................................................... 101
4.4 HYDRATION STATUS ............................................................................................... 101
4.5 ANTHROPOMETRY ................................................................................................... 102
4.5.1 Height ...................................................................................................................... 102
4.5.2 Weight ..................................................................................................................... 102
4.5.3 Body mass index ..................................................................................................... 103
4.6 ESTIMATION OF PERCENT BODY FAT ................................................................... 103
4.6.1 Body composition as determined by deuterium dilution ........................................... 103
4.6.1.1 Fat-free mass ........................................................................................................ 103
4.6.1.2 Percent body fat and fat mass index ..................................................................... 104
4.6.2 Body Mass Index ..................................................................................................... 106
4.6.3 Skinfold measurements ........................................................................................... 106
4.6.3.1 Euhydrated ........................................................................................................... 107
4.6.3.2 Dehydrated ........................................................................................................... 107
4.6.4 Bioelectric impedance analysis ................................................................................ 110
4.6.5 Agreement of all methods with reference method.................................................... 111
4.7 BEHAVIOURS RELATED TO HYDRATION AND FOOD INTAKE ............................. 119
4.7.1 Weight satisfaction ................................................................................................... 119
xi
4.7.2 Chronic weight-making methods.............................................................................. 119
4.7.3 Sports and Exercise ................................................................................................. 122
4.7.4 Acute weight-making methods ................................................................................. 122
4.7.5 Feelings of hunger and thirst ................................................................................... 123
4.8 RISK OF DEVELOPING EATING DISORDERS......................................................... 124
4.8.1 EAT-26 Part B: EAT-26 Test ................................................................................... 124
4.8.2 EAT-26 Part C: Behavioural questions .................................................................... 125
4.9 SUMMARY ................................................................................................................. 126
CHAPTER 5: DISCUSSION ............................................................................................. 128
5.1 INTRODUCTION ........................................................................................................ 128
5.2 HYDRATION STATUS ............................................................................................... 128
5.3 ANTHROPOMETRY ................................................................................................... 130
5.3.1 Height ...................................................................................................................... 130
5.3.2 Body mass index ..................................................................................................... 131
5.4 BODY COMPOSITION ............................................................................................... 135
5.4.1 Fat-free mass........................................................................................................... 135
5.4.2 Percent body fat and fat mass index ........................................................................ 138
5.4.2.1 Percent body fat .................................................................................................... 138
5.4.2.2 Fat mass index ..................................................................................................... 140
5.5 ACCURACY OF METHODS TO ESTIMATE PERCENT BODY FAT ......................... 140
5.5.1 Body mass index ..................................................................................................... 140
5.5.2 Skinfold measurements ........................................................................................... 141
5.5.2.1 Two skinfold sites ............................................................................................. 142
5.5.2.2 Three skinfold sites .......................................................................................... 143
5.5.2.3 Four skinfold sites ............................................................................................ 144
5.5.2.4 Multiple skinfold sites ....................................................................................... 144
5.5.3 Bioelectrical impedance analysis ............................................................................. 145
xii
5.5.4 Recommended method for measuring the percent body fat of apprentices ............. 146
5.6 WEIGHT-MAKING BEHAVIOURS .............................................................................. 145
5.6.1 Weight satisfaction ................................................................................................... 147
5.6.2 Chronic weight-making methods.............................................................................. 147
5.6.2.1 Sports and exercise .............................................................................................. 151
5.6.3 Acute weight-making methods ................................................................................. 152
5.6.4 Feelings of hunger and thirst ................................................................................... 155
5.7 RISK OF DEVELOPING EATING DISORDERS......................................................... 155
5.8 CONCLUSION ............................................................................................................ 158
CHAPTER 6: CONCLUSIONS AND RECOMMENDATIONS .......................................... 161
6.1 INTRODUCTION ........................................................................................................ 161
6.2 CONCLUSION ............................................................................................................ 161
6.3 STUDY LIMITATIONS ................................................................................................ 163
6.4 RECOMMENDATIONS FOR NUTRITION PRACTISE ............................................... 164
6.5 IMPLICATIONS FOR FURTHER RESEARCH ........................................................... 164
REFERENCES ................................................................................................................. 166
xiii
LIST OF FIGURES
FIGURE PAGE
Figure 3.1: Lange metal callipers 65
Figure 3.2: Triceps skinfold site® (ISAK, 2011) 67
Figure 3.3: Biceps skinfold site® (ISAK, 2011) 68
Figure 3.4: Subscapulare® skinfold site (ISAK, 2011) 69
Figure 3.5: The supra-iliac skinfold site (ISAK, 2011) 70
Figure 3.6: Abdominal skinfold site® (ISAK 2011) 70
Figure 3.7: Medial calf skinfold site® (ISAK, 2011) 71
Figure 3.8: Front thigh skinfold site® (ISAK, 2011) 72
Figure 3.9: Diagram of electrode placement on right hand 77
and foot (BodyStat, 2007)
Figure 3.10: Photograph 1 of data collection site 80
Figure 3.11: Photograph 2 of data collection site 81
Figure 3.12: Diagram to show the flow of data collection 93
Figure 4.1: Line graph to show the urine specific gravity values of 102
each apprentice when euhydrated (blue) and dehydrated (orange)
Figure 4.2: Column graph to show the percent body fat values of each 105
apprentice according to deuterium dilution when
euhydrated (blue) and dehydrated (orange)
Figure 4.3: Bland-Altman plots for the Slaughter et al. (1988) skinfold 115
equation when euhydrated and dehydrated
xiv
Figure 4.4: Bland-Altman plots for the Durnin & Womersley (1974) skinfold 116
equation with Brozek et al. (1963) when euhydrated and dehydrated
Figure 4.5: Bland-Altman plot for the Van Loan et al. (1990) bioelectrical 117
impedance analysis equation when euhydrated
Figure 4.6: Bland-Altman plot for the Durnin & Womersley (1974) skinfold 118
equation using Siri (1961) when dehydrated
Figure 4.7: Bar graph to show the proportion of responses to questions 121
regarding chronic weight-making methods
Figure 4.8: Column graph to illustrate the number of apprentices that 122
participated in various sports and exercises
Figure 4.9: Column graph to show the score percentage of the apprentices 124
Figure 4.10: Bar graph to show the apprentices responses to Part B 125
of the EAT-26 questionnaire
xv
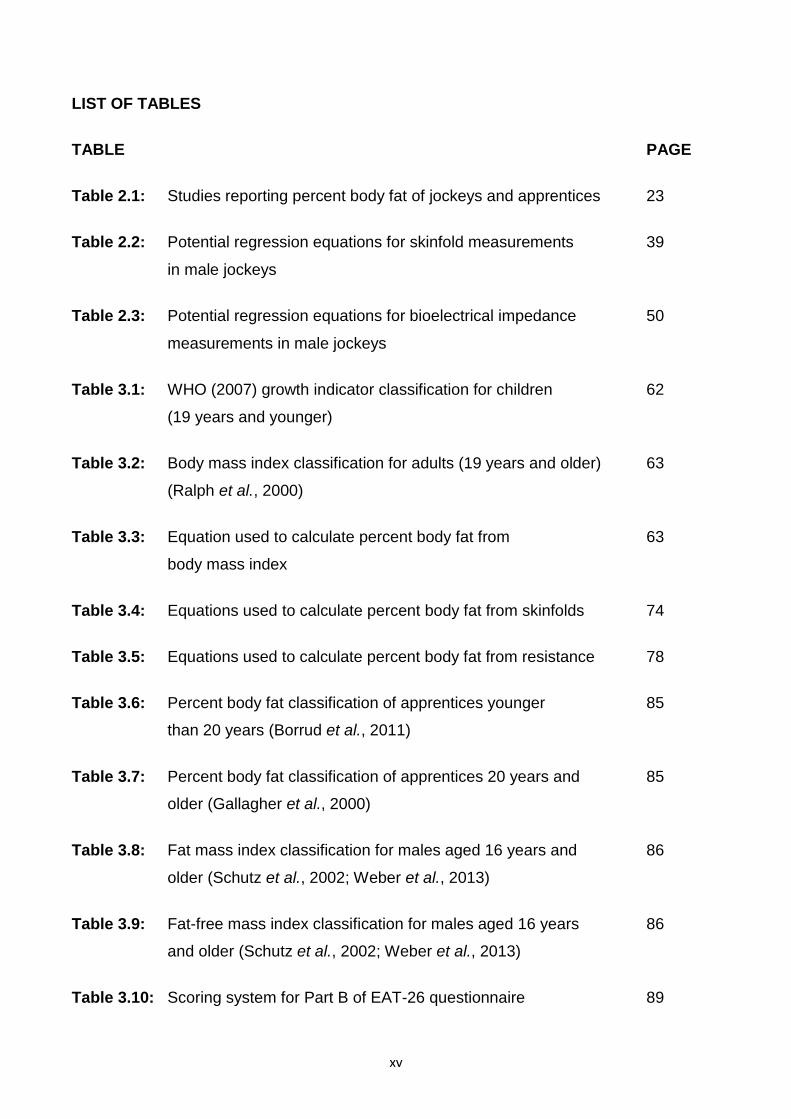
LIST OF TABLES
TABLE PAGE
Table 2.1: Studies reporting percent body fat of jockeys and apprentices 23
Table 2.2: Potential regression equations for skinfold measurements 39
in male jockeys
Table 2.3: Potential regression equations for bioelectrical impedance 50
measurements in male jockeys
Table 3.1: WHO (2007) growth indicator classification for children 62
(19 years and younger)
Table 3.2: Body mass index classification for adults (19 years and older) 63
(Ralph et al., 2000)
Table 3.3: Equation used to calculate percent body fat from 63
body mass index
Table 3.4: Equations used to calculate percent body fat from skinfolds 74
Table 3.5: Equations used to calculate percent body fat from resistance 78
Table 3.6: Percent body fat classification of apprentices younger 85
than 20 years (Borrud et al., 2011)
Table 3.7: Percent body fat classification of apprentices 20 years and 85
older (Gallagher et al., 2000)
Table 3.8: Fat mass index classification for males aged 16 years and 86
older (Schutz et al., 2002; Weber et al., 2013)
Table 3.9: Fat-free mass index classification for males aged 16 years 86
and older (Schutz et al., 2002; Weber et al., 2013)
Table 3.10: Scoring system for Part B of EAT-26 questionnaire 89
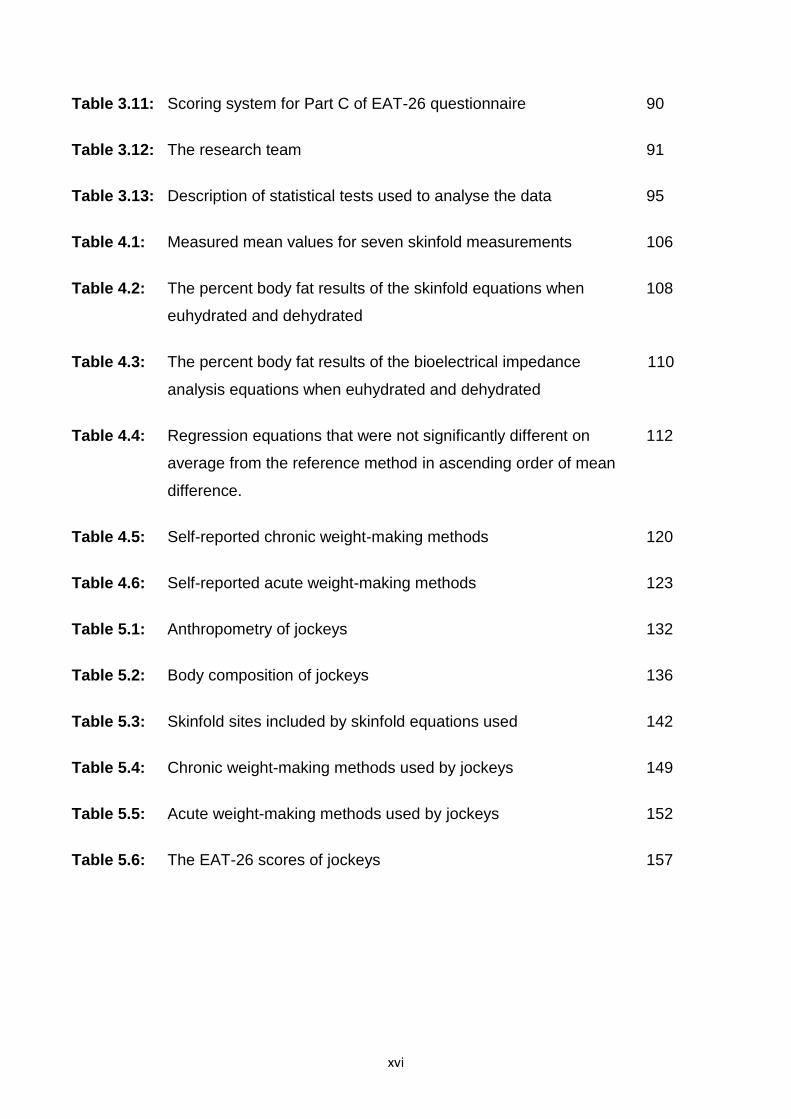
xvi
Table 3.11: Scoring system for Part C of EAT-26 questionnaire 90
Table 3.12: The research team 91
Table 3.13: Description of statistical tests used to analyse the data 95
Table 4.1: Measured mean values for seven skinfold measurements 106
Table 4.2: The percent body fat results of the skinfold equations when 108
euhydrated and dehydrated
Table 4.3: The percent body fat results of the bioelectrical impedance 110
analysis equations when euhydrated and dehydrated
Table 4.4: Regression equations that were not significantly different on 112
average from the reference method in ascending order of mean
difference.
Table 4.5: Self-reported chronic weight-making methods 120
Table 4.6: Self-reported acute weight-making methods 123
Table 5.1: Anthropometry of jockeys 132
Table 5.2: Body composition of jockeys 136
Table 5.3: Skinfold sites included by skinfold equations used 142
Table 5.4: Chronic weight-making methods used by jockeys 149
Table 5.5: Acute weight-making methods used by jockeys 152
Table 5.6: The EAT-26 scores of jockeys 157

xvii
LIST OF APPENDICES
Appendix A: Data collection form
Appendix B: Lifestyle questionnaire
Appendix C: EAT-26 questionnaire
Appendix D1: Information sheet and consent form
Appendix D2: Information sheet and consent form for parent/legal guardian (If the
participant is younger than 18 years)
Appendix D3: Information sheet and assent form for participants younger than 18 years
Appendix E: Hydration protocol for apprentices at the South African Jockey Academy
(July 2016)
Appendix F: Permission letter from the principle of the South African Jockey Academy
Appendix G: Approval letter from the Biomedical Research Ethics Committee
Appendix H: Approval of amendments letter from Biomedical Research Ethics
Committee
xviii
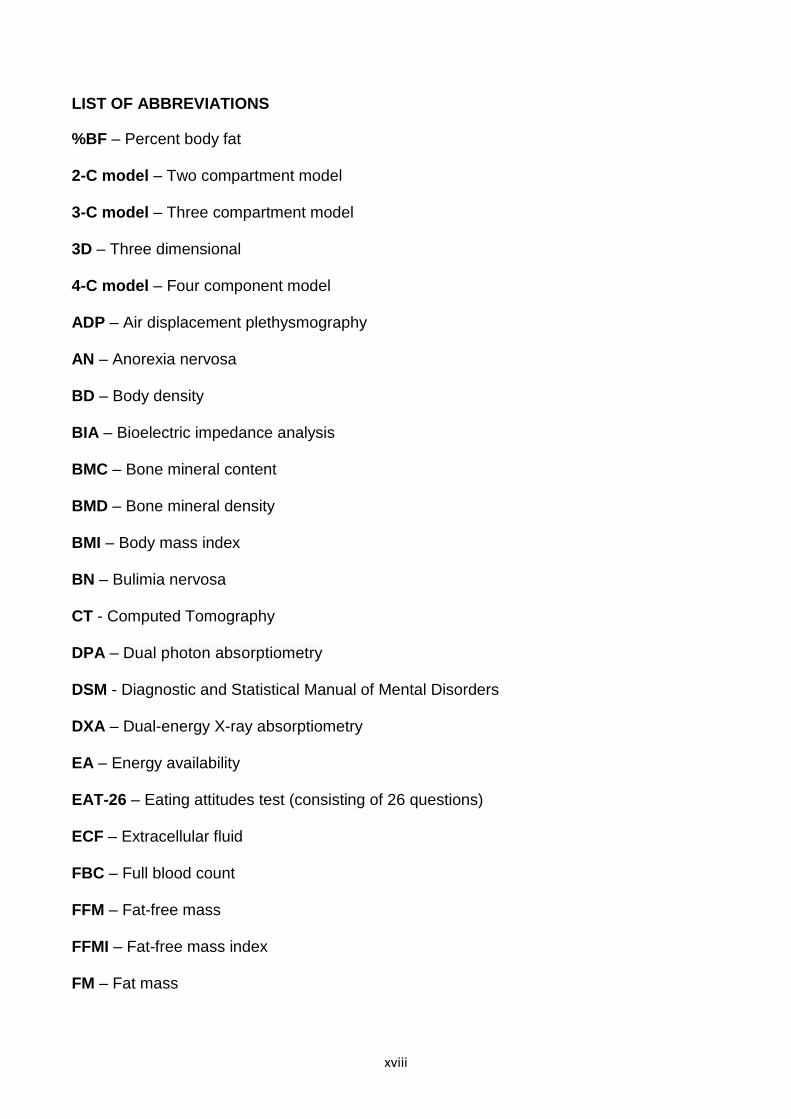
LIST OF ABBREVIATIONS
%BF – Percent body fat
2-C model – Two compartment model
3-C model – Three compartment model
3D – Three dimensional
4-C model – Four component model
ADP – Air displacement plethysmography
AN – Anorexia nervosa
BD – Body density
BIA – Bioelectric impedance analysis
BMC – Bone mineral content
BMD – Bone mineral density
BMI – Body mass index
BN – Bulimia nervosa
CT - Computed Tomography
DPA – Dual photon absorptiometry
DSM - Diagnostic and Statistical Manual of Mental Disorders
DXA – Dual-energy X-ray absorptiometry
EA – Energy availability
EAT-26 – Eating attitudes test (consisting of 26 questions)
ECF – Extracellular fluid
FBC – Full blood count
FFM – Fat-free mass
FFMI – Fat-free mass index
FM – Fat mass
xix
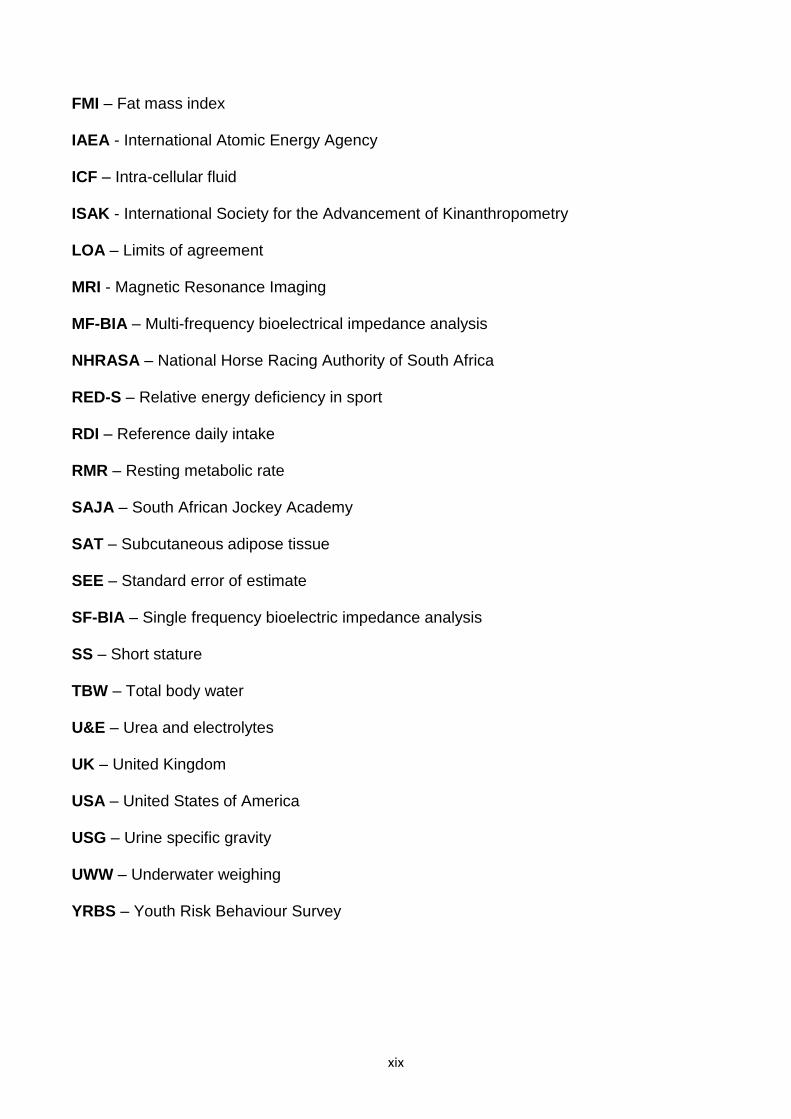
FMI – Fat mass index
IAEA - International Atomic Energy Agency
ICF – Intra-cellular fluid
ISAK - International Society for the Advancement of Kinanthropometry
LOA – Limits of agreement
MRI - Magnetic Resonance Imaging
MF-BIA – Multi-frequency bioelectrical impedance analysis
NHRASA – National Horse Racing Authority of South Africa
RED-S – Relative energy deficiency in sport
RDI – Reference daily intake
RMR – Resting metabolic rate
SAJA – South African Jockey Academy
SAT – Subcutaneous adipose tissue
SEE – Standard error of estimate
SF-BIA – Single frequency bioelectric impedance analysis
SS – Short stature
TBW – Total body water
U&E – Urea and electrolytes
UK – United Kingdom
USA – United States of America
USG – Urine specific gravity
UWW – Underwater weighing
YRBS – Youth Risk Behaviour Survey
1
CHAPTER 1: INTRODUCTION, THE PROBLEM AND ITS SETTING
1.1 IMPORTANCE OF THE STUDY
Horse racing in South Africa makes a significant contribution to the national economy.
The industry is controlled by two bodies: Phumelela Gaming and Leisure Limited,
which controls racing in the Free State, Northern Cape, Eastern Cape and Gauteng,
and Gold Circle, which controls racing in the Western Cape and Kwazulu-Natal. In
2016, the two bodies contributed 2.465 billion rand to the gross domestic product
(GDP) and provided employment for more than three thousand people (Gold Circle,
2017, Phumelela, 2017).
Horse racing relies on a handicapping system, meaning that each horse being ridden
in a given race is assigned a specific weight to carry, according to the ability of the
horse. If the weight of the kitted jockey plus saddle immediately prior to the race
exceeds this, it is unlikely that they will be given the ride. It is easier for the jockey to
‘make’ a heavier weight than to lose weight before racing, therefore it is critical to
maintain an optimal low weight all year round. Jockeys and apprentices often resort
to various deleterious techniques of rapidly losing weight in order to ‘make’ weight for
a race, which increases the risk of occupational injury (Wilson, Fraser, Sharma,
Eubank, Drust, Morton & Close, 2013a). To avoid this, surplus weight in the form of
body fat should be eliminated while maintaining the bone and muscle mass important
for the health and performance of the jockey. An accurate, practical and affordable
measurement of percent body fat (%BF) is therefore useful.
The South African Jockey Academy (SAJA) currently uses skinfold measurements to
calculate %BF, a method with a great potential for error (Parker, Reilly, Slater, Wells
& Pitsiladis, 2003). Bioelectric impedance analysis (BIA) is an alternative method of
body fat analysis that has not been validated in the jockey apprentice population
before but may have advantages over the skinfold method because it requires less
training and is not influenced by inter-observer variability (Fu & Stone, 1994; Ostojic,
2006). Equations have also been developed to estimate %BF from body mass index
(BMI) (Deurenberg, Weststrate & Seidell, 1991c), which involves measurements that
are routinely measured at the SAJA, therefore it could provide a very practical and
inexpensive alternative to other field methods. This method has also not been
validated in the jockey or apprentice population.
2
These methods however may be influenced by fluid changes in the body (Saunders,
Blevins & Broeder, 1998) which is a concern, as common strategies of making weight
for races involve manipulation of hydration status (Labadarios, Kotze, Momberg &
Kotze, 1993; Leydon & Wall, 2002; Moore, Timperio, Crawford, Burns & Cameron-
Smith, 2002a; Dolan, O'Connor, McGoldrick, O'Loughlin, Lyons & Warrington, 2011;
Wilson, Drust, Morton & Close, 2014). It is therefore necessary to validate these
methods in the apprentice population against a reference method for measuring %BF,
such as deuterium dilution (DD) (Parker et al., 2003) in order for the apprentices to
ensure an optimal %BF which can reduce the need for detrimental weigh making
strategies.
Very little literature involving South African jockeys or apprentices exists to date. Only
two such studies exist. Labadarios et al. (1993) described the %BF and weight-
making practises in a descriptive study involving 93 South African male flat jockeys,
although %BF was measured using only the skinfold method and no reference
method. Krog (2015) also described the %BF and weight-making practises of 21 male
flat jockey apprentices training at the SAJA, although %BF was measured using only
BIA.
1.2 STATEMENT OF RESEARCH PROBLEM
The SAJA apprentices require an accurate, practical and affordable measurement of
%BF due to pressures related to weight-restriction in the industry. The accuracy of
three field methods of measuring %BF (BMI, skinfolds and BIA) had not been validated
against a reference method in the apprentices at the SAJA before. Dehydration may
also have an impact on the accuracy of the methods. The use of various weight-
making techniques involving dehydration and food restriction as well as the risk of
developing eating disorders is of concern in the professional jockey population and
should also be assessed amongst the apprentices.
1.3 TYPE OF STUDY
This was a cross-sectional, descriptive study, with minor intervention made with
regards to ensuring euhydration.
3
1.4 OBJECTIVES
1.4.1 To determine the hydration status prior to intervention of the male apprentice
jockeys at the SAJA by urinalysis.
1.4.2 To accurately determine the mean %BF of the apprentices using the reference
method DD.
1.4.3 To classify the height-for-age, BMI, %BF, FMI and FFMI of the apprentices.
1.4.4 To validate the accuracy of three methods of body composition analysis (BMI,
skinfolds and BIA) in measuring %BF to the reference method DD, in male
apprentice jockeys at the SAJA when euhydrated and dehydrated.
1.4.5 To investigate the association between weight satisfaction of the apprentices
and their %BF, age, height, weight, BMI, fat mass index (FMI) and fat-free mass
index (FFMI).
1.4.6 To investigate the use of various weight-making techniques of the apprentices
using a lifestyle questionnaire.
1.4.7 To investigate the apprentices’ risk of developing eating disorders such as
anorexia nervosa (AN) and bulimia nervosa (BN) using the EAT-26
questionnaire.
1.5 HYPOTHESES
1.5.1 The mean BMI of the apprentices would be close to the minimum cut-off range
for normal BMI with a high prevalence of underweight.
1.5.2 The mean fat-free mass (FFM) of the apprentices would be normal.
1.5.3 The %BF values would indicate scope for reduction of body fat in all of the
apprentices included.
1.5.4 Using BMI to calculate %BF will not provide accurate %BF results in both the
euhydrated and dehydrated states and would be significantly impacted by
dehydration.
1.5.5 Regression equations using skinfold measurements would significantly
underestimate %BF in both the euhydrated and dehydrated states and that
dehydration would significantly impact all of the skinfold measurements and
%BF values.
4
1.5.6 Bioelectric impedance analysis would be the most comparable to DD (reference
method), in both the euhydrated and dehydrated state, but would be
significantly impacted by dehydration.
1.5.7 Weight dissatisfaction would be significantly associated with a higher body
weight, BMI and %BF.
1.5.8 The prevalence of chronic and acute weight-making behaviours of the
apprentices studied would be similar to that of the previous study on
apprentices at the SAJA (Krog, 2015) and implicate necessary intervention.
1.5.9 There would be a high risk of developing eating disorders such as AN and BN.
1.6 STUDY PARAMETERS
All male jockey apprentices enrolled at the SAJA in Kwa-Zulu Natal between June and
September 2016 were invited to participate in the study.
1.7 STUDY ASSUMPTIONS
1.7.1 It was assumed that the investigators performing measurements would do so
meticulously and according to protocol.
1.7.2 It was assumed that all apprentices would answer the questionnaires honestly,
objectively and with clear understanding after explanation and any necessary
clarification.
1.8 DEFINITION OF TERMS
Acute dehydration – Water loss that occurs within a short period of time and is
primarily due to vomiting and diarrhoea associated with illness, sweat loss, or other
uncommon situations that cause fluid deprivation or fluid loss (Kenefick, Cheuvront,
Leon & O'Brien, 2012).
Acute weight-making techniques – Techniques used to lose weight over a very
short period of time, for example, by dehydration (Dolan et al., 2011).
Bioelectric impedance analysis – A method of body composition analysis that
applies prediction models derived from regression analysis to the measured
impedance of the human body to an electric current to estimate TBW and FFM (Sun,
5
Chumlea, Heymsfield, Lukaski, Schoeller, Friedl, Kuczmarski, Flegal, Johnson &
Hubbard, 2003).
Body density – A measurement that is determined by weighing the body in air and in
water, or by dividing the body weight by body volume, that permits calculation of the
proportions of fat and lean body tissue (Bender, 2009).
Body mass index – An approximate measure of overweight and obesity, calculated
by dividing body weight in kilograms by the square of height in metres (Flegal,
Shepherd, Looker, Graubard, Borrud, Ogden, Harris, Everhart & Schenker, 2009).
Chronic dehydration – Dehydration that persists for more than a day, usually as a
result of inadequate fluid intake (Kenefick et al., 2012).
Chronic weight-making techniques – Techniques used to sustain weight loss over
an extended period of time, for example, by energy restriction (Dolan et al., 2011).
Dehydration - In this study, this term pertains to a condition of hypertonic hypovolemia
brought about by the net loss of hypotonic body fluids (Kenefick et al., 2012).
Energy availability – The energy left over for body functions after exercise energy
expenditure had been subtracted from dietary energy intake and is expressed in
kilojoules per kilogram fat-free mass (kJ/kg FFM) (Manore & Thompson, 2006). For
example, if a 60 kg athlete consumed 8000 kJ and expends 1000 kJ through exercise,
their EA will be 117 kJ/kg.
Euhydration – A “normal,” narrow fluctuation in body water content with a urine
specific gravity (USG) of 1.020 g/ml or less, without a change in body mass greater
than one percent (Kenefick et al., 2012).
Fat-free mass – Body mass which does not consist of fat, including that of internal
organs, bone, muscle, water and connective tissue (Ackland, Lohman, Sundgot-
Borgen, Maughan, Meyer, Stewart & Müller, 2012).
6
Fat mass index – An approximate measure of whether an individual is overfat,
calculated by dividing body fat mass in kilograms by the square of height in metres
(Bahadori, Uitz, Tonninger-Bahadori, Pestemer-Lach, Trummer, Thonhofer, Brath &
Schaflinger, 2006).
Flat horse racing – Flat races consist of a run with no obstacles and ranges from
distances of five to 20 furlongs - one furlong being 201 metres (Warrington, Dolan,
McGoldrick, McEvoy, MacManus, Griffin & Lyons, 2009).
Four compartment model – A body composition model which divide the body
components on either a chemical level into fat mass, protein, water and other or
anatomically into adipose tissue, skeletal tissue, muscle and connective tissue and
other (Ackland et al., 2012).
Handicap – In the context of horseracing, it is the total weight impediment allocated
to a horse for a given race weight to equalize their chances to win. This includes the
jockey, his/her riding gear, the saddle, and any other added weight which the horse
must carry (Krog, 2015).
Heavy ride – A race meeting ride wherein the horses are handicapped at near the
maximum weight, which in South Africa is 62 kg, allowing the jockeys to ride at higher
weights (Krog, 2015).
Jockey apprentice - A jockey in training. To enter the academy, the applicant must
be 16 to 20 years old, 1.5 to 1.6 metres tall and weigh 38 to 47 kilograms. He or she
must win 50 race rides as an apprentice in order to receive a professional jockey
license. The apprenticeship typically lasts five years (The South African Jockey
Academy, 2007c).
Jump horse racing – Jump races consist of a run which is at least 3.2 km long,
throughout which the horse must jump a number of fences or hurdles (Warrington et
al., 2009).
7
Light ride - A race meeting ride wherein the horses are handicapped at near the
minimum weight, which in South Africa is 52 kg, which might necessitate rapid weight
loss before the ride (Krog, 2015).
Making weight - The practice of rapid weight loss shortly before competition in order
to meet the allocated weight requirement (Wilson et al., 2014).
Mild dehydration - Also known as minimal dehydration. Dehydration classified by a
body weight change of one to three percent or a USG of 1.010 to 1.020 g/ml (Casa,
Armstrong, Hillman, Montain, Reiff, Rich, Roberts & Stone, 2000).
Moderate dehydration – Also known as significant dehydration. Dehydration
classified by a body weight change of three to five percent or a USG of 1.021 to 1.030
g/ml (Casa et al., 2000).
Multi-frequency bioelectrical impedance analysis – Bioelectrical impedance
analysis that involves electrical currents flowing at different frequencies to evaluate
fat-free mass and total body water, as well as to differentiate measures for intra-
cellular and extracellular fluid (Kyle, Bosaeus, De Lorenzo, Deurenberg, Elia, Gómez,
Heitmann, Kent-Smith, Melchior & Pirlich, 2004a).
Professional jockey – An athlete who races horses as a profession. In South Africa,
a jockey apprentice must be awarded a jockey licence from the National Horseracing
Authority (NHA) of South Africa after riding a minimum of 50 winners as well as
complete an apprenticeship at the SAJA or one of its satellites, which typically lasts
five years, in order to qualify as a professional jockey (Krog, 2015).
Relative energy deficiency in sport – TA syndrome which characterised by impaired
physiological functioning caused by relative energy deficiency, and includes but is not
limited to impairments of metabolic rate, menstrual function, bone health, immunity,
protein synthesis and cardiovascular health (Mountjoy, Sundgot-Borgen, Burke,
Carter, Constantini, Lebrun, Meyer, Sherman, Steffen & Budgett, 2014).
8
Resting metabolic rate - The rate of energy expenditure which is required at
complete rest for all cellular function, to maintain the systems of the body and to
regulate body temperature (Livingstone, 2008).
Salt baths – A method of acute weight-loss by dehydration whereby salts, such as
Epsom salts, are added to a hot bath to induce sweating and osmotic dehydration
(Wilson et al., 2014).
Severe dehydration - Also known as significant dehydration. Dehydration classified
by a body weight change of six percent or more or a USG greater than 1.030 g/ml
(Casa et al., 2000).
Single frequency bioelectrical impedance analysis – Bioelectrical impedance
analysis that involves an electrical current that flows at a single frequency (usually 50
kHz) between electrodes to measure fat-free mass and total body water (Kyle et al.,
2004a).
Sweat suits – An outfit, usually made from plastic, used to induce acute weight-loss
by means of dehydration by sweating (Dolan et al., 2011).
Three compartment model - A body composition model which divides the body
components into fat mass, bone mineral and other (Ackland et al., 2012).
Two compartment model - A body composition model which divides the body into fat
mass and FFM (Ackland et al., 2012).
Urine specific gravity – A method of assessing hydration status by measuring the
density of a sample of urine in comparison to pure water, which has a density of 1.000
g/ml (Armstrong, 2005).
1.9 SUMMARY
This was the first study to investigate the accuracy of field methods to measure %BF
in the jockey apprentice population and in South African jockeys using a reference
method. Accurate measurement of %BF is pertinent to the jockey apprentices as they
9
need to keep their weight as low as possible without compromising FFM, which will
affect bone health, balance and metabolic rate. This emphasis on weight in horse-
racing necessitates investigation of the prevalence of weight-making techniques which
could be detrimental to the apprentices’ health, as well as their risk of eating disorders.
1.10 DISSERTATION OUTLINE
This dissertation is laid out as follows:
Chapter 1: Introduction, the problem and its setting
Chapter 2: Review of related literature
Chapter 3: Methodology
Chapter 4: Results
Chapter 5: Discussion
Chapter 6: Conclusion and recommendations
10
CHAPTER 2: REVIEW OF RELATED LITERATURE
2.1 INTRODUCTION
Horse racing in South Africa is an important contributor to the national economy and
the jockeys are a critical component to the industry. The pressures concerning weight
control can have dire consequences for the jockeys’ health and performance which
require attention.
Horse racing relies on a handicapping system, and, in South Africa, these handicaps
range from 52 to 62 kg, according to the horse’s ability. The handicap weight includes
that of the saddle, other riding gear and the jockey. The jockey must ensure that
his/her weight plus that of the gear meets specification in order to be employed to ride.
It is easier to ‘make’ a heavier weight than to lose weight immediately before a race
as lead weights can be added to the saddle and/or heavier gear can be used, therefore
it is optimal to maintain a low weight all year round. Excess weight in the form of body
fat must be eliminated while maintaining a healthy bone and muscle weight, in order
to avoid the use of deleterious weight-making techniques, which increase the jockey’s
risk of occupational injury (Wilson, Chester, Eubank, Crighton, Drust, Morton & Close,
2012a; Wilson et al., 2013a). An accurate measurement of body fat, reflected as %BF
is therefore essential.
The SAJA apprentices face similar pressures regarding weight to that of the
professionals. The SAJA currently measures %BF using skinfolds, which presents a
great potential for error (Ruiz, Colley & Hamilton, 1971; Kispert & Merrifield, 1987;
Moreno, Joyanes, Mesana, González-Gross, Gil, Sarría, Gutierrez, Garaulet, Perez-
Prieto, Bueno & Marcos, 2003) due to its ease of use and the availability of the
necessary equipment and on-site biokineticist trained in the techniques of the
International Society for the Advancement of Kinanthropometry (ISAK). Bioelectric
impedance analysis is an alternative method with less risk of error (Ostojic, 2006)
which has not yet been validated in apprentice jockeys. Equations have also been
developed to estimate %BF from BMI (Deurenberg et al., 1991c), making this another
very practical and inexpensive alternative. As jockeys/apprentices utilize dehydration
as a technique of weight control (Labadarios et al., 1993; Leydon & Wall, 2002; Moore
et al., 2002a; Dolan et al., 2011; Wilson et al., 2014), the methods of using skinfolds,
BIA and BMI to measure %BF needed to be validated as each may be impacted by
11
dehydration (Saunders et al., 1998; Demirkan, Kutlu, Koz, Özal, Güçlüöver & Favre,
2014).
This literature review discusses the weight-making techniques used by
jockeys/apprentices and their possible effects on health and performance. It evaluates
the suitability of using BMI, skinfolds and BIA to estimate %BF in the jockey apprentice
population, taking into consideration their unique lifestyle and physique.
2.2 BACKGROUND TO HORSE RACING
Horse racing as a sport is reported to have originated in the 12th century when English
knights brought back Arab horses upon returning from their crusades. These horses
had been domesticated by nomadic tribesmen of Central Asia. The Arab stallions
were bred with the English mares to produce the Thoroughbred, a breed with greater
strength and endurance. Initially, only nobility would place bets on races between
Thoroughbred horses, until eventually, during Queen Anne’s reign (1702 to 1714),
horse racing (also known as the Sport of Kings) became a full spectator sport
(Huggins, 2014). The Jockey Club was created in 1750 to govern the sport (The
Jockey Club, 2017).
Currently there are two major types of horse racing, flat racing and jump racing (also
referred to as steeple chase or national hunt). Flat racing focuses on speed and
stamina only, whereas jump racing includes hurdles (Warrington et al., 2009). In
South Africa, flat racing is the only type of event that takes place therefore, all South
African apprentices train to be professional flat jockeys. As such, this literature review
will focus on data concerning flat jockeys.
2.3 THE JOCKEY APPRENTICE
The SAJA is the only training academy in Southern Africa, therefore all apprentices in
in this region must go through the SAJA. The SAJA trains approximately 30
apprentices at any given time, most of whom train at the base campus in Summerveld
in KwaZulu Natal while the others train at the satellite campuses in Johannesburg,
Port Elizabeth and Cape Town. To enter the academy, the applicant must be 16 to 20
years old, 1.5 to 1.6 m tall and weigh 38 to 47 kg. They undergo a bone age X-ray,
where the left wrist is X-rayed on the axis of Greulich and Pyle in order to calculate
bone age in contrast to chronological age. They also do a fitness test with a

12
biokineticist to ensure that they meet fitness standards. Basic visual screening with a
registered optometrist is done to rule out those who need glasses or have bad
eyesight. Full blood count (FBC) and urea and electrolyte (U&E) blood tests are also
done to test for medical conditions. Finally, they undergo a basic psychometric test to
establish a personality profile, which will help the recruitment panel to gain insight into
those who are more suited (Sr D Butt 2017, personal communication, 26 June).
As an apprentice, they must win 50 race rides in order to receive a professional jockey
license. The apprenticeship typically lasts five years. The first year apprentices have
riding lessons for approximately the first six to eight months at SAJA. These lessons
involve strength and conditioning sessions under the instruction of a biokineticist.
When the riding masters feel that the apprentice is ready, they will begin work riding
at the training tracks, as well as supervised intensive training on a mechanical horse
called the Equicizer™. When the apprentice is thought to have reached the required
level of riding proficiency, which is usually after 3 years, they ride qualifying races,
along with senior apprentices and professional jockeys (The South African Jockey
Academy, 2007b).
2.3.1 A day in the life of a jockey apprentice
Work riding starts at 5 am and ends at 9 am at one of the two training centres,
Summerveld or Ashburton. The apprentices arrive back at the academy at around
9h30 am to shower, dress and eat breakfast in the academy dining hall. For those
who still attend school, lessons are from 10h30 am to 3 pm with a lunch break from 1
pm to 1h30 pm. Those that no longer attend school might attend race meetings during
the week. After school, the apprentices attend to stable duties and/or receive riding
lessons. They have 30 minutes free time before supper in the dining hall at 5h30 pm,
followed by homework time at 6h30 pm. There is 30 minutes to one hour quiet time
before lights out at 8h30 pm for first years or 9 pm for older apprentices (The South
African Jockey Academy, 2007b).
During the weekends, the apprentices usually have one day off, but will otherwise
continue work riding and attend race meetings if allowed. Race meetings are held
daily throughout South Africa, including Cape Town, Kimberly, Port Elizabeth,
Johannesburg as well as KwaZulu Natal, where the SAJA is based. Every week
approximately three race meetings are hosted in KwaZulu Natal alone. The
13
apprentices are flown between cities to race, with the most skilled apprentices
travelling the most. An apprentice can attend between one and seven race meetings
per week depending on their skill and/or experience (The South African Jockey
Academy, 2007b).
During school holidays, work riding and life at the academy continues, although the
apprentices do not have lessons then. They are also allowed two weeks a year to go
home (The South African Jockey Academy, 2007b).
2.3.2 Merit handicapping
Merit handicapping has a crucial role to play in the lifestyle of jockeys and apprentices.
Thoroughbred horses are handicapped for weight during each race in an attempt to
“level the playing field” and therefore provide a more interesting competition. In South
Africa, horses are handicapped on merit by the National Horse Racing Authority of
Southern Africa (NHRASA). The handicap is earned by the measurement of the
horse’s previous performances using a system compatible with that of international
standards (The National Horse Racing Authority of Southern Africa, 2016). The
horses that have historically performed better are handicapped more severely and will
therefore be assigned to carry heavier weights. In South Africa, the minimum
handicap is a riding weight, for both professional jockeys and apprentices, of 52 kg
and the maximum is 62 kg (Krog, 2015).
As the handicap weight includes the jockey, their riding gear and saddle, the jockey
needs to weigh two to four kilograms less than that of the handicap in order to be
employed for the ride. If their combined weight is less than that of the handicap, lead
weights (referred to as dead weight) up to approximately 2 kg can be added to the
saddle just prior to the race and heavier gear including the saddle and boots can be
used to make up the outstanding weight. If the jockey is too heavy on the day prior to
the race, they will have to rapidly lose weight, usually by means of saunas, exercising
in sweat suits and/or fluid restriction. This process of rapidly losing weight is commonly
referred to as “making weight”.
Apprentices also have to “make” weight to meet handicap requirements. To
compensate for their inexperience, they are given a “claiming allowance” of a
maximum of 4 kg in SA when riding in their initial qualifying races. In effect therefore
an apprentice jockey would ride at 4 kg lighter than a professional jockey for the same
14
ride. This means that they will be allowed to ride at handicaps which they would not
typically be able to make with their weight, gear and the saddle combined. For
example, if an apprentice weighs 46 kg and the handicap of the horse is 52 kg, the
apprentice can “claim” a total of 4 kg in addition to the weight of their riding gear and
saddle (± 2kg). This encourages the trainers to use the inexperienced apprentices as
the weight advantage could override their inexperience. The allowance is reduced to
2.5 kg when the apprentice accumulates 10 wins. After 40 wins, no claim can be made
(Krog, 2015). The pressure to maintain a lower weight therefore increases as the
apprentice gains experience.
Jockeys/apprentices are weighed immediately prior to and after each race. The two
weights may not differ by more than 500g (National Horse Racing Authority of South
Africa, 2016). They may ride several races on a given race day and their weight
requirements for each horse often differs. It is easier to “make” a heavier weight by
placing lead weights under their saddle or riding with heavier gear such as heavier
saddles. Trainers prefer not to put up a lot of dead weight as it is believed that live
weight balances a horse better, although an experimental study found no significant
differences between the impact of an experienced rider and an equivalent weight of
lead on the workload or locomotion of nine trained Dutch Warmblood horses (Sloet
van Oldruitenborgh‐Oosterbaan, Barneveld & Schamhardt, 1995). Making a lighter
weight presents a greater challenge, which generally involves various deleterious
weight-making techniques.
2.4 WEIGHT-MAKING TECHNIQUES
Horse racing differs from other weight category sports, such as boxing, light weight
rowing and wrestling, as there is no “off-season” and racing may take place seven
days a week (Warrington et al., 2009). There is therefore insufficient time to recover
in between race meetings and the jockeys are consistently required to make weight or
achieve low weights.
Various deleterious methods, both acute and chronic, have been used to achieve the
low weights required by handicapping (Wilson et al., 2013a). These methods are
typically culturally driven amongst the jockeys as they have been passed down by
previous generations (Labadarios et al., 1993; Moore, Timperio, Crawford, Burns &
15
Cameron-Smith, 2002b; Wilson et al., 2014) and therefore have no significant scientific
basis.
Acute weight-making techniques refer to techniques used to lose weight over a very
short period of time, usually for the purpose of making weight for a specific handicap
prior to a race. Common methods primarily involve dehydration (saunas, sweat suits,
diuretics and laxatives) and food and fluid restriction (Labadarios et al., 1993; Leydon
& Wall, 2002; Moore et al., 2002b; Cotugna, Snider & Windish, 2011; Dolan et al.,
2011; Wilson et al., 2014). The amount lost will depend on the handicapping
requirement, for example, if the jockey weighs 56 kg and needs to ride light at 52 kg,
then he/she will lose more than 4 kg to meet the requirement, taking into account the
weight of the saddle and gear.
To ensure sustained weight loss over an extended period of time and maintain a low
body weight, the jockey/apprentice will employ chronic weight-making techniques.
These include excessive exercise, food restriction, sporadic eating, the use of
laxatives and appetite suppressants as well as forced vomiting (Wilson et al., 2014).
A combination of acute and chronic weight-making techniques are employed.
King & Mezey (1987) interviewed ten professional English jockeys (jump and flat) aged
21 to 35 years and reported that all (100%) used saunas and exercised strenuously,
90% restricted food intake, 80% used sweat suits, 70% used laxatives, 60% used
diuretics, 20% used appetite suppressants and 10% reported vomiting as means to
make weight. Binge eating was reported by 60%, although other studies did not report
on binge eating. Only one study has investigated weight-making methods used by
professional flat jockeys in South Africa. Labadarios et al. (1993) conducted a
descriptive study involving 93 South African male flat jockeys and found that 75%
smoked cigarettes regularly, 77% restricted food and fluid intake, 70% used saunas,
70% used diuretics, 48% exercised in sweat suits, 48% used appetite suppressants,
27% used hot baths and 27% used laxatives in order to control and/or make weight.
The use of diuretics and laxatives to make weight for jockeys was banned
internationally in 1999, however studies have reported the use of such substances by
jockeys for weight-making purposes since (Leydon & Wall, 2002; Moore et al., 2002b;
Dolan et al., 2011). Nine years after Labadarios et al. (1993), a descriptive study that
included 116 Australian flat jockeys (91 male and 25 female), 11 of which were
16
apprentices, found that 76% exercised, 75% skipped meals, 68% used saunas, 48%
smoked cigarettes, 39% used diuretics, and 26% used laxatives in order to make or
control their weight (Moore et al., 2002a). The study did not differentiate between the
strategies used by professional and apprentice jockeys. In New Zealand, Leydon &
Wall (2002) investigated the weight-making practises of nine apprentice and nine
professional jockeys (male and female) and reported that 67% restricted food intake,
56% used saunas, 56% restricted fluids, 28% took hot baths, 22% exercised, 17%
used laxatives and 22% used other methods in order to make weight. Twenty-eight
percent also reported using laxatives in an attempt to lose weight in the past.
When the reports of the apprentice jockeys were isolated, the results were similar:
67% used saunas, 67% restricted food intake, 56% restricted fluid intake, 33%
exercised, none used diuretics or laxatives and 22% used other methods to make
weight at the time of the study. Weight-making techniques were more prevalent in the
male participants than the females. Dolan et al. (2011) interviewed 21 male
professional Irish jockeys (flat and jump) with a mean age of 27.3 years and found that
86% used the sauna, 81% exercised to sweat and 71% restricted food intake as
means to make weight. Cotugna et al. (2011) interviewed 20 American professional
flat jockeys, aged 21 to 54 years, and reported that 60% used the sauna, 40%
exercised, 35% restricted food intake, 10% vomited after eating and 5% restricted
fluid. Fifteen percent reported not using any techniques to make weight. The same
study found that the most common pattern of daily intake on race days was eating very
little (coffee, energy drinks, a piece of fruit, a granola bar) until after racing and then
consuming a large meal for dinner. When not racing, only 50% consumed three
regular meals per day and 10% reported eating similarly to race days with a larger
quantity of food at each eating time. An experimental study, which tested the effects
of acute dehydration on physical and cognitive function, involving eight professional
jockeys, six of which were jump and two flat, reported that all (100 %) dieted and
exercised in sweat suits, 75% used the sauna, 62% restricted food and fluids, 37%
used hot or salt baths, 25% fasted and 50% used other methods to make or lose
weight (Wilson, Hawken, Poole, Sparks, Bennett, Drust, Morton & Close, 2013b). This
study included a majority of jump jockeys who may face less pressure to lose weight
due to higher minimum weight requirements. Cullen (2014) conducted a descriptive
study which investigated the weight-making habits of 33 retired male flat jockeys from
17
Ireland during their career and found that all (100%) reported restricting energy intake,
97% exercised excessively, 91% restricted fluid, 79% used hot baths, 73% used
saunas, 61% used diuretics, 61% used laxatives, and 6% vomited as a means to make
weight for races. A recent study involving 20 male professional jockeys based in Hong
Kong, found from a questionnaire that 26% used saunas, 20% restricted fluid intake,
20% wore plastic clothing, 16% exercised excessively, 15% exercised to sweat and
4% vomited in order to make or control weight (O’Reilly, Cheng & Poon, 2017).
Very little literature has been published regarding the practices of jockey apprentices
in South Africa. Krog (2015) studied 21 male flat jockey apprentices training at the
SAJA and found that 67% restricted food intake, 48% exercised to sweat and 43%
used saunas suggesting that some of the traditionally used methods of the
professionals had been passed down to the apprentices. Additionally, 81% reported
avoiding situations with food, 71% followed their own diet, 67% would skip lunch and
52% would keep busy to avoid eating.
As the most common techniques of both acute and chronic weight loss in the jockeys
and apprentices involved dehydration and food restriction, it is important to explore the
prevalence and implications of these techniques.
2.4.1 Dehydration
Acute weight loss by dehydration is a frequently used method. Warrington et al. (2009)
conducted a descriptive study which assessed the hydration status of seventeen flat
jockeys and ten jump jockeys using USG (TS400 refractometer). They reported mild
dehydration (mean USG 1.022 g/ml) for both flat and jump jockeys on a non-race day
using a cut-off value of 1.020 g/ml (Sawka, Burke, Eichner, Maughan, Monatin &
Stachenfeld, 2007) indicating that the professional jockeys were chronically
dehydrated. Dehydration increased significantly on an official race day (mean USG
1.028 g/ml) with severe dehydration (USG >1.030 g/ml) reported in 54% of the 11 flat
jockeys (Case, Armstrong, Hillman, Montain, Reiff, Rich, Roberts & Stone, 2000).
A cross-sectional observational study including 47 male American flat jockeys
reported mild dehydration (mean USG of 1.021 g/ml) on typical race days but found
that those with a high USG (>1.028 g/ml) had body weights significantly heavier than
those with a USG <1.028 g/ml (54.2 kg vs. 52.1 kg; p=0.001) (Benardot, Thompson,
18
Hutchinson, Roman, Hedrick & Reynaud, 2008). Higher USG readings were
significantly associated with heavier body weights in male jockeys, as heavier jockeys
are more inclined to resort to dehydration strategies to ‘make’ a desired weight. This
reinforces the need for accurate measurements of %BF to assist in healthy weight
control and reduce the need for these techniques as the %BF will determine the lowest
body weight the jockey can attain without compromising FFM.
In addition to presenting a number of detrimental consequences to the
jockey/apprentices’ health and performance (Dolan, Cullen, McGoldrick & Warrington,
2013; Wilson et al., 2013b; García-Trabanino, Jarquín, Wesseling, Johnson,
González-Quiroz, Weiss, Glaser, Vindell, Stockfelt & Roncal, 2015), a state of
dehydration may impact the accuracy of weight and body fat measurement
(Thompson, Thompson, Prestridge, Bailey, Bean, Brown & McDaniel, 1991; Saunders
et al., 1998; Pialoux, Mischler, Mounier, Gachon, Ritz, Coudert & Fellmann, 2004).
The impact of dehydration in jockey/apprentices on the reliability of various methods
of measuring body composition must therefore be assessed.
2.4.2 Food restriction
Restricting food intake is another popular method of controlling weight (King & Mezey,
1987; Labadarios et al., 1993; Moore et al., 2002a; Leydon & Wall, 2002; Dolan et al.,
2011; Cotugna et al., 2011; Cullen, 2014; Krog, 2015; O’Reilly et al., 2017) which may
present detrimental consequences to the physical and psychological health of the
jockeys.
2.4.2.1 Relative energy deficiency in sport
Restricting food intake, restricts energy consumption, which can result in an
insufficient energy availability (EA). Krog (2015) reported a low mean calculated EA
of 113.28 kJ/kg FFM in the SAJA apprentices over two training days and one rest day,
which is less than the recommended 125 kJ/kg FFM for male athletes (Sundgot-
Borgen, Meyer, Lohman, Ackland, Maughan, Stewart & Müller, 2013). A more
comprehensive term for the syndrome previously known as ‘Female Athlete Triad’,
was introduced by the International Olympic Committee (IOC): ‘Relative Energy
Deficiency in Sport’ (RED-S), due to the complexity of the syndrome and the fact that
19
male athletes are also affected (Mountjoy et al., 2014). It refers to impaired
physiological function including, but not limited to, bone health, protein synthesis,
immunity, metabolic rate, menstrual function and cardiovascular health caused by
relative energy deficiency. Relative energy deficiency is a deficiency of energy relative
to the balance between dietary energy intake and energy expenditure required for
health and activities of daily living, growth and sporting activities, which connotes that
low energy availability can occur even in the scenario where energy intake and total
energy expenditure are balanced (Mountjoy, Sundgot-Borgen, Burke, Carter,
Constantini, Lebrun, Meyer, Sherman, Steffen & Budgett, 2015).
2.4.2.2 Bone health
A healthy EA is particularly important for young athletes like apprentice jockeys as
peak BMD for males typically occurs before the age of 20 years (Cvijetić Avdagić,
Colić Barić, Keser, Cecić, Šatalić, Bobić & Gomzi, 2009; Berger, Goltzman,
Langsetmo, Joseph, Jackson, Kreiger, Tenenhouse, Davison, Josse & Prior, 2010).
Leydon & Wall (2002) reported that 44% of the flat jockeys were osteopenic. This was
attributed to insufficient calcium intake as a result of food restriction as 58% of the
males consumed less than 60% of the recommended daily intake (RDI) of calcium
according to their seven-day weighed food records. Warrington et al. (2009) found
that 53% of flat jockeys were osteopenic and 12% had osteoporosis, which was
suggested to be a result of insufficient EA.
This is of concern due to the high risk of injury from falling in horse racing. Waldron-
Lynch, Murray, Brady, McKenna, McGoldrick, Warrington, O’Loughlin & Barragry
(2010) reported a mean frequency of 3.2 fractures per rider (at the current point in their
career) in a sample of 27 professional male jockeys (17 flat and 10 jump) with a mean
age of 25.5 years. Both professional and apprentices flat racing jockeys were reported
to have a 44% rate of injury per fall, which is significantly higher than that of jump
jockeys, according to a meta-analysis reporting falls, injuries and concussions in
jockeys between 2006 and 2007 (Rueda, Halley & Gilchrist, 2010).
Psychological consequences, such as abnormal eating behaviours can also either
precede or be the result of RED-S (Mountjoy et al., 2015).
20
2.4.2.3 Abnormal eating behaviours
Due to chronic food restriction, abnormal eating behaviours associated with an
increased risk of developing eating disorders such as AN and BN are of concern in the
horse racing industry. The Eating Attitudes Test (EAT-26) questionnaire has been
utilised in several studies to assess the risk of developing eating disorders in jockeys
(Garner & Garfinkel, 1979; King & Mezey, 1987; Leydon & Wall, 2002; Caulfield &
Karageorghis, 2008; Wilson, Pritchard, Papageorgiou, Phillips, Kumar, Langan-
Evans, Routledge, Owens, Morton & Close, 2015)
King & Mezey (1987) reported a significantly higher mean EAT-26 score of 14.9 for
the male English jockeys studied when compared to age-matched controls, which
implied a high risk of AN and BN. However, the EAT-26 cut-off score to indicate risk
of eating disorders is 20. Although the number with an EAT-26 score greater than 20
was not reported, no cases of eating disorders were diagnosed according to a further
full psychiatric and eating interview. Leydon & Wall (2002) reported a lower mean
score of 13.5 in the male and female professional New Zealand jockeys, however 20%
had an EAT score of 20 or more. Using the EAT-26 questionnaire, Caulfield &
Karageorghis (2008) investigated the eating attitudes of 41 professional male jockeys
based in the United Kingdom. Both jump and flat jockeys were included but the ratio
was not specified. Descriptive data was collected at three different weights. At their
lightest or minimum weight, which necessitated acute weight loss by methods
commonly used to make weight for a “light” ride, the mean EAT-26 score was 8.56.
At their optimal weight, which was described as when the jockey felt he was healthy
and not wasting, the mean EAT-26 score was 6.78. Finally, at a relaxed weight, which
was during a time that the jockey was not required to lose or maintain weight as no
“light” rides were impending, the mean score was 6.17. Statistically significant
differences were found between the mean scores at the different weights. Twenty
percent (8/41) scored more than twenty, six of which only scored 20 or more at their
lightest weight, and were thus categorised as at risk of eating disorders. These
participants were advised to seek psychological support as recommended by Garner
& Garfinkel (1979). An intervention study by Wilson et al. (2015) measured the EAT-
26 scores of nine professional flat (eight male and one female) and five professional
male jump jockeys in England before and after an individually prescribed six-week diet
21
and exercise intervention which aimed to reduce body fat while maintaining FFM.
Before the intervention, the mean EAT-26 score was 14.8. This was non-significantly
reduced to 11.0 after the intervention. Twenty-nine percent scored 20 or above,
indicating risk of eating disorders. By comparing these studies, it can be seen that the
results are all in agreement with one another, with the exception with that of Caulfield
& Karageorghis (2008).
Although no eating disorders were diagnosed in these studies, despite the high
prevalence of disordered eating, eating disorders in males, specifically male athletes
who are encouraged to maintain low body weights, may be underreported. This may
be due to the gender bias in the Diagnostic and Statistical Manual of Mental Disorders,
fourth edition (DSM-IV) criteria for eating disorders, which indicates that amenorrhoea
is a specification for AN (Strother, Lemberg, Stanford & Turberville, 2012; Mitchison,
Hay, Griffiths, Murray, Bentley, Gratwick‐Sarll, Harrison & Mond, 2017). Additionally,
underreporting may result from shame associated with the stereotype that eating
disorders afflicts only females and male homosexuals (Murray, 2017). Underreporting
of symptoms of eating disorders is not uncommon in athletes due to poor credibility of
efforts to ensure confidentiality (Joy, Kussman & Nattiv, 2016).
It is therefore important to assess the impact of food restriction on the apprentices’ risk
of eating disorders as well as to be able to measure %BF accurately so that weight
can be controlled appropriately to minimize these consequences
2.5. PERCENT BODY FAT OF JOCKEYS AND APPRENTICES
There may be scope for the jockeys to reduce their %BF in order to make weight for
races using a healthier, more sustainable approach instead of resorting to weight-
making techniques which may pose risks to their health. The mean %BF of male flat
jockeys measured by dual x-ray absorptiometry (DXA) has been reported to be
significantly lower than that of male professional jump jockeys according to Warrington
et al. (2009) (8.99 % versus 10.42 %) and Dolan, Crabtree, McGoldrick, Ashley,
McCaffrey & Warrington (2012a) (8.26 % versus 13.84 %, measured by DXA). Wilson
et al. (2013a) however reported no significant differences (13.0 % versus 11.5 %,
measured by DXA). Nevertheless, this literature review will focus on the %BF of male
flat jockeys.
22
Little data exists on the %BF of jockey apprentices. The descriptive study by Leydon
& Wall (2002) reported a non-statistically significant higher mean %BF in male jockey
apprentices (12.3%) compared to male professionals (10.7%), according to DXA. It is
however important to note that of the 11 apprentices, only two were male and of the
nine professionals, only four were male. Therefore the sample size can be considered
too small to be an accurate representation of average male professional and
apprentice jockey %BF. The study suggested that the %BF of apprentices is
comparable to that of professionals, considering the lack of data on apprentices.
Krog (2015) estimated the %BF of 21 male apprentices at the SAJA using BIA
(BODYSTAT®1500 MDD, Bodystat Ltd) and reported a mean %BF of 12.2 %.
The results of studies published on the %BF of jockeys are summarised in Table 2.1.
The mean %BF represented appear to be similar, with the exception of that of O’Reilly
et al. (2017). The relative difference may be a consequence of using the skinfold
equation by Durnin & Womersley (1974) equation instead of DXA. Labadarios et al.
(1993) and Dolan et al. (2013) also used skinfolds, however, Labadarios et al. (1993)
did not disclose which equation was used and Dolan et al. (2013) used the Withers,
Craig, Bourdon & Norton (1987) equation.
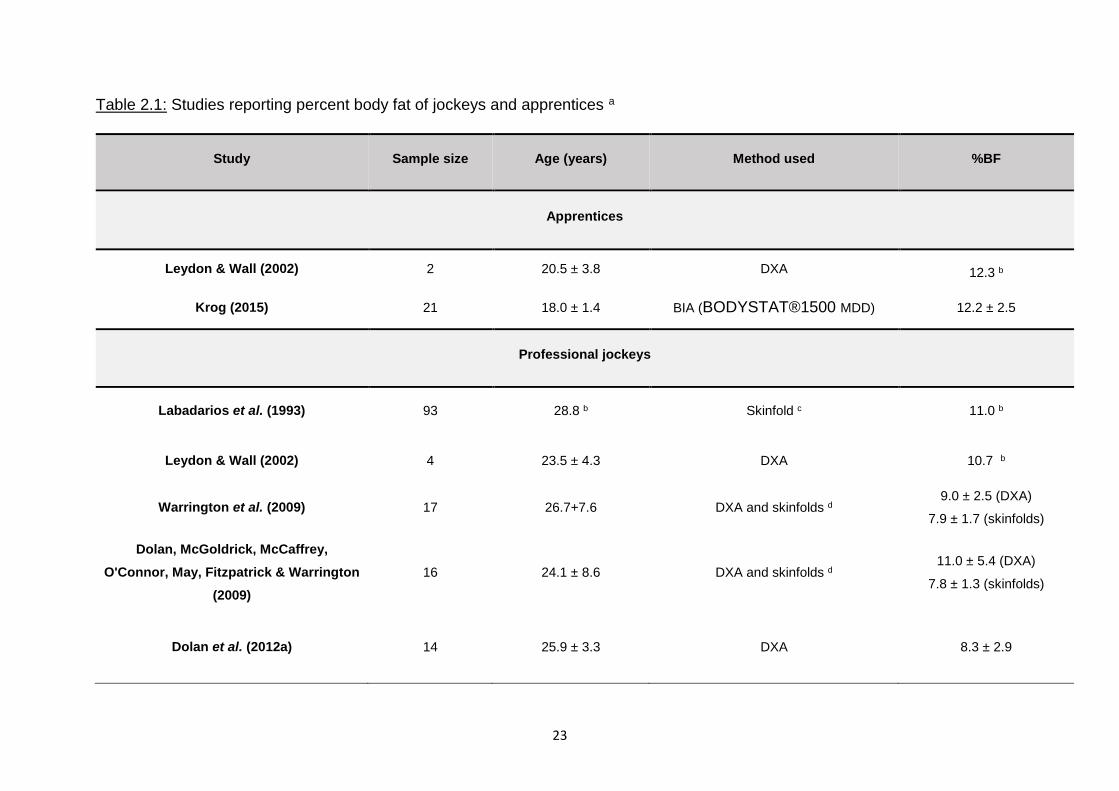
23
Table 2.1: Studies reporting percent body fat of jockeys and apprentices a
Study Sample size Age (years) Method used %BF
Apprentices
Leydon & Wall (2002) 2 20.5 ± 3.8 DXA 12.3 b
Krog (2015) 21 18.0 ± 1.4 BIA (BODYSTAT®1500 MDD) 12.2 ± 2.5
Professional jockeys
Labadarios et al. (1993) 93 28.8 b Skinfold c 11.0 b
Leydon & Wall (2002) 4 23.5 ± 4.3 DXA 10.7 b
Warrington et al. (2009) 17 26.7+7.6 DXA and skinfolds d 9.0 ± 2.5 (DXA)
7.9 ± 1.7 (skinfolds)
Dolan, McGoldrick, McCaffrey,
O'Connor, May, Fitzpatrick & Warrington
(2009)
16 24.1 ± 8.6 DXA and skinfolds d 11.0 ± 5.4 (DXA)
7.8 ± 1.3 (skinfolds)
Dolan et al. (2012a) 14 25.9 ± 3.3 DXA 8.3 ± 2.9
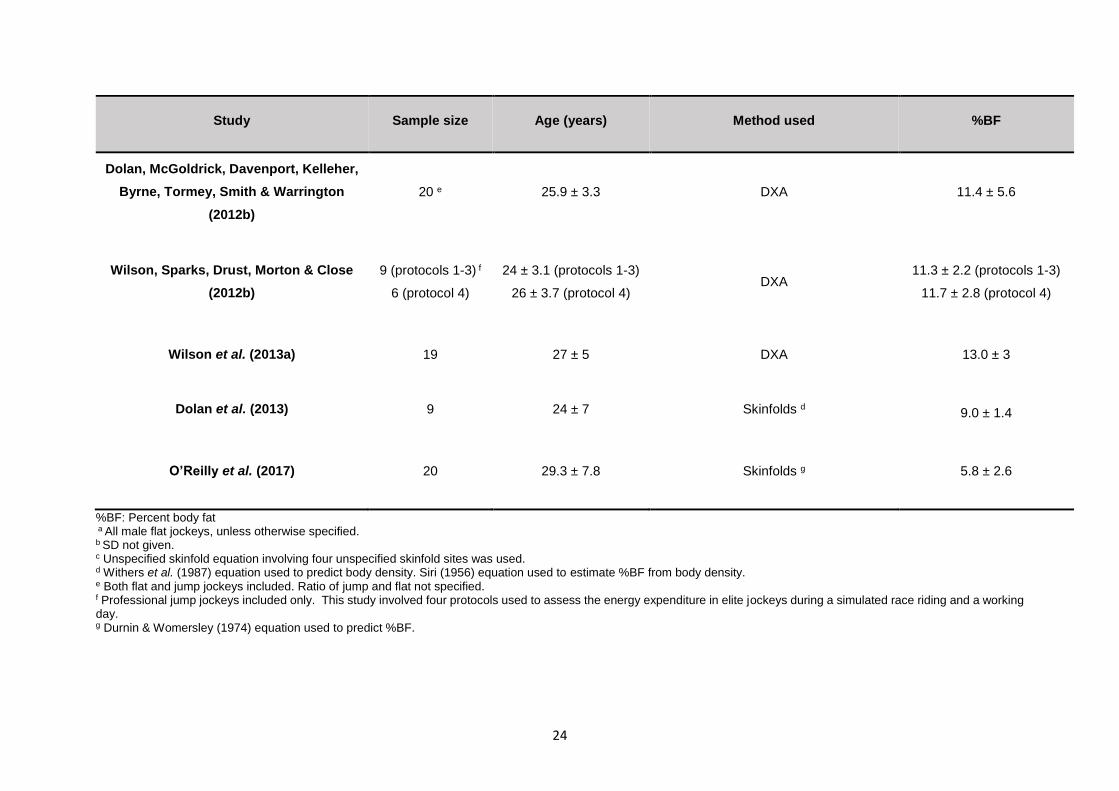
24
Study Sample size Age (years) Method used %BF
Dolan, McGoldrick, Davenport, Kelleher,
Byrne, Tormey, Smith & Warrington
(2012b)
20 e 25.9 ± 3.3 DXA 11.4 ± 5.6
Wilson, Sparks, Drust, Morton & Close
(2012b)
9 (protocols 1-3) f
6 (protocol 4)
24 ± 3.1 (protocols 1-3)
26 ± 3.7 (protocol 4) DXA
11.3 ± 2.2 (protocols 1-3)
11.7 ± 2.8 (protocol 4)
Wilson et al. (2013a) 19 27 ± 5 DXA 13.0 ± 3
Dolan et al. (2013) 9 24 ± 7 Skinfolds d 9.0 ± 1.4
O’Reilly et al. (2017) 20 29.3 ± 7.8 Skinfolds g 5.8 ± 2.6
%BF: Percent body fat a All male flat jockeys, unless otherwise specified. b SD not given. c Unspecified skinfold equation involving four unspecified skinfold sites was used.
d Withers et al. (1987) equation used to predict body density. Siri (1956) equation used to estimate %BF from body density. e Both flat and jump jockeys included. Ratio of jump and flat not specified. f Professional jump jockeys included only. This study involved four protocols used to assess the energy expenditure in elite jockeys during a simulated race riding and a working day. g Durnin & Womersley (1974) equation used to predict %BF.
25
2.6 IMPORTANCE OF ACCURATE MEASUREMENT OF PERCENT BODY FAT
The accurate assessment of %BF is important in the jockey population for appropriate
weight loss and to optimize performance (Wilson et al., 2012a).
Although it is essential for a jockey to have a lower body weight for racing, it is
important to maintain a healthy body composition. The body is composed of fat mass
(FM) and FFM. Fat-free mass consists of water, muscle, connective tissue, organ and
bone mass (Ackland et al., 2012). Jockeys should aim to maintain an optimal level of
FFM during weight loss, making loss of fat mass favourable. Therefore accuracy with
measurement is important to ensure that the loss is not FFM.
2.6.1 Importance of fat-free mass
Higher levels of FFM have been associated with better postural balance (Alonso et al.,
2012) which could assist the jockey to remain stable and maintain control while riding
and reduce the risk of falls. This is important as flat horse racing is associated with a
high risk of falls, injuries and subsequent fractures (Rueda et al., 2010; Waldron-Lynch
et al., 2010). Maintaining a healthy BMD is also important to prevent fractures as a
result of a fall. Dolan et al. (2012a) measured the BMD of 58 male participants (14 flat
jockeys, 16 jump jockeys, 14 elite amateur boxers and 14 age, gender and BMI-
matched controls) using DXA and concluded that FFM is the primary significant
positive predictor of BMD.
Fat-free mass is positively correlated with resting metabolic rate (RMR) (Cunningham,
1991), therefore maintaining FFM is also essential to sustained weight loss, an
important consideration for the jockey. Cunningham (1991) proposed the only general
equation based on FFM to estimate RMR. This has been validated in athletes in
comparison to 11 RMR prediction equations including that of Harris & Benedict (1918),
Owen, Holup, D'Alessio, Craig, Polansky, Smalley, Kavle, Bushman, Owen & Mozzoli
(1987), Mifflin, St Jeor, Hill, Scott, Daugherty & Koh (1990), Thompson & Manore
(1996) and Lohman, Harris, Teixeira & Weiss (2000). Kim, Kim, Kim, Park & Kim
(2015) recommended the use of the Cunningham (1991) for athletes as it has the
closest correlation to indirect calorimetry. The accurate measurement of FFM
therefore will assist the accurate estimation of RMR. In turn this is important in order
26
to appropriately prescribe daily energy intake in order to achieve or maintain a specific
body mass.
Therefore, maintenance of healthy levels of FFM in jockeys/apprentices may reduce
the risk of falls and fractures and assist in weight control.
2.6.2 Importance of fat mass
Jockey/apprentice’s need to reduce their %BF to the minimum acceptable range which
does not present a risk to their health. Essential fat is found in the bone marrow, lungs,
heart, kidneys, liver, muscles, intestine and central nervous system. There is no
known amount of essential fat for adolescent males. The amount of essential fat
required by healthy active adult men is four to six %BF or ~2.5 kg according to Friedl,
Moore, Martinez-Lopez, Vogel, Askew, Marchitelli, Hoyt & Gordon (1994). This was
based on the results of an experimental study involving 55 healthy young men (mean
age 24.6 years) who underwent an eight-week army combat training course which
involved a very low energy intake and strenuous exercise, resulting in a 15.7 % weight
loss. Once the men reached a %BF of four to six percent, which was measured using
DXA, subsequent weight loss was due to loss of FFM. Essential fat therefore is
protected by FFM which is expended for energy when storage fat is depleted (Norgan,
1997a).
However, an amount of storage fat is important to prevent the catabolism of FFM for
energy. Gallagher, Heymsfield, Heo, Jebb, Murgatroyd & Sakamoto (2000) proposed
a healthy %BF range of eight to 20 percent for all males aged 20 to 39 years according
to a four component (4-C) model. This range corresponded to a BMI of 18.5 to 25
kg/m2 in 613 young African American and Caucasian males aged 20 to 39 years.
Borrud, Flegal, Freedman, Li & Ogden (2011) established %BF-for-age percentiles
according to DXA for children aged eight to 20 years which correspond to that of the
BMI-for-age percentiles. There is no established minimum %BF for jockeys or
apprentices.
Accurate measurements of %BF are therefore necessary to ensure that the minimal
optimal fat mass is maintained for performance and health while protecting the FFM.
27
2.7 METHODS OF MEASURING PERCENT BODY FAT
Changes in body weight alone fail to reflect favourable or unfavourable changes in
%BF as a result of dietary and training interventions. The selection of an appropriate
method of body composition analysis to measure %BF for a specific population
depends on the availability of funds and the importance of accuracy relative to cost
and practicality (Heyward, 2001).
Accurate measurement of body composition requires techniques that describe the
constituent components of the body. These components can be described as
chemical, where components are separated according to their molecular properties,
for example lipids and proteins, or they can be described as anatomical, which
separates components according to the type of tissue, for example adipose tissue.
Models of body composition analysis include four compartment (4-C) models, which
either divide components on a chemical level into fat mass, protein, water and other
or anatomically into adipose tissue, skeletal tissue, muscle and connective tissue and
other; three-component models (3-C), dividing the body into fat mass, bone mineral
and other; and two-component (2-C) which simply divides the body into fat mass and
FFM. Four-component models are the most reliable due to the variability in the density
of the components of FFM (Ackland et al., 2012). The techniques of analysis vary in
accuracy and practicality. Techniques of directly measuring fat mass, such as cadaver
dissection, multi-component models and medical imaging including Magnetic
Resonance Imaging (MRI) and Computed Tomography (CT), are the most accurate
but present a number of limitations including cost, time, feasibility and unnecessary
radiation exposure. These methods have been used validating other more feasible
laboratory methods (Ackland et al., 2012).
2.7.1 Laboratory methods
Laboratory or indirect methods include isotope dilution (hydrometry) such as DD, DXA,
densitometry including underwater weighing (UWW) and air displacement
plethysmography (ADP), ultrasound and three-dimensional (3D) photonic scanning
(Ackland et al., 2012). These methods have been validated against the direct
reference methods (cadaver dissection) and are therefore highly accurate yet
expensive and impractical for regular use. They are therefore referred to as reference
28
or “gold standard” methods (Ackland et al., 2012). To date, DXA is the only reference
method that has been used to measure the body composition of jockeys (Warrington
et al., 2009; Waldron-Lynch et al., 2010; Dolan et al., 2011; Dolan et al., 2012a; Dolan
et al., 2013; Wilson et al., 2013a; Wilson et al., 2014).
2.7.1.1 Duel X-ray Absorptiometry
Dual X-ray absorptiometry is a laboratory method used to predict %BF by estimating
an RST value, which is the ratio of soft tissue attenuation at two photon energies: 40
keV and 70 keV (Wang, Heymsfield, Chen, Zhu & Pierson, 2010). It was developed
from dual photon absorptiometry (DPA) which uses a 153-Gd radionuclide source,
however DXA provides total body scans with enhanced precision and less radiation
exposure in significantly less time (Mazess, Barden & Hanson, 1990). It involves
less exposure to radiation than MRI and CT scans, however caution is still
recommended against using on multiple occasions (Ackland et al., 2012). Total body
bone mineral content (BMC) correlates highly with actual skeletal mass and with total
body calcium by neutron activation analysis in vivo (Heymsfield, Wang, Lichtman,
Kamen, Kehayias & Pierson, 1989; Mazess, Barden, Bisek & Hanson, 1990)
because calcium is a constant fraction (about 38%) of the mineral component, or
calcium hydroxyapatite. Lohman et al. (2000) concluded that the estimates of %BF
from DXA are within one to three percent from reference methods but that a five
percent change in the water content of FFM affects estimates of %BF by one to 2.5
percent, therefore euhydration is essential for accurate measurement. Euhydration
needs to be ensured before DXA is used to measure %BF in jockeys due to their
tendency to be chronically dehydrated.
2.7.1.2 Deuterium Dilution
Deuterium dilution, the laboratory technique used as the reference method for the
measurement of %BF in this study, has not previously been used in the jockey
population. The technique uses deuterium, a stable isotope of hydrogen, ingested as
deuterium oxide, to measure total body water (TBW) and so estimate FM and FFM
(International Atomic Energy Agency, 2010). The technique has been validated
against reference standards using 3-C and 4-C models in healthy subjects and is
29
accepted as a reference method (Fuller, Jebb, Laskey, Coward & Elia, 1992). It is a
costly method as it relies on the purchase of deuterium oxide as well as expensive
laboratory equipment and technical expertise, however the technique was used in this
study as the local expertise, deuterium oxide and appropriate laboratory facilities were
available. The technique assumes a constant hydration of 72 to 73%, therefore
variations in hydration status as for DXA can confound the results (Wang, Deurenberg,
Wang, Pietrobelli, Baumgartner & Heymsfield, 1999; Ackland et al., 2012).
2.7.2 Field methods
Field methods are most commonly used to measure and monitor body composition for
sport and health purposes, due to their ease of use and low cost (Ackland et al., 2012).
These include the measurement of skinfolds and BIA. Body mass index can also be
considered a field method to estimate %BF. The accuracy of these methods varies
according to sample population as well as conformity to standardised techniques
(Wells & Fewtrell, 2006).
2.7.2.1 Body Mass Index
Body mass index is a commonly used equation to classify individuals according to
adiposity, for example, obese, overweight, normal or underweight. Equations have
been developed to estimate %BF from BMI. Deurenberg et al. (1991c) derived an
equation from the results of a descriptive study involving 521 males and 708 females
in the Netherlands, aged seven to 83 years, using UWW as the reference. The
equation produced for adults older than 15 years was:
%BF = 1.20 x BMI + 0.23 x age (years) - 10.8 x sex (males = 1, females = 0) - 54
Gallagher et al. (2000) later derived an age and gender-specific equation from the
results of a descriptive study conducted in the United States of America (USA), the
United Kingdom (UK) and Japan from a sample of 1013 non-athletic adult women and
613 adult men of various ethnicities (African America, Asian and Caucasian) using a
4-C model involving DXA, deuterium and tritium dilution and UWW as the references.
However, the mean age of the males included was 51.4 (black), 46.7 (Asian) and 48.1
(white) years which did not match that of the jockey apprentices and this equation was
therefore excluded.
30
The strength of the relationship between BMI and %BF has been argued. A
descriptive study by Meeuwsen, Horgan & Elia (2010b), involving 11 582 male and 12
044 female Scottish non-athletic subjects ranging from 18 to beyond 70 years of age,
demonstrated a nonlinear association between BMI and %BF measured by single
frequency two compartment BIA (BODYSTAT®1500). The relationship between BMI
and %BF was curvilinear or quadratic, meaning that the association weakened as the
BMI decreased. The correlation was weak for males in the BMI range 20 to 25 kg/m2,
into which the jockey/apprentices fall (Krog, 2015), and only showed a strong
correlation for males with a BMI greater than 25 kg/m2. A cross-sectional study
involving 287 males (192 athletes from various sports and 95 controls) and 191
females (87 athletes and 104 controls) assessed the relationship between BMI and
%BF determined by skinfold measurements. A weak relationship between BMI and
%BF was found for both athletes and controls (Nevill, Stewart, Olds & Holder, 2006).
It is important to consider the effect of height on the accuracy of BMI and other
regression equations for %BF analysis, since height is used as a variable in some
(Lukaski, Bolonchuk, Hall & Siders, 1986; Segal, Van Loan, Fitzgerald, Hodgdon &
Van Itallie, 1988; Boulier, Fricker, Thomasset & Apfelbaum, 1990; Heitmann, 1990;
Deurenberg, Van der Kooy, Leenen, Weststrate & Seidell, 1991b; Houtkooper, Going,
Lohman, Roche & Van Loan, 1992; Lohman, 1992; Organ, Bradham, Gore & Lozier,
1994; De Lorenzo, Iacopino, Andreoli & Petrone De Luca, 1998; Kyle, Genton,
Karsegard, Slosman & Pichard, 2001; Sun et al., 2003). By necessity of their
profession, flat jockeys are required to be of short stature (SS). Mean heights of
between 1.59 to 1.68 m have been reported amongst professional jockeys (Labadarios
et al., 1993; Leydon & Wall, 2002; Moore et al., 2002b; Dolan et al., 2009; Warrington
et al., 2009; Cotugna et al., 2011; Dolan et al., 2012a; Dolan et al., 2012b; Wilson et
al., 2012b; Dolan et al., 2013; Wilson et al., 2013a; Jackson, Sanchez-Santos,
MacKinnon, Turner, Kuznik, Ellis, Box, Hill, Javaid & Cooper, 2017; O’Reilly et al.,
2017). This is similar to the height of apprentice jockeys which ranged from 1.58 to
1.67 m (Leydon & Wall, 2002; Moore et al., 2002b; Cullen, Dolan, McGoldrick, Brien,
Carson & Warrington, 2015; Krog, 2015; Silk, Greene, Baker & Jander, 2015). The
mean height of South African young adult males aged 15 to 24 years (1.69 m, range
1.678 -1.693) according to the South African National Health and Nutrition
31
Examination Survey (SANHANES) of 2012 (Shisana, Labadarios, Rehle, Simbayi,
Zuma, Dhansay, Reddy, Parker, Hoosain & Naidoo, 2014).
To date, no studies have investigated the impact of SS on the validity of methods to
measure %BF. A descriptive study by López-Alvarenga, Montesinos-Cabrera,
Velázquez-Alva & González-Barranco (2003) in Mexico compared the %BF according
to BIA of 58 SS individuals with 58 BMI-matched controls of normal stature. Short
stature was defined as women with a height less than or equal to 1.5 metres and men
less than or equal to 1.6 metres. The mean %BF of the SS individuals was significantly
higher (p = 0.04) than that of the controls (López-Alvarenga et al., 2003). This
reinforces the need to validate methods of measuring %BF that involve height as a
variable, such as BMI and BIA, in the jockey apprentice population.
To date, no studies have assessed the relationship between BMI and %BF in jockeys
or apprentices. It is important to determine the accuracy of BMI to predict %BF in
jockey apprentices as this could provide a very practical and inexpensive alternative
to other field methods.
2.7.2.2 Skinfold measurements
Skinfold measurements are a practical, quick and cost-effective method of measuring
body composition (Ackland et al., 2012). They are commonly used to assess body
composition in sport and was the current method to measure %BF at the SAJA. This
method involves the measurement of skinfold thickness at specific body sites.
Raw skinfold thickness measurements, and the sum thereof, may be used to assess
and monitor body fatness, which is an indicator of nutritional status in both athletes
and non-athletes (Wells & Fewtrell, 2006). This technique simply allows one to assess
whether there has been a loss or gain in fat mass, but cannot be validated for specific
populations. In order to derive %BF values, population-specific regression equations,
which have been validated against reference methods, must be applied.
The use of regression equations involve the substitution of skinfold measurements, or
sum thereof, into an equation to estimate either %BF or body density (BD), which can
be translated into %BF using the following equations:
For white adults: Siri (1961): %BF = (4.95/BD − 4.50) × 100 or
32
Brozek, Grande, Anderson & Keys (1963): %BF = (4.57/BD − 4.142) × 100
These equations assume that FM has a density of 0.9007 g/cm3 and FFM has a
density of 1.1 g/cm3. They also assume constant proportions and densities of the
components of FFM: water (73.8% and 0.9937 g/cm3), protein (19.4% and 1.34 g/cm3)
and mineral (6.8% and 3.038 g/cm3) for all individuals (Brozek et al., 1963). However,
these may vary according to race and age.
For black adults, the following equations have been recommended:
Schutte, Townsend, Hugg, Shoup, Malina & Blomqvist (1984): %BF = [(4.374/BD) -
3.928] x 100 or
Wagner, Heyward, Kocina, Stolarczyk & Wilson (1997): %BF = [(4.858/BD) - 4.394] x
100
However, in studies where BD equations have been proposed without considering
race (Durnin & Rahaman, 1967; Forsyth & Sinning, 1973; Durnin & Womersley, 1974;
Withers et al., 1987; Deurenberg, Pieters & Hautvast, 1990), both the Siri (1961) and
Brozek et al. (1963) were recommended to translate BD onto %BF. Slaughter,
Lohman, Boileau, Horswill, Stillman, Van Loan & Bemben (1988) also recommended
Siri (1961) for both blacks and whites.
Skinfold measurements are popular due to the low cost and ease of use (Ackland et
al., 2012). However, there is an assumption that there is a fixed relationship between
subcutaneous adipose tissue (SAT) at specific skin sites and total body fat. This
relationship has been found to be influenced by age and sex (Durnin & Womersley,
1974), race (Vickery, Cureton & Collins, 1988; Wagner & Heyward, 2000) and
adiposity (Beddoe & Samat, 1998). The impact of dehydration should also be
considered. Accuracy is also affected by the measurement technique of the observer
and interobserver variability, the number of sites measured (Hume & Marfell-Jones,
2008) as well as the equations used (Sinning, Dolny, Little, Cunningham, Racaniello,
Siconolfi & Sholes, 1985).
2.7.2.2.1 The impact of age and sex
Durnin & Womersley (1974) demonstrated that different regression equations for
skinfolds need to be used in order to achieve acceptable variability for males and
33
females, as well as different age groups, as the regression lines produced for BD
relative to skinfold thickness were significantly different for the different age groups
and sexes. This means that a given skinfold corresponds to a significantly different
BD between males and females and different age groups. It was also implied that a
greater proportion of BF content is situated internally as opposed to subcutaneously
in females as a given skinfold corresponded to a significantly lower BD. This was
supported by Himes, Roche & Siervogel (1979), who showed that there was a
significantly greater variability in skinfold compressibility in males compared to females
in a sample of 69 adolescents and young adults.
Slaughter et al. (1988) and Deurenberg et al. (1990) also showed how BD measured
by skinfolds varied according to maturation status using the classification described
by Marshall & Tanner (1968) which is based on the extent of hair covering the pubic
region in six stages (p1 to p6). Separate equations were proposed for pre-pubertal
(p1 to p2), pubertal (p3 to p4), post-pubertal (p5 to p6) and adult (p6 onwards) subjects
(see table 2.2). However, in the study by Slaughter et al. (1988), this only applied
when the combination of the triceps and subscapular skinfolds was used to calculate
BD. When the combination of the triceps and calf skinfolds was used instead, there
was no significant effect of maturation. This combination actually proved to account
for greater variance and a lower standard error of measurement (SEE). Deurenberg
et al. (1990) did not include subjects classified as adults according to Marshall &
Tanner (1968). The mean age of the post-pubertal males in this study was 17.5 and
the maximum age was 20 years.
2.7.2.2.2 The impact of race
Vickery et al. (1988) compared %BF measured using the seven skinfold equation by
Jackson & Pollock (1978) with UWW, in a sample of 140 black and 179 white male
subjects aged 18 to 32 years. The skinfold equation calculated a significantly higher
BD for the black subjects compared to the white subjects, yet the skinfold
measurements were not significantly different. These results suggest that race has a
significant impact on the prediction of BD from skinfolds in young males. The study
proposed the use of separate regression equations to calculate BD from the same
seven skinfolds (triceps, subscapular, chest, mid-axilla, supra-iliac, abdomen and
thigh) in black and white males. The individual skinfolds significantly influenced by
34
race were the chest, abdomen and thigh. Slaughter et al. (1988) reported that the
impact of race was only significant when the combination of the triceps and
subscapular skinfolds was used to calculate BD. When the combination of the triceps
and calf skinfolds was used instead, there was no significant effect of race. In contrast,
Evans, Rowe, Misic, Prior & Arngrimsson (2005) also proposed a new equation that
included race as a variable due to the significant impact of race on %BF determined
by skinfolds. The proposed equations included either seven skinfolds (subscapular,
triceps, chest, mid-axilla, supra-iliac, abdominal and thigh) or three skinfolds
(abdominal, thigh and triceps).
Many studies have derived skinfold equations from white subjects only (Sloan, 1967;
Katch & McArdle, 1973; Lohman, 1981; Lean, Han & Deurenberg, 1996; Rodriguez,
Moreno, Blay, Blay, Fleta, Sarria & Bueno, 2005; Peterson, Czerwinski & Siervogel,
2003), whereas other studies that have produced valid skinfold equations did not
consider race as a variable (Durnin & Rahaman, 1967; Forsyth & Sinning, 1973;
Durnin & Womersley, 1974; Jackson & Pollock, 1978; Withers et al., 1987; Deurenberg
et al., 1990; Van der Ploeg, Gunn, Withers & Modra, 2003).
2.7.2.2.3 The impact of adiposity
Beddoe & Samat (1998) assessed the variability of %BF measured by four skinfolds
using the Durnin & Womersley (1974) equation in a sample of 33 males and 35 female
using hydrometry (tritium dilution) and neutron activation as a reference. Significantly
greater variation between the two methods was found in individuals with higher %BF
according to the reference method. This suggests that there is a more constant
relationship between subcutaneous fat and total body fat in leaner individuals, making
the skinfold method more accurate for measuring %BF in leaner individuals. This
reflects in favour of this method in the jockey apprentice population as they do not
have high levels of %BF.
2.7.2.2.4 The impact of dehydration
The impact of hydration status on the prediction of %BF from skinfolds was evaluated
using three skinfold sites (triceps, subscapular and abdomen) and the equation by
Lohman (1981) was assessed on 66 male wrestlers with a mean age of 20.2 years
(Utter, Goss, Swan, Harris, Robertson & Trone, 2003) and 114 male wrestlers aged
15 to 17 years (Demirkan et al., 2014). Both studies reported no significant difference
35
between %BF calculated in a euhydrated state (mean USG 1.019 g/ml and 1.016 g/ml
for Utter et al. (2003) and Demirkan et al. (2014) respectively); and a dehydrated state
(mean USG 1.027 g/ml and 1.028 g/ml for Utter et al. (2003) and Demirkan et al.
(2014) respectively). Utter et al. (2003) reported mean %BF values of 12.4 % and
12.2 % for euhydration and dehydration respectively, and Demirkan et al. (2014)
reported 8.8 % and 9.1 % for euhydration and dehydration respectively.
Dolan et al. (2013) used the Withers et al (1987) and Siri (1961) equations to estimate
%BF in a sample of nine professional male jockeys in Ireland (five jump and four flat)
in an intervention study on the effects of dehydration on physiological and cognitive
function. The results showed a non-significant decrease in %BF according to skinfold
measurements from 9.0 % at baseline to 8.9 % after four percent weight loss by
dehydration.
The literature regarding the impact of hydration status on the %BF determined by
skinfold measurements therefore suggests that there is no significant impact of
dehydration on the measurement of %BF from skinfolds. To date, no data exists for
the impact of hydration status on the accuracy of estimating %BF from skinfold
measurements in jockeys, therefore it was important to test this.
2.7.2.2.5 The impact of measurement technique
Strict adherence to a measurement protocol is also essential to obtaining reliable
results. Ruiz et al. (1971) investigated the variation of triceps skinfold measurements
in males aged 40 years and older when the measurement site was displaced by 2.5cm
vertically in 124 subjects and horizontally in 120 subjects, when the depth of the bite
changed (either deeper or more superficial than the standard technique) in 62
subjects, and when the skinfold was either held or released when the measurement
was read in 123 subjects. The study reported highly significant differences in triceps
skinfold thickness as a result of horizontal and/or vertical displacement of the calliper
site as well as the size of the bite, but no significant difference when the skinfold was
either held or released when the measurement was read. This study signified the
importance of a standardised technique. In 1986, the ISAK was formed in Glasgow.
This International society established a closely-defined protocol, as well as an exam-
based certification course, for practitioners and instructors (International Society for
the Advancement of Kinanthropometry, 2001) which is reported to reduce intra-tester
36
error by seven-fold (Ackland et al., 2012). A cross-sectional quantitative study by
Hume & Marfell-Jones (2008) on the impact of a one cm variation from the standard
ISAK skinfold sites in a sample of ten males aged 27.9 years reported significant
differences in skinfold measurement values for 70% of the points measured. The ISAK
technique has been used in a recent study on jockeys (Silk et al., 2015) and was used
in this study.
2.7.2.2.6 The impact of inter-observer variability
Literature regarding the impact of inter-observer variability on increased error in
measurement is controversial when trained investigators use a standardised
technique. Kispert & Merrifield (1987) investigated the variability of measurements at
three skinfold sites in ten males (triceps, chest and subscapular) and ten females
(triceps, abdomen and supra-iliac) by eight investigators and reported no significant
differences between the measurement values at each sites nor for the sum of the
skinfolds. Conversely, the study by Hume & Marfell-Jones (2008) reported significant
differences between the measurements of the two investigators.
Although the evidence regarding inter-observer variability for skinfold measurements
is ambiguous, measurements in this study were carried out by the same investigator
who was ISAK trained to eliminate potential variability.
2.7.2.2.7 Regression equations
A number of regression equations have been produced in order to calculate %BF from
skinfold measurements. Most equations calculate BD, which then needs to be
translated into %BF from either the Siri (1961) or Brozek et al. (1963). The choice of
equation should be population specific, as it has been discussed that age, sex, race
and adiposity can affect variability, therefore it is necessary to investigate the
equation’s which have been used and validated in the jockey/apprentice population.
2.7.2.2.8 Regression equations used in the jockey population
The biokineticist at the SAJA currently uses the four-skinfold equation which was
retrieved from (Topend Sports Network, 2015) and attributed to Jackson & Pollock
(1985). The selection of this equation was based on the fact that it takes age into
account, however more recent equations also include age as a variable (Peterson et
al., 2003; Van der Ploeg et al., 2003; Vickery et al., 1988; Withers et al., 1987). The
37
equation could not be sourced from the publication by Jackson & Pollock (1985). One
of the authors, Dr A.S. Jackson ([email protected]), who is affiliated with the University
of Houston, was contacted and confirmed that this equation was developed by himself
and the late Mr Michael Pollock, of the University of Wisconsin. Although the equation
could still not be found in any of their publications (as the reputable Jackson & Pollock
(1978) equations use either three or seven skinfold sites) the equation was used in
this study as it was in use at the time at the SAJA.
Labadarios et al. (1993) measured four skinfold sites, namely the triceps, biceps,
subscapular and supra-iliac, to determine the %BF of professional male flat jockeys in
South Africa, although neither the equation or measurement standards were specified
No reference method was used as a comparison and hydration status was not
measured.
Warrington et al. (2009) measured the %BF of 17 professional male flat jockeys and
ten professional male jump jockeys in Ireland using both DXA and seven skinfold
measurements (biceps, triceps, subscapular, supra-iliac, abdominal, mid-thigh and
medial calf) and the equation by Withers et al. (1987) to calculate BD and the Siri
(1961) equation to translate into %BF. Note that this equation was derived from the
1987 dataset, but not published in full in the original study. The skinfold protocol
was not specified. The jockeys were tested for hydration status and measured on a
non-race day. The mean USG (1.022 g/ml) on the non-race day, indicating moderate
dehydration (Casa et al., 2000). Statistical analysis showed that there was no
significant difference between %BF values for flat jockeys measured by DXA (8.99 %)
and skinfolds (7.88 %), indicating that skinfold measurements using the Withers et al
(1987) equation was comparable to DXA in the jockey population.
Similarly Dolan et al. (2009) used the Withers et al (1987) equation with the Siri (1961)
equation versus DXA in a sample of 41 weight category athletes (29 professional
jockeys and 12 boxers) in Ireland. Skinfold measurements were taken in accordance
with the American College of Sports Medicine (ACSM) (2006) guidelines, however
hydration status was not assessed. They reported significant differences between the
%BF values determined by each method although the difference between DXA and
skinfold values when only the flat jockeys were included was not significant. Dolan et
al. (2013) also used the Withers et al (1987) and Siri (1961) equations to estimate
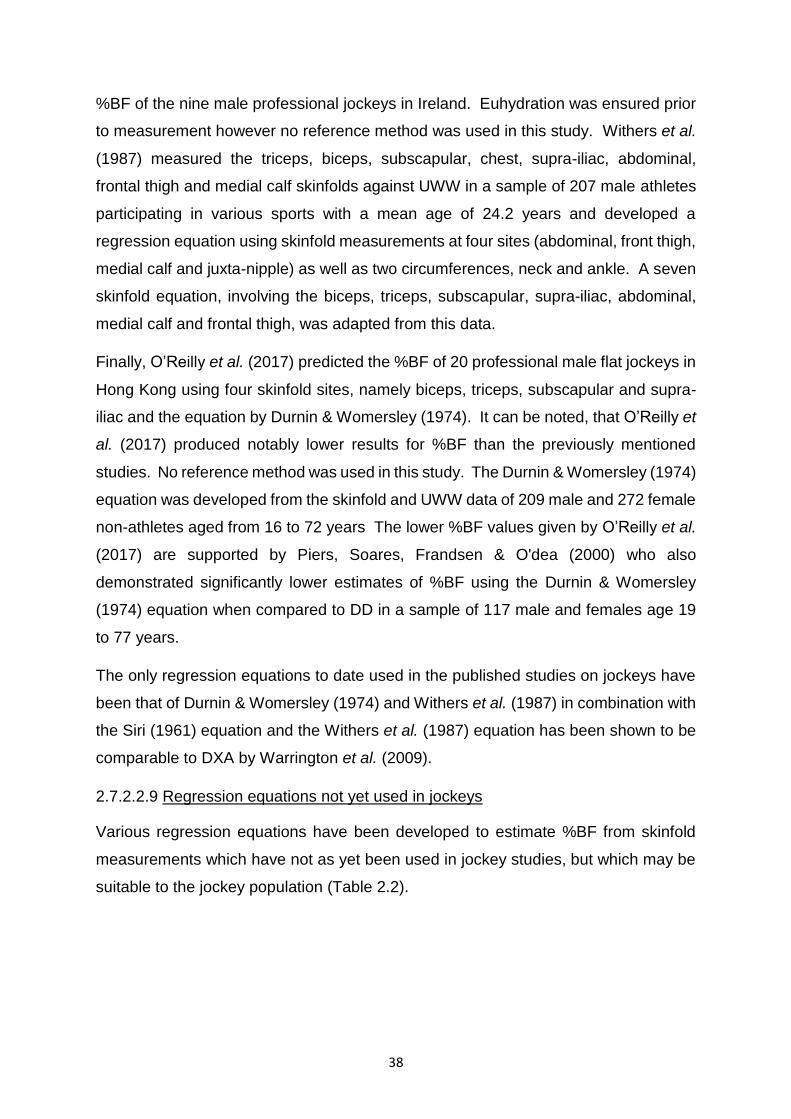
38
%BF of the nine male professional jockeys in Ireland. Euhydration was ensured prior
to measurement however no reference method was used in this study. Withers et al.
(1987) measured the triceps, biceps, subscapular, chest, supra-iliac, abdominal,
frontal thigh and medial calf skinfolds against UWW in a sample of 207 male athletes
participating in various sports with a mean age of 24.2 years and developed a
regression equation using skinfold measurements at four sites (abdominal, front thigh,
medial calf and juxta-nipple) as well as two circumferences, neck and ankle. A seven
skinfold equation, involving the biceps, triceps, subscapular, supra-iliac, abdominal,
medial calf and frontal thigh, was adapted from this data.
Finally, O’Reilly et al. (2017) predicted the %BF of 20 professional male flat jockeys in
Hong Kong using four skinfold sites, namely biceps, triceps, subscapular and supra-
iliac and the equation by Durnin & Womersley (1974). It can be noted, that O’Reilly et
al. (2017) produced notably lower results for %BF than the previously mentioned
studies. No reference method was used in this study. The Durnin & Womersley (1974)
equation was developed from the skinfold and UWW data of 209 male and 272 female
non-athletes aged from 16 to 72 years The lower %BF values given by O’Reilly et al.
(2017) are supported by Piers, Soares, Frandsen & O'dea (2000) who also
demonstrated significantly lower estimates of %BF using the Durnin & Womersley
(1974) equation when compared to DD in a sample of 117 male and females age 19
to 77 years.
The only regression equations to date used in the published studies on jockeys have
been that of Durnin & Womersley (1974) and Withers et al. (1987) in combination with
the Siri (1961) equation and the Withers et al. (1987) equation has been shown to be
comparable to DXA by Warrington et al. (2009).
2.7.2.2.9 Regression equations not yet used in jockeys
Various regression equations have been developed to estimate %BF from skinfold
measurements which have not as yet been used in jockey studies, but which may be
suitable to the jockey population (Table 2.2).
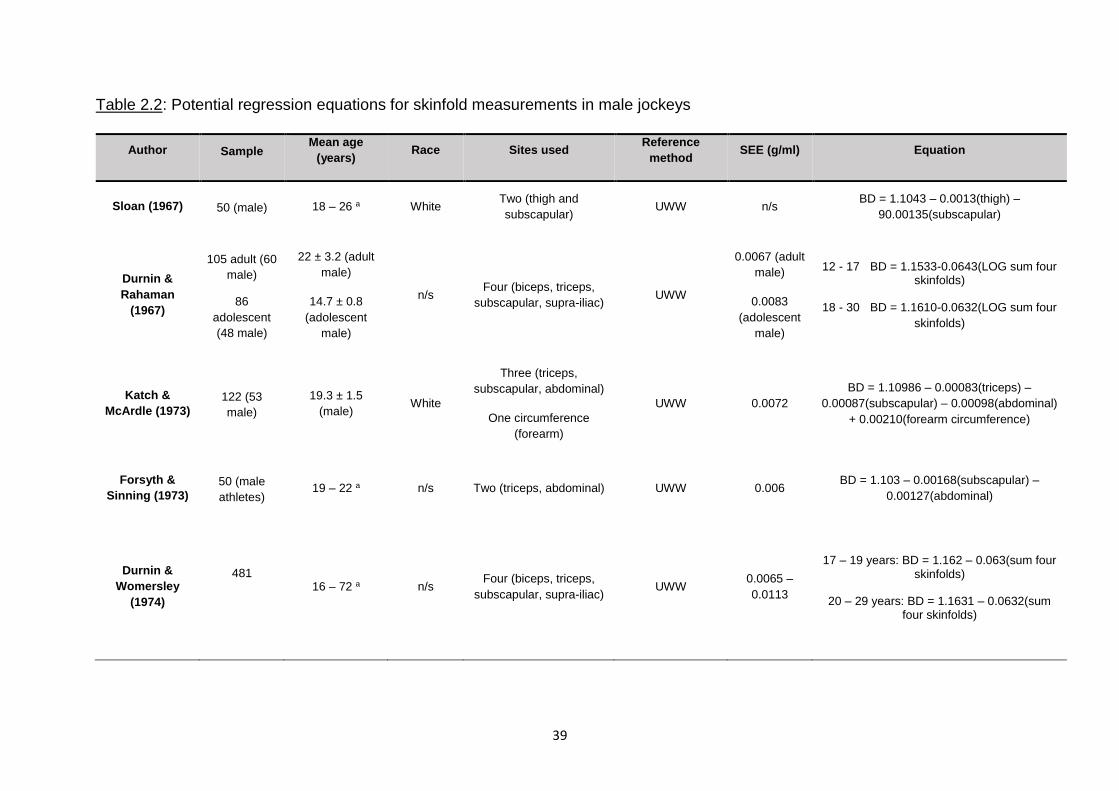
39
Table 2.2: Potential regression equations for skinfold measurements in male jockeys
Author Sample Mean age
(years) Race Sites used
Reference
method SEE (g/ml) Equation
Sloan (1967) 50 (male) 18 – 26 a White Two (thigh and
subscapular) UWW n/s
BD = 1.1043 – 0.0013(thigh) –
90.00135(subscapular)
Durnin &
Rahaman
(1967)
105 adult (60
male)
86
adolescent
(48 male)
22 ± 3.2 (adult
male)
14.7 ± 0.8
(adolescent
male)
n/s Four (biceps, triceps,
subscapular, supra-iliac) UWW
0.0067 (adult
male)
0.0083
(adolescent
male)
12 - 17 BD = 1.1533-0.0643(LOG sum four skinfolds)
18 - 30 BD = 1.1610-0.0632(LOG sum four
skinfolds)
Katch &
McArdle (1973)
122 (53
male)
19.3 ± 1.5
(male) White
Three (triceps,
subscapular, abdominal)
One circumference
(forearm)
UWW 0.0072
BD = 1.10986 – 0.00083(triceps) –
0.00087(subscapular) – 0.00098(abdominal)
+ 0.00210(forearm circumference)
Forsyth &
Sinning (1973)
50 (male
athletes) 19 – 22 a n/s Two (triceps, abdominal) UWW 0.006
BD = 1.103 – 0.00168(subscapular) –
0.00127(abdominal)
Durnin &
Womersley
(1974)
481
16 – 72 a n/s
Four (biceps, triceps,
subscapular, supra-iliac) UWW
0.0065 –
0.0113
17 – 19 years: BD = 1.162 – 0.063(sum four skinfolds)
20 – 29 years: BD = 1.1631 – 0.0632(sum four skinfolds)
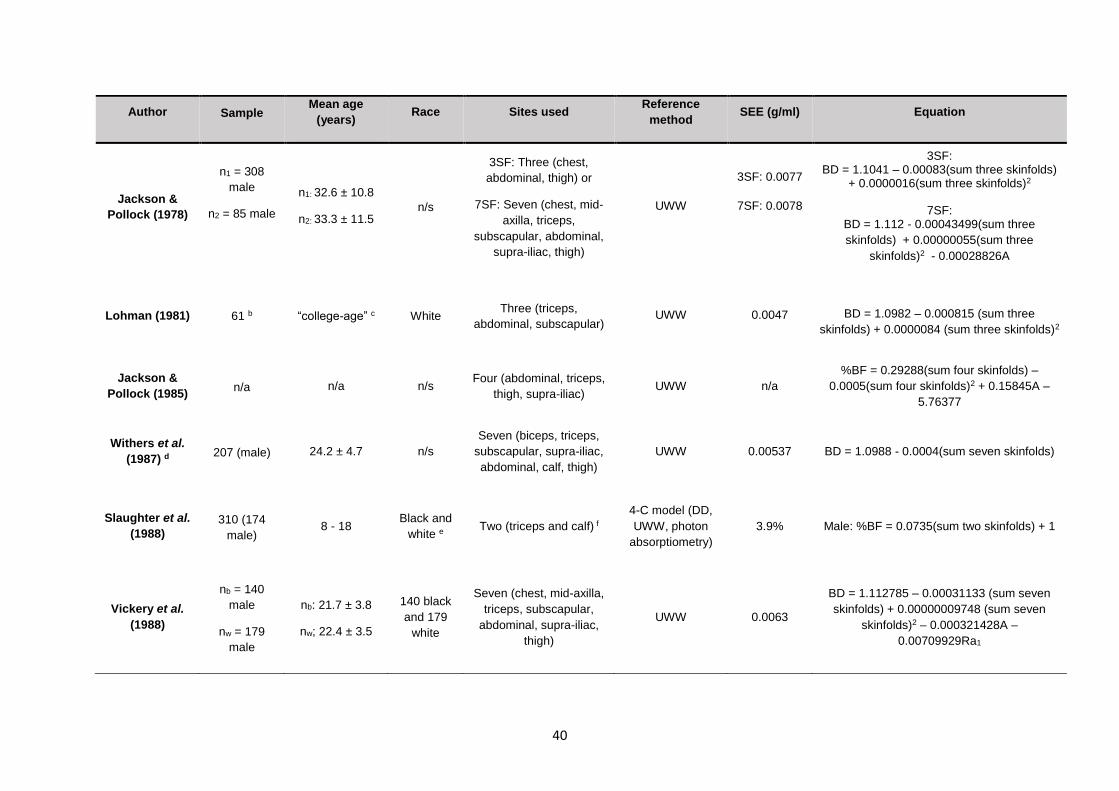
40
Author Sample Mean age
(years) Race Sites used
Reference
method SEE (g/ml) Equation
Jackson &
Pollock (1978)
n1 = 308
male
n2 = 85 male
n1: 32.6 ± 10.8
n2: 33.3 ± 11.5 n/s
3SF: Three (chest,
abdominal, thigh) or
7SF: Seven (chest, mid-
axilla, triceps,
subscapular, abdominal,
supra-iliac, thigh)
UWW
3SF: 0.0077
7SF: 0.0078
3SF: BD = 1.1041 – 0.00083(sum three skinfolds)
+ 0.0000016(sum three skinfolds)2
7SF: BD = 1.112 - 0.00043499(sum three
skinfolds) + 0.00000055(sum three
skinfolds)2 - 0.00028826A
Lohman (1981) 61 b “college-age” c White Three (triceps,
abdominal, subscapular) UWW 0.0047 BD = 1.0982 – 0.000815 (sum three
skinfolds) + 0.0000084 (sum three skinfolds)2
Jackson &
Pollock (1985) n/a n/a n/s
Four (abdominal, triceps,
thigh, supra-iliac) UWW n/a
%BF = 0.29288(sum four skinfolds) –
0.0005(sum four skinfolds)2 + 0.15845A –
5.76377
Withers et al.
(1987) d 207 (male) 24.2 ± 4.7 n/s
Seven (biceps, triceps,
subscapular, supra-iliac,
abdominal, calf, thigh)
UWW 0.00537 BD = 1.0988 - 0.0004(sum seven skinfolds)
Slaughter et al.
(1988)
310 (174
male) 8 - 18
Black and
white e Two (triceps and calf) f
4-C model (DD,
UWW, photon
absorptiometry)
3.9% Male: %BF = 0.0735(sum two skinfolds) + 1
Vickery et al.
(1988)
nb = 140
male
nw = 179
male
nb: 21.7 ± 3.8
nw; 22.4 ± 3.5
140 black
and 179
white
Seven (chest, mid-axilla,
triceps, subscapular,
abdominal, supra-iliac,
thigh)
UWW 0.0063
BD = 1.112785 – 0.00031133 (sum seven
skinfolds) + 0.00000009748 (sum seven
skinfolds)2 – 0.000321428A –
0.00709929Ra1
41
Author Sample Mean age
(years) Race Sites used
Reference
method SEE (g/ml) Equation
Deurenberg et
al. (1990)
n = 378 (170
male)
PrP (n = 114):
11.3 ± 0.16
P (n = 35): 13.8
± 0.21
PoP (n = 21):
17.5 ± 0.39
n/s
Two (biceps and triceps)
or
Four (biceps, triceps,
supra-iliac, subscapular)
UWW 0.0013 –
0.0028
2SF: BD = 1.1132 – 0.0410(LOG sum two skinfolds)
4SF: BD = 1.1324 – 0.0429(LOG sum four
skinfolds)
Lean et al.
(1996)
n = 147 (63
male)
40.1 ± 13.1
R: 16.1 – 65.4
(male)
White
One skinfold (triceps) and
one circumference
(waist)
UWW 3.2 Male: %BF = 0.353(waist circumference) +
0.756(triceps skinfold) + 0.235A
Stewart &
Hannan (2000)
n1 = 82 male
athletes
n2 = 24 male
athletes
n1: 28.1 ± 7.5
n2: 29.0 ± 7.0 n/s
Five (abdominal, chest,
forearm, calf, thigh,
supra-iliac)
DXA RMSE: 2.9%
%BF = [105.2Wt + 189.5(abdominal) + 345.2(chest) - 521.1(forearm) + 215.9(calf) + 258.3(thigh) + 293(supra-iliac) - 8334.4]/Wt x
100
Peterson et al.
(2003)
n = 681 (365
male)
n1: 36.2 ± 11.0
R:18.0 –55.4
n2: 35.2 ± 14.6
R:18.0 – 55.6
White
Four (triceps,
subscapular, supra-iliac,
thigh)
4-C model (DXA,
UWW, DD)
RMSE: 4.6%
(male)
Male: %BF = 20.94878 + 0.1166A - 0.11666Ht +
0.42696(sum four skinfolds) - 0.00159(sum
four skinfolds)2
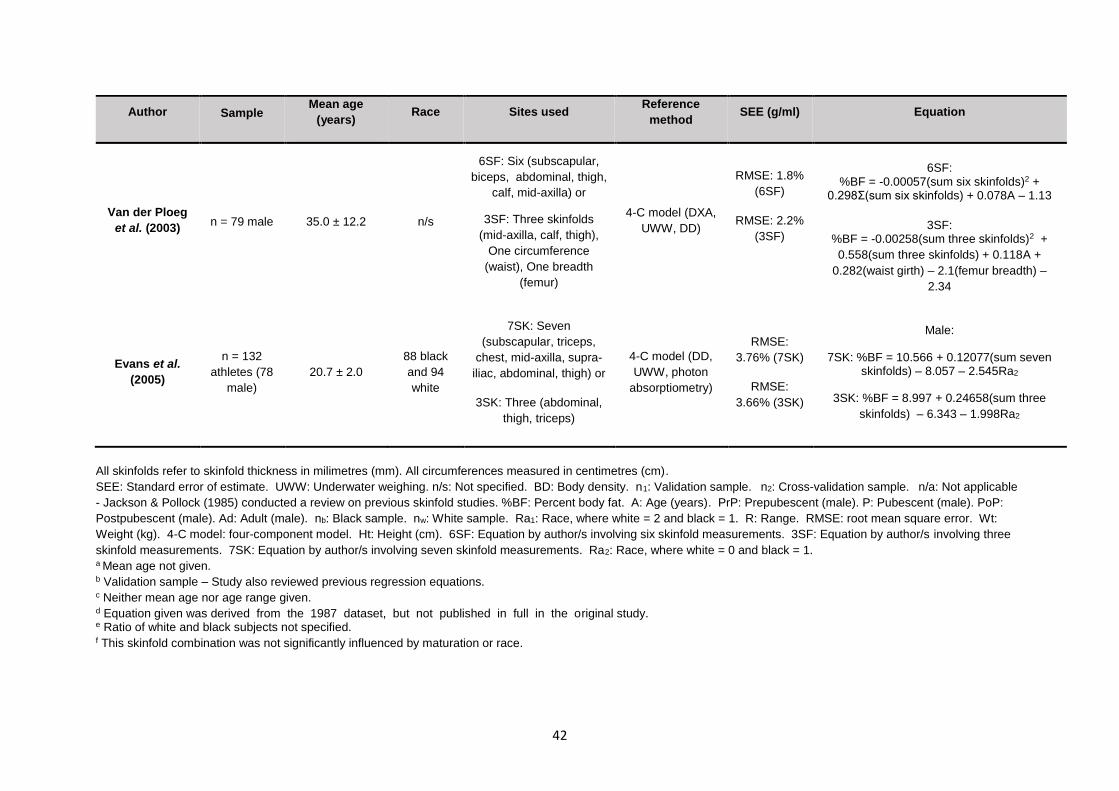
42
Author Sample Mean age
(years) Race Sites used
Reference
method SEE (g/ml) Equation
Van der Ploeg
et al. (2003) n = 79 male 35.0 ± 12.2 n/s
6SF: Six (subscapular,
biceps, abdominal, thigh,
calf, mid-axilla) or
3SF: Three skinfolds
(mid-axilla, calf, thigh),
One circumference
(waist), One breadth
(femur)
4-C model (DXA,
UWW, DD)
RMSE: 1.8%
(6SF)
RMSE: 2.2%
(3SF)
6SF: %BF = -0.00057(sum six skinfolds)2 +
0.298Ʃ(sum six skinfolds) + 0.078A – 1.13
3SF: %BF = -0.00258(sum three skinfolds)2 +
0.558(sum three skinfolds) + 0.118A +
0.282(waist girth) – 2.1(femur breadth) –
2.34
Evans et al.
(2005)
n = 132
athletes (78
male)
20.7 ± 2.0
88 black
and 94
white
7SK: Seven
(subscapular, triceps,
chest, mid-axilla, supra-
iliac, abdominal, thigh) or
3SK: Three (abdominal,
thigh, triceps)
4-C model (DD,
UWW, photon
absorptiometry)
RMSE:
3.76% (7SK)
RMSE:
3.66% (3SK)
Male:
7SK: %BF = 10.566 + 0.12077(sum seven skinfolds) – 8.057 – 2.545Ra2
3SK: %BF = 8.997 + 0.24658(sum three
skinfolds) – 6.343 – 1.998Ra2
All skinfolds refer to skinfold thickness in milimetres (mm). All circumferences measured in centimetres (cm).
SEE: Standard error of estimate. UWW: Underwater weighing. n/s: Not specified. BD: Body density. n1: Validation sample. n2: Cross-validation sample. n/a: Not applicable
- Jackson & Pollock (1985) conducted a review on previous skinfold studies. %BF: Percent body fat. A: Age (years). PrP: Prepubescent (male). P: Pubescent (male). PoP:
Postpubescent (male). Ad: Adult (male). nb: Black sample. nw: White sample. Ra1: Race, where white = 2 and black = 1. R: Range. RMSE: root mean square error. Wt:
Weight (kg). 4-C model: four-component model. Ht: Height (cm). 6SF: Equation by author/s involving six skinfold measurements. 3SF: Equation by author/s involving three
skinfold measurements. 7SK: Equation by author/s involving seven skinfold measurements. Ra2: Race, where white = 0 and black = 1. a Mean age not given. b Validation sample – Study also reviewed previous regression equations. c Neither mean age nor age range given. d Equation given was derived from the 1987 dataset, but not published in full in the original study. e Ratio of white and black subjects not specified. f This skinfold combination was not significantly influenced by maturation or race.
43
Various studies have cross-validated these equations against each other. Sinning et
al. (1985) evaluated against UWW the accuracy of 21 skinfold equations, including
that of Sloan (1967), Katch & McArdle (1973), Forsyth & Sinning (1973), Durnin &
Womersley (1974), Jackson & Pollock (1978) and Lohman (1981), to calculate the BD
and %BF of 265 male athletes, age 18 to 26 years. Only the equations by Jackson &
Pollock (1978), which involved either seven skinfolds (chest, mid-axilla, triceps,
subscapular, abdomen, supra-iliac, thigh) or three skinfolds (chest, abdomen,
thigh),showed no significant difference from the reference method of UWW. The
equations by Sloan (1967), Katch & McArdle (1973) and Lohman (1981) also produced
estimations with an acceptable error.
Peterson et al. (2003) developed their own skinfold equation using a 4-C model (DXA,
DD and UWW) in a sample of 274 male and 230 female subjects and then cross-
validated it with the equations by Durnin & Womersley (1974) and Jackson & Pollock
(1978) in a sample of 86 males and 91 females (Peterson et al., 2003). Peterson et
al. (2003) maintained that the Durnin & Womersley (1974) equation underestimated
%BF in men and women. The newly proposed equation by Peterson et al. (2003)
produced estimations that did not differ significantly from that of the reference method.
Rodriguez et al. (2005) compared 14 commonly used equations to predict %BF from
skinfolds, including that of Durnin & Womersley (1974), Slaughter et al. (1988),
Deurenberg et al. (1990) and Lean et al. (1996), to DXA in a sample of in 238 white
adolescents (167 females and 113 males), aged 13.0 to 17.9 years. The study found
that only the Slaughter et al. (1988) equation showed nonsignificant differences
against DXA in adolescent males. No studies to date have validated these equations
for use in jockeys or jockey apprentices.
The Sloan (1967), Durnin & Rahaman (1967), Forsyth & Sinning (1973), Durnin &
Womersley (1974), Lohman (1981), Jackson & Pollock (1985), Slaughter et al. (1988),
Deurenberg et al. (1990), Peterson et al. (2003) and Evans et al. (2005) equations are
used to measure %BF of the jockey apprentices in this study as these equations
include only the seven skinfolds (biceps, triceps, subscapular, supra-iliac, abdominal,
thigh and calf) currently measured at the SAJA for the purpose of body composition
measurement.
44
2.7.2.2.10 Quality of equipment
The type of calliper has been found to have a significant impact due to the pressure
exerted on the skinfold (Ball, Swan & Altena, 2006). High quality metal callipers such
as the Lange and Harpenden have been found to be the most accurate as they are
able to apply constant pressure throughout the range of measurement (Heyward &
Wagner, 2004). Lange callipers are used in this study.
The accuracy of using skinfold measurements to estimate %BF is highly influenced by
the technique, inter-observer variability and choice of equation. Only the equation by
Withers et al. (1987) has been validated in a jockey/apprentice population, although it
may be influenced by dehydration. This necessitates the validation of various
equations for use in the jockey apprentice population.
An alternative field method, of similar cost but requiring less training and is less
susceptible to inter-observer variability, would be extremely valuable for the jockey
apprentice population.
2.7.2.3 Bioelectrical Impedance Analysis
Bioelectrical impedance analysis is another portable, quick, cost-effective and non-
invasive method of measuring %BF with less inter-observer variability than skinfold
measurements, thus making it a more practical method (Ostojic, 2006). Bioelectrical
impedance analysis uses the impedance of a conductor (the human body), which is
the opposition to the flow of an alternating electric current comprising of both
resistance (R) and reactivity (Xc), at a specific frequency/frequencies to calculate %BF
from body volume and length (Brodie, Moscrip & Hutcheon, 1998). The most common
methods of BIA include single-frequency (SF-BIA), where the electrical current flows
at a single frequency (usually 50 kHz) between electrodes to measure FFM and TBW,
and multi-frequency (MF-BIA), which uses different frequencies to evaluate FFM,
TBW, as well as to differentiate measures for intra-cellular (ICF) and extracellular fluid
(ECF) (Kyle et al., 2004a). The advantage of MF-BIA over SF-BIA is that MF-BIA is
reported to be more accurate for the measurement of TBW in conditions in which body
water compartmentalization (ICF and ECF balance) is altered from the normal state,
for example renal failure (Gudivaka, Schoeller, Kushner & Bolt, 1999; Martinoli,
Mohamed, Maiolo, Cianci, Denoth, Salvadori & Iacopino, 2003). However it has
45
recently been found that MF-BIA does not provide more accurate results than SF-BIA
when used to measure %BF in variable hydration statuses (Donadio, Halim, Caprio,
Grassi, Khedr & Mazzantini, 2008). Single-frequency devices such as the
BODYSTAT®1500 MDD used in this study, are more affordable than MF-BIA devices
and has been used to measure the body composition of apprentice jockeys training at
the SAJA for research purposes (Krog, 2015).
The accuracy of BIA for measuring %BF is influenced by the age and sex (Deurenberg,
Van der Kooy, Leenen, Weststrate & Seidell, 1991a; Lohman, 1992), race (Sun et al.,
2003) adiposity (Segal et al., 1988; Gray, Bray, Gemayel & Kaplan, 1989), hydration
status (Saunders et al., 1998) of the individual measured, the choice of machine
(Ghosh, Meister, Cowen, Hannan & Ferguson, 1997) and adherence to procedural
techniques. Procedural techniques have been established by the European Society
for Parenteral and Enteral Nutrition (Kyle, Bosaeus, De Lorenzo, Deurenberg, Elia,
Gómez, Heitmann, Kent-Smith, Melchior & Pirlich, 2004b).
These include, but are not limited to, calibration of electrical equipment, correct
placement of electrodes, subject in a supine position on a non-conductive surface and
subject fasting for eight hours prior to measurement (Kyle et al., 2004b). Height may
also be a confounding factor. These factors are used to select an appropriate
population-specific BIA equation (Kyle et al., 2004a).
2.7.2.3.1 The impact of age and sex
Deurenberg et al. (1991a) developed regression equations for BIA from a sample of
827 male and female subjects aged seven to 83 years using UWW as a reference.
The study reported that age and sex significantly impacted the accuracy of %BF
measured by BIA compared to UWW therefore these variables were included in the
equations produced.
Lohman (1992) conducted a similar study involving 685 male and female subjects
aged 18 to 70 years and also reported significant effects of age and sex on accuracy
when BIA was compared to UWW. Separate equations were proposed for each age
group (18 to 29 years; 30 to 49 years; 50 to 70 years) and for each sex within each
age group.
46
2.7.2.3.2 The impact of race
Sun et al. (2003) tested BIA equations for calculating FFM in a sample of 1034 white
(412 male and 622 female) and 279 (114 male and 156 female) black subjects aged,
12 to 94 years using a 4-C model (UWW, DD, DXA). It was found that race-combined
equations tended to under-predict FFM in black males by 2.1 kg and females by 1.6
kg, and over-predict FFM in white males by 0.4 kg and females by 0.3 kg. Based on
these results, race- and sex-specific equations were developed and cross-validated in
a sample of 440 white (182 male and 258 female) and 85 black (26 male and 59
female) subjects to produce acceptable SEE values.
2.7.2.3.3 The impact of adiposity
Segal et al. (1988) conducted a descriptive study involving 1069 male and 498 females
aged 17 to 62 years with %BF ranging from three to 56% according to UWW. Fat-free
mass was measured using SF-BIA and it was found that BIA significantly
overestimated FFM in obese subjects with a %BF greater than 42%. A separate
regression equation was derived for obese subjects.
Gray et al. (1989) reported similar findings in a sample of 87 adults with %BF varying
from 8.8 to 59% when comparing SF-BIA to UWW and also derived a separate
equation for obese subjects.
Since jockeys and apprentices are not obese, this factor will not influence the results
of predicting %BF from BIA.
2.7.2.3.4 The impact of dehydration
Measurement of %BF by BIA is known to be affected by hydration status. An
intervention study by Saunders et al. (1998), involving 15 athletes (11 men and 4
women) aged 19 to 56 years, found that exercise-induced dehydration, as indicated
by a 3% loss of normal body mass, caused a significant reduction in %BF when
measured by single-frequency BIA (Valhalla Scientific 1990B, San Diego, CA)
analyser. This is a concern in the jockey/apprentice population as common strategies
of making weight for races involve manipulation of hydration status (Labadarios et al.,
1993; Leydon & Wall, 2002; Moore et al., 2002a; Dolan et al., 2011; Wilson et al.,
2014) and jockeys are reported to be chronically dehydrated, even on non-race days
when %BF would typically be measured (Warrington et al. (2009).
47
Thompson et al. (1991) conducted an intervention study which investigated the impact
of dehydration (as indicated by a mean 2.81% loss of body mass following a
combination of exercise and sitting in a steam room) on the %BF measured by SF-
BIA in a sample of ten males aged 18 to 44 years. The equation used was not
specified. A significant decrease in %BF as measured by BIA was reported when
comparing baseline to dehydration.
2.7.2.3.5 Choice of machine
The BODYSTAT®1500 is a relatively affordable SF-BIA device that measures %BF
by using the tetrapolar hand-to-foot technique at a single frequency. Ghosh et al.
(1997) validated the BODYSTAT®1500 machine against DXA in a study involving 160
participants, including healthy adults and adolescents as well as hospital patients, and
reported satisfactory limits of agreement.
The machine has been compared to various other SF-BIA devices, including the RJL
system which also uses the tetrapolar hand-to-foot technique, the Tanita TBF410 GS
model which uses the bipolar foot to foot technique, the Omron BF300 which uses the
bipolar handheld technique and the Omron BF511 which uses the tetrapolar handheld
technique, as well as the skinfold equations by Pařízková (1977) and Slaughter et al.
(1988) (Smye, Sutcliffe & Pitt, 1993; Stewart & Hannan, 2000; Vetrovska, Vilikus,
Klaschka, Stranska, Svacina, Svobodova & Matoulek, 2014).
Smye et al. (1993) compared four whole-body SF-BIA systems (Holtain, RJL,
BODYSTAT®1500 and EZcomp) on two separate occasions in a sample of 21 healthy
subjects (nine female and 12 male) aged 20 to 57 years and found no significant
difference between the %BF values obtained from the BODYSTAT®1500, RJL and
EZcomp but significant differences between the BODYSTAT®1500 and Holtain.
Limited conclusions can be drawn from this study as no reference method was used
to validate the BIA results.
The previously described study by Stewart & Hannan (2000), involving 82 male
athletes reported that fat mass predicted by skinfolds using the equations by Durnin &
Womersley (1974) and Jackson & Pollock (1978) produced a lower SEE (1.7 kg) that
that of BIA using the RJL machine and equations by Lohman (1992) and Lukaski et
al. (1986) (2.8 kg). Since the BODYSTAT®1500 is reported to have a similar accuracy
to that of RJL, it can be deduced that skinfold measurements using the equations by
48
Durnin & Womersley (1974) and Jackson & Pollock (1978) could be more accurate
than the BODYSTAT®1500.
In a descriptive study involving 42 male children with a mean age of 12.9 years, %BF
was measured by BIA using the Tanita TBF410 GS model and the BODYSTAT®1500.
The results were compared to that of a 3-C model, involving ADP (BOD POD) and DD,
as the reference method. The study reported that both BIA machines significantly
overestimated %BF when compared to the reference method (Parker et al., 2003).
Markham & Fountaine (2011) compared the accuracy of predicting %BF using the
BODYSTAT®1500 and Omron machines in a sample of 24 (15 male and 9 female)
track and field athletes with a mean age of 20.13 years using the BOD POD as a
reference. The study reported significantly higher %BF values measured by the
BODYSTAT®1500 when compared to both the BOD POD and the Omron in the male
subjects, indicating that the Omron was more reliable.
Vetrovska et al. (2014) compared the accuracy of %BF measurements using the
Tanita TBF 410 GS, BODYSTAT®1500 and Omron BF 300 machines as well skinfold
measurements using the equation by Pařízková (1977) against DXA in a sample of
130 females with a mean age of 46.8 years stratified by BMI. They found that all
methods, except for Omron, significantly underestimated %BF when compared to DXA
for participants with a BMI less than 25 kg/m2 (30/130) and that there was a significant
difference between values measured by the Omron and BODYSTAT®1500 machines
in this group. The skinfold method underestimated %BF for all BMI groups. Overall,
it was found that all methods produced values significantly different to that of DXA,
with Omron being the most similar.
In summary the BODYSTAT®1500 machine significantly overestimates %BF when
compared to the reference methods APD, DD and DXA.
2.7.2.3.6 The impact of height
Although there is no evidence in the literature that states that height directly influences
the accuracy of BIA, it is established that BIA equations are inaccurate at extremes of
height (Kyle et al., 2004b). The BIA equations are based on V = p x S2/R; where V is
the conductive volume, p is the specific resistivity of the conductor, S is stature (height)
and R is whole-body resistance (Houtkooper, Lohman, Going & Howell, 1996). As
49
jockeys are small in stature, and the equations for BIA include height as a variable it
would be reasonable to hypothesise that height may be a confounding factor.
2.7.2.3.7 Regression equations
Various equations have been developed to estimate %BF from impedance, none of
which have been validated in a jockey/apprentice population. The manufacturers of
the BODYSTAT®1500 refused to disclose the regression equation used by their
computer software. It was important to determine whether other BIA equations were
more appropriate for the jockey apprentice population. Studies which have published
equations considered suitable for the jockey apprentice population, on the basis of
being validated in an age- and gender-appropriate population with an acceptable SEE,
are summarised in Table 2.3.
The BODYSTAT®1500 is not phase-sensitive, which means it measures impedance
(Z) at a frequency of 50 KHz only, and does not measure R and X values separately.
A phase-sensitive machine is required to measure these values separately and Z and
R values are not recommended to be used interchangeably (Preedy, 2012). This
presents a challenge when substituting measurements from the BODYSTAT®1500
into other regression equations as most involve R instead of Z.
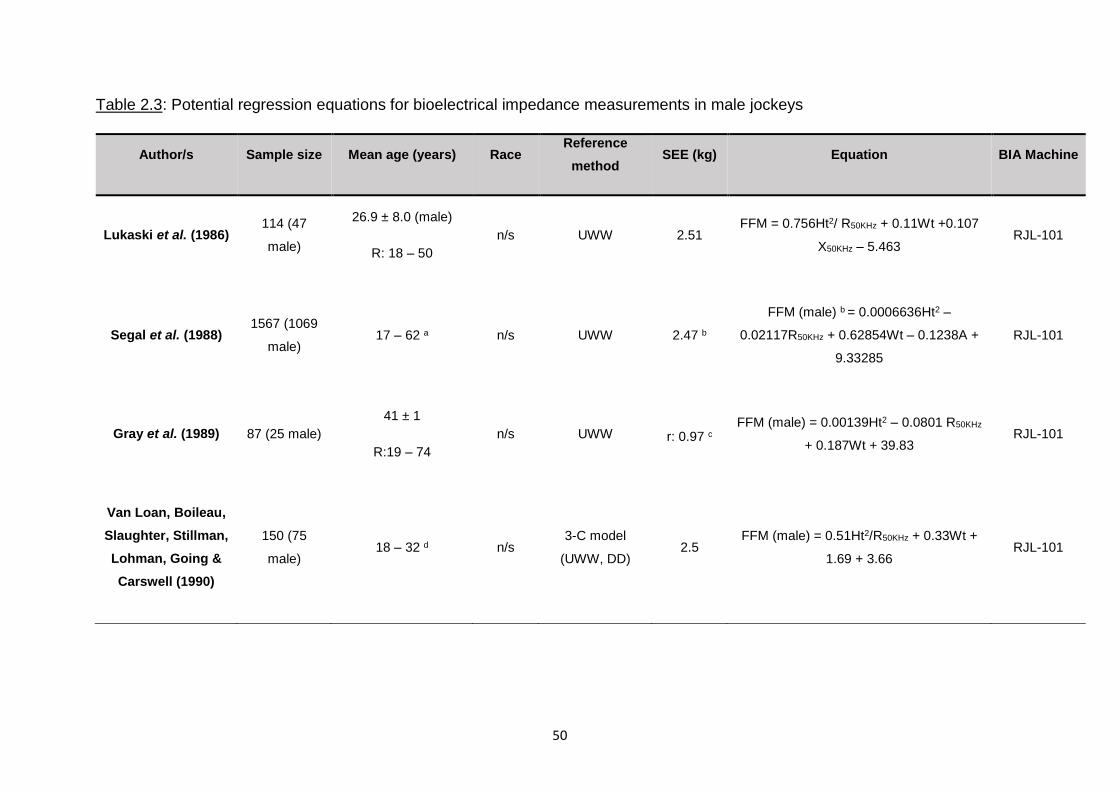
50
Table 2.3: Potential regression equations for bioelectrical impedance measurements in male jockeys
Author/s Sample size Mean age (years) Race Reference
method SEE (kg) Equation BIA Machine
Lukaski et al. (1986) 114 (47
male)
26.9 ± 8.0 (male)
R: 18 – 50
n/s UWW 2.51 FFM = 0.756Ht2/ R50KHz + 0.11Wt +0.107
X50KHz – 5.463 RJL-101
Segal et al. (1988) 1567 (1069
male) 17 – 62 a n/s UWW 2.47 b
FFM (male) b = 0.0006636Ht2 –
0.02117R50KHz + 0.62854Wt – 0.1238A +
9.33285
RJL-101
Gray et al. (1989) 87 (25 male)
41 ± 1
R:19 – 74
n/s UWW r: 0.97 c
FFM (male) = 0.00139Ht2 – 0.0801 R50KHz
+ 0.187Wt + 39.83 RJL-101
Van Loan, Boileau,
Slaughter, Stillman,
Lohman, Going &
Carswell (1990)
150 (75
male) 18 – 32 d n/s
3-C model
(UWW, DD) 2.5
FFM (male) = 0.51Ht2/R50KHz + 0.33Wt +
1.69 + 3.66 RJL-101
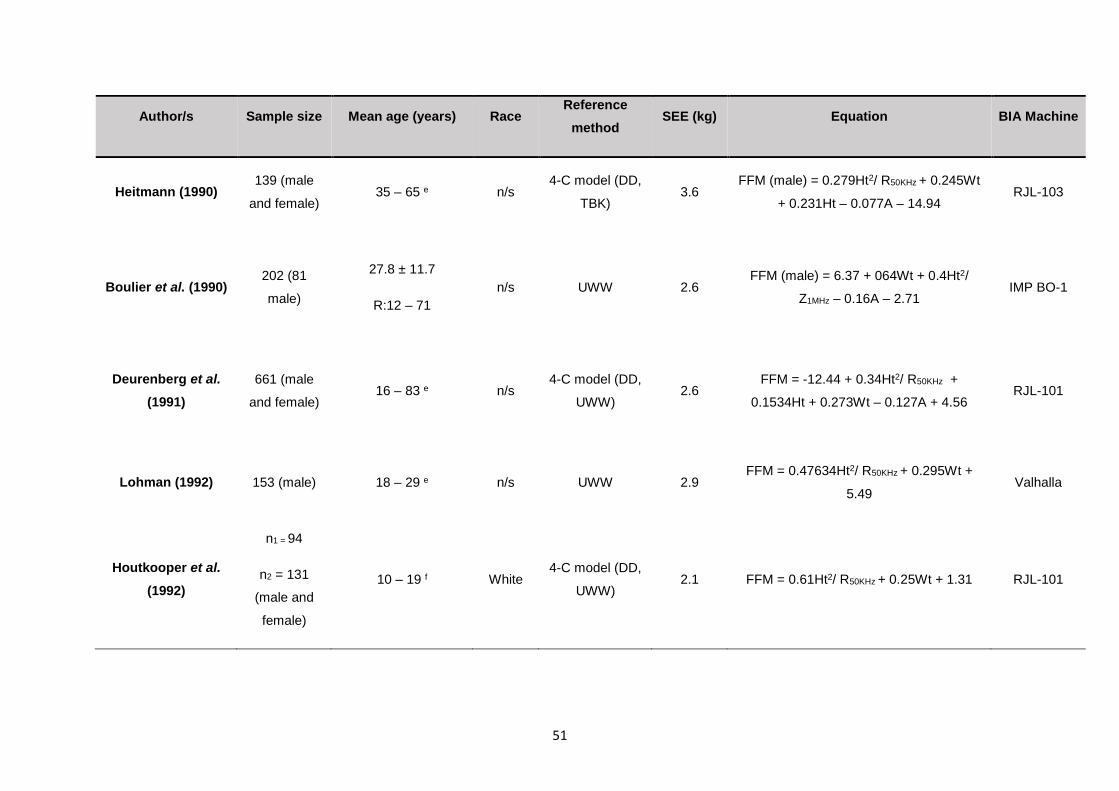
51
Author/s Sample size Mean age (years) Race Reference
method SEE (kg) Equation BIA Machine
Heitmann (1990) 139 (male
and female) 35 – 65 e n/s
4-C model (DD,
TBK) 3.6
FFM (male) = 0.279Ht2/ R50KHz + 0.245Wt
+ 0.231Ht – 0.077A – 14.94 RJL-103
Boulier et al. (1990) 202 (81
male)
27.8 ± 11.7
R:12 – 71
n/s UWW 2.6 FFM (male) = 6.37 + 064Wt + 0.4Ht2/
Z1MHz – 0.16A – 2.71 IMP BO-1
Deurenberg et al.
(1991)
661 (male
and female) 16 – 83 e n/s
4-C model (DD,
UWW) 2.6
FFM = -12.44 + 0.34Ht2/ R50KHz +
0.1534Ht + 0.273Wt – 0.127A + 4.56 RJL-101
Lohman (1992) 153 (male) 18 – 29 e n/s UWW 2.9 FFM = 0.47634Ht2/ R50KHz + 0.295Wt +
5.49 Valhalla
Houtkooper et al.
(1992)
n1 = 94
n2 = 131
(male and
female)
10 – 19 f White 4-C model (DD,
UWW) 2.1 FFM = 0.61Ht2/ R50KHz + 0.25Wt + 1.31 RJL-101
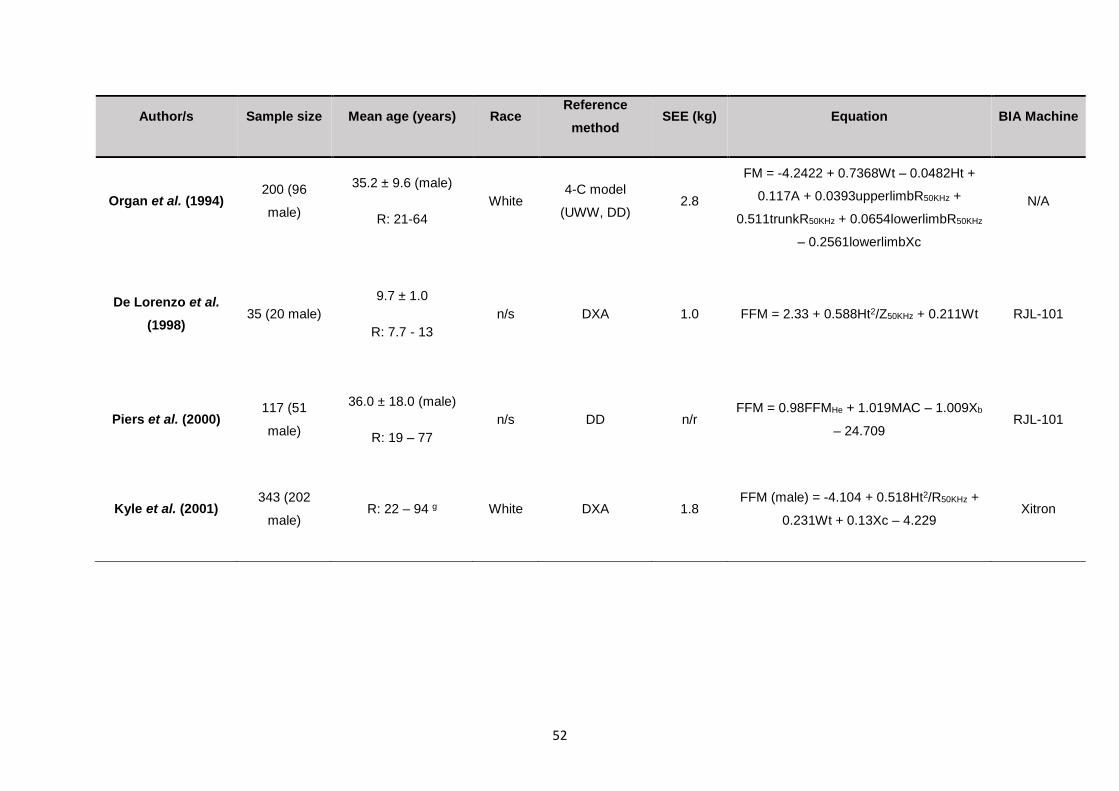
52
Author/s Sample size Mean age (years) Race Reference
method SEE (kg) Equation BIA Machine
Organ et al. (1994) 200 (96
male)
35.2 ± 9.6 (male)
R: 21-64
White 4-C model
(UWW, DD) 2.8
FM = -4.2422 + 0.7368Wt – 0.0482Ht +
0.117A + 0.0393upperlimbR50KHz +
0.511trunkR50KHz + 0.0654lowerlimbR50KHz
– 0.2561lowerlimbXc
N/A
De Lorenzo et al.
(1998) 35 (20 male)
9.7 ± 1.0
R: 7.7 - 13
n/s DXA 1.0 FFM = 2.33 + 0.588Ht2/Z50KHz + 0.211Wt RJL-101
Piers et al. (2000) 117 (51
male)
36.0 ± 18.0 (male)
R: 19 – 77
n/s DD n/r FFM = 0.98FFMHe + 1.019MAC – 1.009Xb
– 24.709 RJL-101
Kyle et al. (2001) 343 (202
male) R: 22 – 94 g White DXA 1.8
FFM (male) = -4.104 + 0.518Ht2/R50KHz +
0.231Wt + 0.13Xc – 4.229 Xitron
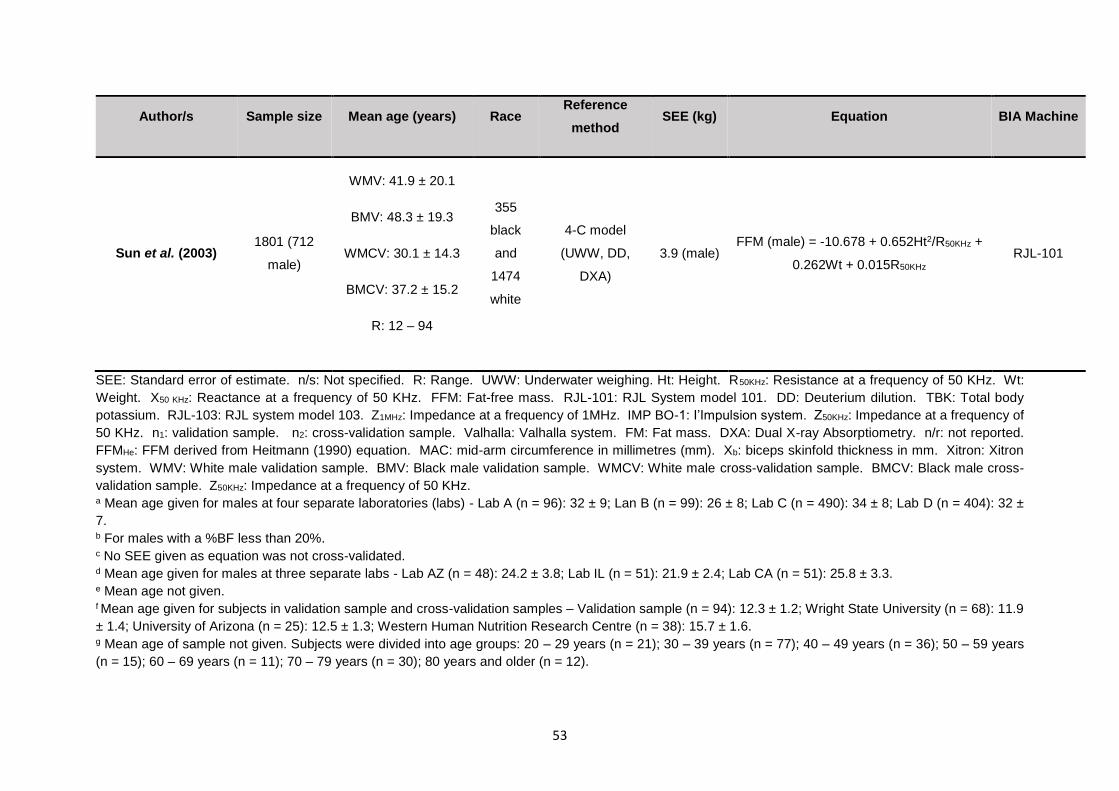
53
Author/s Sample size Mean age (years) Race Reference
method SEE (kg) Equation BIA Machine
Sun et al. (2003) 1801 (712
male)
WMV: 41.9 ± 20.1
BMV: 48.3 ± 19.3
WMCV: 30.1 ± 14.3
BMCV: 37.2 ± 15.2
R: 12 – 94
355
black
and
1474
white
4-C model
(UWW, DD,
DXA)
3.9 (male) FFM (male) = -10.678 + 0.652Ht2/R50KHz +
0.262Wt + 0.015R50KHz
RJL-101
SEE: Standard error of estimate. n/s: Not specified. R: Range. UWW: Underwater weighing. Ht: Height. R50KHz: Resistance at a frequency of 50 KHz. Wt:
Weight. X50 KHz: Reactance at a frequency of 50 KHz. FFM: Fat-free mass. RJL-101: RJL System model 101. DD: Deuterium dilution. TBK: Total body
potassium. RJL-103: RJL system model 103. Z1MHz: Impedance at a frequency of 1MHz. IMP BO-1: I’Impulsion system. Z50KHz: Impedance at a frequency of
50 KHz. n1: validation sample. n2: cross-validation sample. Valhalla: Valhalla system. FM: Fat mass. DXA: Dual X-ray Absorptiometry. n/r: not reported.
FFMHe: FFM derived from Heitmann (1990) equation. MAC: mid-arm circumference in millimetres (mm). Xb: biceps skinfold thickness in mm. Xitron: Xitron
system. WMV: White male validation sample. BMV: Black male validation sample. WMCV: White male cross-validation sample. BMCV: Black male cross-
validation sample. Z50KHz: Impedance at a frequency of 50 KHz. a Mean age given for males at four separate laboratories (labs) - Lab A (n = 96): 32 ± 9; Lan B (n = 99): 26 ± 8; Lab C (n = 490): 34 ± 8; Lab D (n = 404): 32 ±
7. b For males with a %BF less than 20%. c No SEE given as equation was not cross-validated. d Mean age given for males at three separate labs - Lab AZ (n = 48): 24.2 ± 3.8; Lab IL (n = 51): 21.9 ± 2.4; Lab CA (n = 51): 25.8 ± 3.3. e Mean age not given. f Mean age given for subjects in validation sample and cross-validation samples – Validation sample (n = 94): 12.3 ± 1.2; Wright State University (n = 68): 11.9
± 1.4; University of Arizona (n = 25): 12.5 ± 1.3; Western Human Nutrition Research Centre (n = 38): 15.7 ± 1.6. g Mean age of sample not given. Subjects were divided into age groups: 20 – 29 years (n = 21); 30 – 39 years (n = 77); 40 – 49 years (n = 36); 50 – 59 years
(n = 15); 60 – 69 years (n = 11); 70 – 79 years (n = 30); 80 years and older (n = 12).
54
Studies have also assessed accuracy of some of these regression equations by either cross-
validation or analysis of SEE, which indicates accuracy. Piers et al. (2000) conducted a
descriptive study on 117 healthy Australian adults, including males and females with ages
ranging from 19 to 77 years, to evaluate the reliability of equations by Heitmann (1990),
Lukaski et al. (1986) and Segal et al. (1988), against DD as a reference method. It was
reported that all three equations produced significantly different results for %BF when
compared to the reference method. A modified version of Heitmann, which included biceps
skinfold thickness and mid upper arm circumference, was then developed by Piers et al.
(2000) to produce results that were not significantly different to DD.
Kyle et al. (2004a) evaluated the reliability of a number of equations developed since 1990
which are commonly used to estimate FFM and body fat mass in terms of SEE. Houtkooper
et al. (1996) suggested that an ideal SEE would be less than 2.5 and an acceptable SEE of
less than 3.0 for men when evaluating the suitability of an equation. The equations were
classified according to outcome values, which were either FFM or fat mass (FM). Most of the
equations that can be considered suitable for use in the jockey apprentice population predict
FFM, which can then be used to calculate FM by subtracting the FFM from total body mass.
The equations evaluated in the study by Kyle et al. (2004a) are described in ascending order
of SEE.
The equation by Kyle et al. (2001), which was validated against DXA in a sample of 343
healthy adults age 18 to 94 years, was found to have the lowest SEE (1.8) and was therefore
the most accurate. This equation estimates FFM from R and X values (Kyle et al., 2001).
The next most accurate was the equation by Boulier et al. (1990) with a SEE of 2.6, which
necessitates the use of Z values from a frequency of 1 MHz, and Deurenberg et al. (1991a)
with the same SEE. For directly determining FM only, the equation by Organ et al. (1994)
had an acceptable SEE of 2.8. This was determined using a device that measures segmental
BIA, meaning that impedance values for each segment of the body, for example trunk, are
measured. The variables required for this equation cannot be measured by the
BODYSTAT®1500 as it measures whole-body impedance only. Lohman (1992) developed
an equation for predicting FFM with an acceptable SEE of 2.9. Sun et al. (2003) developed
from a sample of 1829 male and female subjects aged 12 to 94 years using a multi-
component model involving UWW, DD and DXA as a reference, giving an SEE of 3.9 for the
male sample. According to Houtkooper et al. (1996), this is an unacceptably high SEE for
the male population.
55
Interestingly, the study by Kyle et al. (2004a) did not evaluate the equation to predict FFM by
Houtkooper et al. (1992). This equation was derived from both UWW and DD in a sample of
94 healthy male and female subjects age 10 to 19 years, and then cross-validated in a three
other samples including 131 subjects from the same population. This study demonstrated a
SEE of 2.1 for the equation from cross-validation, making it the second most reliable equation
for SF-BIA for use in the jockey apprentice population.
2.7.2.4 The prediction of percent body fat by bioelectrical impedance analysis compared to
skinfolds
It is of importance to this study that the accuracy of BIA and skinfolds for the measurement
of %BF be compared as neither method has been validated in the jockey apprentice
population. Comparisons of the two methods have included the skinfold equations by Durnin
and Womersley (1974) , Jackson & Pollock (1978) and Lohman (1981), as well as BIA
equations by the Valhalla and RJL machines (equations cannot be disclosed) Lukaski et al.
(1986), Lohman (1992) and Houtkooper et al. (1992).
Jackson, Pollock, Graves & Mahar (1988) compared the reliability of %BF values predicted
by SF-BIA using the equation by Lukaski et al. (1986) and the seven-skinfold equation by
Jackson & Pollock (1978) compared to UWW as a reference method in a sample of 132
healthy male and female subjects with mean age of 36.7 years for the male subjects. The
results indicated a greater inter-observer variation in skinfold methods when compared to
BIA, however BIA produced a greater SEE than the skinfold method when compared to
UWW.
Fuller et al. (1992) compared %BF values predicted by SF-BIA using the equation provided
by the Valhalla machine used (equation cannot be disclosed) and four skinfolds using the
equation by Durnin & Womersley (1974) against a four component model involving DXA,
UWW and DD, in a sample of 28 healthy adults (12 women and 16 men) aged 18 to 59 years.
The mean age of the participants was 32.9 years which is substantially higher than that of
the jockey apprentices at the SAJA. The study reported that skinfolds produced more reliable
values than BIA. Although, it must be noted that this study sample size is relatively small and
the skinfold measurements were carried out by a single observer, therefore preventing inter-
observer variation which would have been more likely in a larger population over time.
56
Stewart & Hannan (2000) reported that fat mass predicted by skinfolds using the equations
by Durnin & Womersley (1974) and Jackson & Pollock (1978) produced a lower SEE (1.7)
that that of SF-BIA using the RJL machine and the equations by Lohman (1992) and Lukaski
et al. (1986) (2.8) in 82 male athletes. Dual X-ray Absorptiometry was used as a reference
method.
The previously described study by Parker et al. (2003) also compared %BF as measured by
skinfolds using the equation by Slaughter et al. (1988) to the 3-C model. Although BIA using
the Tanita TBF410 GS model gave inaccurate results, nonsignificant differences were
reported between the skinfold method and the reference method.
Hetzler, Kimura, Haines, Labotz & Smith (2006) investigated the level of agreement between
SF-BIA using equations by RJL, Lukaski et al. (1986) and Houtkooper et al. (1992) to the
skinfold equations by Jackson & Pollock (1978) and Lohman (1981) to determine minimal
wrestling weight in 208 wrestlers, aged 13 to 18 years, as previously described. Significant
differences were reported between values determined BIA using Lukaski et al. (1986) and
both skinfold equations as well as between Houtkooper et al. (1992) and Jackson & Pollock
(1978) but not Lohman (1981). No significant differences were found between RJL and either
of the skinfold equations. No reference method was used in this study.
Demirkan et al. (2014) measured the %BF of 114 male wrestlers aged 15 to 17 years by the
skinfold method using the Lohman (1992) equation as well as BIA using the Tanita BC- 418
device. Skinfold measurements produced significantly lower values for %BF (8.8 % for
euhydration and 9.1 % for dehydration) than BIA (9.0 % for euhydration and 10.8 % for
dehydration). No reference method was used.
It is clear that further validation of both methods for the apprentices is required as there is no
data available for this population.
2.8 CONCLUSION
It is evident that deleterious techniques including chronic weight-making methods, such as
food restriction, excessive exercise, smoking and the use of laxatives and appetite
suppressants, as well as acute weight-making methods, including fluid restriction and
dehydration by using saunas, exercising in sweat suits, taking hot or salt baths and the use
of diuretics, are part of the jockey culture. These habits have been inherited by the jockey
apprentices at the SAJA.
57
These habits negatively impact the physiological health, such as BMD, and psychological
health, in terms of the risk of eating disorders of the jockeys reducing. This study investigates
the apprentices’ risk of abnormal eating behaviours.
Accurate prediction of %BF is important to assist the apprentices with healthy weight control,
by ensuring that FFM is not lost during weight loss, and preventing the apprentices from
reducing their %BF to dangerously low levels.
Reference methods for frequently measuring %BF, such as DXA and DD, are not appropriate
due to cost, impracticality and possible risk of excessive radiation exposure (DXA). Field
methods such as BMI, BIA and skinfold measurements are more suitable. These methods
may be impacted by dehydration which presents an issue in the jockey population as they
are reported to be chronically dehydrated. It is therefore important to evaluate the impact of
dehydration on the accuracy of these methods in the jockey apprentice population.
The advantages and disadvantages of each method seem to be equal, in terms of cost,
practicality and the impact of demographic factors and hydration status. Using BMI to
calculate %BF may be affected by the apprentices’ SS. The skinfold method is not affected
by SS as equations do not use height as a variable. The skinfold method does however
require a substantial amount of training. Bioelectric impedance analysis may be affected by
height as it is used as a variable in most BIA equations. This method requires much less, if
any, training than the skinfold method.
Assessment of the accuracy of these three methods in this unique population, and the impact
of dehydration, would therefore be useful for improving the weight-control practices of the
apprentices.
58
CHAPTER 3: METHODOLOGY
3.1 INTRODUCTION
This chapter discusses background information on the study site (SAJA), the study design,
study population and sample, methods and materials used, statistical analysis, reduction of
bias and ethical considerations.
3.2 BACKGROUND INFORMATION ON THE STUDY SITE
The SAJA, situated in Summerveld, is the only institution in SA that offers both an academic
and practical apprentice programme to qualify professional jockeys. It was established in
1958 and has extended to two satellite training centres in Cape Town and Port Elizabeth.
The academy and these satellites are run by Gold Circle. There is an additional training
centre based in Gauteng that is funded and administered by The Racing Trust. Apprentices
begin their initial training at the Academy in Summerveld and are fed through to the other
three training centres once they are competent at riding in races (The South African Jockey
Academy, 2007a).
3.3 STUDY DESIGN
This was a cross-sectional, descriptive study including all male apprentice jockeys training at
the SAJA in 2016. However, it can be noted that the study did involve some intervention as
a hydration protocol was used to ensure euhydration for euhydrated measurements.
The study aimed to determine the accuracy of three methods of body composition analysis
(BMI, skinfold method and BIA) when euhydrated and dehydrated compared to DD. It also
investigated the weight-making techniques and the risk of developing eating disorders such
as AN and BN.
A cross-sectional study involves the assessment of a population, which is represented by the
study sample, at a single point in time. It is used to estimate the prevalence of a specific
outcome/s in the population of interest. It typically involves survey research, such as
questionnaires, which is a cost-effective method of data collection (Creswell, 2013).
The advantages include cost-effectiveness, timely data collection, the ability to control for
multiple confounders, the ability to assess multiple outcomes at once and the use of
individualised data (Thiese, 2014). A disadvantage is that temporality cannot be
59
demonstrated, meaning that causation cannot be proven as both exposure and outcome are
measured at the same time (Thiese, 2014).
A descriptive study is used to describe the characteristics of a population without
manipulating the environment. It can therefore be used to identify patterns but not causation
(Shields & Rangarajan, 2013).
The advantages are that there are relatively small ethical implications as the environment is
not manipulated, although this study involved some intervention by the use of a hydration
protocol; it is effective in the analysis of non-quantified topics and issues, and it offers the
opportunity to observe a phenomenon in a completely natural or unchanged environment, as
well as integrate both qualitative and quantitative methods of data collection (Dudovskiy,
2016). The disadvantage is that it is of low internal validity as it cannot be used to identify
cause and effect (Dudovskiy, 2016).
A cross sectional descriptive design was appropriate for this study due to its low cost and
timeliness and because it was not the intention of the study to identify causation. The study
design allowed for the comparison of methods of measuring %BF, weight-making techniques
and risk of eating disorders at the SAJA and did not require any manipulation of the
environment or apprentices.
3.4 STUDY POPULATION AND SAMPLE SELECTION
Total population sampling was used in this study and all male jockey apprentices training at
the Summerveld campus of the SAJA between June and September 2016 were invited to
participate. Those that met the inclusion criteria were included.
3.4.1 Inclusion criteria
Male jockey apprentices enrolled in the apprenticeship program at the SAJA Summerveld
campus during the duration of data collection were included in the study.
3.4.2 Exclusion criteria
Female apprentices were not included due to the small sample of female apprentices.
Apprentices who left the academy or obtained their professional license during data collection
were excluded from analysis. Apprentices with known disorders that could impact water
balance, such as renal failure, and body composition, such as dwarfism or any amputations
would have been excluded.
60
3.5 OUTCOME VARIABLES
These included demographics (age and race); USG, anthropometry (weight, height, BMI,
skinfolds including biceps, triceps, subscapular, supra-iliac, abdominal, thigh and calf
skinfolds), impedance values obtained from the BODYSTAT®1500 machine, and the Fourier-
transform infrared spectroscopy results obtained from the DD technique in both a dehydrated
and euhydrated state; the responses to the use of various weight-making and weight-control
techniques according to the lifestyle questionnaire; and the EAT-26 scores of the apprentices.
3.6 CONFOUNDING VARIABLES
There were no confounding variables.
3.7 STUDY MATERIALS AND METHODS
Urine specific gravity, anthropometric measurements, BIA and DD were measured by the
research team at 5am following an overnight fast on a rest day, which was usually a Sunday.
These measurements were taken on two separate days: once when dehydrated, following
no protocol to ensure dehydration, and again when euhydrated, following a euhydration
protocol. Ensuring dehydration required no intervention in this population. The apprentices
arrived at the first measurement session with a USG indicating dehydration due to chronic
dehydration. Should they have arrived euhydrated on the first measurement session, a
dehydration protocol would have been implemented for the next session, however this was
not necessary.
3.7.1 Urine specific gravity
Urine specific gravity has previously been shown to be an accurate and reliable measure of
hydration status (Bartok, Schoeller, Randall Clark, Sullivan & Landry, 2004; Armstrong, 2005;
Oppliger, Magnes, Popowski & Gisolfi, 2005). Urine specific gravity was measured using a
digital hand held pocket refractometer (ATAGO PAL-10S) prior to anthropometric
measurements, BIA and DD.
A midstream urine sample was important for consistency and accuracy (Armstrong, 2005).
To collect a midstream urine sample, the apprentices were required to first pass a small
amount urine into the toilet and then, without stopping the urine flow, catch enough urine to
quarter fill the sterile sample bottle provided. The sample bottle cap was replaced, the bottle
washed and was given immediately to the fieldworker for analysis.
61
The fieldworker wore surgical gloves during testing. Prior to calibration, the device was
switched on. To calibrate the device, it was set to zero before every test was done.
Approximately 0.3 ml of tap water was placed on the prism surface of the device before zero-
setting. Once “AAA” was displayed on the screen, the prism was wiped with two-ply tissue
paper, water was applied and the zero button was pressed again. Once the screen displayed
1.000, confirming the zero setting, the prism was wiped clean again with tissue paper.
Approximately 0.3 ml of the urine sample was then placed on the prism surface using a plastic
spoon and, after about three seconds, a USG reading was obtained. This process was
repeated and an average of the two readings was recorded on the data collection sheet
(Appendix A). If the two readings differed by more than 0.001 g/ml, a third reading was taken
and an average of the two closest readings was used.
The readings were interpreted according to the guidelines prescribed by Armstrong, Maresh,
Castellani, Bergeron, Kenefick, LaGasse & Riebe (1994) and Casa et al. (2000), which
classifies euhydration as a USG less than or equal to 1.020 g/ml (Armstrong et al., 1994), a
USG greater than 1.020 g/ml up to 1.030 g/ml as significant or moderate dehydration and a
USG greater than 1.030 g/ml as serious or severe dehydration (Casa et al., 2000).
3.7.2 Anthropometry measurements
3.7.2.1 Weight
A portable Seca 437 scale (50 g to 150 kg) was used to determine weight. The scale was
calibrated prior to the study by SA Scales and was regularly checked during the study using
a known 5 kg calibration weight (Avery) and placed on a stable level surface. The apprentices
were weighed in their underwear after urination and having fasted overnight. The scale was
first switched on and when 0.00 appeared the apprentices were instructed to step onto the
centre of the scale, with their weight evenly distributed on both feet, and look directly ahead
(Norton & Olds, 1996). Their weight was recorded on the data collection sheet (Appendix A).
They were then asked to step off the scale. The scale was zeroed and the apprentice
reweighed. If the readings differed by 100 g, the apprentice was weighed a third time and
the average was taken of the two closest readings.
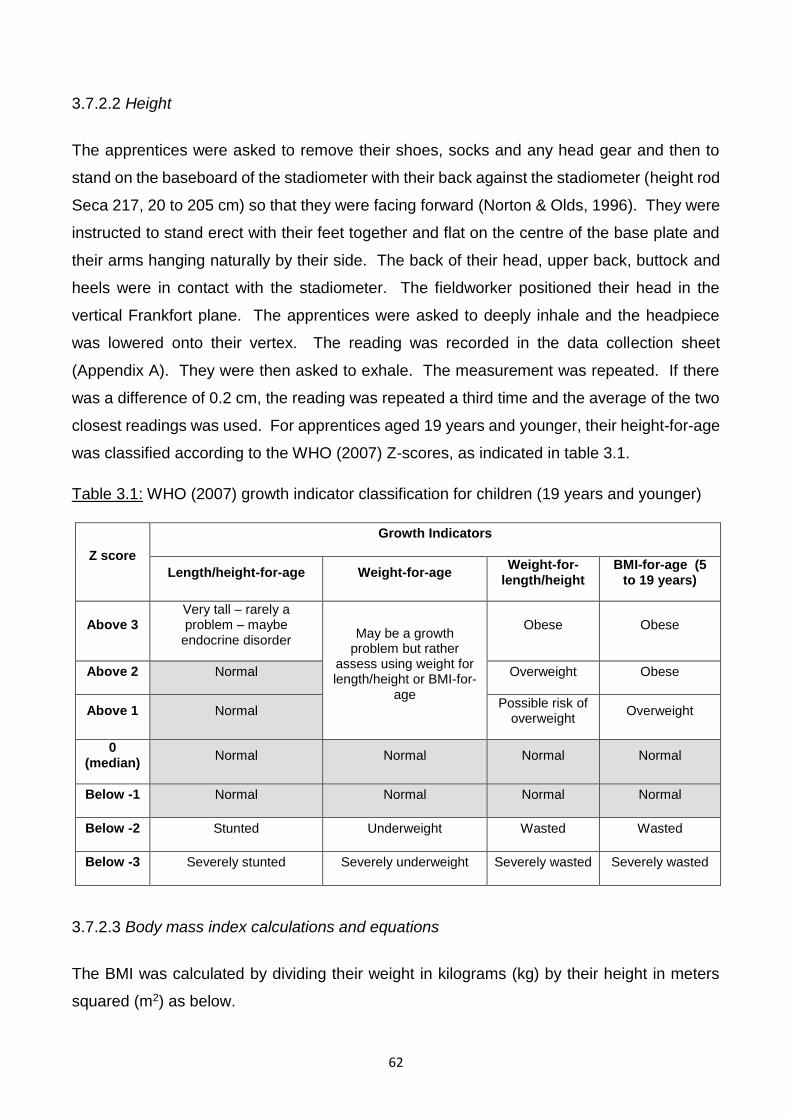
62
3.7.2.2 Height
The apprentices were asked to remove their shoes, socks and any head gear and then to
stand on the baseboard of the stadiometer with their back against the stadiometer (height rod
Seca 217, 20 to 205 cm) so that they were facing forward (Norton & Olds, 1996). They were
instructed to stand erect with their feet together and flat on the centre of the base plate and
their arms hanging naturally by their side. The back of their head, upper back, buttock and
heels were in contact with the stadiometer. The fieldworker positioned their head in the
vertical Frankfort plane. The apprentices were asked to deeply inhale and the headpiece
was lowered onto their vertex. The reading was recorded in the data collection sheet
(Appendix A). They were then asked to exhale. The measurement was repeated. If there
was a difference of 0.2 cm, the reading was repeated a third time and the average of the two
closest readings was used. For apprentices aged 19 years and younger, their height-for-age
was classified according to the WHO (2007) Z-scores, as indicated in table 3.1.
Table 3.1: WHO (2007) growth indicator classification for children (19 years and younger)
Z score
Growth Indicators
Length/height-for-age Weight-for-age Weight-for-
length/height BMI-for-age (5
to 19 years)
Above 3 Very tall – rarely a problem – maybe
endocrine disorder May be a growth
problem but rather assess using weight for length/height or BMI-for-
age
Obese Obese
Above 2 Normal Overweight Obese
Above 1 Normal Possible risk of
overweight Overweight
0 (median)
Normal Normal Normal Normal
Below -1 Normal Normal Normal Normal
Below -2 Stunted Underweight Wasted Wasted
Below -3 Severely stunted Severely underweight Severely wasted Severely wasted
3.7.2.3 Body mass index calculations and equations
The BMI was calculated by dividing their weight in kilograms (kg) by their height in meters
squared (m2) as below.
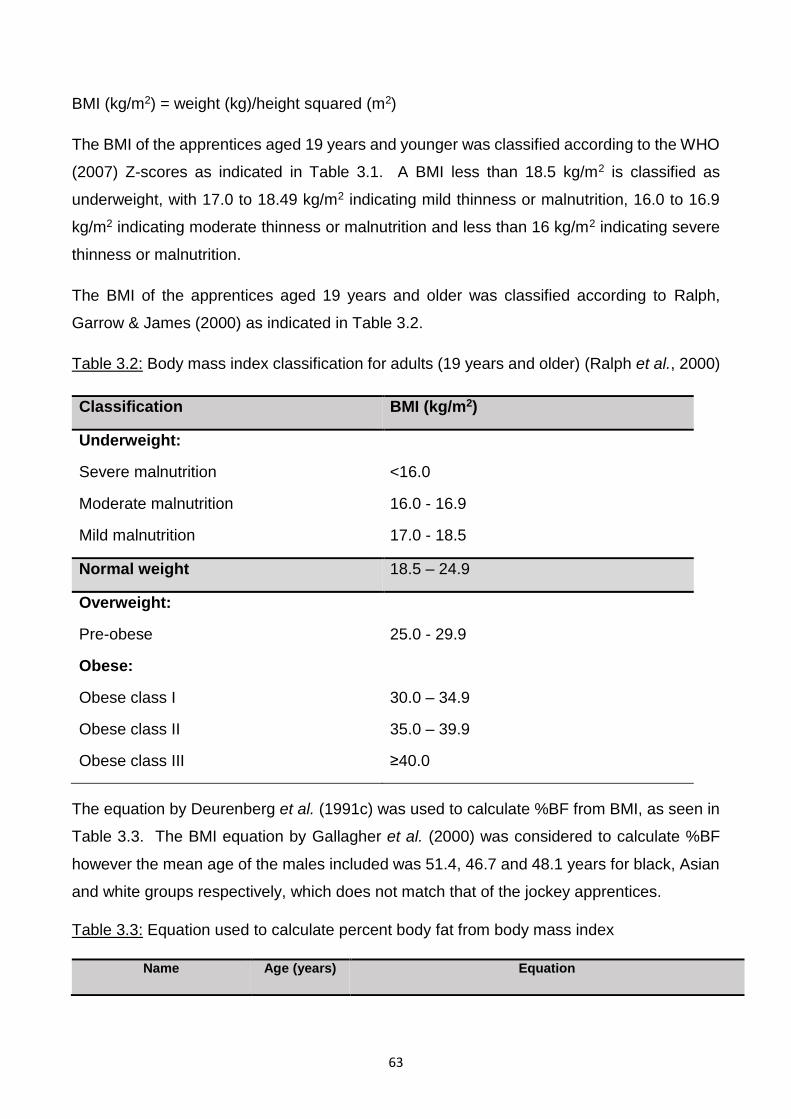
63
BMI (kg/m2) = weight (kg)/height squared (m2)
The BMI of the apprentices aged 19 years and younger was classified according to the WHO
(2007) Z-scores as indicated in Table 3.1. A BMI less than 18.5 kg/m2 is classified as
underweight, with 17.0 to 18.49 kg/m2 indicating mild thinness or malnutrition, 16.0 to 16.9
kg/m2 indicating moderate thinness or malnutrition and less than 16 kg/m2 indicating severe
thinness or malnutrition.
The BMI of the apprentices aged 19 years and older was classified according to Ralph,
Garrow & James (2000) as indicated in Table 3.2.
Table 3.2: Body mass index classification for adults (19 years and older) (Ralph et al., 2000)
Classification BMI (kg/m2)
Underweight:
Severe malnutrition
Moderate malnutrition
Mild malnutrition
<16.0
16.0 - 16.9
17.0 - 18.5
Normal weight 18.5 – 24.9
Overweight:
Pre-obese
25.0 - 29.9
Obese:
Obese class I
Obese class II
Obese class III
30.0 – 34.9
35.0 – 39.9
≥40.0
The equation by Deurenberg et al. (1991c) was used to calculate %BF from BMI, as seen in
Table 3.3. The BMI equation by Gallagher et al. (2000) was considered to calculate %BF
however the mean age of the males included was 51.4, 46.7 and 48.1 years for black, Asian
and white groups respectively, which does not match that of the jockey apprentices.
Table 3.3: Equation used to calculate percent body fat from body mass index
Name Age (years) Equation
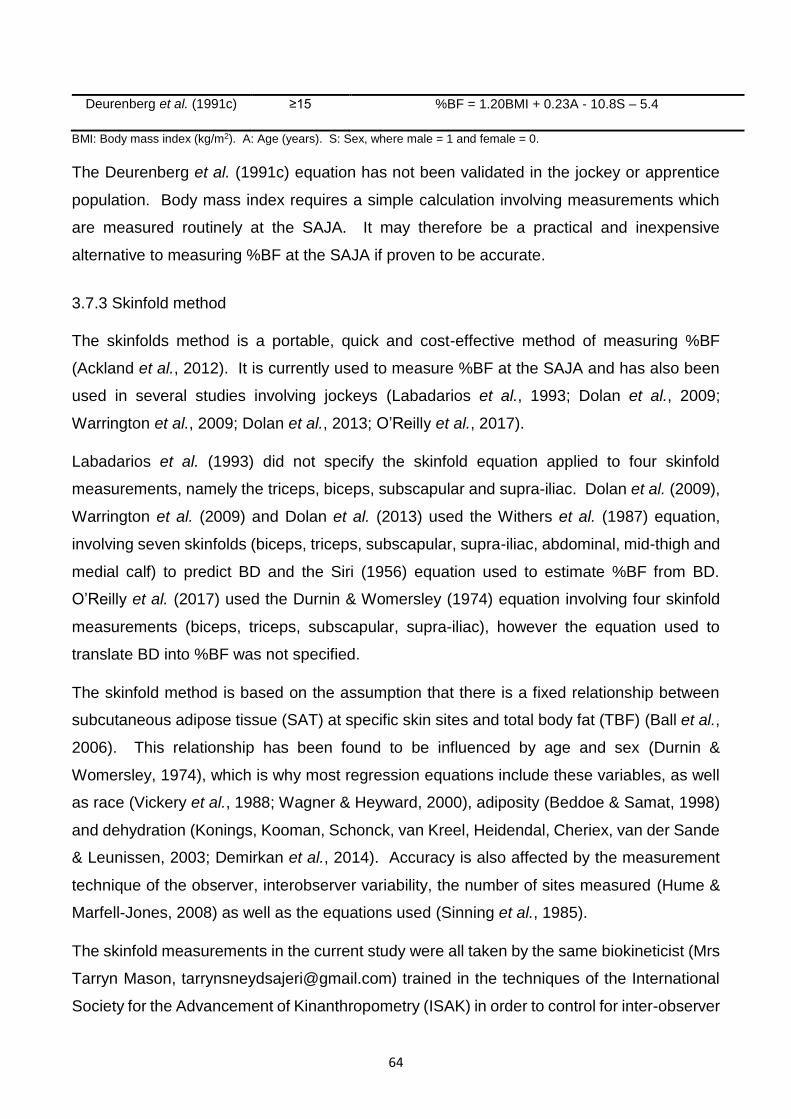
64
Deurenberg et al. (1991c) ≥15 %BF = 1.20BMI + 0.23A - 10.8S – 5.4
BMI: Body mass index (kg/m2). A: Age (years). S: Sex, where male = 1 and female = 0.
The Deurenberg et al. (1991c) equation has not been validated in the jockey or apprentice
population. Body mass index requires a simple calculation involving measurements which
are measured routinely at the SAJA. It may therefore be a practical and inexpensive
alternative to measuring %BF at the SAJA if proven to be accurate.
3.7.3 Skinfold method
The skinfolds method is a portable, quick and cost-effective method of measuring %BF
(Ackland et al., 2012). It is currently used to measure %BF at the SAJA and has also been
used in several studies involving jockeys (Labadarios et al., 1993; Dolan et al., 2009;
Warrington et al., 2009; Dolan et al., 2013; O’Reilly et al., 2017).
Labadarios et al. (1993) did not specify the skinfold equation applied to four skinfold
measurements, namely the triceps, biceps, subscapular and supra-iliac. Dolan et al. (2009),
Warrington et al. (2009) and Dolan et al. (2013) used the Withers et al. (1987) equation,
involving seven skinfolds (biceps, triceps, subscapular, supra-iliac, abdominal, mid-thigh and
medial calf) to predict BD and the Siri (1956) equation used to estimate %BF from BD.
O’Reilly et al. (2017) used the Durnin & Womersley (1974) equation involving four skinfold
measurements (biceps, triceps, subscapular, supra-iliac), however the equation used to
translate BD into %BF was not specified.
The skinfold method is based on the assumption that there is a fixed relationship between
subcutaneous adipose tissue (SAT) at specific skin sites and total body fat (TBF) (Ball et al.,
2006). This relationship has been found to be influenced by age and sex (Durnin &
Womersley, 1974), which is why most regression equations include these variables, as well
as race (Vickery et al., 1988; Wagner & Heyward, 2000), adiposity (Beddoe & Samat, 1998)
and dehydration (Konings, Kooman, Schonck, van Kreel, Heidendal, Cheriex, van der Sande
& Leunissen, 2003; Demirkan et al., 2014). Accuracy is also affected by the measurement
technique of the observer, interobserver variability, the number of sites measured (Hume &
Marfell-Jones, 2008) as well as the equations used (Sinning et al., 1985).
The skinfold measurements in the current study were all taken by the same biokineticist (Mrs
Tarryn Mason, [email protected]) trained in the techniques of the International
Society for the Advancement of Kinanthropometry (ISAK) in order to control for inter-observer
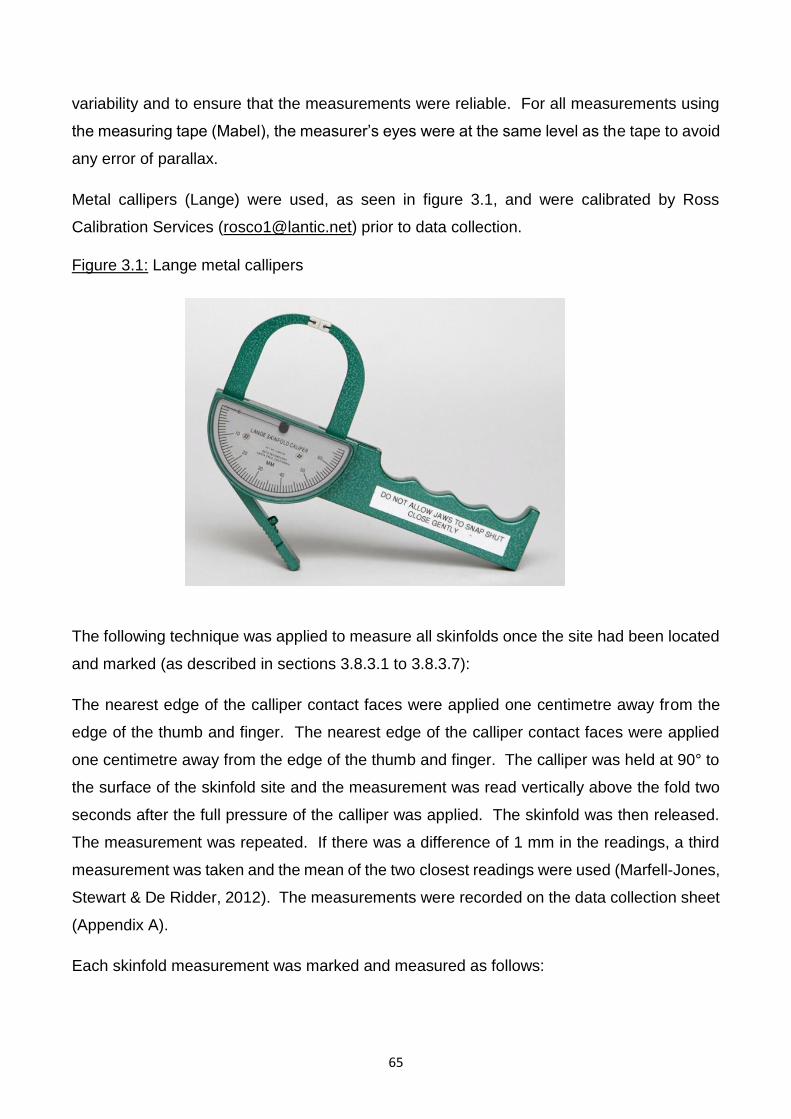
65
variability and to ensure that the measurements were reliable. For all measurements using
the measuring tape (Mabel), the measurer’s eyes were at the same level as the tape to avoid
any error of parallax.
Metal callipers (Lange) were used, as seen in figure 3.1, and were calibrated by Ross
Calibration Services ([email protected]) prior to data collection.
Figure 3.1: Lange metal callipers
The following technique was applied to measure all skinfolds once the site had been located
and marked (as described in sections 3.8.3.1 to 3.8.3.7):
The nearest edge of the calliper contact faces were applied one centimetre away from the
edge of the thumb and finger. The nearest edge of the calliper contact faces were applied
one centimetre away from the edge of the thumb and finger. The calliper was held at 90° to
the surface of the skinfold site and the measurement was read vertically above the fold two
seconds after the full pressure of the calliper was applied. The skinfold was then released.
The measurement was repeated. If there was a difference of 1 mm in the readings, a third
measurement was taken and the mean of the two closest readings were used (Marfell-Jones,
Stewart & De Ridder, 2012). The measurements were recorded on the data collection sheet
(Appendix A).
Each skinfold measurement was marked and measured as follows:
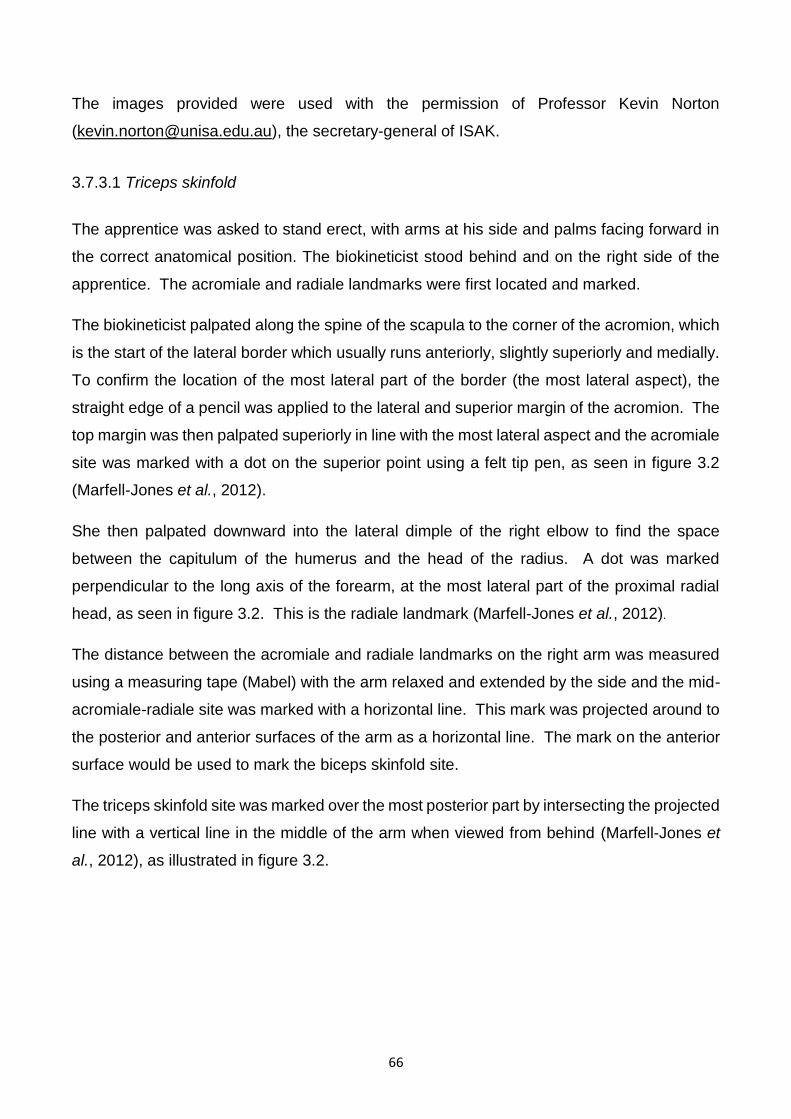
66
The images provided were used with the permission of Professor Kevin Norton
([email protected]), the secretary-general of ISAK.
3.7.3.1 Triceps skinfold
The apprentice was asked to stand erect, with arms at his side and palms facing forward in
the correct anatomical position. The biokineticist stood behind and on the right side of the
apprentice. The acromiale and radiale landmarks were first located and marked.
The biokineticist palpated along the spine of the scapula to the corner of the acromion, which
is the start of the lateral border which usually runs anteriorly, slightly superiorly and medially.
To confirm the location of the most lateral part of the border (the most lateral aspect), the
straight edge of a pencil was applied to the lateral and superior margin of the acromion. The
top margin was then palpated superiorly in line with the most lateral aspect and the acromiale
site was marked with a dot on the superior point using a felt tip pen, as seen in figure 3.2
(Marfell-Jones et al., 2012).
She then palpated downward into the lateral dimple of the right elbow to find the space
between the capitulum of the humerus and the head of the radius. A dot was marked
perpendicular to the long axis of the forearm, at the most lateral part of the proximal radial
head, as seen in figure 3.2. This is the radiale landmark (Marfell-Jones et al., 2012).
The distance between the acromiale and radiale landmarks on the right arm was measured
using a measuring tape (Mabel) with the arm relaxed and extended by the side and the mid-
acromiale-radiale site was marked with a horizontal line. This mark was projected around to
the posterior and anterior surfaces of the arm as a horizontal line. The mark on the anterior
surface would be used to mark the biceps skinfold site.
The triceps skinfold site was marked over the most posterior part by intersecting the projected
line with a vertical line in the middle of the arm when viewed from behind (Marfell-Jones et
al., 2012), as illustrated in figure 3.2.
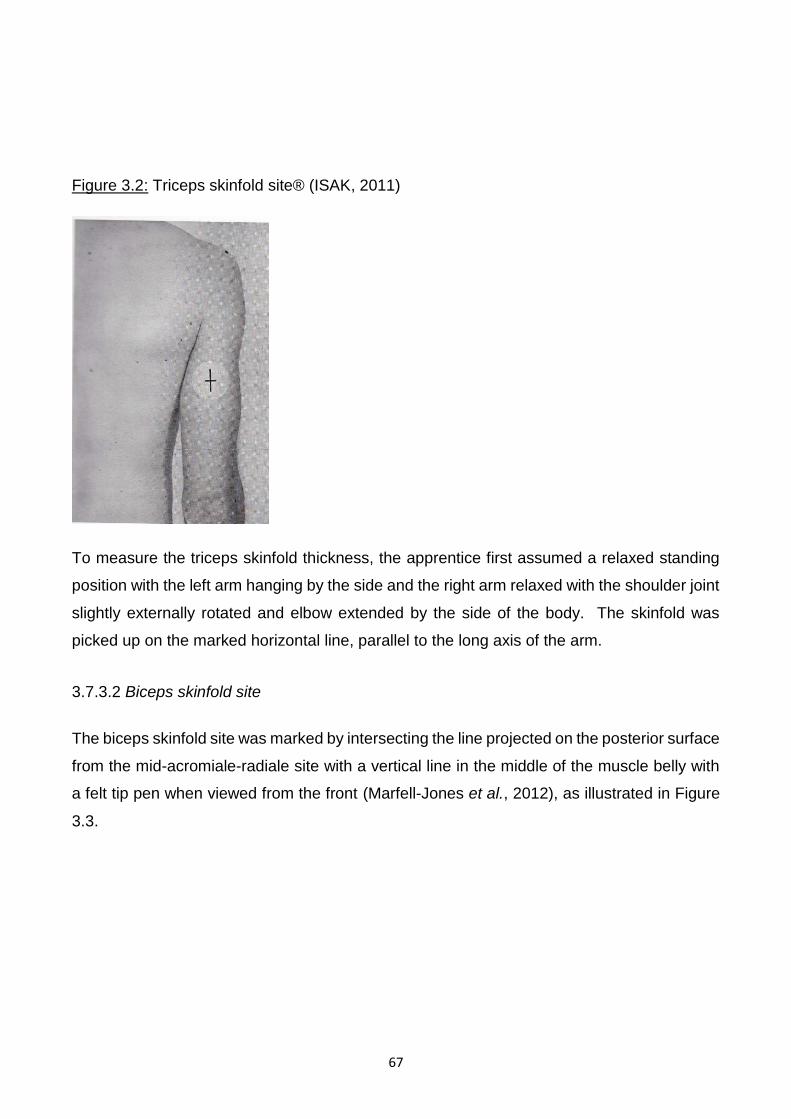
67
Figure 3.2: Triceps skinfold site® (ISAK, 2011)
To measure the triceps skinfold thickness, the apprentice first assumed a relaxed standing
position with the left arm hanging by the side and the right arm relaxed with the shoulder joint
slightly externally rotated and elbow extended by the side of the body. The skinfold was
picked up on the marked horizontal line, parallel to the long axis of the arm.
3.7.3.2 Biceps skinfold site
The biceps skinfold site was marked by intersecting the line projected on the posterior surface
from the mid-acromiale-radiale site with a vertical line in the middle of the muscle belly with
a felt tip pen when viewed from the front (Marfell-Jones et al., 2012), as illustrated in Figure
3.3.
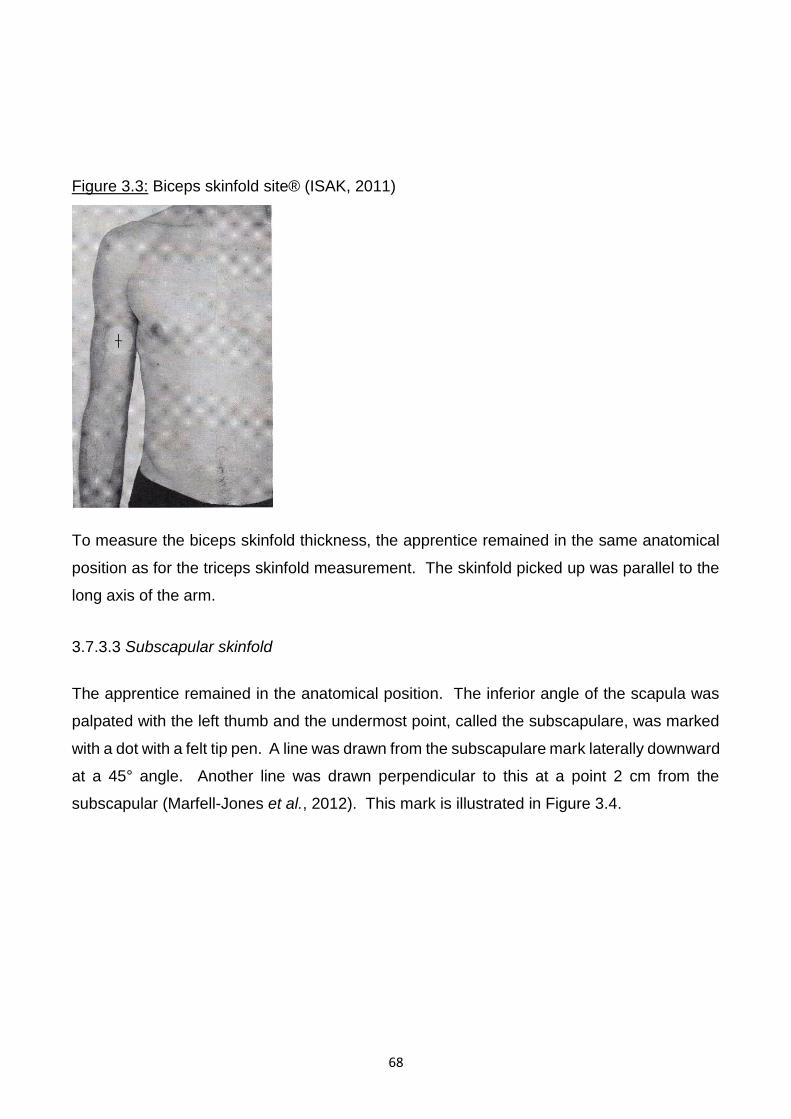
68
Figure 3.3: Biceps skinfold site® (ISAK, 2011)
To measure the biceps skinfold thickness, the apprentice remained in the same anatomical
position as for the triceps skinfold measurement. The skinfold picked up was parallel to the
long axis of the arm.
3.7.3.3 Subscapular skinfold
The apprentice remained in the anatomical position. The inferior angle of the scapula was
palpated with the left thumb and the undermost point, called the subscapulare, was marked
with a dot with a felt tip pen. A line was drawn from the subscapulare mark laterally downward
at a 45° angle. Another line was drawn perpendicular to this at a point 2 cm from the
subscapular (Marfell-Jones et al., 2012). This mark is illustrated in Figure 3.4.
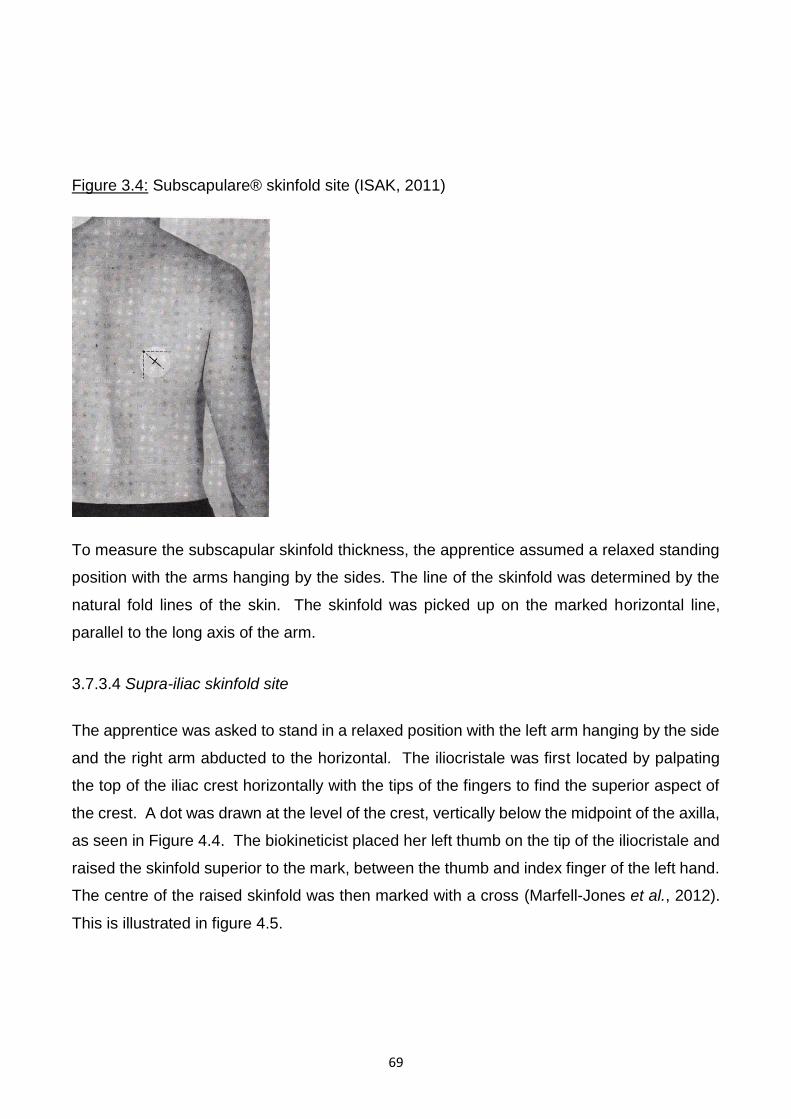
69
Figure 3.4: Subscapulare® skinfold site (ISAK, 2011)
To measure the subscapular skinfold thickness, the apprentice assumed a relaxed standing
position with the arms hanging by the sides. The line of the skinfold was determined by the
natural fold lines of the skin. The skinfold was picked up on the marked horizontal line,
parallel to the long axis of the arm.
3.7.3.4 Supra-iliac skinfold site
The apprentice was asked to stand in a relaxed position with the left arm hanging by the side
and the right arm abducted to the horizontal. The iliocristale was first located by palpating
the top of the iliac crest horizontally with the tips of the fingers to find the superior aspect of
the crest. A dot was drawn at the level of the crest, vertically below the midpoint of the axilla,
as seen in Figure 4.4. The biokineticist placed her left thumb on the tip of the iliocristale and
raised the skinfold superior to the mark, between the thumb and index finger of the left hand.
The centre of the raised skinfold was then marked with a cross (Marfell-Jones et al., 2012).
This is illustrated in figure 4.5.
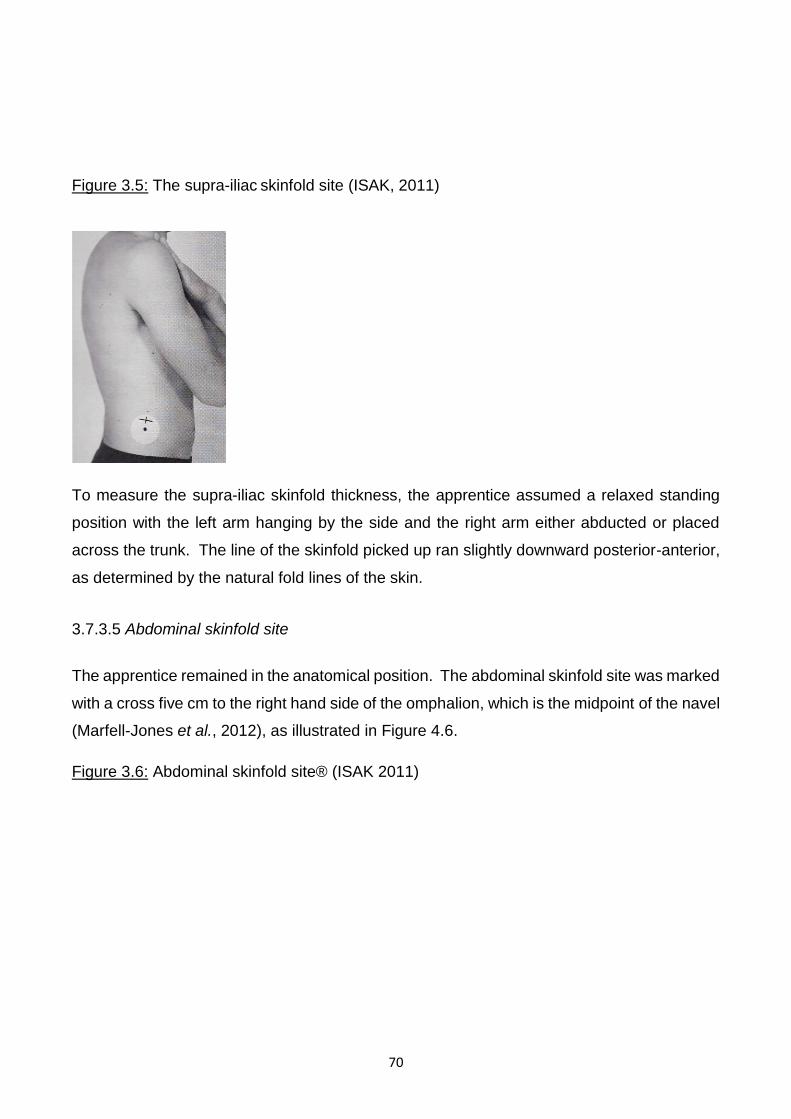
70
Figure 3.5: The supra-iliac skinfold site (ISAK, 2011)
To measure the supra-iliac skinfold thickness, the apprentice assumed a relaxed standing
position with the left arm hanging by the side and the right arm either abducted or placed
across the trunk. The line of the skinfold picked up ran slightly downward posterior-anterior,
as determined by the natural fold lines of the skin.
3.7.3.5 Abdominal skinfold site
The apprentice remained in the anatomical position. The abdominal skinfold site was marked
with a cross five cm to the right hand side of the omphalion, which is the midpoint of the navel
(Marfell-Jones et al., 2012), as illustrated in Figure 4.6.
Figure 3.6: Abdominal skinfold site® (ISAK 2011)
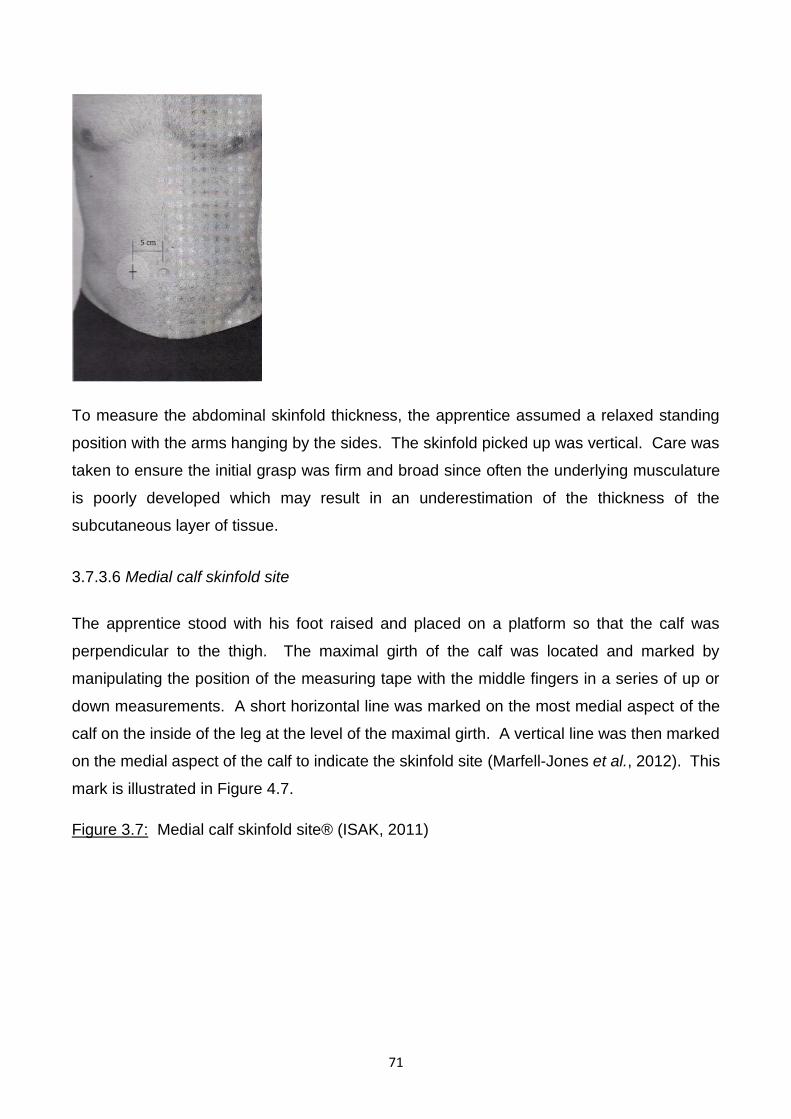
71
To measure the abdominal skinfold thickness, the apprentice assumed a relaxed standing
position with the arms hanging by the sides. The skinfold picked up was vertical. Care was
taken to ensure the initial grasp was firm and broad since often the underlying musculature
is poorly developed which may result in an underestimation of the thickness of the
subcutaneous layer of tissue.
3.7.3.6 Medial calf skinfold site
The apprentice stood with his foot raised and placed on a platform so that the calf was
perpendicular to the thigh. The maximal girth of the calf was located and marked by
manipulating the position of the measuring tape with the middle fingers in a series of up or
down measurements. A short horizontal line was marked on the most medial aspect of the
calf on the inside of the leg at the level of the maximal girth. A vertical line was then marked
on the medial aspect of the calf to indicate the skinfold site (Marfell-Jones et al., 2012). This
mark is illustrated in Figure 4.7.
Figure 3.7: Medial calf skinfold site® (ISAK, 2011)
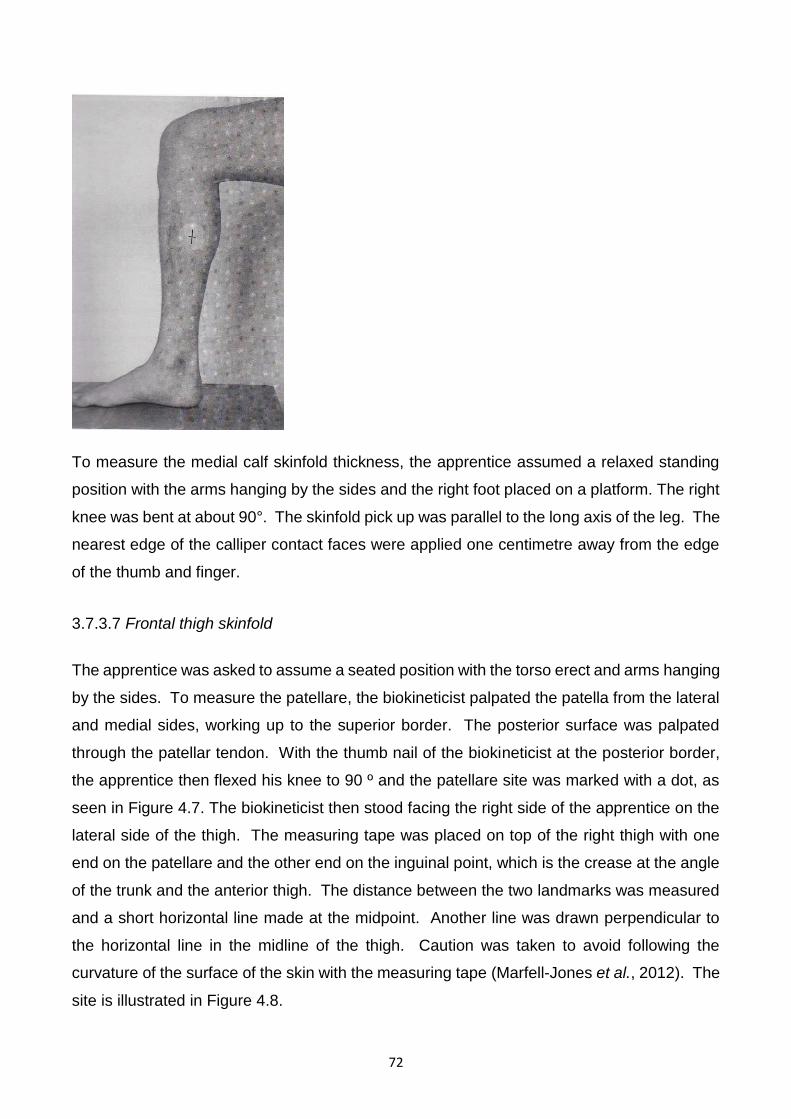
72
To measure the medial calf skinfold thickness, the apprentice assumed a relaxed standing
position with the arms hanging by the sides and the right foot placed on a platform. The right
knee was bent at about 90°. The skinfold pick up was parallel to the long axis of the leg. The
nearest edge of the calliper contact faces were applied one centimetre away from the edge
of the thumb and finger.
3.7.3.7 Frontal thigh skinfold
The apprentice was asked to assume a seated position with the torso erect and arms hanging
by the sides. To measure the patellare, the biokineticist palpated the patella from the lateral
and medial sides, working up to the superior border. The posterior surface was palpated
through the patellar tendon. With the thumb nail of the biokineticist at the posterior border,
the apprentice then flexed his knee to 90 º and the patellare site was marked with a dot, as
seen in Figure 4.7. The biokineticist then stood facing the right side of the apprentice on the
lateral side of the thigh. The measuring tape was placed on top of the right thigh with one
end on the patellare and the other end on the inguinal point, which is the crease at the angle
of the trunk and the anterior thigh. The distance between the two landmarks was measured
and a short horizontal line made at the midpoint. Another line was drawn perpendicular to
the horizontal line in the midline of the thigh. Caution was taken to avoid following the
curvature of the surface of the skin with the measuring tape (Marfell-Jones et al., 2012). The
site is illustrated in Figure 4.8.
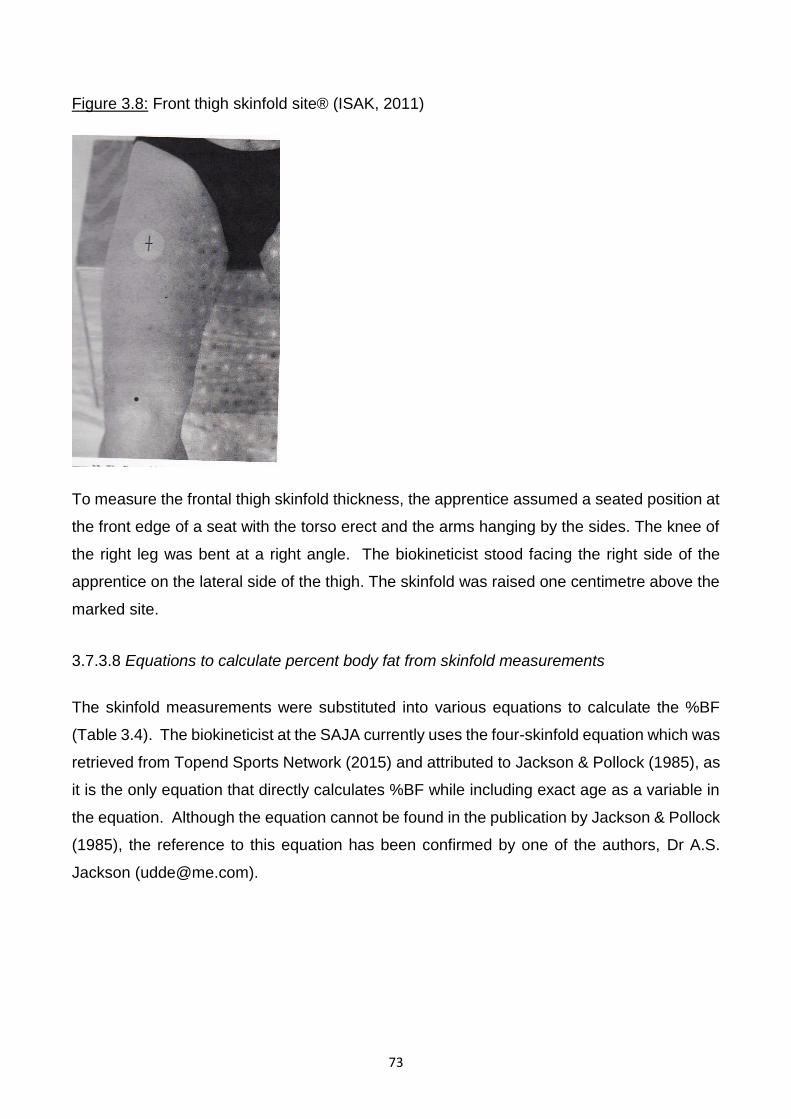
73
Figure 3.8: Front thigh skinfold site® (ISAK, 2011)
To measure the frontal thigh skinfold thickness, the apprentice assumed a seated position at
the front edge of a seat with the torso erect and the arms hanging by the sides. The knee of
the right leg was bent at a right angle. The biokineticist stood facing the right side of the
apprentice on the lateral side of the thigh. The skinfold was raised one centimetre above the
marked site.
3.7.3.8 Equations to calculate percent body fat from skinfold measurements
The skinfold measurements were substituted into various equations to calculate the %BF
(Table 3.4). The biokineticist at the SAJA currently uses the four-skinfold equation which was
retrieved from Topend Sports Network (2015) and attributed to Jackson & Pollock (1985), as
it is the only equation that directly calculates %BF while including exact age as a variable in
the equation. Although the equation cannot be found in the publication by Jackson & Pollock
(1985), the reference to this equation has been confirmed by one of the authors, Dr A.S.
Jackson ([email protected]).
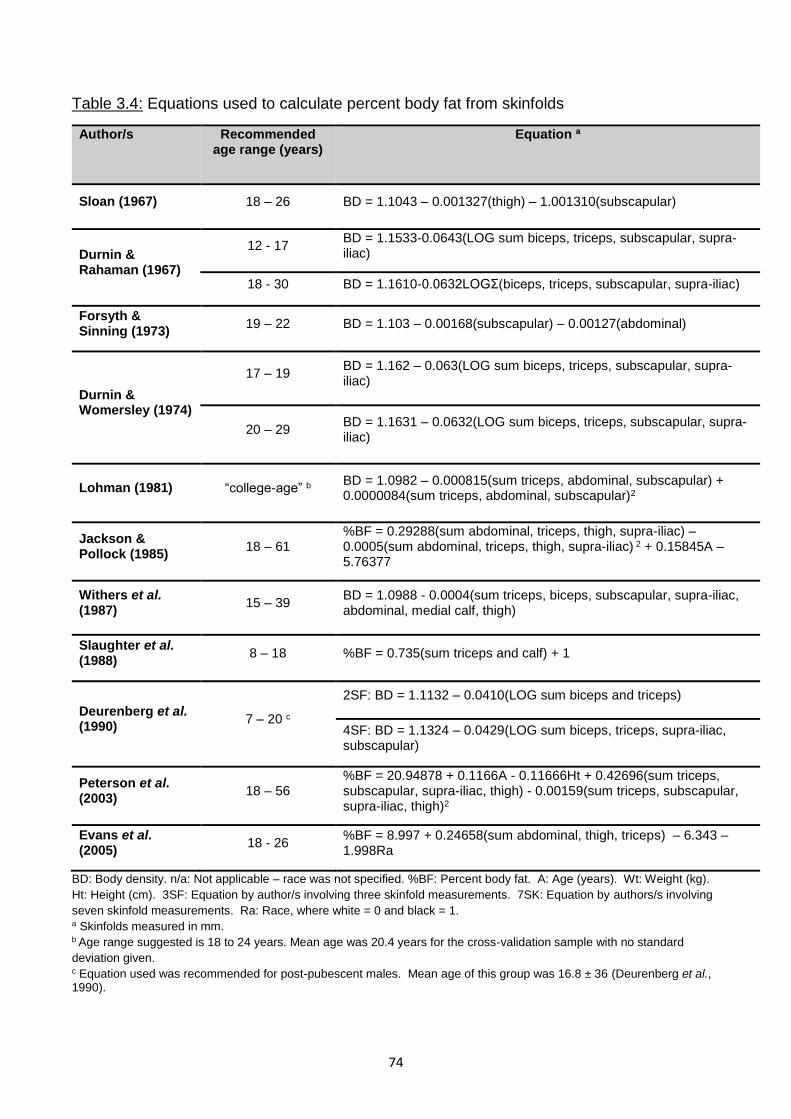
74
Table 3.4: Equations used to calculate percent body fat from skinfolds
Author/s Recommended age range (years)
Equation a
Sloan (1967) 18 – 26 BD = 1.1043 – 0.001327(thigh) – 1.001310(subscapular)
Durnin & Rahaman (1967)
12 - 17 BD = 1.1533-0.0643(LOG sum biceps, triceps, subscapular, supra-iliac)
18 - 30 BD = 1.1610-0.0632LOGƩ(biceps, triceps, subscapular, supra-iliac)
Forsyth & Sinning (1973)
19 – 22 BD = 1.103 – 0.00168(subscapular) – 0.00127(abdominal)
Durnin & Womersley (1974)
17 – 19 BD = 1.162 – 0.063(LOG sum biceps, triceps, subscapular, supra-iliac)
20 – 29 BD = 1.1631 – 0.0632(LOG sum biceps, triceps, subscapular, supra-iliac)
Lohman (1981) “college-age” b BD = 1.0982 – 0.000815(sum triceps, abdominal, subscapular) + 0.0000084(sum triceps, abdominal, subscapular)2
Jackson & Pollock (1985)
18 – 61 %BF = 0.29288(sum abdominal, triceps, thigh, supra-iliac) – 0.0005(sum abdominal, triceps, thigh, supra-iliac) 2 + 0.15845A – 5.76377
Withers et al. (1987)
15 – 39 BD = 1.0988 - 0.0004(sum triceps, biceps, subscapular, supra-iliac, abdominal, medial calf, thigh)
Slaughter et al. (1988)
8 – 18 %BF = 0.735(sum triceps and calf) + 1
Deurenberg et al. (1990)
7 – 20 c
2SF: BD = 1.1132 – 0.0410(LOG sum biceps and triceps)
4SF: BD = 1.1324 – 0.0429(LOG sum biceps, triceps, supra-iliac, subscapular)
Peterson et al. (2003)
18 – 56 %BF = 20.94878 + 0.1166A - 0.11666Ht + 0.42696(sum triceps, subscapular, supra-iliac, thigh) - 0.00159(sum triceps, subscapular, supra-iliac, thigh)2
Evans et al. (2005)
18 - 26 %BF = 8.997 + 0.24658(sum abdominal, thigh, triceps) – 6.343 – 1.998Ra
BD: Body density. n/a: Not applicable – race was not specified. %BF: Percent body fat. A: Age (years). Wt: Weight (kg).
Ht: Height (cm). 3SF: Equation by author/s involving three skinfold measurements. 7SK: Equation by authors/s involving
seven skinfold measurements. Ra: Race, where white = 0 and black = 1. a Skinfolds measured in mm. b Age range suggested is 18 to 24 years. Mean age was 20.4 years for the cross-validation sample with no standard
deviation given. c Equation used was recommended for post-pubescent males. Mean age of this group was 16.8 ± 36 (Deurenberg et al., 1990).
75
Slaughter et al. (1988) and Deurenberg et al. (1990) proposed different skinfold equations
according to maturation status using the classification described by Marshall & Tanner (1968)
which is based on the extent of hair covering the pubic region in six stages (p1 to p6).
Separate equations were proposed for pre-pubertal (p1 to p2), pubertal (p3 to p4), post-
pubertal (p5 to p6) and adult (p6 onwards) subjects (see table 2.4). In the study by Slaughter
et al. (1988), the mean age of the post-pubertal male subjects was 15.8 years and the mean
age of the adult male subjects was 23.1 years, which would be age groups relevant to the
jockey apprentices. Deurenberg et al. (1990) did not include subjects classified as adults
according to Marshall & Tanner (1968). The mean age of the post-pubertal males in this
study was 17.5 years and the maximum age was 20 years. For this reason, the equations
indicated for post-pubertal males were applied to the apprentices younger than 20 years as
maturation status was not measured. Slaughter et al. (1988) proposed equations for different
maturation stages between ages eight and 18 years, however, it was found that maturation
had no significant effect on %BF when the tricep and calf skinfolds were used instead of the
subscapular and calf. For this reason, the equation using the tricep and calf was used.
All equations were only applied to the apprentices that fell into the recommended age group
and compared to the mean value of the same group according to the reference method (DD).
The apprentices were divided into two age groups for the Durnin & Rahaman (1967) and
Durnin & Womersley (1974) equations and the equations were applied according to age
group.
The BD equations by Sloan (1967), Durnin & Rahaman (1967), Forsyth & Sinning (1973),
Durnin & Womersley (1974), Lohman (1981), Withers et al. (1987) and Deurenberg et al.
(1990) were translated into %BF using the BD equations by Siri (1961) and Brozek et al.
(1963), as follows:
Siri (1961): %BF = (4.95/BD − 4.50) × 100
Brozek et al. (1963): %BF = (4.57/BD − 4.142) × 100
3.7.4 Bioelectric impedance analysis
Bioelectric impedance analysis is another portable, quick and cost-effective method of
measuring %BF, yet it is less invasive than the skinfold method, requires less training, and is
not influenced by inter-observer variability (Ostojic, 2006). However, the accuracy of BIA for
76
measuring %BF is more susceptible to the impact of fluid and electrolyte changes (Saunders
et al., 1998), which is a concern in the jockey apprentice population.
Bioelectrical impedance analysis uses the impedance of a conductor (the human body),
which is the opposition to the flow of an alternating electric current comprising of both
resistance (R) and reactivity (Xc), at specific frequency/frequencies to calculate %BF from
body volume and length (Brodie et al., 1998). Single-frequency BIA (SF-BIA) is a common
method of BIA where the electrical current flows at a single frequency between electrodes to
measure FFM and total body water (TBW) (Kyle et al., 2004a). The BODYSTAT®1500
machine used in this study is an affordable SF-BIA device that uses a frequency of 50 kHz.
Ghosh et al. (1997) validated the BODYSTAT®1500 machine against DXA in a study
involving 160 participants, including healthy adults and adolescents as well as hospital
patients, and reported satisfactory limits of agreement. The BODYSTAT®1500 has
previously been used to measure the body composition of apprentices training at the SAJA
for research purposes (Krog, 2015) although it has not been validated in the jockey population
against a reference method.
The standard operating procedures (SOP) for the BODYSTAT®1500 were followed. The
BODYSTAT®1500 uses Lock-in Signal Conversion Technology, meaning it cannot be self-
calibrated. The calibrator supplied with the machine was used to independently verify that
the unit remained in calibration prior to each day of data collection.
The apprentice removed any socks or gloves that would cover the electrode placement sites
and any jewellery or metal accessories that could have interfered with the measurement.
They then lay down on a plinth table in the supine position with no parts of the body touching
one another. The skin on the back of the right hand and foot was cleaned with an alcohol
swab in order to remove excess oil and sweat which might have influenced the reading due
to reduced contact with the skin surface. BODYSTAT Ltd. electrodes were placed on the
right hand (one behind the knuckle of the middle finger and one on the wrist next to the ulna
head) and foot (one behind the second toe next to the big toe and one on the ankle at the
level of and between the medial and lateral malleoli), as seen in Figure 4.8.
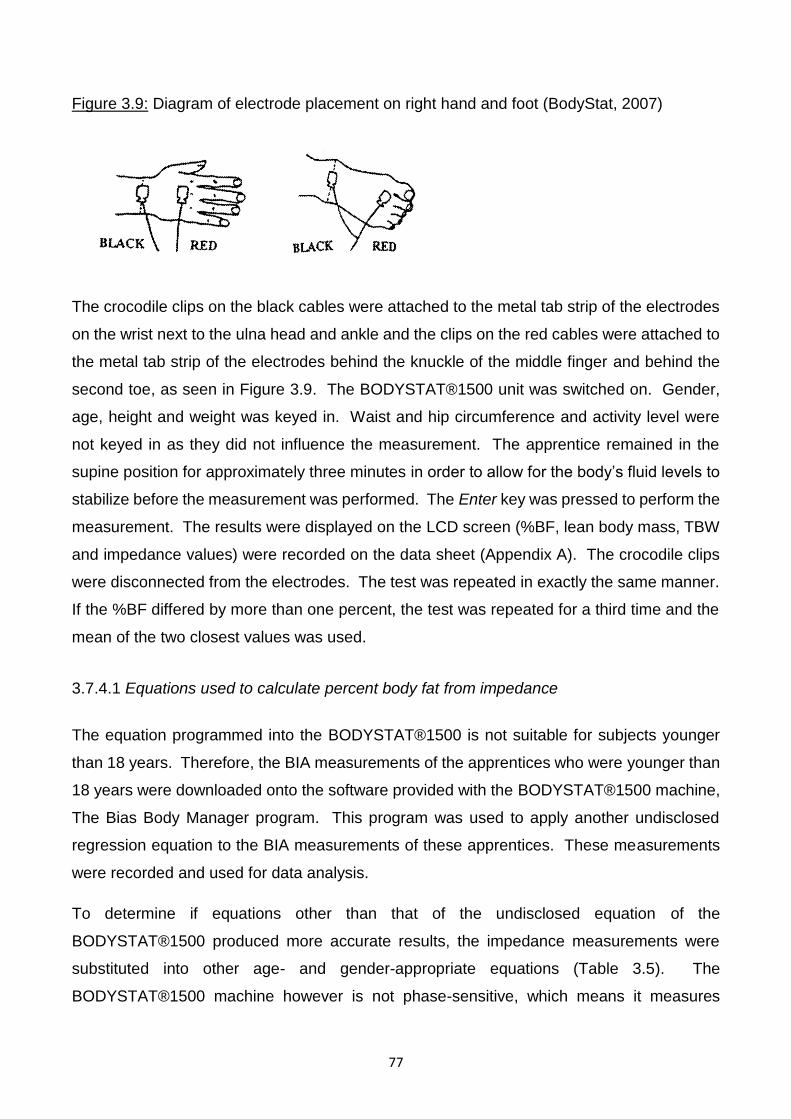
77
Figure 3.9: Diagram of electrode placement on right hand and foot (BodyStat, 2007)
The crocodile clips on the black cables were attached to the metal tab strip of the electrodes
on the wrist next to the ulna head and ankle and the clips on the red cables were attached to
the metal tab strip of the electrodes behind the knuckle of the middle finger and behind the
second toe, as seen in Figure 3.9. The BODYSTAT®1500 unit was switched on. Gender,
age, height and weight was keyed in. Waist and hip circumference and activity level were
not keyed in as they did not influence the measurement. The apprentice remained in the
supine position for approximately three minutes in order to allow for the body’s fluid levels to
stabilize before the measurement was performed. The Enter key was pressed to perform the
measurement. The results were displayed on the LCD screen (%BF, lean body mass, TBW
and impedance values) were recorded on the data sheet (Appendix A). The crocodile clips
were disconnected from the electrodes. The test was repeated in exactly the same manner.
If the %BF differed by more than one percent, the test was repeated for a third time and the
mean of the two closest values was used.
3.7.4.1 Equations used to calculate percent body fat from impedance
The equation programmed into the BODYSTAT®1500 is not suitable for subjects younger
than 18 years. Therefore, the BIA measurements of the apprentices who were younger than
18 years were downloaded onto the software provided with the BODYSTAT®1500 machine,
The Bias Body Manager program. This program was used to apply another undisclosed
regression equation to the BIA measurements of these apprentices. These measurements
were recorded and used for data analysis.
To determine if equations other than that of the undisclosed equation of the
BODYSTAT®1500 produced more accurate results, the impedance measurements were
substituted into other age- and gender-appropriate equations (Table 3.5). The
BODYSTAT®1500 machine however is not phase-sensitive, which means it measures
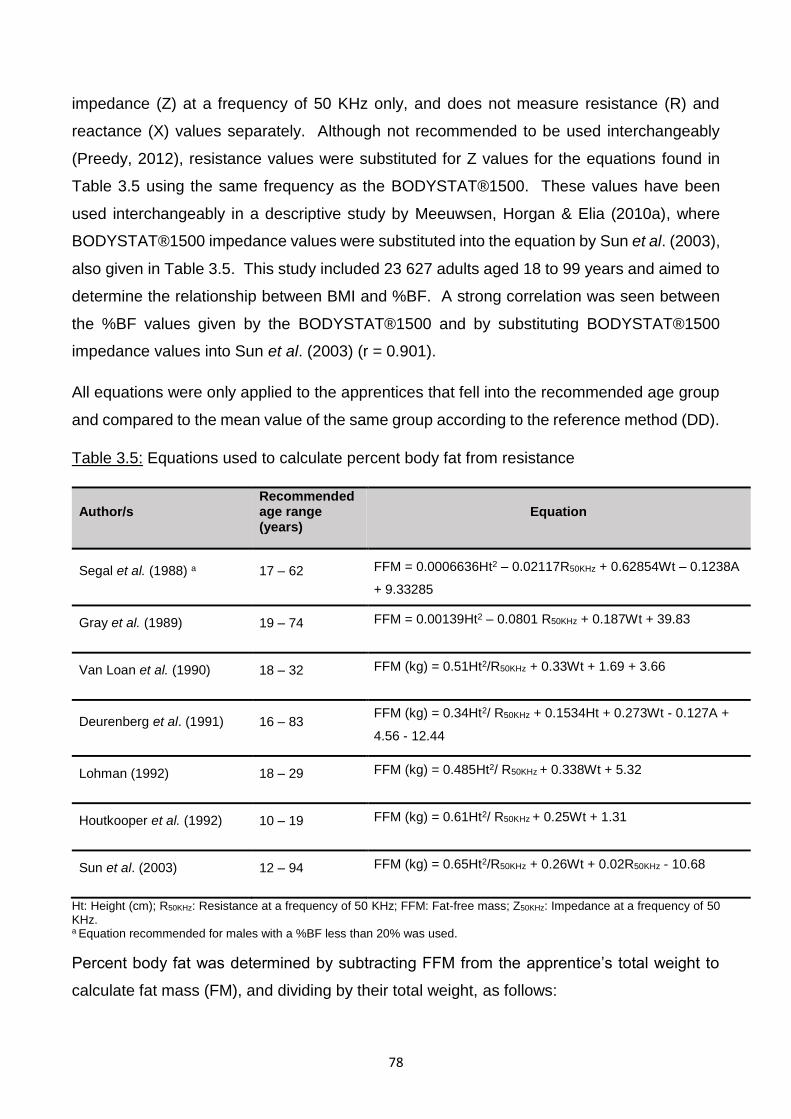
78
impedance (Z) at a frequency of 50 KHz only, and does not measure resistance (R) and
reactance (X) values separately. Although not recommended to be used interchangeably
(Preedy, 2012), resistance values were substituted for Z values for the equations found in
Table 3.5 using the same frequency as the BODYSTAT®1500. These values have been
used interchangeably in a descriptive study by Meeuwsen, Horgan & Elia (2010a), where
BODYSTAT®1500 impedance values were substituted into the equation by Sun et al. (2003),
also given in Table 3.5. This study included 23 627 adults aged 18 to 99 years and aimed to
determine the relationship between BMI and %BF. A strong correlation was seen between
the %BF values given by the BODYSTAT®1500 and by substituting BODYSTAT®1500
impedance values into Sun et al. (2003) (r = 0.901).
All equations were only applied to the apprentices that fell into the recommended age group
and compared to the mean value of the same group according to the reference method (DD).
Table 3.5: Equations used to calculate percent body fat from resistance
Author/s Recommended age range (years)
Equation
Segal et al. (1988) a 17 – 62 FFM = 0.0006636Ht2 – 0.02117R50KHz + 0.62854Wt – 0.1238A
+ 9.33285
Gray et al. (1989) 19 – 74 FFM = 0.00139Ht2 – 0.0801 R50KHz + 0.187Wt + 39.83
Van Loan et al. (1990) 18 – 32 FFM (kg) = 0.51Ht2/R50KHz + 0.33Wt + 1.69 + 3.66
Deurenberg et al. (1991) 16 – 83 FFM (kg) = 0.34Ht2/ R50KHz + 0.1534Ht + 0.273Wt - 0.127A +
4.56 - 12.44
Lohman (1992) 18 – 29 FFM (kg) = 0.485Ht2/ R50KHz + 0.338Wt + 5.32
Houtkooper et al. (1992) 10 – 19 FFM (kg) = 0.61Ht2/ R50KHz + 0.25Wt + 1.31
Sun et al. (2003) 12 – 94 FFM (kg) = 0.65Ht2/R50KHz + 0.26Wt + 0.02R50KHz - 10.68
Ht: Height (cm); R50KHz: Resistance at a frequency of 50 KHz; FFM: Fat-free mass; Z50KHz: Impedance at a frequency of 50 KHz. a Equation recommended for males with a %BF less than 20% was used.
Percent body fat was determined by subtracting FFM from the apprentice’s total weight to
calculate fat mass (FM), and dividing by their total weight, as follows:
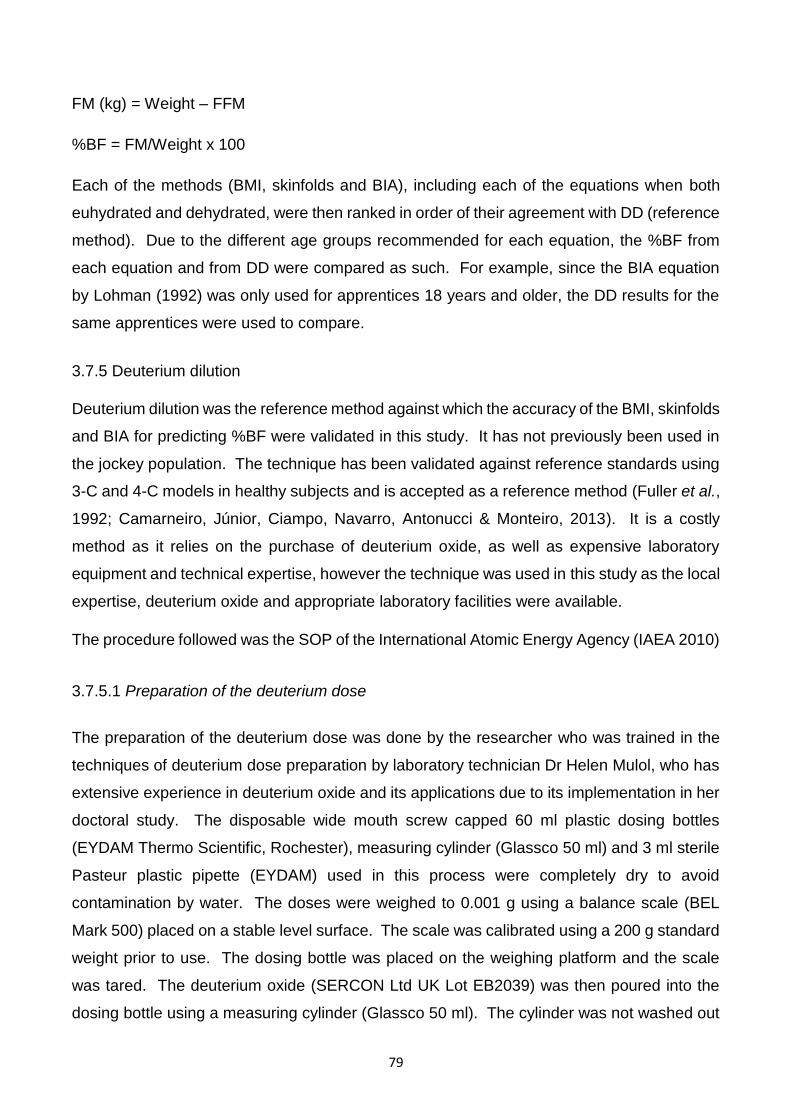
79
FM (kg) = Weight – FFM
%BF = FM/Weight x 100
Each of the methods (BMI, skinfolds and BIA), including each of the equations when both
euhydrated and dehydrated, were then ranked in order of their agreement with DD (reference
method). Due to the different age groups recommended for each equation, the %BF from
each equation and from DD were compared as such. For example, since the BIA equation
by Lohman (1992) was only used for apprentices 18 years and older, the DD results for the
same apprentices were used to compare.
3.7.5 Deuterium dilution
Deuterium dilution was the reference method against which the accuracy of the BMI, skinfolds
and BIA for predicting %BF were validated in this study. It has not previously been used in
the jockey population. The technique has been validated against reference standards using
3-C and 4-C models in healthy subjects and is accepted as a reference method (Fuller et al.,
1992; Camarneiro, Júnior, Ciampo, Navarro, Antonucci & Monteiro, 2013). It is a costly
method as it relies on the purchase of deuterium oxide, as well as expensive laboratory
equipment and technical expertise, however the technique was used in this study as the local
expertise, deuterium oxide and appropriate laboratory facilities were available.
The procedure followed was the SOP of the International Atomic Energy Agency (IAEA 2010)
3.7.5.1 Preparation of the deuterium dose
The preparation of the deuterium dose was done by the researcher who was trained in the
techniques of deuterium dose preparation by laboratory technician Dr Helen Mulol, who has
extensive experience in deuterium oxide and its applications due to its implementation in her
doctoral study. The disposable wide mouth screw capped 60 ml plastic dosing bottles
(EYDAM Thermo Scientific, Rochester), measuring cylinder (Glassco 50 ml) and 3 ml sterile
Pasteur plastic pipette (EYDAM) used in this process were completely dry to avoid
contamination by water. The doses were weighed to 0.001 g using a balance scale (BEL
Mark 500) placed on a stable level surface. The scale was calibrated using a 200 g standard
weight prior to use. The dosing bottle was placed on the weighing platform and the scale
was tared. The deuterium oxide (SERCON Ltd UK Lot EB2039) was then poured into the
dosing bottle using a measuring cylinder (Glassco 50 ml). The cylinder was not washed out
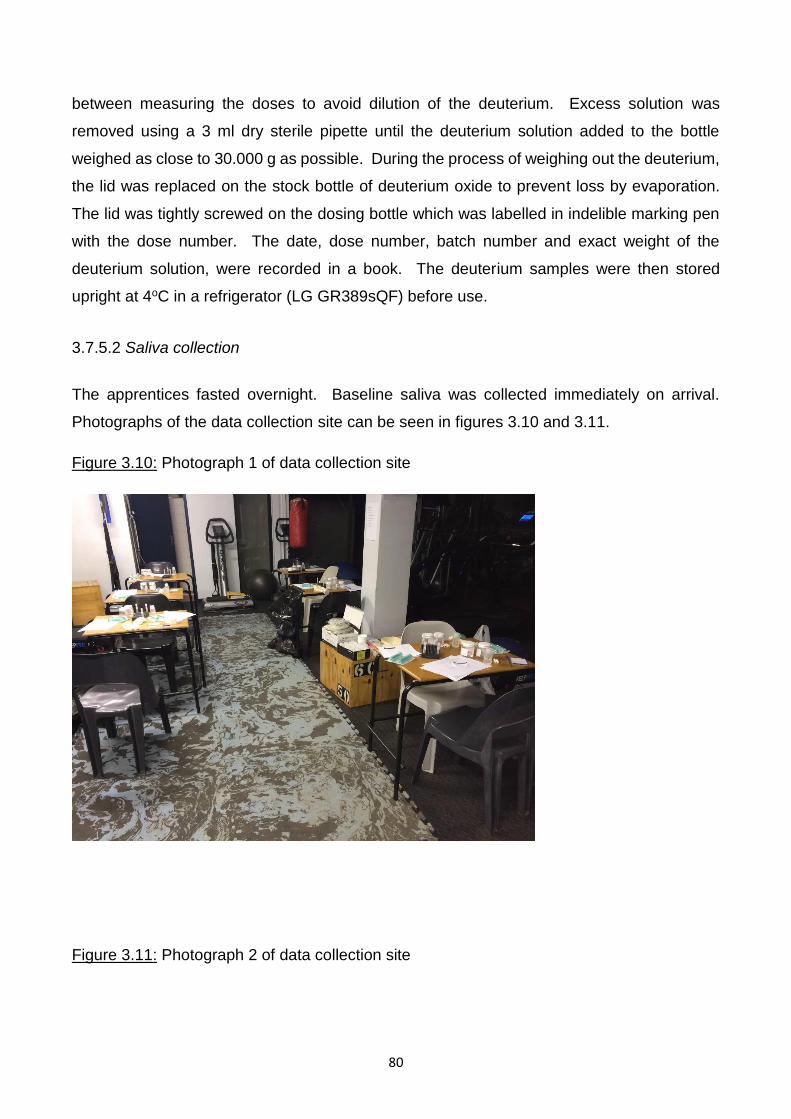
80
between measuring the doses to avoid dilution of the deuterium. Excess solution was
removed using a 3 ml dry sterile pipette until the deuterium solution added to the bottle
weighed as close to 30.000 g as possible. During the process of weighing out the deuterium,
the lid was replaced on the stock bottle of deuterium oxide to prevent loss by evaporation.
The lid was tightly screwed on the dosing bottle which was labelled in indelible marking pen
with the dose number. The date, dose number, batch number and exact weight of the
deuterium solution, were recorded in a book. The deuterium samples were then stored
upright at 4oC in a refrigerator (LG GR389sQF) before use.
3.7.5.2 Saliva collection
The apprentices fasted overnight. Baseline saliva was collected immediately on arrival.
Photographs of the data collection site can be seen in figures 3.10 and 3.11.
Figure 3.10: Photograph 1 of data collection site
Figure 3.11: Photograph 2 of data collection site
81
The apprentices placed two dental cotton wool swabs (Henry Schein Dental Cotton Rolls) in
their mouth which they sucked on until the swabs were wet with saliva. They were asked to
move the swabs around their mouth and to keep their mouth closed during the process. The
plunger was removed from a new 20 ml disposable syringe. The swabs were then transferred
directly from the apprentice’s mouth into a 20 ml syringe (Healthease Plus LUER SLIP). The
plunger was replaced and the saliva from the swabs was syringed into a completely dry 4.5
ml cryovial (NUNCTM CryoTubeTM Vials) labelled with the dose number of the deuterium that
the apprentice consumed and whether the saliva sample was pre- or post-dosage. The cap
was replaced on the cryovial and this process of collection was repeated until 4.5 ml of saliva
had been collected. The cap was firmly replaced on the cryovial and the cryovial was placed
in a separate zip lock bag. Each participant then drank the solution containing 30 g of
deuterium oxide (SERCON Ltd UK Lot EB2039) from the dosing bottle (EYDAM Thermo
Scientific, Rochester). Fifty ml of tap water was poured into the dosing bottle, the container
lid was replaced and the bottle was inverted and then thoroughly shaken to ensure that any
remaining deuterium was washed from the top and sides of the dosing bottle. The apprentice
then drank this to ensure that no deuterium was remaining in the dosing bottle. A further 50
ml of tap water was placed in the dosing bottle and the procedure repeated. The time the
deuterium dose was ingested was then noted in the apprentice’s data collection sheet
(Appendix A) and they were instructed not to eat or drink anything (including water and
chewing gum) for the next four hours. They were also asked not to exercise or walk to prevent
82
water from leaving the body via transdermal evaporation and rapid breathing as increased
insensible water losses would increase the concentration of deuterium in the body and result
in an overestimation of body fat. Most of the apprentices went back to sleep during this time.
After four hours, the saliva was resampled using the technique described previously and the
labelled post dose sample was placed together with the pre dose sample in one zip lock bag
and labelled with the apprentice’s dose number and the date. The saliva was kept at room
temperature (20 to 28οC) for a maximum of 6 hours before being frozen at –20οC until
analysis.
3.7.5.3 Preparation of the calibration standards
The calibration standard solution was prepared according to the IAEA SOP (International
Atomic Energy Agency, 2010) by laboratory technician Dr Helen Mulol. The solution was to
make a concentration of one gram of deuterium oxide per litre of water by weighing, as
precisely as possible, one gram of deuterium oxide and diluting it with one litre of standard
drinking water. A second litre of the standard drinking water was used as the zero standard.
These solutions were placed in borosilicate bottles with polytetrafluoroethylene (PTFE) lined
screw caps and kept in a cool, dark place separate from the deuterium oxide. To check the
accuracy of the Fourier Transform Infrared Spectroscopy (FTIR) (FTIR IRPrestige-21
SHIMADZU) over a range of concentrations of deuterium, 100 ml standards were prepared
according to the IAEA SOP. All standards were analysed in triplicate and a calibration curve
was constructed.
3.7.5.4 Measurement of the deuterium concentration in the saliva samples
The deuterium content of the pre and post dose samples was measured by the researcher
using the FTIR (FTIR IRPrestige-21 SHIMADZU) which was situated on a stable, level,
independent surface in a well-ventilated, air conditioned, temperature (21ºC) and humidity
controlled room at the Doris Duke Medical Research Institute (DDMRI). The machine was
not exposed to vibration from any nearby instruments such as a centrifuge.
The saliva samples were thawed at room temperature and then centrifuged for 10 minutes at
1000 g (ALC PK 121 R multispeed refrigerated centrifuge). This was to remove condensation
from the caps of the cryovials, to remove air bubbles and to ensure that any solid matter
83
(remains of food or cotton wool used for sampling) settled at the bottom of the cryovial,
leaving a clear liquid above which could be used for FTIR analysis.
The FTIR was prepared for measurement in accordance with the IAEA SOP. Before filling
the cell, lint free tissue was used to clean the window of the cell. At least two millilitres of
reference water was then syringed through the cell to remove all traces of the previous
sample. Folded absorbent paper was then firmly pressed over the exit port of the cell to
absorb excess sample and to prevent the entrance of air. The background standard (local
drinking water) was then drawn up into a two ml disposable syringe and the cell was filled by
attaching the syringe to the cell and firmly pressing the syringe plunger. Excess sample was
removed from the outside of the cell using absorbent paper. The cell was held up to the light
to check for air bubbles. More sample was syringed though the cell if there were air bubbles
until all the air bubbles had been excluded. The cell was then placed in the FTIR and the
absorbance measured at 2300-2900 cm-1. On completion, the cell was removed from the
FTIR and the syringe used for filling the cell was then used to remove the sample. This
procedure was then repeated with the calibration standard to obtain the spectrum which was
used to calibrate the software. The saliva samples were then analysed using the same
technique. A pre-dose (background) saliva sample was run and then the post dose sample
was analysed. The resulting FTIR spectrum was then compared to the calibration standard
using the Medical Research Council software. A new one millilitre syringe was used for each
sample to avoid cross contamination and the FTIR cell was flushed between samples to avoid
any memory effect. The background and calibration standards were reanalysed in the middle
and end of the batch to check the calibration of the FTIR. On completion of the batch of
samples, the cell was thoroughly rinsed with drinking quality water before storing. During the
entire process, care was taken to avoid evaporation by keeping the caps on the
cryovials/bottles at all times and only removing them to access the sample/standard.
3.7.5.5 Calculation of body composition
Deuterium is a stable (non-radioactive) isotope of hydrogen, with the symbol 2H. It is given
orally as deuterium oxide (D2O). VD is the volume of distribution.
The dilution space of 2H(VD) is 4.1% higher than total body water (TBW) due to the exchange
of hydrogen (H) with non-aqueous H in the body.
TBW (kg) = VD/1.041
84
Where VD (kg) = Dose D2O (mg)/enrichment 2H in saliva (mg/kg)
The hydration of FFM is assumed to be 73.2% in adults:
FFM (kg) = TBW (kg)/0.732
However, for males aged 15 to 16 years, the hydration of FFM is assumed to be 74.2%, and
for males aged 17 to 20 years, 73.8% (Lohman, 1992).
Fat mass is calculated by the difference between body mass and fat-free mass:
FM (kg) = body mass (kg) – FFM (kg)
Results are often expressed as percent body weight.
%BF = FM (kg)/body mass (kg) x 100
The calculations were done by the researcher.
3.7.5.6 Classification of percent body fat
The lower limit of body fat (essential fat) for healthy active men of four to six percent was
used to identify apprentices in the “essential” category (Friedl et al., 1994).
The %BF-for-age percentiles established by Borrud et al. (2011) were used to classify the
apprentices younger than 20 years, as indicated in table 3.6. For those aged 20 years and
older, the healthy range of eight to 20 percent set out by Gallagher et al. (2000) was used to
classify %BF, as indicated in table 3.7. There is no established minimum %BF for jockeys or
apprentices.
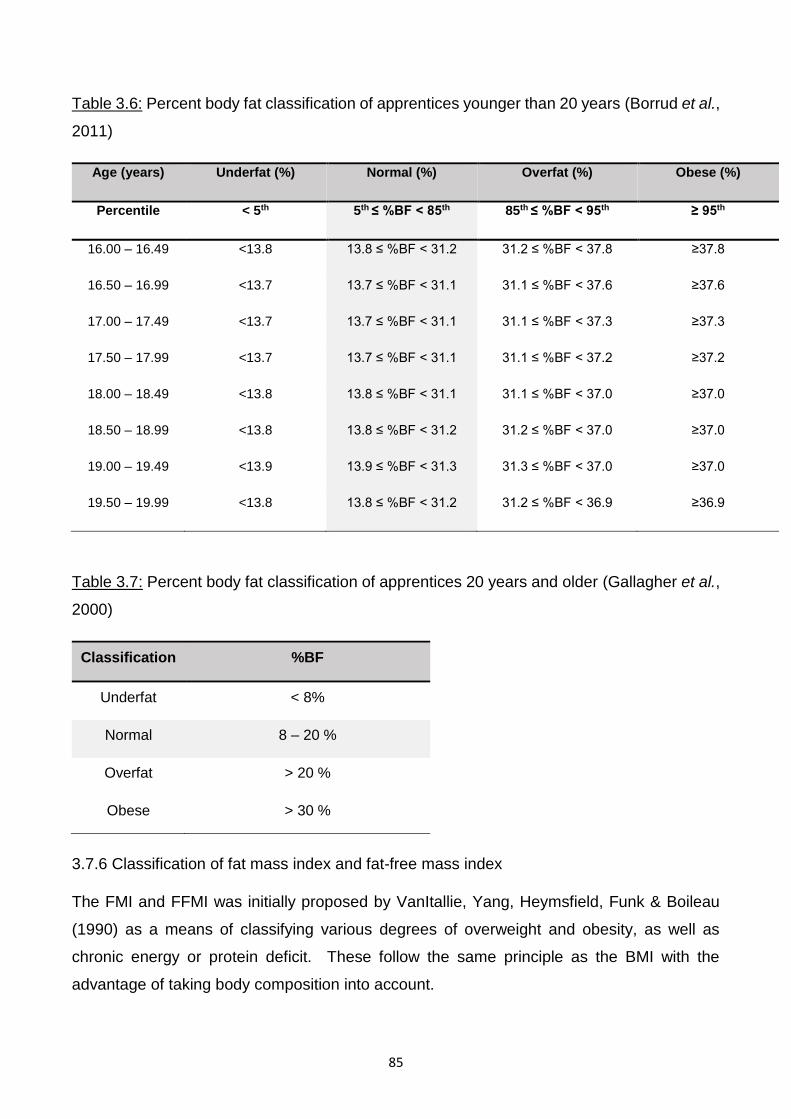
85
Table 3.6: Percent body fat classification of apprentices younger than 20 years (Borrud et al.,
2011)
Age (years) Underfat (%) Normal (%) Overfat (%) Obese (%)
Percentile < 5th 5th ≤ %BF < 85th 85th ≤ %BF < 95th ≥ 95th
16.00 – 16.49 <13.8 13.8 ≤ %BF < 31.2 31.2 ≤ %BF < 37.8 ≥37.8
16.50 – 16.99 <13.7 13.7 ≤ %BF < 31.1 31.1 ≤ %BF < 37.6 ≥37.6
17.00 – 17.49 <13.7 13.7 ≤ %BF < 31.1 31.1 ≤ %BF < 37.3 ≥37.3
17.50 – 17.99 <13.7 13.7 ≤ %BF < 31.1 31.1 ≤ %BF < 37.2 ≥37.2
18.00 – 18.49 <13.8 13.8 ≤ %BF < 31.1 31.1 ≤ %BF < 37.0 ≥37.0
18.50 – 18.99 <13.8 13.8 ≤ %BF < 31.2 31.2 ≤ %BF < 37.0 ≥37.0
19.00 – 19.49 <13.9 13.9 ≤ %BF < 31.3 31.3 ≤ %BF < 37.0 ≥37.0
19.50 – 19.99 <13.8 13.8 ≤ %BF < 31.2 31.2 ≤ %BF < 36.9 ≥36.9
Table 3.7: Percent body fat classification of apprentices 20 years and older (Gallagher et al.,
2000)
Classification %BF
Underfat < 8%
Normal 8 – 20 %
Overfat > 20 %
Obese > 30 %
3.7.6 Classification of fat mass index and fat-free mass index
The FMI and FFMI was initially proposed by VanItallie, Yang, Heymsfield, Funk & Boileau
(1990) as a means of classifying various degrees of overweight and obesity, as well as
chronic energy or protein deficit. These follow the same principle as the BMI with the
advantage of taking body composition into account.
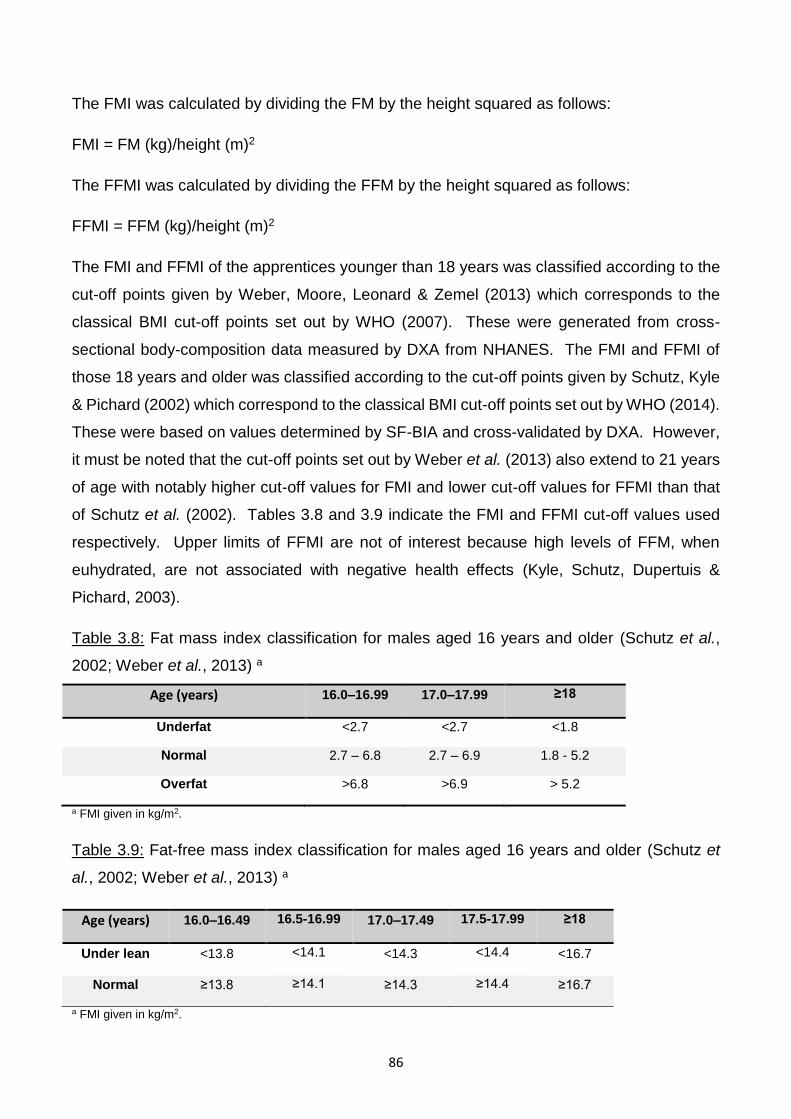
86
The FMI was calculated by dividing the FM by the height squared as follows:
FMI = FM (kg)/height (m)2
The FFMI was calculated by dividing the FFM by the height squared as follows:
FFMI = FFM (kg)/height (m)2
The FMI and FFMI of the apprentices younger than 18 years was classified according to the
cut-off points given by Weber, Moore, Leonard & Zemel (2013) which corresponds to the
classical BMI cut-off points set out by WHO (2007). These were generated from cross-
sectional body-composition data measured by DXA from NHANES. The FMI and FFMI of
those 18 years and older was classified according to the cut-off points given by Schutz, Kyle
& Pichard (2002) which correspond to the classical BMI cut-off points set out by WHO (2014).
These were based on values determined by SF-BIA and cross-validated by DXA. However,
it must be noted that the cut-off points set out by Weber et al. (2013) also extend to 21 years
of age with notably higher cut-off values for FMI and lower cut-off values for FFMI than that
of Schutz et al. (2002). Tables 3.8 and 3.9 indicate the FMI and FFMI cut-off values used
respectively. Upper limits of FFMI are not of interest because high levels of FFM, when
euhydrated, are not associated with negative health effects (Kyle, Schutz, Dupertuis &
Pichard, 2003).
Table 3.8: Fat mass index classification for males aged 16 years and older (Schutz et al.,
2002; Weber et al., 2013) a
Age (years) 16.0–16.99 17.0–17.99 ≥18
Underfat <2.7 <2.7 <1.8
Normal 2.7 – 6.8 2.7 – 6.9 1.8 - 5.2
Overfat >6.8 >6.9 > 5.2
a FMI given in kg/m2.
Table 3.9: Fat-free mass index classification for males aged 16 years and older (Schutz et
al., 2002; Weber et al., 2013) a
Age (years) 16.0–16.49 16.5-16.99 17.0–17.49 17.5-17.99 ≥18
Under lean <13.8 <14.1 <14.3 <14.4 <16.7
Normal ≥13.8 ≥14.1 ≥14.3 ≥14.4 ≥16.7
a FMI given in kg/m2.
87
3.7.7 Lifestyle questionnaire
The advantages of using questionnaires are that they are relatively inexpensive and are quick
to administer. They are also usually relatively simple to analyse if well-constructed. The
disadvantages are that it is assumed that both the respondents and the researcher are able
to interpret wording in a similar manner and share the same underlying assumptions about
language (Bowling, 2014). Establishing trust between the respondent and the researcher
administering the questionnaire may also present a challenge which could result in false
reporting if this trust is not sufficiently established.
A number of studies have used lifestyle questionnaires to evaluate the weight-making
techniques used by the jockeys (Cotugna et al., 2011; Cullen, 2014; Dolan et al., 2011; King
& Mezey, 1987; Krog, 2015; Labadarios et al., 1993; Leydon & Wall, 2002; Moore et al.,
2002b; O’Reilly et al., 2017; Wilson et al., 2014). The questionnaire (Appendix B) used in
this study was adapted from the questionnaire used in a study involving the SAJA apprentices
(Krog, 2015). It is a modified version of a lifestyle questionnaire which was previously
designed and tested on professional jockeys (Dolan et al., 2011). The questionnaire was
validated for content validity by a qualified statistician (Dr Gill Hendry,
[email protected]). Content validity refers to the extent to which the questionnaire’s
scale items are relevant to measuring what the questionnaire intended to measure.
The questionnaire contained of 50 open- and closed-ended (Likert scale) questions. Closed-
ended questions were selected due to the small amount of time required to administer and
the ease of coding and analysis. However, this possibly limited the depth and spontaneity of
the answers and may have introduced bias by forcing the apprentices to choose pre-
established responses (Meadows, 2003). To limit this, open-ended questions were also
used. The questionnaire was interviewer-administered by Mrs Sarah Olds
([email protected]), a registered social worker in private practise, who had previously
administered the adapted questionnaire to the SAJA apprentices in the study by Krog (2015).
Following the pilot study however, the questionnaire was further adapted by the researcher
as certain questions proved to be irrelevant and difficult to understand. Certain words such
as “hypnosis” and “fasting” had to be explained and/or translated into simpler terms.
Additionally, the questionnaire asked whether the apprentices avoided eating meals with the
family, which was an irrelevant question as the apprentices ate at the academy and not at
home.
88
It was administered to each apprentice individually to ensure confidentiality and to encourage
honest responses. Providing surety of confidentiality as much as possible was crucial, which
is why a qualified social worker who had administered a similar questionnaire to the
apprentices was used. The advantages of interviewer-administration as opposed to self-
administration by the apprentices, were that it allowed for the interviewer to clarify
misunderstandings and probe for additional information, and the recording of information was
not dependent on the respondent’s level of literacy. However, this was a more time-
consuming process and could have also caused the apprentices to be more reluctant to
answer truthfully due to reduced anonymity (Meadows, 2003). Where applicable, participants
were instructed to select as many options as deemed personally relevant.
The questions surrounding diet, health and lifestyle issues collected information regarding
the physical activities the apprentices were involved in and for what purpose, the specific
chronic weight-making techniques used such as avoiding foods with a high carbohydrate
content, specific acute weight-making techniques such as using the sauna, as well as feelings
of hunger and thirst.
3.7.8 Eating Attitudes Test questionnaire
The Eating Attitudes Test 26 (EAT-26) questionnaire was used to assess the risk of abnormal
eating behaviours as it has been utilised in several studies to assess the risk of jockeys
developing eating disorders (Garner & Garfinkel, 1979; King & Mezey, 1987; Leydon & Wall,
2002; Caulfield & Karageorghis, 2008; Wilson et al., 2015).
The EAT-26 questionnaire is a well-validated and frequently used tool in the general female
and non-athletic population. It was initially validated in a descriptive study involving a sample
of 160 female subjects with diagnosed AN and 140 female comparison subjects with a mean
age of 21.5 years (Garner, Olmsted, Bohr & Garfinkel, 1982). It was again validated in a
descriptive study involving a sample of 207 female college athletes (Doninger, Enders &
Burnett, 2005). Pope, Gao, Bolter & Pritchard (2015) reviewed 50 studies which investigated
eating disorders in athletic populations, aged 18 to 26 years, and assessed the validity and
reliability of several commonly used psychometric measures including the EAT-26, Eating
Disorder Inventory (EDI), Bulimia Test-Revised (BULIT-R), Questionnaire for Eating Disorder
Diagnosis (QEDD) and the Eating Disorder Examination Questionnaire (EDE-Q). The review
concluded that all measures have largely been validated in non-athletic female populations
but scarcely validated in athletic populations. The Eat-26 questionnaire was however the
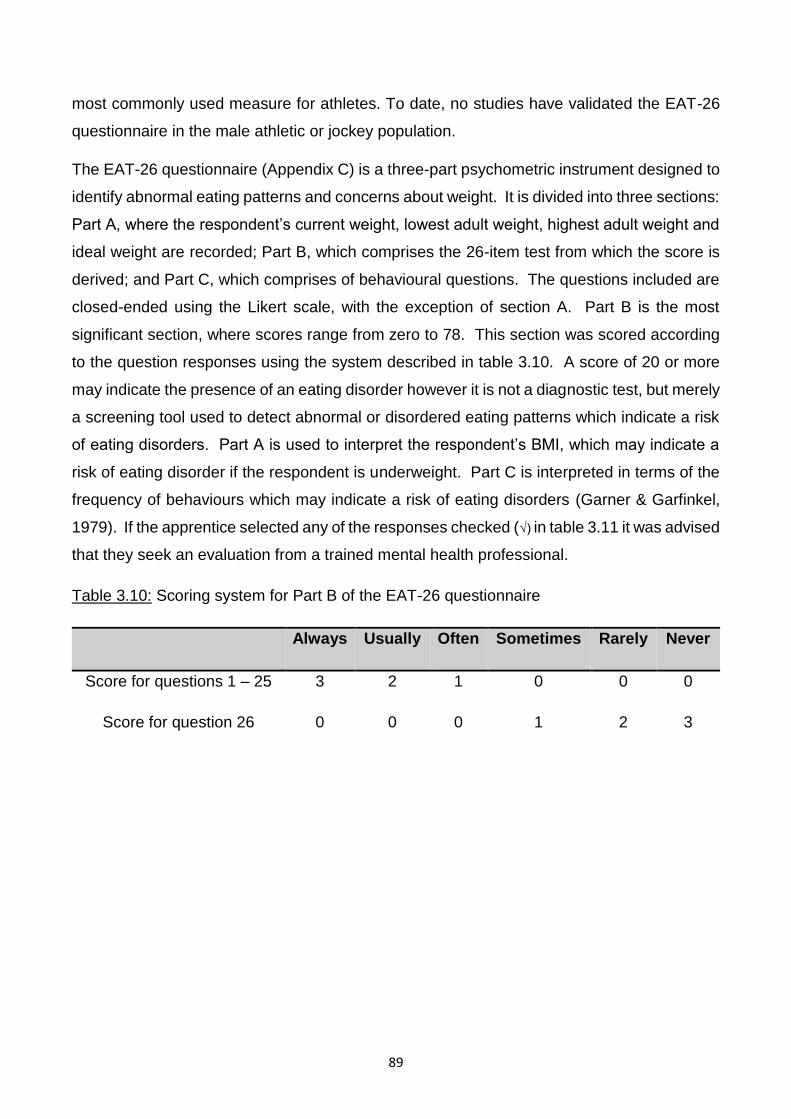
89
most commonly used measure for athletes. To date, no studies have validated the EAT-26
questionnaire in the male athletic or jockey population.
The EAT-26 questionnaire (Appendix C) is a three-part psychometric instrument designed to
identify abnormal eating patterns and concerns about weight. It is divided into three sections:
Part A, where the respondent’s current weight, lowest adult weight, highest adult weight and
ideal weight are recorded; Part B, which comprises the 26-item test from which the score is
derived; and Part C, which comprises of behavioural questions. The questions included are
closed-ended using the Likert scale, with the exception of section A. Part B is the most
significant section, where scores range from zero to 78. This section was scored according
to the question responses using the system described in table 3.10. A score of 20 or more
may indicate the presence of an eating disorder however it is not a diagnostic test, but merely
a screening tool used to detect abnormal or disordered eating patterns which indicate a risk
of eating disorders. Part A is used to interpret the respondent’s BMI, which may indicate a
risk of eating disorder if the respondent is underweight. Part C is interpreted in terms of the
frequency of behaviours which may indicate a risk of eating disorders (Garner & Garfinkel,
1979). If the apprentice selected any of the responses checked (√) in table 3.11 it was advised
that they seek an evaluation from a trained mental health professional.
Table 3.10: Scoring system for Part B of the EAT-26 questionnaire
Always Usually Often Sometimes Rarely Never
Score for questions 1 – 25 3 2 1 0 0 0
Score for question 26 0 0 0 1 2 3
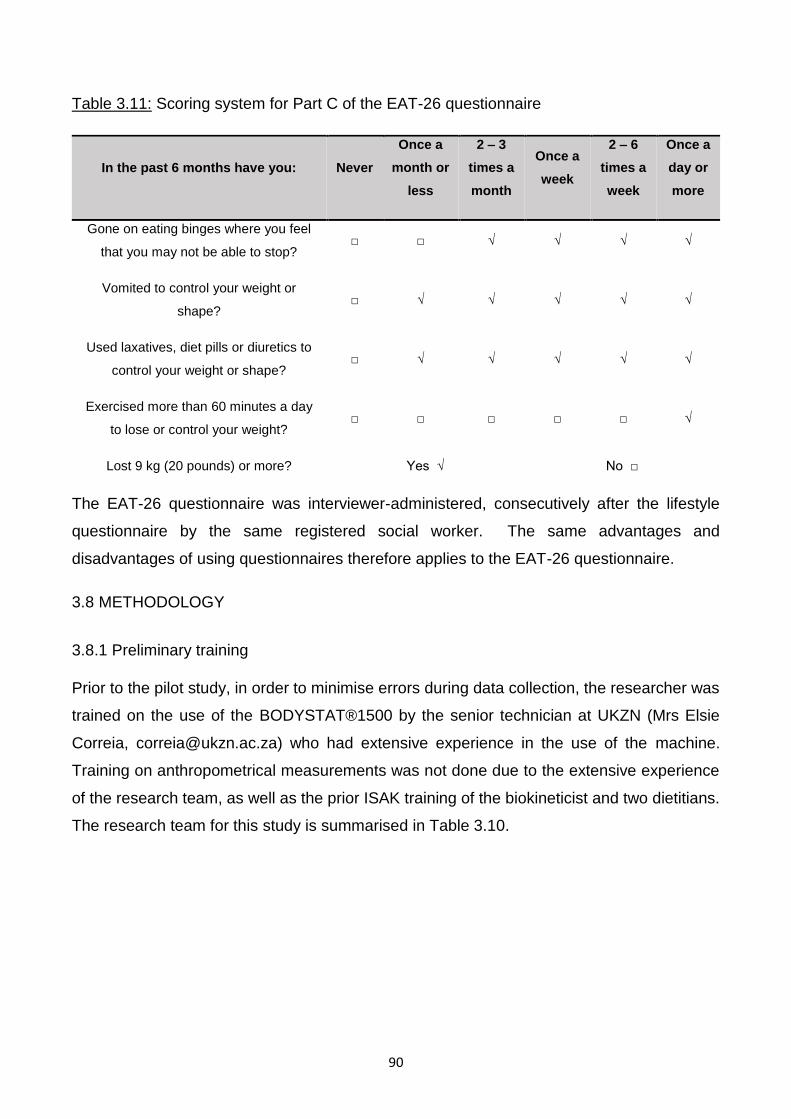
90
Table 3.11: Scoring system for Part C of the EAT-26 questionnaire
In the past 6 months have you: Never
Once a
month or
less
2 – 3
times a
month
Once a
week
2 – 6
times a
week
Once a
day or
more
Gone on eating binges where you feel
that you may not be able to stop? □ □ √ √ √ √
Vomited to control your weight or
shape? □ √ √ √ √ √
Used laxatives, diet pills or diuretics to
control your weight or shape? □ √ √ √ √ √
Exercised more than 60 minutes a day
to lose or control your weight? □ □ □ □ □ √
Lost 9 kg (20 pounds) or more? Yes √ No □
The EAT-26 questionnaire was interviewer-administered, consecutively after the lifestyle
questionnaire by the same registered social worker. The same advantages and
disadvantages of using questionnaires therefore applies to the EAT-26 questionnaire.
3.8 METHODOLOGY
3.8.1 Preliminary training
Prior to the pilot study, in order to minimise errors during data collection, the researcher was
trained on the use of the BODYSTAT®1500 by the senior technician at UKZN (Mrs Elsie
Correia, [email protected]) who had extensive experience in the use of the machine.
Training on anthropometrical measurements was not done due to the extensive experience
of the research team, as well as the prior ISAK training of the biokineticist and two dietitians.
The research team for this study is summarised in Table 3.10.
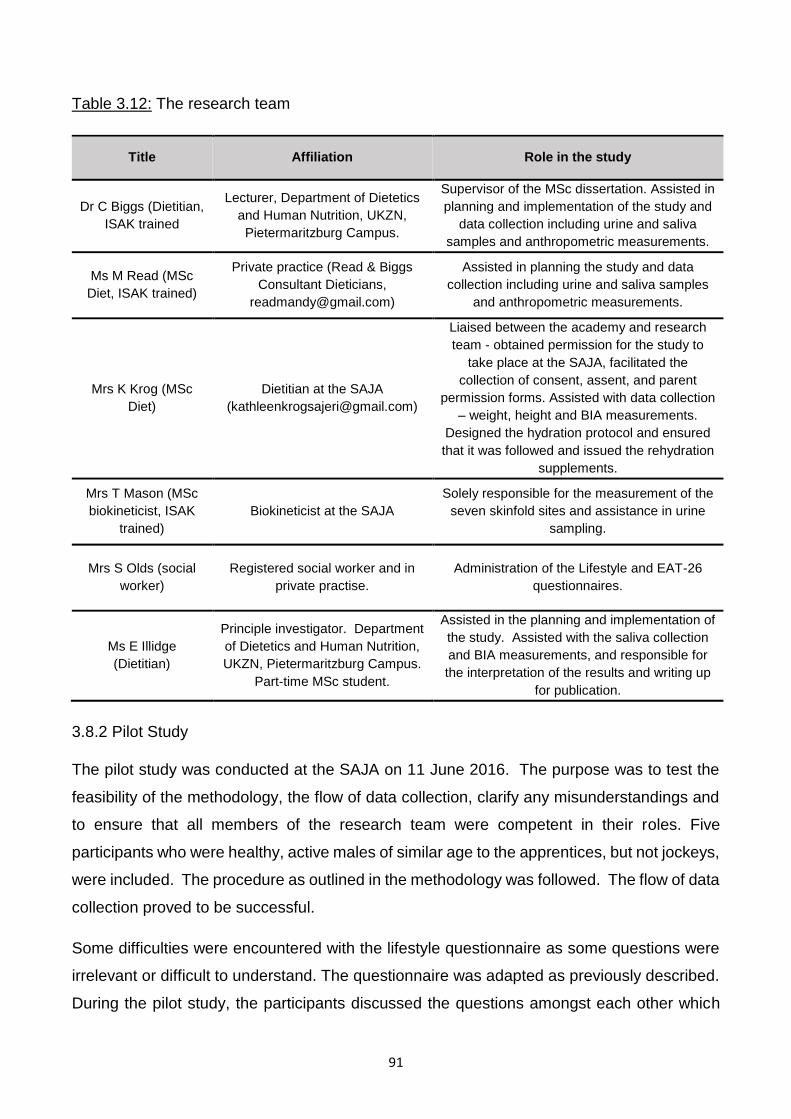
91
Table 3.12: The research team
Title Affiliation Role in the study
Dr C Biggs (Dietitian,
ISAK trained
Lecturer, Department of Dietetics
and Human Nutrition, UKZN,
Pietermaritzburg Campus.
Supervisor of the MSc dissertation. Assisted in
planning and implementation of the study and
data collection including urine and saliva
samples and anthropometric measurements.
Ms M Read (MSc
Diet, ISAK trained)
Private practice (Read & Biggs
Consultant Dieticians,
Assisted in planning the study and data
collection including urine and saliva samples
and anthropometric measurements.
Mrs K Krog (MSc
Diet)
Dietitian at the SAJA
Liaised between the academy and research
team - obtained permission for the study to
take place at the SAJA, facilitated the
collection of consent, assent, and parent
permission forms. Assisted with data collection
– weight, height and BIA measurements.
Designed the hydration protocol and ensured
that it was followed and issued the rehydration
supplements.
Mrs T Mason (MSc
biokineticist, ISAK
trained)
Biokineticist at the SAJA
Solely responsible for the measurement of the
seven skinfold sites and assistance in urine
sampling.
Mrs S Olds (social
worker)
Registered social worker and in
private practise.
Administration of the Lifestyle and EAT-26
questionnaires.
Ms E Illidge
(Dietitian)
Principle investigator. Department
of Dietetics and Human Nutrition,
UKZN, Pietermaritzburg Campus.
Part-time MSc student.
Assisted in the planning and implementation of
the study. Assisted with the saliva collection
and BIA measurements, and responsible for
the interpretation of the results and writing up
for publication.
3.8.2 Pilot Study
The pilot study was conducted at the SAJA on 11 June 2016. The purpose was to test the
feasibility of the methodology, the flow of data collection, clarify any misunderstandings and
to ensure that all members of the research team were competent in their roles. Five
participants who were healthy, active males of similar age to the apprentices, but not jockeys,
were included. The procedure as outlined in the methodology was followed. The flow of data
collection proved to be successful.
Some difficulties were encountered with the lifestyle questionnaire as some questions were
irrelevant or difficult to understand. The questionnaire was adapted as previously described.
During the pilot study, the participants discussed the questions amongst each other which
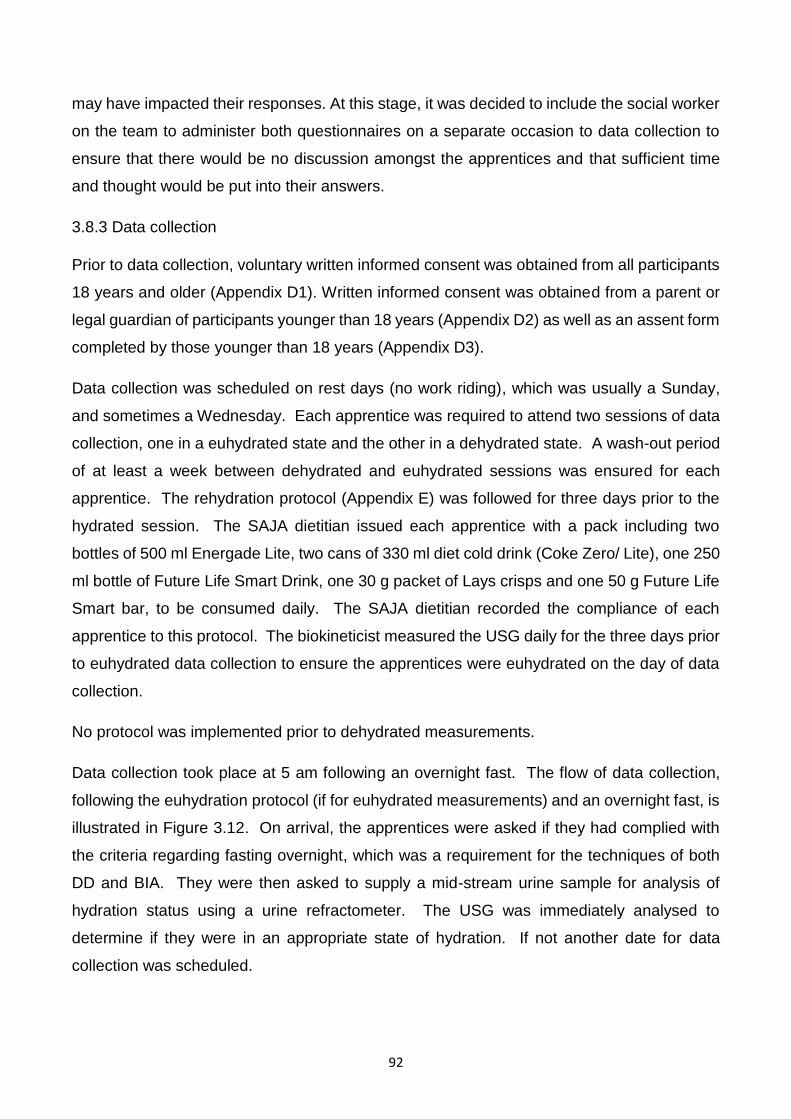
92
may have impacted their responses. At this stage, it was decided to include the social worker
on the team to administer both questionnaires on a separate occasion to data collection to
ensure that there would be no discussion amongst the apprentices and that sufficient time
and thought would be put into their answers.
3.8.3 Data collection
Prior to data collection, voluntary written informed consent was obtained from all participants
18 years and older (Appendix D1). Written informed consent was obtained from a parent or
legal guardian of participants younger than 18 years (Appendix D2) as well as an assent form
completed by those younger than 18 years (Appendix D3).
Data collection was scheduled on rest days (no work riding), which was usually a Sunday,
and sometimes a Wednesday. Each apprentice was required to attend two sessions of data
collection, one in a euhydrated state and the other in a dehydrated state. A wash-out period
of at least a week between dehydrated and euhydrated sessions was ensured for each
apprentice. The rehydration protocol (Appendix E) was followed for three days prior to the
hydrated session. The SAJA dietitian issued each apprentice with a pack including two
bottles of 500 ml Energade Lite, two cans of 330 ml diet cold drink (Coke Zero/ Lite), one 250
ml bottle of Future Life Smart Drink, one 30 g packet of Lays crisps and one 50 g Future Life
Smart bar, to be consumed daily. The SAJA dietitian recorded the compliance of each
apprentice to this protocol. The biokineticist measured the USG daily for the three days prior
to euhydrated data collection to ensure the apprentices were euhydrated on the day of data
collection.
No protocol was implemented prior to dehydrated measurements.
Data collection took place at 5 am following an overnight fast. The flow of data collection,
following the euhydration protocol (if for euhydrated measurements) and an overnight fast, is
illustrated in Figure 3.12. On arrival, the apprentices were asked if they had complied with
the criteria regarding fasting overnight, which was a requirement for the techniques of both
DD and BIA. They were then asked to supply a mid-stream urine sample for analysis of
hydration status using a urine refractometer. The USG was immediately analysed to
determine if they were in an appropriate state of hydration. If not another date for data
collection was scheduled.
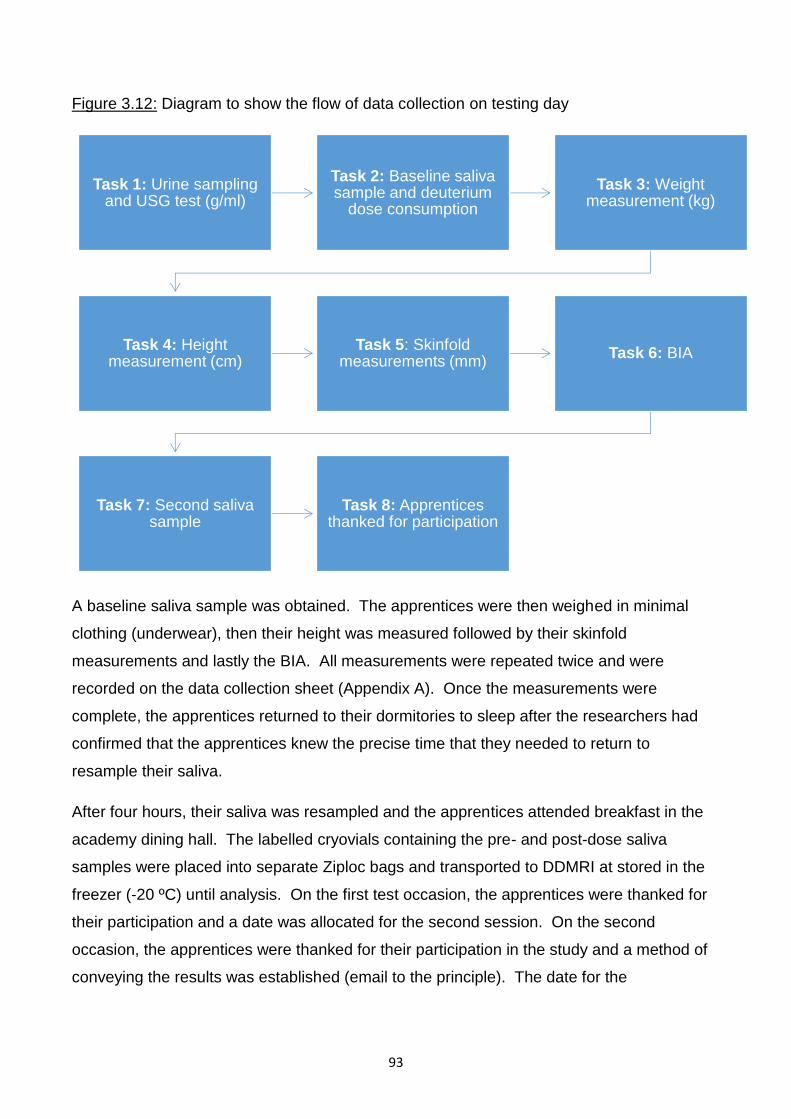
93
Figure 3.12: Diagram to show the flow of data collection on testing day
A baseline saliva sample was obtained. The apprentices were then weighed in minimal
clothing (underwear), then their height was measured followed by their skinfold
measurements and lastly the BIA. All measurements were repeated twice and were
recorded on the data collection sheet (Appendix A). Once the measurements were
complete, the apprentices returned to their dormitories to sleep after the researchers had
confirmed that the apprentices knew the precise time that they needed to return to
resample their saliva.
After four hours, their saliva was resampled and the apprentices attended breakfast in the
academy dining hall. The labelled cryovials containing the pre- and post-dose saliva
samples were placed into separate Ziploc bags and transported to DDMRI at stored in the
freezer (-20 ºC) until analysis. On the first test occasion, the apprentices were thanked for
their participation and a date was allocated for the second session. On the second
occasion, the apprentices were thanked for their participation in the study and a method of
conveying the results was established (email to the principle). The date for the
Task 1: Urine sampling and USG test (g/ml)
Task 2: Baseline saliva sample and deuterium
dose consumption
Task 3: Weight measurement (kg)
Task 4: Height measurement (cm)
Task 5: Skinfold measurements (mm)
Task 6: BIA
Task 7: Second saliva sample
Task 8: Apprentices thanked for participation
94
questionnaires to be administered by the social worker was established and the apprentices
were notified by the SAJA dietitian.
Both the lifestyle and EAT-26 questionnaires were administered consecutively and
individually in an office at the SAJA by the social worker.
Once collection of saliva samples was complete, the samples were batch analysed using
the FTIR. The FTIR results were recorded and double entered into the computer program
Miscrosoft Office Excel 2013, along with the rest of the data for analysis.
3.8.4 Statistical analysis
The data was double entered by the researcher into the computer program Miscrosoft
Office Excel 2013. The two data bases were compared to ensure that there were no input
errors. The researcher checked the data for outliers and discrepancies. The cleaned
database was then exported into Statistical Package for the Social Sciences (SPSS)
version 24.0 and analysed by the statistician.
The statistical tests applied to each category of data are described in Table 3.11. Descriptive
statistics, including means, standard deviations, range, frequencies and percentages
(proportions) were used where data was normally distributed. Frequencies were represented
in tables or graphs. All variables were tested for normality using the Shapiro-Wilk test
(Shapiro & Wilk, 1965). Combined with the fact that some of the variables were shown to be
non-normal and the sample size of 17 is considered small, it was decided to use the Wilcoxon
signed ranks test (Wilcoxon, 1945), an equivalent non-parametric test for paired samples t-
test, to compare two variables for a single group, being the %BF results of the field methods
and DD. The Wilcoxon signed rank test reflects agreement, on average, between two
measures at group level (Lombard, Steyn, Charlton & Senekal, 2015). A p <0.05 indicated a
significant difference. Correlations, such as Pearson or product-moment correlation, were
not included as correlation studies the relationship between one variable and another, not the
differences, and it is not recommended as a method for assessing the comparability between
methods (Giavarina, 2015). Equations that showed no statistically significant difference from
DD according to the Wilcoxon signed ranks test were further analysed using Bland-Altman
plots to evaluate bias within the mean differences (Giavarina, 2015). The Binomial test was
used to test whether a significant proportion of respondents selected one of a possible two
responses. This was extended when data with more than two response options was split into
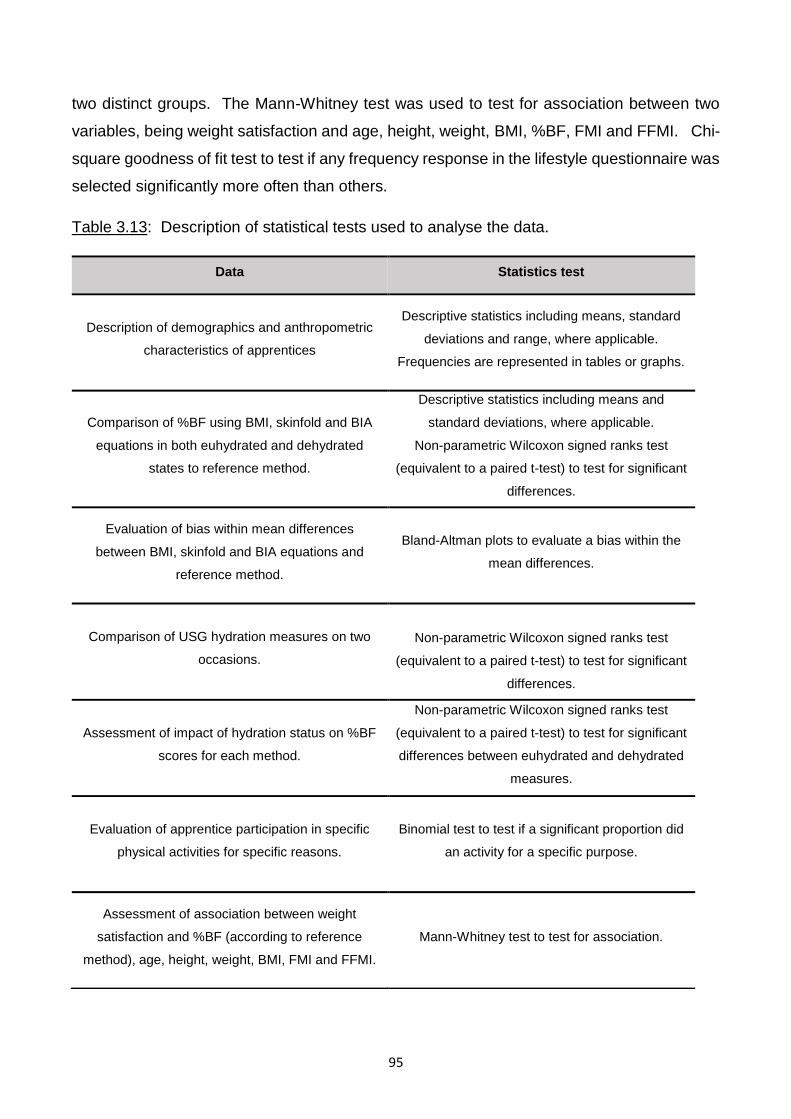
95
two distinct groups. The Mann-Whitney test was used to test for association between two
variables, being weight satisfaction and age, height, weight, BMI, %BF, FMI and FFMI. Chi-
square goodness of fit test to test if any frequency response in the lifestyle questionnaire was
selected significantly more often than others.
Table 3.13: Description of statistical tests used to analyse the data.
Data Statistics test
Description of demographics and anthropometric
characteristics of apprentices
Descriptive statistics including means, standard
deviations and range, where applicable.
Frequencies are represented in tables or graphs.
Comparison of %BF using BMI, skinfold and BIA
equations in both euhydrated and dehydrated
states to reference method.
Descriptive statistics including means and
standard deviations, where applicable.
Non-parametric Wilcoxon signed ranks test
(equivalent to a paired t-test) to test for significant
differences.
Evaluation of bias within mean differences
between BMI, skinfold and BIA equations and
reference method.
Bland-Altman plots to evaluate a bias within the
mean differences.
Comparison of USG hydration measures on two
occasions.
Non-parametric Wilcoxon signed ranks test
(equivalent to a paired t-test) to test for significant
differences.
Assessment of impact of hydration status on %BF
scores for each method.
Non-parametric Wilcoxon signed ranks test
(equivalent to a paired t-test) to test for significant
differences between euhydrated and dehydrated
measures.
Evaluation of apprentice participation in specific
physical activities for specific reasons.
Binomial test to test if a significant proportion did
an activity for a specific purpose.
Assessment of association between weight
satisfaction and %BF (according to reference
method), age, height, weight, BMI, FMI and FFMI.
Mann-Whitney test to test for association.
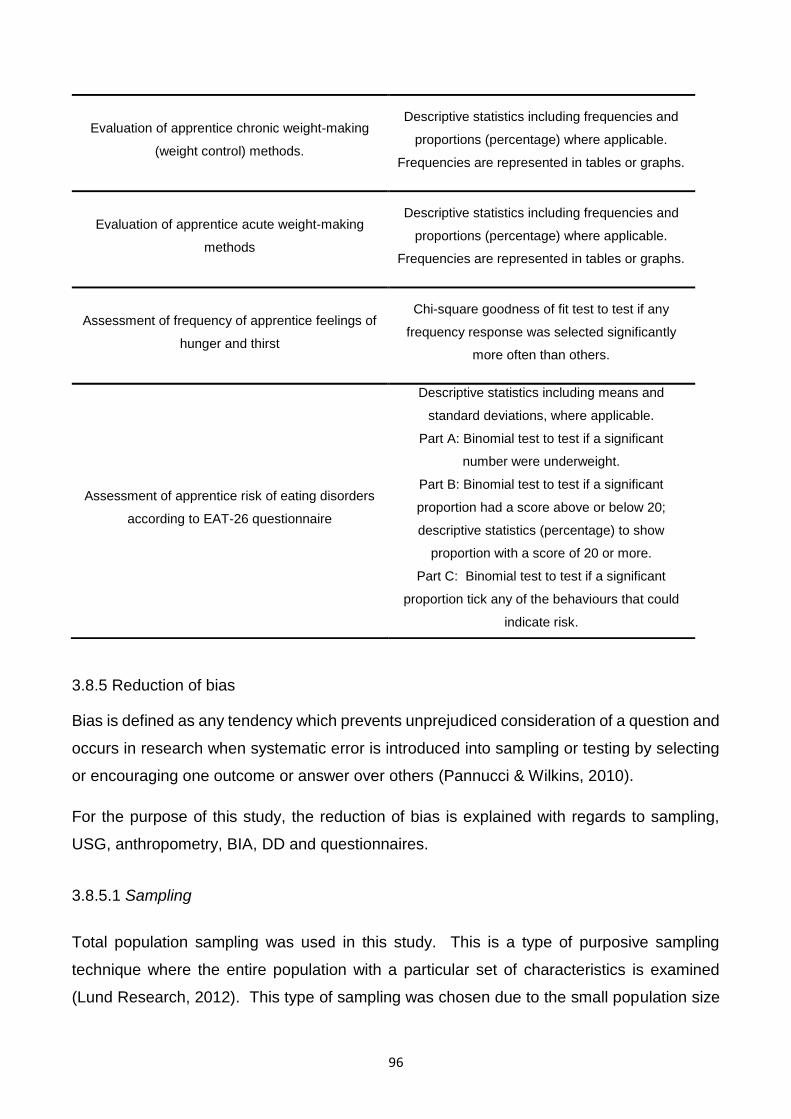
96
3.8.5 Reduction of bias
Bias is defined as any tendency which prevents unprejudiced consideration of a question and
occurs in research when systematic error is introduced into sampling or testing by selecting
or encouraging one outcome or answer over others (Pannucci & Wilkins, 2010).
For the purpose of this study, the reduction of bias is explained with regards to sampling,
USG, anthropometry, BIA, DD and questionnaires.
3.8.5.1 Sampling
Total population sampling was used in this study. This is a type of purposive sampling
technique where the entire population with a particular set of characteristics is examined
(Lund Research, 2012). This type of sampling was chosen due to the small population size
Evaluation of apprentice chronic weight-making
(weight control) methods.
Descriptive statistics including frequencies and
proportions (percentage) where applicable.
Frequencies are represented in tables or graphs.
Evaluation of apprentice acute weight-making
methods
Descriptive statistics including frequencies and
proportions (percentage) where applicable.
Frequencies are represented in tables or graphs.
Assessment of frequency of apprentice feelings of
hunger and thirst
Chi-square goodness of fit test to test if any
frequency response was selected significantly
more often than others.
Assessment of apprentice risk of eating disorders
according to EAT-26 questionnaire
Descriptive statistics including means and
standard deviations, where applicable.
Part A: Binomial test to test if a significant
number were underweight.
Part B: Binomial test to test if a significant
proportion had a score above or below 20;
descriptive statistics (percentage) to show
proportion with a score of 20 or more.
Part C: Binomial test to test if a significant
proportion tick any of the behaviours that could
indicate risk.
97
of jockey apprentices in KZN, since they must all train at the SAJA in order to obtain a license,
as well as the unique characteristics of the population, in terms of physique and lifestyle
habits.
This sampling technique reduces bias as it allows for wide coverage of the population of
interest, reducing the risk of missing potential insights from members that are not included
(Lund Research, 2012) .
3.8.5.2 Urine specific gravity
Urine specific gravity was measured to the nearest 0.001 g/ml using the same digital hand
held pocket refractometer (ATAGO PAL-10S) for every apprentice. It was calibrated with tap
water prior to every measurement. Each measurement was performed twice and an average
of the two readings was recorded. If the two readings differed by more than 0.001 g/ml, a
third reading was taken and an average of the two closest readings was used. All
measurements were taken by the SAJA biokineticist, with extensive experience in USG
measurement.
3.8.5.3 Anthropometry
Body weight was measured to the nearest 0.1 kg using a portable Seca 437 scale and height
was measured to the nearest centimetre using a stadiometer in the SAJA gymnasium. The
scale was calibrated prior to the study by SA Scales and was regularly checked during the
study using a known 5 kg calibration weight (Avery) to minimise measurement errors.
Skinfolds were measured using metal callipers (Lange) which were calibrated by Ross
Calibration Services prior to data collection. All measurements were taken twice and the
mean used in calculations. A third measurement was taken and the mean of the two closest
readings recorded if the readings differed by more than 100 g, 0.2 cm, or 1 mm for weight,
height and skinfold thickness respectively. Weight and height were taken by a registered
dietician trained in taking anthropometric measurements. The skinfold measurements were
taken by a biokineticist trained in the techniques of ISAK. This assisted with reduction of
inter-observer error, however, bias between measurers is unavoidable. The same dietitian
measured weight and height and the same biokineticist measured all of the skinfold
measurements for each apprentice in order to control for inter-observer variability.
98
3.8.5.4 Bioelectric impedance analysis
The calibrator supplied with the BODYSTAT®1500 machine was used to independently verify
that the unit remained in calibration prior to each day of data collection. The measurements
were taken by the researcher following training by a senior technician at UKZN (Mrs Elsie
Correia, [email protected]) who had extensive experience in the use of the machine, in
order to minimise errors during data collection.
3.8.5.5 Deuterium dilution
All deuterium doses were prepared to weigh as close to 30.000 g as possible using a balance
scale (BEL Mark 500). The scale was calibrated using a 200 g standard weight prior to use.
To ensure that no deuterium remained in the dosing bottle after drinking, the apprentice drank
100 ml tap water out of the dosing bottle in two separate doses. The samples were
transferred to the DDMRI within a specified time and kept in the same freezer until analysis.
The FTIR was prepared for measurement in accordance with the IAEA SOP and was
calibrated by laboratory technician Dr Helen Mulol, who has extensive experience in
deuterium oxide and its applications due to its implementation in her doctoral study.
3.8.5.6 Questionnaires
Both the lifestyle and EAT-26 questionnaires were administered by a registered social worker
with previous experience in administering a similar lifestyle questionnaire at the SAJA. Open-
and closed-ended questions were included in both questionnaires. Closed-ended questions
were selected due to the small amount of time required to administer and the ease of coding
and analysis. However, this possibly limited the depth and spontaneity of the answers and
may have introduced bias by forcing the apprentices to choose pre-established responses
(Meadows, 2003). Where applicable, participants were instructed to select as many options
as deemed personally relevant.
3.8.6 RELIABILITY
Reliability refers to the degree to which consistent results can be produced from repeated
measurements (Hulley, Cummings, Browner, Grady & Newman, 2013). This was achieved
by ensuring that all observers were competent in measurement, either by certification (ISAK
99
for skinfold measurements, weight and height), previous experience and training (urinalysis,
FTIR), or preliminary training (BODYSTAT®1500 machine); by calibrating measurement
instruments such as the urine refractometer, weight scale, skinfold callipers,
BODYSTAT®1500 machine and FTIR software; and by ensuring that the same field worker
or researcher performed the same measurements. Standard operating procedures were
followed for BIA and DD and ISAK procedures for skinfold measurement. The same
measurement instruments were used throughout the study.
3.8.7 VALIDITY
Validity refers to the extent to which the results are accurate and the conclusions derived can
be generalized (Hulley et al., 2013). Content validity, which refers to whether the instruments
measure the content they were intended to measure (Creswell, 2013), was ensured by using
a validated reference method of measuring %BF, DD (Fuller et al., 1992; Camarneiro et al.,
2013). Both questionnaires were validated for content validity by a qualified statistician, Dr
Gill Hendry. The field methods assessed have also been validated in the general population,
although none have been validated against a reference method in the jockey population. The
skinfold equation by Durnin & Womersley (1974) has also been used in the professional
jockey population before (O’Reilly et al., 2017) and the BODYSTAT®1500 had been used in
the SAJA apprentice population before (Krog, 2015). The lifestyle questionnaire used was
adapted from a questionnaire that had been validated in the jockey population (Dolan et al.,
2011). The EAT-26 questionnaire has been well-validated and frequently used tool in the
female and non-athletic population (Pope et al., 2015) and has been utilised in several
studies to assess the risk of jockeys developing eating disorders (Garner & Garfinkel, 1979;
King & Mezey, 1987; Leydon & Wall, 2002; Caulfield & Karageorghis, 2008; Wilson et al.,
2015).
3.8.8 Ethical considerations
Permission to conduct the study at the SAJA was given by the principal, Mr Graham Bailey
(Appendix F). Ethics approval was granted by the Biomedical Research Ethics Committee of
the University of KwaZulu-Natal (BE212/16) in May 2016 (Appendix G) and approval of study
amendment to compare hydrated and dehydrated results was granted in August 2016
(Appendix H).
100
Prior to data collection, the apprentices were informed in a group session by the SAJA
dietitian of all aspects of the study, including the fact that participation was voluntary and that
they were free to withdraw at any time during the study. Voluntary written informed consent
was obtained from all participants 18 years and older prior to commencement of the study
(Appendix H1). Written informed consent was obtained from a parent or legal guardian of
participants younger than 18 years (Appendix H2) as well as an assent form completed by
those younger than 18 years (Appendix H3). The benefits of participating in the study were
indicated on the consent and assent forms, which included having an accurate measurement
of %BF using a technique that is usually only available in advanced body composition
research and that the research would assist the apprentice in achieving an optimal %BF by
determining the most accurate available method of measuring %BF. It was also indicated of
the consent and assent forms that there would be no possible risks to the apprentice for
participating in the study.
The data base was password protected and can only be accessed by the researcher. The
participants’ files were stored in a secure locked cabinet and will be destroyed after a 5 year
period.
The apprentices’ identity was protected by the allocation of a study number which was used
for all laboratory and data analysis.
Due to the delay between data collection from the apprentices and actual calculation of %BF,
which was approximately 6 months, the apprentices did not receive feedback of their %BF
results as they were no longer relevant. The apprentices were informed of their hydration
results by the SAJA dietitian and action to promote better hydration practises were
implemented accordingly.
101
CHAPTER 4: RESULTS
4.1 INTRODUCTION
This study measured the %BF of the jockey apprentices training at the SAJA. Percent body
fat was obtained by using various regression equations in combination with BMI, skinfold
measurements and BIA. These %BF values were compared to that of the DD technique
(reference method) in both a dehydrated and euhydrated state to determine the impact of
dehydration on the accuracy of each method.
A lifestyle questionnaire was used to determine the prevalence of use of weight-making and
weight-control techniques. The prevalence of the risk of eating disorders was determined
using the EAT-26 questionnaire.
4.2 RESPONSE RATE
The sample consisted of 17 of the 19 jockey apprentices who were training at the SAJA in
Hillcrest during June to September 2016. One was unavailable to complete both the lifestyle
and EAT-26 questionnaires due to riding commitments, therefore the sample for the
questionnaires was 16 of 19 apprentices. Of those who did not take part, one obtained a
professional licence and the other did not complete his apprenticeship, thus they were
excluded. The response rate was 84% and therefore an adequate representation of the
population.
4.3 SAMPLE DEMOGRAPHICS
Almost half were white (47%, 8/17), followed by black (23%, 4/17), coloured (18%, 3/17) and
Indian (12%, 2/17). The mean age was 18.8 years (SD± 1.7, range 16.1 - 23.1).
4.4 HYDRATION STATUS
Following the hydration protocol, the mean USG was 1.011 g/ml (SD± 0.005, range 1.001-
1.020). The individual USG measurements when euhydrated are indicated in Figure 4.1.
The mean USG was significantly higher (p < 0.001) when dehydrated (1.027 g/ml, SD± 0.003,
range 1.021-1.032). Nineteen percent (13/16) were severely dehydrated (Figure 4.1).
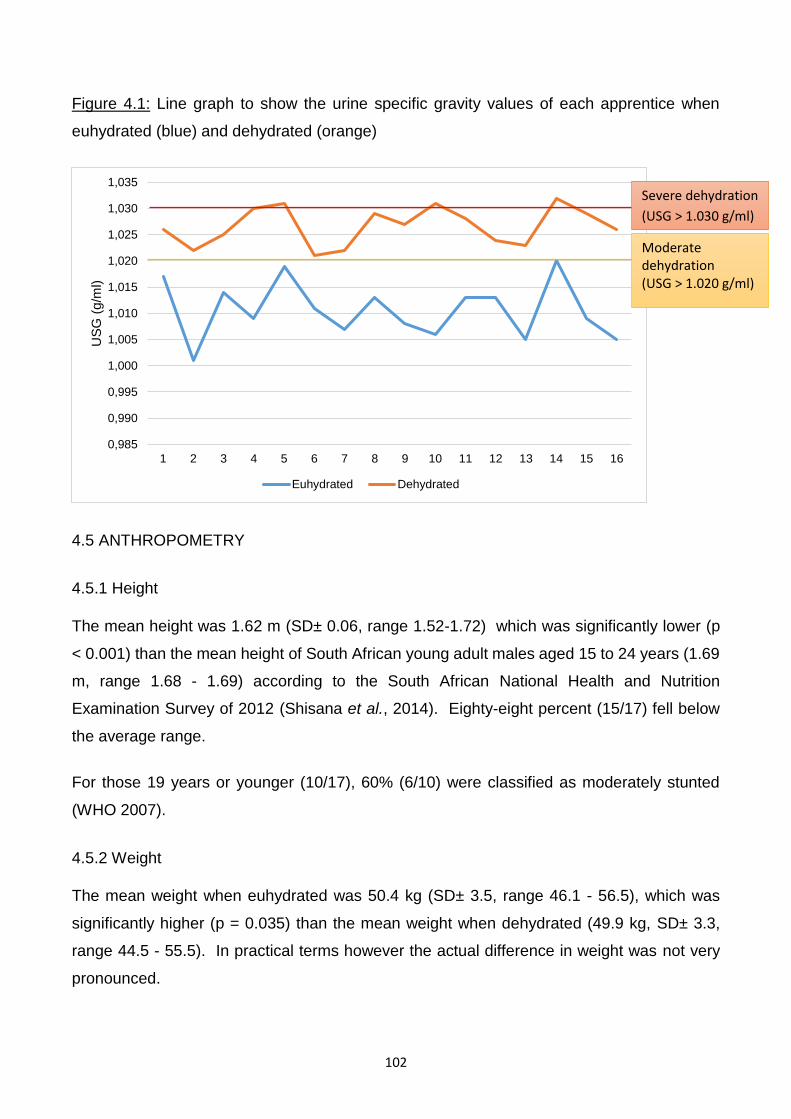
102
Figure 4.1: Line graph to show the urine specific gravity values of each apprentice when
euhydrated (blue) and dehydrated (orange)
4.5 ANTHROPOMETRY
4.5.1 Height
The mean height was 1.62 m (SD± 0.06, range 1.52-1.72) which was significantly lower (p
< 0.001) than the mean height of South African young adult males aged 15 to 24 years (1.69
m, range 1.68 - 1.69) according to the South African National Health and Nutrition
Examination Survey of 2012 (Shisana et al., 2014). Eighty-eight percent (15/17) fell below
the average range.
For those 19 years or younger (10/17), 60% (6/10) were classified as moderately stunted
(WHO 2007).
4.5.2 Weight
The mean weight when euhydrated was 50.4 kg (SD± 3.5, range 46.1 - 56.5), which was
significantly higher (p = 0.035) than the mean weight when dehydrated (49.9 kg, SD± 3.3,
range 44.5 - 55.5). In practical terms however the actual difference in weight was not very
pronounced.
0,985
0,990
0,995
1,000
1,005
1,010
1,015
1,020
1,025
1,030
1,035
1 2 3 4 5 6 7 8 9 10 11 12 13 14 15 16
US
G (
g/m
l)
Euhydrated Dehydrated
Severe dehydration
(USG > 1.030 g/ml)
Moderate dehydration (USG > 1.020 g/ml)
103
4.5.3 Body mass index
The mean BMI when euhydrated was 19.2 kg/m2 (SD± 1.1, range 16.4 - 21.0), which was not
significantly different from the BMI when dehydrated (19.0 kg/m2, SD± 0.9, range 17.1 - 21.0).
Only one (6%) was classified as moderately malnourished when measured euhydrated while
the rest were classified as normal (Ralph et al., 2000). For those 19 years or younger (10/16),
all had a normal BMI for age.
4.6 ESTIMATION OF PERCENT BODY FAT
4.6.1 Body composition as determined by deuterium dilution
4.6.1.1 Fat-free mass
The mean FFM when euhydrated was 45.7 kg (SD± 3.5, range 40.1 – 53.4), which was
significantly higher than when dehydrated (44.1 kg, SD± 3.5, range 38.1 – 50.4) (p = 0.002).
Therefore the euhydrated FFM values were used to calculate the FFMI of 17.4 kg/m2 (SD±
1.1, range 15.0 – 19.5). This was within the normal range1.
There are different reference ranges for classifying the FFMI of those younger than 20 years
and 18 years and older, namely those of Weber et al. (2013) and Schutz et al. (2002)
respectively. The mean FFMI of those younger than 18 years (6/17) was 16.6 kg/m2 (SD±
1.8, range 15.0 – 18.7), which was greater than the lower limit of normal for this age group
(13.8 to 14.4 kg/m2, depending on actual age) according to Weber et al. (2013) and none of
the apprentices younger than 18 years were underlean. The mean FFMI of those 18 years
and older (11/17) was 17.8 kg/m2 (SD± 1.9, range 15.3 – 23.1), which was greater than the
lower limit of normal for this age group (16.7 kg/m2) according to Schutz et al. (2002).
Eighteen percent (2/11) of those 18 years and older were classified as underlean. Overall,
18% (2/17) apprentices were classified as underlean according to their FFMI.
1 Different lower limits were used for different age groups, for example the lower limit is 13.8 kg/m2 for 16.0 - 16.49 years, whereas the lower limit for 18 years and older is 16.7 kg/m2. High levels of FFM, when euhydrated, are not associated with negative health effects (Kyle et al., 2003), therefore no upper limit was used.
104
4.6.1.2 Percent body fat and fat mass index
The mean %BF of all the apprentices combined was 9.5 % (SD± 2.8, range 4.5 – 14.1), when
euhydrated which was significantly lower than when dehydrated (11.8 %, SD± 4.6, range 5.9
– 24.2) (p = 0.025). Due to this difference, only the euhydrated DD (eDD) values were
considered accurate and were therefore used as the reference standard for the other
methods. The individual %BF according to DD when euhydrated and dehydrated are
indicated in Figure 4.2. There was no significant correlation between %BF and BMI (p =
0.793).
Twelve percent (2/17) had a %BF within the “essential” fat range (3 - 6 %).
There are different reference ranges for classifying the %BF of those younger and older than
20 years namely those of Borrud et al. (2011) and Gallagher et al. (2000) respectively. The
mean %BF of the apprentices who were younger than 20 years was 10.2 % (SD± 2.8, range
4.5 – 14.1), which was lower than the normal range (13.7 – 31.2 %) for this age group
according to Borrud et al. (2011). Twelve of the 13 (92%) apprentices younger than 20 years,
were underfat as their %BF fell below this normal range. The mean %BF of the apprentices
20 years and older was 7.3 % (SD± 1.2, range 5.6 – 11.9), which was also lower than the
normal range (8.0 – 20.0 %) for this age group according to (Gallagher et al., 2000). Three
of the four (75%) apprentices 20 years and older were underfat, as their %BF fell below this
normal range. Overall, 88% (15/17) of the apprentices were classified as underfat according
to their %BF.
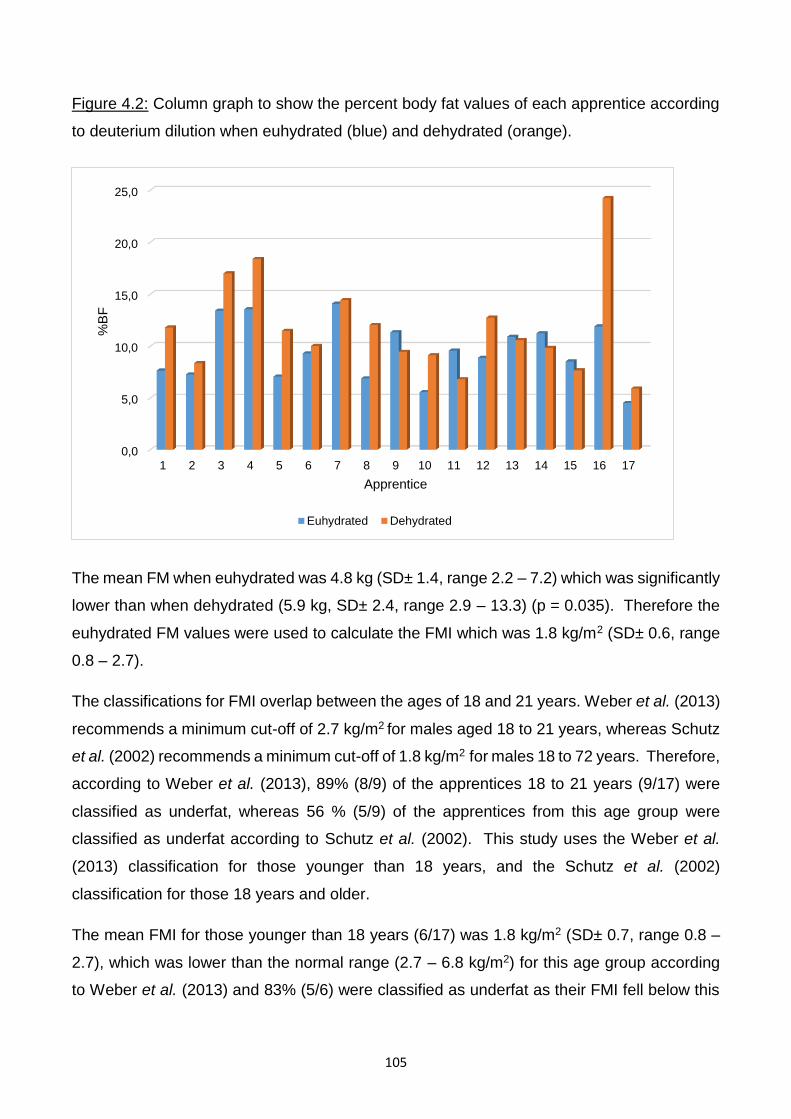
105
Figure 4.2: Column graph to show the percent body fat values of each apprentice according
to deuterium dilution when euhydrated (blue) and dehydrated (orange).
The mean FM when euhydrated was 4.8 kg (SD± 1.4, range 2.2 – 7.2) which was significantly
lower than when dehydrated (5.9 kg, SD± 2.4, range 2.9 – 13.3) (p = 0.035). Therefore the
euhydrated FM values were used to calculate the FMI which was 1.8 kg/m2 (SD± 0.6, range
0.8 – 2.7).
The classifications for FMI overlap between the ages of 18 and 21 years. Weber et al. (2013)
recommends a minimum cut-off of 2.7 kg/m2 for males aged 18 to 21 years, whereas Schutz
et al. (2002) recommends a minimum cut-off of 1.8 kg/m2 for males 18 to 72 years. Therefore,
according to Weber et al. (2013), 89% (8/9) of the apprentices 18 to 21 years (9/17) were
classified as underfat, whereas 56 % (5/9) of the apprentices from this age group were
classified as underfat according to Schutz et al. (2002). This study uses the Weber et al.
(2013) classification for those younger than 18 years, and the Schutz et al. (2002)
classification for those 18 years and older.
The mean FMI for those younger than 18 years (6/17) was 1.8 kg/m2 (SD± 0.7, range 0.8 –
2.7), which was lower than the normal range (2.7 – 6.8 kg/m2) for this age group according
to Weber et al. (2013) and 83% (5/6) were classified as underfat as their FMI fell below this
0,0
5,0
10,0
15,0
20,0
25,0
1 2 3 4 5 6 7 8 9 10 11 12 13 14 15 16 17
%B
F
Apprentice
Euhydrated Dehydrated
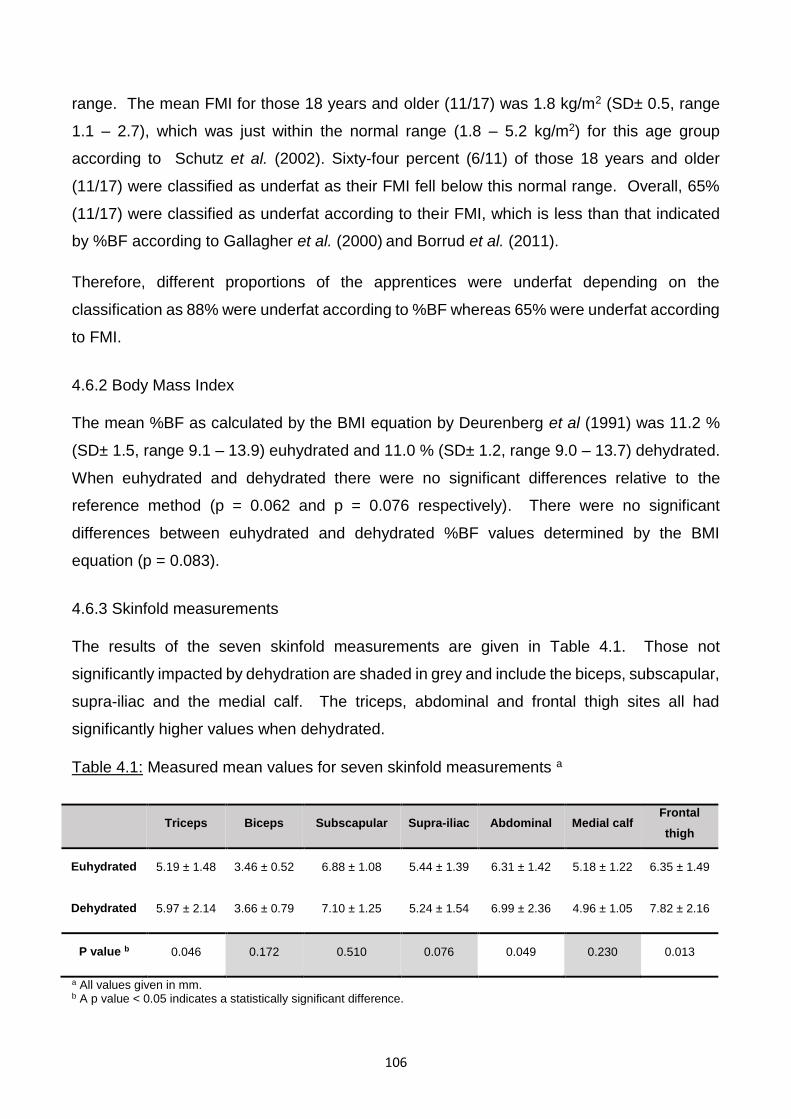
106
range. The mean FMI for those 18 years and older (11/17) was 1.8 kg/m2 (SD± 0.5, range
1.1 – 2.7), which was just within the normal range (1.8 – 5.2 kg/m2) for this age group
according to Schutz et al. (2002). Sixty-four percent (6/11) of those 18 years and older
(11/17) were classified as underfat as their FMI fell below this normal range. Overall, 65%
(11/17) were classified as underfat according to their FMI, which is less than that indicated
by %BF according to Gallagher et al. (2000) and Borrud et al. (2011).
Therefore, different proportions of the apprentices were underfat depending on the
classification as 88% were underfat according to %BF whereas 65% were underfat according
to FMI.
4.6.2 Body Mass Index
The mean %BF as calculated by the BMI equation by Deurenberg et al (1991) was 11.2 %
(SD± 1.5, range 9.1 – 13.9) euhydrated and 11.0 % (SD± 1.2, range 9.0 – 13.7) dehydrated.
When euhydrated and dehydrated there were no significant differences relative to the
reference method (p = 0.062 and p = 0.076 respectively). There were no significant
differences between euhydrated and dehydrated %BF values determined by the BMI
equation (p = 0.083).
4.6.3 Skinfold measurements
The results of the seven skinfold measurements are given in Table 4.1. Those not
significantly impacted by dehydration are shaded in grey and include the biceps, subscapular,
supra-iliac and the medial calf. The triceps, abdominal and frontal thigh sites all had
significantly higher values when dehydrated.
Table 4.1: Measured mean values for seven skinfold measurements a
Triceps Biceps Subscapular Supra-iliac Abdominal Medial calf Frontal
thigh
Euhydrated 5.19 ± 1.48 3.46 ± 0.52 6.88 ± 1.08 5.44 ± 1.39 6.31 ± 1.42 5.18 ± 1.22 6.35 ± 1.49
Dehydrated 5.97 ± 2.14 3.66 ± 0.79 7.10 ± 1.25 5.24 ± 1.54 6.99 ± 2.36 4.96 ± 1.05 7.82 ± 2.16
P value b 0.046 0.172 0.510 0.076 0.049 0.230 0.013
a All values given in mm. b A p value < 0.05 indicates a statistically significant difference.
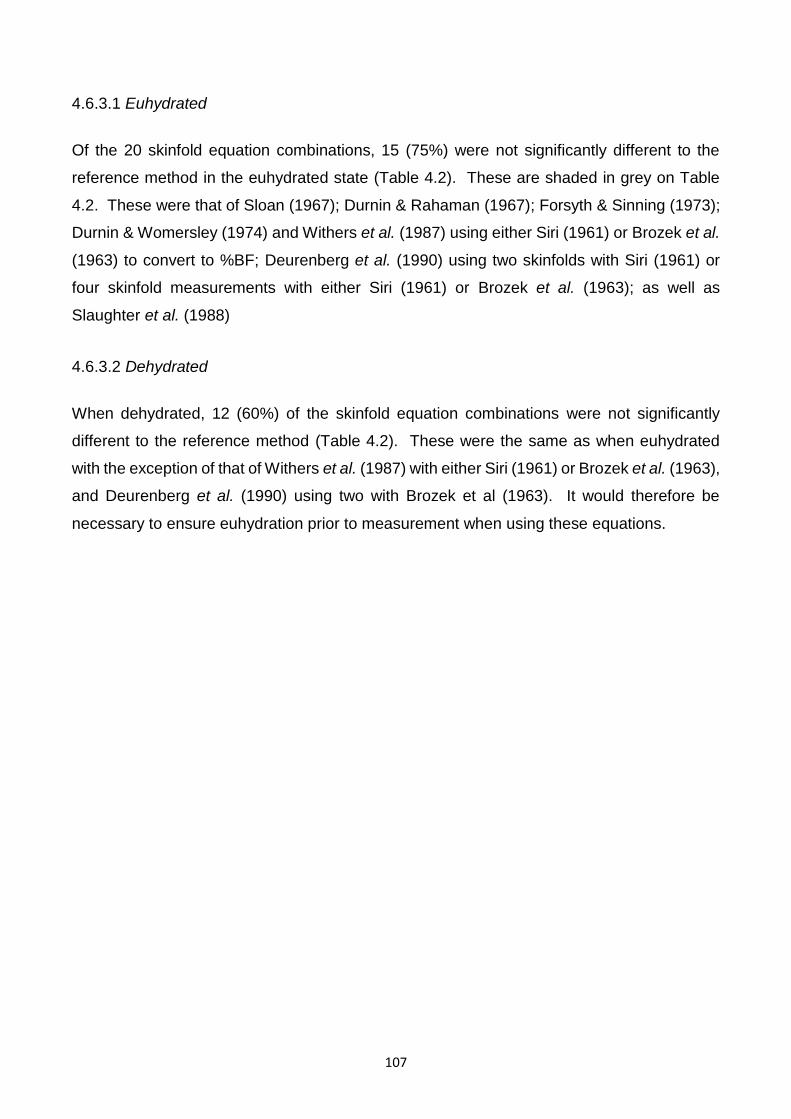
107
4.6.3.1 Euhydrated
Of the 20 skinfold equation combinations, 15 (75%) were not significantly different to the
reference method in the euhydrated state (Table 4.2). These are shaded in grey on Table
4.2. These were that of Sloan (1967); Durnin & Rahaman (1967); Forsyth & Sinning (1973);
Durnin & Womersley (1974) and Withers et al. (1987) using either Siri (1961) or Brozek et al.
(1963) to convert to %BF; Deurenberg et al. (1990) using two skinfolds with Siri (1961) or
four skinfold measurements with either Siri (1961) or Brozek et al. (1963); as well as
Slaughter et al. (1988)
4.6.3.2 Dehydrated
When dehydrated, 12 (60%) of the skinfold equation combinations were not significantly
different to the reference method (Table 4.2). These were the same as when euhydrated
with the exception of that of Withers et al. (1987) with either Siri (1961) or Brozek et al. (1963),
and Deurenberg et al. (1990) using two with Brozek et al (1963). It would therefore be
necessary to ensure euhydration prior to measurement when using these equations.
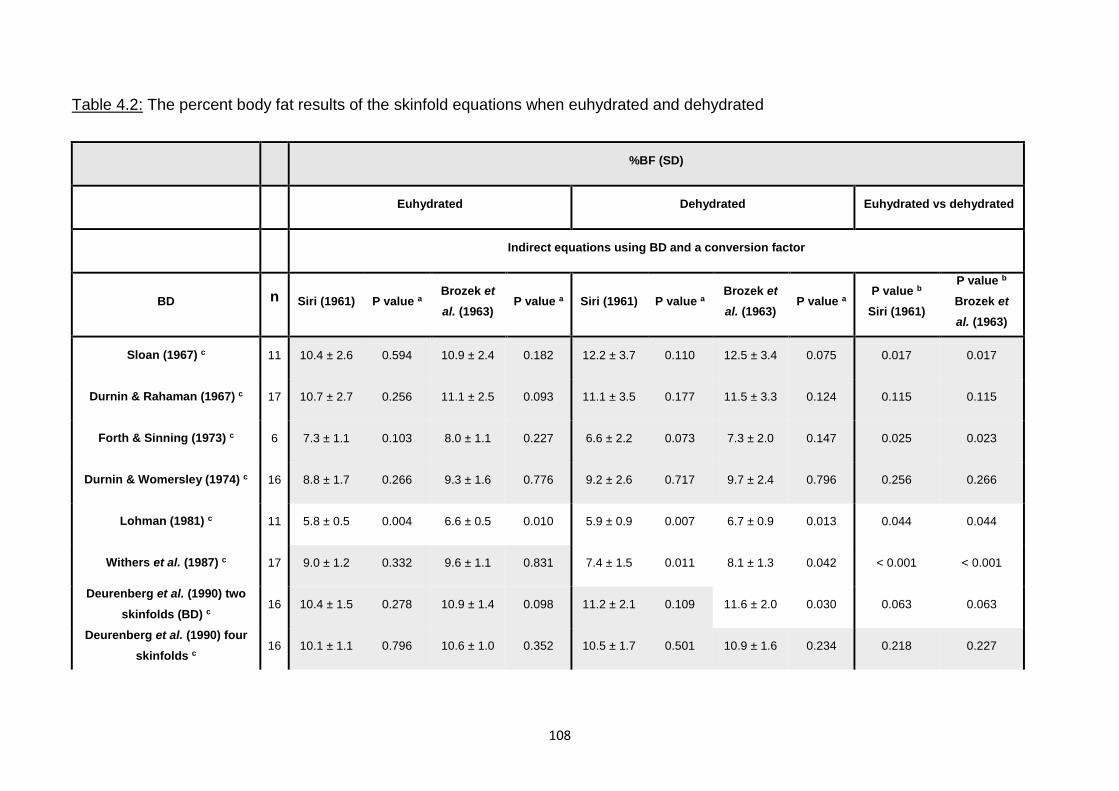
108
Table 4.2: The percent body fat results of the skinfold equations when euhydrated and dehydrated
%BF (SD)
Euhydrated Dehydrated Euhydrated vs dehydrated
Indirect equations using BD and a conversion factor
BD n Siri (1961) P value a Brozek et
al. (1963) P value a Siri (1961) P value a
Brozek et
al. (1963) P value a
P value b
Siri (1961)
P value b
Brozek et
al. (1963)
Sloan (1967) c 11 10.4 ± 2.6 0.594 10.9 ± 2.4 0.182 12.2 ± 3.7 0.110 12.5 ± 3.4 0.075 0.017 0.017
Durnin & Rahaman (1967) c 17 10.7 ± 2.7 0.256 11.1 ± 2.5 0.093 11.1 ± 3.5 0.177 11.5 ± 3.3 0.124 0.115 0.115
Forth & Sinning (1973) c 6 7.3 ± 1.1 0.103 8.0 ± 1.1 0.227 6.6 ± 2.2 0.073 7.3 ± 2.0 0.147 0.025 0.023
Durnin & Womersley (1974) c 16 8.8 ± 1.7 0.266 9.3 ± 1.6 0.776 9.2 ± 2.6 0.717 9.7 ± 2.4 0.796 0.256 0.266
Lohman (1981) c 11 5.8 ± 0.5 0.004 6.6 ± 0.5 0.010 5.9 ± 0.9 0.007 6.7 ± 0.9 0.013 0.044 0.044
Withers et al. (1987) c 17 9.0 ± 1.2 0.332 9.6 ± 1.1 0.831 7.4 ± 1.5 0.011 8.1 ± 1.3 0.042 < 0.001 < 0.001
Deurenberg et al. (1990) two
skinfolds (BD) c 16 10.4 ± 1.5 0.278 10.9 ± 1.4 0.098 11.2 ± 2.1 0.109 11.6 ± 2.0 0.030 0.063 0.063
Deurenberg et al. (1990) four
skinfolds c 16 10.1 ± 1.1 0.796 10.6 ± 1.0 0.352 10.5 ± 1.7 0.501 10.9 ± 1.6 0.234 0.218 0.227
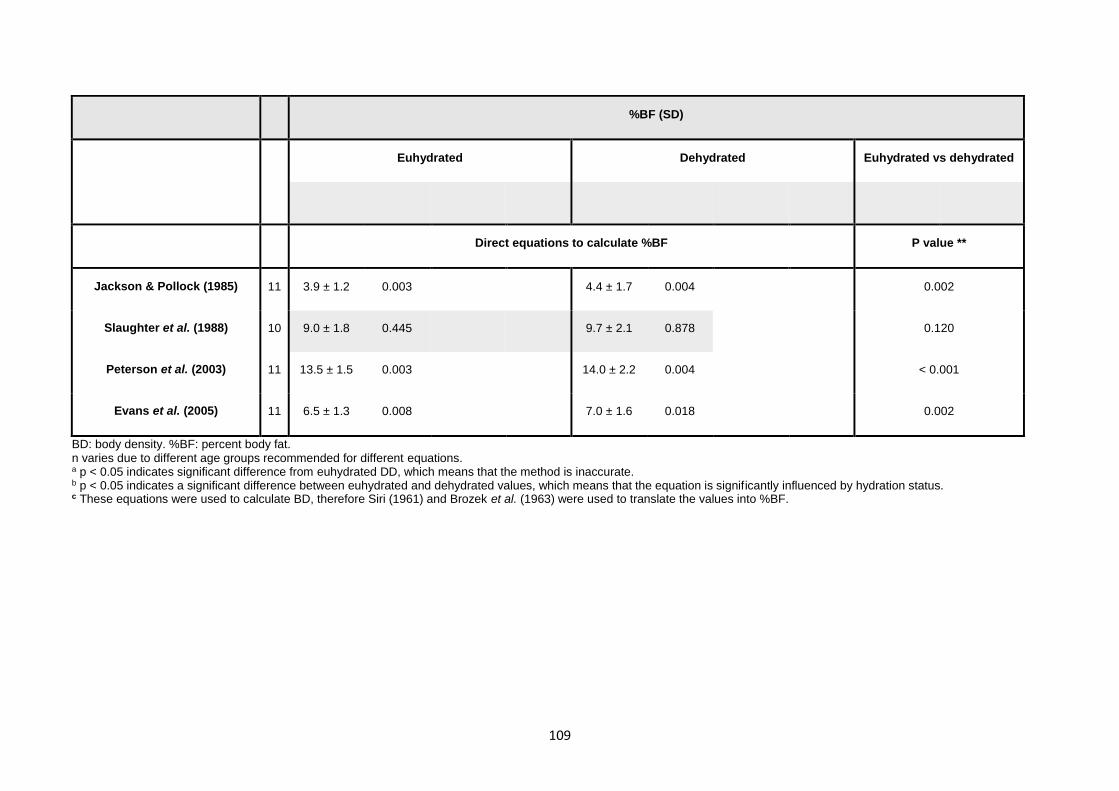
109
%BF (SD)
Euhydrated Dehydrated Euhydrated vs dehydrated
Direct equations to calculate %BF P value **
Jackson & Pollock (1985) 11 3.9 ± 1.2 0.003 4.4 ± 1.7 0.004 0.002
Slaughter et al. (1988) 10 9.0 ± 1.8 0.445 9.7 ± 2.1 0.878 0.120
Peterson et al. (2003) 11 13.5 ± 1.5 0.003 14.0 ± 2.2 0.004 < 0.001
Evans et al. (2005) 11 6.5 ± 1.3 0.008 7.0 ± 1.6 0.018 0.002
BD: body density. %BF: percent body fat. n varies due to different age groups recommended for different equations. a p < 0.05 indicates significant difference from euhydrated DD, which means that the method is inaccurate. b p < 0.05 indicates a significant difference between euhydrated and dehydrated values, which means that the equation is significantly influenced by hydration status. c These equations were used to calculate BD, therefore Siri (1961) and Brozek et al. (1963) were used to translate the values into %BF.
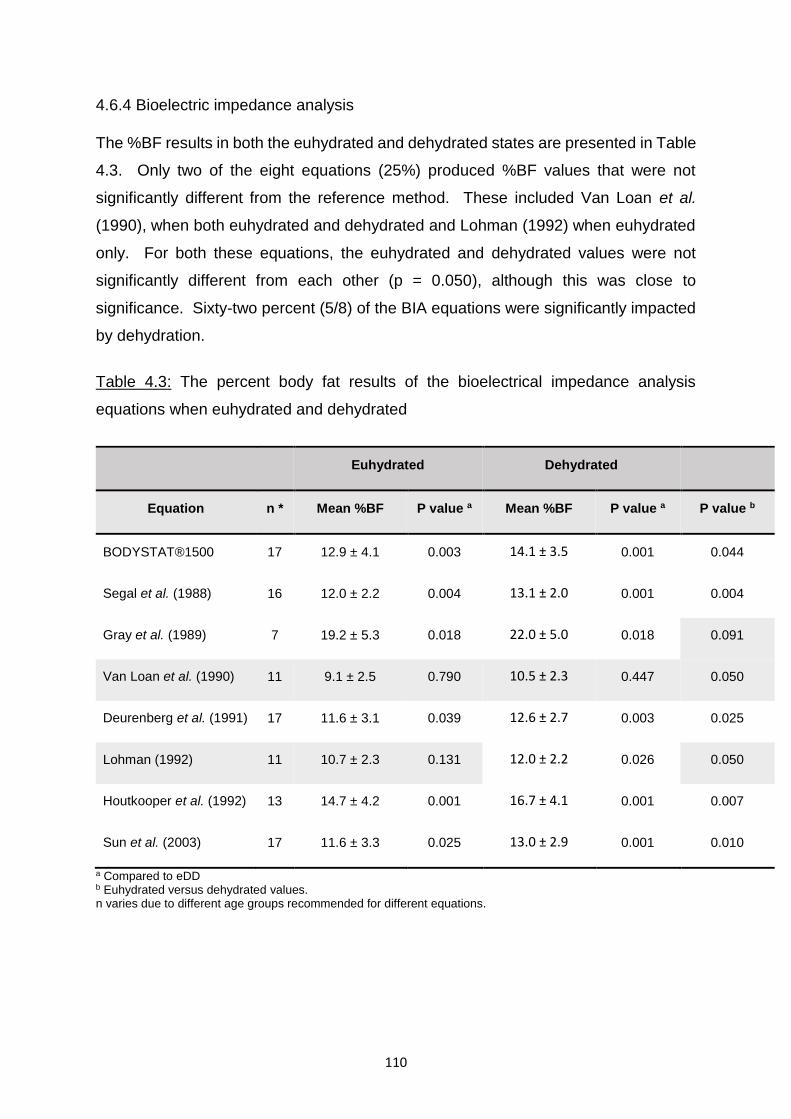
110
4.6.4 Bioelectric impedance analysis
The %BF results in both the euhydrated and dehydrated states are presented in Table
4.3. Only two of the eight equations (25%) produced %BF values that were not
significantly different from the reference method. These included Van Loan et al.
(1990), when both euhydrated and dehydrated and Lohman (1992) when euhydrated
only. For both these equations, the euhydrated and dehydrated values were not
significantly different from each other (p = 0.050), although this was close to
significance. Sixty-two percent (5/8) of the BIA equations were significantly impacted
by dehydration.
Table 4.3: The percent body fat results of the bioelectrical impedance analysis
equations when euhydrated and dehydrated
Euhydrated Dehydrated
Equation n * Mean %BF P value a Mean %BF P value a P value b
BODYSTAT®1500 17 12.9 ± 4.1 0.003 14.1 ± 3.5 0.001 0.044
Segal et al. (1988) 16 12.0 ± 2.2 0.004 13.1 ± 2.0 0.001 0.004
Gray et al. (1989) 7 19.2 ± 5.3 0.018 22.0 ± 5.0 0.018 0.091
Van Loan et al. (1990) 11 9.1 ± 2.5 0.790 10.5 ± 2.3 0.447 0.050
Deurenberg et al. (1991) 17 11.6 ± 3.1 0.039 12.6 ± 2.7 0.003 0.025
Lohman (1992) 11 10.7 ± 2.3 0.131 12.0 ± 2.2 0.026 0.050
Houtkooper et al. (1992) 13 14.7 ± 4.2 0.001 16.7 ± 4.1 0.001 0.007
Sun et al. (2003) 17 11.6 ± 3.3 0.025 13.0 ± 2.9 0.001 0.010
a Compared to eDD b Euhydrated versus dehydrated values. n varies due to different age groups recommended for different equations.
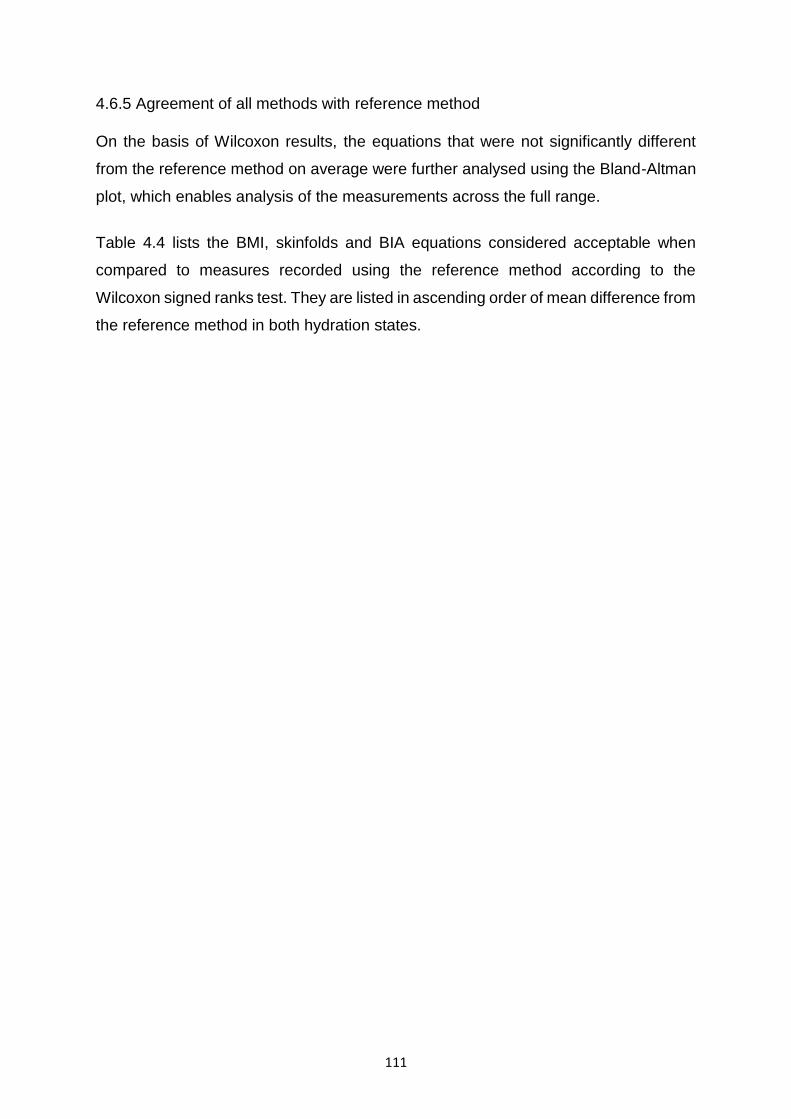
111
4.6.5 Agreement of all methods with reference method
On the basis of Wilcoxon results, the equations that were not significantly different
from the reference method on average were further analysed using the Bland-Altman
plot, which enables analysis of the measurements across the full range.
Table 4.4 lists the BMI, skinfolds and BIA equations considered acceptable when
compared to measures recorded using the reference method according to the
Wilcoxon signed ranks test. They are listed in ascending order of mean difference from
the reference method in both hydration states.
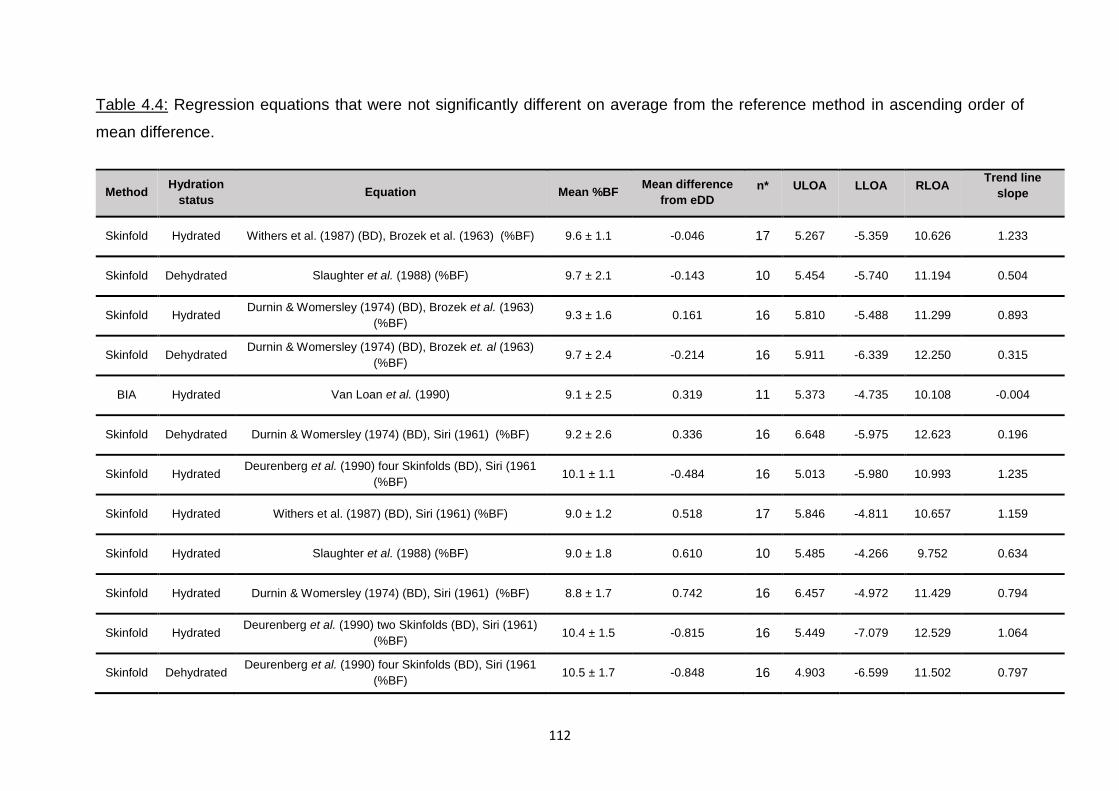
112
Table 4.4: Regression equations that were not significantly different on average from the reference method in ascending order of
mean difference.
Method Hydration
status Equation Mean %BF
Mean difference
from eDD
n* ULOA LLOA RLOA Trend line
slope
Skinfold Hydrated Withers et al. (1987) (BD), Brozek et al. (1963) (%BF) 9.6 ± 1.1 -0.046 17 5.267 -5.359 10.626 1.233
Skinfold Dehydrated Slaughter et al. (1988) (%BF) 9.7 ± 2.1 -0.143 10 5.454 -5.740 11.194 0.504
Skinfold Hydrated Durnin & Womersley (1974) (BD), Brozek et al. (1963)
(%BF) 9.3 ± 1.6 0.161 16 5.810 -5.488 11.299 0.893
Skinfold Dehydrated Durnin & Womersley (1974) (BD), Brozek et. al (1963)
(%BF) 9.7 ± 2.4 -0.214 16 5.911 -6.339 12.250 0.315
BIA Hydrated Van Loan et al. (1990) 9.1 ± 2.5 0.319 11 5.373 -4.735 10.108 -0.004
Skinfold Dehydrated Durnin & Womersley (1974) (BD), Siri (1961) (%BF) 9.2 ± 2.6 0.336 16 6.648 -5.975 12.623 0.196
Skinfold Hydrated Deurenberg et al. (1990) four Skinfolds (BD), Siri (1961
(%BF) 10.1 ± 1.1 -0.484 16 5.013 -5.980 10.993 1.235
Skinfold Hydrated Withers et al. (1987) (BD), Siri (1961) (%BF) 9.0 ± 1.2 0.518 17 5.846 -4.811 10.657 1.159
Skinfold Hydrated Slaughter et al. (1988) (%BF) 9.0 ± 1.8 0.610 10 5.485 -4.266 9.752 0.634
Skinfold Hydrated Durnin & Womersley (1974) (BD), Siri (1961) (%BF) 8.8 ± 1.7 0.742 16 6.457 -4.972 11.429 0.794
Skinfold Hydrated Deurenberg et al. (1990) two Skinfolds (BD), Siri (1961)
(%BF) 10.4 ± 1.5 -0.815 16 5.449 -7.079 12.529 1.064
Skinfold Dehydrated Deurenberg et al. (1990) four Skinfolds (BD), Siri (1961
(%BF) 10.5 ± 1.7 -0.848 16 4.903 -6.599 11.502 0.797
113
Method Hydration
status Equation Mean %BF
Mean difference
from eDD
n* ULOA LLOA RLOA Trend line
slope
Skinfold Hydrated Deurenberg et al. (1990) four Skinfolds (BD), Brozek et
al. (1963) (%BF) 10.6 ± 1.0 -0.962 16 4.517 -6.441 10.958 1.305
Skinfold Hydrated Sloan (1967) (BD), Siri (1961) (%BF) 10.4 ± 2.6 -0.992 11 5.819 -7.804 13.624 -0.059
BIA Dehydrated Van Loan et al. (1990) 9.2 ± 2.6 -1.060 11 5.125 -7.246 12.371 0.131
Skinfold Hydrated Durnin & Rahaman (1967) (BD), Siri (1961) (%BF) 10.7 ± 2.7 -1.184 17 5.656 -8.024 13.681 0.103
BIA Hydrated Lohman (1992) 10.7 ± 2.3 -1.267 11 3.637 -6.172 9.809 0.073
Skinfold Hydrated Deurenberg et al. (1990) two Skinfolds (BD), Brozek et
al. (1963) (%BF) 10.9 ± 1.4 -1.267 16 4.902 -7.437 12.339 1.166
Skinfold Dehydrated Deurenberg et al. (1990) four Skinfolds (BD), Brozek et
al. (1963) (%BF) 10.9 ± 1.6 -1.298 16 4.379 -6.975 11.355 0.898
Skinfold Hydrated Sloan (1967) (BD), Brozek et al. (1963) (%BF) 10.9 ± 2.4 -1.445 11 5.102 -7.993 13.095 0.093
Skinfold Dehydrated Forth & Sinning (1973) (BD), Brozek et al. (1963) (%BF) 7.3 ± 2.0 1.455 6 6.675 -3.765 10.440 0.289
BMI Dehydrated Deurenberg et al. (1991) 11.0 ± 1.2 -1.464 17 4.932 -7.861 12.792 1.509
Skinfold Dehydrated Deurenberg et al. (1990) two Skinfolds (BD), Siri (1961)
(%BF) 11.2 ± 2.1 -1.601 16 4.855 -8.056 12.911 0.501
Skinfold Dehydrated Durnin & Rahaman (1967) (BD), Siri (1961) (%BF) 11.1 ± 3.5 -1.610 17 6.208 -9.428 15.636 -0.350
Skinfold Hydrated Durnin & Rahaman (1967) (BD), Brozek et al. (1963)
(%BF) 11.1 ± 2.5 -1.617 17 4.989 -8.223 13.212 0.235
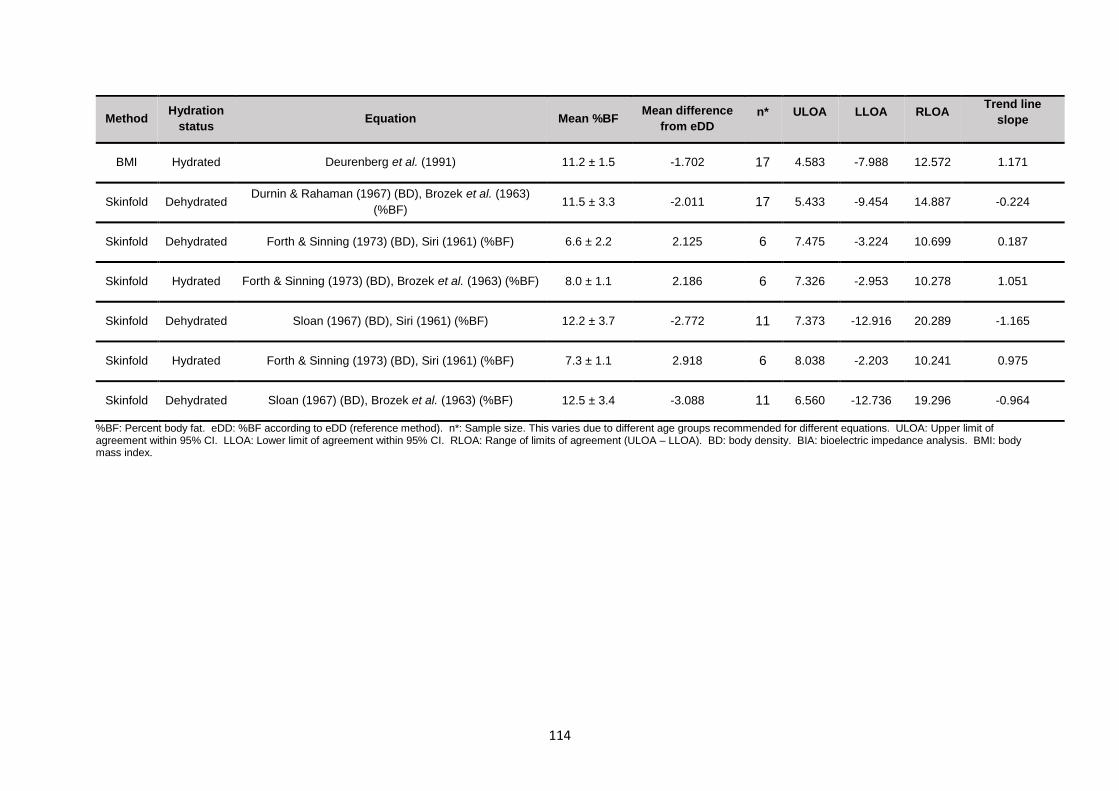
114
Method Hydration
status Equation Mean %BF
Mean difference
from eDD
n* ULOA LLOA RLOA Trend line
slope
BMI Hydrated Deurenberg et al. (1991) 11.2 ± 1.5 -1.702 17 4.583 -7.988 12.572 1.171
Skinfold Dehydrated Durnin & Rahaman (1967) (BD), Brozek et al. (1963)
(%BF) 11.5 ± 3.3 -2.011 17 5.433 -9.454 14.887 -0.224
Skinfold Dehydrated Forth & Sinning (1973) (BD), Siri (1961) (%BF) 6.6 ± 2.2 2.125 6 7.475 -3.224 10.699 0.187
Skinfold Hydrated Forth & Sinning (1973) (BD), Brozek et al. (1963) (%BF) 8.0 ± 1.1 2.186 6 7.326 -2.953 10.278 1.051
Skinfold Dehydrated Sloan (1967) (BD), Siri (1961) (%BF) 12.2 ± 3.7 -2.772 11 7.373 -12.916 20.289 -1.165
Skinfold Hydrated Forth & Sinning (1973) (BD), Siri (1961) (%BF) 7.3 ± 1.1 2.918 6 8.038 -2.203 10.241 0.975
Skinfold Dehydrated Sloan (1967) (BD), Brozek et al. (1963) (%BF) 12.5 ± 3.4 -3.088 11 6.560 -12.736 19.296 -0.964
%BF: Percent body fat. eDD: %BF according to eDD (reference method). n*: Sample size. This varies due to different age groups recommended for different equations. ULOA: Upper limit of agreement within 95% CI. LLOA: Lower limit of agreement within 95% CI. RLOA: Range of limits of agreement (ULOA – LLOA). BD: body density. BIA: bioelectric impedance analysis. BMI: body mass index.
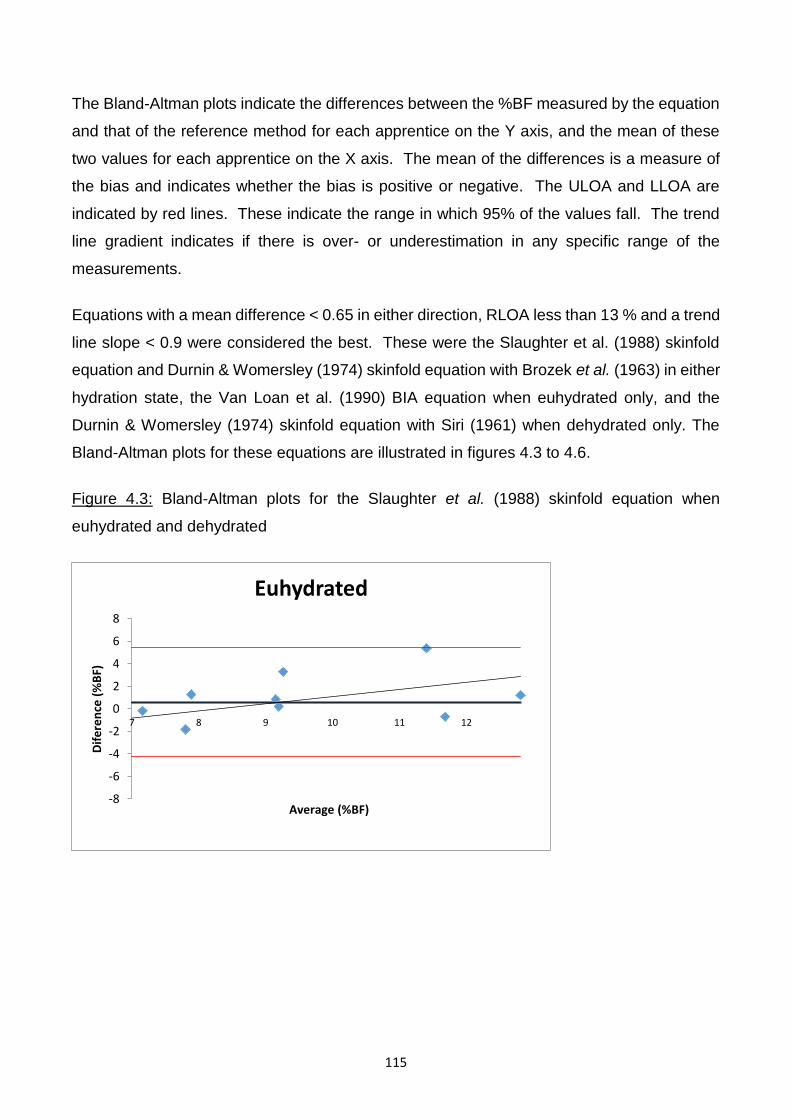
115
The Bland-Altman plots indicate the differences between the %BF measured by the equation
and that of the reference method for each apprentice on the Y axis, and the mean of these
two values for each apprentice on the X axis. The mean of the differences is a measure of
the bias and indicates whether the bias is positive or negative. The ULOA and LLOA are
indicated by red lines. These indicate the range in which 95% of the values fall. The trend
line gradient indicates if there is over- or underestimation in any specific range of the
measurements.
Equations with a mean difference < 0.65 in either direction, RLOA less than 13 % and a trend
line slope < 0.9 were considered the best. These were the Slaughter et al. (1988) skinfold
equation and Durnin & Womersley (1974) skinfold equation with Brozek et al. (1963) in either
hydration state, the Van Loan et al. (1990) BIA equation when euhydrated only, and the
Durnin & Womersley (1974) skinfold equation with Siri (1961) when dehydrated only. The
Bland-Altman plots for these equations are illustrated in figures 4.3 to 4.6.
Figure 4.3: Bland-Altman plots for the Slaughter et al. (1988) skinfold equation when
euhydrated and dehydrated
-8
-6
-4
-2
0
2
4
6
8
7 8 9 10 11 12
Dif
ere
nce
(%
BF)
Average (%BF)
Euhydrated
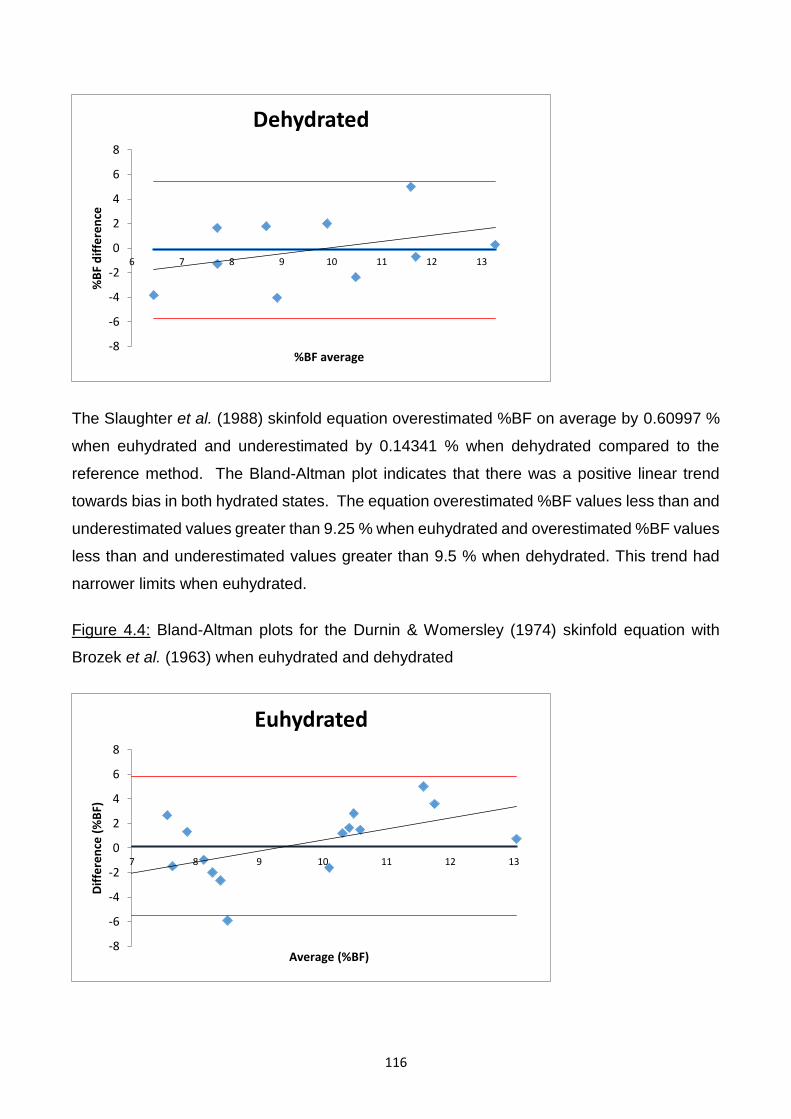
116
The Slaughter et al. (1988) skinfold equation overestimated %BF on average by 0.60997 %
when euhydrated and underestimated by 0.14341 % when dehydrated compared to the
reference method. The Bland-Altman plot indicates that there was a positive linear trend
towards bias in both hydrated states. The equation overestimated %BF values less than and
underestimated values greater than 9.25 % when euhydrated and overestimated %BF values
less than and underestimated values greater than 9.5 % when dehydrated. This trend had
narrower limits when euhydrated.
Figure 4.4: Bland-Altman plots for the Durnin & Womersley (1974) skinfold equation with
Brozek et al. (1963) when euhydrated and dehydrated
-8
-6
-4
-2
0
2
4
6
8
6 7 8 9 10 11 12 13
%B
F d
iffe
ren
ce
%BF average
Dehydrated
-8
-6
-4
-2
0
2
4
6
8
7 8 9 10 11 12 13
Dif
fere
nce
(%
BF)
Average (%BF)
Euhydrated
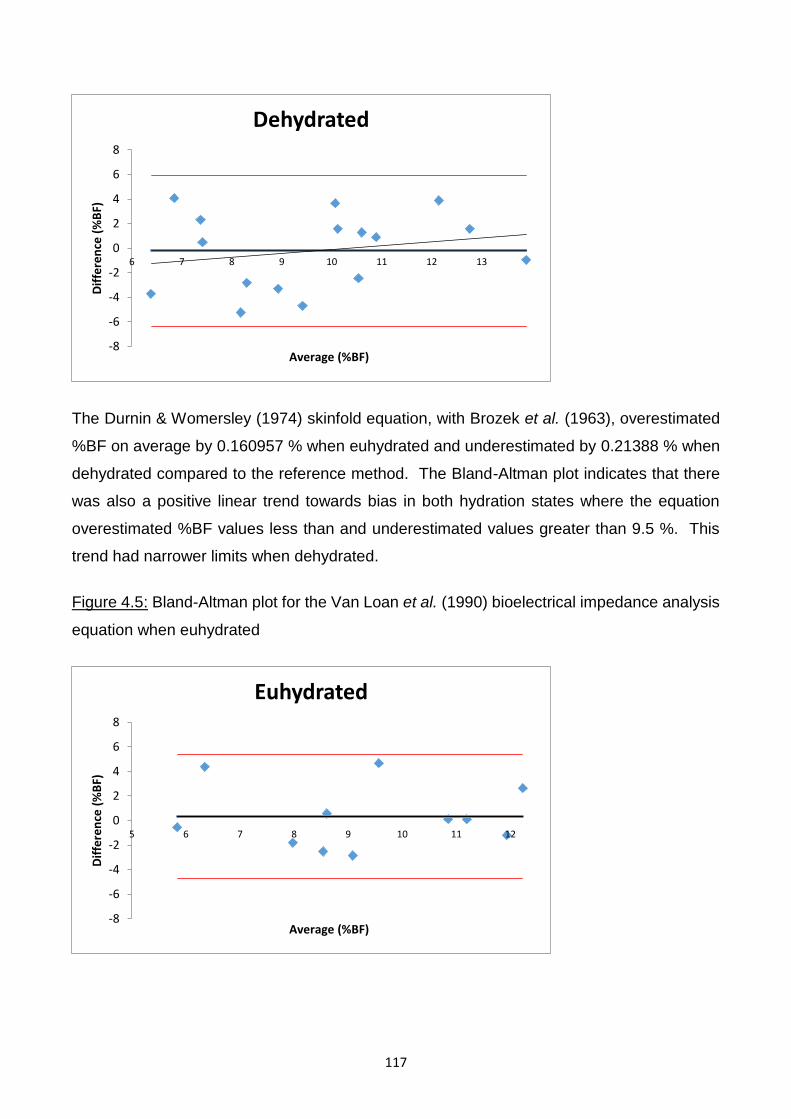
117
The Durnin & Womersley (1974) skinfold equation, with Brozek et al. (1963), overestimated
%BF on average by 0.160957 % when euhydrated and underestimated by 0.21388 % when
dehydrated compared to the reference method. The Bland-Altman plot indicates that there
was also a positive linear trend towards bias in both hydration states where the equation
overestimated %BF values less than and underestimated values greater than 9.5 %. This
trend had narrower limits when dehydrated.
Figure 4.5: Bland-Altman plot for the Van Loan et al. (1990) bioelectrical impedance analysis
equation when euhydrated
-8
-6
-4
-2
0
2
4
6
8
6 7 8 9 10 11 12 13
Dif
fere
nce
(%
BF)
Average (%BF)
Dehydrated
-8
-6
-4
-2
0
2
4
6
8
5 6 7 8 9 10 11 12
Dif
fere
nce
(%
BF)
Average (%BF)
Euhydrated
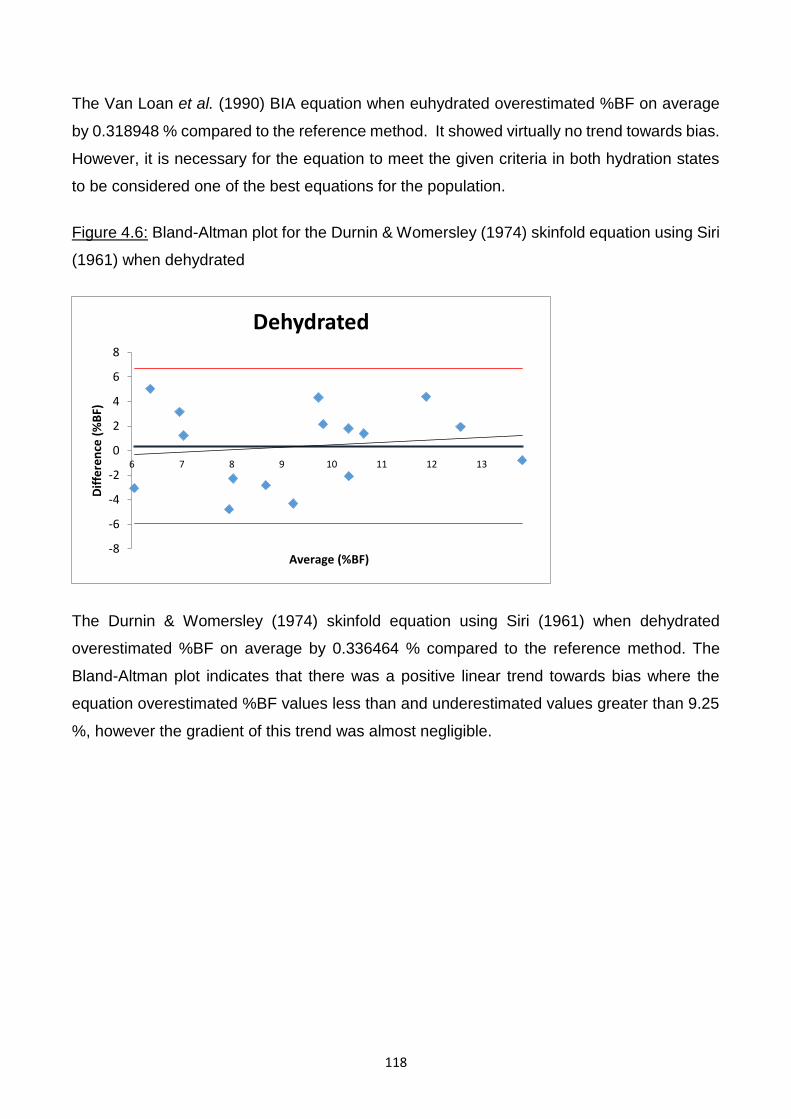
118
The Van Loan et al. (1990) BIA equation when euhydrated overestimated %BF on average
by 0.318948 % compared to the reference method. It showed virtually no trend towards bias.
However, it is necessary for the equation to meet the given criteria in both hydration states
to be considered one of the best equations for the population.
Figure 4.6: Bland-Altman plot for the Durnin & Womersley (1974) skinfold equation using Siri
(1961) when dehydrated
The Durnin & Womersley (1974) skinfold equation using Siri (1961) when dehydrated
overestimated %BF on average by 0.336464 % compared to the reference method. The
Bland-Altman plot indicates that there was a positive linear trend towards bias where the
equation overestimated %BF values less than and underestimated values greater than 9.25
%, however the gradient of this trend was almost negligible.
-8
-6
-4
-2
0
2
4
6
8
6 7 8 9 10 11 12 13
Dif
fere
nce
(%
BF)
Average (%BF)
Dehydrated
119
4.7 BEHAVIOURS RELATED TO HYDRATION AND FOOD INTAKE
Of the 17 jockey apprentices, 16 completed the lifestyle questionnaire.
4.7.1 Weight satisfaction
Thirty seven percent (6/16) reported that they were not satisfied with their current weight. Of
these 67 % (4/6) would like to weigh up to two kg less and 33 % (2/6) two to four kg less than
their actual weight. Weight dissatisfaction was not significantly associated with age (p =
0.515), height (p = 0.129), weight (p = 0.051), BMI (p = 0.663), FMI (p = 0.386) or FFMI (p =
0.057). Those who were dissatisfied were heavier (52.3 kg, SD ± 3.0, range 49.2 – 56.5)
than those who were satisfied (48.9 kg, SD ± 3.2, range 46.1 – 55.3) - this almost reached
significance (p = 0.051). However those who were dissatisfied had a significantly lower %BF
(7.7 %, SD± 2.5, range 4.5 - 11.2 %) than those who were satisfied (10.7 %, SD± 2.5, range
7.1 – 14.1 %) (p = 0.039).
4.7.2 Chronic weight-making methods
Restricting food intake was the most commonly reported method (75%), followed by daily
weighing (69%), keeping busy to avoid eating (44%) and exercising to use up calories (44%).
The chronic weight-making methods reported are summarised in Table 4.5.
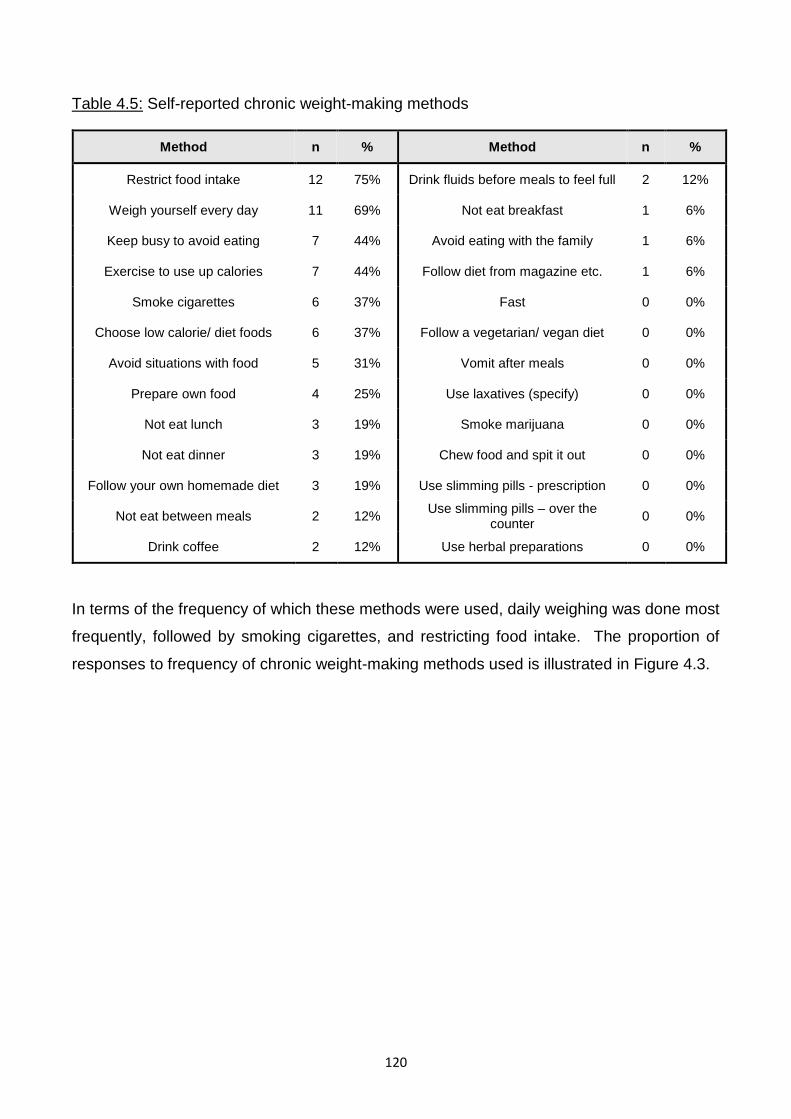
120
Table 4.5: Self-reported chronic weight-making methods
Method n % Method n %
Restrict food intake 12 75% Drink fluids before meals to feel full 2 12%
Weigh yourself every day 11 69% Not eat breakfast 1 6%
Keep busy to avoid eating 7 44% Avoid eating with the family 1 6%
Exercise to use up calories 7 44% Follow diet from magazine etc. 1 6%
Smoke cigarettes 6 37% Fast 0 0%
Choose low calorie/ diet foods 6 37% Follow a vegetarian/ vegan diet 0 0%
Avoid situations with food 5 31% Vomit after meals 0 0%
Prepare own food 4 25% Use laxatives (specify) 0 0%
Not eat lunch 3 19% Smoke marijuana 0 0%
Not eat dinner 3 19% Chew food and spit it out 0 0%
Follow your own homemade diet 3 19% Use slimming pills - prescription 0 0%
Not eat between meals 2 12% Use slimming pills – over the
counter 0 0%
Drink coffee 2 12% Use herbal preparations 0 0%
In terms of the frequency of which these methods were used, daily weighing was done most
frequently, followed by smoking cigarettes, and restricting food intake. The proportion of
responses to frequency of chronic weight-making methods used is illustrated in Figure 4.3.
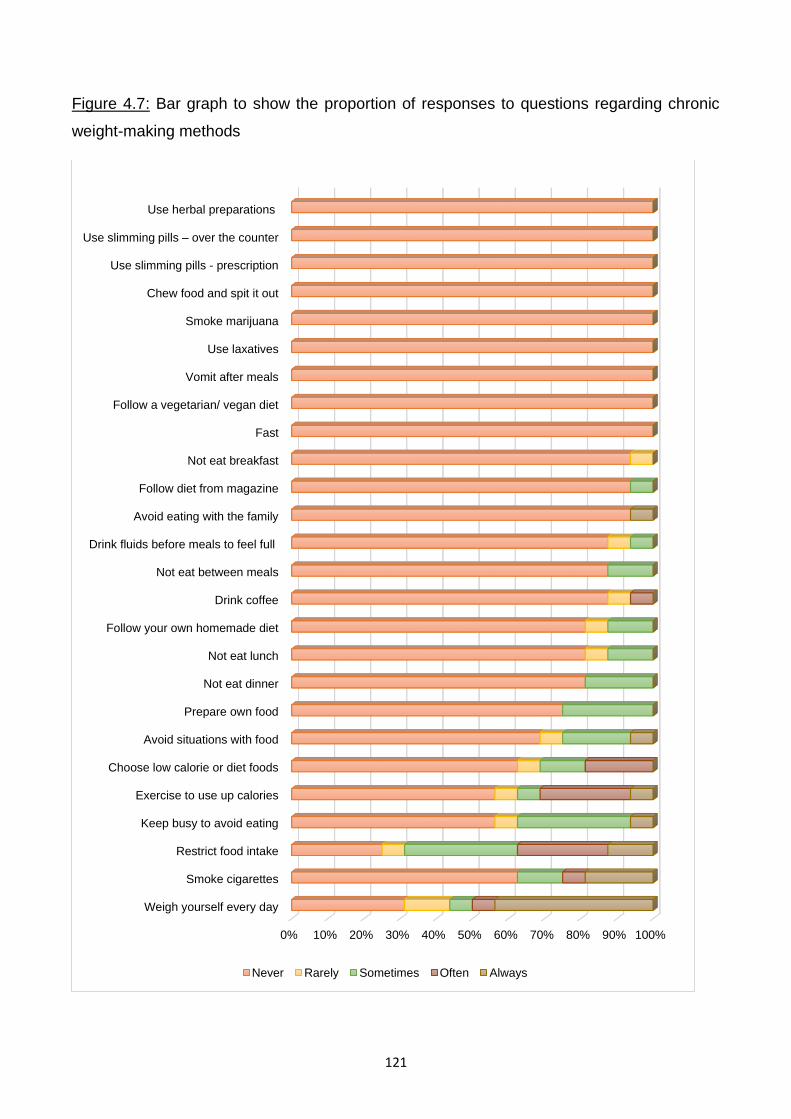
121
Figure 4.7: Bar graph to show the proportion of responses to questions regarding chronic
weight-making methods
0% 10% 20% 30% 40% 50% 60% 70% 80% 90% 100%
Weigh yourself every day
Smoke cigarettes
Restrict food intake
Keep busy to avoid eating
Exercise to use up calories
Choose low calorie or diet foods
Avoid situations with food
Prepare own food
Not eat dinner
Not eat lunch
Follow your own homemade diet
Drink coffee
Not eat between meals
Drink fluids before meals to feel full
Avoid eating with the family
Follow diet from magazine
Not eat breakfast
Fast
Follow a vegetarian/ vegan diet
Vomit after meals
Use laxatives
Smoke marijuana
Chew food and spit it out
Use slimming pills - prescription
Use slimming pills – over the counter
Use herbal preparations
Never Rarely Sometimes Often Always
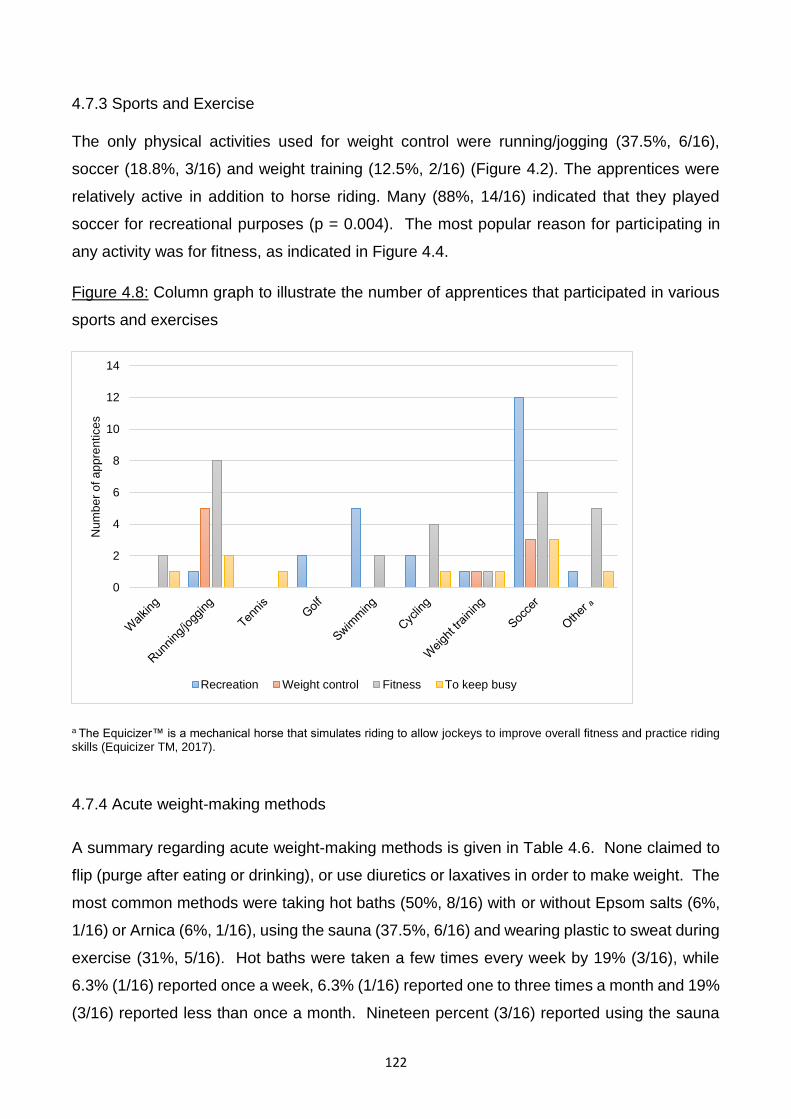
122
4.7.3 Sports and Exercise
The only physical activities used for weight control were running/jogging (37.5%, 6/16),
soccer (18.8%, 3/16) and weight training (12.5%, 2/16) (Figure 4.2). The apprentices were
relatively active in addition to horse riding. Many (88%, 14/16) indicated that they played
soccer for recreational purposes (p = 0.004). The most popular reason for participating in
any activity was for fitness, as indicated in Figure 4.4.
Figure 4.8: Column graph to illustrate the number of apprentices that participated in various
sports and exercises
a The Equicizer™ is a mechanical horse that simulates riding to allow jockeys to improve overall fitness and practice riding skills (Equicizer TM, 2017).
4.7.4 Acute weight-making methods
A summary regarding acute weight-making methods is given in Table 4.6. None claimed to
flip (purge after eating or drinking), or use diuretics or laxatives in order to make weight. The
most common methods were taking hot baths (50%, 8/16) with or without Epsom salts (6%,
1/16) or Arnica (6%, 1/16), using the sauna (37.5%, 6/16) and wearing plastic to sweat during
exercise (31%, 5/16). Hot baths were taken a few times every week by 19% (3/16), while
6.3% (1/16) reported once a week, 6.3% (1/16) reported one to three times a month and 19%
(3/16) reported less than once a month. Nineteen percent (3/16) reported using the sauna
0
2
4
6
8
10
12
14
Nu
mb
er
of a
pp
ren
tice
s
Recreation Weight control Fitness To keep busy
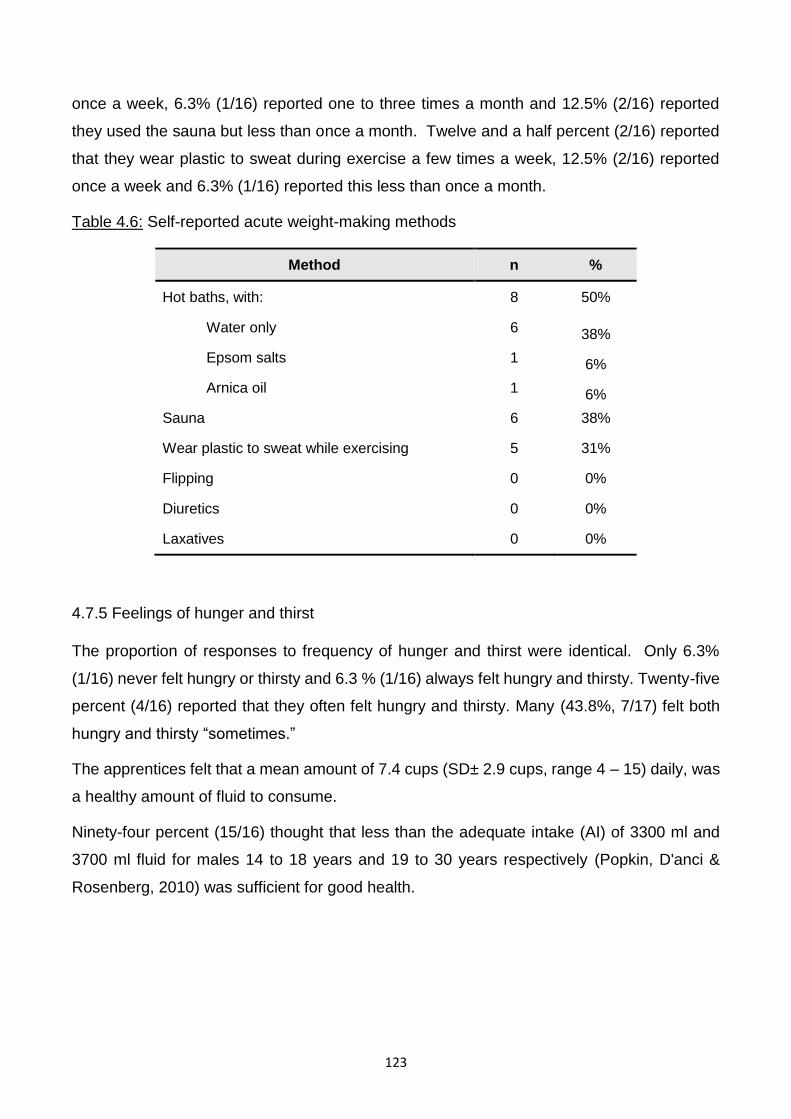
123
once a week, 6.3% (1/16) reported one to three times a month and 12.5% (2/16) reported
they used the sauna but less than once a month. Twelve and a half percent (2/16) reported
that they wear plastic to sweat during exercise a few times a week, 12.5% (2/16) reported
once a week and 6.3% (1/16) reported this less than once a month.
Table 4.6: Self-reported acute weight-making methods
Method n %
Hot baths, with: 8 50%
Water only 6 38%
Epsom salts 1 6%
Arnica oil 1 6%
Sauna 6 38%
Wear plastic to sweat while exercising 5 31%
Flipping 0 0%
Diuretics 0 0%
Laxatives 0 0%
4.7.5 Feelings of hunger and thirst
The proportion of responses to frequency of hunger and thirst were identical. Only 6.3%
(1/16) never felt hungry or thirsty and 6.3 % (1/16) always felt hungry and thirsty. Twenty-five
percent (4/16) reported that they often felt hungry and thirsty. Many (43.8%, 7/17) felt both
hungry and thirsty “sometimes.”
The apprentices felt that a mean amount of 7.4 cups (SD± 2.9 cups, range 4 – 15) daily, was
a healthy amount of fluid to consume.
Ninety-four percent (15/16) thought that less than the adequate intake (AI) of 3300 ml and
3700 ml fluid for males 14 to 18 years and 19 to 30 years respectively (Popkin, D'anci &
Rosenberg, 2010) was sufficient for good health.
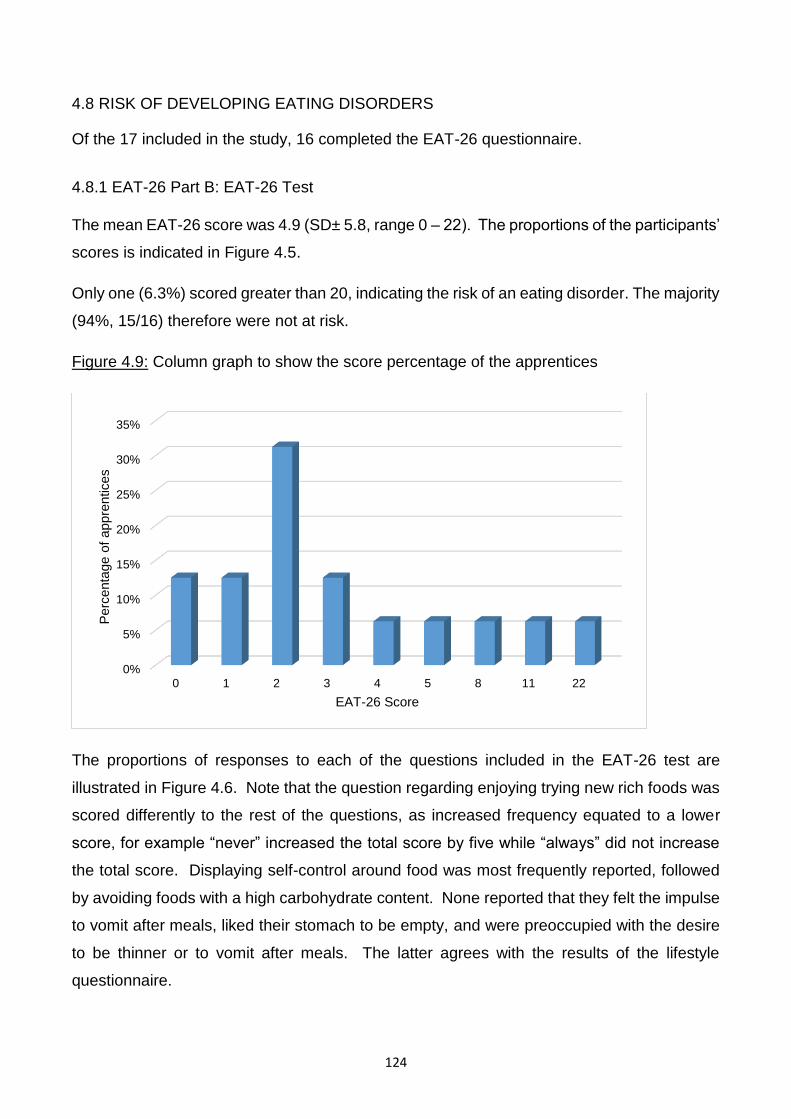
124
4.8 RISK OF DEVELOPING EATING DISORDERS
Of the 17 included in the study, 16 completed the EAT-26 questionnaire.
4.8.1 EAT-26 Part B: EAT-26 Test
The mean EAT-26 score was 4.9 (SD± 5.8, range 0 – 22). The proportions of the participants’
scores is indicated in Figure 4.5.
Only one (6.3%) scored greater than 20, indicating the risk of an eating disorder. The majority
(94%, 15/16) therefore were not at risk.
Figure 4.9: Column graph to show the score percentage of the apprentices
The proportions of responses to each of the questions included in the EAT-26 test are
illustrated in Figure 4.6. Note that the question regarding enjoying trying new rich foods was
scored differently to the rest of the questions, as increased frequency equated to a lower
score, for example “never” increased the total score by five while “always” did not increase
the total score. Displaying self-control around food was most frequently reported, followed
by avoiding foods with a high carbohydrate content. None reported that they felt the impulse
to vomit after meals, liked their stomach to be empty, and were preoccupied with the desire
to be thinner or to vomit after meals. The latter agrees with the results of the lifestyle
questionnaire.
0%
5%
10%
15%
20%
25%
30%
35%
0 1 2 3 4 5 8 11 22
Perc
enta
ge o
f appre
ntices
EAT-26 Score
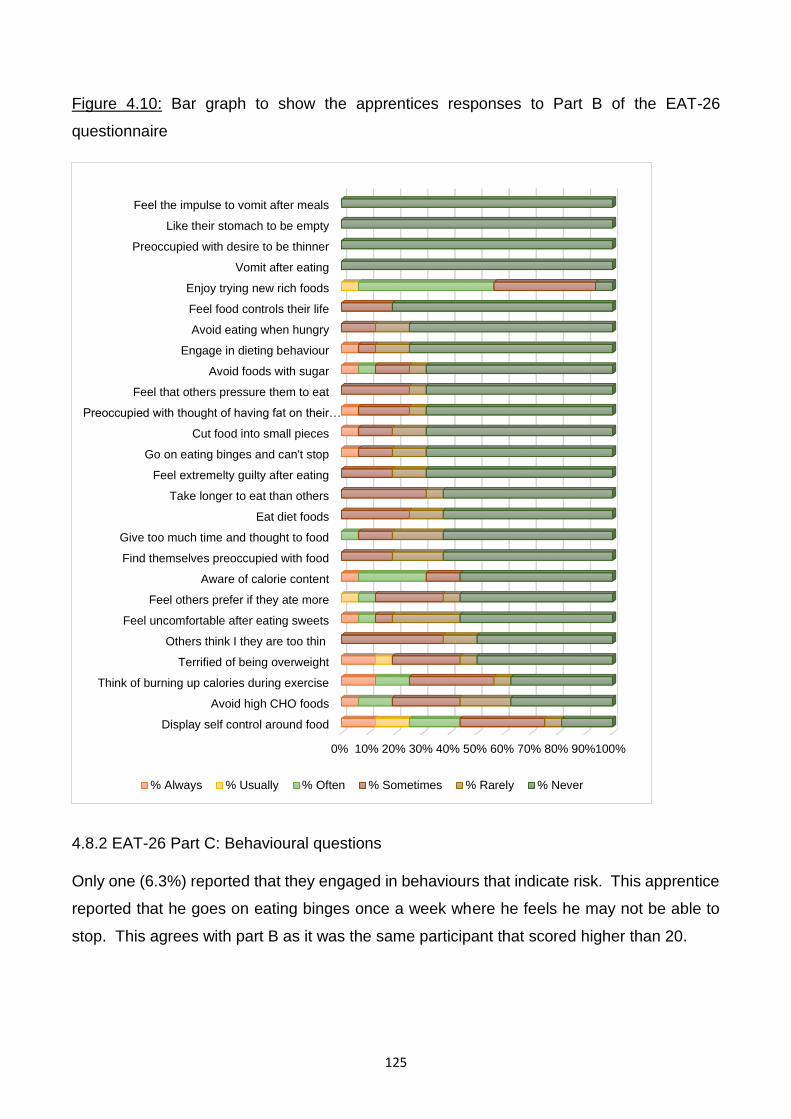
125
Figure 4.10: Bar graph to show the apprentices responses to Part B of the EAT-26
questionnaire
4.8.2 EAT-26 Part C: Behavioural questions
Only one (6.3%) reported that they engaged in behaviours that indicate risk. This apprentice
reported that he goes on eating binges once a week where he feels he may not be able to
stop. This agrees with part B as it was the same participant that scored higher than 20.
0% 10% 20% 30% 40% 50% 60% 70% 80% 90%100%
Display self control around food
Avoid high CHO foods
Think of burning up calories during exercise
Terrified of being overweight
Others think I they are too thin
Feel uncomfortable after eating sweets
Feel others prefer if they ate more
Aware of calorie content
Find themselves preoccupied with food
Give too much time and thought to food
Eat diet foods
Take longer to eat than others
Feel extremelty guilty after eating
Go on eating binges and can't stop
Cut food into small pieces
Preoccupied with thought of having fat on their…
Feel that others pressure them to eat
Avoid foods with sugar
Engage in dieting behaviour
Avoid eating when hungry
Feel food controls their life
Enjoy trying new rich foods
Vomit after eating
Preoccupied with desire to be thinner
Like their stomach to be empty
Feel the impulse to vomit after meals
% Always % Usually % Often % Sometimes % Rarely % Never
126
4.9 SUMMARY
The response rate was 84% and therefore an adequate representation of the population.
The mean USG when dehydrated was close to severe dehydration (1.027 g/ml, SD± 0.003,
range 1.021 - 1.032) and 24% (4/17) were classified as severely dehydrated.
For those 19 years or younger, 60% (6/10) were classified as moderately stunted (WHO
2007) which indicates either chronic malnutrition or as a result of genetics, however these
apprentices all had a normal BMI for age. Only one apprentice (6%), who was older than 19
years, was classified as moderately malnourished (BMI 16.0 - 16.9 kg/m2) when measured
euhydrated, and mildly malnourished (BMI 17.0 - 18.5 kg/m2) when dehydrated (Ralph et al.,
2000).
The mean %BF using DD was 9.5 % (SD± 2.8, range 4.5 – 14.1), when euhydrated which
was significantly lower than when dehydrated (11.8 %, SD± 4.6, range 5.9 – 24.2) (p = 0.025).
There was no significant correlation between %BF and BMI.
According to the classifications of Gallagher et al. (2000) and Borrud et al. (2011), 88%
(15/17) were underfat according to their %BF. Twelve percent (2/17) were underfat as their
%BF fell into the “essential” (3 - 6 %) range, meaning that these apprentices did not have
sufficient fat stores to protect FFM (Friedl et al., 1994). According to their FMI, 65% (15/17)
were classified as underfat. Eighteen percent (2/17) were classified as underlean according
to their FFMI.
Although %BF, as calculated by the BMI equation by Deurenberg et al. (1991), in both
hydration states was not significantly different from the reference method, the difference
between a %BF of 11.2% and 9.5% is considerable and they were ranked 29th and 32nd
overall for accuracy. This degree of overestimation could lead to excessive reduction of body
fat which is dangerous to the apprentices’ health.
The skinfold equation by Slaughter et al. (1988) was the most accurate method to determine
the %BF in the dehydrated state and was not affected by dehydration. It is a simple and
practical method involving only two skinfolds (triceps and medial calf). However it was only
age-appropriate for 59 % (10/17) of the apprentices. It can therefore be recommended for
apprentices 18 years and younger. This was followed by the seven skinfold equation by
Withers et al. (1987) using Brozek et al. (1963) when euhydrated, however it was significantly
127
affected by dehydration to the extent where it was not accurate in the dehydrated state,
therefore it is not appropriate for the apprentices. The Durnin & Womersley (1974) equation
for BD, using Brozek et al. (1963) to translate to %BF was ranked third and sixth when
dehydrated and euhydrated respectively. It was not significantly affected by dehydration and
was age-appropriate for 94 % (16/17) of the apprentices making it most appropriate for the
apprentices older than 18 years.
The equation by Van Loan et al. (1990) was the only BIA equation that did not differ from the
reference method in both hydration states and was also not significantly impacted by
dehydration.
Thirty-seven percent (6/16) reported weight dissatisfaction, but this was not associated with
age, height, BMI, FMI or FFMI. Weight dissatisfaction was however associated with a
significantly lower %BF according to the reference method and a close to significantly higher
body weight.
Restricting food intake, daily weighing, keeping busy and exercising were the most commonly
reported chronic weight-making methods. The only physical activities reported to be used
for weight control were running/jogging, soccer and weight training, although most physical
activities were used for fitness as opposed to weight control.
The most frequently reported acute weight-making method reported was the use of hot baths
with or without Epsom salts or Arnica oil, followed by the use of saunas and sweat suits.
Ninety-four percent reported that they feel both hungry and thirsty at least sometimes and of
these 25% reported that they often feel both hungry and thirsty. The majority (94%, 15/16)
thought that less than the AI of daily fluid is sufficient for good health.
The mean EAT-26 score was 4.87 (SD± 5.84, range 0 – 22). Only one (6%) could be
classified as at risk of eating disorders. The same apprentice was the only one who reported
engaging in behaviours that indicate risk, which was going on eating binges once a week
where he feels he may not be able to stop.
128
CHAPTER 5: DISCUSSION
5.1 INTRODUCTION
This chapter will discuss the findings of this study with regards to hydration status,
anthropometry, FFM, %BF, FMI, the accuracy of methods to estimate %BF, the prevalence
of weight-making and weight control techniques and the risk of eating disorders.
5.2 HYDRATION STATUS
When not following any protocol for data collection, all participants were dehydrated
according to their USG (Casa et al., 2000) of which 81% were moderately dehydrated while
19% were severely dehydrated. An upon-waking USG value less 1.020 g/ml has been used
to indicate a state of euhydration according to Casa, Clarkson & Roberts (2005). Therefore,
a USG greater than 1.020 g/ml, upon waking, can be considered an indication of chronic
dehydration if no intervention was taken to ensure dehydration. The dehydrated USG was
measured on a non-race day with no “light” rides pending, therefore there was no reason to
dehydrate acutely and acute dehydration does not occur while sleeping. This result was
unexpected as the apprentices were at acceptable handicapping weights and did not need
to dehydrate to make weight. Since this data was collected, education regarding proper
hydration practises and monthly USG assessments have taken place, which has decreased
the prevalence of dehydration among the apprentices (Mrs K Krog 2017, personal
communication, 27 November).
The USG results of the present study were extremely concerning as the mean USG on a
non-race day was similar to or greater than that of apprentice and professional jockeys on
race days. The mean USG (1.027 g/ml) was greater than that reported by other studies on
jockeys, although only one had investigated this in apprentices. Cullen et al. (2015)
measured the USG of ten male jockey apprentices on two separate race days at their
“normal” weight2 and at their “light” weight.3 At their “normal” weight, the apprentices mean
USG was 1.017 g/ml (euhydrated) which was considerably lower than that of this study. At
their “light” weight, their mean USG was significantly higher (1.026 g/ml) although this was
still lower than the SAJA apprentices on a non-race day. This suggests that chronic
2 This implied that the handicaps were similar to that of their current weight therefore acute weight-making
methods were not necessitated.
3 This implied that the handicaps were set closer to the minimum weight range.
129
dehydration is more prevalent and severe among the apprentices at the SAJA than that of
other apprentices.
Most studies on professional jockeys have reported a non-race day USG of between 1.021
to 1.022 g/ml which was just within the range of dehydration. Dolan, McGoldrick, Mac Manus,
O'Gorman, Moyna & Warrington (2007) measured the USG of 11 male professional jump and
flat jockeys on both a non-race and race day. The mean USG was 1.022 g/ml on a non-race
day and 1.028 g/ml on a race day, which was similar to that of the present study on a non-
race day. On typical race days however, Benardot et al. (2008) reported a considerably lower
mean USG of 1.021 g/ml in 47 male American flat jockeys which was similar to what
Warrington et al. (2009) found in 27 flat and jump jockeys on a non-race day (mean USG
1.022 g/ml). Dolan et al. (2013) measured the USG of five jump and four flat professional
jockeys before and after reducing their body mass by 4 % of their baseline measure
mimicking the acute weight-making methods they typically would use before racing. The
mean USG was 1.019 g/ml (hydrated) prior to 4% weight loss and 1.028 g/ml (moderately
dehydrated) after 4% weight loss.
Acute and chronic dehydration can have negative consequences for both jockeys and
apprentices. In terms of physical performance, Wilson et al. (2013b) reported a significant
increase in heart rate and rate of perceived exertion, and a significant reduction in chest and
leg strength and pushing frequency in eight male professional jump and flat jockeys after a
2% induced acute weight loss despite the USG only being borderline dehydrated (mean urine
osmolality 514 mOsmols/kg which is equivalent to 1.020 g/ml).4 Dolan et al. (2013) reported
a significantly reduced peak work capacity as a result of acute dehydration (4% weight loss
over 48 hours) in professional jockeys with a mean USG of 1.028 g/ml when compared with
age-, gender-, and BMI-matched euhydrated controls, who were not jockeys. Acute weight-
loss by dehydration therefore impairs the physical performance of professional jockeys, which
has negative implications on their chance of winning, as well as their risk of falling.
In terms of cognitive function, a significant impact by dehydration has not been reported in
jockeys. The study by Dolan et al. (2013) reported no significant impact on cognitive function,
in terms of motor response, decision making, executive function, and working memory.
Cullen et al. (2015) conducted two experimental trials involving 12 and ten flat jockey
4 Cut-off for moderate dehydration is 700 mOsmols/kg (Kenefick et al., 2012).
130
apprentices in a simulated (USG 1.032 g/ml) and competitive race environment (USG 1.026
g/ml) respectively and reported no significant impact on simple reaction time 5 and memory
as a result of acute moderate and severe dehydration.
In general, chronic dehydration has been associated with impaired renal function (García-
Trabanino et al., 2015). In the descriptive study by Labadarios et al. (1993), five percent
(5/93) of the South African flat jockeys reported renal complaints, which included kidney
stones and haematuria post-race meeting. Wilson et al. (2013a) measured the markers of
kidney and liver function in 19 flat and 18 jump male elite professional jockeys in England
and reported no abnormalities. Cullen, Donohoe, McGoldrick, McCaffrey, Davenport, Byrne,
Donaghy, Tormey, Smith & Warrington (2016) claimed that four percent (1/28) of the retired
Irish flat jockeys reported the loss of a kidney after retiring. However, these statistics were
lower than the prevalence of chronic kidney disease in the general population of South Africa
(14%) (Stanifer, Jing, Tolan, Helmke, Mukerjee, Naicker & Patel, 2014), England (6%)
(Barron, 2014) and Ireland (11%) (Stack, Casserly, Cronin, Chernenko, Cullen, Hannigan,
Saran, Johnson, Browne & Ferguson, 2014) implying that the prevalence in the
aforementioned jockey studies is not a concern as it was relatively low.
Therefore, although there is limited evidence to indicate reduced cognitive function and renal
dysfunction as a result of acute and chronic dehydration in jockeys, it can negatively impact
racing performance by reducing peak work capacity, increasing heart rate and rate of
perceived exertion and reducing chest and leg strength and pushing frequency. Accurately
measuring %BF and optimising body composition may help to reduce the need for deleterious
weight-making methods which involve dehydration and therefore protect the health and
performance of the jockeys.
5.3 ANTHROPOMETRY
5.3.1 Height
The stunting experienced by 60% of those under 19 years may have been the result of either
chronic malnutrition during childhood or genetics.
5 The time required for a subject to initiate a prearranged response to a defined stimulus, which is used as an
indicator of cognitive function (Merriam-Webster, 2017).
131
According to Jinabhai, Reddy, Taylor, Monyeki, Kamabaran, Omardien & Sullivan (2007), the
prevalence of stunting amongst 2398 black male teenagers, aged 13.0–17.9 years, in South
Africa was 22%, based on the data of the South African Youth Risk Behaviour Survey (YRBS)
of 2002. These figures were higher than those in the SANHANES-1 report for 2012 which
was 15.2% amongst South African children aged ten to 14 years (Shisana et al., 2014). Of
the six apprentices who were classified as stunted, three (50%) came from lower income
groups, which could indicate chronic malnutrition as a result of poor food security as stunting
is associated with a poor socio-economic background. Stunting as a result of chronic
malnutrition further exacerbates the negative implications for the apprentices as it is
significantly correlated with poor BMD and BMC (Martins, Toledo Florêncio, Grillo, Do Carmo
P Franco, Martins, Clemente, Santos, Vieira & Sawaya, 2011), which could increase the risk
of fractures from falls.
5.3.2 Body mass index
The hypothesis that the mean BMI of the apprentices would be close to the minimum cut-off
range for normal BMI with a high prevalence of underweight, can be rejected.
The euhydrated mean BMI (19.2 kg/m2) was normal, with only one being underweight. Table
5.1 compares the anthropometry with that of other jockey studies. The mean BMI therefore
was comparable to that of most apprentice studies which ranged from 18.8 (Krog, 2015) to
20.5 kg/m2 (Moore et al., 2002a; Leydon & Wall, 2002; Silk et al., 2015) except for the higher
BMI (22.7 kg/m2) reported by Cullen et al. (2015). Neither Moore et al. (2002b) nor Leydon
& Wall (2002) differentiated the mean BMI between the male and female apprentices.
The mean BMI of professional jockeys was slightly higher than that of the apprentices - this
ranged from 19.4 to 20.7 (Labadarios et al., 1993; Moore et al., 2002a; Leydon & Wall, 2002;
Warrington et al., 2009; Dolan et al., 2009; Cotugna et al., 2011; Dolan et al., 2012a; Wilson
et al., 2012b; Wilson et al., 2013a; Dolan et al., 2013; O’Reilly et al., 2017; Jackson et al.,
2017) except for Dolan et al. (2012b) who reported a mean BMI of 21.4 kg/m2.
Theoretically, as the mean BMI was above the lower limit of the normal range (18.5 kg/m2)
there was scope for some to reduce weight. The BMI however must be interpreted in
conjunction with their %BF and FFM as their %BF is the component that needs to be reduced
and a high BMI could be a result of a high FFM.
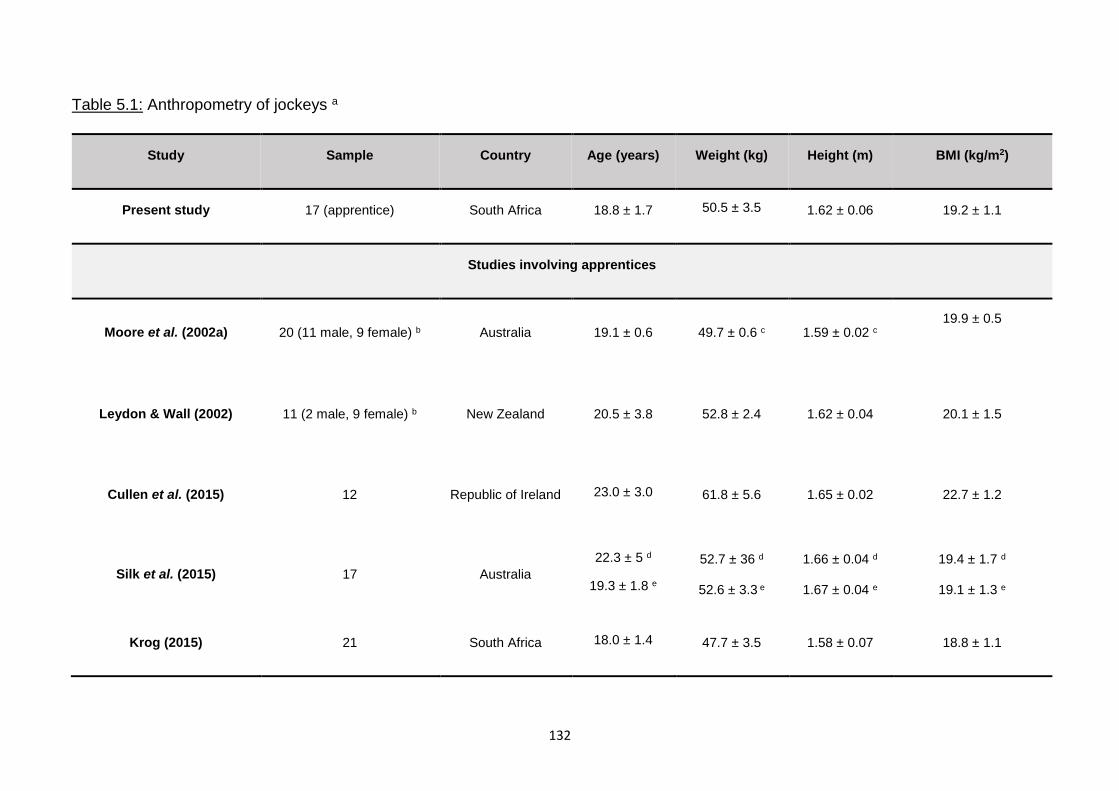
132
Table 5.1: Anthropometry of jockeys a
Study Sample Country Age (years) Weight (kg) Height (m) BMI (kg/m2)
Present study 17 (apprentice) South Africa 18.8 ± 1.7 50.5 ± 3.5 1.62 ± 0.06 19.2 ± 1.1
Studies involving apprentices
Moore et al. (2002a) 20 (11 male, 9 female) b Australia 19.1 ± 0.6 49.7 ± 0.6 c 1.59 ± 0.02 c 19.9 ± 0.5
Leydon & Wall (2002) 11 (2 male, 9 female) b New Zealand 20.5 ± 3.8 52.8 ± 2.4 1.62 ± 0.04 20.1 ± 1.5
Cullen et al. (2015) 12 Republic of Ireland 23.0 ± 3.0 61.8 ± 5.6 1.65 ± 0.02 22.7 ± 1.2
Silk et al. (2015) 17 Australia
22.3 ± 5 d
19.3 ± 1.8 e
52.7 ± 36 d
52.6 ± 3.3 e
1.66 ± 0.04 d
1.67 ± 0.04 e
19.4 ± 1.7 d
19.1 ± 1.3 e
Krog (2015) 21 South Africa 18.0 ± 1.4 47.7 ± 3.5 1.58 ± 0.07 18.8 ± 1.1
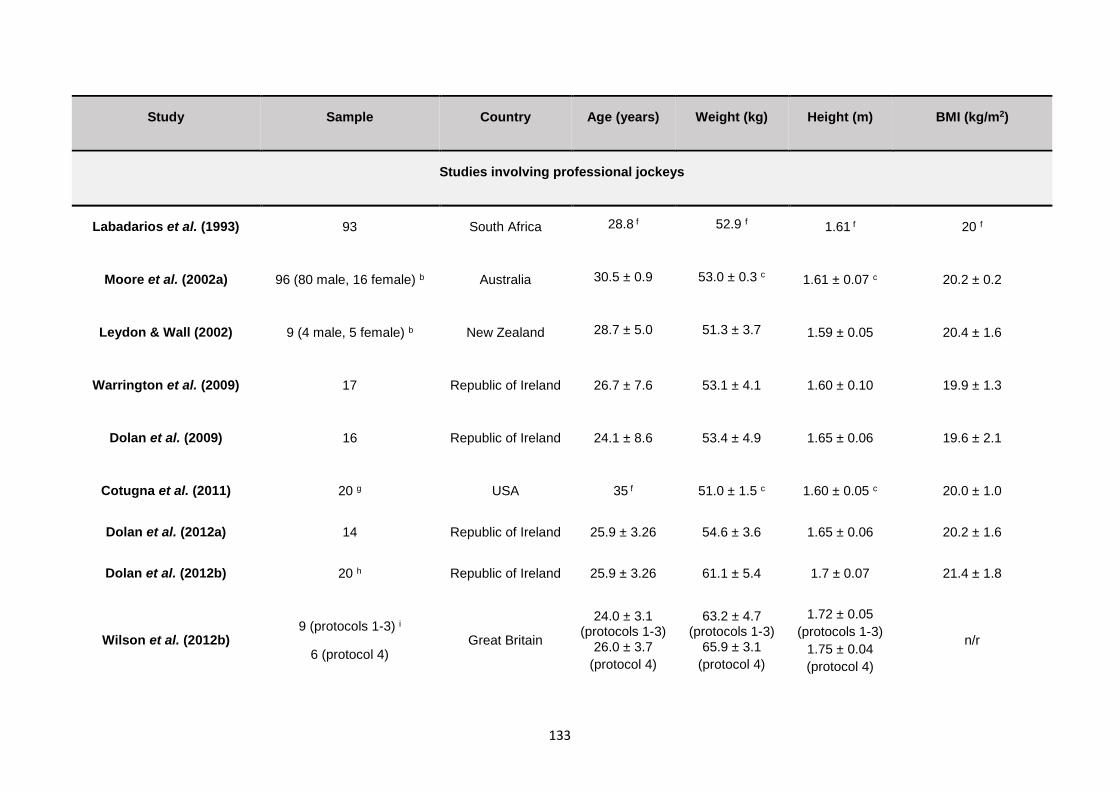
133
Study Sample Country Age (years) Weight (kg) Height (m) BMI (kg/m2)
Studies involving professional jockeys
Labadarios et al. (1993) 93 South Africa 28.8 f 52.9 f 1.61 f 20 f
Moore et al. (2002a) 96 (80 male, 16 female) b Australia 30.5 ± 0.9 53.0 ± 0.3 c 1.61 ± 0.07 c 20.2 ± 0.2
Leydon & Wall (2002) 9 (4 male, 5 female) b New Zealand 28.7 ± 5.0 51.3 ± 3.7 1.59 ± 0.05 20.4 ± 1.6
Warrington et al. (2009) 17 Republic of Ireland 26.7 ± 7.6 53.1 ± 4.1 1.60 ± 0.10 19.9 ± 1.3
Dolan et al. (2009) 16 Republic of Ireland 24.1 ± 8.6 53.4 ± 4.9 1.65 ± 0.06 19.6 ± 2.1
Cotugna et al. (2011) 20 g USA 35 f 51.0 ± 1.5 c 1.60 ± 0.05 c 20.0 ± 1.0
Dolan et al. (2012a) 14 Republic of Ireland 25.9 ± 3.26 54.6 ± 3.6 1.65 ± 0.06 20.2 ± 1.6
Dolan et al. (2012b) 20 h Republic of Ireland 25.9 ± 3.26 61.1 ± 5.4 1.7 ± 0.07 21.4 ± 1.8
Wilson et al. (2012b) 9 (protocols 1-3) i
6 (protocol 4) Great Britain
24.0 ± 3.1 (protocols 1-3)
26.0 ± 3.7
(protocol 4)
63.2 ± 4.7 (protocols 1-3)
65.9 ± 3.1
(protocol 4)
1.72 ± 0.05
(protocols 1-3)
1.75 ± 0.04
(protocol 4)
n/r
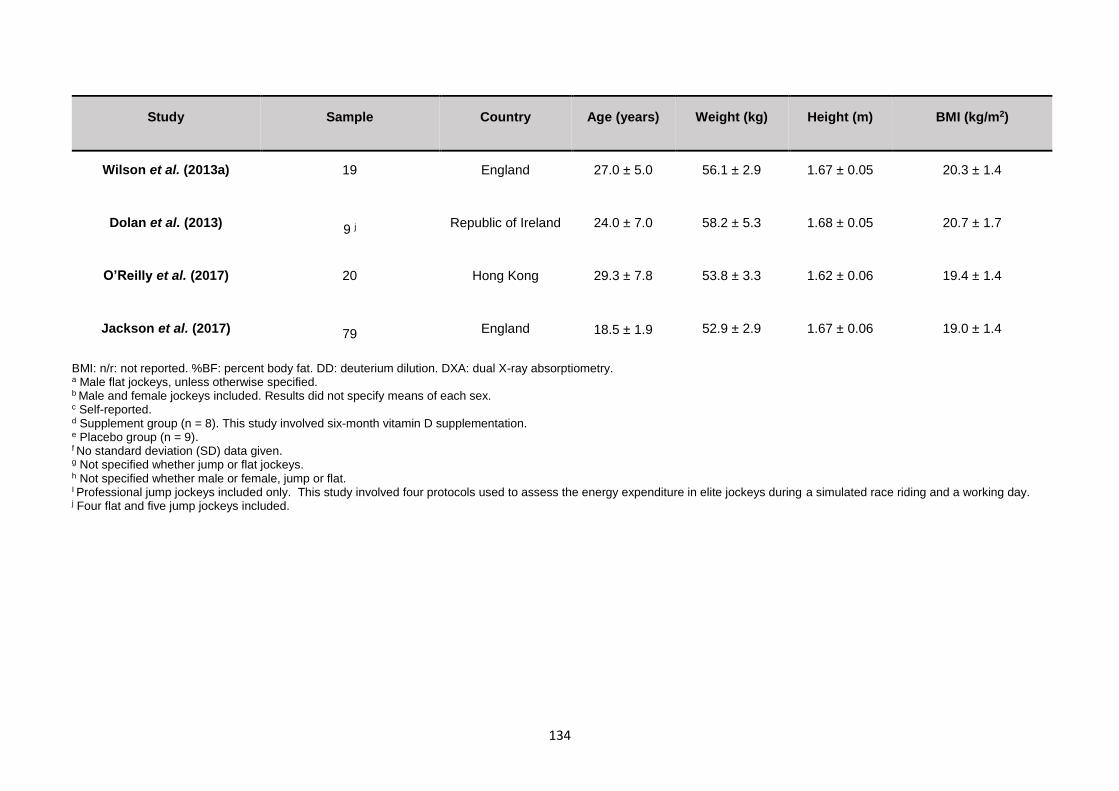
134
Study Sample Country Age (years) Weight (kg) Height (m) BMI (kg/m2)
Wilson et al. (2013a) 19 England 27.0 ± 5.0 56.1 ± 2.9 1.67 ± 0.05 20.3 ± 1.4
Dolan et al. (2013) 9 j
Republic of Ireland 24.0 ± 7.0 58.2 ± 5.3 1.68 ± 0.05 20.7 ± 1.7
O’Reilly et al. (2017) 20 Hong Kong 29.3 ± 7.8 53.8 ± 3.3 1.62 ± 0.06 19.4 ± 1.4
Jackson et al. (2017) 79 England 18.5 ± 1.9 52.9 ± 2.9 1.67 ± 0.06 19.0 ± 1.4
BMI: n/r: not reported. %BF: percent body fat. DD: deuterium dilution. DXA: dual X-ray absorptiometry. a Male flat jockeys, unless otherwise specified. b Male and female jockeys included. Results did not specify means of each sex. c Self-reported. d Supplement group (n = 8). This study involved six-month vitamin D supplementation. e Placebo group (n = 9). f No standard deviation (SD) data given. g Not specified whether jump or flat jockeys. h Not specified whether male or female, jump or flat. I Professional jump jockeys included only. This study involved four protocols used to assess the energy expenditure in elite jockeys during a simulated race riding and a working day. j Four flat and five jump jockeys included.
135
5.4 BODY COMPOSITION
5.4.1 Fat-free mass
The hypothesis that the mean FFM of the apprentices would be normal was accepted.
The mean FFMI (17.4 kg/m2) was within the normal ranges, even when the cut-offs for
each age group were taken into consideration. Table 5.2 summarises the FFMI, %BF
and FMI reported by studies on jockeys. No studies have reported the FFMI of
apprentices. The mean age (18.5 years) of the professional jockeys from the study by
Jackson et al. (2017) was similar to the present study (18.8 years) and is therefore
comparable as FFMI is affected by age (Bahadori et al., 2006; Weber et al., 2013).
The present study reports a considerably higher mean FFMI than that of Jackson et
al. (2017) (15.3 kg/m2). Since the minimum cut-off values of a normal FFMI for males
18 years and older is 16.7 kg/m2, the jockeys in the study by Jackson et al. (2017)
were underlean while those in the present study were normal. Older jockeys had a
higher FFMI as reported by Dolan et al. (2012a) (18.2 kg/m2) and Dolan et al. (2012b)
(18.3 kg/m2). This is not surprising as FFMI is reported to increase with age during
early adulthood in males and females (Bahadori et al., 2006; Weber et al., 2013).
Twelve percent (2/17) of the apprentices in the present study were underlean overall.
One was also classified as underweight according to his BMI, although his %BF was
normal. The other had a BMI close to the minimum acceptable value and his %BF
was normal. It is recommended that these two increase their FFM through strength
training and diet to avoid the negative consequences of an inadequate FFM.
Adequate FFM is important in horse racing as higher levels are associated with better
postural balance (Alonso et al., 2012) which could assist the jockey to remain stable
and maintain control while riding and reduce the risk of falls. Adequate FFM is also
associated with higher BMD in athletes and non-athletes (Gjesdal, Halse, Eide, Brun
& Tell, 2008; Dolan et al., 2012a), which is also important to prevent fractures as a
result of a fall. Maintaining FFM is also essential to sustained weight loss as it is
positively correlated with RMR (Cunningham, 1991).
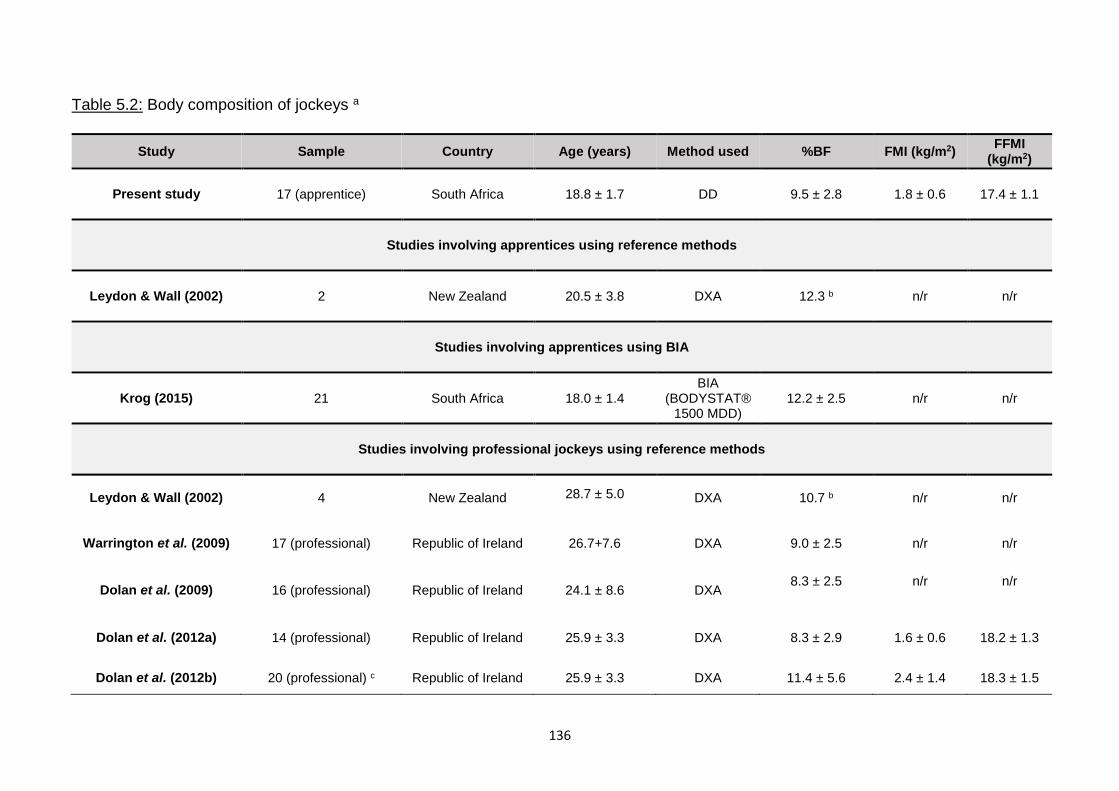
136
Table 5.2: Body composition of jockeys a
Study Sample Country Age (years) Method used %BF FMI (kg/m2) FFMI
(kg/m2)
Present study 17 (apprentice) South Africa 18.8 ± 1.7 DD 9.5 ± 2.8 1.8 ± 0.6 17.4 ± 1.1
Studies involving apprentices using reference methods
Leydon & Wall (2002) 2 New Zealand 20.5 ± 3.8 DXA 12.3 b n/r n/r
Studies involving apprentices using BIA
Krog (2015) 21 South Africa 18.0 ± 1.4 BIA
(BODYSTAT®1500 MDD)
12.2 ± 2.5 n/r n/r
Studies involving professional jockeys using reference methods
Leydon & Wall (2002) 4 New Zealand 28.7 ± 5.0 DXA 10.7 b n/r n/r
Warrington et al. (2009) 17 (professional) Republic of Ireland 26.7+7.6 DXA 9.0 ± 2.5 n/r n/r
Dolan et al. (2009) 16 (professional) Republic of Ireland 24.1 ± 8.6 DXA 8.3 ± 2.5 n/r n/r
Dolan et al. (2012a) 14 (professional) Republic of Ireland 25.9 ± 3.3 DXA 8.3 ± 2.9 1.6 ± 0.6 18.2 ± 1.3
Dolan et al. (2012b) 20 (professional) c Republic of Ireland 25.9 ± 3.3 DXA 11.4 ± 5.6 2.4 ± 1.4 18.3 ± 1.5
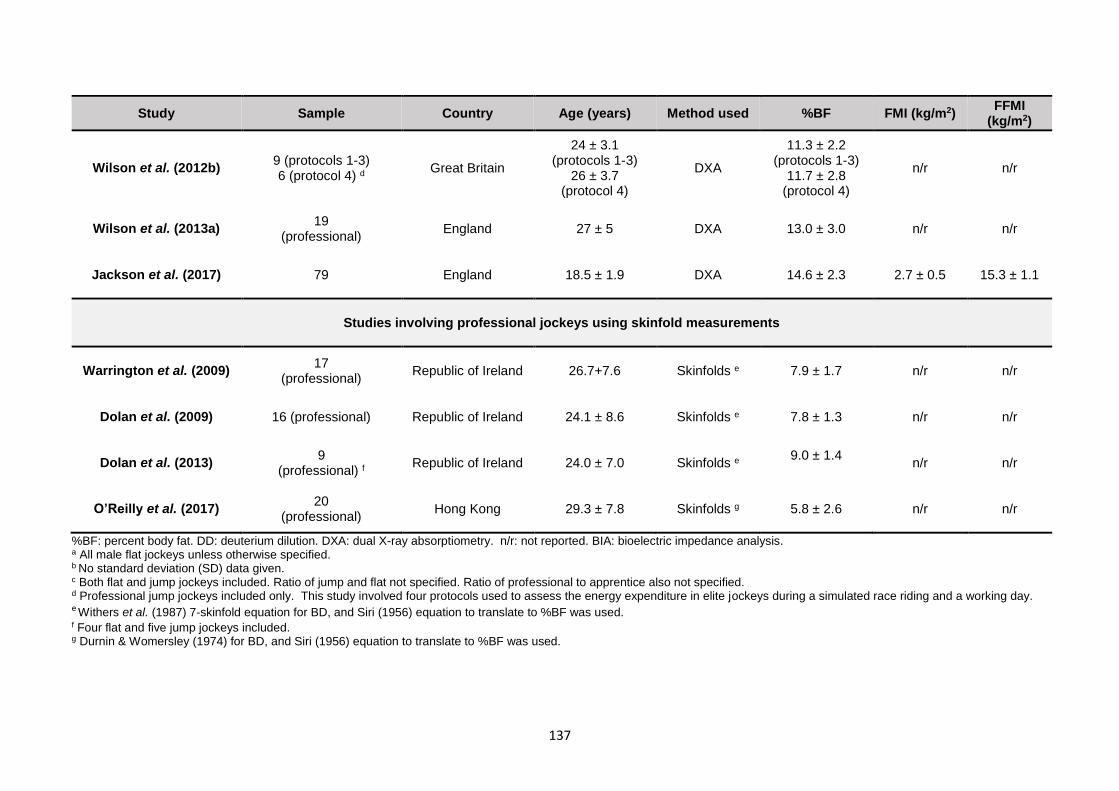
137
Study Sample Country Age (years) Method used %BF FMI (kg/m2) FFMI
(kg/m2)
Wilson et al. (2012b) 9 (protocols 1-3) 6 (protocol 4) d Great Britain
24 ± 3.1 (protocols 1-3)
26 ± 3.7 (protocol 4)
DXA
11.3 ± 2.2 (protocols 1-3)
11.7 ± 2.8 (protocol 4)
n/r n/r
Wilson et al. (2013a) 19
(professional) England 27 ± 5 DXA 13.0 ± 3.0 n/r n/r
Jackson et al. (2017) 79 England 18.5 ± 1.9 DXA 14.6 ± 2.3 2.7 ± 0.5 15.3 ± 1.1
Studies involving professional jockeys using skinfold measurements
Warrington et al. (2009) 17
(professional) Republic of Ireland 26.7+7.6 Skinfolds e 7.9 ± 1.7 n/r n/r
Dolan et al. (2009) 16 (professional) Republic of Ireland 24.1 ± 8.6 Skinfolds e 7.8 ± 1.3 n/r n/r
Dolan et al. (2013) 9
(professional) f Republic of Ireland 24.0 ± 7.0 Skinfolds e 9.0 ± 1.4
n/r n/r
O’Reilly et al. (2017) 20
(professional) Hong Kong 29.3 ± 7.8 Skinfolds g 5.8 ± 2.6 n/r n/r
%BF: percent body fat. DD: deuterium dilution. DXA: dual X-ray absorptiometry. n/r: not reported. BIA: bioelectric impedance analysis. a All male flat jockeys unless otherwise specified. b No standard deviation (SD) data given. c Both flat and jump jockeys included. Ratio of jump and flat not specified. Ratio of professional to apprentice also not specified. d Professional jump jockeys included only. This study involved four protocols used to assess the energy expenditure in elite jockeys during a simulated race riding and a working day. e Withers et al. (1987) 7-skinfold equation for BD, and Siri (1956) equation to translate to %BF was used. f Four flat and five jump jockeys included. g Durnin & Womersley (1974) for BD, and Siri (1956) equation to translate to %BF was used.
138
5.4.2 Percent body fat and fat mass index
5.4.2.1 Percent body fat
The hypothesis that the %BF of the apprentices would be high relative to professional jockeys
was rejected.
The present study was the only study in South Africa to use a gold standard reference method
to measure the %BF of apprentices.
The mean %BF (9.5 %) was much lower than that of other apprentices as reported by Leydon
& Wall (2002) using DEXA (12.3%) and Krog (2015) using BIA (BODYSTAT®1500 MDD)
(12.2%) (Table 5.2). The mean %BF fell within the lower range (8.3 to 14.6 %) of professional
jockeys (Leydon & Wall (2002); Warrington et al., 2009; Dolan et al., 2009; Dolan et al.,
2012a; Dolan et al., 2012b; Wilson et al., 2012b; Wilson et al., 2013a; Jackson et al., 2017)
(Table 5.2). Labadarios et al. (1993) reported a mean %BF of 11.0 % for South African
professional jockeys using skinfold measurements, with an undisclosed equation involving
four unknown skinfold sites. The apprentices at the SAJA were already making a concerted
effort to attain a lower %BF in line with the professional jockeys.
Although the jockeys in the study by Warrington et al. (2009), were measured on a non-race
day, the mean USG (1.022 g/ml) indicated moderate dehydration. The %BF results of
Warrington et al. (2009) (7.9 %) were similar to that of the present study when %BF was
calculated using the Withers et al. (1987) equation with the Siri (1961) equation and the
apprentices were dehydrated (7.4 %). The %BF results of study by Dolan et al. (2009) (7.8
%) were also similar to that of the present study when the Withers et al. (1987) equation with
the Siri (1961) equation when the apprentices were dehydrated, although Dolan et al. (2009)
did not test hydration status. When compared to DXA, Dolan et al. (2009) found that skinfolds
significantly underestimated %BF. Dolan et al. (2013) ensured euhydration prior to skinfold
measurement and reported similar %BF results (9.0 %) to that of present study when the
Withers et al. (1987) equation with the Siri (1961) equation when the apprentices were
euhydrated (9.0 %). It can de deduced that the %BF results in these studies were
underestimated by skinfolds. The Durnin & Womersley (1974) skinfold equation, together
with the Siri (1961) equation, was used in a study involving male professional flat jockeys in
Hong Kong by O’Reilly et al. (2017). The %BF results of this study (5.8 %) were notably
139
lower than that of the present study when the Durnin & Womersley (1974) equation was used
with Siri (1961) when euhydrated (8.8 %) or dehydrated (9.2 %). This result is surprising as
a number of studies have indicated that %BF for a given BMI is significantly greater in Asian
populations when compared to white and black populations (Wang, Thornton, Russell,
Burastero, Heymsfield & Pierson, 1994; Deurenberg, Yap & Van Staveren, 1998;
Deurenberg, Deurenberg‐Yap & Guricci, 2002; Gallagher et al., 2000).
The lower limit of body fat (essential fat) in healthy active men is four to six percent or ~2.5
kg according to Friedl et al. (1994). Although Friedl et al. (1994) only described the essential
%BF range for adult men (18 years and older), the occurrence of such a low %BF in an
apprentice younger than 18 years can be considered more severe as the lower limit of normal
%BF for children is higher than that of adults (Borrud et al., 2011). There is no known lower
limit for children and adolescents. Despite a normal BMI, a few (12%) fell within this essential
fat range, and therefore had insufficient fat stores and should be prevented from reducing
their weight further. They can be encouraged to gain weight as essential fat has a number
of important functions. Fat tissue secretes adipokines which are involved in bone physiology
regulation (Gomez-Ambrosi, Rodriguez, Catalan & Frühbeck, 2008) therefore insufficient fat
stores may compromise bone health and increase the risk of fractures. Fat tissue also has a
mechanical protective effect as layers of subcutaneous adipose tissue cushion the limbs and
internal organs from physical trauma such as falls and blows (Norgan, 1997b). Warrington
et al. (2009) suggested that the combination of low BMD, dehydration and low %BF was
associated with the high incidence of fractures seen in professional male jockeys. Low levels
of essential fat therefore could have a detrimental impact on the jockey/apprentice’s career.
It is important to have a small amount of storage fat, over and above the essential fat, to avoid
the risk of compromising FFM when there is an energy deficit as once the essential fat level
has been reached, muscle is catabolised for energy (Friedl et al. (1994). Therefore rather
than using the essential fat ranges, the normal ranges of %BF as recommended by Borrud
et al. (2011) and Gallagher et al. (2000) were used in the present study.
According to these recommendations of Borrud et al. (2011) and Gallagher et al. (2000), 88%
(15/17) were underfat. The mean %BF of the apprentices who were younger than 20 years
was 10.2 %, which was lower than the lower limit for normal %BF (13.7 %) for this age group
according to Borrud et al. (2011). The mean %BF of the apprentices 20 years and older was
7.3 %, which was also lower than the lower limit of normal %BF (8 %) for this age group
140
according to Gallagher et al. (2000). Four of the apprentices (24%) had the potential to
reduce their %BF to the lower limit of normal for their respective age group.
Each individual apprentice needs to be carefully assessed therefore taking into consideration
his body composition and handicapping demands before deciding what %BF would be
appropriate for them. It is not recommended that all of the apprentices reduce their FM as
this presents a high risk of compromising FFM. These results are not in agreement with the
BMI results which indicate scope for further reduction of weight (mean 19.2 kg/m2). This
further emphasises the need to measure body composition as opposed to weight and BMI.
5.4.2.2 Fat mass index
According to FMI, 65 % (11/17) of the apprentices were underfat, as opposed to 88 % when
using %BF. The mean FMI for those younger than 18 years (1.8 kg/m2) is low according to
Weber et al. (2013) and the mean FMI for those 18 years and older (1.8 kg/m2) was just within
the normal range according to Schutz et al. (2002). Five of the apprentices (29%), had the
potential to reduce their FMI to the lower limit of normal for their respective age groups. Only
one of these apprentices also had a %BF that showed scope for reduction. It can be noted
that there are large gaps between the lower limit of normal %BF for the under 20 year age
group (13.7 %) (Borrud et al., 2011), and the 20 years and older age group (8 %) (Gallagher
et al., 2000). The same can be said for the lower limit of normal FMI for the under 18 year
age group (2.7 kg/m2) (Weber et al., 2013), and 18 years and older age group (1.8 kg/m2)
(Schutz et al., 2002). Therefore, both the %BF and FMI should be considered before the
decision to reduce FM is made. It can be recommended that whichever classification
indicates scope for loss of FM be used as both classifications allow for an amount of storage
fat to prevent muscle catabolism.
5.5 ACCURACY OF METHODS TO ESTIMATE PERCENT BODY FAT
5.5.1 Body mass index
The hypothesis that using BMI to calculate %BF would not provide accurate %BF results and
would be significantly impacted by dehydration was rejected.
Although the %BF values calculated from the Deurenberg et al. (1991) BMI equation were
not significantly different to the reference method according to the Wilcoxon signed ranks
141
test, and were not significantly affected by dehydration, the Bland-Altman analysis showed
that there was unacceptable bias. This degree of overestimation could lead to excessive
reduction of body fat which is dangerous to the apprentices’ health. A weak relationship
between BMI and %BF has been found in athletes and non-athletes with a BMI less than 25
kg/m2 (Nevill et al., 2006; Meeuwsen et al., 2010a; Kupusinac, Stokić, Sukić, Rankov & Katić,
2017). Calculating %BF from BMI is therefore not recommended for the apprentice
population.
5.5.2 Skinfold measurements
The hypotheses that regression equations using skinfolds would underestimate %BF in both
the euhydrated and dehydrated states, and that dehydration would significantly impact all of
the skinfold measurements and %BF values, was rejected.
Only 20% (4/20) of the skinfold equation combinations significantly underestimated %BF and
30% (6/20) of the skinfold equation combinations were significantly influenced by
dehydration, as the euhydrated and dehydrated %BF values were significantly different
according to the Wilcoxon signed ranks test.
The Slaughter et al. (1988) skinfold equation and the Durnin & Womersley (1974) skinfold
equation using Brozek et al. (1963) were the only equations that showed acceptable levels
of bias according to the Bland-Altman analysis in both hydration states. These equations
showed a positive linear trend towards bias in both hydration states, therefore %BF values
on either extreme of 9.5% should also be approached with caution.
This Durnin & Womersley (1974) skinfold equation using Brozek et al. (1963) is indicated for
males 17 years and older therefore it was age-appropriate for 94% of the apprentices. This
equation can therefore be considered suitable for apprentices 17 years and older. This
equation has been used in another study involving jockeys by O’Reilly et al. (2017).
The Slaughter et al. (1988) skinfold equation was only age-appropriate for 59% of the
apprentices as it is not recommended for males older than 18 years. Therefore it should only
be recommended as the most suitable equation for the apprentices 18 years and younger.
Rodriguez et al. (2005) supports this as they reported that the Slaughter et al. (1988) equation
was the most accurate equation for measuring %BF in adolescent males aged 13 to 17.9
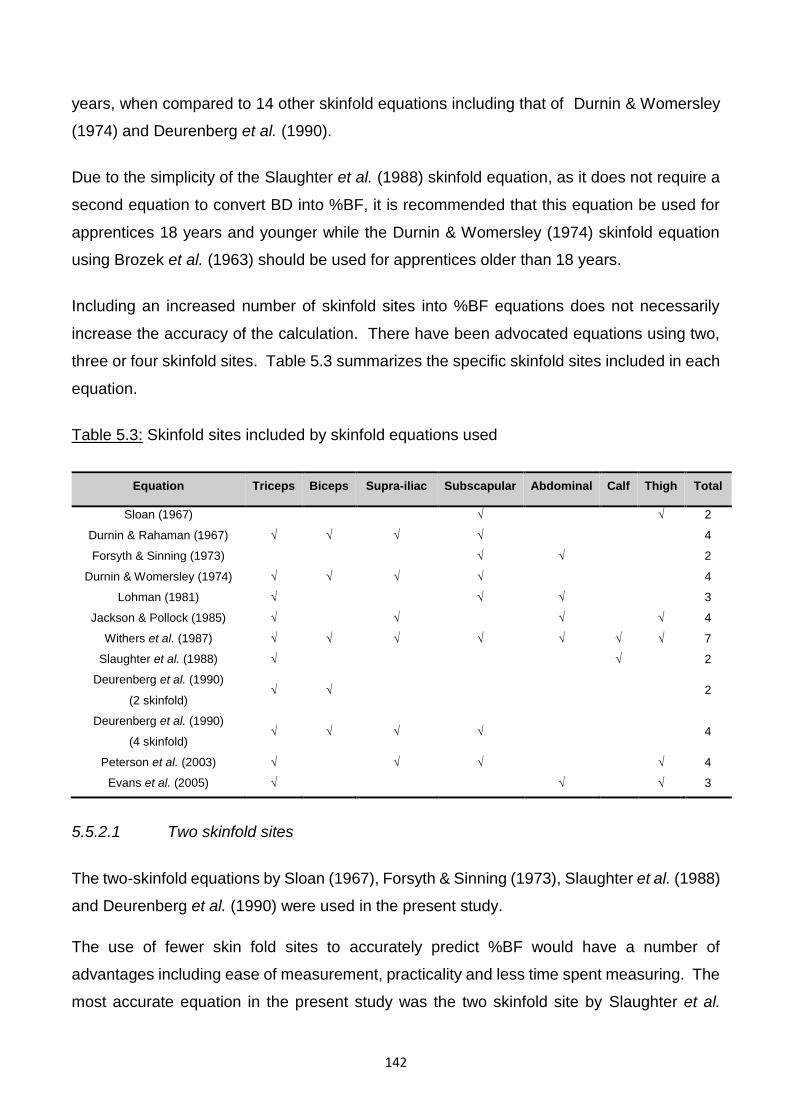
142
years, when compared to 14 other skinfold equations including that of Durnin & Womersley
(1974) and Deurenberg et al. (1990).
Due to the simplicity of the Slaughter et al. (1988) skinfold equation, as it does not require a
second equation to convert BD into %BF, it is recommended that this equation be used for
apprentices 18 years and younger while the Durnin & Womersley (1974) skinfold equation
using Brozek et al. (1963) should be used for apprentices older than 18 years.
Including an increased number of skinfold sites into %BF equations does not necessarily
increase the accuracy of the calculation. There have been advocated equations using two,
three or four skinfold sites. Table 5.3 summarizes the specific skinfold sites included in each
equation.
Table 5.3: Skinfold sites included by skinfold equations used
Equation Triceps Biceps Supra-iliac Subscapular Abdominal Calf Thigh Total
Sloan (1967) √ √ 2
Durnin & Rahaman (1967) √ √ √ √ 4
Forsyth & Sinning (1973) √ √ 2
Durnin & Womersley (1974) √ √ √ √ 4
Lohman (1981) √ √ √ 3
Jackson & Pollock (1985) √ √ √ √ 4
Withers et al. (1987) √ √ √ √ √ √ √ 7
Slaughter et al. (1988) √ √ 2
Deurenberg et al. (1990)
(2 skinfold) √ √ 2
Deurenberg et al. (1990)
(4 skinfold) √ √ √ √ 4
Peterson et al. (2003) √ √ √ √ 4
Evans et al. (2005) √ √ √ 3
5.5.2.1 Two skinfold sites
The two-skinfold equations by Sloan (1967), Forsyth & Sinning (1973), Slaughter et al. (1988)
and Deurenberg et al. (1990) were used in the present study.
The use of fewer skin fold sites to accurately predict %BF would have a number of
advantages including ease of measurement, practicality and less time spent measuring. The
most accurate equation in the present study was the two skinfold site by Slaughter et al.
143
(1988). As early as 1967, Sloan (1967) reported that BD measured by UWW had the highest
correlation with a regression equation using the two skinfolds (frontal thigh and subscapular)
in males aged 18 to 26 years, after considering five other sites (abdominal, supra-iliac, chest,
triceps and buttock). Forsyth & Sinning (1973) advocated the use of two skinfold sites
(abdominal and triceps) to calculated the %BF of male athletes aged 19 to 22 years. Mueller
& Stallones (1981) concluded from a principle components analysis that the medial calf and
one other trunk site, such as the supra-iliac, lateral chest wall or subscapular were sufficiently
accurate to measure %BF for males and females aged seven to 80 years. Slaughter et al.
(1988) also demonstrated that just two skinfolds (triceps and either subscapular or calf) were
satisfactory in predicting %BF when compare to nine skinfolds (triceps, biceps, subscapular,
mid-axilla, supra-iliac, anterior supra-iliac, abdominal, mid-thigh and medial calf) in children
aged eight to 18 years. Deurenberg et al. (1990) advocated the use of the triceps and biceps
sites in a two skinfold equation as they found that the correlation coefficient of the sum these
two skinfolds and body density was comparable to that of four skinfolds (triceps, biceps,
subscapular and supra-iliac) in children aged seven to 20 years. However, it can be noted
that in the present study the two-skinfold equation by Deurenberg et al. (1990) was
significantly impacted by dehydration while the four-skinfold equation was not. This presents
a possible disadvantage to using fewer skinfold sites.
5.5.2.2 Three skinfold sites
The three-skinfold equations by Lohman (1981) and Evans et al. (2005) were used in the
present study, both of which were inaccurate in either hydration state.
The use of three skinfold sites was advocated by Jackson & Pollock (1978) who reported a
close correlation (r = 0.98) between %BF calculated using the sum of three (chest, abdominal
and thigh) and seven skinfolds (chest, mid-axillary, triceps, subscapular, abdominal, supra-
iliac and thigh) in male athletes and non-athletes aged 18 to 61 years. This equation was not
used in the present study as the chest skinfolds were not routinely measured at the SAJA.
Similarly, Evans et al. (2005) concluded that a prediction equation using three sites (triceps,
abdominal and thigh) produced a similar accuracy to that of same seven skinfold sites in male
athletes aged 18 to 26 years. However, in the present study, the results of the Evans et al.
(2005) equation were the least accurate overall and were significantly affected by
dehydration. The three-skinfold equation by Lohman (1981) (triceps, abdominal and
subscapular sites) also proved to be inaccurate.
144
Therefore, the use of three skinfold sites was less accurate, less practical and more time-
consuming than using two sites.
5.5.2.3 Four skinfold sites
The four-skinfold equations by Durnin & Rahaman (1967), Durnin & Womersley (1974),
Jackson & Pollock (1985), Deurenberg et al. (1990) and Peterson et al. (2003) were used in
the present study, none of which were significantly impacted by dehydration. However, only
that of Durnin & Rahaman (1967), Durnin & Womersley (1974) and Deurenberg et al. (1990)
were accurate in either hydration state.
The Durnin & Womersley (1974) equation, which involves the biceps, triceps, subscapular
and supra-iliac sites, was ranked third most accurate in combination with the Brozek et al.
(1963) equation and was not significantly affected by dehydration. The authors
recommended this equation for male athletes and non-athletes ages 16 to 72 years.
It is of interest to note that the equation that was currently used to calculate %BF from
skinfolds at the SAJA, which was retrieved from (Topend Sports Network, 2015) and
attributed to Jackson & Pollock (1985), was the least accurate overall. This equation includes
the abdominal, triceps, thigh and supra-iliac sites. It resulted in significant under-estimation
of the %BF, with a mean %BF of 3.8 % and 2.6 % when euhydrated and dehydrated
respectively.
5.5.2.4 Multiple skinfold sites
Stewart & Hannan (2000) demonstrated contrarily to the previous studies that more skinfolds
increased the accuracy of calculation of %BF as the SEE for regression equations decreased
as the number of skinfold sites used increased in male athletes with a mean age of 28.1
years. The sites included the abdominal, chest, thigh, supra-iliac, forearm and medial calf
sites and the SEE decreased as the number of sites were added to the regression equation
in this order. Stewart & Hannan (2000) proposed an alternative regression equation for male
athletes using all six skinfold sites. This equation was not used in the present study as the
chest and forearm skinfolds are not routinely measured at the SAJA.
The equation by Withers et al. (1987), using seven skinfold sites (triceps, biceps,
subscapular, supra-iliac, abdominal, medial calf and thigh) was the second most accurate but
145
only in the euhydrated state. It is suggested that this is because this equation includes all of
the sites that were significantly impacted by dehydration (tricep, abdominal and frontal thigh).
This equation has been used in a number of studies involving jockeys (Warrington et al.,
2009; Dolan et al., 2009; Dolan et al., 2013) (Table 5.2).
Therefore, an increased number of skinfold sites does not necessarily increase the accuracy
of %BF calculation. Additional sites may introduce error into the equation as some sites are
more susceptible to be influenced by dehydration than others, which was suggested by the
effect of dehydration in the present study. Fewer skinfolds are more practical, less time-
consuming and less invasive. Therefore, it is difficult to specify which equation might be more
suitable, in terms of sites, variables and constant values used, without validating in a specific
population.
Using skinfold measurements to accurately determine %BF would be a cheap, quick and
practical method of measuring %BF at the SAJA, particularly those equations which were not
impacted by dehydration, such as that of Slaughter et al. (1988) and Durnin & Womersley
(1974).
5.5.3 Bioelectrical impedance analysis
The hypothesis that BIA would be most comparable to DD (reference method) can be
rejected. However, it was significantly affected by dehydration, as hypothesised. The Van
Loan et al. (1990) BIA equation can however be considered relatively comparable to the
reference method.
Seventy-five percent of the BIA equations produced %BF values that differed significantly
from the reference method according to the Wilcoxon signed ranks test in both hydration
states, including the undisclosed equation of the BODYSTAT®1500, with regression
equations applied to the apprentices younger than 18 years using the product software.
Applying the equations by Van Loan et al. (1990) in either hydration state and Lohman (1992)
when euhydrated only to the impedance values given by the BODYSTAT®1500 machine
produced %BF results that were not significantly different to the reference method according
to the Wilcoxon signed ranks test. However, only the Van Loan et al. (1990) BIA equation
when euhydrated was considered to have an acceptable level of bias according to the Bland-
Altman analysis. There was virtually no trend towards bias therefore, %BF on either extreme
of 9.5% could be verified using these BIA equations. From a practical perspective however,
146
most people using a BIA will simply use the equation given by the machine. Therefore this
is not a very suitable method.
5.5.4 Recommended method for measuring the percent body fat of apprentices
Given the results of the present study, it is recommended that the SAJA continues to utilize
the skinfold method for measuring %BF. However, the currently used equation is not suitable
for this population. Although raw skinfold thickness measurements, and the sum thereof,
may be used to assess and monitor body fatness, which is an indicator of nutritional status
in both athletes and non-athletes (Wells & Fewtrell, 2006), these cannot be validated without
deriving population-specific regression equations for %BF. Therefore, validated regression
equations are recommended. The study aimed to determine the actual %BF of the
apprentices in order to assess scope for reduction of body fat and not to monitor the change.
The Slaughter et al. (1988) skinfold equation can be recommended for the apprentices who
are 18 years and younger due to its acceptable level of bias in both hydration states. The
Durnin and Womersley (1974) equation for BD, using Brozek et al. (1963) to translate to %BF
is recommended for apprentices older than 18 years as it also had an acceptable level of bias
in either hydration state. Percent body fat values measured on either extreme of 9.5 % should
be approached with caution when using these equations due to the positive linear trend
towards bias.
It is still essential that the correct techniques (ISAK) are strictly adhered to, the callipers such
as Lange or Harpenden used have been validated for accuracy, and that inter-observer
variability is controlled by ensuring that the same observer takes all of the measurements at
each assessment.
Should an ISAK-trained individual not be available for measurement, or should %BF values
be on either extreme of 9.5%, BIA may be used by substituting the impedance value given
by the BODYSTAT®1500 machine into the equation by Van Loan et al. (1990) after ensuring
euhydration as it had an acceptable level of bias and a neutral trend.
The BMI equation for measuring %BF is not recommended as the level of bias was found to
be unacceptably large and BMI and %BF are known to have a weak relationship in athletes
and non-athletes with a BMI less than 25 kg/m2 (Nevill et al., 2006; Meeuwsen et al., 2010a;
Kupusinac et al., 2017). It also showed a positive linear bias on either extreme of 10.25%.
147
5.6 WEIGHT-MAKING BEHAVIOURS
5.6.1 Weight satisfaction
The hypothesis that weight dissatisfaction would be significantly associated with a higher
weight and BMI was rejected, however weight dissatisfaction was significantly associated
with a lower %BF.
Approximately one third (37%) were dissatisfied with their current weight which was less than
that reported by Krog (2015) (57%) and Moore et al. (2002b) (52%). These included both
apprentices whose %BF was within the essential fat range, and the remainder who were all
underfat. Interestingly, those dissatisfied with their body weight had a higher body weight but
a lower %BF than those satisfied. This reinforces the need for a practical, cheap and accurate
measurement of body composition analysis to individualise weight loss in terms of %BF.
Therefore, should these apprentices reduce their weight to what they consider to be ideal,
they would compromise their FFM. An apprentice who is unsatisfied with his weight but has
a %BF less than the recommended range should be reassured and counselled, and ideally
not be prescribed a diet or exercise regime that will increase FFM further.
5.6.2 Chronic weight-making methods
The hypothesis that the prevalence of chronic and acute weight-making behaviours of the
apprentices studied would be similar to that of the previous study on apprentices at the SAJA
(Krog, 2015) and implicate necessary intervention was accepted.
Restricting food intake was the most commonly reported method (75%), followed by daily
weighing (69%), keeping busy to avoid eating (44%) and exercising to use up calories (44%).
It should also be noted that smoking cigarettes was relatively common (37%), which presents
other potential health concerns, including negative effects on immunity (Sopori, 2002) and
BMD (Ward & Klesges, 2001). The results of the present study were similar to other studies
involving jockey apprentices (Moore et al., 2002b; Leydon & Wall, 2002; Krog, 2015) (Table
5.3). In keeping with the study conducted by Krog (2015), none reported using laxatives or
induced vomiting to lose weight. The apprentices may be under less pressure to maintain a
lower weight than the professional jockeys, as they have not developed to their full adult size,
and may therefore be less inclined to adopt more “extreme” methods such as the use of
laxatives and induced vomiting. This result however may be due to false reporting. Although

148
confidentiality and anonymity was assured, the apprentices may have been afraid or
uncertain of the consequences of admitting to these habits.
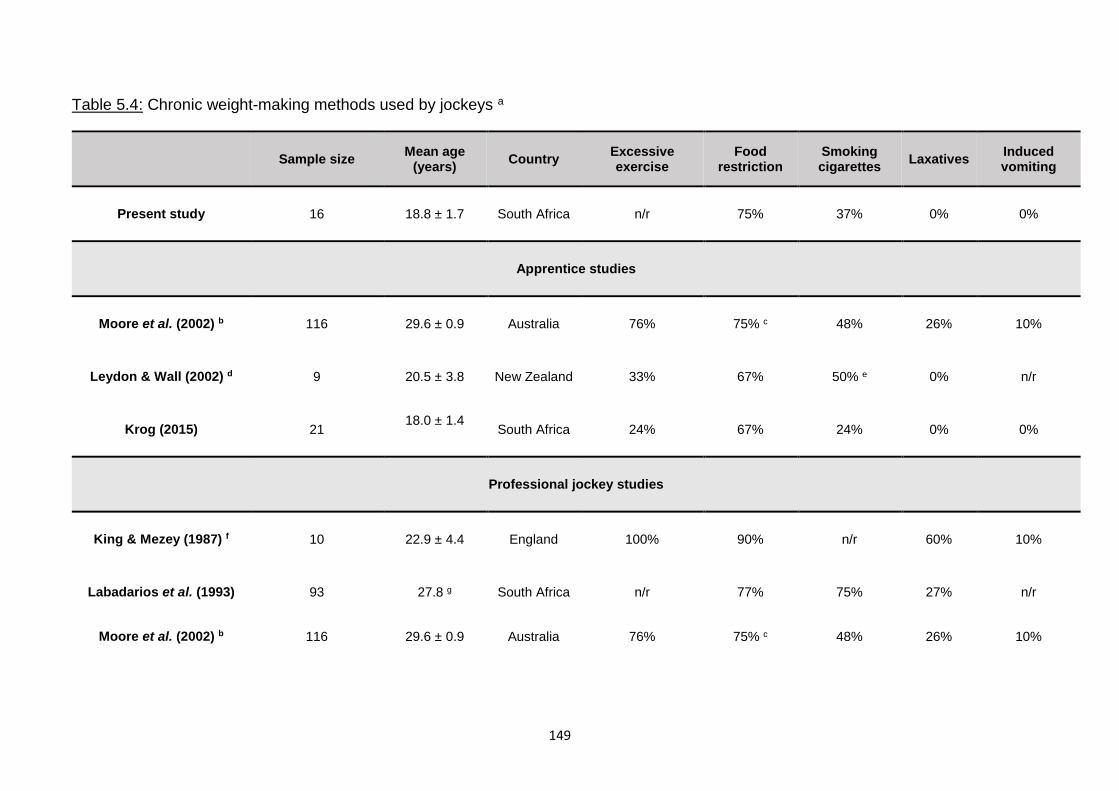
149
Table 5.4: Chronic weight-making methods used by jockeys a
Sample size Mean age
(years) Country
Excessive exercise
Food restriction
Smoking cigarettes
Laxatives Induced vomiting
Present study 16 18.8 ± 1.7 South Africa n/r 75% 37% 0% 0%
Apprentice studies
Moore et al. (2002) b 116 29.6 ± 0.9 Australia 76% 75% c 48% 26% 10%
Leydon & Wall (2002) d 9 20.5 ± 3.8 New Zealand 33% 67% 50% e 0% n/r
Krog (2015) 21 18.0 ± 1.4
South Africa 24% 67% 24% 0% 0%
Professional jockey studies
King & Mezey (1987) f 10 22.9 ± 4.4 England 100% 90% n/r 60% 10%
Labadarios et al. (1993) 93 27.8 g South Africa n/r 77% 75% 27% n/r
Moore et al. (2002) b 116 29.6 ± 0.9 Australia 76% 75% c 48% 26% 10%
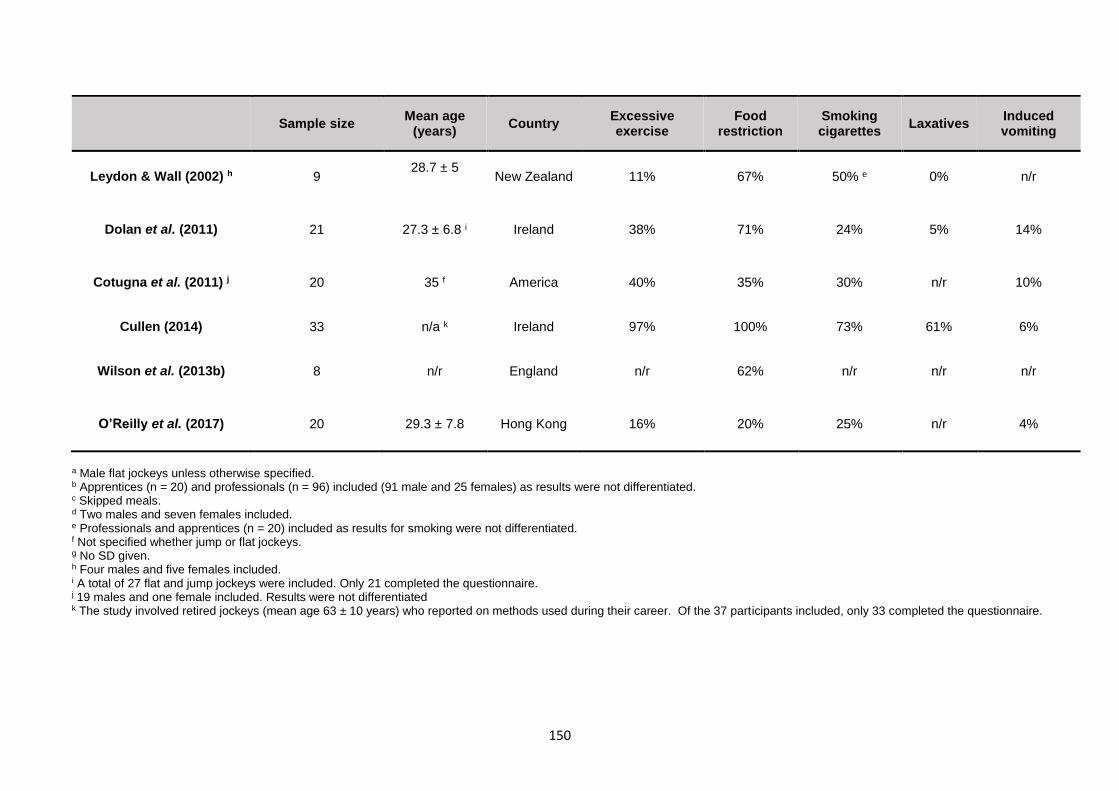
150
Sample size Mean age
(years) Country
Excessive exercise
Food restriction
Smoking cigarettes
Laxatives Induced vomiting
Leydon & Wall (2002) h 9 28.7 ± 5
New Zealand 11% 67% 50% e 0% n/r
Dolan et al. (2011) 21 27.3 ± 6.8 i Ireland 38% 71% 24% 5% 14%
Cotugna et al. (2011) j 20 35 f America 40% 35% 30% n/r 10%
Cullen (2014) 33 n/a k Ireland 97% 100% 73% 61% 6%
Wilson et al. (2013b) 8 n/r England n/r 62% n/r n/r n/r
O’Reilly et al. (2017) 20 29.3 ± 7.8 Hong Kong 16% 20% 25% n/r 4%
a Male flat jockeys unless otherwise specified. b Apprentices (n = 20) and professionals (n = 96) included (91 male and 25 females) as results were not differentiated. c Skipped meals. d Two males and seven females included. e Professionals and apprentices (n = 20) included as results for smoking were not differentiated. f Not specified whether jump or flat jockeys. g No SD given. h Four males and five females included. i A total of 27 flat and jump jockeys were included. Only 21 completed the questionnaire. j 19 males and one female included. Results were not differentiated k The study involved retired jockeys (mean age 63 ± 10 years) who reported on methods used during their career. Of the 37 participants included, only 33 completed the questionnaire.
151
The consequences of food restriction includes poor BMD as a result of low EA. This is
particularly important when considering the mean age of the apprentices (18.8 years) as peak
BMD for males typically occurs before the age of 20 years (Cvijetić Avdagić et al., 2009;
Berger et al., 2010). Krog (2015) reported a low mean calculated EA of 113.28 kJ/kg FFM in
the SAJA apprentices over two training days and one rest day. Training with an EA less than
125 kJ/kg FFM, with or without disordered eating, has previously been shown to negatively
impact physiological function and bone health in male athletes (Sundgot-Borgen et al., 2013).
Leydon & Wall (2002) reported that 44% of the flat jockeys were osteopenic. This was related
to a restricted food intake as 58% of the males consumed less than 60% of the recommended
daily intake (RDI) of calcium according to their seven-day weighed food records. Warrington
et al. (2009) found that 53% of flat jockeys were osteopenic and 12% had osteoporosis, which
was suggested to be a result of the exercise, nutritional and other lifestyle habits of the
jockeys. This is of concern due to the high risk of injuries and fractures from falling in horse
racing (Waldron-Lynch et al., 2010; Rueda et al., 2010).
Restriction of energy and fluid intake is also associated with impaired mood profiles in
jockeys. Caulfield & Karageorghis (2008) reported significantly increased depression, anger,
fatigue, confusion and tension and significantly decreased vigour when 41 professional male
flat and jump jockeys (mean age 30.9 years) were at their lightest weight compared to a
relaxed weight. The descriptive study by Wilson et al. (2013a) also demonstrated high levels
of depression, anger and fatigue as well as low vigour according to the Brunel Mood Scale
(BRUMS) as a result of food and fluid restriction in 19 flat (mean age 27 years) and 17 jump
(mean age 25 years) jockeys. This may have negative implications for their physical
performance in the sport, as well as their personal lives.
5.6.2.1 Sports and exercise
Although exercising to use up calories was a popular method of weight control, the most
popular reason reported for engaging in any physical activity besides horse riding was for
fitness. The most popular activities were soccer and running or jogging. Soccer, running
and weight training were the only physical activities used for weight control. From the body
composition results of this study, increased weight training should not be recommended as it
may increase FFM. The present study did not assess the prevalence of excessive exercise.
152
5.6.3 Acute weight-making methods
The only methods reported for rapidly losing weight were taking hot baths with or without
Epsom salts (most common method) or Arnica, using the sauna and wearing plastic to sweat
during exercise. These results were similar to that of Krog (2015), indicating that the
behaviour of the SAJA apprentices has not changed but much lower than reported 25 years
ago in professional jockeys in South Africa. This can be attributed to the change in race rules
as medications such as laxatives and diuretics are no longer allowed, and that the
apprentices may have not yet adopted these practises.
In comparison to other studies involving apprentice and professional jockeys, the general use
of acute weight-making methods was less prevalent in the present study with the exception
of taking hot baths (Table 5.4). None in the present study claimed to flip6 or use diuretics or
laxatives in order to make weight, whereas the average prevalence in other jockey studies
was 8%, 40% and 26% respectively. The prevalence of these specific habits among
apprentices was not differentiated out in the studies by Moore et al. (2002b) and Leydon &
Wall (2002). This indicates that these habits have not yet been adopted by the apprentices.
This could also be due to less pressure to make handicaps as well as false reporting.
6 purge after eating or drinking
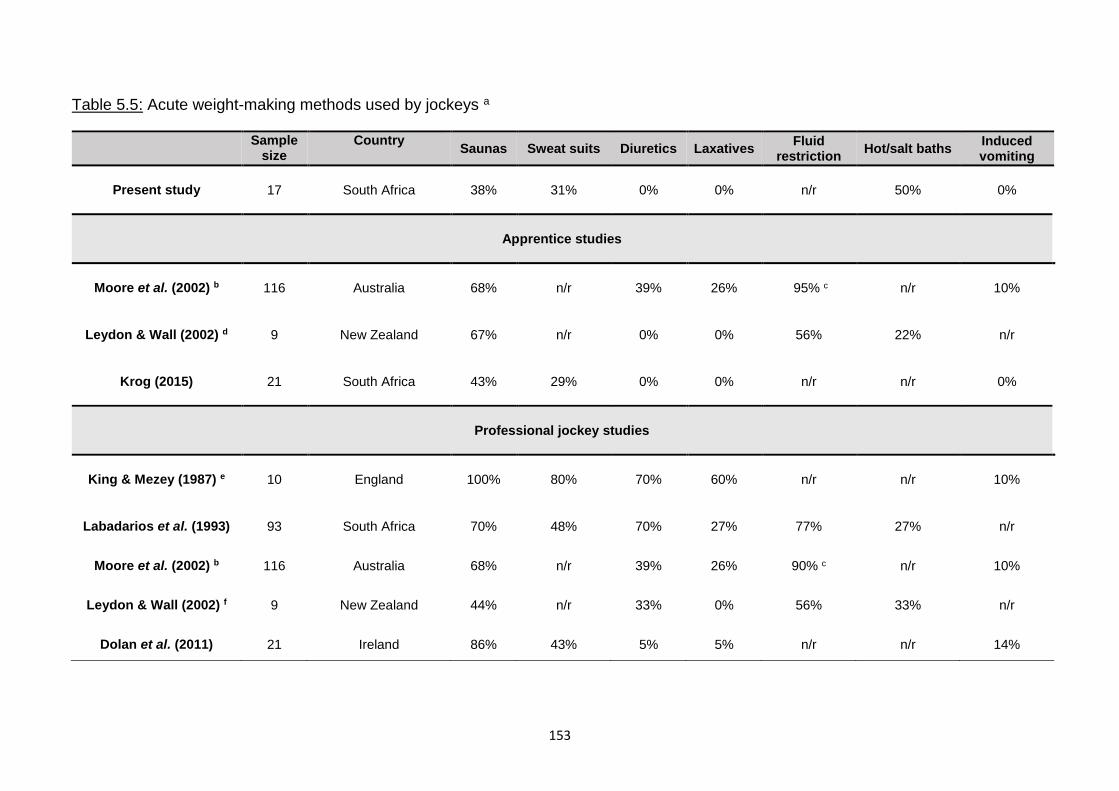
153
Table 5.5: Acute weight-making methods used by jockeys a
Sample
size Country
Saunas Sweat suits Diuretics Laxatives Fluid
restriction Hot/salt baths
Induced vomiting
Present study 17 South Africa 38% 31% 0% 0% n/r 50% 0%
Apprentice studies
Moore et al. (2002) b 116 Australia 68% n/r 39% 26% 95% c n/r 10%
Leydon & Wall (2002) d 9 New Zealand 67% n/r 0% 0% 56% 22% n/r
Krog (2015) 21 South Africa 43% 29% 0% 0% n/r n/r 0%
Professional jockey studies
King & Mezey (1987) e 10 England 100% 80% 70% 60% n/r n/r 10%
Labadarios et al. (1993) 93 South Africa 70% 48% 70% 27% 77% 27% n/r
Moore et al. (2002) b 116 Australia 68% n/r 39% 26% 90% c n/r 10%
Leydon & Wall (2002) f 9 New Zealand 44% n/r 33% 0% 56% 33% n/r
Dolan et al. (2011) 21 Ireland 86% 43% 5% 5% n/r n/r 14%
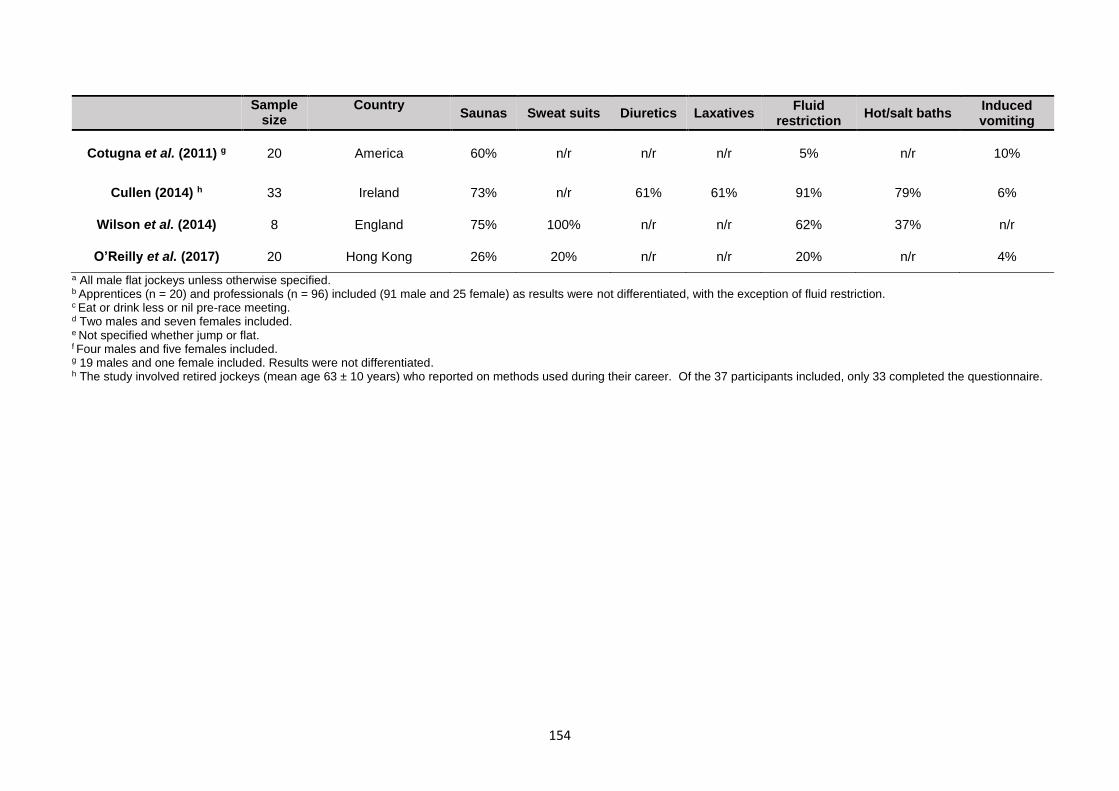
154
Sample
size Country
Saunas Sweat suits Diuretics Laxatives Fluid
restriction Hot/salt baths
Induced vomiting
Cotugna et al. (2011) g 20 America 60% n/r n/r n/r 5% n/r 10%
Cullen (2014) h 33 Ireland 73% n/r 61% 61% 91% 79% 6%
Wilson et al. (2014) 8 England 75% 100% n/r n/r 62% 37% n/r
O’Reilly et al. (2017) 20 Hong Kong 26% 20% n/r n/r 20% n/r 4%
a All male flat jockeys unless otherwise specified. b Apprentices (n = 20) and professionals (n = 96) included (91 male and 25 female) as results were not differentiated, with the exception of fluid restriction. c Eat or drink less or nil pre-race meeting. d Two males and seven females included. e Not specified whether jump or flat. f Four males and five females included. g 19 males and one female included. Results were not differentiated. h The study involved retired jockeys (mean age 63 ± 10 years) who reported on methods used during their career. Of the 37 participants included, only 33 completed the questionnaire.
155
The prevalence of chronic and acute weight-making methods was considerably lower in the
present study when compared to that of studies involving professional jockeys, particularly
regarding acute weight-making methods as well as the use of laxatives and forced vomiting
to control weight.
The reported acute weight-making behaviours such as the use of saunas, sweat suits and
hot baths as well as the reports of feelings of thirst which suggest fluid restriction, may explain
the findings of chronic dehydration in the apprentices.
5.6.4 Feelings of hunger and thirst
The majority (94%) felt both hungry and thirsty at least “sometimes,” which included those
that reported feeling both hungry and thirsty “often” and “always.” Only 6% reported that they
never feel hungry or thirsty. This reflects a disturbing level of discomfort in terms of hunger
and thirst. Krog (2015) indicated that 80% reported thirst as a short-term negative effect of
weight control methods.
Dolan et al. (2011) found that hunger (38%) and thirst (52%) were the most frequently
reported short-term negative effects among professional jockeys. It was suggested by
Warrington et al. (2009) that habituation to dehydration may have led to an impairment of
the thirst mechanism in professional jockeys, although further investigation into this
phenomenon is required. This may indicate that the apprentices have not yet undergone the
extent of habituation to cause this impairment. The same may apply to feelings of hunger,
wherein the apprentices have not yet adapted to energy deficiency as the professionals have.
5.7 RISK OF DEVELOPING EATING DISORDERS.
The hypothesis that there would be a high risk of developing eating disorders such as AN
and BN was rejected.
The mean EAT-26 score was considerably lower than 20, indicating a low risk with only one
being considered at risk, which was surprising considering their preoccupation with body
weight. The prevalence of risk of chronic eating disorders was lower in apprentices than in
professional jockeys (Table 5.5).
156
This apprentice was dissatisfied with his body weight, and although his BMI was above the
sample mean, his %BF (8.89 %) was bordering the lower limit of the normal range for his age
group (8%). This supports the need to accurately measure %BF in order for such apprentices
to be aware that it is dangerous to reduce weight if their %BF is borderline or below normal.
Although the EAT-26 questionnaire is a screening as opposed to a diagnostic tool, it is the
recommendation of Garner & Garfinkel (1979) that this apprentice should be referred for
professional assessment.
The prevalence of abnormal eating behaviour was lower when compared to other jockey
studies (King & Mezey, 1987; Leydon & Wall, 2002; Caulfield & Karageorghis, 2008; Wilson
et al., 2015) as reflected by a lower mean score, including that of a group of male and female
apprentices (Table 5.5). Female jockeys were reported to have a significantly lower mean
EAT-26 score than that of male jockeys in the study by Leydon & Wall (2002), which makes
the mean score of the present study more surprising. The mean age in the present study
was lower than that of the other jockey studies, which may account for a lower EAT-26 score
as the apprentices may not have developed to their full adult size yet making it easier to attain
a low weight.
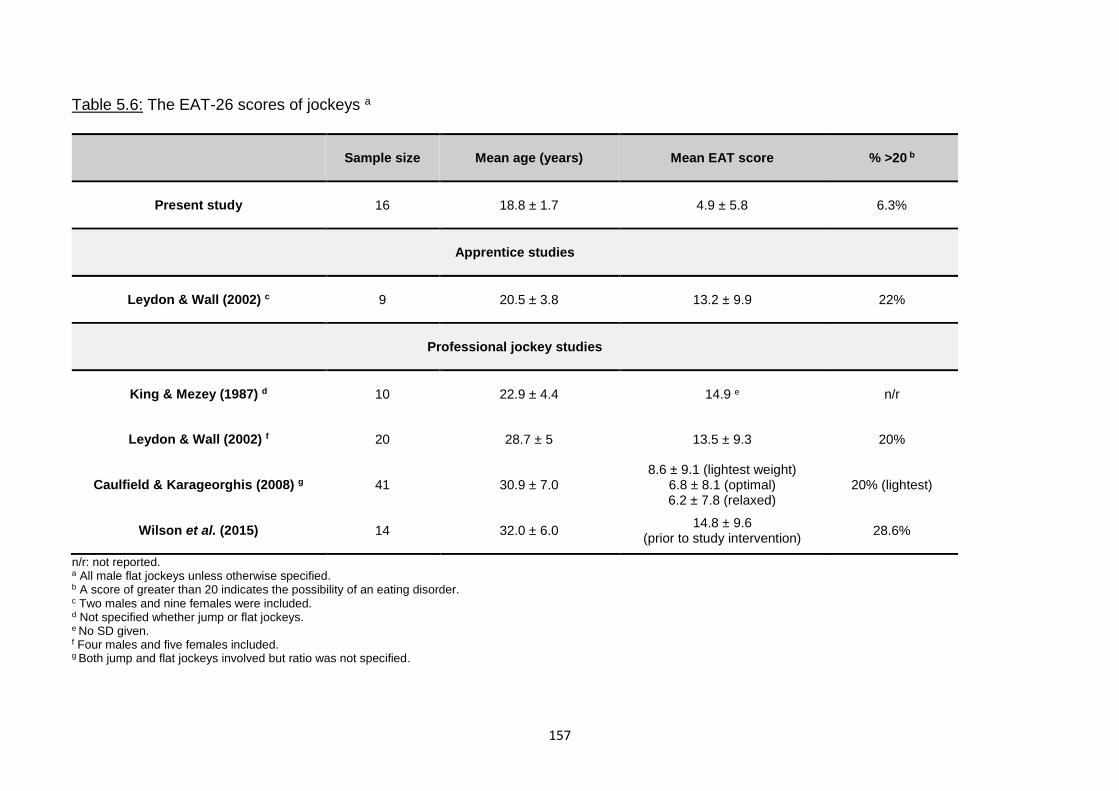
157
Table 5.6: The EAT-26 scores of jockeys a
Sample size Mean age (years) Mean EAT score % >20 b
Present study 16 18.8 ± 1.7 4.9 ± 5.8 6.3%
Apprentice studies
Leydon & Wall (2002) c 9 20.5 ± 3.8 13.2 ± 9.9 22%
Professional jockey studies
King & Mezey (1987) d 10 22.9 ± 4.4 14.9 e n/r
Leydon & Wall (2002) f 20 28.7 ± 5 13.5 ± 9.3 20%
Caulfield & Karageorghis (2008) g 41 30.9 ± 7.0 8.6 ± 9.1 (lightest weight)
6.8 ± 8.1 (optimal) 6.2 ± 7.8 (relaxed)
20% (lightest)
Wilson et al. (2015) 14 32.0 ± 6.0 14.8 ± 9.6
(prior to study intervention) 28.6%
n/r: not reported. a All male flat jockeys unless otherwise specified. b A score of greater than 20 indicates the possibility of an eating disorder. c Two males and nine females were included. d Not specified whether jump or flat jockeys. e No SD given. f Four males and five females included. g Both jump and flat jockeys involved but ratio was not specified.
158
The low score however may be a result of underreporting, because of the shame
associated with the stereotype that eating disorders afflicts only female and male
homosexuals (Murray, 2017). Underreporting of symptoms of eating disorders is not
uncommon in athletes due to poor credibility of efforts to ensure confidentiality (Joy et al.,
2016). However, a strong effort to ensure confidentiality was made in the present study
by having both the EAT-26 and lifestyle questionnaires administered by a registered
social worker with no affiliations to the SAJA who had experience doing similar
questionnaires with the apprentices. The questionnaires were administered to each
apprentice separately in a private location.
No eating disorders were diagnosed in the studies described in Table 5.5, despite the
high prevalence of disordered eating. The typically used diagnostic criteria for eating
disorders (DSM-IV) is known to present a gender bias as it indicates that amenorrhoea is
a specification for AN (Strother et al., 2012; Mitchison et al., 2017). The revised diagnostic
classification, Diagnostic and Statistical Manual of Mental Disorders, 5th edition (DSM-
V), which allows more eating disorders in males to be identified by a specific diagnosis
(Raevuori, Keski-Rahkonen & Hoek, 2014), was only published in 2013. Therefore it is
possible that eating disorders in these jockey samples were undiagnosed.
5.8 CONCLUSION
As indicated by USG, the apprentices are chronically moderately dehydrated which may
have long term health implications although chronic dehydration could not be associated
with negative consequences such as renal dysfunction in jockeys.
Stunting was reported in 60% of those under 19 years, of which three (50%) came from
lower income groups, which could indicate chronic malnutrition as a result of poor food
security. Stunting as a result of chronic malnutrition presents negative implications for
the jockeys as it is significantly correlated with poor BMD and BMC (Martins et al., 2011),
which could increase the risk of fractures from falls.
Only twelve percent (2/17) fell into the “essential” fat range, and 88% and 65 % were
underfat according to their %BF and FMI respectively and therefore had insufficient fat
stores to protect their FFM. Most of the apprentices had a %BF that was close to the
159
lower limit of the normal range, although some did indicate some scope to reduce either
their %BF or FMI to the lower limit of normal for their age group. Therefore it is not
recommended that all of the apprentices reduce their FM as this presents a high risk of
compromising FFM. Recommendations for reducing FM should be individualised.
Calculating %BF from BMI using the Deurenberg et al. (1991c) equation is not
recommended for the apprentice population as it showed an unacceptable level of bias
and a weak relationship between BMI and %BF has been reported in athletes and non-
athletes with a BMI less than 25 kg/m2 (Nevill et al., 2006; Meeuwsen et al., 2010a;
Kupusinac et al., 2017).
Given the results of the present study, it is recommended that the SAJA continues to
utilize the skinfold method for measuring %BF. However, the currently used equation is
not suitable for this population.
The Slaughter et al. (1988) skinfold equation can be used for the apprentices that are 18
years or younger. The Durnin and Womersley (1974) equation for BD, using Brozek et
al. (1963) to translate to %BF is therefore recommended for those apprentices older than
18 years. Caution should be taken when approaching %BF values on either extreme of
9.5% given by these equations due to the positive linear trend towards bias.
An increased number of skinfold sites does not necessarily increase the accuracy of %BF
calculation from skinfold equations as the three most accurate equations involved the use
of two, four and seven sites respectively with varying site locations. The use of a
population-specific equation is more important.
The use of the undisclosed equation from the BODYSTAT®1500 machine was not
accurate in either hydration state. Although an acceptable level of bias was found when
substituting the resistance values into the BIA equation by Van Loan et al. (1990), from a
practical perspective, most people using a BIA will simply use the equation given by the
machine. Therefore this is not a very suitable method. However, this method may be
used to verify results from the skinfold equations on either extreme of 9.5%
160
Weight dissatisfaction was associated with a significantly lower %BF meaning that the
higher body weight of those dissatisfied was not due to excess fat mass, which reinforces
the need to accurately measure %BF. An apprentice who is unsatisfied with his weight
but has a %BF less than the recommended range should be reassured and counselled,
and ideally not be prescribed a diet or exercise regime that will increase FFM further.
Food restriction was the most popular chronic weight-making method, which can
negatively impact bone health and therefore increase the risk of fracture from falling.
Acute weight-making techniques reported explain the findings of chronic dehydration.
Some acute weight-making methods that are used by professional jockeys, such as the
use of diuretics, laxatives and induced vomiting, have not yet been adopted by the
apprentices.
The prevalence of weight-making techniques in the present study was similar to that of
other studies involving apprentices but lower than that of professional jockeys. This
indicates that these habits have not yet been adopted by the apprentices. Acute
dehydration is associated with poor performance when racing.
There was a disturbing level of discomfort in terms of both hunger and thirst as the
majority felt both hungry and thirsty as least sometimes and very few reported that they
never felt hungry or thirsty.
Only one apprentice was at risk for an eating disorder and overall the risk was low
according to the mean EAT-26 and lower than that of other jockey studies.
161
CHAPTER 6: CONCLUSIONS AND RECOMMENDATIONS
6.1 INTRODUCTION
This study aimed to assess the accuracy of methods (BMI, skinfolds and BIA) of
accurately determining the %BF of the male jockey apprentices training at the SAJA, the
weight-making behaviours adopted and the risk of eating disorders. The specific
objectives were:
i. To determine the hydration status prior to intervention of the male apprentice
jockeys at the SAJA by urinalysis.
ii. To accurately determine the mean %BF of the apprentices using the reference
method DD.
iii. To classify the height-for-age, BMI, %BF, FMI and FFMI of the apprentices.
iv. To validate the accuracy of three methods of body composition analysis (BMI,
skinfolds and BIA) in measuring %BF to the reference method DD, in male
apprentice jockeys at the SAJA when euhydrated and dehydrated.
v. To investigate the association between weight satisfaction of the apprentices and
their %BF, age, height, weight, BMI, fat mass index (FMI) and fat-free mass index
(FFMI).
vi. To investigate the use of various weight-making techniques of the apprentices
using a lifestyle questionnaire.
To investigate the apprentices’ risk of developing eating disorders such as anorexia
nervosa (AN) and bulimia nervosa (BN) using the EAT-26 questionnaire.
6.2 CONCLUSION
The study sample consisted of jockey apprentices training at the SAJA during 2016, most
of whom were Caucasian teenagers.
The apprentices were chronically moderately dehydrated due to the perceived need to
reduce weight to meet handicapping requirements. It is important to address this by
regular hydration assessment and education on how to ensure proper hydration as
162
dehydration could negatively impact racing performance, renal function and BMD
particularly in conjunction with a low %BF.
The mean BMI, although within the normal range, was above the lower limit with only one
being classified as underweight. Although two apprentices were classified as underlean,
the mean FFMI was normal, which would assist them to remain stable and maintain
control while riding reducing the risk of falls and help prevent a low BMD as well as to
sustain weight loss. The mean %BF (10.2 %) for those under 20 year and those over 20
years (7.3 %) was below the minimum range of normal, and although lower than that of
other apprentices, it was comparable to that of professional jockeys. The majority were
classified as being underfat, with two falling within the essential fat range compromising
both their health and FFM. For some apprentices, there is some scope to reduce either
their %BF or FMI to the minimum normal level for their age group. Recommendations to
reduce weight therefore in this population should be individualised and based on %BF
and FMI established by accurate methods of body composition.
Both the BMI and BIA as measured in this study were not as appropriate as the skinfold
measurements regression equations. The Slaughter et al. (1988) skinfold equation is
recommended for apprentices that are 18 years or younger and the Durnin & Womersley
(1974) skinfold equation with Brozek et al. (1963) is recommended for those older than
18 years. Caution should be taken when approaching %BF values on either extreme of
9.5% given by these equations due to the positive linear trend towards bias. An increased
number of skinfold sites does not necessarily increase the accuracy of %BF calculation
from skinfold equations as the most accurate equations involved the use of two skinfold
sites.
Should an ISAK-trained individual not be available to measure skinfolds, or the skinfold
equations produce %BF values on either extreme of 9.5 %, BIA could be used by
substituting the impedance value given by the BODYSTAT®1500 machine into the
equation by Van Loan et al. (1990) which was reasonably accurate when both euhydrated
and dehydrated and had a neutral trend towards bias.
163
Weight dissatisfaction was associated with a higher body weight but a significantly lower
%BF, which reinforces the need to accurately measure %BF and to individualise
recommendations regarding weight loss according to body composition and not actual
weight or BMI.
Chronic weight-making techniques included restricting food intake, daily weighing,
keeping busy to avoid eating, exercising to use up calories and smoking cigarettes. Food
restriction was the most popular, which can negatively impact bone health and therefore
increase the risk of fracture from falling. Acute weight-making techniques included taking
hot baths, with or without Epsom salts or Arnica oil, using the sauna and wearing plastic
to sweat while exercising with hot baths were most popular. Extreme methods, such as
vomiting, were not used by the apprentices. There was a disturbing level of discomfort in
terms of both hunger and thirst as the majority felt both hungry and thirsty at least
sometimes and very few reported that they never felt hungry or thirsty.
The risk of eating disorders was low as reflected by a low EAT-26 score with only one
apprentice at risk. This was surprising considering that the results of the lifestyle
questionnaire indicated a high prevalence of food restriction as well as other habits
associated with disordered eating such as skipping meals and avoiding situations with
food.
Therefore, the use of the skinfold method with the equations by Slaughter et al. (1988)
for those 18 years and younger and Durnin & Womersley (1974) for BD, with the Brozek
et al. (1963) equation to translate to %BF, for those older than 18 years, is recommended
for this population. Some of the deleterious weight-making methods used by
professionals have not yet been adopted by the apprentices, although they are chronically
dehydrated and there was a disturbing level of discomfort in terms of hunger and thirst.
The risk of eating disorders was low.
6.3 STUDY LIMITATIONS
The sample size was small as the total population of apprentice jockeys in South
Africa was small, however the high response rate allowed for a good
representation of the population.
164
The BODYSTAT®1500, does not measure separate values for resistance and
reactance. This limited the number of BIA equations that could be applied to the
data. Other machines, which measure resistance and reactance separately, could
have also been more accurate.
The questionnaires involved subjective self-reported data. These should be
approached with caution as participants might have misinterpreted questions or
tried to impress the social worker and thus the data could be aligned with socially
accepted norms and sporting rules, rather than the truth.
6.4 RECOMMENDATIONS FOR NUTRITION PRACTISE
6.4.1 Prescriptions of weight-loss diets and exercise regimes for the jockey apprentices
at the SAJA be individualised based on body composition (%BF and FFMI), instead of
weight and BMI.
6.4.2 Continued use of the skinfold method by an ISAK-trained individual is
recommended, however with the Slaughter et al. (1988) equation for those 18 years and
younger and the Durnin & Womersley (1974) equation for BD, with that of Brozek et al.
(1963) to translate to %BF, for those older than 18 years.
6.4.3 Regular education regarding the risks of deleterious weight-making methods,
especially those involving energy restriction and dehydration, be conducted at the SAJA
by the faculty and medical team (clinic sister, dietitian, biokineticist).
6.4.4 Regular monitoring of hydration status according to USG should also be done and
the apprentices should be encouraged to remain euhydrated, especially on non-race
days.
6.5 IMPLICATIONS FOR FURTHER RESEARCH
6.5.1 To investigate the bone health of the apprentices according to their BMD and BMC
using DXA, since a number the apprentices in the present study indicated a high
prevalence of stunting, a low %BF, as well as the use of weight-making methods that
involved energy restriction and dehydration. A low %BF, combined with energy restriction
165
and dehydration, has been shown to reduce BMD and increase the prevalence of
osteopenia and fractures in studies in other jockey studies.
6.5.2 To investigate the effects of implementing an initiative to encourage better
hydration practices (drinking more fluids and avoiding dehydration practises) as the
apprentices were reported to be chronically dehydrated which could have detrimental
effects on their long-term health and their career.
166
REFERENCES
Ackland, T., Lohman, T., Sundgot-Borgen, J., Maughan, R., Meyer, N., Stewart, A. & Müller, W. (2012). Current status of body composition assessment in sport. Sports Med 42(3): 227-249.
American Psychiatric Association (2013). Diagnostic and statistical manual of mental disorders. Arlington, Virginia, USA: American Psychiatric Publishing.
Armstrong, L. (2005). Hydration assessment techniques. Nutrition Reviews 63(1): S40-S54. Armstrong, L., Maresh, C., Castellani, J., Bergeron, M., Kenefick, R., LaGasse, K. & Riebe, D. (1994).
Urinary indices of hydration status. Int J Sport Nutr 4(3): 265-279. Bahadori, B., Uitz, E., Tonninger-Bahadori, K., Pestemer-Lach, I., Trummer, M., Thonhofer, R., Brath, H. &
Schaflinger, E. (2006). Body composition: the fat-free mass index (FFMI) and the body fat mass index (BFMI) distribution among the adult Austrian population-results of a cross-sectional pilot study. Int J Body Compos Res 4(3): 123-128.
Ball, S., Swan, P. & Altena, T. (2006). Skinfold assessment: Accuracy and application. Meas Phys Educ Exerc Sci 10(4): 255-264.
Barron, E. (2014).Chronic kidney disease prevalence model. London: Public Health England. Bartok, C., Schoeller, D., Randall Clark, R., Sullivan, J. & Landry, G. (2004). The effect of dehydration on
wrestling minimum weight assessment. Med Sci Sports Exerc 36(1): 160-167. Beddoe, A. & Samat, S. (1998). Body fat prediction from skinfold anthropometry referenced to a new
gold standard: in vivo neutron activation analysis and tritium dilution. Physiol Meas 19(3): 393-403.
Benardot, D., Thompson, W., Hutchinson, M., Roman, S., Hedrick, T. & Reynaud, C. (2008).Urine Specific Gravity is Unrelated to BIA or Skinfold- Derived Body Fat Percent, But Is Related to Weight in Professional Racehorse Jockeys.: 2251: Board #31 May 30 3:30 PM- 5:00 PM. In Med Sci Sports Exerc, Vol. 40, S414 Baltimore: Lippincott Williams & Wilkins.
Bender, D. (2009). A dictionary of food and nutrition. Oxford: Oxford University Press. Berger, C., Goltzman, D., Langsetmo, L., Joseph, L., Jackson, S., Kreiger, N., Tenenhouse, A., Davison, K.,
Josse, R. & Prior, J. (2010). Peak bone mass from longitudinal data: implications for the prevalence, pathophysiology, and diagnosis of osteoporosis. JBMR 25(9): 1948-1957.
Borrud, L., Flegal, K., Freedman, D., Li, Y. & Ogden, C. (2011).Smoothed percentage body fat percentiles for US children and adolescents, 1999-2004. USA: Centre for Disease Control and Prevention.
Boulier, A., Fricker, J., Thomasset, A. & Apfelbaum, M. (1990). Fat-free mass estimation by the two-electrode impedance method. Am J Clin Nutr 52(4): 581-585.
Bowling, A. (2014). Research Methods in Health: Investigating Health and Health Services. UK: McGraw-Hill Education.
Brodie, D., Moscrip, H. & Hutcheon, R. (1998). Body Composition Measurement: A Review of Hydrodensitometry, Anthropometry, and Impedance Methods. Nutr 14(3): 296-310.
Brozek, J., Grande, F., Anderson, J. & Keys, A. (1963). Densitometric analysis of body composition: revision of some quantitative assumptions. NYAS 110(1): 113-140.
Butt, D. (2017).Registered Nurse at the SAJA. Camarneiro, J., Júnior, J., Ciampo, L., Navarro, A., Antonucci, G. & Monteiro, J. (2013). Body composition
estimatives by anthropometry, bioelectrical impedance and deuterium oxide dilution in obese adolescents. FNS 4(10): 9-17.
Casa, D., Armstrong, L., Hillman, S., Montain, S., Reiff, R., Rich, B., Roberts, W. & Stone, J. (2000). National Athletic Trainers' Association position statement: fluid replacement for athletes. J Athl Train 35(2): 212-224.
Casa, D., Clarkson, P. & Roberts, W. (2005). American College of Sports Medicine roundtable on hydration and physical activity: consensus statements. CSMR 4(3): 115-127.
167
Case, D., Armstrong, L., Hillman, S., Montain, S., Reiff, R., Rich, B., Roberts, W. & Stone, J. (2000). National Athletic Trainers' Association Position Statement: Fluid Replacement for Athletes. J Athl Train 35(2): 212-224.
Caulfield, M. & Karageorghis, C. (2008). Psychological effects of rapid weight loss and attitudes towards eating among professional jockeys. J Sport Sci 26(9): 877-883.
Cotugna, N., Snider, O. & Windish, J. (2011). Nutrition assessment of horse-racing athletes. J Community Health 36(2): 261-264.
Creswell, J. (2013). Research design: Qualitative, quantitative, and mixed methods approaches. Callifornia: Sage.
Cullen, S. (2014).The health and performance characteristics of current and retired jockeys in Ireland. Dublin City University.
Cullen, S., Dolan, E., McGoldrick, A., Brien, K., Carson, B. & Warrington, G. (2015). The impact of making-weight on cognitive performance in apprentice jockeys. J Sport Sci 33(15): 1589-1595.
Cullen, S., Donohoe, A., McGoldrick, A., McCaffrey, N., Davenport, C., Byrne, B., Donaghy, C., Tormey, W., Smith, D. & Warrington, G. (2016). Physiological and health characteristics of ex-jockeys. J Sports Sci Med 19(4): 283-287.
Cunningham, J. (1991). Body composition as a determinant of energy expenditure: a synthetic review and a proposed general prediction equation. Am J Clin Nutr 54(6): 963-969.
Cvijetić Avdagić, S., Colić Barić, I., Keser, I., Cecić, I., Šatalić, Z., Bobić, J. & Gomzi, M. (2009). Peak bone mass from longitudinal data: implications for the prevalence, pathophysiology, and diagnosis of osteoporosis. Arhiv za higijenu rada i toksikologiju 60(1): 79-86.
De Lorenzo, A., Iacopino, L., Andreoli, A. & Petrone De Luca, P. (1998). Fat-free mass by bioelectrical impedance vs dual-energy X-ray absorptiometry (DXA). Appl Radiat lsot 49(5/6): 739-741.
Demirkan, E., Kutlu, M., Koz, M., Özal, M., Güçlüöver, A. & Favre, M. (2014). Effects of hydration changes on body composition of wrestlers. IJSS 4(2): 196-200.
Deurenberg, P., Deurenberg‐Yap, M. & Guricci, S. (2002). Asians are different from Caucasians and from each other in their body mass index/body fat per cent relationship. Obes Rev 3(3): 141-146.
Deurenberg, P., Pieters, J. & Hautvast, J. (1990). The assessment of the body fat percentage by skinfold thickness measurements in childhood and young adolescence. Brit J Nutr 63(02): 293-303.
Deurenberg, P., Van der Kooy, K., Leenen, R., Weststrate, J. & Seidell, J. (1991a). Sex and age specific prediction formulas for estimating body composition from bioelectrical impedance: a cross-validation study. Int J Obes 15(1): 17-25.
Deurenberg, P., Van der Kooy, K., Leenen, R., Weststrate, J. & Seidell, J. (1991b). Sex and age specific prediction formulas for estimating body composition from bioelectrical impedance: a cross-validation study. International journal of obesity 15(1): 17-25.
Deurenberg, P., Weststrate, J. & Seidell, J. (1991c). Body mass index as a measure of body fatness: age-and sex-specific prediction formulas. Br J Nutr 65(02): 105-114.
Deurenberg, P., Yap, M. & Van Staveren, W. (1998). Body mass index and percent body fat: a meta analysis among different ethnic groups. Int J Obes Relat Metab Disord 22(12): 1164-1171.
Dolan, E., Crabtree, N., McGoldrick, A., Ashley, D., McCaffrey, N. & Warrington, G. (2012a). Weight regulation and bone mass: a comparison between professional jockeys, elite amateur boxers, and age, gender and BMI matched controls. J Bone Miner Metab 30(2): 164-170.
Dolan, E., Cullen, S., McGoldrick, A. & Warrington, G. (2013). The impact of “making-weight” on physiological and cognitive processes in elite jockeys. Int J Sport Nutr Exerc Metab 23(4): 399-408.
Dolan, E., McGoldrick, A., Davenport, C., Kelleher, G., Byrne, B., Tormey, W., Smith, D. & Warrington, G. (2012b). An altered hormonal profile and elevated rate of bone loss are associated with low bone mass in professional horse-racing jockeys. J Bone Miner Metab 30(5): 534-542.
168
Dolan, E., McGoldrick, A., McCaffrey, N., O'Connor, P., May, G., Fitzpatrick, P. & Warrington, G. (2009). Comparison Between Skinfolds And Dexa For Determination Of Body Composition In Weight Category Athletes: 2787: Board# 181 May 29 3: 30 PM-5: 00 PM. Med Sci Sports Exerc 41(5): 460-460.
Dolan, E., McGoldrick, P., Mac Manus, C., O'Gorman, D., Moyna, N. & Warrington, G. (2007). Comparison Of The Hydration Status Of Top Level Jockeys On A Racing And Non‐racing Day: 956: June 2 10: 15 AM‐10: 30 AM. Med Sci Sports Exerc 39(5): S101.
Dolan, E., O'Connor, H., McGoldrick, A., O'Loughlin, G., Lyons, D. & Warrington, G. (2011). Nutritional, lifestyle, and weight control practices of professional jockeys. J Sport Sci 29(8): 791-799.
Donadio, C., Halim, A. B., Caprio, F., Grassi, G., Khedr, B. & Mazzantini, M. (2008). Single-and multi-frequency bioelectrical impedance analyses to analyse body composition in maintenance haemodialysis patients: comparison with dual-energy x-ray absorptiometry. Physiol Meas 29(6): S517-S524.
Doninger, G., Enders, C. & Burnett, K. (2005). Validity Evidence for Eating Attitudes Test Scores in a Sample of Female College Athletes. Meas Phys Educ Exerc Sci 9(1): 35-49.
Dudovskiy, J. (2016).The Ultimate Guide to Writing a Dissertation in Business Studies: A step-by-step assistance.
Durnin, J. & Rahaman, M. (1967). The assessment of the amount of fat in the human body from measurements of skinfold thickness. Br J Nutr 21(1): 681-689.
Durnin, J. & Womersley, J. (1974). Body fat assessed from total body density and its estimation from skinfold thickness: measurements on 481 men and women aged from 16 to 72 years. Br J Nutr 32(1): 77-97.
Equicizer TM (2017).https://equicizer.com/pages/overview (Acessed 07/09/2017). Evans, E., Rowe, D., Misic, M., Prior, B. & Arngrimsson, S. (2005). Skinfold prediction equation for
athletes developed using a four-component model. Med Sci Sports Exerc 37(11): 2006-2011. Flegal, K., Shepherd, J., Looker, A., Graubard, B., Borrud, L., Ogden, C., Harris, T., Everhart, J. & Schenker,
N. (2009). Comparisons of percentage body fat, body mass index, waist circumference, and waist-stature ratio in adults. AJCN 89(2): 500-508.
Forsyth, H. & Sinning, W. (1973). The anthropometric estimation of body density and lean body weight of male athletes. Med Sci Sports 5(3): 174-180.
Friedl, K., Moore, R., Martinez-Lopez, L., Vogel, J., Askew, E., Marchitelli, L., Hoyt, R. & Gordon, C. (1994). Lower limit of body fat in healthy active men. J Appl Physiol 77(2): 933-940.
Fu, F. & Stone, D. (1994). Sports injuries: mechanisms, prevention, treatment. Baltimore, USA: Williams & Wilkins.
Fuller, N., Jebb, S., Laskey, M., Coward, W. & Elia, M. (1992). Four-component model for the assessment of body composition in humans: comparison with alternative methods, and evaluation of the density and hydration of fat-free mass. Clin Sci 82(6): 687-693.
Gallagher, D., Heymsfield, S., Heo, M., Jebb, S., Murgatroyd, P. & Sakamoto, Y. (2000). Healthy percentage body fat ranges: an approach for developing guidelines based on body mass index. Am J Clin Nutr 72(3): 694-701.
García-Trabanino, R., Jarquín, E., Wesseling, C., Johnson, R., González-Quiroz, M., Weiss, I., Glaser, J., Vindell, J., Stockfelt, L. & Roncal, C. (2015). Heat stress, dehydration, and kidney function in sugarcane cutters in El Salvador–a cross-shift study of workers at risk of Mesoamerican nephropathy. Environ Res 142: 746-755.
Garner, D. & Garfinkel, P. (1979). The Eating Attitudes Test: An index of the symptoms of anorexia nervosa. Psychol Med 9(02): 273-279.
Garner, D., Olmsted, M., Bohr, Y. & Garfinkel, P. (1982). The eating attitudes test: psychometric features and clinical correlates. Psychol Med 12(04): 871-878.
169
Ghosh, S., Meister, D., Cowen, S., Hannan, J. & Ferguson, A. (1997). Body composition at the bedside. Eur J Gastroenterol Hepatol 9(8): 783-788.
Giavarina, D. (2015). Understanding bland altman analysis. Biochemia medica 25(2): 141-151. Gjesdal, C., Halse, J., Eide, G., Brun, J. & Tell, G. (2008). Impact of lean mass and fat mass on bone
mineral density: The Hordaland Health Study. Maturitas 59(2): 191-200. Gold Circle (2016). Annual report 2016. Available at
http://www.goldcircle.co.za/downloads/GCAnnualReport2016.pdf. Gomez-Ambrosi, J., Rodriguez, A., Catalan, V. & Frühbeck, G. (2008). The bone-adipose axis in obesity
and weight loss. Obes Surg 18(9): 1134-1143. Gray, D., Bray, G., Gemayel, N. & Kaplan, K. (1989). Effect of obesity on bioelectrical impedance. AJCN
50(2): 255-260. Gudivaka, R., Schoeller, D., Kushner, R. & Bolt, M. (1999). Single-and multifrequency models for
bioelectrical impedance analysis of body water compartments. J Appl Physiol 87(3): 1087-1096. Harris, J. & Benedict, F. (1918). A biometric study of human basal metabolism. Proc Natl Acad Sci 4(12):
370-373. Heitmann, B. (1990). Evaluation of body fat estimated from body mass index, skinfolds and impedance.
A comparative study. Eur J Clin Nutr 44(11): 831-837. Hetzler, R., Kimura, I., Haines, K., Labotz, M. & Smith, J. (2006). A comparison of bioelectrical impedance
and skinfold measurements in determining minimum wrestling weights in high school wrestlers. J Athl Train 41(1): 46-51.
Heymsfield, S., Wang, J., Lichtman, S., Kamen, Y., Kehayias, J. & Pierson, R. (1989). Body composition in elderly subjects: A critical appraisal of clinical methodology. Am J Clin Nutr 50: 1167-1175.
Heyward, V. (2001). ASEP methods recommendation: body composition assessment. J Exerc Physiol 4(4): 1-12.
Heyward, V. & Wagner, D. (2004). Applied body composition assessment. Leeds, United Kingdom: Human Kinetics.
Himes, J., Roche, A. & Siervogel, R. (1979). Compressibility of skinfolds and the measurement of subcutaneous fatness. AJCN 32(8): 1734-1740.
Houtkooper, L., Going, S., Lohman, T., Roche, A. & Van Loan, M. (1992). Bioelectrical impedance estimation of fat-free body mass in children and youth: a cross-validation study. J Appl Physiol 72(1): 366-373.
Houtkooper, L., Lohman, T., Going, S. & Howell, W. (1996). Why bioelectrical impedance analysis should be used for estimating adiposity. Am J Clin Nutr 64(3): 436S-448S.
Huggins, M. (2014). Flat racing and British society, 1790-1914: A social and economic history. UK: Routledge.
Hulley, S., Cummings, S., Browner, W., Grady, D. & Newman, T. (2013). Designing clinical research. Philadelphia: Lippincott Williams & Wilkins.
Hume, P. & Marfell-Jones, M. (2008). The importance of accurate site location for skinfold measurement. J Sport Sci 26(12): 1333-1340.
International Atomic Energy Agency (2010). Introduction to body composition assessment using the deuterium dilution technique with analysis of saliva samples by Fourier transform infrared spectrometry. Vienna: International Atomic Energy Agency.
International Society for the Advancement of Kinanthropometry (2001). International standards for anthropometric assessment. Australia: International Society for the Advancement of Kinanthropometry.
Jackson, A. & Pollock, M. (1978). Generalized equations for predicting body density of men. Br J Nutr 40(03): 497-504.
170
Jackson, A. & Pollock, M. (1985). A practical approach for assessing body composition of men, women, and athletes. Phys Sportsmed 13: 195-206.
Jackson, A., Pollock, M., Graves, J. & Mahar, M. (1988). Reliability and validity of bioelectrical impedance in determining body composition. J Appl Physiol 64(2): 529-534.
Jackson, K., Sanchez-Santos, M., MacKinnon, A., Turner, A., Kuznik, K., Ellis, S., Box, C., Hill, J., Javaid, M. & Cooper, C. (2017). Bone density and body composition in newly licenced professional jockeys. Osteoporos Int 28(9): 2675-2682.
Jinabhai, C., Reddy, P., Taylor, M., Monyeki, D., Kamabaran, N., Omardien, R. & Sullivan, K. (2007). Sex differences in under and over nutrition among school‐going Black teenagers in South Africa: an uneven nutrition trajectory. Trop Med Int Health 12(8): 944-952.
Joy, E., Kussman, A. & Nattiv, A. (2016). 2016 update on eating disorders in athletes: A comprehensive narrative review with a focus on clinical assessment and management. Br J Sports Med 50(3): 154-162.
Katch, F. & McArdle, W. (1973). Prediction of body density from simple anthropometric measurements in college-age men and women. Hum Biol 45(3): 445-455.
Kenefick, R., Cheuvront, S., Leon, L. & O'Brien, K. K. (2012).Dehydration and rehydration. DTIC Document.
Kim, J., Kim, M., Kim, G., Park, J. & Kim, E. (2015). Accuracy of predictive equations for resting metabolic rate in Korean athletic and non-athletic adolescents. Nutr Res Pract 9(4): 370-378.
King, M. & Mezey, G. (1987). Eating behaviour of male racing jockeys. Psychol Med 17(01): 249-253. Kispert, C. & Merrifield, H. (1987). Interrater reliability of skinfold fat measurements. Phys Ther 67(6):
917-920. Konings, C., Kooman, J., Schonck, M., van Kreel, B., Heidendal, G., Cheriex, E., van der Sande, F. &
Leunissen, K. (2003). Influence of fluid status on techniques used to assess body composition in peritoneal dialysis patients. Perit Dial Int 23(2): 184-190.
Krog, K. (2015)."Dietary intake, energy availability and weight control practices of male apprentice jockeys residing at the SA Jockey Academy". MA. North-West University. Accessed June 2016. Google Scholar.
Kupusinac, A., Stokić, E., Sukić, E., Rankov, O. & Katić, A. (2017). What kind of Relationship is Between Body Mass Index and Body Fat Percentage? JMed Syst 41(1): 5-12.
Kyle, U., Bosaeus, I., De Lorenzo, A., Deurenberg, P., Elia, M., Gómez, J., Heitmann, B., Kent-Smith, L., Melchior, J. & Pirlich, M. (2004a). Bioelectrical impedance analysis—part I: review of principles and methods. Clin Nutr 23(5): 1226-1243.
Kyle, U., Bosaeus, I., De Lorenzo, A., Deurenberg, P., Elia, M., Gómez, J., Heitmann, B., Kent-Smith, L., Melchior, J. & Pirlich, M. (2004b). Bioelectrical impedance analysis—part II: utilization in clinical practice. Clin Nutr 23(6): 1430-1453.
Kyle, U., Genton, L., Karsegard, L., Slosman, D. & Pichard, C. (2001). Single prediction equation for bioelectrical impedance analysis in adults aged 20-94 years. Nutr 17(3): 248-253.
Kyle, U., Schutz, Y., Dupertuis, Y. & Pichard, C. (2003). Body composition interpretation: contributions of the fat-free mass index and the body fat mass index. Nutr 19(7): 597-604.
Labadarios, D., Kotze, J., Momberg, D. & Kotze, T. (1993).Jockeys and their practices in South Africa. In Nutrition and Fitness for Athletes, 97-114: Karger Publishers.
Lean, M., Han, T. & Deurenberg, P. (1996). Predicting body composition by densitometry from simple anthropometric measurements. AJCN 63(1): 4-14.
Leydon, M. & Wall, C. (2002). New Zealand jockeys' dietary habits and their potential impact on health. Int J Sport Nutr Exerc Metab 12(2): 220-237.
Livingstone, C. (2008). Dictionary of sport and exercise science and medicine. Retrieved April 14: 2015.
171
Lohman, T. (1981). Skinfolds and Body Density and Their Relation to Body Fatness: A Review. Hum Biol 53(2): 181-225.
Lohman, T. (1992). Advances in Body Composition Assessment. Champaigne, IL: Human Kinetics. Lohman, T., Harris, M., Teixeira, P. & Weiss, L. (2000). Assessing body composition and changes in body
composition: another look at dual‐energy x‐ray absorptiometry. Ann N Y Acad Sci 904(1): 45-54. Lombard, M., Steyn, N., Charlton, K. & Senekal, M. (2015). Application and interpretation of multiple
statistical tests to evaluate validity of dietary intake assessment methods. Nutr J 14(1): 40. López-Alvarenga, J., Montesinos-Cabrera, R., Velázquez-Alva, C. & González-Barranco, J. (2003). Short
stature is related to high body fat composition despite body mass index in a Mexican population. Archives of medical research 34(2): 137-140.
Ltd, L. R. (2012).http://dissertation.laerd.com/total-population-sampling.php (Acessed 07/09/2017). Lukaski, H., Bolonchuk, W., Hall, C. & Siders, W. (1986). Validation of tetrapolar bioelectrical impedance
method to assess human body composition. J Appl Physiol 60(4): 1327-1332. Manore, M. & Thompson, J. (2006). Energy requirements of the athlete: assessment and evidence of
energy efficiency. Australia: McGraw Hill. Marfell-Jones, M. J., Stewart, A. & De Ridder, J. (2012). International standards for anthropometric
assessment. Wellington, New Zealand: International Society for the Advancement of Kinanthropometry.
Markham, K. & Fountaine, C. (2011). Comparison of Bodpod, Omron, and Bodystat body composition measurements in track and field athletes. Med Sci Sports Exerc 43(5): 873.
Marshall, W. & Tanner, J. (1968). Growth and Physiological Development During Adolescence. Annual Review of Medicine 19(1): 283-300.
Martinoli, R., Mohamed, E., Maiolo, C., Cianci, R., Denoth, F., Salvadori, S. & Iacopino, L. (2003). Total body water estimation using bioelectrical impedance: a meta-analysis of the data available in the literature. Acta Diabetol 40(2003): s203-s206.
Martins, V., Toledo Florêncio, T., Grillo, L., Do Carmo P Franco, M., Martins, P., Clemente, A., Santos, C., Vieira, M. & Sawaya, A. (2011). Long-lasting effects of undernutrition. Int J Environ Res Public Health 8(6): 1817-1846.
Mazess, R., Barden, H. & Hanson, J. (1990). Body Composition by Dual-Photon Absorptiometry and Dual-Energy X-Ray Absorptiometry. Boston, MA: Springer US.
Mazess, R. B., Barden, H. S., Bisek, J. P. & Hanson, J. (1990). Dual-energy x-ray absorptiometry for total-body and regional bone-mineral and soft-tissue composition. Am J Clin Nutr 51.
Meadows, K. (2003). So you want to do research? 5: Questionnaire design. Br J Community Nurs 8(12): 562-570.
Meeuwsen, S., Horgan, G. & Elia, M. (2010a). The relationship between BMI and percent body fat, measured by bioelectrical impedance, in a large adult sample is curvilinear and influenced by age and sex. Clin Nutr 29(5): 560-566.
Meeuwsen, S., Horgan, G. & Elia, M. (2010b). The relationship between BMI and percent body fat, measured by bioelectrical impedance, in a large adult sample is curvilinear and influenced by age and sex. Clin Nutr (Edinburgh, Scotland) 29(5): 560-566.
Mifflin, M., St Jeor, S., Hill, L., Scott, B., Daugherty, S. A. & Koh, Y. (1990). A new predictive equation for resting energy expenditure in healthy individuals. Am J Clin Nutr 51(2): 241-247.
Mitchison, D., Hay, P., Griffiths, S., Murray, S., Bentley, C., Gratwick‐Sarll, K., Harrison, C. & Mond, J. (2017). Disentangling body image: the relative associations of overvaluation, dissatisfaction, and preoccupation with psychological distress and eating disorder behaviors in male and female adolescents. International Journal of Eating Disorders 50(2): 118-126.
Moore, J., Timperio, A., Crawford, D., Burns, C. & Cameron-Smith, D. (2002a). Weight management and weight loss strategies of professional jockeys. Int J Sport Nutr Exerc Metab 12(1): 1-13.
172
Moore, J., Timperio, A., Crawford, D., Burns, C. & Cameron-Smith, D. (2002b). Weight management and weight loss strategies of professional jockeys.
Moreno, L., Joyanes, M., Mesana, M., González-Gross, M., Gil, C., Sarría, A., Gutierrez, A., Garaulet, M., Perez-Prieto, R., Bueno, M. & Marcos, A. (2003). Harmonization of anthropometric measurements for a multicenter nutrition survey in Spanish adolescents. Nutr 19(6): 481-486.
Mountjoy, M., Sundgot-Borgen, J., Burke, L., Carter, S., Constantini, N., Lebrun, C., Meyer, N., Sherman, R., Steffen, K. & Budgett, R. (2014). The IOC consensus statement: beyond the female athlete triad—Relative Energy Deficiency in Sport (RED-S). Br J Sports Med 48(7): 491-497.
Mountjoy, M., Sundgot-Borgen, J., Burke, L., Carter, S., Constantini, N., Lebrun, C., Meyer, N., Sherman, R., Steffen, K. & Budgett, R. (2015). Authors’ 2015 additions to the IOC consensus statement: Relative Energy Deficiency in Sport (RED-S). Br J Sports Med 49(7): 417-420.
Mueller, W. & Stallones, L. (1981). Anatomical distribution of subcutaneous fat: skinfold site choice and construction of indices. Hum Biol 53(3): 321-335.
Murray, S. (2017). Gender Identity and Eating Disorders: The Need to Delineate Novel Pathways for Eating Disorder Symptomatology. Journal of Adolescent Health 60: 1-2.
National Horse Racing Authority of South Africa (2016).A Guide to Handicapping in Southern Africa Vol. 2016.
Nevill, A., Stewart, A., Olds, T. & Holder, R. (2006). Relationship between adiposity and body size reveals limitations of BMI. Am J Phys Anthropol 129(1): 151-156.
Norgan, N. (1997a). The beneficial effects of body fat and adipose tissue in humans. Int J Obes Relat Metab Disord 21(9): 738-746.
Norgan, N. (1997b). The beneficial effects of body fat and adipose tissue in humans. International Journal of Obesity & Related Metabolic Disorders 21(9): 738-746.
Norton, K. & Olds, T. (1996). Anthropometrica: a textbook of body measurement for sports and health courses. Australia: UNSW press.
O’Reilly, J., Cheng, H. & Poon, E. (2017). New insights in professional horse racing; “in-race” heart rate data, elevated fracture risk, hydration, nutritional and lifestyle analysis of elite professional jockeys. J Sport Sci 35(5): 441-448.
Oppliger, R., Magnes, S., Popowski, L. & Gisolfi, C. (2005). Accuracy of urine specific gravity and osmolality as indicators of hydration status. Int J Sport Nutr Exerc Metab 15(3): 236-251.
Organ, L., Bradham, G., Gore, D. & Lozier, S. (1994). Segmental bioelectrical impedance analysis: theory and application of a new technique. J Appl Physiol 77(1): 98-112.
Ostojic, S. (2006). Estimation of body fat in athletes: skinfolds vs bioelectrical impedance. J Sports Med Phys Fitness 46(3): 442-446.
Owen, O., Holup, J., D'Alessio, D., Craig, E., Polansky, M., Smalley, K., Kavle, E., Bushman, M., Owen, L. & Mozzoli, M. (1987). A reappraisal of the caloric requirements of men. Am J Clin Nutr 46(6): 875-885.
Pannucci, C. & Wilkins, E. (2010). Identifying and avoiding bias in research. Plast Reconstr Surg 126(2): 619-625.
Pařízková, J. (1977).Lean body mass and depot fat during ontogenesis in humans. In Body Fat and Physical Fitness, 24-51 Netherlands, Dordrecht: Springer.
Parker, L., Reilly, J., Slater, C., Wells, J. & Pitsiladis, Y. (2003). Validity of six field and laboratory methods for measurement of body composition in boys. Obesity Research 11(7): 852-858.
Peterson, M., Czerwinski, S. & Siervogel, R. (2003). Development and validation of skinfold-thickness prediction equations with a 4-compartment model. Am J Clin Nutr 77(5): 1186-1191.
Phumelela (2016). Integrated report 2016. Available at http://www.phumelela.com/Horseracing/General.
173
Pialoux, V., Mischler, I., Mounier, R., Gachon, P., Ritz, P., Coudert, J. & Fellmann, N. (2004). Effect of equilibrated hydration changes on total body water estimates by bioelectrical impedance analysis. Br J Nutr 91(1): 153-159.
Piers, L., Soares, M., Frandsen, S. & O'dea, K. (2000). Indirect estimates of body composition are useful for groups but unreliable in individuals. Int J Obes Relat Metab Disord 24(9): 1145-1152.
Pope, Z., Gao, Y., Bolter, N. & Pritchard, M. (2015). Validity and reliability of eating disorder assessments used with athletes: A review. Journal of Sport and Health Science 4(3): 211-221.
Popkin, B., D'anci, K. & Rosenberg, I. (2010). Water, hydration, and health. Nutr Rev 68(8): 439-458. Preedy, V. (2012). Handbook of anthropometry: physical measures of human form in health and disease.
New York: Springer. Raevuori, A., Keski-Rahkonen, A. & Hoek, H. (2014). A review of eating disorders in males. Curr Opin
Psychiatry 27(6): 426-430. Ralph, A., Garrow, J. & James, W. (2000). Human nutrition and dietetics. Edinburgh: Churchill
Livingstone. Rodriguez, G., Moreno, L., Blay, M., Blay, V., Fleta, J., Sarria, A. & Bueno, M. (2005). Body fat
measurement in adolescents: comparison of skinfold thickness equations with dual-energy X-ray absorptiometry. Eur J Clin Nutr 59(10): 1158-1166.
Rueda, M., Halley, W. & Gilchrist, M. (2010). Fall and injury incidence rates of jockeys while racing in Ireland, France and Britain. Injury 41(5): 533-539.
Ruiz, L., Colley, J. & Hamilton, P. (1971). Measurement of triceps skinfold thickness. An investigation of sources of variation. Brit J Prev Soc Med 25(3): 165-167.
Saunders, M., Blevins, J. & Broeder, C. (1998). Effects of hydration changes on bioelectrical impedance in endurance trained individuals. Med Sci Sports Exerc 30(6): 885-892.
Sawka, M., Burke, L., Eichner, R., Maughan, R., Monatin, S. & Stachenfeld, N. (2007). Exercise and fluid replacement: ACSM Position Stand. Med Sci Sports Exerc 39(2): 377–390.
Schutte, J., Townsend, E., Hugg, J., Shoup, R., Malina, R. & Blomqvist, C. (1984). Density of lean body mass is greater in blacks than in whites. J Appl Physiol 56(6): 1647-1649.
Schutz, Y., Kyle, U. & Pichard, C. (2002). Fat-free mass index and fat mass index percentiles in Caucasians aged 18-98 y. Int J Obes 26(7): 953–960.
Segal, K., Van Loan, M., Fitzgerald, P., Hodgdon, J. & Van Itallie, T. B. (1988). Lean body mass estimation by bioelectrical impedance analysis: a four-site cross-validation study. AJCN 47(1): 7-14.
Shapiro, S. & Wilk, M. (1965). An analysis of variance test for normality (complete samples). Biometrika 52(3/4): 591-611.
Shields, P. & Rangarajan, N. (2013). A playbook for research methods: Integrating conceptual frameworks and project management. Stillwater, OK: New Forums Press.
Shisana, O., Labadarios, D., Rehle, T., Simbayi, L., Zuma, K., Dhansay, A., Reddy, P., Parker, W., Hoosain, E. & Naidoo, P. (2014).The South African National Health and Nutrition Examination Survey, 2012: SANHANES-1: the health and nutritional status of the nation. (Ed D. o. Health). Cape Town, South Africa: HSRC press.
Silk, L., Greene, D., Baker, M. & Jander, C. (2015). Tibial bone responses to 6-month calcium and vitamin D supplementation in young male jockeys: A randomised controlled trial. Bone 81: 554-561.
Sinning, W., Dolny, D., Little, K., Cunningham, L., Racaniello, A., Siconolfi, S. & Sholes, J. (1985). Validity of “generalized” equations for body composition analysis in male athletes. Med Sci Sports Exerc 17(1): 124-130.
Siri, W. (1961).Body composition from fluid spaces and density: Analysis of methods. In Techniques for measuring body composition, 223-244 (Eds J. Brozek and A. Henschel). Washington, DC: National Academy of Sciences.
174
Slaughter, M., Lohman, T., Boileau, R., Horswill, C., Stillman, R., Van Loan, M. & Bemben, D. (1988). Skinfold equations for estimation of body fatness in children and youth. Hum Biol 60(5): 709-723.
Sloan, A. (1967). Estimation of body fat in young men. J Appl Physiol 23: 311-315. Sloet van Oldruitenborgh‐Oosterbaan, M., Barneveld, A. & Schamhardt, H. (1995). Effects of weight and
riding on workload and locomotion during treadmill exercise. Equine Veterinary Journal 27(S18): 413-417.
Smye, S., Sutcliffe, J. & Pitt, E. (1993). A comparison of four commercial systems used to measure whole-body electrical impedance. Physiol Meas 14(4): 473-478.
Sopori, M. (2002). Effects of cigarette smoke on the immune system. Nat Rev Immunol 2(5): 372. Stack, A., Casserly, L., Cronin, C., Chernenko, T., Cullen, W., Hannigan, A., Saran, R., Johnson, H., Browne,
G. & Ferguson, J. (2014). Prevalence and variation of Chronic Kidney Disease in the Irish health system: initial findings from the National Kidney Disease Surveillance Programme. BMC nephrology 15(1): 185-197.
Stanifer, J., Jing, B., Tolan, S., Helmke, N., Mukerjee, R., Naicker, S. & Patel, U. (2014). The epidemiology of chronic kidney disease in sub-Saharan Africa: a systematic review and meta-analysis. Lancet Glob Health 2(3): e174-e181.
Stewart, A. & Hannan, W. (2000). Prediction of fat and fat-free mass in male athletes using dual X-ray absorptiometry as the reference method. J Sport Sci 18(4): 263-274.
Strother, E., Lemberg, R., Stanford, S. & Turberville, D. (2012). Eating disorders in men: underdiagnosed, undertreated, and misunderstood. Eating disorders 20(5): 346-355.
Sun, S., Chumlea, W., Heymsfield, S., Lukaski, H., Schoeller, D., Friedl, K., Kuczmarski, R., Flegal, K., Johnson, C. & Hubbard, V. (2003). Development of bioelectrical impedance analysis prediction equations for body composition with the use of a multicomponent model for use in epidemiologic surveys. Am J Clin Nutr 77(2): 331-340.
Sundgot-Borgen, J., Meyer, N., Lohman, T., Ackland, T., Maughan, R., Stewart, A. & Müller, W. (2013). How to minimise the health risks to athletes who compete in weight-sensitive sports review and position statement on behalf of the Ad Hoc Research Working Group on Body Composition, Health and Performance, under the auspices of the IOC Medical Commission. Br J Sports Med 47(16): 1012-1022.
The Jockey Club (2017).http://www.thejockeyclub.co.uk/about/our-heritage (Acessed 07/05/2017). The National Horse Racing Authority of Southern Africa (2016).A Guide to Handicapping in Southern
Africa. The National Horse Racing Authority of Southern Africa. The South African Jockey Academy (2007a).http://www.saja.co.za/index.shtml (Accessed 10/02/2017). The South African Jockey Academy (2007b).http://www.saja.co.za/jockeyschedule.shtml (Acessed
12/08/2016). The South African Jockey Academy (2007c).http://www.saja.co.za/jockeyselection.shtml (Acessed
10/02/2017). Thiese, M. (2014). Observational and interventional study design types; an overview. Biochemia medica:
Biochemia medica 24(2): 199-210. Thompson, D., Thompson, W., Prestridge, T., Bailey, J., Bean, M., Brown, S. & McDaniel, J. (1991). Effects
of hydration and dehydration on body composition analysis: a comparative study of bioelectric impedance analysis and hydrodensitometry. J Sports Med Phys Fitness 31(4): 565-570.
Thompson, J. & Manore, M. (1996). Predicted and measured resting metabolic rate of male and female endurance athletes. J Am Diet Assoc 96(1): 30-34.
Topend Sports Network (2015).http://www.topendsports.com/testing/density-jackson-pollock.htm (Acessed 10/07/2017).
175
Utter, A., Goss, F., Swan, P., Harris, G., Robertson, R. & Trone, G. (2003). Evaluation of air displacement for assessing body composition of collegiate wrestlers. Med Sci Sports Exerc 35(3): 500-505.
Van der Ploeg, G., Gunn, S., Withers, R. & Modra, A. (2003). Use of anthropometric variables to predict relative body fat determined by a four-compartment body composition model. EJCN 57(8): 1009-1016.
Van Loan, M., Boileau, R., Slaughter, M., Stillman, R., Lohman, T., Going, S. & Carswell, C. (1990). Association of bioelectrical resistance with estimates of fat‐free mass determined by densitometry and hydrometry. Am J Hum Biol 2(3): 219-226.
VanItallie, T., Yang, M., Heymsfield, S., Funk, R. & Boileau, R. (1990). Height-normalized indices of the body's fat-free mass and fat mass: potentially useful indicators of nutritional status. AJCN 52(6): 953-959.
Vetrovska, R., Vilikus, Z., Klaschka, J., Stranska, Z., Svacina, S., Svobodova, S. & Matoulek, M. (2014). Does impedance measure a functional state of the body fat? Physiol Res 63: S309-S320.
Vickery, S., Cureton, K. & Collins, M. (1988). Prediction of body density from skinfolds in black and white young men. Hum Biol 60(1): 135-149.
Wagner, D. & Heyward, V. (2000). Measures of body composition in blacks and whites: a comparative review. AJCN 71(6): 1392-1402.
Wagner, D., Heyward, V., Kocina, P., Stolarczyk, L. & Wilson, W. (1997). Predictive accuracy of BIA equations for estimating fat-free mass of black men. Med Sci Sports Exerc 29(7): 969-974.
Waldron-Lynch, F., Murray, B., Brady, J., McKenna, M., McGoldrick, A., Warrington, G., O’Loughlin, G. & Barragry, J. (2010). High bone turnover in Irish professional jockeys. Osteoporos Int 21(3): 521-525.
Wang, J., Thornton, J., Russell, M., Burastero, S., Heymsfield, S. & Pierson, R. (1994). Asians have lower body mass index (BMI) but higher percent body fat than do whites: comparisons of anthropometric measurements. Am J Clin Nutr 60(1): 23-28.
Wang, Z., Deurenberg, P., Wang, W., Pietrobelli, A., Baumgartner, R. & Heymsfield, S. (1999). Hydration of fat-free body mass: new physiological modeling approach. Am J Physiol Endocrinol Metab 276(6): E995-E1003.
Wang, Z., Heymsfield, S., Chen, Z., Zhu, S. & Pierson, R. (2010). Estimation of percentage body fat by dual-energy x-ray absorptiometry: evaluation by in vivo human elemental composition. Phys Med Biol 55(9): 2619–2635.
Ward, K. & Klesges, R. (2001). A meta-analysis of the effects of cigarette smoking on bone mineral density. Calcif Tissue Int 68(5): 259-270.
Warrington, G., Dolan, E., McGoldrick, A., McEvoy, J., MacManus, C., Griffin, M. & Lyons, D. (2009). Chronic weight control impacts on physiological function and bone health in elite jockeys. J Sport Sci 27(6): 543-550.
Weber, D., Moore, R., Leonard, M. & Zemel, B. (2013). Fat and lean BMI reference curves in children and adolescents and their utility in identifying excess adiposity compared with BMI and percentage body fat. AJCN 98(1): 49-56.
Wells, J. & Fewtrell, M. (2006). Measuring body composition. Arch Dis Child 91(7): 612-617. Wilcoxon, F. (1945). Individual comparisons by ranking methods. Biometrics bulletin 1(6): 80-83. Wilson, G., Chester, N., Eubank, M., Crighton, B., Drust, B., Morton, J. & Close, G. (2012a). An alternative
dietary strategy to make weight while improving mood, decreasing body fat, and not dehydrating: a case study of a professional jockey. Int J Sport Nutr Exerc Metab 22(3): 225.
Wilson, G., Drust, B., Morton, J. & Close, G. (2014). Weight-making strategies in professional jockeys: implications for physical and mental health and well-being. Sports Med 44(6): 785-796.
176
Wilson, G., Fraser, W., Sharma, A., Eubank, M., Drust, B., Morton, J. & Close, G. (2013a). Markers of bone health, renal function, liver function, anthropometry and perception of mood: a comparison between flat and national hunt jockeys. Int J Sports Med 34(05): 453-459.
Wilson, G., Hawken, M., Poole, I., Sparks, A., Bennett, S., Drust, B., Morton, J. & Close, G. (2013b). Rapid weight-loss impairs simulated riding performance and strength in jockeys: implications for making-weight. Journal of sports sciences 32(4): 383-391.
Wilson, G., Pritchard, P., Papageorgiou, C., Phillips, S., Kumar, P., Langan-Evans, C., Routledge, H., Owens, D., Morton, J. & Close, G. (2015). Fasted exercise and increased dietary protein reduces body fat and improves strength in jockeys. Int J Sports Med 36(12): 1008-1014.
Wilson, G., Sparks, S., Drust, B., Morton, J. & Close, G. (2012b). Assessment of energy expenditure in elite jockeys during simulated race riding and a working day: implications for making weight. Appl Physiol Nutr Metab 38(4): 415-420.
Withers, R., Craig, N., Bourdon, P. & Norton, K. (1987). Relative body fat and anthropometric prediction of body density of male athletes. Eur J Appl Physiol Occup Physiol 56(2): 191-200.
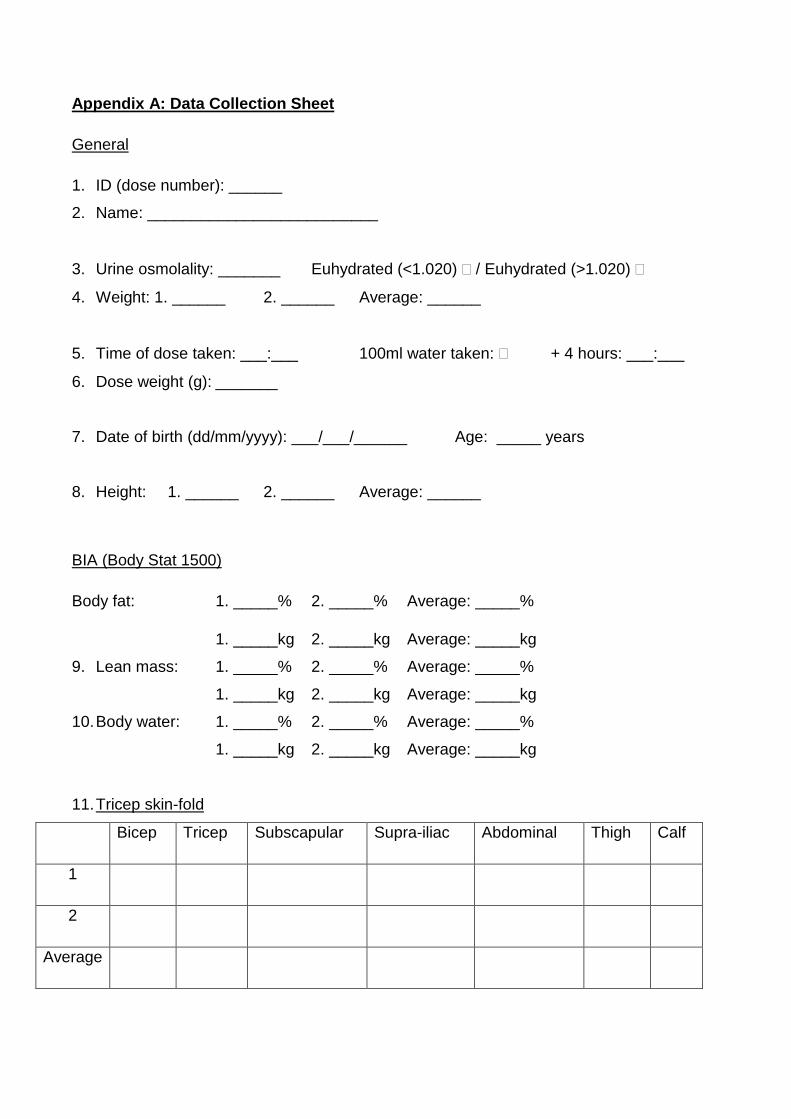
Appendix A: Data Collection Sheet
General
1. ID (dose number): ______
2. Name: __________________________
3. Urine osmolality: _______ Euhydrated (<1.020) / Euhydrated (>1.020)
4. Weight: 1. ______ 2. ______ Average: ______
5. Time of dose taken: ___:___ 100ml water taken: + 4 hours: ___:___
6. Dose weight (g): _______
7. Date of birth (dd/mm/yyyy): ___/___/______ Age: _____ years
8. Height: 1. ______ 2. ______ Average: ______
BIA (Body Stat 1500)
Body fat: 1. _____% 2. _____% Average: _____%
1. _____kg 2. _____kg Average: _____kg
9. Lean mass: 1. _____% 2. _____% Average: _____%
1. _____kg 2. _____kg Average: _____kg
10. Body water: 1. _____% 2. _____% Average: _____%
1. _____kg 2. _____kg Average: _____kg
11. Tricep skin-fold
Bicep Tricep Subscapular Supra-iliac Abdominal Thigh Calf
1
2
Average

12. Time of post-dose saliva sample: ___:___
13. 2H enrichment in saliva (mg/kg): ________
14. 2H pool space (VD, kg)
= Dose (mg)/2H concentration (mg/kg): ________

Appendix B: Lifestyle Questionnaire
Please note that there are 4 pages in this questionnaire and you are required to complete all pages.
1. ID (not to be filled in by respondents): _____
2. Apart from riding, what other exercise do you participate in regularly and for what reason? If you
don’t do an activity leave it blank. (You may tick more than one option per activity).
Activity Recreation Weight
control Fitness
To keep
busy Other –please specify
2.1 Walking
2.2 Running/jogging
2.3 Tennis
2.4 Golf
2.5 Swimming
2.6 Cycling
2.7 Weight training
2.8 Soccer
2.9 Other –please specify:
_____________________
3. Weight:
3.1 Are you happy with your current weight?
Yes
No
3.2 If no to q3.1, how much would you like to weigh? ______ kg
4. Please indicate how often you currently use the following for the purpose of controlling your
weight.

For example, if you are drinking three cups of coffee every day for the sole purpose of controlling
your weight, you will answer “always” for Q4.15. If however you are drinking the coffee for pleasure
and this is not related to weight control then you would reply never.
Ways to control weight… Never Rarely Sometimes Often Always
4.1 Not eat between meals
4.2 Not eat breakfast
4.3 Not eat lunch
4.4 Not eat dinner
4.5 Avoid eating with the family – when/if staying at
home
4.6 Avoid situations where there will be food
4.7 Keep busy to avoid eating
4.8 Restrict food intake
4.9 Fast
4.10 Choose low calorie/ diet foods
4.11 Follow your own homemade diet
4.12 Follow a diet from a magazine/ website/ book/
newspaper
4.13 Follow a vegetarian/ vegan diet
4.14 Prepare your own food eg. 2 minute noodles
4.15 Drink coffee
4.16 Drink fluids before meals to feel full
4.17 Weigh yourself every day
4.18 Exercise to use up calories
4.19 Vomit after meals
4.20 Use laxatives (specify)
__________________________________________
4.21 Smoke cigarettes

Ways to control weight… Never Rarely Sometimes Often Always
4.22 Smoke marijuana
4.23 Chew food and spit it out
4.24 Use slimming pills – prescription (specify)
__________________________________________
4.25 Use slimming pills – over the counter (specify)
__________________________________________
4.26 Use herbal preparations (specify)
__________________________________________
4.27 Other methods (please specify)
___________________________________________
5. The following is a list of behaviours used by people to control their body weight or to lose weight
over a very short period of time. Please indicate how often you currently use the following to lose
weight during training or for a race?
Behaviour Daily
A few
times a
week
Once a
week
1-3 times
a month
Less
than
once a
month
Never
5.1 Sauna
5.2 Rub downs
5.3 Wearing plastic to sweat
while exercising
5.4 Flipping
5.5 Diuretics (specify)
_______________________
5.7 Laxatives (specify)
_______________________
5.8 Other (specify)
_______________________
_______________________
_______________________

6. Please indicate how often you feel the following:
Never Rarely Sometimes Often Always
6.1 Hungry
6.2 Thirsty
7. How many cups of fluid do you think you need to drink per day in order to be healthy?
______ cups/day
Thank you for completing this questionnaire
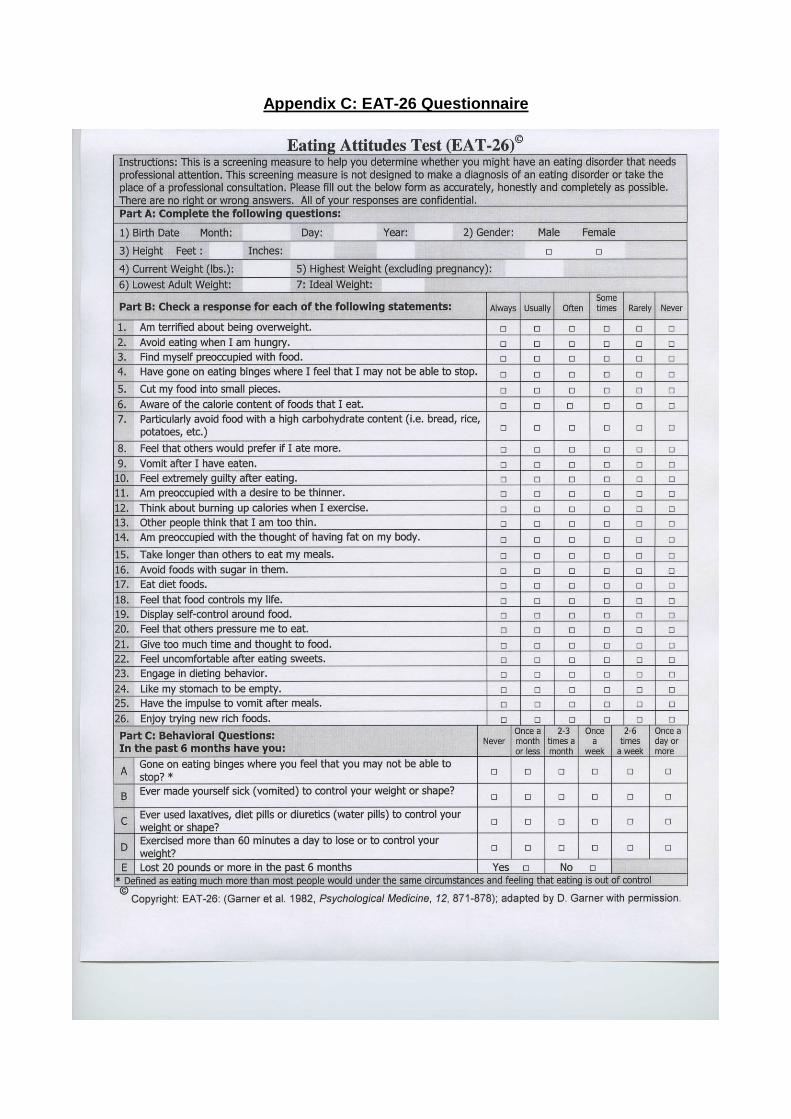
Appendix C: EAT-26 Questionnaire
Appendix D1: Information sheet and consent Form
Study title: Comparing the methods of accurately determining the percent body fat in male
jockey apprentices at the South African Jockey Academy (SAJA) and the
impact of hydration status on the accuracy of these methods
We are inviting all apprentices training at SAJA to participate in the study.
Methods under investigation include both the current technique of measuring the skinfolds at
seven sites as well as bioelectrical impedance analysis (BIA). The results will be compared
to the gold standard research technique (deuterium dilution) to determine whether these
methods accurately estimate body fat percent. Measurements will be taken on two separate
occasions in both dehydrated and well-hydrated states in order to determine the impact of
hydration status on the accuracy of measurements. Proper hydration will be achieved by
following a drinking schedule prior to measurement.
Benefits to you:
You will have an accurate measurement of your body fat percent using a
technique that is usually only available in advanced body composition research.
This research will determine the most accurate available method of measuring
body fat percent which will assist you in achieving an optimal body fat percent.
(Emma Illidge) an MSc Dietetics student of the University of KwaZulu Natal (UKZN), along
with my supervisor Dr Chara Biggs (Programme of Dietetics and Human Nutrition, UKZN),
Kathleen Krog (SAJA dietitian) and Tarryn Sneyd (biokineticist), will be conducting the study.
We are affiliated with the Programme of Dietetics and Human Nutrition of the College of
Agricultural, Earth and Environmental Science at UKZN.
If you agree to participate you will be asked to do the following:
To attend measurement sessions on 2 separate occasions
To follow a drinking schedule prior to one of these measurement sessions in
order to achieve good hydration.
Not to eat or drink for at least 1 hour prior to the measurements being taken on
both occasions
To produce a urine sample on arrival. This will tell us whether you are properly
hydrated or dehydrated so that we can determine the impact of dehydration on
the accuracy of our measurements.
To be weighed wearing shorts only.
To collect your saliva by sucking on cotton wool swabs. When wet the swabs
will then be put into a syringe and the saliva squeezed out into a test tube.
To drink a tasteless solution containing 30 g of deuterium oxide. This is the
special marker which is safe and has been used extensively in other studies.
To not eat or drink or be physically active for 4 hours after drinking the
deuterium solution to make sure the tests are very accurate.
To have your height, skinfold thickness and BIA measured during this four hour
period.
At the end of 4 hours you will be asked to give another saliva sample and the
testing will be over.
To answer a questionnaire regarding weight and weight-making techniques on
a separate occasion.
Possible risks/discomforts participating in this trial
None of these techniques are painful, uncomfortable or unsafe. There is no risk to you taking
part in the study.
Important information
You must be 18 years or older to consent to participating in this study.
Otherwise, informed consent must be obtained from a parent or legal
guardian and you must complete an assent form.
Participation is voluntary - you do not have to be part of the study and you will
not be disadvantaged if you do not participate.
You may choose to withdraw from the study at any time and you will not incur
any penalty.
When the study is over you will be given the results personally via SMS or via
email when they become available. The results of the study will also be
published and presented at meetings but your name will not be used so no one
will know who you are.
Participation in the study will require two mornings (for measurements -
approximately 5 hours each) and one afternoon (for the questionnaire -
approximately 1 hour) of your time.
The study will take place at the SAJA.
Written recordings of results will be made using a preliminary form for each
participant. No audio or video recordings will be made.
The results of this study will be published in a scientific journal and may be
presented at a congress. In signing this form, you are consenting to having the
information you provide published. As you will have been allocated an
identification number your name will not be used and you will remain
anonymous and your information confidential.
Every effort will be made to keep personal information confidential. However
absolute confidentiality cannot be guaranteed. Personal information may be
disclosed but only if required by law.
Organizations that may inspect and/or copy your research records for quality
assurance and data analysis include groups such as the Research Ethics
Committee and Data Safety Monitoring Committee (where appropriate).
The raw data collection sheets will be locked in a secured cabinet in the study
supervisor’s office and the electronic copy on a password protected memory
stick which will also be locked away. The data will be kept secure for five years
following the completion of the study and then disposed of by shredding.
Thank you for your interest in this study. If you have any questions about the study and/or
testing procedures please do not hesitate to contact me Miss Emma Illidge 071 354 1001 or
the study supervisor Dr Chara Biggs 081 4877950.
In the event of any problems or concerns, you may contact the UKZN Biomedical Research
Ethics Committee, contact details as follows:
BIOMEDICAL RESEARCH ETHICS ADMINISTRATION
Research Office, Westville Campus
Govan Mbeki Building
Private Bag X 54001
Durban
4000
KwaZulu-Natal, SOUTH AFRICA
Tel: 27 31 2604769 - Fax: 27 31 2604609
Email: [email protected]
Consent
I, the undersigned __________________________________________________
Full names, Surname and ID number
hereby confirm that I understand the contents of this document and the nature of the research
project, and I consent to participating in the research project.
I confirm that I am 18 years or older.
I understand that I am at liberty to withdraw from the project at any time, should I so desire.
SIGNATURE OF PARTICIPANT: DATE: _________________
SIGNATURE OF WITNESS: DATE: _________________
Appendix D2: Information sheet and consent form for
Parent/legal guardian
(If the participant is younger than 18 years)
Study title: Comparing the methods of accurately determining the percent body fat in male
jockey apprentices at the South African Jockey Academy (SAJA) and the
impact of hydration status on the accuracy of these methods
We are inviting all apprentices training at SAJA to participate in the study.
Methods under investigation include both the current technique of measuring the skinfolds at
seven sites as well as bioelectrical impedance analysis (BIA). The results will be compared
to the gold standard research technique (deuterium dilution) to determine whether these
methods accurately estimate body fat percent. Measurements will be taken on two separate
occasions in both dehydrated and well-hydrated states in order to determine the impact of
hydration status on the accuracy of measurements. Proper hydration will be achieved by
following a drinking schedule prior to measurement.
Benefits to the participants:
He will have an accurate measurement of your body fat percent using a
technique that is usually only available in advanced body composition research.
This research will determine the most accurate available method of measuring
body fat percent which will assist him in achieving an optimal body fat percent.
(Emma Illidge) an MSc Dietetics student of the University of KwaZulu Natal (UKZN), along
with my supervisor Dr Chara Biggs (Programme of Dietetics and Human Nutrition, UKZN),
Kathleen Krog (SAJA dietitian) and Tarryn Sneyd (biokineticist), will be conducting the study.
We are affiliated with the Programme of Dietetics and Human Nutrition of the College of
Agricultural, Earth and Environmental Science at UKZN.
If he agrees to participate he will be asked to do the following:
To attend measurement sessions on 2 separate occasions
To follow a drinking schedule prior to one of these measurement sessions in
order to achieve good hydration.
Not to eat or drink for at least 1 hour prior to the measurements being taken on
both occasions
To produce a urine sample on arrival. This will tell us whether you are properly
hydrated or dehydrated so that we can determine the impact of dehydration on
the accuracy of our measurements.
To be weighed wearing shorts only.
To collect your saliva by sucking on cotton wool swabs. When wet the swabs
will then be put into a syringe and the saliva squeezed out into a test tube.
To drink a tasteless solution containing 30 g of deuterium oxide. This is the
special marker which is safe and has been used extensively in other studies.
To not eat or drink or be physically active for 4 hours after drinking the
deuterium solution to make sure the tests are very accurate.
To have your height, skinfold thickness and BIA measured during this four hour
period.
At the end of 4 hours you will be asked to give another saliva sample and the
testing will be over.
To answer a questionnaire regarding weight and weight-making techniques on
a separate occasion.
Possible risks/discomforts participating in this trial
None of these techniques are painful, uncomfortable or unsafe. There is no risk to the
participant taking part in the study.
Important information
Participation is voluntary – the athlete does not have to be part of the study
and will not be disadvantaged if he does not participate.
The participant may choose to withdraw from the study at any time and will not
incur any penalty.
When the study is over he will be given the results personally via SMS or via
email when they become available. The results of the study will also be
published and presented at meetings but participant names will not be used
and full anonymity is ensured.
Participation in the study will require two mornings (for measurements -
approximately 5 hours each) and one afternoon (for the questionnaire -
approximately 1 hour) of your time.
The study will take place at the SAJA.
Written recordings of results will be made using a preliminary form for each
participant. No audio or video recordings will be made.
The results of this study will be published in a scientific journal and may be
presented at a congress. In signing this form, you are consenting to having the
information provided published. As participants will have been allocated an
identification number names will not be used and anonymity and confidentiality
is ensured.
Every effort will be made to keep personal information confidential. However
absolute confidentiality cannot be guaranteed. Personal information may be
disclosed but only if required by law.
Organizations that may inspect and/or copy research records for quality
assurance and data analysis include groups such as the Research Ethics
Committee and Data Safety Monitoring Committee (where appropriate).
The raw data collection sheets will be locked in a secured cabinet in the study
supervisor’s office and the electronic copy on a password protected memory
stick which will also be locked away. The data will be kept secure for five years
following the completion of the study and then disposed of by shredding.
If you have any questions about the study and/or testing procedures please do not hesitate
to contact me Miss Emma Illidge 071 354 1001 or the study supervisor Dr Chara Biggs 081
4877950.

In the event of any problems or concerns, you may contact the UKZN Biomedical Research
Ethics Committee, contact details as follows:
BIOMEDICAL RESEARCH ETHICS ADMINISTRATION
Research Office, Westville Campus
Govan Mbeki Building
Private Bag X 54001
Durban
4000
KwaZulu-Natal, SOUTH AFRICA
Tel: 27 31 2604769 - Fax: 27 31 2604609
Email: [email protected]
Consent of parent/legal guardian
I, the undersigned __________________________________________________
Full names, Surname and ID number
hereby confirm that I understand the contents of this document and the nature of the research
project, and I consent to my child/dependent participating in the research project.
I understand that he is at liberty to withdraw from the project at any time, should he so desire.
SIGNATURE OF PARENT/ LEGAL GUARDIAN: DATE: _________________
SIGNATURE OF WITNESS: DATE: _________________
Appendix D3: Information sheet and assent form for participants younger than 18
years
Study title: Comparing the methods of accurately determining the percent body fat in male
jockey apprentices at the South African Jockey Academy (SAJA) and the
impact of hydration status on the accuracy of these methods
We are inviting all apprentices training at SAJA to participate in the study.
Methods under investigation include both the current technique of measuring the skinfolds at
seven sites as well as bioelectrical impedance analysis (BIA). The results will be compared
to the gold standard research technique (deuterium dilution) to determine whether these
methods accurately estimate body fat percent. Measurements will be taken on two separate
occasions in both dehydrated and well-hydrated states in order to determine the impact of
hydration status on the accuracy of measurements. Proper hydration will be achieved by
following a drinking schedule prior to measurement.
Benefits to you:
You will have an accurate measurement of your body fat percent using a
technique that is usually only available in advanced body composition research.
This research will determine the most accurate available method of measuring
body fat percent which will assist you in achieving an optimal body fat percent.
(Emma Illidge) an MSc Dietetics student of the University of KwaZulu Natal (UKZN), along
with my supervisor Dr Chara Biggs (Programme of Dietetics and Human Nutrition, UKZN),
Kathleen Krog (SAJA dietitian) and Tarryn Sneyd (biokineticist), will be conducting the study.
We are affiliated with the Programme of Dietetics and Human Nutrition of the College of
Agricultural, Earth and Environmental Science at UKZN.
If you agree to participate you will be asked to do the following:
To attend measurement sessions on 2 separate occasions
To follow a drinking schedule prior to one of these measurement sessions in
order to achieve good hydration.
Not to eat or drink for at least 1 hour prior to the measurements being taken on
both occasions
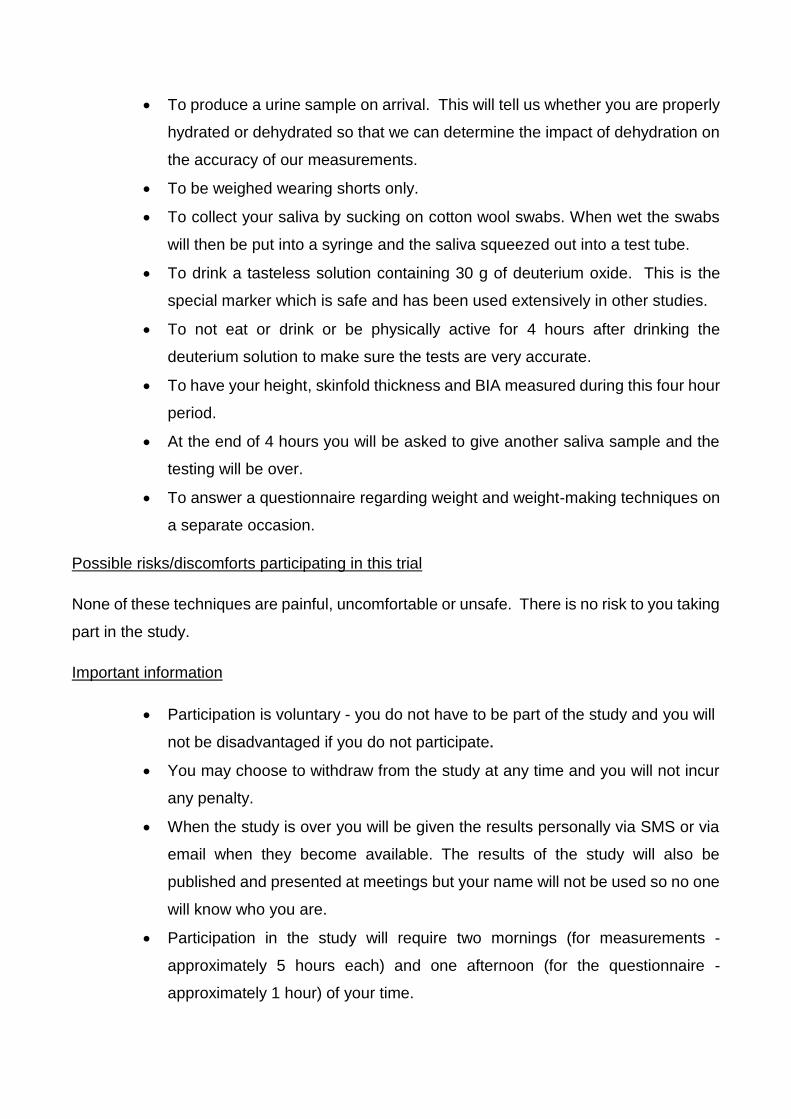
To produce a urine sample on arrival. This will tell us whether you are properly
hydrated or dehydrated so that we can determine the impact of dehydration on
the accuracy of our measurements.
To be weighed wearing shorts only.
To collect your saliva by sucking on cotton wool swabs. When wet the swabs
will then be put into a syringe and the saliva squeezed out into a test tube.
To drink a tasteless solution containing 30 g of deuterium oxide. This is the
special marker which is safe and has been used extensively in other studies.
To not eat or drink or be physically active for 4 hours after drinking the
deuterium solution to make sure the tests are very accurate.
To have your height, skinfold thickness and BIA measured during this four hour
period.
At the end of 4 hours you will be asked to give another saliva sample and the
testing will be over.
To answer a questionnaire regarding weight and weight-making techniques on
a separate occasion.
Possible risks/discomforts participating in this trial
None of these techniques are painful, uncomfortable or unsafe. There is no risk to you taking
part in the study.
Important information
Participation is voluntary - you do not have to be part of the study and you will
not be disadvantaged if you do not participate.
You may choose to withdraw from the study at any time and you will not incur
any penalty.
When the study is over you will be given the results personally via SMS or via
email when they become available. The results of the study will also be
published and presented at meetings but your name will not be used so no one
will know who you are.
Participation in the study will require two mornings (for measurements -
approximately 5 hours each) and one afternoon (for the questionnaire -
approximately 1 hour) of your time.
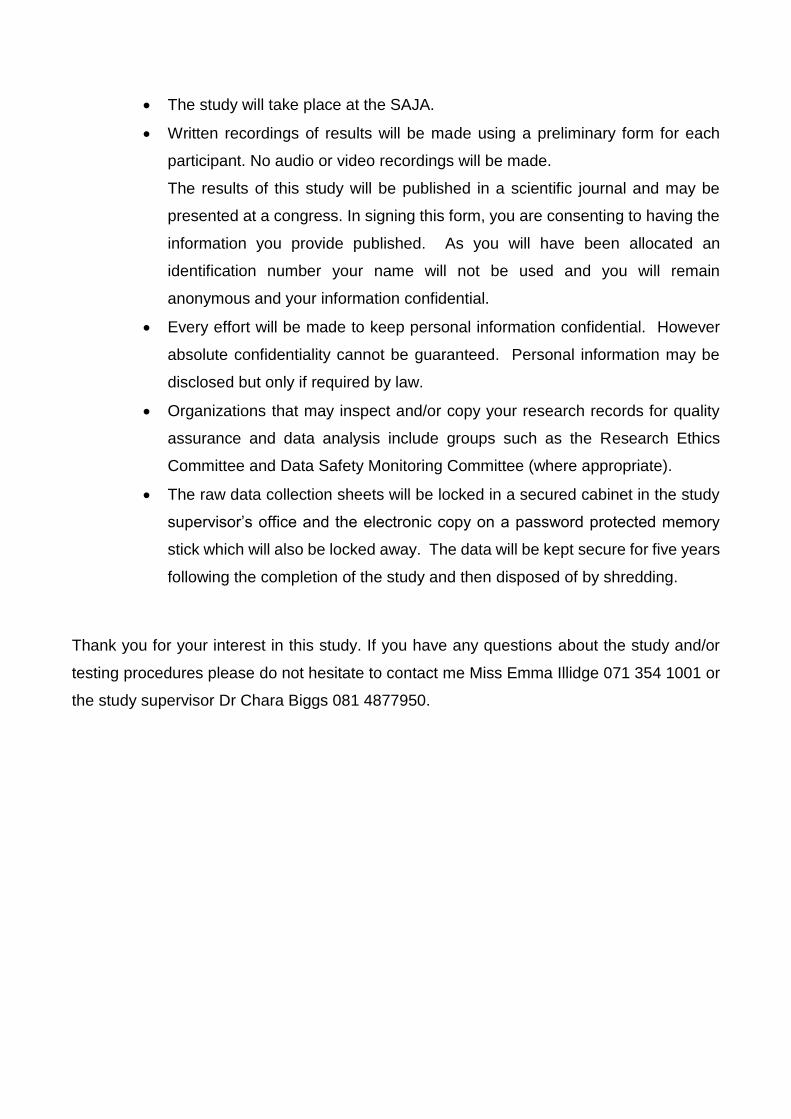
The study will take place at the SAJA.
Written recordings of results will be made using a preliminary form for each
participant. No audio or video recordings will be made.
The results of this study will be published in a scientific journal and may be
presented at a congress. In signing this form, you are consenting to having the
information you provide published. As you will have been allocated an
identification number your name will not be used and you will remain
anonymous and your information confidential.
Every effort will be made to keep personal information confidential. However
absolute confidentiality cannot be guaranteed. Personal information may be
disclosed but only if required by law.
Organizations that may inspect and/or copy your research records for quality
assurance and data analysis include groups such as the Research Ethics
Committee and Data Safety Monitoring Committee (where appropriate).
The raw data collection sheets will be locked in a secured cabinet in the study
supervisor’s office and the electronic copy on a password protected memory
stick which will also be locked away. The data will be kept secure for five years
following the completion of the study and then disposed of by shredding.
Thank you for your interest in this study. If you have any questions about the study and/or
testing procedures please do not hesitate to contact me Miss Emma Illidge 071 354 1001 or
the study supervisor Dr Chara Biggs 081 4877950.

In the event of any problems or concerns, you may contact the UKZN Biomedical Research
Ethics Committee, contact details as follows:
BIOMEDICAL RESEARCH ETHICS ADMINISTRATION
Research Office, Westville Campus
Govan Mbeki Building
Private Bag X 54001
Durban
4000
KwaZulu-Natal, SOUTH AFRICA
Tel: 27 31 2604769 - Fax: 27 31 2604609
Email: [email protected]
Assent
I, the undersigned __________________________________________________
Full names, Surname and ID number
hereby confirm that I understand the contents of this document and the nature of the research
project, and I assent to participating in the research project. Consent has been given by my
parent or legal guardian.
I understand that I am at liberty to withdraw from the project at any time, should I so desire.
SIGNATURE OF PARTICIPANT: DATE: _________________
SIGNATURE OF WITNESS: DATE: _________________
Please note that a consent form from a parent or legal guardian must also be completed in
order to participate in the study.
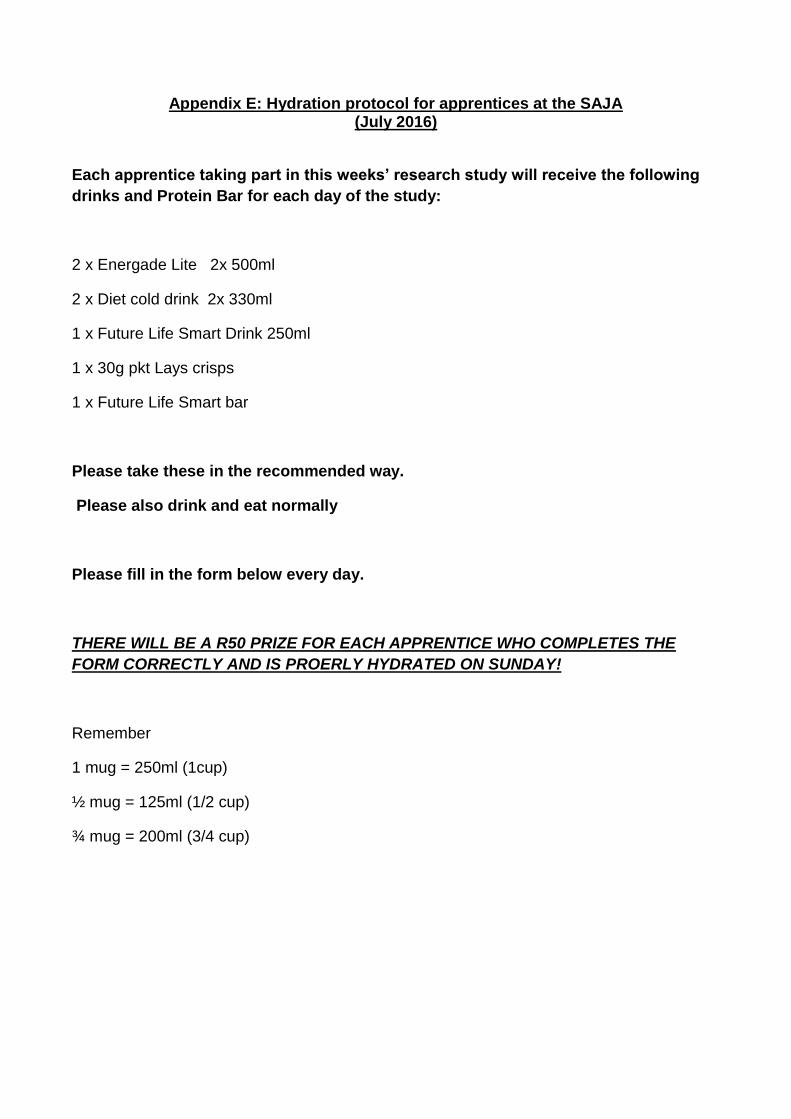
Appendix E: Hydration protocol for apprentices at the SAJA (July 2016)
Each apprentice taking part in this weeks’ research study will receive the following
drinks and Protein Bar for each day of the study:
2 x Energade Lite 2x 500ml
2 x Diet cold drink 2x 330ml
1 x Future Life Smart Drink 250ml
1 x 30g pkt Lays crisps
1 x Future Life Smart bar
Please take these in the recommended way.
Please also drink and eat normally
Please fill in the form below every day.
THERE WILL BE A R50 PRIZE FOR EACH APPRENTICE WHO COMPLETES THE
FORM CORRECTLY AND IS PROERLY HYDRATED ON SUNDAY!
Remember
1 mug = 250ml (1cup)
½ mug = 125ml (1/2 cup)
¾ mug = 200ml (3/4 cup)
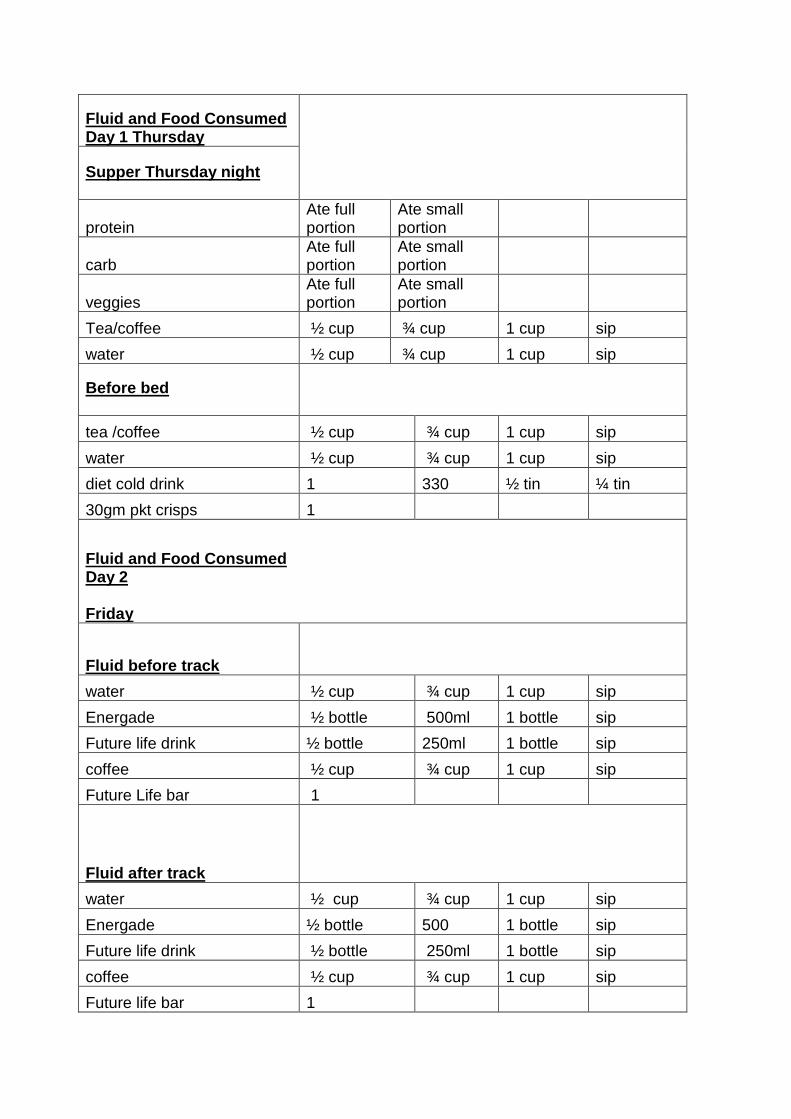
Fluid and Food Consumed Day 1 Thursday
Supper Thursday night
protein Ate full portion
Ate small portion
carb Ate full portion
Ate small portion
veggies Ate full portion
Ate small portion
Tea/coffee ½ cup ¾ cup 1 cup sip
water ½ cup ¾ cup 1 cup sip
Before bed
tea /coffee ½ cup ¾ cup 1 cup sip
water ½ cup ¾ cup 1 cup sip
diet cold drink 1 330 ½ tin ¼ tin
30gm pkt crisps 1
Fluid and Food Consumed Day 2 Friday
Fluid before track
water ½ cup ¾ cup 1 cup sip
Energade ½ bottle 500ml 1 bottle sip
Future life drink ½ bottle 250ml 1 bottle sip
coffee ½ cup ¾ cup 1 cup sip
Future Life bar 1
Fluid after track
water ½ cup ¾ cup 1 cup sip
Energade ½ bottle 500 1 bottle sip
Future life drink ½ bottle 250ml 1 bottle sip
coffee ½ cup ¾ cup 1 cup sip
Future life bar 1
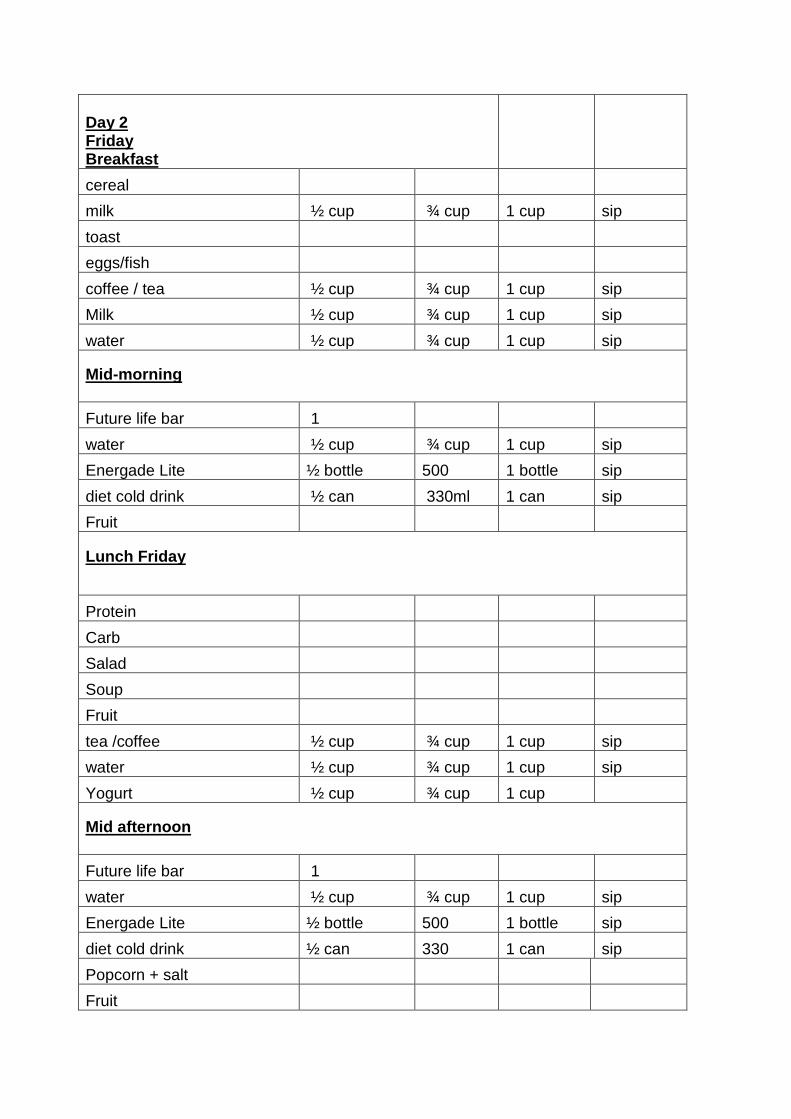
Day 2 Friday Breakfast
cereal
milk ½ cup ¾ cup 1 cup sip
toast
eggs/fish
coffee / tea ½ cup ¾ cup 1 cup sip
Milk ½ cup ¾ cup 1 cup sip
water ½ cup ¾ cup 1 cup sip
Mid-morning
Future life bar 1
water ½ cup ¾ cup 1 cup sip
Energade Lite ½ bottle 500 1 bottle sip
diet cold drink ½ can 330ml 1 can sip
Fruit
Lunch Friday
Protein
Carb
Salad
Soup
Fruit
tea /coffee ½ cup ¾ cup 1 cup sip
water ½ cup ¾ cup 1 cup sip
Yogurt ½ cup ¾ cup 1 cup
Mid afternoon
Future life bar 1
water ½ cup ¾ cup 1 cup sip
Energade Lite ½ bottle 500 1 bottle sip
diet cold drink ½ can 330 1 can sip
Popcorn + salt
Fruit
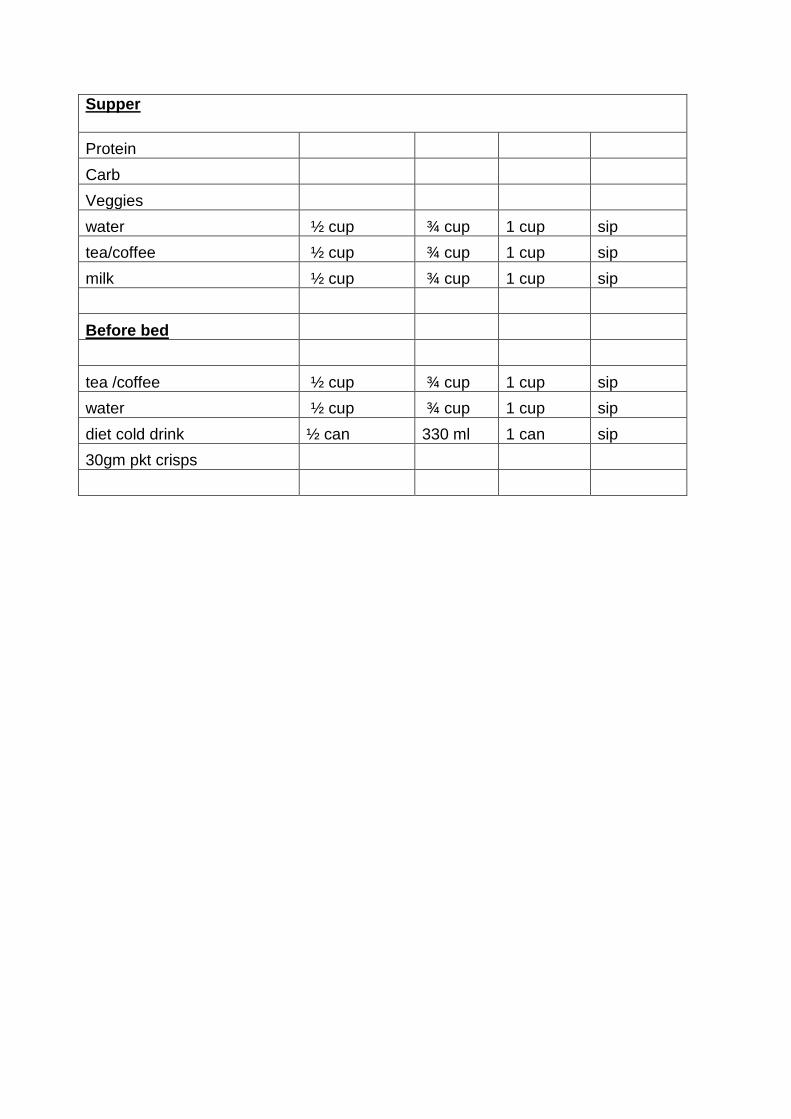
Supper
Protein
Carb
Veggies
water ½ cup ¾ cup 1 cup sip
tea/coffee ½ cup ¾ cup 1 cup sip
milk ½ cup ¾ cup 1 cup sip
Before bed
tea /coffee ½ cup ¾ cup 1 cup sip
water ½ cup ¾ cup 1 cup sip
diet cold drink ½ can 330 ml 1 can sip
30gm pkt crisps
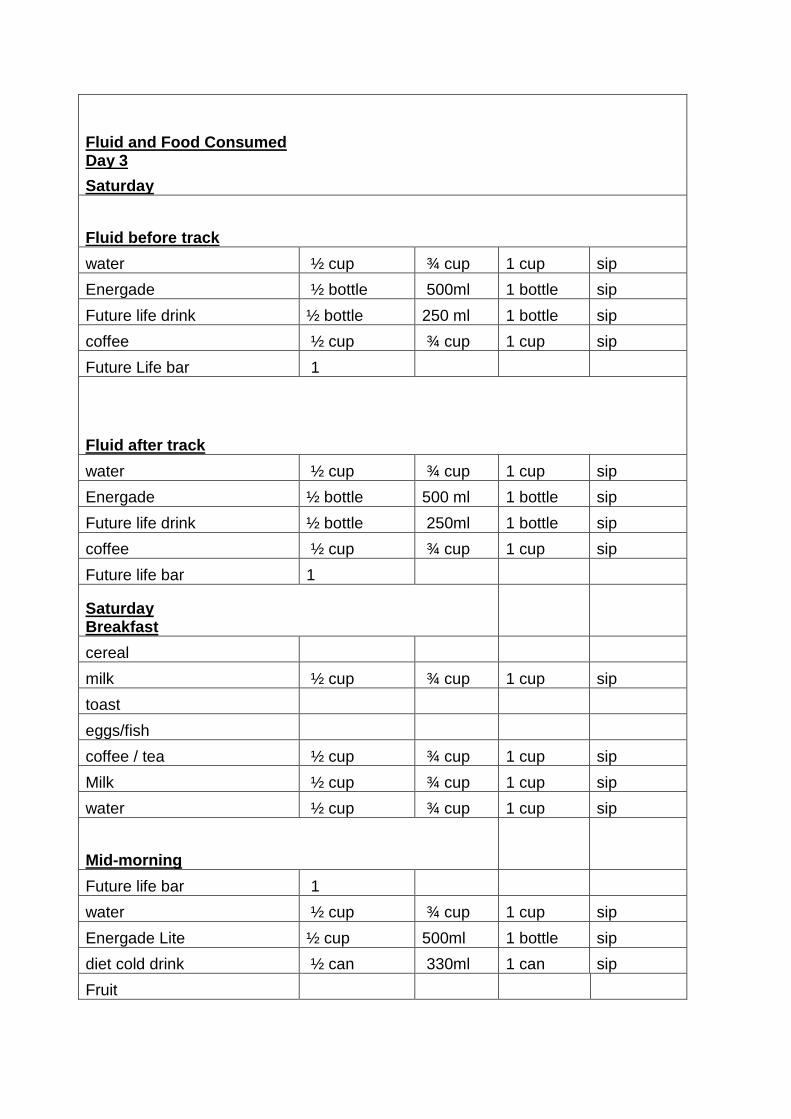
Fluid and Food Consumed Day 3
Saturday
Fluid before track
water ½ cup ¾ cup 1 cup sip
Energade ½ bottle 500ml 1 bottle sip
Future life drink ½ bottle 250 ml 1 bottle sip
coffee ½ cup ¾ cup 1 cup sip
Future Life bar 1
Fluid after track
water ½ cup ¾ cup 1 cup sip
Energade ½ bottle 500 ml 1 bottle sip
Future life drink ½ bottle 250ml 1 bottle sip
coffee ½ cup ¾ cup 1 cup sip
Future life bar 1
Saturday Breakfast
cereal
milk ½ cup ¾ cup 1 cup sip
toast
eggs/fish
coffee / tea ½ cup ¾ cup 1 cup sip
Milk ½ cup ¾ cup 1 cup sip
water ½ cup ¾ cup 1 cup sip
Mid-morning
Future life bar 1
water ½ cup ¾ cup 1 cup sip
Energade Lite ½ cup 500ml 1 bottle sip
diet cold drink ½ can 330ml 1 can sip
Fruit
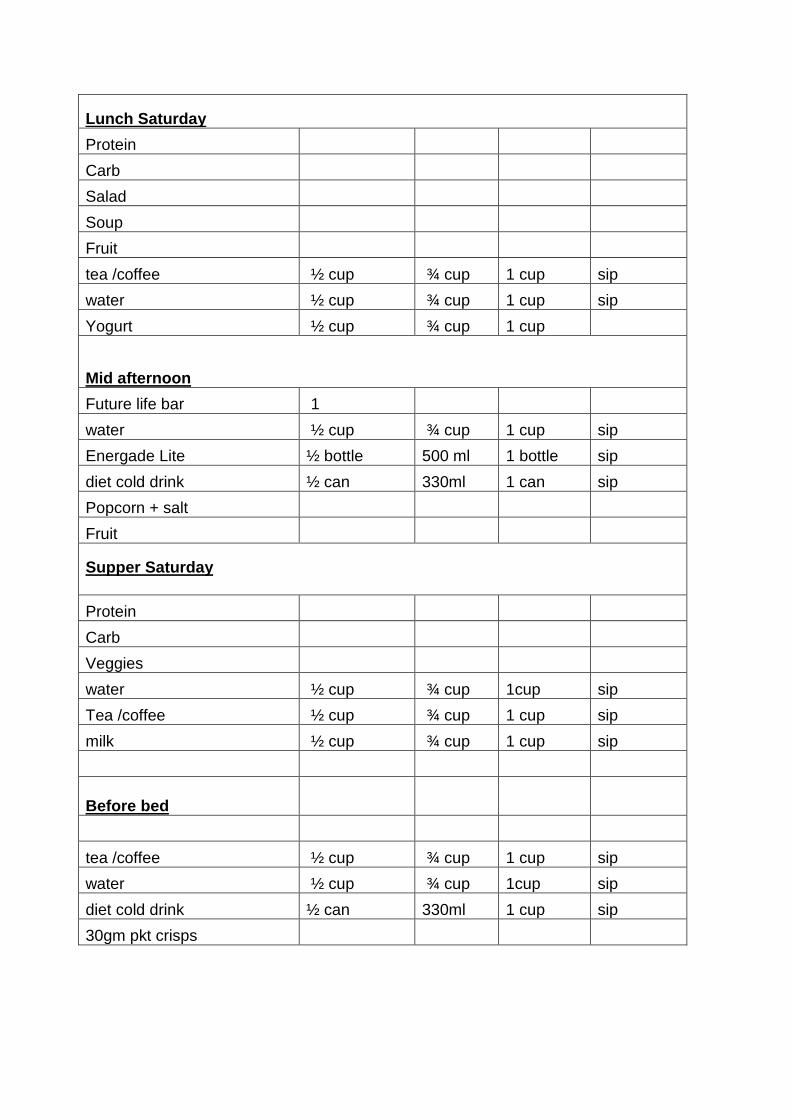
Lunch Saturday
Protein
Carb
Salad
Soup
Fruit
tea /coffee ½ cup ¾ cup 1 cup sip
water ½ cup ¾ cup 1 cup sip
Yogurt ½ cup ¾ cup 1 cup
Mid afternoon
Future life bar 1
water ½ cup ¾ cup 1 cup sip
Energade Lite ½ bottle 500 ml 1 bottle sip
diet cold drink ½ can 330ml 1 can sip
Popcorn + salt
Fruit
Supper Saturday
Protein
Carb
Veggies
water ½ cup ¾ cup 1cup sip
Tea /coffee ½ cup ¾ cup 1 cup sip
milk ½ cup ¾ cup 1 cup sip
Before bed
tea /coffee ½ cup ¾ cup 1 cup sip
water ½ cup ¾ cup 1cup sip
diet cold drink ½ can 330ml 1 cup sip
30gm pkt crisps
Appendix F: Permission letter from the principle of the South African Jockey
Academy
Appendix G: Approval letter from the Biomedical Research Ethics Committee
Appendix H: Approval of amendments letter from Biomedical Research Ethics
Committee