netmhciipan-2.0 - improved pan-specific hla-dr predictions using a novel concurrent alignment and...
TRANSCRIPT

RESEARCH Open Access
NetMHCIIpan-2.0 - Improved pan-specific HLA-DRpredictions using a novel concurrent alignmentand weight optimization training procedureMorten Nielsen1*, Sune Justesen2, Ole Lund1, Claus Lundegaard1, Søren Buus2
Abstract
Background: Binding of peptides to Major Histocompatibility class II (MHC-II) molecules play a central role ingoverning responses of the adaptive immune system. MHC-II molecules sample peptides from the extracellularspace allowing the immune system to detect the presence of foreign microbes from this compartment. Predictingwhich peptides bind to an MHC-II molecule is therefore of pivotal importance for understanding the immuneresponse and its effect on host-pathogen interactions. The experimental cost associated with characterizing thebinding motif of an MHC-II molecule is significant and large efforts have therefore been placed in developingaccurate computer methods capable of predicting this binding event. Prediction of peptide binding to MHC-II iscomplicated by the open binding cleft of the MHC-II molecule, allowing binding of peptides extending out of thebinding groove. Moreover, the genes encoding the MHC molecules are immensely diverse leading to a large set ofdifferent MHC molecules each potentially binding a unique set of peptides. Characterizing each MHC-II moleculeusing peptide-screening binding assays is hence not a viable option.
Results: Here, we present an MHC-II binding prediction algorithm aiming at dealing with these challenges. Themethod is a pan-specific version of the earlier published allele-specific NN-align algorithm and does not requireany pre-alignment of the input data. This allows the method to benefit also from information from alleles coveredby limited binding data. The method is evaluated on a large and diverse set of benchmark data, and is shown tosignificantly out-perform state-of-the-art MHC-II prediction methods. In particular, the method is found to boost theperformance for alleles characterized by limited binding data where conventional allele-specific methods tend toachieve poor prediction accuracy.
Conclusions: The method thus shows great potential for efficient boosting the accuracy of MHC-II bindingprediction, as accurate predictions can be obtained for novel alleles at highly reduced experimental costs. Pan-specific binding predictions can be obtained for all alleles with know protein sequence and the method canbenefit by including data in the training from alleles even where only few binders are known. The method andbenchmark data are available at http://www.cbs.dtu.dk/services/NetMHCIIpan-2.0
BackgroundBinding of peptides to MHC II molecules play a majorrole in governing adaptive immune responses. Theyallow peptides derived from pathogens in the extracellu-lar compartment to be presented by professional antigenpresenting cells (APCs) to T helper cells of the immunesystem.
These T cells might in turn activate the presenting cellto kill intracellular bacterial infections. Help is also formost antigens needed to activate B cells to produce anti-bodies that may neutralize the pathogen. Over the lastdecade a number of different methods for prediction ofbinding to MHC II molecules have been developed, themost known being the TEPITOPE method [1]. Predictionof binding of peptides to MHC II is complicated by theimmense polymorphism of the MHC class II alleles sincethe many different encoded MHC class II molecules(more than 690 different known HLA-DR alleles are
* Correspondence: [email protected] A for Biological Sequence Analysis, BioCentrum-DTU, Building 208,Technical University of Denmark, DK-2800 Lyngby, DenmarkFull list of author information is available at the end of the article
Nielsen et al. Immunome Research 2010, 6:9http://www.immunome-research.com/content/6/1/9
IMMUNOME RESEARCH
© 2010 Nielsen et al; licensee BioMed Central Ltd. This is an Open Access article distributed under the terms of the Creative CommonsAttribution License (http://creativecommons.org/licenses/by/2.0), which permits unrestricted use, distribution, and reproduction inany medium, provided the original work is properly cited.
known) bind very different sets of peptides. The TEPI-TOPE method covers 50 of these HLA-DR alleles. Duringthe last decays several data driven so-called allele-specificmethods have been developed for alleles where sufficientnumbers of binding peptides are known. These methodscover a very broad range of different bioinformatics train-ing algorithms including Gibbs sampler [2,3], artificialneural networks [4,5], support vector machines [6-8],hidden Markov models [9], as well as other (often exotic)motif search algorithms [10-18]. For a detailed reviewplease refer to Nielsen et al. [19].These methods can interpolate between peptide bind-
ing data and create predictions for peptides not presentin the training set. Recently, pan-specific methods thatin principle can make predictions for all alleles withknown amino acid sequence have been developed[20-26]. These methods work by including informationabout the amino acid sequence of the MHC molecule asinput to the method allowing the methods to integrateinformation across multiple alleles simultaneously thusboosting the predictive performance and potentiallyextrapolate the predictions to previously un-character-ized MHC molecules. Several benchmark calculationshave demonstrated the power of such pan-specificmethods [27] and have shown how accurate predictionscan be obtained also for alleles for which no or verylimited binding data have been identified [21,28].One of the best performing pan-specific MHC class II
prediction method is the NetMHCIIpan method [29].An important limiting factor for this method lies in theneed for a pre-alignment of the input training data iden-tifying the peptide-binding core prior to the training ofthe method. Such pre-alignments require sufficient databeing available for all MHC molecules included in thetraining data in order to derive accurate allele-specificpredictions. It has earlier been shown that this numberof peptide binding data for MHC class II is of the orderof many hundred [3,19], which makes it very costly todevelop accurate MHC class II predictions. In order tocircumvent this, we here propose a less demanding, yethighly efficient method to generate MHC class II predic-tors. This method is a pan-specific version of the earlierpublished allele-specific NN-align algorithm [5] anddoes not require any pre-alignment of the input data.The method hence has the potential to benefit alsofrom information from alleles covered by limited bind-ing data. Here, we demonstrate its predictive power in aseries of large-scale benchmark calculations.
Materials and methodsDataQuantitative peptide binding data covering 24 HLA-DRmolecules were obtained from the IEDB databaseand combined with data from an in-house database
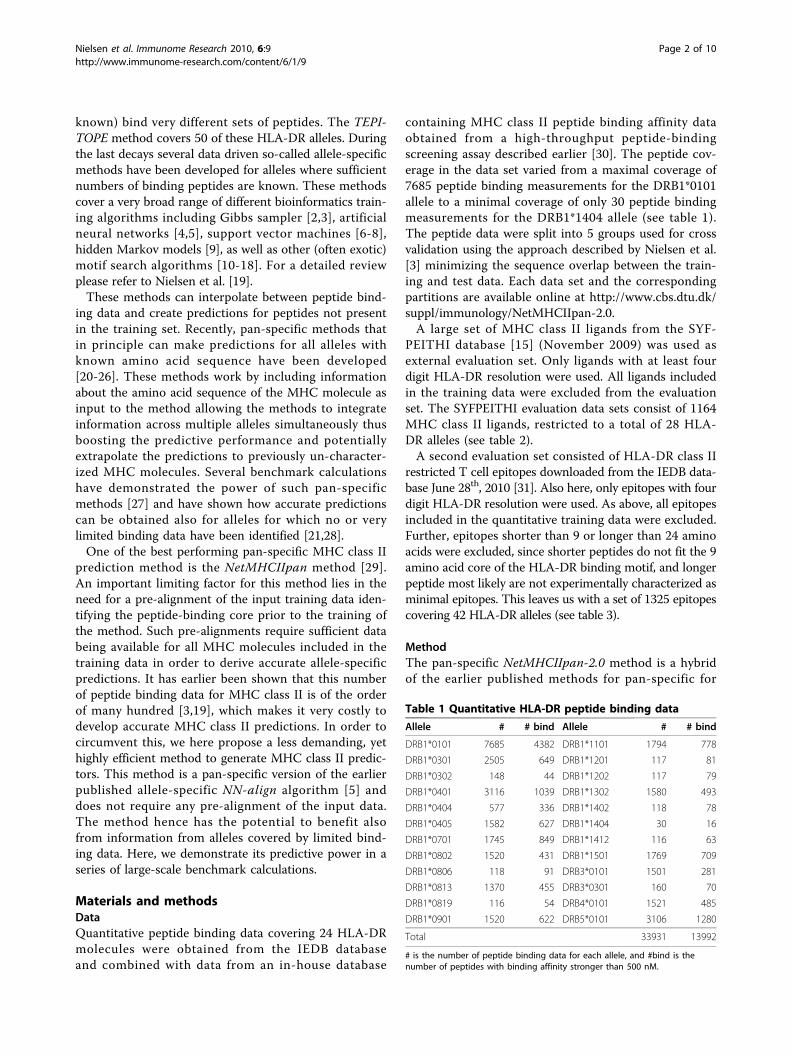
containing MHC class II peptide binding affinity dataobtained from a high-throughput peptide-bindingscreening assay described earlier [30]. The peptide cov-erage in the data set varied from a maximal coverage of7685 peptide binding measurements for the DRB1*0101allele to a minimal coverage of only 30 peptide bindingmeasurements for the DRB1*1404 allele (see table 1).The peptide data were split into 5 groups used for crossvalidation using the approach described by Nielsen et al.[3] minimizing the sequence overlap between the train-ing and test data. Each data set and the correspondingpartitions are available online at http://www.cbs.dtu.dk/suppl/immunology/NetMHCIIpan-2.0.A large set of MHC class II ligands from the SYF-
PEITHI database [15] (November 2009) was used asexternal evaluation set. Only ligands with at least fourdigit HLA-DR resolution were used. All ligands includedin the training data were excluded from the evaluationset. The SYFPEITHI evaluation data sets consist of 1164MHC class II ligands, restricted to a total of 28 HLA-DR alleles (see table 2).A second evaluation set consisted of HLA-DR class II
restricted T cell epitopes downloaded from the IEDB data-base June 28th, 2010 [31]. Also here, only epitopes with fourdigit HLA-DR resolution were used. As above, all epitopesincluded in the quantitative training data were excluded.Further, epitopes shorter than 9 or longer than 24 aminoacids were excluded, since shorter peptides do not fit the 9amino acid core of the HLA-DR binding motif, and longerpeptide most likely are not experimentally characterized asminimal epitopes. This leaves us with a set of 1325 epitopescovering 42 HLA-DR alleles (see table 3).
MethodThe pan-specific NetMHCIIpan-2.0 method is a hybridof the earlier published methods for pan-specific for
Table 1 Quantitative HLA-DR peptide binding data
Allele # # bind Allele # # bind
DRB1*0101 7685 4382 DRB1*1101 1794 778
DRB1*0301 2505 649 DRB1*1201 117 81
DRB1*0302 148 44 DRB1*1202 117 79
DRB1*0401 3116 1039 DRB1*1302 1580 493
DRB1*0404 577 336 DRB1*1402 118 78
DRB1*0405 1582 627 DRB1*1404 30 16
DRB1*0701 1745 849 DRB1*1412 116 63
DRB1*0802 1520 431 DRB1*1501 1769 709
DRB1*0806 118 91 DRB3*0101 1501 281
DRB1*0813 1370 455 DRB3*0301 160 70
DRB1*0819 116 54 DRB4*0101 1521 485
DRB1*0901 1520 622 DRB5*0101 3106 1280
Total 33931 13992
# is the number of peptide binding data for each allele, and #bind is thenumber of peptides with binding affinity stronger than 500 nM.
Nielsen et al. Immunome Research 2010, 6:9http://www.immunome-research.com/content/6/1/9
Page 2 of 10

MHC class I and class II binding, NetMHCpan [20,21],and NetMHCIIpan [29], and the NN-align methodrecently published for allele-specific MHC class II bind-ing predictions [5]. The overall method architecture issimilar to the NN-align method, and the manner inwhich the MHC polymorphism method is incorporated
is similar to that of the NetMHCpan and NetMHCIIpanmethods.The method was implemented as a conventional feed-
forward artificial neural network. Like the NN-alignmethod, the method consists of a two-step procedurethat simultaneously estimates the optimal peptide bind-ing register (core) and network weight configuration.Initially, all network weights were assigned randomvalues. Given this set of network weights, the core of agiven peptide was identified as the highest scoring of allnonamers contained within the peptide. The score of anonamer peptide was calculated using the conventionalfeed-forward algorithm. The network weights wereupdated using gradient descent back-propagation. Givena peptide core alignment, the weights were updated tolower the sum of squared errors between the predictedbinding score and the measured binding affinity targetvalue. A peptide core was presented to the network asdescribed for the NN-align method including encodingof peptide flanking regions (PFR), PFR length and thepeptide length. The MHC environment defining thepeptide binding strength was implemented in terms ofthe MHC pseudo sequence constructed from 21 poly-morphic amino acid positions in potential contact withthe bound peptide as described by Nielsen et al. [29].Two types of sequence encodings (sparse and blosum)were applied for the peptide-core and MHC pseudosequences as described by Nielsen et al. [32]. For eachpeptide core, the input to the neural network thus con-sisted of the peptide core and MHC environment resi-dues ((9+21) × 20 = 600 inputs), the PFRs (2 × 20 = 40inputs), the peptide length (2 inputs), the length of theC and N terminal PFR’s (2 × 2 = 4 inputs) resulting in atotal of 646 input values. The peptide binding affinityIC50 values were encoded to the neural network as log-transformed values, using the relation 1-log (aff)/log(15,000), where aff is the measured binding affinity(IC50) in nM units [32]. Note, that we here use 15,000as the base for the logarithmic transformation. This is incontrast to the 50,000 used in previous works by ourgroup, and is chosen due to a lower sensitivity for weakbinding peptides of the high-throughput peptide-bindingscreening assay described by Justesen et al. [30].The networks were trained using 5-fold cross-validation.
Network ensembles were trained with 40 hiddenneurons. The procedure of i) identifying the optimalpeptide core, and ii) updating the network weights tolower the predictive error was repeated for 500 cycles.Since the “search landscape” has a large set of localminima each with close to identical performance values,the network training was repeated 10 times, each withdifferent initial configuration values. This led to signifi-cantly improved prediction accuracy (data not shown).In total 20 (2 encoding schemes*10 seeds) networks
Table 2 MHC class II ligands from the SYFPEITHIdatabase
Allele # Allele #
HLA-DRB1*0101 53 HLA-DRB1*1101 35
HLA-DRB1*0102 5 HLA-DRB1*1104 8
HLA-DRB1*0301 88 HLA-DRB1*1201 11
HLA-DRB1*0401 468 HLA-DRB1*1301 16
HLA-DRB1*0402 36 HLA-DRB1*1302 19
HLA-DRB1*0403 1 HLA-DRB1*1401 9
HLA-DRB1*0404 42 HLA-DRB1*1501 22
HLA-DRB1*0405 36 HLA-DRB1*1502 3
HLA-DRB1*0701 47 HLA-DRB1*1601 2
HLA-DRB1*0801 39 HLA-DRB3*0101 2
HLA-DRB1*0802 1 HLA-DRB3*0301 5
HLA-DRB1*0803 1 HLA-DRB4*0101 6
HLA-DRB1*0901 6 HLA-DRB4*0103 2
HLA-DRB1*1001 183 HLA-DRB5*0101 18
Total 1164
Table 3 HLA-DR restriction T cell epitope from the IEDBdatabase
Allele # Allele #
HLA-DRB1*0101 125 HLA-DRB1*1103 3
HLA-DRB1*0102 4 HLA-DRB1*1104 6
HLA-DRB1*0103 5 HLA-DRB1*1201 3
HLA-DRB1*0301 173 HLA-DRB1*1301 15
HLA-DRB1*0401 342 HLA-DRB1*1302 10
HLA-DRB1*0402 33 HLA-DRB1*1303 3
HLA-DRB1*0403 14 HLA-DRB1*1401 16
HLA-DRB1*0404 46 HLA-DRB1*1404 1
HLA-DRB1*0405 21 HLA-DRB1*1405 2
HLA-DRB1*0406 6 HLA-DRB1*1501 193
HLA-DRB1*0407 4 HLA-DRB1*1502 20
HLA-DRB1*0408 2 HLA-DRB1*1503 2
HLA-DRB1*0701 56 HLA-DRB1*1601 5
HLA-DRB1*0703 1 HLA-DRB1*1602 3
HLA-DRB1*0801 4 HLA-DRB3*0101 12
HLA-DRB1*0802 2 HLA-DRB3*0202 10
HLA-DRB1*0803 2 HLA-DRB3*0301 1
HLA-DRB1*0901 13 HLA-DRB4*0101 17
HLA-DRB1*1001 4 HLA-DRB4*0103 1
HLA-DRB1*1101 88 HLA-DRB5*0101 55
HLA-DRB1*1102 1 HLA-DRB5*0102 1
Total 1325
Nielsen et al. Immunome Research 2010, 6:9http://www.immunome-research.com/content/6/1/9
Page 3 of 10
were created for each training/test set configuration. Thebinding core of a given peptide was assigned by a major-ity vote of the networks in the ensemble.
Leave-one-out (LOO) network training and benchmarkLeave-one-(allele)-out experiments were conducted toinvestigate the predictive performance of the method insituations where binding data for a given allele wasexcluded from the training. Two types of LOO experi-ments were conducted. In the first type, peptide-bindingdata for a given allele were excluded from the trainingof the prediction method, and upon training, the predic-tive performance was evaluated using the peptide bind-ing affinity values for the HLA-DR molecule inquestion. This is the LOO approach applied in theNetMHCIIpan-1.0 method [29] and allows for a directcomparison of this method to the method proposedhere when trained on similar data sets.Since many of the peptides in the training data have
been measured for binding affinities to multiple alleles,the above LOO experiment can lead to a significantoverestimation of the performance for a given predictionmethod. To reduce this bias, a second type of LOOexperiment was conducted where all data representing agiven peptide was excluded from the training of the pre-diction method. That is, if a given peptide was measuredagainst multiple alleles including the allele in question,all these measurements were excluded from the LOOtraining. To avoid reducing the size of the training datatoo much, this second type of LOO training was per-formed as a three-fold cross-validation for alleles char-acterized by more than 200 data points.
Performance measuresThe predictive performance was measured in terms of thearea under the ROC curve (AUC) value and Pearson’s cor-relation coefficient (PCC). The receiver operating charac-teristic (ROC) curve is a graphical plot of the sensitivityversus the false positive rate (1 - specificity) as the discrimi-nation threshold is varied. Through out this work, a bindingthreshold value of 500 nM was used to classify the peptides.The area under the ROC curve (AUC) gives an indicationof the accuracy of a prediction method. An AUC value of 1corresponds to perfect predictions and a value of 0.5reflects random predictions. Likewise, PCC is a measure ofthe accuracy of a prediction method. It is obtained by divid-ing the covariance of the two variables by the product oftheir standard deviations. For perfect predictions PCC is 1(or -1), and for random predictions PCC is 0.
Nearest neighbor distance calculationThe distance between two MHC alleles was estimated asdescribed by Nielsen et al. [29] using the relation
d s A B
s A A s B B= −
⋅1 ( , )
( , ) ( , ) , where s(A, B) is the BLOSUM50
similarity score between the pseudo sequences of alleleA and B, respectively. Next, the nearest neighbor dis-tance for an allele is defined as the minimal distance toany allele included in the training data set.
ResultsPan-specific versus allele-specific predictionsIn contrast to allele-specific MHC class II predictionmethods, the pan-specific method outlined here is pro-posed to benefit from information even from alleles cov-ered by limited binding data. To demonstrate this, we intable 4 show the performance values obtained by the newNetMHCIIpan-2.0 and older NN-align method using 5fold cross-validation. The NN-align method was trainedin an allele-specific manner as described in by Nielsenet al. [5]. As a reference, the performance of theTEPITOPE method is also included in the benchmarkstudy. The predictive performance for each HLA allelewas measured in terms of the area under the ROC curve(AUC) value and Pearson’s correlation coefficient (PCC).From the results in table 4, it is apparent that the
NetMHCIIpan-2.0 method significantly outperformsboth the NN-align and TEPITOPE methods (p < 0.01,binomial test). For 9 of the 9 alleles covered by less than400 peptide-binding measurements, we find thatNetMHCIIpan-2.0 outperforms NN-align. These resultsstrongly indicate that NetMHCIIpan-2.0 is capable ofbenefiting from information from the multiple allelesincluded in the benchmark to boost the predictive per-formance and deliver accurate predictions also for allelescovered by limited binding data. Only for 3 out of the24 alleles does the NN-align perform better thanNetMHCIIpan-2.0. These alleles are all covered by morethan 1500 peptide-binding measurements. This henceconfirms the results obtained earlier for MHC class Ibinding predictions namely that pan-specific predictionsare particularly beneficial when binding data are scarceor absent [28]. What is also clear from the data in table4 is that the NetMHCIIpan-2.0 method is capable ofmaintaining its high performance also for alleles notcharacterized by the TEPITIOPE method.
NetMHCpanII-1.0 versus NetMHCpanII-2.0In the pan-specific training algorithm implemented inthe NetMHCIIpan-2.0 method, alignment and bindingaffinity prediction is performed simultaneously. Tofurther demonstrate that this approach does indeed out-perform the NetMHCIIpan-1.0 method where the twosteps were decoupled, we performed a series of LOOexperiments as described in Materials and methods. Inthese experiments, peptide-binding data for a given
Nielsen et al. Immunome Research 2010, 6:9http://www.immunome-research.com/content/6/1/9
Page 4 of 10

allele were excluded from the training of the predictionmethod, and upon training, the predictive performancewas evaluated using the peptide binding affinity valuesfor the HLA-DR molecule in question. This experimentthus simulated prediction of binding to hitherto un-characterized HLA-DR molecules. The first LOO experi-ment was conducted based on the binding data using inthe original NetMHCIIpan paper covering 14 HLA-DRalleles [29]. Details of this analysis are shown in table 5.The average PCC and AUC values for the 14 LOO
experiments were 0.541, 0.768 and 0.606, 0.799 for theNetMHCIIpan-1.0 and NetMHCIIpan-2.0 methods,respectively. This difference is statistically highly signifi-cant (p < 0.01, binomial test). Only for one allele(DRB1*1302) did the NetMHCIIpan-1.0 method achievea higher performance than NetMHCIIpan-2.0. Theseresults thus demonstrate, that the training algorithmimplemented in the NetMHCIIpan-2.0 method leads tosignificantly improved prediction accuracy compared tothe algorithm employed in the NetMHCIIpan-1.0method.Next, we investigated to what extent expanding the
peptide data set with broader allelic coverage and morebinding data would lead to an improved predictive per-formance. To do this, we conducted a second series ofLOO experiments comparing the LOO predictive per-formance of the NetMHCIIpan-2.0 method when trainedon the old data set covering 14 HLA-DR allele (termedOLD) to its performance when trained on the extendeddata set covering 24 HLA-DR alleles (termed NEW).The peptide overlap in both datasets is high, and manypeptides have been measured for binding affinities
Table 4 Five-fold cross-validation performance of thepan-specific NetMHCIIpan-2.0 method compared to theallele-specific NN-align and TEPITOPE methods on thequantitative benchmark data set
NN-align NetMHCIIpan-2.0
TEPITOPE
Allele # # bind PCC AUC PCC AUC AUC
DRB1*0101 7685 4382 0.675 0.825 0.711 0.846 0.727
DRB1*0301 2505 649 0.690 0.855 0.709 0.864 0.718
DRB1*0302 148 44 0.272 0.659 0.525 0.757
DRB1*0401 3116 1039 0.643 0.833 0.670 0.848 0.762
DRB1*0404 577 336 0.565 0.766 0.630 0.818 0.747
DRB1*0405 1582 627 0.710 0.869 0.698 0.858 0.780
DRB1*0701 1745 849 0.718 0.855 0.740 0.864 0.777
DRB1*0802 1520 431 0.518 0.778 0.526 0.780 0.645
DRB1*0806 118 91 0.744 0.902 0.796 0.924 0.884
DRB1*0813 1370 455 0.729 0.878 0.746 0.885 0.750
DRB1*0819 116 54 0.370 0.706 0.608 0.808
DRB1*0901 1520 622 0.597 0.810 0.634 0.818
DRB1*1101 1794 778 0.756 0.873 0.777 0.883 0.793
DRB1*1201 117 81 0.699 0.860 0.764 0.892
DRB1*1202 117 79 0.695 0.866 0.769 0.900
DRB1*1302 1580 493 0.630 0.819 0.634 0.825 0.596
DRB1*1402 118 78 0.623 0.825 0.694 0.860
DRB1*1404 30 16 0.466 0.661 0.613 0.737
DRB1*1412 116 63 0.680 0.857 0.757 0.894
DRB1*1501 1769 709 0.641 0.815 0.653 0.819 0.731
DRB3*0101 1501 281 0.673 0.843 0.690 0.850
DRB3*0301 160 70 0.604 0.826 0.736 0.853
DRB4*0101 1521 485 0.701 0.854 0.675 0.837
DRB5*0101 3106 1280 0.735 0.865 0.765 0.882 0.760
Ave 33931 13992 0.631 0.821 0.688 0.846
Ave* 0.673 0.841 0.697 0.854 0.744
Ave** 0.580 0.797 0.679 0.837
# gives the number of peptide binding data for each allele, #bind gives thenumber of peptides with a binding affinity stronger than 500 nM. NN-align isthe method described by Nielsen et al. [5], NetMHCIIpan-2.0 is the methoddescribed here, and TEPITOPE is the method described by Sturniolo et al. [1].Ave gives the per allele average, Ave* gives the per allele average of the 13alleles characterized by the TEPITOPE method, and Ave** gives the per alleleaverage of the 11 allele not characterized by the TEPITOPE method. In bold ishighlighted the best performing method for each of the 24 alleles. AUCvalues were calculated using a binding threshold of 500 nM. Only AUC valuesare included for the TEPITOPE method since prediction values for this methodare not linearly related to the binding affinity.
Table 5 LOO benchmark comparison of the pan-specificNetMHCIIpan-2.0 and the NetMHCIIpan-1.0 methods
NetMHCIIpan-1.0
NetMHCIIpan-2.0
TEPITOPE
Allele # #bind PCC AUC PCC AUC AUC
DRB1*0101 5166 3510 0.571 0.778 0.627 0.794 0.720
DRB1*0301 1020 277 0.465 0.746 0.560 0.792 0.664
DRB1*0401 1024 510 0.591 0.775 0.652 0.802 0.716
DRB1*0404 663 386 0.693 0.852 0.731 0.869 0.770
DRB1*0405 630 425 0.594 0.808 0.626 0.823 0.759
DRB1*0701 853 498 0.655 0.825 0.753 0.886 0.761
DRB1*0802 420 148 0.637 0.841 0.700 0.869 0.766
DRB1*0901 530 254 0.406 0.653 0.474 0.684
DRB1*1101 950 429 0.580 0.799 0.721 0.875 0.721
DRB1*1302 498 199 0.323 0.658 0.337 0.648 0.652
DRB1*1501 934 450 0.533 0.738 0.598 0.769 0.686
DRB3*0101 549 75 0.449 0.716 0.474 0.733
DRB4*0101 446 200 0.448 0.724 0.515 0.762
DRB5*0101 924 478 0.627 0.831 0.722 0.879 0.686
Ave 0.541 0.768 0.606 0.799
Ave* 0.570 0.786 0.639 0.819 0.718
The two methods are compared in a leave-one-out experiment on thepeptide binding data described in the original NetMHCIIpan publication [29].
# is the number of peptide binding data for each allele, #bind is the numberof peptides with a binding affinity stronger than 500 nM. NetMHCIIpan-1.0 isthe method by Nielsen et al. [29], NetMHCIIpan-2.0 is the method describedhere, and TEPITOPE is the method by Sturniolo et al. [1]. Prediction values forNetMHCIIpan-1.0 were taken from [29]. Ave gives the per allele average, Ave*gives the per allele average of the 11 alleles characterized by the TEPITOPEmethod. In bold is highlighted the best performing method for each of the 14alleles. AUC values were calculated using a binding threshold of 500 nM. OnlyAUC values are included for the TEPITOPE method since prediction values forthis method are not linearly related to the binding affinity.
Nielsen et al. Immunome Research 2010, 6:9http://www.immunome-research.com/content/6/1/9
Page 5 of 10
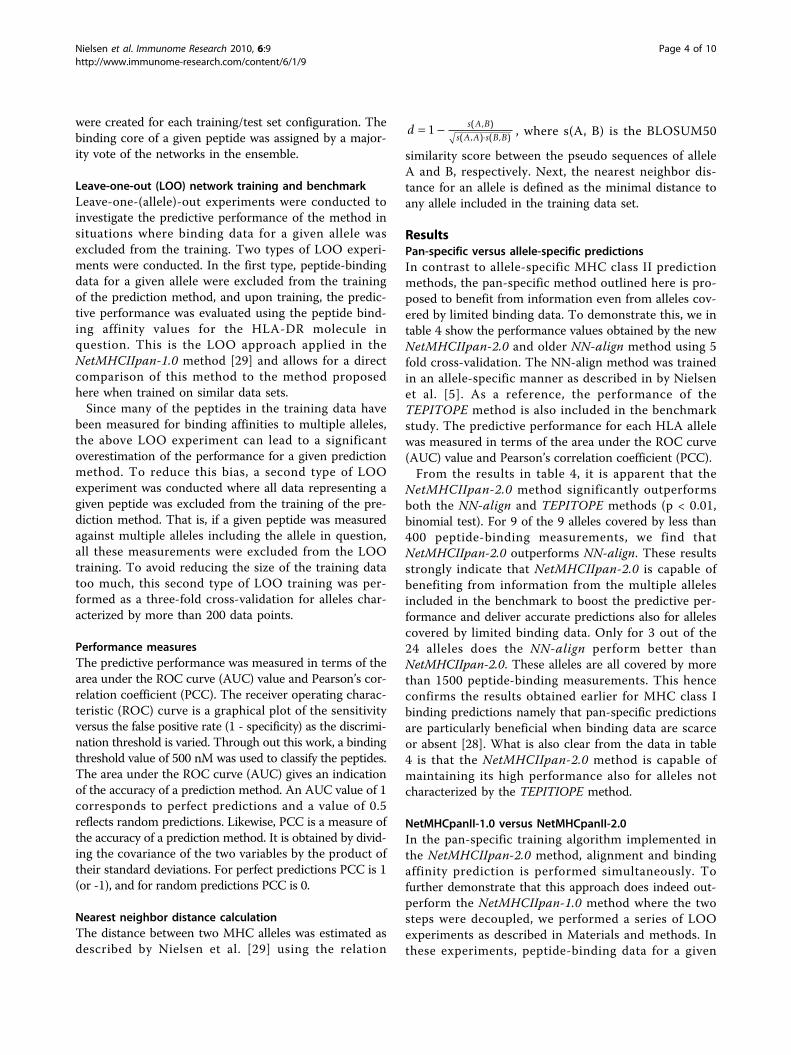
against multiple alleles. This peptide overlap can imposea strongly bias in the benchmark evaluation [20], and tolower this bias all peptides used to characterize a givenallele were excluded from the training of the predictionmethod in the second LOO benchmark (for details seeMaterials and methods). Both the OLD and NEW meth-ods were evaluated using the peptide binding data in thenew peptide data set. The results of the extended LOOcalculation are shown in table 6.The results presented in table 6 clearly demonstrate
that the enrichment of novel peptide binding data witha broader allelic coverage leads to an improved predic-tive performance of the pan-specific prediction method.We can quantify to what degree an allele will benefit
from other alleles being present in the training data bycalculating its distance to the nearest neighbor in thetraining data (see Materials and methods). Earlier workhas demonstrated that this distance measure correlatesstrongly with the performance of pan-specific predictionmethods [20,21]. For 10 of the 11 alleles, where includ-ing the novel 10 alleles has decreased the nearest neigh-bor distance, the NEW method has a higher AUCpredictive performance compared to the OLD. For theremaining 13 alleles, the 10 novel alleles have notaltered the nearest neighbor distance and the perfor-mance of the two methods is similar. This stronglyunderlines the essential prerequisite for accurate pan-specific prediction methods demonstrated earlier for
Table 6 The extended LOO benchmark
OLD NEW TEPITOPE
Allele # #bind PCC AUC NN dist PCC AUC NN dist AUC
DRB1*0101 7685 4382 0.567 0.767 DRB1*0401 0.352 0.583 0.786 DRB1*1402 0.322 0.727
DRB1*0301 2505 649 0.433 0.727 DRB3*0101 0.277 0.499 0.765 DRB1*0302 0.156 0.718
DRB1*0401 3116 1039 0.563 0.787 DRB1*0405 0.066 0.594 0.804 DRB1*0405 0.066 0.762
DRB1*0404 577 336 0.592 0.806 DRB1*0401 0.091 0.595 0.804 DRB1*0401 0.091 0.747
DRB1*0405 1582 627 0.638 0.826 DRB1*0401 0.066 0.633 0.833 DRB1*0401 0.066
DRB1*0701 1745 849 0.659 0.831 DRB1*0901 0.504 0.648 0.826 DRB1*0901 0.504 0.780
DRB1*0802 1520 431 0.380 0.710 DRB1*1101 0.111 0.369 0.692 DRB1*0813 0.041 0.777
DRB1*0901 1520 622 0.539 0.757 DRB5*0101 0.431 0.517 0.762 DRB5*0101 0.431 0.645
DRB1*1101 1794 778 0.602 0.799 DRB1*1302 0.084 0.460 0.741 DRB1*1302 0.084
DRB1*1302 1580 493 0.338 0.691 DRB1*1101 0.084 0.323 0.671 DRB1*1101 0.084 0.793
DRB1*1501 1769 709 0.568 0.775 DRB1*0404 0.295 0.525 0.756 DRB1*0404 0.295 0.596
DRB3*0101 1501 281 0.339 0.672 DRB1*0301 0.277 0.374 0.702 DRB3*0301 0.223 0.731
DRB4*0101 1521 485 0.506 0.753 DRB1*0404 0.397 0.518 0.766 DRB1*0404 0.397
DRB5*0101 3106 1280 0.547 0.781 DRB1*1101 0.295 0.608 0.813 DRB1*1101 0.295
DRB1*0302 148 44 0.396 0.729 DRB1*0301 0.156 0.542 0.759 DRB1*1402 0.119 0.760
DRB1*0806 118 91 0.670 0.886 DRB1*0802 0.107 0.703 0.902 DRB1*0802 0.107
DRB1*0813 1370 455 0.505 0.735 DRB1*0802 0.041 0.340 0.666 DRB1*0802 0.041 0.884
DRB1*0819 116 54 0.567 0.789 DRB1*0802 0.107 0.566 0.813 DRB1*0813 0.083 0.750
DRB1*1201 117 81 0.626 0.786 DRB1*1101 0.445 0.609 0.798 DRB1*1202 0.045
DRB1*1202 117 79 0.623 0.814 DRB1*1101 0.399 0.713 0.879 DRB1*1201 0.045
DRB1*1402 118 78 0.570 0.793 DRB1*1101 0.148 0.659 0.846 DRB1*0302 0.119
DRB1*1404 30 16 0.393 0.594 DRB1*0404 0.311 0.646 0.679 DRB1*0806 0.240
DRB1*1412 116 63 0.640 0.845 DRB1*0802 0.180 0.738 0.897 DRB1*0813 0.139
DRB3*0301 160 70 0.395 0.738 DRB3*0101 0.223 0.545 0.765 DRB3*0101 0.223
Ave 0.527 0.766 0.554 0.780
Ave* 0.543 0.779 0.529 0.774 0.744
Ave** 0.539 0.771 0.606 0.800
The predictive performance of the pan-specific NN-align method when trained in a leave-one-out experiment and evaluated on the 24 alleles included in thenew peptide binding data set.
# is the number of peptide binding data for each allele, #bind is the number of peptides with a binding affinity stronger than 500 nM. OLD is the methoddescribed here trained on the old peptide data set, NEW is the method described here trained on the new data set, and TEPITOPE is the method by Sturnioloet al. [1]. NN is the nearest neighbor as defined by the pseudo sequence distance, and dist is the nearest neighbor distance calculated as described in Materialsand methods. Ave is the per allele average, Ave* is the per allele average of the 13 alleles characterized by the TEPITOPE method, and Ave** is the per-alleleaverage performance of the 10 alleles included in the new peptide binding data set. In bold is highlighted the best performing method for each of the 24alleles. AUC values were calculated using a binding threshold of 500 nM. Only AUC values are included for the TEPITOPE method since prediction values for thismethod are not linearly related to the binding affinity. The double line separates the 10 novel alleles from the original 14 alleles included in the development ofthe NetMHCIIpan-1.0 method.
Nielsen et al. Immunome Research 2010, 6:9http://www.immunome-research.com/content/6/1/9
Page 6 of 10

MHC class I, namely a population of the close neighbor-hood of un-characterized MHC molecules [20,28].
Lin benchmarkThe Lin benchmark consists of binding affinities of 103overlapping peptides to seven common HLA-DR mole-cules (DRB1*0101, 0301, 0401, 0701, 1101, 1301, and1501). The results of this benchmark are shown intable 7.The results in table 7 clearly show that NetMHCIIpan-
2.0 outperforms both the earlier NetMHCIIpan-1.0method, as well as the other methods included in thebenchmark.
Identifying MHC class II ligands and T cell epitopesThe performance of the NetMHCIIpan-2.0 method onthe large set of SYFPEITHI ligand and IEDB T cell epi-tope data was next investigated. The benchmark wasperformed as described by Nielsen et al. [29]. The ligandsource protein was split into overlapping peptides of thelength of the ligand/epitope. All peptides except theannotated HLA ligand/epitope were taken as negatives.This is a very stringent assumption since suboptimalpeptides sharing the ligand binding-core are counted asnegatives even though they could be presented on theHLA molecule. Thus, this setup is likely to underesti-mate the predictive performance, but the effect shouldbe equal for all methods compared in the benchmark.For each protein-HLA ligand/epitope pair, the predictiveperformance was estimated as the AUC value. Table 8gives a summary of the performance of this benchmarkcalculation (details can be found in Additional file 1:Table S1).Both the SYFPEITI ligand and IEDB epitope bench-
marks show that the NetMHCIIpan-2.0 method per-forms better than the original NetMHCIIpan-1.0method. On the per ligand basis, the NetMHCIIpan-2.0method significantly outperforms NetMHCIIpan-1.0 forboth data sets (p < 0.01, binomial test excluding ties). In
terms of the per-allele performance, the NetMHCIIpan-2.0 also achieved a higher performance than theNetMHCIIpan-1.0 method. This difference is howevernot statistically significant (p > 0.1 binomial test, in bothcases). For the alleles characterized by the TEPITOPEmethod, the TEPITOPE method achieves the highestperformance of the three methods for both data sets.This difference, however, is not statistically significant(p > 0.5 in all cases, binomial test). For alleles not char-acterized by TEPITOPE, the NetMHCIIpan-2.0 methodsignificantly outperform NetMHCIIpan-1.0 for the IEDBdata set (p < 0.01, binomial test), whereas the two meth-ods for this set of alleles achieve a similar predictiveperformance when evaluated on the SYFPEITHI dataset.We next investigated how the predictive performance
of the NetMHCIIpan-2.0 method depended on the lengthof the ligand/epitope under investigation. Figure 1 shows
Table 7 Predictive performance in terms of the AUC on the Lin benchmark data set
Allele NetMHCIIpan-2.0 NetMHCIIpan-1.0 TEPITOPE Multipred_SVM SVMHC
DRB1*0101 0.883 0.847 0.919 0.860 0.860
DRB1*0301 0.716 0.668 0.718 0.800 0.690
DRB1*0401 0.846 0.815 0.745 0.650 0.750
DRB1*0701 0.878 0.852 0.715 0.700 0.740
DRB1*1101 0.884 0.821 0.824 0.780 0.830
DRB1*1301 0.729 0.715 0.718 0.630 0.720
DRB1*1501 0.838 0.791 0.737 0.620 0.660
Ave 0.825 0.787 0.768 0.720 0.750
The AUC was calculated using the following binding affinity threshold values for each of the 7 alleles: DRB1*0101, 0401, 0701, and 1501 threshold = 100 nM,DRB1*0301, 1101, and 1301, threshold = 1000 nM. The performance values for Multipred_SVM and SVMHC were taken from Nielsen et al. [5]. TEPITOPE is themethod described by Sturniolo et al. [1]. NetMHCIIpan-2.0 is the pan-specific method described here, and NetMHCIIpan-1.0 is the pan-specific method by Nielsenet al. [29]. For each allele, the best performing method is highlighted in bold.
Table 8 Endogenous HLA-DR ligand benchmark
SYF # NetMHCIIpan-1.0
NetMHCIIpan-2.0
TEPITOPE
Ave per ligand 1164 0.800 0.829
Ave per allele 28 0.788 0.797
In TEPITOPE 17 0.768 0.786 0.799
!In TEPITOPE 11 0.819 0.814
IEDB # NetMHCIIpan-1.0
NetMHCIIpan-2.0
TEPITOPE
Ave perepitope
1325 0.729 0.751
Ave per allele 42 0.759 0.781
In TEPITOPE 20 0.745 0.747 0.755
!In TEPITOPE 22 0.772 0.812
NetMHCIIpan-1.0 is the method described by Nielsen et al. [29], NetMHCIIpan-2.0 is the pan-specific method described here, and TEPITOPE is the methoddescribed by Sturniolo et al. [1]. Ave per ligand/epitope gives the averageAUC over the 1164/1325 ligands/epitopes in the benchmark data set. Ave perallele gives the average over the per allele averaged AUC values. In TEPITOPEgives the per allele average of the subset of alleles characterized by theTEPITOPE method, and !In TEPITOPE give the per-allele average performanceof the alleles not characterized by the TEPITOPE method. AUC values werecalculated as described in the text. For each benchmark subset, the bestperforming method is highlighted in bold.
Nielsen et al. Immunome Research 2010, 6:9http://www.immunome-research.com/content/6/1/9
Page 7 of 10

a histograms of the average AUC values for the NetMH-CIIpan-2.0 (named 2.0) and NetMHCIIpan-1.0 (named1.0) methods as a function of the ligand/epitope lengthfor the SYFPEITHI and IEDB data sets, respectively.Figure 1 clearly demonstrates that the NetMHCIIpan-
2.0 method, for the majority of peptide lengths, outper-forms the NetMHCIIpan-1.0 method. Only for veryshort peptides (length equal to 9 for the SYFPEITHIdata set and length equal to 10 for the IEDB data set)does the NetMHCIIpan-1.0 achieve the highest AUCvalue. What is also clear for the IEDB data set is thatboth methods achieve their highest predictive perfor-mance for peptides of length less than 15 amino acids.The average AUC for epitopes with a length less then15 amino acids is 0.823. This values is significantlyhigher than the average AUC for epitopes with a lengthgreater than 15 (0.704, p < 0.005, t-test). This differenceis not observed for the SYFPEITHI ligand data set,hence strongly suggesting that the longer epitopes in theIEDB data set are not “true” epitopes in the sense ofdefining the minimal HLA restriction element.
DiscussionDevelopment of accurate prediction algorithms forMHC class II binding is complicated by the fact that theMHC class II molecule has an open binding cleft, andthat peptide binders are accommodated in the bindingcleft in a binding register that a priori is unknown.Training of methods for prediction of peptide-MHCclass II binding hence rely on either a two step
procedure where first the binding register is identifiedand next the aligned peptides are used to train the bind-ing prediction algorithm or a procedure where these twosteps are integrated and performed simultaneously.We have earlier shown that developing allele-specific
prediction methods for MHC class II binding using thelatter approach leads to higher prediction accuracy [3,5].We have further for MHC class I demonstrated thattraining the predictors in a pan-specific manner, incor-porating all binding data across multiple MHC moleculessimultaneously in the training, leads to a significant boostin the predictive performance in particular for MHCmolecules characterized by few or no binding data[20-22,28].Based on these findings, we have in this paper devel-
oped a pan-specific method for prediction of MHC classII binding affinities. The method was trained on bindingdata covering multiple MHC class II simultaneously,and does not require any prior alignment or bindingregister-identification. The method was evaluated in sev-eral large-scale benchmarks and shown consistently tooutperform all other methods investigated, includingstate-of the-art allele-specific (NN-align [5]) and pan-specific (NetMHCIIpan [29]) methods, as well as andthe well-known TEPITOPE method [1]. In particular, itwas demonstrated that the proposed method due to itspan-specific nature could boost performance for allelescharacterized by limited binding data, and in such casessignificantly out-perform allele specific methods. Themethod thus demonstrates great potential for efficient
Figure 1 Histogram of the predictive performance measured in terms of the AUC value for the ligands/epitopes in the SYFPEITHI/IEDBdataset as a function of the peptide length. 2.0 refers to the pan-specific method developed here, and 1.0 refers to the NetMHCIIpan-1.0method. SYF refers to the SYFPEITHI ligand data set, and IEDB refers to the IEDB T cell epitope data set.
Nielsen et al. Immunome Research 2010, 6:9http://www.immunome-research.com/content/6/1/9
Page 8 of 10
boosting of the accuracy of MHC class II binding pre-diction, as accurate predictions can be achieved fornovel alleles at a highly reduced experimental cost, andpan-specific binding predictions can be obtained for allalleles with known protein sequence by a methodtrained using data with limited allelic coverage.When benchmarked on large data sets of know HLA-
DR ligands and epitopes, the method was shown to havea predictive performance comparable to that of TEPI-TOPE for alleles covered by this method, and maybemore important maintain this high performance also foralleles not described by the TEPITOPE method.For MHC class I, we have earlier demonstrated that a
pan-specific predictor can benefit from being trained oncross-loci (and cross-species) peptide binding data [20].The development of a cross-loci model for HLA class IIis complicated by the fact that the HLA-DRA moleculeis close to monomorphic (only two allelic version exists).This is in contrast to HLA-DP and HLA-DQ whereboth the a and b chains are highly polymorphic. More-over, the structures of the HLA molecules are less con-served across the three loci for class II compared toclass I, and finally very limited peptide binding datahave been generated characterizing the different HLA-DP and DQ molecules. As of September 2010, only fiveHLA-DP and six HLA-DQ alleles have been character-ized in the IEDB database with more than 200 peptide-binding measurements [31]. Nonetheless, large amountsof peptide binding data for the HLA-DP and HLA-DQloci will most likely become available in the near futureproviding a broader allelic coverage, and future evalua-tions will demonstrate if also MHC class II binding pre-diction algorithms using training algorithms like the oneoutlined in this work, will benefit from pan-specifictraining across the different loci.The method and benchmark data sets described in
this work are available at http://www.cbs.dtu.dk/ser-vices/NetMHCIIpan-2.0 (method) and http://www.cbs.dtu.dk/suppl/immunology/NetMHCIIpan-2.0 (bench-mark data).
Additional material
Additional file 1: HLA-DR ligand and T cell epitope benchmark. Theper-allele AUC performance values of the NetMHCIIpan-1.0, NetMHCIIpan-2.0, and TEPITOPE methods on the HLA-DR ligands and T cell epitopebenchmark data sets.
AcknowledgementsThis work was supported by a NIH (National Institute of Health) grant(contract no. HHSN272200900045C) and EU 7th framework grant 222773(Pep-ChipOmics).
Author details1Center A for Biological Sequence Analysis, BioCentrum-DTU, Building 208,Technical University of Denmark, DK-2800 Lyngby, Denmark. 2Laboratory ofExperimental Immunology, Faculty of Health Sciences, University ofCopenhagen, Denmark.
Authors’ contributionsMN designed, trained and evaluated the NetMHCIIpan-2.0 method. MNwrote the manuscript draft. SB and SJ made MHC peptid- binding data forthe 10 novel MHC molecules. All authors contributed to and approved thefinal manuscript.
Competing interestsThe authors declare that they have no competing interests.
Received: 22 September 2010 Accepted: 13 November 2010Published: 13 November 2010
References1. Sturniolo T, Bono E, Ding J, Raddrizzani L, Tuereci O, Sahin U,
Braxenthaler M, Gallazzi F, Protti MP, Sinigaglia F, Hammer J: Generation oftissue-specific and promiscuous HLA ligand databases using DNAmicroarrays and virtual HLA class II matrices. Nat Biotechnol 1999,17:555-561.
2. Nielsen M, Lundegaard C, Worning P, Hvid CS, Lamberth K, Buus S,Brunak S, Lund O: Improved prediction of MHC class I and class IIepitopes using a novel Gibbs sampling approach. Bioinformatics 2004,20:1388-1397.
3. Nielsen M, Lundegaard C, Lund O: Prediction of MHC class II bindingaffinity using SMM-align, a novel stabilization matrix alignment method.BMC bioinformatics 2007, 8:238.
4. Brusic V, Rudy G, Honeyman G, Hammer J, Harrison L: Prediction of MHCclass II-binding peptides using an evolutionary algorithm and artificialneural network. Bioinformatics 1998, 14:121-130.
5. Nielsen M, Lund O: NN-align. An artificial neural network-basedalignment algorithm for MHC class II peptide binding prediction. BMCbioinformatics 2009, 10:296.
6. Wan J, Liu W, Xu Q, Ren Y, Flower DR, Li T: SVRMHC prediction server forMHC-binding peptides. BMC bioinformatics 2006, 7:463.
7. Salomon J, Flower DR: Predicting Class II MHC-Peptide binding: a kernelbased approach using similarity scores. BMC bioinformatics 2006, 7:501.
8. Cui J, Han LY, Lin HH, Zhang HL, Tang ZQ, Zheng CJ, Cao ZW, Chen YZ:Prediction of MHC-binding peptides of flexible lengths from sequence-derived structural and physicochemical properties. Molecular immunology2007, 44:866-877.
9. Noguchi H, Kato R, Hanai T, Matsubara Y, Honda H, Brusic V, Kobayashi T:Hidden Markov model-based prediction of antigenic peptides thatinteract with MHC class II molecules. J Biosci Bioeng 2002, 94:264-270.
10. Bui HH, Sidney J, Peters B, Sathiamurthy M, Sinichi A, Purton KA, Mothe BR,Chisari FV, Watkins DI, Sette A: Automated generation and evaluation ofspecific MHC binding predictive tools: ARB matrix applications.Immunogenetics 2005, 57:304-314.
11. Murugan N, Dai Y: Prediction of MHC class II binding peptides based onan iterative learning model. Immunome research 2005, 1:6.
12. Chang ST, Ghosh D, Kirschner DE, Linderman JJ: Peptide length-basedprediction of peptide-MHC class II binding. Bioinformatics 2006,22:2761-2767.
13. Doytchinova IA, Flower DR: Towards the in silico identification of class IIrestricted T-cell epitopes: a partial least squares iterative self-consistentalgorithm for affinity prediction. Bioinformatics 2003, 19:2263-2270.
14. Rajapakse M, Schmidt B, Feng L, Brusic V: Predicting peptides binding toMHC class II molecules using multi-objective evolutionary algorithms.BMC bioinformatics 2007, 8:459.
15. Rammensee H, Bachmann J, Emmerich NP, Bachor OA, Stevanovic S:SYFPEITHI: database for MHC ligands and peptide motifs.Immunogenetics 1999, 50:213-219.
16. Hertz T, Yanover C: PepDist: a new framework for protein-peptidebinding prediction based on learning peptide distance functions. BMCbioinformatics 2006, 7(Suppl 1):S3.
Nielsen et al. Immunome Research 2010, 6:9http://www.immunome-research.com/content/6/1/9
Page 9 of 10

17. Zhang W, Liu J, Niu Y: Quantitative prediction of MHC-II binding affinityusing particle swarm optimization. Artificial intelligence in medicine 2010,50:127-132.
18. Dimitrov I, Garnev P, Flower DR, Doytchinova I: EpiTOP-aproteochemometric tool for MHC class II binding prediction.Bioinformatics 2010, 26:2066-2068.
19. Nielsen M, Lund O, Buus S, Lundegaard C: MHC Class II epitope predictivealgorithms. Immunology 2010, 130:319-328.
20. Hoof I, Peters B, Sidney J, Pedersen LE, Sette A, Lund O, Buus S, Nielsen M:NetMHCpan, a method for MHC class I binding prediction beyondhumans. Immunogenetics 2009, 61:1-13.
21. Nielsen M, Lundegaard C, Blicher T, Lamberth K, Harndahl M, Justesen S,Roder G, Peters B, Sette A, Lund O, Buus S: NetMHCpan, a method forquantitative predictions of peptide binding to any HLA-A and -B locusprotein of known sequence. PLoS ONE 2007, 2:e796.
22. Zhang H, Lund O, Nielsen M: The PickPocket method for predictingbinding specificities for receptors based on receptor pocket similarities:application to MHC-peptide binding. Bioinformatics 2009, 25:1293-1299.
23. Jacob L, Vert JP: Efficient peptide-MHC-I binding prediction for alleleswith few known binders. Bioinformatics 2008, 24:358-366.
24. Jojic N, Reyes-Gomez M, Heckerman D, Kadie C, Schueler-Furman O:Learning MHC I–peptide binding. Bioinformatics 2006, 22:e227-235.
25. Zaitlen N, Reyes-Gomez M, Heckerman D, Jojic N: Shift-invariant adaptivedouble threading: learning MHC II-peptide binding. J Comput Biol 2008,15:927-942.
26. Zhang GL, Khan AM, Srinivasan KN, August JT, Brusic V: MULTIPRED: acomputational system for prediction of promiscuous HLA bindingpeptides. Nucleic acids research 2005, 33:W172-179.
27. Lin HH, Zhang GL, Tongchusak S, Reinherz EL, Brusic V: Evaluation of MHC-II peptide binding prediction servers: applications for vaccine research.BMC bioinformatics 2008, 9(Suppl 12):S22.
28. Zhang H, Lundegaard C, Nielsen M: Pan-specific MHC class I predictors: abenchmark of HLA class I pan-specific prediction methods. Bioinformatics2009, 25:83-89.
29. Nielsen M, Lundegaard C, Blicher T, Peters B, Sette A, Justesen S, Buus S,Lund O: Quantitative predictions of peptide binding to any HLA-DRmolecule of known sequence: NetMHCIIpan. PLoS Comput Biol 2008, 4:e1000107.
30. Justesen S, Harndahl M, Lamberth K, Nielsen LL, Buus S: Functionalrecombinant MHC class II molecules and high-throughput peptide-binding assays. Immunome research 2009, 5:2.
31. Vita R, Zarebski L, Greenbaum JA, Emami H, Hoof I, Salimi N, Damle R,Sette A, Peters B: The immune epitope database 2.0. Nucleic acids research2010, 38:D854-862.
32. Nielsen M, Lundegaard C, Worning P, Lauemoller SL, Lamberth K, Buus S,Brunak S, Lund O: Reliable prediction of T-cell epitopes using neuralnetworks with novel sequence representations. Protein Sci 2003,12:1007-1017.
doi:10.1186/1745-7580-6-9Cite this article as: Nielsen et al.: NetMHCIIpan-2.0 - Improved pan-specific HLA-DR predictions using a novel concurrent alignment andweight optimization training procedure. Immunome Research 2010 6:9.
Submit your next manuscript to BioMed Centraland take full advantage of:
• Convenient online submission
• Thorough peer review
• No space constraints or color figure charges
• Immediate publication on acceptance
• Inclusion in PubMed, CAS, Scopus and Google Scholar
• Research which is freely available for redistribution
Submit your manuscript at www.biomedcentral.com/submit
Nielsen et al. Immunome Research 2010, 6:9http://www.immunome-research.com/content/6/1/9
Page 10 of 10