natural ventilation building design approach in ... - mdpi
TRANSCRIPT
sustainability
Article
Natural Ventilation Building Design Approach inMediterranean Regions—A Case Study at theValencian Coastal Regional Scale (Spain)
Miguel Mora-Pérez 1, Ignacio Guillen-Guillamón 2, Gonzalo López-Patiño 1
and Petra Amparo López-Jiménez 1,*1 Hydraulic Engineering and Environment Department, Universitat Politècnica de València,
Camino de Vera s/n, 46022 València, Spain; [email protected] (M.M.-P.);[email protected] (G.L.-P.)
2 Physic Department, Universitat Politècnica de València, Camino de Vera s/n, 46022 València, Spain;[email protected]
* Correspondence: [email protected]; Tel.: +34-963-877-000 (ext. 86106)
Academic Editors: Joanne Patterson and Derek SinnottReceived: 27 July 2016; Accepted: 22 August 2016; Published: 29 August 2016
Abstract: Environmental awareness has led to an increased concern about low carbon technologiesimplementation. Among these technologies, the following research is focused on the naturalventilation effect evaluation in buildings prior to its construction. The aim is to select the most suitablearchitectural solution to ensure comfortable indoor environment in the most efficient way in the earlybuilding design stage. The design approach takes into account the wind conditions in the region andthe building surroundings to evaluate the façade opening distribution impact on natural ventilationperformance. The design approach is based on computational fluid dynamics (CFD). In this article,a case study located in the Valencian Community (Spain) is depicted. The Valencian Communitycoastal climatic conditions are evaluated to assess the low carbon technology energy saving potential.Moreover, the main drivers and barriers involved in the design approach implementation in theregion are discussed. The conclusions show that the natural ventilation design approach can improveup to 9.7% the building energy performance respect an initial building design, in which naturalventilation has not been considered. The results contribute to an assessment of the complete lowcarbon technology effect in the region.
Keywords: low carbon technologies; energy efficient buildings; natural ventilation; wind energy;computational fluid dynamics
1. Introduction
Over the last 15 years, low carbon technologies to achieve sustainable buildings have becomemore popular, mainly because of the aim to reduce the greenhouse effect and to save energy andresources. The EU is working to achieve the reduction of greenhouse gas emission by 20% comparedwith the emission levels of 1990 by 2020. The built environment contributes with almost 35% of thetotal European CO2 emissions [1]. Residential buildings represent 77% of the total built environmentenergy use [1]. Consequently the residential sector represents an important percentage in which CO2
emissions could be reduced. Therefore, the authorities should push the implementation of low carbontechnologies in the residential built environment to meet the targets for sustainable development.Unfortunately, there are still barriers in the national laws that make it difficult.
The present sustainable building design approach is based on natural ventilation (NV). NV is apassive ventilation method based on wind and/or buoyancy pressure differences to refresh air fromindoor spaces with outdoor air [2]. The lower energy cost in comparison with mechanical ventilation
Sustainability 2016, 8, 855; doi:10.3390/su8090855 www.mdpi.com/journal/sustainability
Sustainability 2016, 8, 855 2 of 15
and the improved indoor environment air quality are the main benefits of NV [3]. Furthermore,many parameters should be analysed carefully to achieve these benefits. NV requires an appropriateunderstanding of building pressurization, façade design [4], wind patterns and local climate conditions.Accurately predicting and evaluating the NV performance, before and after building construction,is essential to reduce building energy use since the early design stage.
The energy reduction as a result of NV should be considered from the early building designstage in which building location, orientation and envelope have primary impact on building energyperformance [5]. Last but not least, wind flow also influences building ventilation, infiltration ratesand the associated heat losses or gains. Therefore, building envelope bears much importance in thebuildings energy behaviour. The façade performance should be improved according to the surroundingenvironment conditions and the neighbouring constructions that may modify the local flow causingunexpected flow effects. However, the fact remains that building designers often do not consider itdue to the lack of tools and expertise for evaluating and implementing it. Thus, this lack of knowledgein the field may result in poorly designed, constructed and operated naturally ventilated buildings.
Many methods are used to predict ventilation [6]. Among them, computational fluid dynamics(CFD) has been the most popular method for predicting NV nowadays [7–10], especially in studiesthat cannot be done in laboratories. Thus, CFD empowers building designers to optimize the buildingsolutions by simulation instead of trial-and-error techniques that require much effort, time andresources. Moreover, several standards and guidelines [11–15] have been developed to assist designersin the CFD model definition. The current research is therefore based on CFD to assist building designersto optimize NV building behaviour.
The present design approach is suitable to be used in a regional scale, thereby becoming it in asmart energy region. In any case the “smart energy region” definition is not simple. The definitioninvolves many issues, i.e., energy, technology, social, economic and environmental aspects of territory,etc. in a regional scale [16]. Furthermore, some strategies can be common in a regional scale andtheir global analysis permits designers to have tools for taking decisions when regional conditionsare similar.
In this context, the NV design approach is presented through a residential house—case studyin the Mediterranean region. Although the design approach is applied in a residential house, it canbe used in the whole built environment. The case study analyses the repercussion of distinct façadeopening configurations on the indoor airflow distribution to achieve an air sweeping effect to improvethe NV building behaviour. The particular Mediterranean coast environmental conditions are analyzed.Finally, the energy saving potential of the low carbon design approach used in the future new buildingsis evaluated over the complete region.
2. Case Study Description
2.1. Region Description
The research is focused on the Valencian Community Mediterranean coast (Spain). The ValencianCommunity is located along the Mediterranean Sea coast in the east of the Iberian Peninsula.The most important cities are Valencia, Alicante and Castellon. The Valencian Community has alarge mountain range and a thin coastal strip along the whole region. The Iberian mountain range isplaced in the inland part of the region. This part is craggy with mountain ranges higher than 1000 mhigh and mountain peaks higher than 1300 m (Penyagolosa 1813 m, Aitana 1558 m, Montcabrer 1390 m).The temperatures in the inland part are lower than comfort conditions in winter and higher in summer.Oppositely, the rather thin coastal strip is a very plain terrain and the temperatures are more averagedduring the whole year due to the Mediterranean Sea effect. Accordingly most of the population livesalong the thin coastal strip.
Climatic conditions in Valencian Community coastal zones are also common and particularlyinteresting to implement construction strategies based on NV. On the one hand, temperatures are
Sustainability 2016, 8, 855 3 of 15
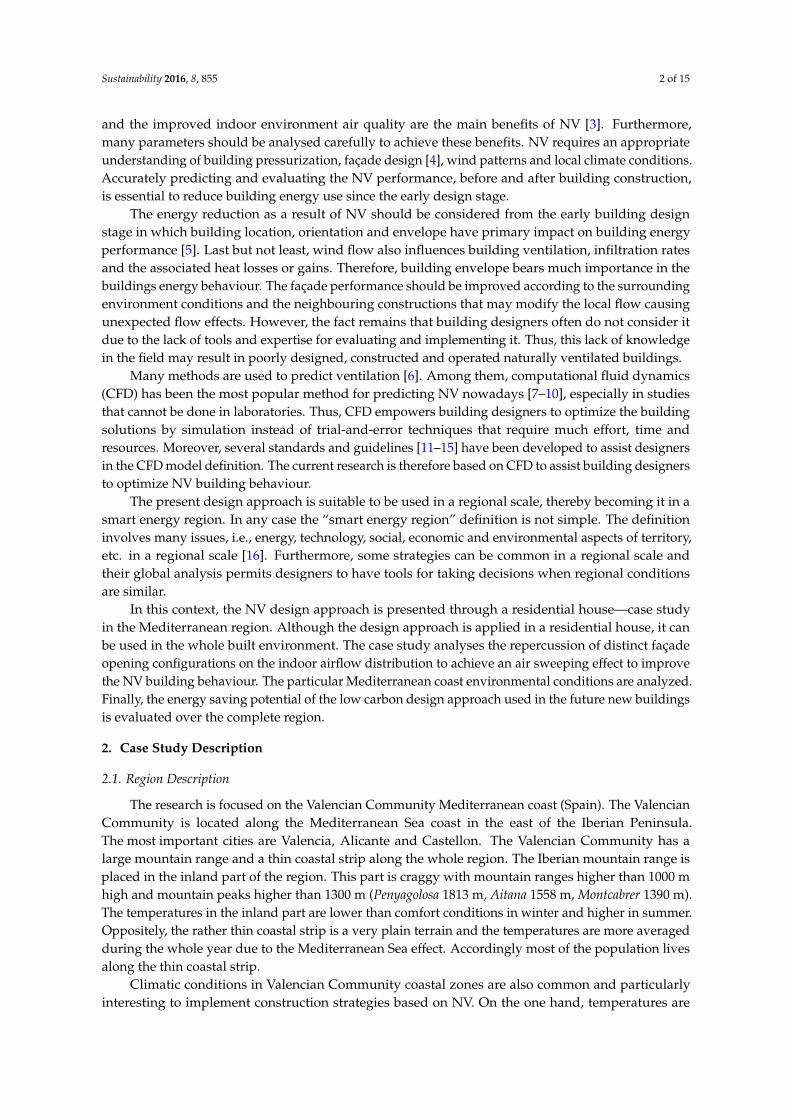
averaged during spring and autumn (temperature is near 20 ◦C). The mean temperatures are littlebit higher than 25 ◦C during July and August and a little bit lower than 15 ◦C during winter (seeFigure 1) [17].
Sustainability 2016, 8, 855 3 of 15
bit higher than 25 °C during July and August and a little bit lower than 15 °C during winter (see Figure 1) [17].
Figure 1. Mean temperature in the three more important cities in Valencian coastal region (IVE).
On the other hand, the sea location has a paramount influence in wind directions. The wind main direction determination is important for the efficient NV implementation as a low carbon technology. In this case, the predominant winds are in the main direction SW-NE in all the coastal regional zones [18]. Consequently, façades opening orientation and distribution analysis will be strongly recommended in the building design stage to ensure and increase NV effect.
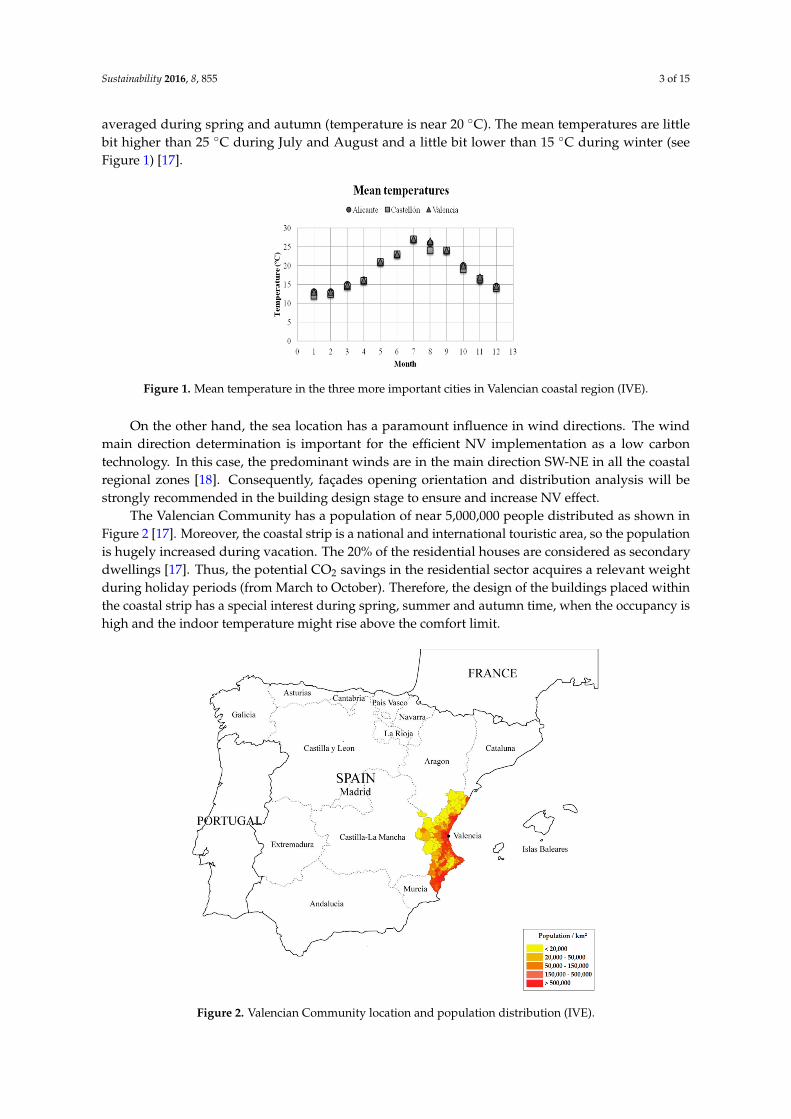
The Valencian Community has a population of near 5,000,000 people distributed as shown in Figure 2 [17]. Moreover, the coastal strip is a national and international touristic area, so the population is hugely increased during vacation. The 20% of the residential houses are considered as secondary dwellings [17]. Thus, the potential CO2 savings in the residential sector acquires a relevant weight during holiday periods (from March to October). Therefore, the design of the buildings placed within the coastal strip has a special interest during spring, summer and autumn time, when the occupancy is high and the indoor temperature might rise above the comfort limit.
Figure 2. Valencian Community location and population distribution (IVE).
Figure 1. Mean temperature in the three more important cities in Valencian coastal region (IVE).
On the other hand, the sea location has a paramount influence in wind directions. The windmain direction determination is important for the efficient NV implementation as a low carbontechnology. In this case, the predominant winds are in the main direction SW-NE in all the coastalregional zones [18]. Consequently, façades opening orientation and distribution analysis will bestrongly recommended in the building design stage to ensure and increase NV effect.
The Valencian Community has a population of near 5,000,000 people distributed as shown inFigure 2 [17]. Moreover, the coastal strip is a national and international touristic area, so the populationis hugely increased during vacation. The 20% of the residential houses are considered as secondarydwellings [17]. Thus, the potential CO2 savings in the residential sector acquires a relevant weightduring holiday periods (from March to October). Therefore, the design of the buildings placed withinthe coastal strip has a special interest during spring, summer and autumn time, when the occupancy ishigh and the indoor temperature might rise above the comfort limit.
Sustainability 2016, 8, 855 3 of 15
bit higher than 25 °C during July and August and a little bit lower than 15 °C during winter (see Figure 1) [17].
Figure 1. Mean temperature in the three more important cities in Valencian coastal region (IVE).
On the other hand, the sea location has a paramount influence in wind directions. The wind main direction determination is important for the efficient NV implementation as a low carbon technology. In this case, the predominant winds are in the main direction SW-NE in all the coastal regional zones [18]. Consequently, façades opening orientation and distribution analysis will be strongly recommended in the building design stage to ensure and increase NV effect.
The Valencian Community has a population of near 5,000,000 people distributed as shown in Figure 2 [17]. Moreover, the coastal strip is a national and international touristic area, so the population is hugely increased during vacation. The 20% of the residential houses are considered as secondary dwellings [17]. Thus, the potential CO2 savings in the residential sector acquires a relevant weight during holiday periods (from March to October). Therefore, the design of the buildings placed within the coastal strip has a special interest during spring, summer and autumn time, when the occupancy is high and the indoor temperature might rise above the comfort limit.
Figure 2. Valencian Community location and population distribution (IVE). Figure 2. Valencian Community location and population distribution (IVE).
Sustainability 2016, 8, 855 4 of 15
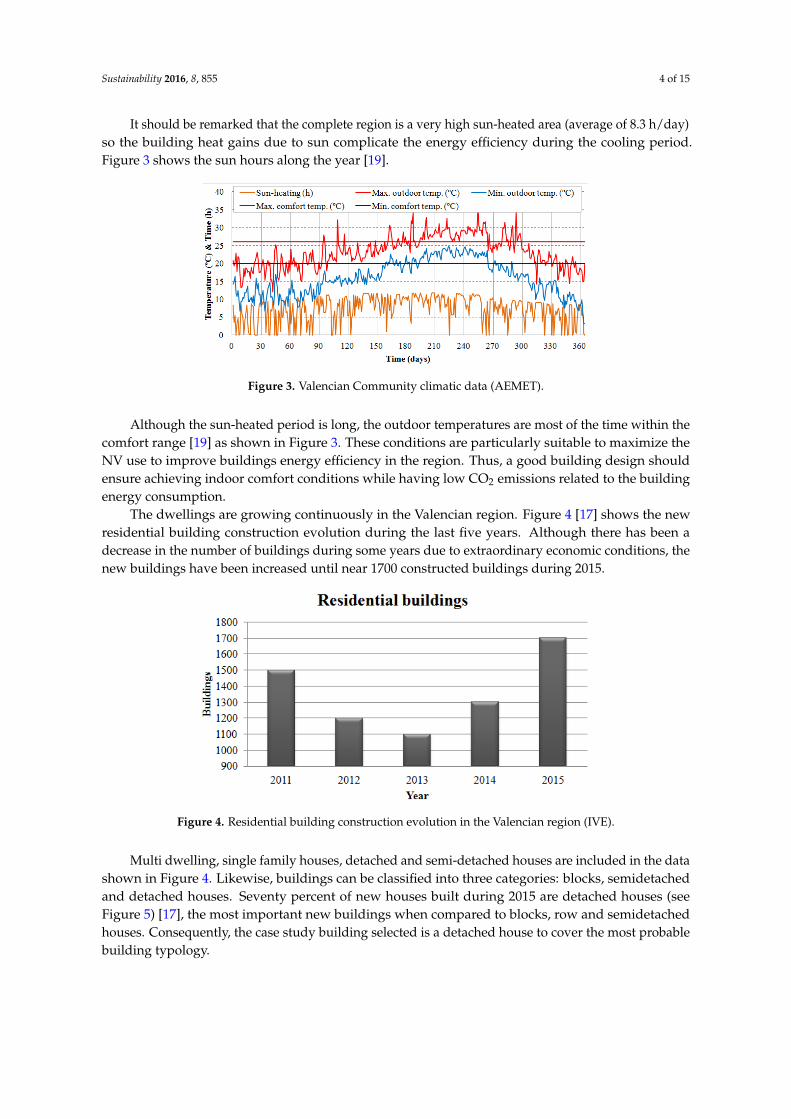
It should be remarked that the complete region is a very high sun-heated area (average of 8.3 h/day)so the building heat gains due to sun complicate the energy efficiency during the cooling period.Figure 3 shows the sun hours along the year [19].
Sustainability 2016, 8, 855 4 of 15
It should be remarked that the complete region is a very high sun-heated area (average of 8.3 h/day) so the building heat gains due to sun complicate the energy efficiency during the cooling period. Figure 3 shows the sun hours along the year [19].
Figure 3. Valencian Community climatic data (AEMET).
Although the sun-heated period is long, the outdoor temperatures are most of the time within the comfort range [19] as shown in Figure 3. These conditions are particularly suitable to maximize the NV use to improve buildings energy efficiency in the region. Thus, a good building design should ensure achieving indoor comfort conditions while having low CO2 emissions related to the building energy consumption.
The dwellings are growing continuously in the Valencian region. Figure 4 [17] shows the new residential building construction evolution during the last five years. Although there has been a decrease in the number of buildings during some years due to extraordinary economic conditions, the new buildings have been increased until near 1700 constructed buildings during 2015.
Figure 4. Residential building construction evolution in the Valencian region (IVE).
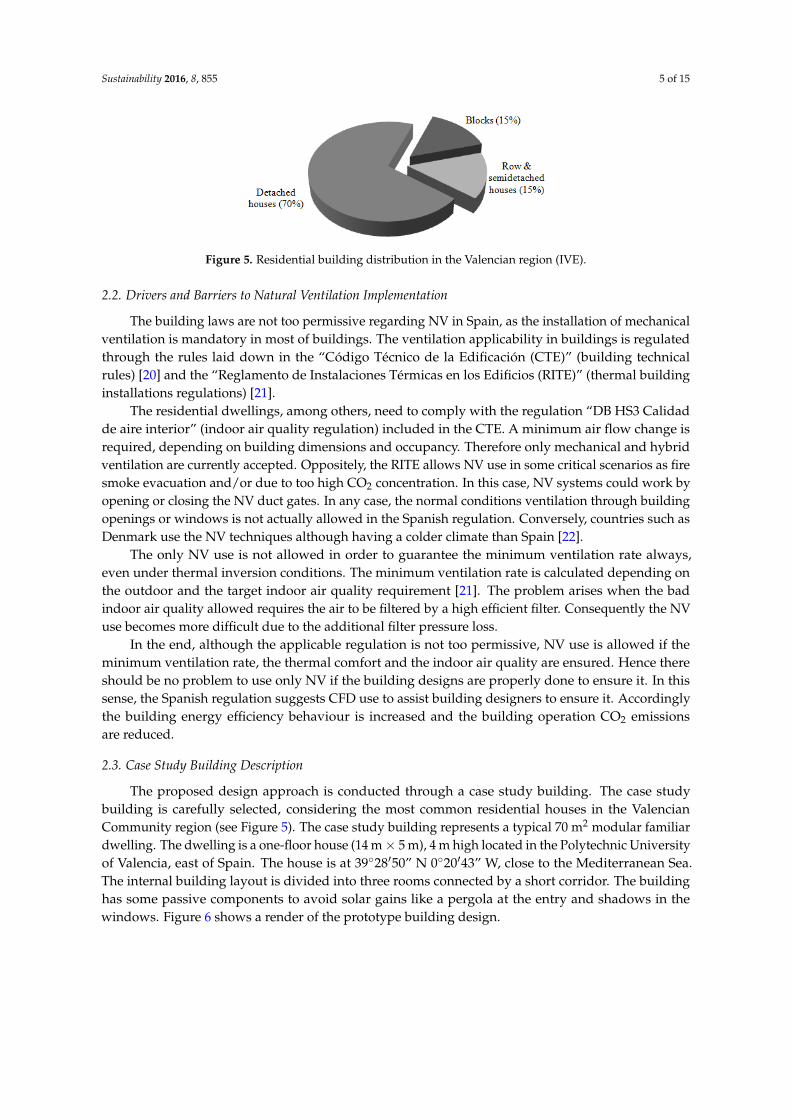
Multi dwelling, single family houses, detached and semi-detached houses are included in the data shown in Figure 4. Likewise, buildings can be classified into three categories: blocks, semidetached and detached houses. Seventy percent of new houses built during 2015 are detached houses (see Figure 5) [17], the most important new buildings when compared to blocks, row and semidetached houses. Consequently, the case study building selected is a detached house to cover the most probable building typology.
Figure 3. Valencian Community climatic data (AEMET).
Although the sun-heated period is long, the outdoor temperatures are most of the time within thecomfort range [19] as shown in Figure 3. These conditions are particularly suitable to maximize theNV use to improve buildings energy efficiency in the region. Thus, a good building design shouldensure achieving indoor comfort conditions while having low CO2 emissions related to the buildingenergy consumption.
The dwellings are growing continuously in the Valencian region. Figure 4 [17] shows the newresidential building construction evolution during the last five years. Although there has been adecrease in the number of buildings during some years due to extraordinary economic conditions, thenew buildings have been increased until near 1700 constructed buildings during 2015.
Sustainability 2016, 8, 855 4 of 15
It should be remarked that the complete region is a very high sun-heated area (average of 8.3 h/day) so the building heat gains due to sun complicate the energy efficiency during the cooling period. Figure 3 shows the sun hours along the year [19].
Figure 3. Valencian Community climatic data (AEMET).
Although the sun-heated period is long, the outdoor temperatures are most of the time within the comfort range [19] as shown in Figure 3. These conditions are particularly suitable to maximize the NV use to improve buildings energy efficiency in the region. Thus, a good building design should ensure achieving indoor comfort conditions while having low CO2 emissions related to the building energy consumption.
The dwellings are growing continuously in the Valencian region. Figure 4 [17] shows the new residential building construction evolution during the last five years. Although there has been a decrease in the number of buildings during some years due to extraordinary economic conditions, the new buildings have been increased until near 1700 constructed buildings during 2015.
Figure 4. Residential building construction evolution in the Valencian region (IVE).
Multi dwelling, single family houses, detached and semi-detached houses are included in the data shown in Figure 4. Likewise, buildings can be classified into three categories: blocks, semidetached and detached houses. Seventy percent of new houses built during 2015 are detached houses (see Figure 5) [17], the most important new buildings when compared to blocks, row and semidetached houses. Consequently, the case study building selected is a detached house to cover the most probable building typology.
Figure 4. Residential building construction evolution in the Valencian region (IVE).
Multi dwelling, single family houses, detached and semi-detached houses are included in the datashown in Figure 4. Likewise, buildings can be classified into three categories: blocks, semidetachedand detached houses. Seventy percent of new houses built during 2015 are detached houses (seeFigure 5) [17], the most important new buildings when compared to blocks, row and semidetachedhouses. Consequently, the case study building selected is a detached house to cover the most probablebuilding typology.
Sustainability 2016, 8, 855 5 of 15Sustainability 2016, 8, 855 5 of 15
Figure 5. Residential building distribution in the Valencian region (IVE).
2.2. Drivers and Barriers to Natural Ventilation Implementation
The building laws are not too permissive regarding NV in Spain, as the installation of mechanical ventilation is mandatory in most of buildings. The ventilation applicability in buildings is regulated through the rules laid down in the “Código Técnico de la Edificación (CTE)” (building technical rules) [20] and the “Reglamento de Instalaciones Térmicas en los Edificios (RITE)” (thermal building installations regulations) [21].
The residential dwellings, among others, need to comply with the regulation “DB HS3 Calidad de aire interior” (indoor air quality regulation) included in the CTE. A minimum air flow change is required, depending on building dimensions and occupancy. Therefore only mechanical and hybrid ventilation are currently accepted. Oppositely, the RITE allows NV use in some critical scenarios as fire smoke evacuation and/or due to too high CO2 concentration. In this case, NV systems could work by opening or closing the NV duct gates. In any case, the normal conditions ventilation through building openings or windows is not actually allowed in the Spanish regulation. Conversely, countries such as Denmark use the NV techniques although having a colder climate than Spain [22].
The only NV use is not allowed in order to guarantee the minimum ventilation rate always, even under thermal inversion conditions. The minimum ventilation rate is calculated depending on the outdoor and the target indoor air quality requirement [21]. The problem arises when the bad indoor air quality allowed requires the air to be filtered by a high efficient filter. Consequently the NV use becomes more difficult due to the additional filter pressure loss.
In the end, although the applicable regulation is not too permissive, NV use is allowed if the minimum ventilation rate, the thermal comfort and the indoor air quality are ensured. Hence there should be no problem to use only NV if the building designs are properly done to ensure it. In this sense, the Spanish regulation suggests CFD use to assist building designers to ensure it. Accordingly the building energy efficiency behaviour is increased and the building operation CO2 emissions are reduced.
2.3. Case Study Building Description
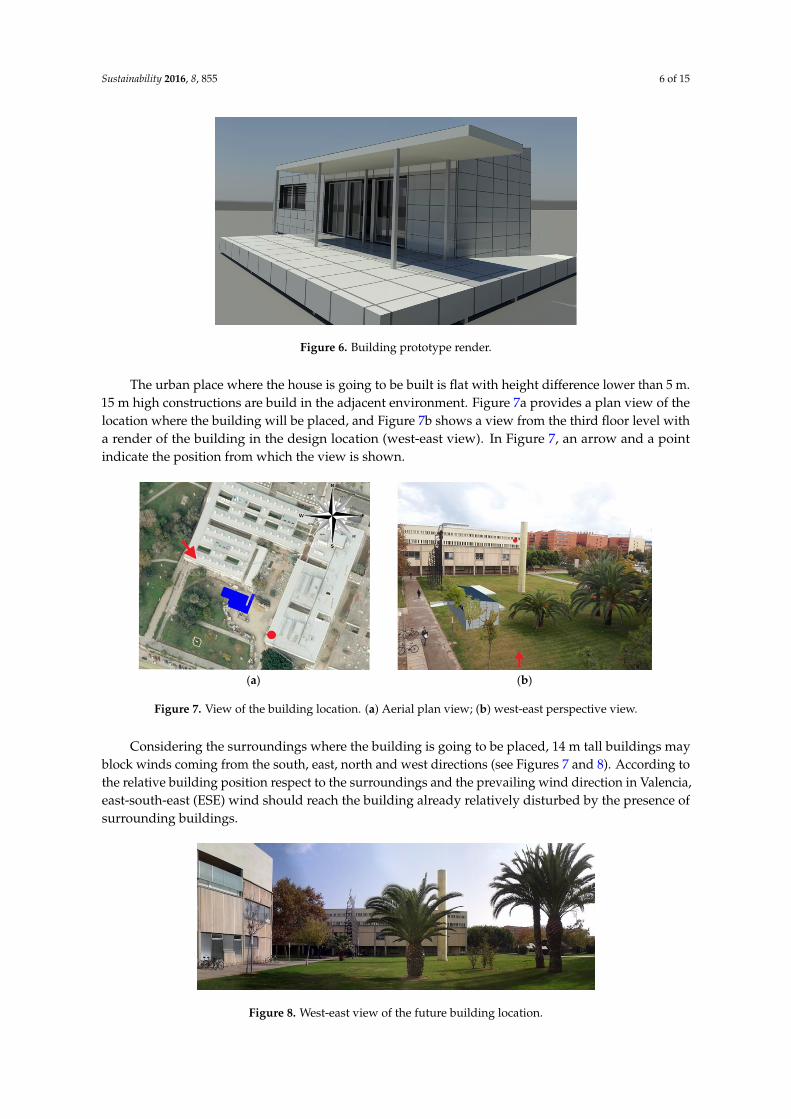
The proposed design approach is conducted through a case study building. The case study building is carefully selected, considering the most common residential houses in the Valencian Community region (see Figure 5). The case study building represents a typical 70 m2 modular familiar dwelling. The dwelling is a one-floor house (14 m × 5 m), 4 m high located in the Polytechnic University of Valencia, east of Spain. The house is at 39°28′50″ N 0°20′43″ W, close to the Mediterranean Sea. The internal building layout is divided into three rooms connected by a short corridor. The building has some passive components to avoid solar gains like a pergola at the entry and shadows in the windows. Figure 6 shows a render of the prototype building design.
Figure 5. Residential building distribution in the Valencian region (IVE).
2.2. Drivers and Barriers to Natural Ventilation Implementation
The building laws are not too permissive regarding NV in Spain, as the installation of mechanicalventilation is mandatory in most of buildings. The ventilation applicability in buildings is regulatedthrough the rules laid down in the “Código Técnico de la Edificación (CTE)” (building technicalrules) [20] and the “Reglamento de Instalaciones Térmicas en los Edificios (RITE)” (thermal buildinginstallations regulations) [21].
The residential dwellings, among others, need to comply with the regulation “DB HS3 Calidadde aire interior” (indoor air quality regulation) included in the CTE. A minimum air flow change isrequired, depending on building dimensions and occupancy. Therefore only mechanical and hybridventilation are currently accepted. Oppositely, the RITE allows NV use in some critical scenarios as firesmoke evacuation and/or due to too high CO2 concentration. In this case, NV systems could work byopening or closing the NV duct gates. In any case, the normal conditions ventilation through buildingopenings or windows is not actually allowed in the Spanish regulation. Conversely, countries such asDenmark use the NV techniques although having a colder climate than Spain [22].
The only NV use is not allowed in order to guarantee the minimum ventilation rate always,even under thermal inversion conditions. The minimum ventilation rate is calculated depending onthe outdoor and the target indoor air quality requirement [21]. The problem arises when the badindoor air quality allowed requires the air to be filtered by a high efficient filter. Consequently the NVuse becomes more difficult due to the additional filter pressure loss.
In the end, although the applicable regulation is not too permissive, NV use is allowed if theminimum ventilation rate, the thermal comfort and the indoor air quality are ensured. Hence thereshould be no problem to use only NV if the building designs are properly done to ensure it. In thissense, the Spanish regulation suggests CFD use to assist building designers to ensure it. Accordinglythe building energy efficiency behaviour is increased and the building operation CO2 emissionsare reduced.
2.3. Case Study Building Description
The proposed design approach is conducted through a case study building. The case studybuilding is carefully selected, considering the most common residential houses in the ValencianCommunity region (see Figure 5). The case study building represents a typical 70 m2 modular familiardwelling. The dwelling is a one-floor house (14 m× 5 m), 4 m high located in the Polytechnic Universityof Valencia, east of Spain. The house is at 39◦28′50” N 0◦20′43” W, close to the Mediterranean Sea.The internal building layout is divided into three rooms connected by a short corridor. The buildinghas some passive components to avoid solar gains like a pergola at the entry and shadows in thewindows. Figure 6 shows a render of the prototype building design.
Sustainability 2016, 8, 855 6 of 15
Sustainability 2016, 8, 855 6 of 15
Figure 6. Building prototype render.
The urban place where the house is going to be built is flat with height difference lower than 5 m. 15 m high constructions are build in the adjacent environment. Figure 7a provides a plan view of the location where the building will be placed, and Figure 7b shows a view from the third floor level with a render of the building in the design location (west-east view). In Figure 7, an arrow and a point indicate the position from which the view is shown.
(a) (b)
Figure 7. View of the building location. (a) Aerial plan view; (b) west-east perspective view.
Considering the surroundings where the building is going to be placed, 14 m tall buildings may block winds coming from the south, east, north and west directions (see Figures 7 and 8). According to the relative building position respect to the surroundings and the prevailing wind direction in Valencia, east-south-east (ESE) wind should reach the building already relatively disturbed by the presence of surrounding buildings.
Figure 8. West-east view of the future building location.
Figure 6. Building prototype render.
The urban place where the house is going to be built is flat with height difference lower than 5 m.15 m high constructions are build in the adjacent environment. Figure 7a provides a plan view of thelocation where the building will be placed, and Figure 7b shows a view from the third floor level witha render of the building in the design location (west-east view). In Figure 7, an arrow and a pointindicate the position from which the view is shown.
Sustainability 2016, 8, 855 6 of 15
Figure 6. Building prototype render.
The urban place where the house is going to be built is flat with height difference lower than 5 m. 15 m high constructions are build in the adjacent environment. Figure 7a provides a plan view of the location where the building will be placed, and Figure 7b shows a view from the third floor level with a render of the building in the design location (west-east view). In Figure 7, an arrow and a point indicate the position from which the view is shown.
(a) (b)
Figure 7. View of the building location. (a) Aerial plan view; (b) west-east perspective view.
Considering the surroundings where the building is going to be placed, 14 m tall buildings may block winds coming from the south, east, north and west directions (see Figures 7 and 8). According to the relative building position respect to the surroundings and the prevailing wind direction in Valencia, east-south-east (ESE) wind should reach the building already relatively disturbed by the presence of surrounding buildings.
Figure 8. West-east view of the future building location.
Figure 7. View of the building location. (a) Aerial plan view; (b) west-east perspective view.
Considering the surroundings where the building is going to be placed, 14 m tall buildings mayblock winds coming from the south, east, north and west directions (see Figures 7 and 8). According tothe relative building position respect to the surroundings and the prevailing wind direction in Valencia,east-south-east (ESE) wind should reach the building already relatively disturbed by the presence ofsurrounding buildings.
Sustainability 2016, 8, 855 6 of 15
Figure 6. Building prototype render.
The urban place where the house is going to be built is flat with height difference lower than 5 m. 15 m high constructions are build in the adjacent environment. Figure 7a provides a plan view of the location where the building will be placed, and Figure 7b shows a view from the third floor level with a render of the building in the design location (west-east view). In Figure 7, an arrow and a point indicate the position from which the view is shown.
(a) (b)
Figure 7. View of the building location. (a) Aerial plan view; (b) west-east perspective view.
Considering the surroundings where the building is going to be placed, 14 m tall buildings may block winds coming from the south, east, north and west directions (see Figures 7 and 8). According to the relative building position respect to the surroundings and the prevailing wind direction in Valencia, east-south-east (ESE) wind should reach the building already relatively disturbed by the presence of surrounding buildings.
Figure 8. West-east view of the future building location. Figure 8. West-east view of the future building location.
Sustainability 2016, 8, 855 7 of 15
The main wind direction strongly affects window orientation for NV design. Therefore theposition and size of the openings has to be analysed to provide strong and well-distributed airflowthroughout the building. Other aspects are assumed to be constant and already defined (buildingshape, location, orientation and internal distribution).
The building has six initial outdoor ventilation openings. Four of these openings are windowsplaced in the upper part of the north façade (0.5 m × 2 m). The south façade has a window(1.5 m × 3.7 m) and a door (2.5 m × 6 m). To improve NV performance, the ESE prevailing windsuggests including an opening in the east building face. This opening allows the prevailing windflow to go through the east building face, improving the total air change rate (ACR) of the building.Furthermore, a vertical and narrow window may provide a well-distributed airflow throughout thewhole building.
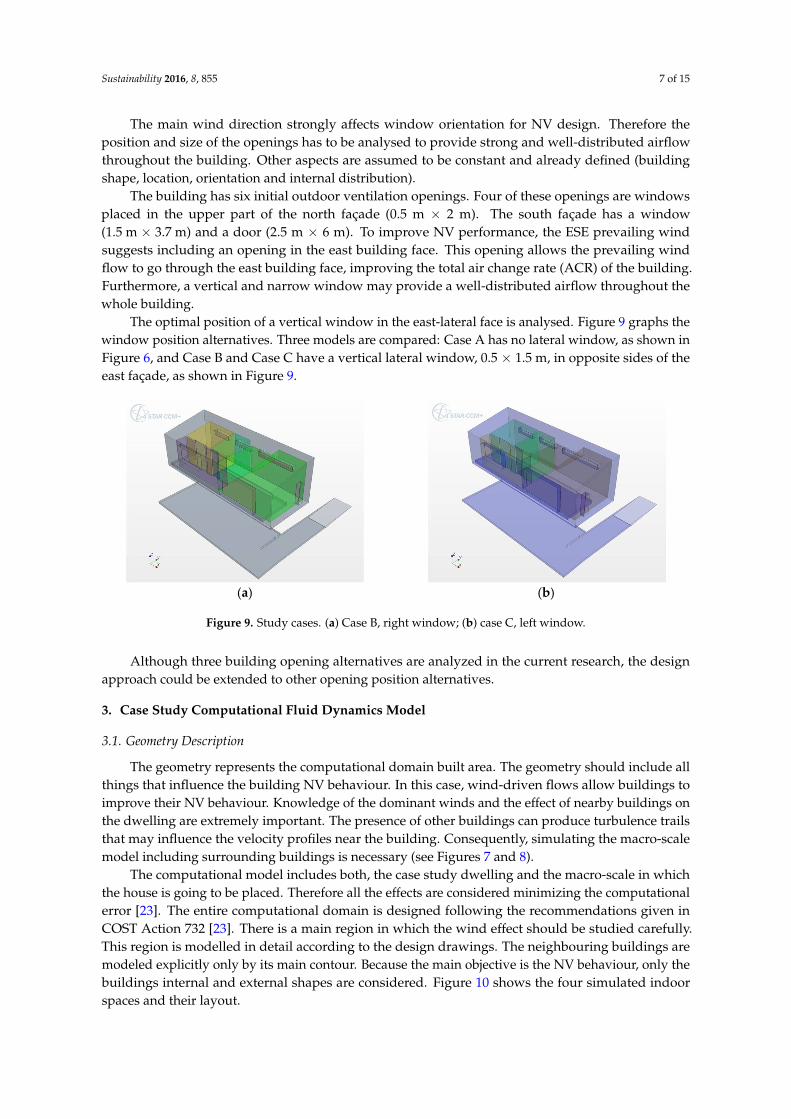
The optimal position of a vertical window in the east-lateral face is analysed. Figure 9 graphs thewindow position alternatives. Three models are compared: Case A has no lateral window, as shown inFigure 6, and Case B and Case C have a vertical lateral window, 0.5 × 1.5 m, in opposite sides of theeast façade, as shown in Figure 9.
Sustainability 2016, 8, 855 7 of 15
The main wind direction strongly affects window orientation for NV design. Therefore the position and size of the openings has to be analysed to provide strong and well-distributed airflow throughout the building. Other aspects are assumed to be constant and already defined (building shape, location, orientation and internal distribution).
The building has six initial outdoor ventilation openings. Four of these openings are windows placed in the upper part of the north façade (0.5 m × 2 m). The south façade has a window (1.5 m × 3.7 m) and a door (2.5 m × 6 m). To improve NV performance, the ESE prevailing wind suggests including an opening in the east building face. This opening allows the prevailing wind flow to go through the east building face, improving the total air change rate (ACR) of the building. Furthermore, a vertical and narrow window may provide a well-distributed airflow throughout the whole building.
The optimal position of a vertical window in the east-lateral face is analysed. Figure 9 graphs the window position alternatives. Three models are compared: Case A has no lateral window, as shown in Figure 6, and Case B and Case C have a vertical lateral window, 0.5 × 1.5 m, in opposite sides of the east façade, as shown in Figure 9.
(a) (b)
Figure 9. Study cases. (a) Case B, right window; (b) case C, left window.
Although three building opening alternatives are analyzed in the current research, the design approach could be extended to other opening position alternatives.
3. Case Study Computational Fluid Dynamics Model
3.1. Geometry Description
The geometry represents the computational domain built area. The geometry should include all things that influence the building NV behaviour. In this case, wind-driven flows allow buildings to improve their NV behaviour. Knowledge of the dominant winds and the effect of nearby buildings on the dwelling are extremely important. The presence of other buildings can produce turbulence trails that may influence the velocity profiles near the building. Consequently, simulating the macro-scale model including surrounding buildings is necessary (see Figures 7 and 8).
The computational model includes both, the case study dwelling and the macro-scale in which the house is going to be placed. Therefore all the effects are considered minimizing the computational error [23]. The entire computational domain is designed following the recommendations given in COST Action 732 [23]. There is a main region in which the wind effect should be studied carefully. This region is modelled in detail according to the design drawings. The neighbouring buildings are modeled explicitly only by its main contour. Because the main objective is the NV behaviour, only the buildings internal and external shapes are considered. Figure 10 shows the four simulated indoor spaces and their layout.
Figure 9. Study cases. (a) Case B, right window; (b) case C, left window.
Although three building opening alternatives are analyzed in the current research, the designapproach could be extended to other opening position alternatives.
3. Case Study Computational Fluid Dynamics Model
3.1. Geometry Description
The geometry represents the computational domain built area. The geometry should include allthings that influence the building NV behaviour. In this case, wind-driven flows allow buildings toimprove their NV behaviour. Knowledge of the dominant winds and the effect of nearby buildings onthe dwelling are extremely important. The presence of other buildings can produce turbulence trailsthat may influence the velocity profiles near the building. Consequently, simulating the macro-scalemodel including surrounding buildings is necessary (see Figures 7 and 8).
The computational model includes both, the case study dwelling and the macro-scale in whichthe house is going to be placed. Therefore all the effects are considered minimizing the computationalerror [23]. The entire computational domain is designed following the recommendations given inCOST Action 732 [23]. There is a main region in which the wind effect should be studied carefully.This region is modelled in detail according to the design drawings. The neighbouring buildings aremodeled explicitly only by its main contour. Because the main objective is the NV behaviour, only thebuildings internal and external shapes are considered. Figure 10 shows the four simulated indoorspaces and their layout.
Sustainability 2016, 8, 855 8 of 15Sustainability 2016, 8, 855 8 of 15
Figure 10. Design building indoor layout.
3.2. Boundary Conditions
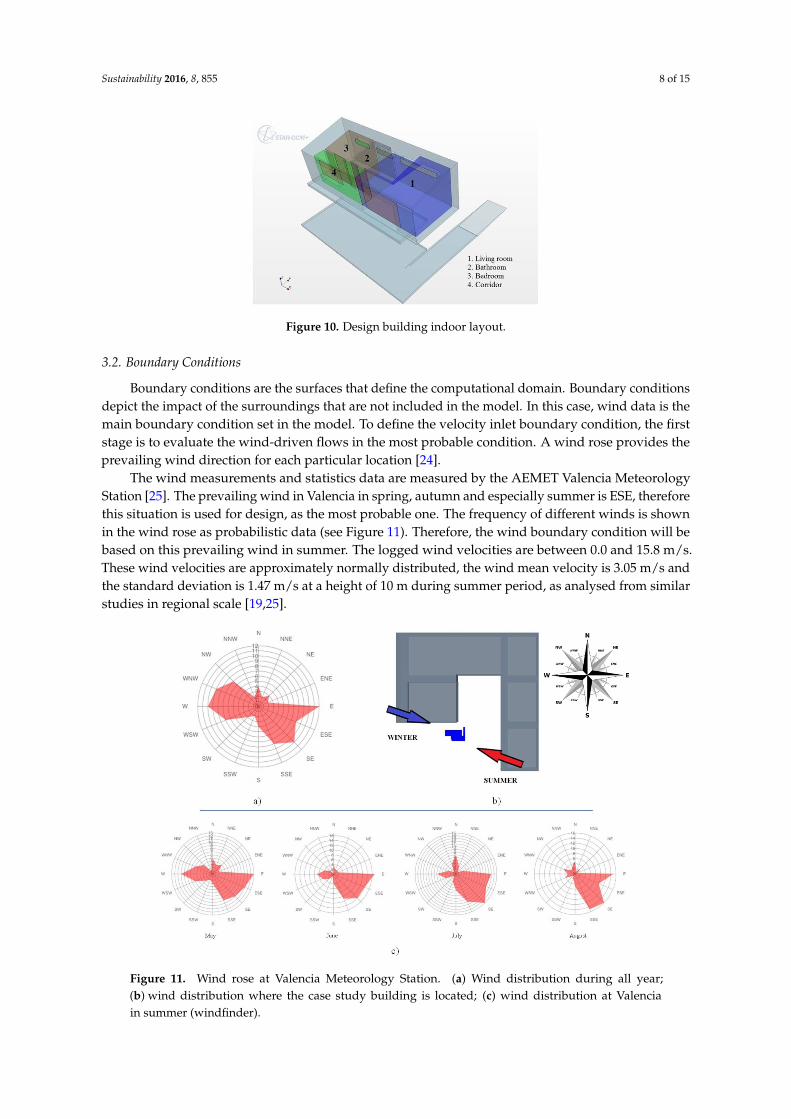
Boundary conditions are the surfaces that define the computational domain. Boundary conditions depict the impact of the surroundings that are not included in the model. In this case, wind data is the main boundary condition set in the model. To define the velocity inlet boundary condition, the first stage is to evaluate the wind-driven flows in the most probable condition. A wind rose provides the prevailing wind direction for each particular location [24].
The wind measurements and statistics data are measured by the AEMET Valencia Meteorology Station [25]. The prevailing wind in Valencia in spring, autumn and especially summer is ESE, therefore this situation is used for design, as the most probable one. The frequency of different winds is shown in the wind rose as probabilistic data (see Figure 11). Therefore, the wind boundary condition will be based on this prevailing wind in summer. The logged wind velocities are between 0.0 and 15.8 m/s. These wind velocities are approximately normally distributed, the wind mean velocity is 3.05 m/s and the standard deviation is 1.47 m/s at a height of 10 m during summer period, as analysed from similar studies in regional scale [19,25].
Figure 11. Wind rose at Valencia Meteorology Station. (a) Wind distribution during all year; (b) wind distribution where the case study building is located; (c) wind distribution at Valencia in summer (windfinder).
Figure 10. Design building indoor layout.
3.2. Boundary Conditions
Boundary conditions are the surfaces that define the computational domain. Boundary conditionsdepict the impact of the surroundings that are not included in the model. In this case, wind data is themain boundary condition set in the model. To define the velocity inlet boundary condition, the firststage is to evaluate the wind-driven flows in the most probable condition. A wind rose provides theprevailing wind direction for each particular location [24].
The wind measurements and statistics data are measured by the AEMET Valencia MeteorologyStation [25]. The prevailing wind in Valencia in spring, autumn and especially summer is ESE, thereforethis situation is used for design, as the most probable one. The frequency of different winds is shownin the wind rose as probabilistic data (see Figure 11). Therefore, the wind boundary condition will bebased on this prevailing wind in summer. The logged wind velocities are between 0.0 and 15.8 m/s.These wind velocities are approximately normally distributed, the wind mean velocity is 3.05 m/s andthe standard deviation is 1.47 m/s at a height of 10 m during summer period, as analysed from similarstudies in regional scale [19,25].
Sustainability 2016, 8, 855 8 of 15
Figure 10. Design building indoor layout.
3.2. Boundary Conditions
Boundary conditions are the surfaces that define the computational domain. Boundary conditions depict the impact of the surroundings that are not included in the model. In this case, wind data is the main boundary condition set in the model. To define the velocity inlet boundary condition, the first stage is to evaluate the wind-driven flows in the most probable condition. A wind rose provides the prevailing wind direction for each particular location [24].
The wind measurements and statistics data are measured by the AEMET Valencia Meteorology Station [25]. The prevailing wind in Valencia in spring, autumn and especially summer is ESE, therefore this situation is used for design, as the most probable one. The frequency of different winds is shown in the wind rose as probabilistic data (see Figure 11). Therefore, the wind boundary condition will be based on this prevailing wind in summer. The logged wind velocities are between 0.0 and 15.8 m/s. These wind velocities are approximately normally distributed, the wind mean velocity is 3.05 m/s and the standard deviation is 1.47 m/s at a height of 10 m during summer period, as analysed from similar studies in regional scale [19,25].
Figure 11. Wind rose at Valencia Meteorology Station. (a) Wind distribution during all year; (b) wind distribution where the case study building is located; (c) wind distribution at Valencia in summer (windfinder).
Figure 11. Wind rose at Valencia Meteorology Station. (a) Wind distribution during all year;(b) wind distribution where the case study building is located; (c) wind distribution at Valenciain summer (windfinder).
Sustainability 2016, 8, 855 9 of 15
Wind data is adapted to be simulated for height [26]. The wind resource should be extrapolatedfrom the available height to a shear model [27]. Justus and Mikhail [28] is used to define the verticalvelocity profile using Expression (1).
c(z) = ca
(zza
)n(1)
in which c(z) represents the speed at height z (measured in m) and ca is the average speed at za height(measured in m/s). The “n” exponent is defined by Expression (2).
n =0.37− 0.088× ln(ca)
1− 0.088× ln(za/10)(2)
The exponential velocity profile is set in the ESE direction as inlet velocity in the simulation.The outlet boundary conditions is set as zero relative static pressure based on previous researches [29–31].The top and lateral model walls are set as symmetry faces to enforce parallel flow. The modellateral walls and ceiling are defined as smooth surfaces. The commercial code Star CCM+ isused as a computational fluid dynamic software to perform the simulations. The conservationof mass and momentum fluid dynamic laws are solved by the numerical code. The ReynoldsAveraged Navier-Stokes (RANS) equations are calculated in the target region considering the turbulentapproach [32]. The reviewed literature shows the standard k-ε model as the most suitable model forthis application [33].
3.3. Validation with Full-Scale Measurements
CFD models must be validated to ensure their reliable results. The CFD validation can be doneusing several methods [15,34]. This particular case does not allow full-scale indoor measurements tobe done, as the building only exists in drawings, and it can still be modified. However, outdoor windmeasurements can be performed as well to validate the CFD model. The measurement strategy aimsto measure the outdoor conditions by means of installing sensors in some strategic points, as describedin the referred literature [10,15,34–36]. Future works will focus on a more detailed validation process,with inside measurements comparisons, when the building is finally constructed.
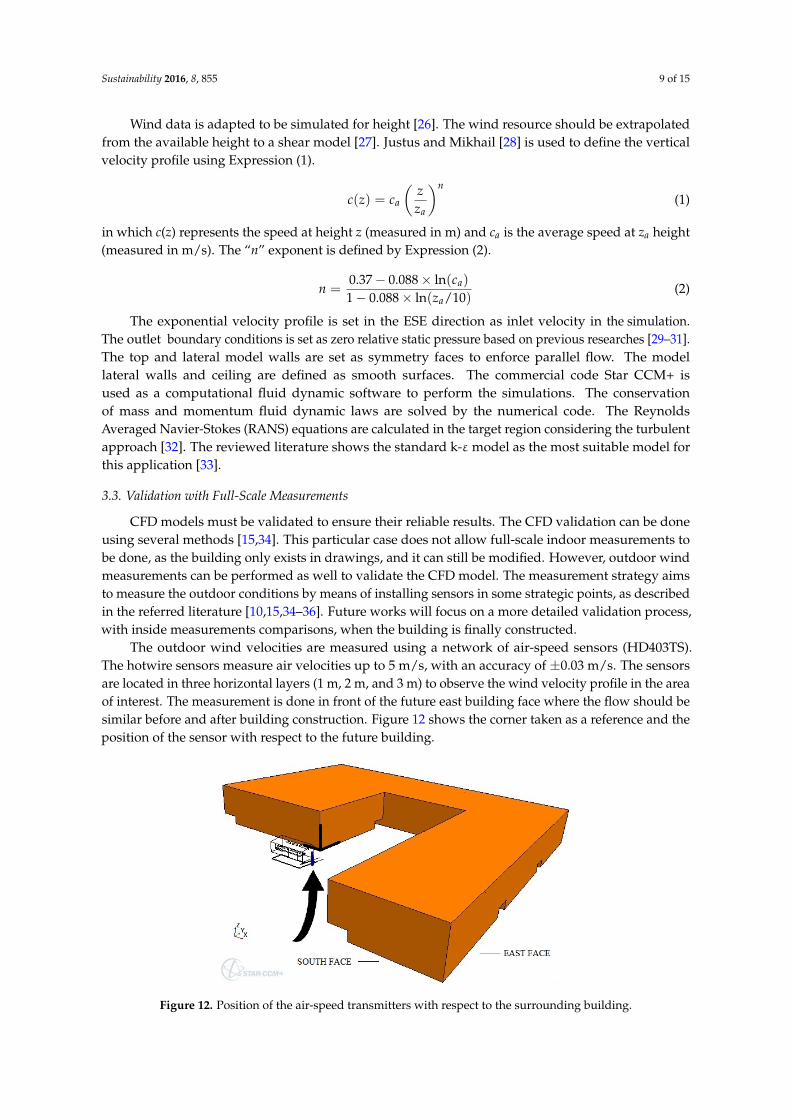
The outdoor wind velocities are measured using a network of air-speed sensors (HD403TS).The hotwire sensors measure air velocities up to 5 m/s, with an accuracy of ±0.03 m/s. The sensorsare located in three horizontal layers (1 m, 2 m, and 3 m) to observe the wind velocity profile in the areaof interest. The measurement is done in front of the future east building face where the flow should besimilar before and after building construction. Figure 12 shows the corner taken as a reference and theposition of the sensor with respect to the future building.
Sustainability 2016, 8, 855 9 of 15
Wind data is adapted to be simulated for height [26]. The wind resource should be extrapolated from the available height to a shear model [27]. Justus and Mikhail [28] is used to define the vertical velocity profile using Expression (1).
n
aa zzczc
)( (1)
in which c(z) represents the speed at height z (measured in m) and ca is the average speed at za height (measured in m/s). The “n” exponent is defined by Expression (2).
0.37 0.088 ln( )1 0.088 ln( 10)
a
a
cnz
(2)
The exponential velocity profile is set in the ESE direction as inlet velocity in the simulation. The outlet boundary conditions is set as zero relative static pressure based on previous researches [29–31]. The top and lateral model walls are set as symmetry faces to enforce parallel flow. The model lateral walls and ceiling are defined as smooth surfaces. The commercial code Star CCM+ is used as a computational fluid dynamic software to perform the simulations. The conservation of mass and momentum fluid dynamic laws are solved by the numerical code. The Reynolds Averaged Navier-Stokes (RANS) equations are calculated in the target region considering the turbulent approach [32]. The reviewed literature shows the standard k-ε model as the most suitable model for this application [33].
3.3. Validation with Full-Scale Measurements
CFD models must be validated to ensure their reliable results. The CFD validation can be done using several methods [15,34]. This particular case does not allow full-scale indoor measurements to be done, as the building only exists in drawings, and it can still be modified. However, outdoor wind measurements can be performed as well to validate the CFD model. The measurement strategy aims to measure the outdoor conditions by means of installing sensors in some strategic points, as described in the referred literature [10,15,34–36]. Future works will focus on a more detailed validation process, with inside measurements comparisons, when the building is finally constructed.
The outdoor wind velocities are measured using a network of air-speed sensors (HD403TS). The hotwire sensors measure air velocities up to 5 m/s, with an accuracy of ±0.03 m/s. The sensors are located in three horizontal layers (1 m, 2 m, and 3 m) to observe the wind velocity profile in the area of interest. The measurement is done in front of the future east building face where the flow should be similar before and after building construction. Figure 12 shows the corner taken as a reference and the position of the sensor with respect to the future building.
Figure 12. Position of the air-speed transmitters with respect to the surrounding building. Figure 12. Position of the air-speed transmitters with respect to the surrounding building.
Sustainability 2016, 8, 855 10 of 15
To gather data to validate the numerical model, the measurements are taken on a common ESEwindy day. The field wind measurement results mean average over 10 min to 30 min time intervals fora whole day. Longer intervals are not feasible because the outdoor conditions are considered steadyfor less than 30 min [37]. Then, the steadiest 30 min wind measurements (2.82 m/s ± 0.23 m/s) areselected to validate the numerical results. Table 1 shows the comparison in each position.
Table 1. Full-scale and numerical results comparison.
Position (mm) Velocity Sensor (m/s) Numerical Model (m/s)
(6596.7; −10,842.3; 1) 1.59 ± 0.12 1.585654(6596.7; 10,842.3; 2) 1.39 ± 0.19 1.340761
(6596.7; −10,842.3; 3) 1.99 ± 0.15 1.986461
The outdoor measurements are in the same range as the CFD predictions. In conclusion, the CFDmodel is regarded as a reliable model for the design stage building analysis.
4. Results and Discussion
The prevailing wind influence, the façade opening location and the neighbouring buildingsinfluence on the building NV behaviour are assessed. The simulations (see Figure 9) are conductedat three wind speeds to cover the complete wind range. Cases A (no window in the east face),B (right window in the east face) and C (left window in the east face) are compared to determine thearchitectural solution that best improves the NV behaviour in the building.
The discussion is focused on three issues: the quantitative analysis of the wind flows through thebuilding, the NV behaviour, and the energy saving potential. The velocity inlet boundary conditioninfluence on the CFD results is also discussed.
4.1. Quantitative Analysis of Results
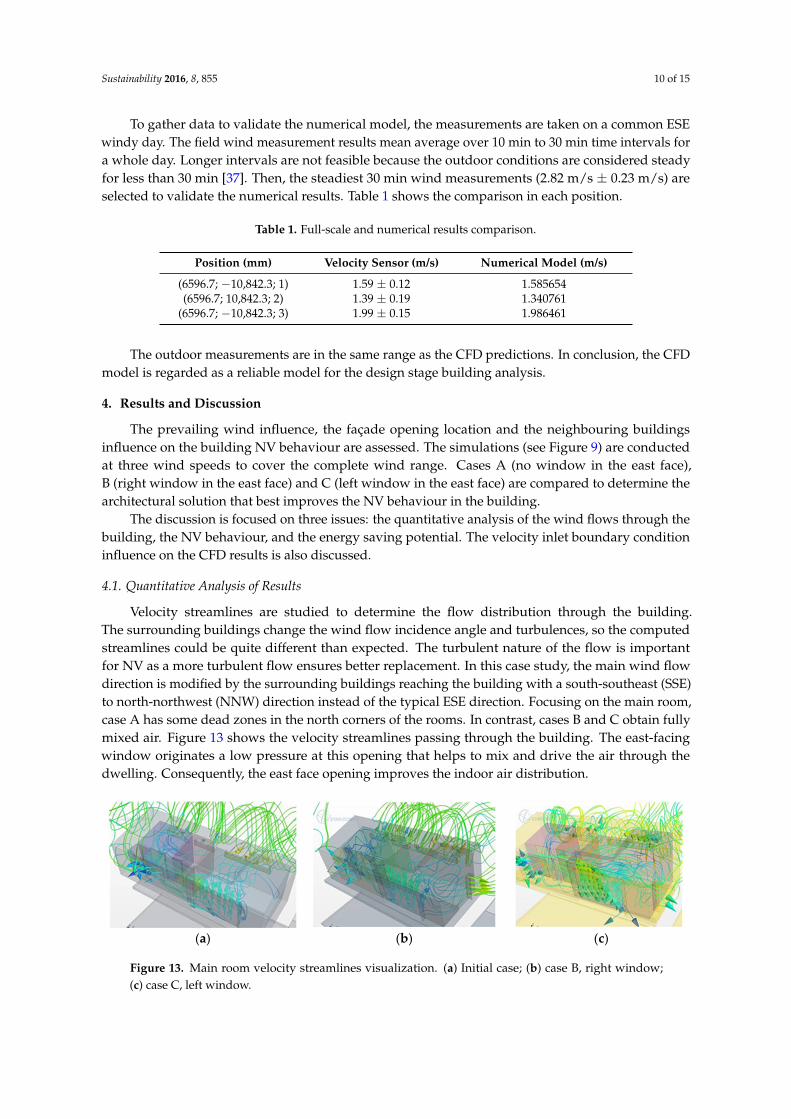
Velocity streamlines are studied to determine the flow distribution through the building.The surrounding buildings change the wind flow incidence angle and turbulences, so the computedstreamlines could be quite different than expected. The turbulent nature of the flow is importantfor NV as a more turbulent flow ensures better replacement. In this case study, the main wind flowdirection is modified by the surrounding buildings reaching the building with a south-southeast (SSE)to north-northwest (NNW) direction instead of the typical ESE direction. Focusing on the main room,case A has some dead zones in the north corners of the rooms. In contrast, cases B and C obtain fullymixed air. Figure 13 shows the velocity streamlines passing through the building. The east-facingwindow originates a low pressure at this opening that helps to mix and drive the air through thedwelling. Consequently, the east face opening improves the indoor air distribution.
Sustainability 2016, 8, 855 10 of 15
To gather data to validate the numerical model, the measurements are taken on a common ESE windy day. The field wind measurement results mean average over 10 min to 30 min time intervals for a whole day. Longer intervals are not feasible because the outdoor conditions are considered steady for less than 30 min [37]. Then, the steadiest 30 min wind measurements (2.82 m/s ± 0.23 m/s) are selected to validate the numerical results. Table 1 shows the comparison in each position.
Table 1. Full-scale and numerical results comparison.
Position (mm) Velocity Sensor (m/s) Numerical Model (m/s) (6596.7; −10,842.3; 1) 1.59 ± 0.12 1.585654 (6596.7; 10,842.3; 2) 1.39 ± 0.19 1.340761
(6596.7; −10,842.3; 3) 1.99 ± 0.15 1.986461
The outdoor measurements are in the same range as the CFD predictions. In conclusion, the CFD model is regarded as a reliable model for the design stage building analysis.
4. Results and Discussion
The prevailing wind influence, the façade opening location and the neighbouring buildings influence on the building NV behaviour are assessed. The simulations (see Figure 9) are conducted at three wind speeds to cover the complete wind range. Cases A (no window in the east face), B (right window in the east face) and C (left window in the east face) are compared to determine the architectural solution that best improves the NV behaviour in the building.
The discussion is focused on three issues: the quantitative analysis of the wind flows through the building, the NV behaviour, and the energy saving potential. The velocity inlet boundary condition influence on the CFD results is also discussed.
4.1. Quantitative Analysis of Results
Velocity streamlines are studied to determine the flow distribution through the building. The surrounding buildings change the wind flow incidence angle and turbulences, so the computed streamlines could be quite different than expected. The turbulent nature of the flow is important for NV as a more turbulent flow ensures better replacement. In this case study, the main wind flow direction is modified by the surrounding buildings reaching the building with a south-southeast (SSE) to north-northwest (NNW) direction instead of the typical ESE direction. Focusing on the main room, case A has some dead zones in the north corners of the rooms. In contrast, cases B and C obtain fully mixed air. Figure 13 shows the velocity streamlines passing through the building. The east-facing window originates a low pressure at this opening that helps to mix and drive the air through the dwelling. Consequently, the east face opening improves the indoor air distribution.
(a) (b) (c)
Figure 13. Main room velocity streamlines visualization. (a) Initial case; (b) case B, right window; (c) case C, left window.
Natural ventilation will be more effective with less time needed for the indoor air to be refreshed. The inlet and outlet air flow rates are used to calculate the effectiveness of wind-driven
Figure 13. Main room velocity streamlines visualization. (a) Initial case; (b) case B, right window;(c) case C, left window.
Sustainability 2016, 8, 855 11 of 15
Natural ventilation will be more effective with less time needed for the indoor air to be refreshed.The inlet and outlet air flow rates are used to calculate the effectiveness of wind-driven flows for NV.The objective is to determine how much time it takes for the total indoor air to be replaced usingwind-driven flows.
A relative coordinate system is set in each building opening. Air that enters the building (positivevelocity value) is taken as an inlet flow and air that leaves the building (negative value) is taken as anoutlet flow. The time needed (t) to replace all of the internal building air is calculated by dividing thetotal control volume and the density by the whole mass flow rate, as shown in Expression (3).
t =V × ρ
f(3)
where $ is the fluid density (kg/m3), f is the mass flow rate (kg/s) and V is the total volume of thebuilding (m3).
Table 2 shows the time needed to replace the indoor air comparison of the three cases (the windspeed considered is the wind mean velocity 3.05 m/s). Case B (east face right opening) and case C(east face left opening) are 7.60% and 9.77% better than case A (no east face opening) respectively.Case C performs almost 2% better than case B regarding natural ventilation. Therefore, the east faceleft opening achieves better results than the east face right opening for the prevailing wind condition.
Table 2. Time needed to replace the indoor air improvement.
Case B vs. A Case C vs. A Case B vs. C
+7.60% +9.77% −1.97%
4.2. Parametric Analysis of Results
The CFD results accuracy depends on the influence of the input boundary conditions. Therefore,a parametric analysis must be performed, especially when the most important input boundarycondition is a probabilistic data that has a standard deviation of approximately 50% of its meanvalue (see Section 3.2). Because wind is defined in terms of probabilistic data, NV should also bestudied under a probabilistically approach and not only examining the mean values of wind velocitymodulus and direction but also all of the other probable wind values. Consequently, the completefeasible wind range is selected taking into account the standard deviation of the prevailing nominalwind measurement.
Compared to the nominal wind velocity (v = 3 m/s), when the mean inlet velocity is increasedto 4.5 m/s, case B and C still achieves better performance than cases A (+5.07% and +7.63%respectively). However, the relative improvement respect the nominal wind velocity is lower(+5.07% vs. +7.60% and +7.63% vs. +9.77% respectively). When the average wind velocity isdecreased to 1.6 m/s, the relative improvement is lower than the nominal wind velocity (+2.38%vs. +7.60% and +2.04% vs. +9.77%). Case B and C behave very similarly with only a 0.33% difference.In conclusion, case C has a relative better performance vs. case B and A. Consequently the designrecommendation is to include the proposed window in the left side of the east face of the house. Table 3shows the NV behaviour comparison of the different cases when the wind modulus is modified.
Table 3. Natural ventilation performance comparison.
Average Wind Velocity Case B vs. A Case C vs. A Case B vs. C
4.5 m/s +5.07% +7.63% −2.38%3.0 m/s +7.60% +9.77% −1.97%1.6 m/s +2.38% +2.04% +0.33%
Sustainability 2016, 8, 855 12 of 15
4.3. Energy Saving Potential
The energy saving potential is calculated according to standard 13790, calculation of energy usefor space heating and cooling for residential buildings [38]. The Spanish regulations CTE [20] andRITE [21] take the standard 13790 [38] as reference. The monthly quasi-steady-state calculation methodis used. Expression (4) shows the general ventilation heat transfer equation used in the Standard 13790,Section 9 [38].
Qve = Hve,adj × (θint,set,C,z − θe)× t (4)
where Hve,adj is the ventilation global heat transfer coefficient, θint,set,C is the indoor temperature, θe isthe outdoor temperature and t is the time period used for the calculation. The method provided by thestandard is particularly suitable for comparison between proposed building designs, especially whenthe objective is to calculate the various design options influence on the energy use. Insofar as the designoptions are compared, the calculation error is minimized. The method accuracy depends on the qualityof the input data. Particular attention should be paid in the air change rate determination. The presentNV approach is focused on the air change rate estimation by CFD. Accordingly, the method set in thestandard 13790 is strongly recommended to be used in the NV design approach.
The supply temperature is the value of the external environment temperature. The coolingdemand is calculated during the months in which the average outside temperature is below themaximum comfortable indoor allowed temperature in the warm season and above the minimumrequired temperature in the cold season according to the UNE-CR 1752 [39] (see Figure 3).Additionally, the wind direction data is taken into account so that is considered only the timein which the prevailing direction (ESE) is flowing. Case A and case C are compared to calculatethe relative improvement achieved. The results show that the proposed opening addition (case C)could reduce up to 1.13 kWh/m2 the energy consumption of the building per annum. It is equivalentapproximately to a reduction of 434 grams of CO2 equivalent per kWh/m2 of electricity [40] respectthe initial building design per annum. The energy behaviour of the complete building has beenapproximately improved in 4.12%. The here described research is only focused on the prevailing windconditions. In any case the calculation could be extended to the other wind directions to calculate thecomplete NV impact on reducing the CO2 emissions.
The characteristics of the Valencian residential sector have been analyzed to calculateapproximately the NV design approach impact on the new building construction. The CO2 emissionspotential reduction could be up to 56.5 tons of CO2 per year, taking into consideration the 2015 newdetached houses data (see Section 2). However, the CO2 potential reduction is very rough sincethe calculation is only based on the case study presented in this research. The NV design approachpotential CO2 savings is higher because it can be extended to the complete wind directions. Moreover,although the case study is focused on a one-floor modular detached dwelling, the design approachcan be extrapolated to other kind of residential buildings. This research is challenging in terms ofmodelling time and resources. Consequently, the results are just illustrative to quantify the possibleNV design approach CO2 reduction potential applied onto a large-scale scenario.
5. Conclusions and Future Work
The paper shows a design approach for selecting building architectural alternatives to improveNV behaviour using CFD. It has been demonstrated that it is feasible to make comparative results ofdifferent façade opening alternatives in an initial design stage to make better NV design decisions toimprove the building energy efficiency and reduce the CO2 emissions.
The residential sector is being shown as one of the major potential sectors to improve energyefficiency and reduce CO2 emissions. Therefore, the building should be adapted to the region’sparticular conditions to make as much profit as possible of sustainable energy resources. In this case,the research is focused on the Valencian Community region that is located in the Mediterranean coast
Sustainability 2016, 8, 855 13 of 15
of Spain. The local climate and the wind conditions are particular due to the Mediterranean Searegulatory thermal effect and the topography, respectively.
With the NV design approach since the first building design stage there is a potential savingof 56.5 tons of CO2 per annum taking into account the new building construction in the ValencianCommunity. Unfortunately, the main barriers for implementing natural ventilation in externalcomfortable days come from regional legislation, as only mechanical and hybrid ventilation aregenerally accepted.
Nevertheless, NV should be considered as a reasonable tool for decreasing CO2 emissions inMediterranean regional scale. The impact of the predominant winds and the façades opening positionon the buildings in NV performance should be analyzed using CFD techniques. The design approachallows selecting the most efficient building alternatives using simulation instead of trial-and-errorexperimental techniques in the building design stage. Well-designed outdoor openings shape andlocation can provide naturally ventilated and healthy indoor conditions while significantly reducingthe energy consumed by buildings. The study approves the inclusion of a new opening in the east sideof the building. This new opening improves the building NV behaviour up to 9.7% (see Table 3).
In future works, the design approach should be extended to the complete wind rose conditionsrange for the case study building during the whole year. The NV performance assumptions will bevalidated in the constructed case study building in the future. Moreover, the modular case study resultsshould be adapted to the other building typologies in order to improve the design approach scope.
Acknowledgments: This work has been made possible within the framework of the research project “E3EDIFICACIÓN ECO EFICIENTE, cofounded by CDTI: Proyectos Tecnológicos de Empresas”.
Author Contributions: Miguel Mora performed the CFD experiments and took measurements in the building;Ignacio Guillén as Project Manager for the E3 Research Project is responsible for building design; Gonzalo Lópezanalysed the data; Petra Amparo López-Jiménez supervised the design approach implementation and the paperwriting. All the authors equally contributed to the paper.
Conflicts of Interest: The authors declare no conflict of interest.
References
1. Hamdy, M.; Hasan, A.; Siren, K. Applying a multi-objective optimization approach for design of low-emissioncost-effective dwellings. Build. Environ. 2011, 46, 109–123. [CrossRef]
2. Linden, P.F. The fluid mechanics of natural ventilation. Annu. Rev. Fluid Mech. 2009, 31, 201–208. [CrossRef]3. Luo, Z.; Zhao, J.; Gao, J.; He, L. Estimating natural-ventilation potential considering both thermal comfort
and IAQ issues. Build. Environ. 2007, 42, 2289–2298. [CrossRef]4. Suresh, B.S.; Srikanth, M.; Robert, F.B. Passive building energy savings: A review of building envelope
components. Renew. Sustain. Energy Rev. 2011, 15, 3617–3631.5. Jin, Q.; Overend, M.; Thompson, P. Towards productivity indicators for performance-based façade design in
commercial buildings. Build. Environ. 2012, 57, 271–281. [CrossRef]6. Li, Y.; Heiselberg, P. Analysis methods for natural and hybrid ventilation—A critical literature review and
recent developments. Int. J. Vent. 2003, 4, 3–20. [CrossRef]7. Martin, L.; James, A.; Heiselberg, P.; Li, Y.; Stathopoulos, T. Achieving natural and hybrid ventilation in
practice. Int. J. Vent. 2006, 5, 115–130.8. Khan, N.; Su, Y.; Riffat, S.B. A review on wind driven ventilation techniques. Energy Build. 2008, 40,
1586–1604. [CrossRef]9. Mora-Pérez, M.; López-Patiño, G.; López-Jiménez, P.A. Quantification of ventilated façade effect due to
convection in buildings—Buoyancy and wind driven effect. Res. Appl. Mech. Eng. 2014, 3, 1–11.10. Ray, S.D.; Gong, N.W.; Glicksman, L.R.; Paradiso, J.A. Experimental characterization of full-scale naturally
ventilated atrium and validation of CFD simulations. Energy Build. 2014, 69, 285–291. [CrossRef]11. Chen, Q.; Zhai, Z. The use of computational fluid dynamics tools for indoor environmental design.
In Advanced Building Simulation; Taylor & Francis: Oxfordshire, UK, 2003; pp. 119–140.
Sustainability 2016, 8, 855 14 of 15
12. Tominaga, Y.; Mochida, A.; Yoshie, R.; Kataoka, H.; Nozu, T.; Yoshikawa, M. AIJ guidelines for practicalapplications of CFD to pedestrian wind environment around buildings. J. Wind Eng. Ind. Aerodyn. 2008, 96,1749–1761. [CrossRef]
13. Norris, S.E. Appropriate boundary conditions for computational wind engineering in models revisited.In Proceedings of the Fifth International Symposium on Computational Wind Engineering (CWE2010),Chapel Hill, NC, USA, 23–27 May 2010; pp. 23–27.
14. Hajdukievwicz, M.; Geron, M.; Keane, M.M. Calibrated CFD simulation to evaluate thermal comfort in ahighly-glazed naturally ventilated room. Build. Environ. 2013, 70, 73–89. [CrossRef]
15. Hajdukievwicz, M.; Geron, M.; Keane, M.M. Formal calibration methodology for CFD models of naturallyventilated indoor environments. Build. Environ. 2013, 59, 290–302. [CrossRef]
16. Marsa-Maestre, I.; Lopez-Carmona, M.A.; Velasco, J.R.; Navarro, A. Mobile agents for service personalizationin smart environments. J. Netw. 2008, 3, 30–41. [CrossRef]
17. Instituto Valenciano de la Edificación (IVE). Generalitat Valenciana. Available online: http://www.ive.es(accessed on 8 February 2016).
18. Pérez-Cueva, A. Atlas Climático de la Comunidad Valenciana; Generalitat Valenciana: Valencia, Spain, 1993.19. Agencia Estatal de Meteorología de España (AEMET). Available online: http://www.aemet.es (accessed on
8 February 2016).20. Código Técnico de la Edificación (CTE). Ministerio de Fomento, Gobierno de España. Available online:
http://www.codigotecnico.org/ (accessed on 15 April 2015).21. Reglamento de Instalaciones Térmicas en los Edificios (RITE). Ministerio de Industria, Energía y
Turismo, Gobierno de España. Available online: http://www.minetur.gob.es/energia/desarrollo/EficienciaEnergetica/RITE/Paginas/InstalacionesTermicas.aspx (accessed on 15 April 2015).
22. Oropeza-Perez, I.; Ostergaard, P.A. Potential of natural ventilation in temperate countries—A case study ofDenmark. Appl. Energy 2014, 114, 520–530. [CrossRef]
23. Franke, J.; Hellsten, A.; Schlünzen, H.; Carissimo, B. Best Practice Guideline for the CFD Simulation of Flows inthe Urban Environment; COST Action: Brussels, Belgium, 2007.
24. Reboussin, D. Wind Rose; University of Florida: Gainesville, FL, USA, 2005.25. Windfinder. Available online: http://es.windfinder.com/windstats/windstatistic_valencia.htm (accessed
on 15 April 2015).26. Joseph, H.; Willian, D.; Warren, H. Wind Energy Resource Assessment Using Wind Atlas and Meteorological Data;
Stiver School of Engineering, University of Guelph: Guelph, ON, USA, 2008.27. Giovanni, G.; Sauro, S. Methods to extrapolate wind resource to the turbine hub height based on power laws:
A 1-h wind speed vs. Weibull distribution extrapolation comparison. Renew. Energy 2012, 43, 183–200.28. Justus, C.G.; Mikhail, A. Height variation of wind speed and wind distributions statistics. Geophys. Res. Lett.
1976, 3, 261–264. [CrossRef]29. Senthooran, S.; Lee, D.D.; Parameswaran, S. A computational model to calculate the flow-induced pressure
fluctuations on buildings. J. Wind Eng. Ind. Aerodyn. 2004, 92, 1131–1145. [CrossRef]30. Hu, C.H.; Wang, F. Using a CFD approach for the study of street-level winds in a built-up area. Build. Environ.
2005, 40, 617–631. [CrossRef]31. Evola, G.; Popov, V. Computational analysis of wind driven natural ventilation in buildings. Energy Build.
2006, 38, 491–501. [CrossRef]32. Wang, L.; Wong, N.H. The impacts of ventilation strategies and façade on indoor thermal environment for
naturally ventilated residential buildings in Singapore. Build. Environ. 2007, 42, 4006–4015.33. Shao, J.; Liu, J.; Zhao, J. Evaluation of various non-linear k-epsilon models for predicting wind flow around
an isolated high-rise building within the surface boundary layer. Build. Environ. 2012, 57, 145–155. [CrossRef]34. Chen, Q. Ventilation performance prediction for buildings: A method overview and recent applications.
Build. Environ. 2009, 44, 848–858. [CrossRef]35. Van Hooff, T.; Blocken, B. On the effect of wind direction and urban surroundings on natural ventilation of a
large semi-enclosed stadium. Comput. Fluids 2010, 39, 1146–1155. [CrossRef]36. Lo, L.J.; Novoselac, A. Cross ventilation with small openings: Measurements in a multi-zone test building.
Build. Environ. 2012, 57, 377–386. [CrossRef]

Sustainability 2016, 8, 855 15 of 15
37. Franke, J.; Hirsch, C.; Jensen, A.G.; Krus, H.W.; Schatzmann, M.; Westbury, P.S.; Miles, S.D.; Wisse, J.A.;Wright, N.G. Recommendations on the use of CFD in wind engineering. In Proceedings of the InternationalConference Urban Wind Engineering and Building Aerodynamics 2004, Rhode-Saint-Genèse, Belgium,5–7 May 2004.
38. European Technical Standard EN ISO 13790. Calculation of Energy Use for Space Heating and Cooling, 1st ed.;CEN: Brussels, Belgium, 2008.
39. Comité técnico AEN/CTN 100. UNE-CR 1752:2008. In Ventilation for Buildings—Design Criteria for the IndoorEnvironment; Aenor: Madrid, Spain, 2008.
40. Instituto para la Diversificación y Ahorro de Energía (IDAE). Factores de Emisión de CO2 y Coeficientes de Pasoa Energía Primaría de Diferentes Fuentes de Energía Final Consumidas en el Sector de Edificios en España; Version20/07/2014; Ministerio de Industria, Energía y Turismo y Ministerio de Fomento: Madrid, Spain, 2014.
© 2016 by the authors; licensee MDPI, Basel, Switzerland. This article is an open accessarticle distributed under the terms and conditions of the Creative Commons Attribution(CC-BY) license (http://creativecommons.org/licenses/by/4.0/).