n+3 aircraft concept designs and trade studies, final report
TRANSCRIPT
E.M. Greitzer, P.A. Bonnefoy, E. De la Rosa Blanco, C.S. Dorbian, M. Drela,D.K. Hall, R.J. Hansman, J.I. Hileman, R.H. Liebeck, J. Lovegren, P. Mody,J.A. Pertuze, S. Sato, Z.S. Spakovszky, and C.S. TanMassachusetts Institute of Technology, Cambridge, Massachusetts
J.S. Hollman, J.E. Duda, N. Fitzgerald, J. Houghton, J.L. Kerrebrock, G.F. Kiwada, D. Kordonowy, J.C. Parrish, J. Tylko, and E.A. WenAurora Flight Sciences, Cambridge, Massachusetts
W.K. LordPratt & Whitney, East Hartford, Connecticut
N+3 Aircraft Concept Designs and Trade Studies, Final ReportVolume 1
NASA/CR—2010-216794/VOL1
December 2010

NASA STI Program . . . in Profi le
Since its founding, NASA has been dedicated to the advancement of aeronautics and space science. The NASA Scientifi c and Technical Information (STI) program plays a key part in helping NASA maintain this important role.
The NASA STI Program operates under the auspices of the Agency Chief Information Offi cer. It collects, organizes, provides for archiving, and disseminates NASA’s STI. The NASA STI program provides access to the NASA Aeronautics and Space Database and its public interface, the NASA Technical Reports Server, thus providing one of the largest collections of aeronautical and space science STI in the world. Results are published in both non-NASA channels and by NASA in the NASA STI Report Series, which includes the following report types: • TECHNICAL PUBLICATION. Reports of
completed research or a major signifi cant phase of research that present the results of NASA programs and include extensive data or theoretical analysis. Includes compilations of signifi cant scientifi c and technical data and information deemed to be of continuing reference value. NASA counterpart of peer-reviewed formal professional papers but has less stringent limitations on manuscript length and extent of graphic presentations.
• TECHNICAL MEMORANDUM. Scientifi c
and technical fi ndings that are preliminary or of specialized interest, e.g., quick release reports, working papers, and bibliographies that contain minimal annotation. Does not contain extensive analysis.
• CONTRACTOR REPORT. Scientifi c and
technical fi ndings by NASA-sponsored contractors and grantees.
• CONFERENCE PUBLICATION. Collected papers from scientifi c and technical conferences, symposia, seminars, or other meetings sponsored or cosponsored by NASA.
• SPECIAL PUBLICATION. Scientifi c,
technical, or historical information from NASA programs, projects, and missions, often concerned with subjects having substantial public interest.
• TECHNICAL TRANSLATION. English-
language translations of foreign scientifi c and technical material pertinent to NASA’s mission.
Specialized services also include creating custom thesauri, building customized databases, organizing and publishing research results.
For more information about the NASA STI program, see the following:
• Access the NASA STI program home page at http://www.sti.nasa.gov
• E-mail your question via the Internet to help@
sti.nasa.gov • Fax your question to the NASA STI Help Desk
at 443–757–5803 • Telephone the NASA STI Help Desk at 443–757–5802 • Write to:
NASA Center for AeroSpace Information (CASI) 7115 Standard Drive Hanover, MD 21076–1320
E.M. Greitzer, P.A. Bonnefoy, E. De la Rosa Blanco, C.S. Dorbian, M. Drela,D.K. Hall, R.J. Hansman, J.I. Hileman, R.H. Liebeck, J. Lovegren, P. Mody,J.A. Pertuze, S. Sato, Z.S. Spakovszky, and C.S. TanMassachusetts Institute of Technology, Cambridge, Massachusetts
J.S. Hollman, J.E. Duda, N. Fitzgerald, J. Houghton, J.L. Kerrebrock, G.F. Kiwada, D. Kordonowy, J.C. Parrish, J. Tylko, and E.A. WenAurora Flight Sciences, Cambridge, Massachusetts
W.K. LordPratt & Whitney, East Hartford, Connecticut
N+3 Aircraft Concept Designs and Trade Studies, Final ReportVolume 1
NASA/CR—2010-216794/VOL1
December 2010
National Aeronautics andSpace Administration
Glenn Research CenterCleveland, Ohio 44135
Prepared under Cooperative Agreement NNX08AW63A
Acknowledgments
Financial support for this project was provided by NASA under Cooperative Agreement Number NNX08AW63A. This support is gratefully acknowledged. We would also like to thank G. Brown, J. Felder, H-D Kim, K. Pham, and A. Strazisar of NASA Glenn Research Center (GRC) for their interest and help. We also would like to acknowledge the help of P.J. Masson from Magnetolab for his technical advisement. Team Participants: The following have contributed to the work described in this report. Their affi liation is shown by this Key: + Aurora Flight Sciences, @ Boeing (ret.), # MIT, * Pratt&Whitney, and ‡ Imperial College. Holly Anderson# Robert Bengtson* Phillip Bonnefoy# Nicholas Cumpsty‡ Elena De la Rosa Blanco# Mark Drela# Christopher Dorbian# Jessica Duda+ Alan Epstein* Nathan Fitzgerald+ Lindley Graham+ Edward Greitzer# David Hall# John Hansman# Karl Hasel* James Hileman# Jeremy Hollman+ James Houghton+ Jack Kerrebrock+ James L. Kirtley# George Kiwada+ Rob Kline* Atul Kohli* David Kordonowy+ Steve Kramer* John Langford+ Robert Liebeck# Wesley Lord* Jonathan Lovegren# Justin McClellan+ Siamak Masoudi* Randy McKinney* Brent McLaughlin+ Pritesh Mody# Bruce Morin* Diana Park# Joe Parrish+ Julio Pertuze# Sho Sato# Zolti Spakovszky# Brent Staubach* Jayant Sabnis* Gabe Suciu* Choon Tan# John Tylko+ Ian Waitz# Ed Wen+ Gerald Wilson# Robert Woodling@ Adam Woodworth+
Available from
NASA Center for Aerospace Information7115 Standard DriveHanover, MD 21076–1320
National Technical Information Service5301 Shawnee Road
Alexandria, VA 22312
Available electronically at http://gltrs.grc.nasa.gov
This work was sponsored by the Fundamental Aeronautics Program at the NASA Glenn Research Center.
Level of Review: This material has been technically reviewed by NASA technical management.
This report contains preliminary fi ndings, subject to revision as analysis proceeds.
Program Abstract
MIT, Aerodyne Research, Aurora Flight Sciences, and Pratt & Whitney have collaborated to address NASA’s desire to pursue revolutionary conceptual designs for a subsonic commercial transport that could enter service in the 2035 timeframe. The MIT team brings together multidisciplinary expertise and cutting-edge technologies to determine, in a rigorous and objective manner, the potential for improvements in noise, emissions and performance for subsonic fixed wing transport aircraft. The collaboration incorporates assessment of the trade space in aerodynamics, propulsion, operations, and structures to ensure that the full spectrum of improvements is identified. Although the analysis focuses on these key areas, the team has taken a system-level approach to find the integrated solutions that offer the best balance in performance enhancements. Based on the trade space analyses and system-level assessment, two aircraft have been identified and carried through conceptual design to show both the in-depth engineering that underpins the benefits envisioned and also the technology paths that need to be followed to enable, within the next 25 years, the development of aircraft three generations ahead in capabilities from those flying today.
NASA/CR—2010-216794/VOL1 iii

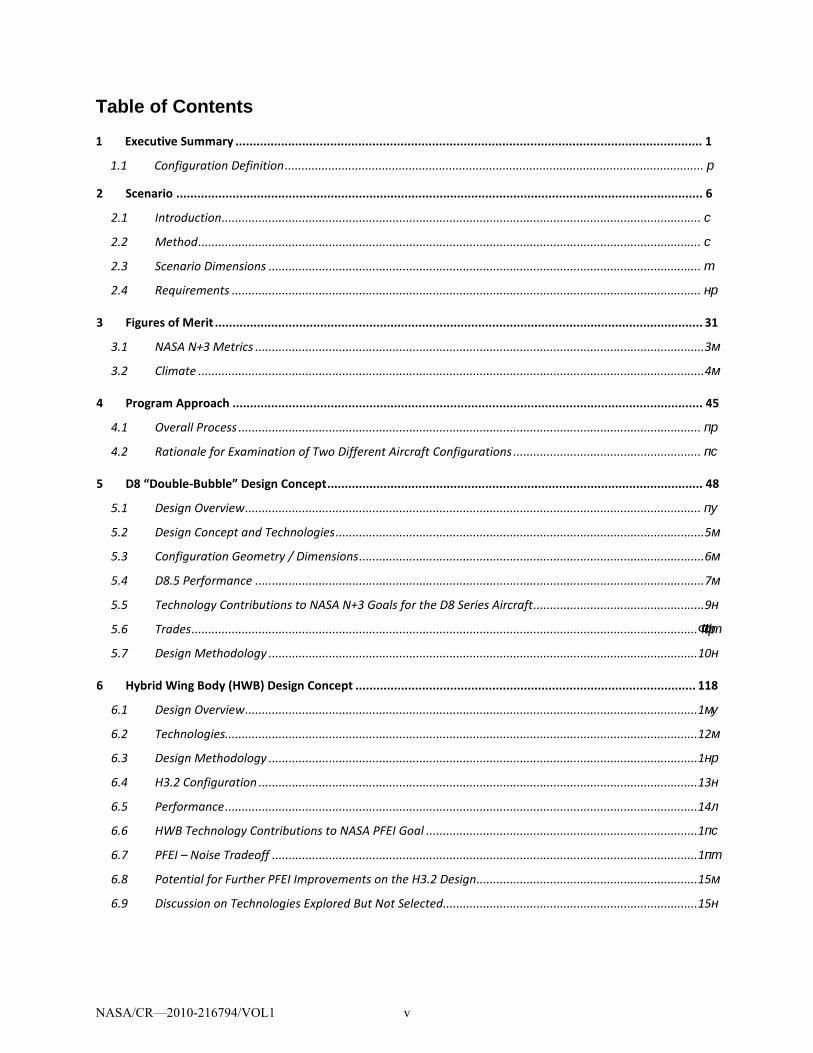
Table of Contents
1 Executive Summary ..................................................................................................................................... 1
1.1 Configuration Definition ............................................................................................................................. р
2 Scenario ...................................................................................................................................................... 6
2.1 Introduction ............................................................................................................................................... с
2.2 Method ...................................................................................................................................................... с
2.3 Scenario Dimensions ................................................................................................................................. т
2.4 Requirements ............................................................................................................................................ нр
3 Figures of Merit ........................................................................................................................................... 31
3.1 NASA N+3 Metrics ...................................................................................................................................... 3м
3.2 Climate ....................................................................................................................................................... 4м
4 Program Approach ...................................................................................................................................... 45
4.1 Overall Process .......................................................................................................................................... пр
4.2 Rationale for Examination of Two Different Aircraft Configurations ........................................................ пс
5 D8 “Double-Bubble” Design Concept ........................................................................................................... 48
5.1 Design Overview ........................................................................................................................................ пу
5.2 Design Concept and Technologies .............................................................................................................. 5м
5.3 Configuration Geometry / Dimensions ....................................................................................................... 6м
5.4 D8.5 Performance ...................................................................................................................................... 7м
5.5 Technology Contributions to NASA N+3 Goals for the D8 Series Aircraft ................................................... 9н
5.6 Trades .......................................................................................................................................................ΦΦфт
5.7 Design Methodology ................................................................................................................................ 10н
6 Hybrid Wing Body (HWB) Design Concept ................................................................................................. 118
6.1 Design Overview ....................................................................................................................................... 1му
6.2 Technologies............................................................................................................................................. 12м
6.3 Design Methodology ................................................................................................................................ 1нр
6.4 H3.2 Configuration ................................................................................................................................... 13н
6.5 Performance ............................................................................................................................................. 14л
6.6 HWB Technology Contributions to NASA PFEI Goal ................................................................................. 1пс
6.7 PFEI – Noise Tradeoff ............................................................................................................................... 1пт
6.8 Potential for Further PFEI Improvements on the H3.2 Design .................................................................. 15м
6.9 Discussion on Technologies Explored But Not Selected ............................................................................ 15н
NASA/CR—2010-216794/VOL1 v
7 Concept Trades – Impact of Payload and Range on D and H Configuration ................................................ 154
7.1 Assessment of H-Series Aircraft Configuration for Varied Mission and Payload ...................................... 15п
7.2 Assessment of D Series Aircraft Configuration for B777 Mission and Payload ........................................ 1рс
7.3 Comparison of Aircraft Configurations at Varied Payload ....................................................................... 1ру
8 Technology Roadmaps .............................................................................................................................. 160
8.1 Risk Assessment and Technology Maturation Plans ................................................................................ 16л
8.2 Technology Roadmaps ............................................................................................................................. 1ср Appendices included in separate volume, “Design Methodologies for Aerodynamics, Structures, Weight, and Thermodynamic Cycles.”
NASA/CR—2010-216794/VOL1 vi
1 Executive Summary
Content and Scope of the Report
This final report for the NASA N+3 Phase 1 project “Aircraft and Technology Concepts for an N+3 Subsonic Transport” represents the results of research carried out from 1 September 2008 to 31 March 2010 by a team from MIT, Aerodyne Research, Aurora Flight Sciences, and Pratt&Whitney.
This research included development of the conceptual design of two advanced civil aircraft for the 2030-2035 time period, as well as trade studies relating aircraft performance (fuel burn, field length requirement), noise, and emissions for the defined mission to each of the identified advanced technologies, and specific steps needed to advance these technologies. The principal findings are summarized in this section.
Scenario Development as a Driver for Aircraft Selection
To define the conditions that aircraft attributes must address in the 2030-2035 timeframe, we have developed a scenario that adopts the economic, environmental, and mobility issues expected to exist at that time. This scenario drove the requirements specifications for the design of two conceptual aircraft that targeted the NASA N+3 goals. The missions of the two were selected from different market segments, but chosen so together they would represent a substantial fraction of the commercial fleet; this in turn implies that adoption of such a design could have major impact on fleet-wide fuel burn, noise, emissions, and airport utilization. One aircraft addresses the role currently filled by the B737/Airbus A320 class, accommodating 180 passengers for 500 nm to transcontinental range trip length. The other is aimed at the market served by a B777, accommodating 350 passengers in a multiclass configuration with cargo and a range of at least 7000 nm. For both, the passenger trip time was also taken into account in the design of the concept aircraft.
N+3 Aircraft Configurations
The two aircraft designs developed to carry out these missions have very different configurations. The aircraft intended to serve the B737/A320 mission is a “double-bubble”, i.e. a double-tube and wing design, referred to as the D8 Series. The aircraft intended to serve the B777 mission is a hybrid wing body, referred to as the H3 Series. The two aircraft concepts are shown in Figure 1.
Figure 1: Double-bubble (D8 Series) and hybrid wing body (H3 Series) conceptual aircraft.
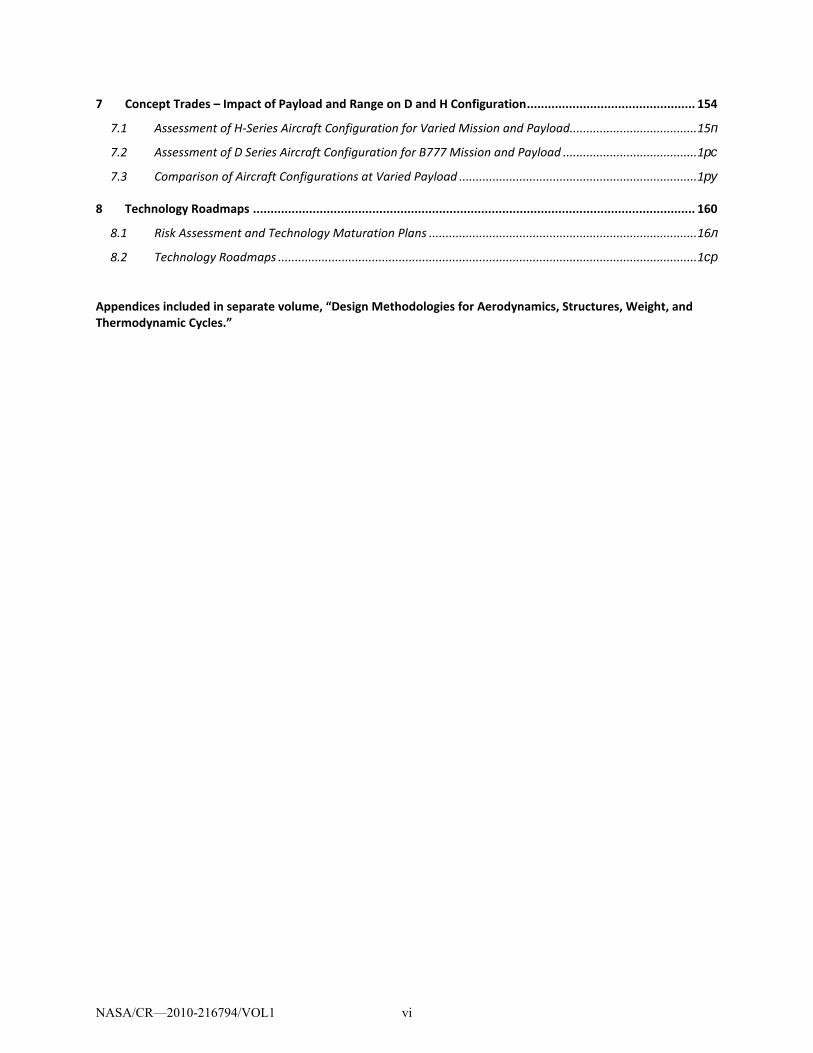
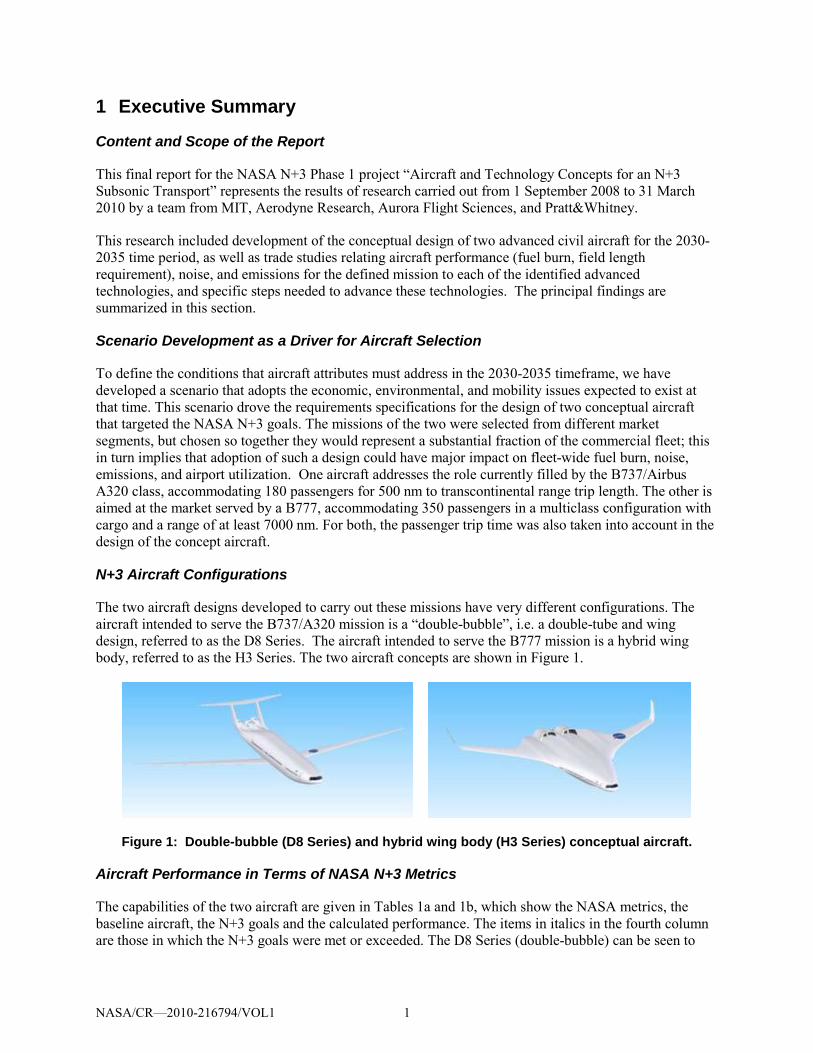
Aircraft Performance in Terms of NASA N+3 Metrics
The capabilities of the two aircraft are given in Tables 1a and 1b, which show the NASA metrics, the baseline aircraft, the N+3 goals and the calculated performance. The items in italics in the fourth column are those in which the N+3 goals were met or exceeded. The D8 Series (double-bubble) can be seen to
NASA/CR—2010-216794/VOL1 1
achieve three of the NASA N+3 metrics and nearly achieves the fourth (noise.) The H3 (hybrid wing body) meets only one of the goals (emissions), although there are substantial gains towards the other three aggressive targets. The potential of the hybrid wing body configuration has been recognized by NASA and others, but the D8 Series is a new configuration whose design was developed as a direct result of the N+3 Phase 1 program. The performance levels achieved by the two configurations are the first major finding from the Phase 1 project.
Table 1a: Performance of Double-Bubble (D8 Series) Aircraft (B737-800 Baseline)
NASA Metric Baseline (B737-800)
N+3 Goals Double-bubble (D8.5)
Fuel Burn (Represented by Payload Fuel Energy Intensity, PFEI, in [KJ/kg-km])
7.43 2.23 (70% reduction)
2.17 (70.87% reduction)
Noise [EPNdB] (EPNdB below Stage 4) 277 202 (-71 EPNdB) 213 (-60 EPNdB) LTO NOx [g/KN] (% below CAEP 6) 43.28 (31%
below CAEP 6) >75% reduction 10.5 (87.3% reduction)
Field Length [ft] 7680 ft for 300 nm mission
Metroplex
5000
Table 1b: Performance of Hybrid Wing Body (H3) Aircraft (B777-200LR Baseline)
NASA Metric Baseline (B777-200LR)
N+3 Goals Hybrid Wing-Body (H3.2)
Fuel Burn [KJ/kg-km] 5.94 1.78 (70% reduction)
2.75 (53.7% reduction)
Noise [EPNdB] (EPNdB below Stage 4)
288 217 (-71 EPNdB) 242 (-46 EPNdB)
LTO NOx [g/KN] (% below CAEP 6) 67.9 >75% reduction 18.6 (81% reduction) Field Length [ft] 10000 Metroplex 9000
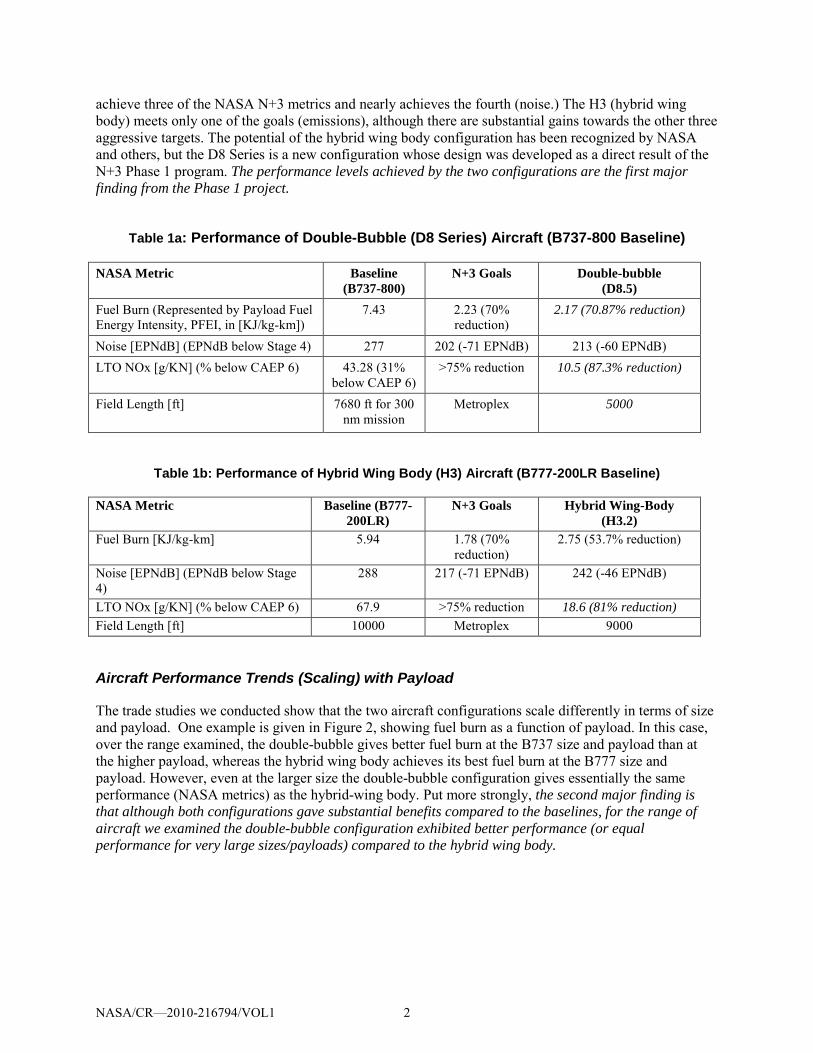
Aircraft Performance Trends (Scaling) with Payload
The trade studies we conducted show that the two aircraft configurations scale differently in terms of size and payload. One example is given in Figure 2, showing fuel burn as a function of payload. In this case, over the range examined, the double-bubble gives better fuel burn at the B737 size and payload than at the higher payload, whereas the hybrid wing body achieves its best fuel burn at the B777 size and payload. However, even at the larger size the double-bubble configuration gives essentially the same performance (NASA metrics) as the hybrid-wing body. Put more strongly, the second major finding is that although both configurations gave substantial benefits compared to the baselines, for the range of aircraft we examined the double-bubble configuration exhibited better performance (or equal performance for very large sizes/payloads) compared to the hybrid wing body.
NASA/CR—2010-216794/VOL1 2
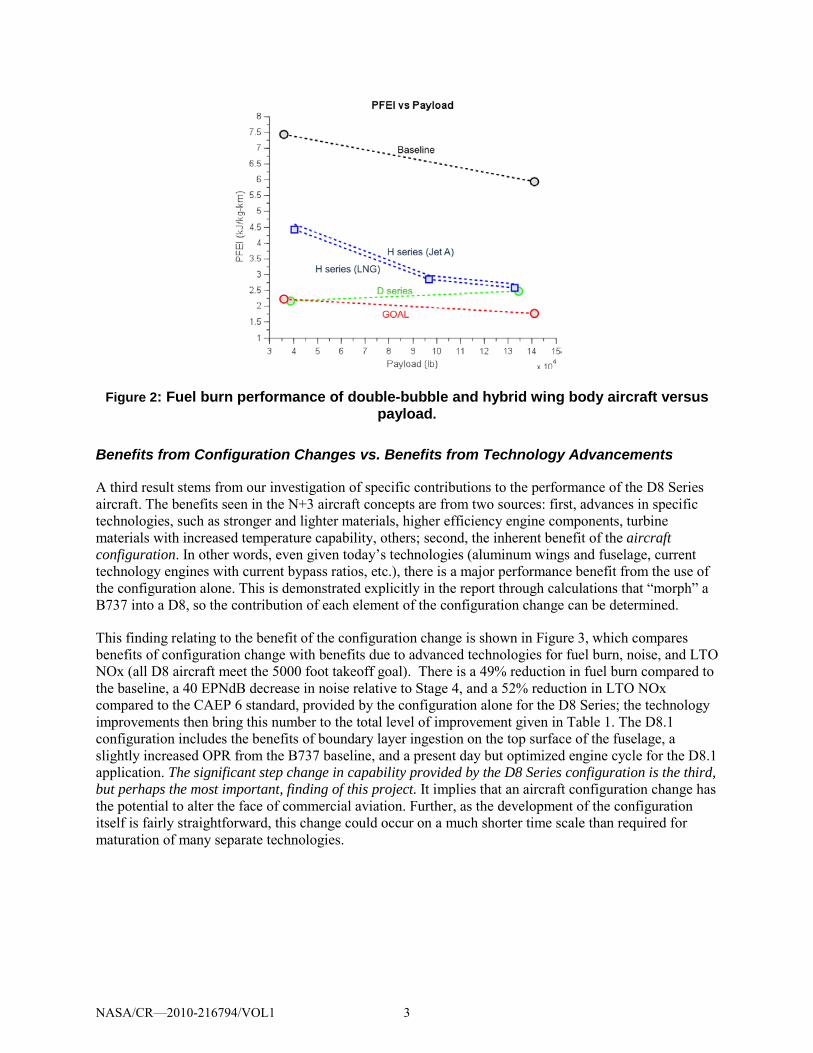
Figure 2: Fuel burn performance of double-bubble and hybrid wing body aircraft versus payload.
Benefits from Configuration Changes vs. Benefits from Technology Advancements
A third result stems from our investigation of specific contributions to the performance of the D8 Series aircraft. The benefits seen in the N+3 aircraft concepts are from two sources: first, advances in specific technologies, such as stronger and lighter materials, higher efficiency engine components, turbine materials with increased temperature capability, others; second, the inherent benefit of the aircraft configuration. In other words, even given today’s technologies (aluminum wings and fuselage, current technology engines with current bypass ratios, etc.), there is a major performance benefit from the use of the configuration alone. This is demonstrated explicitly in the report through calculations that “morph” a B737 into a D8, so the contribution of each element of the configuration change can be determined.
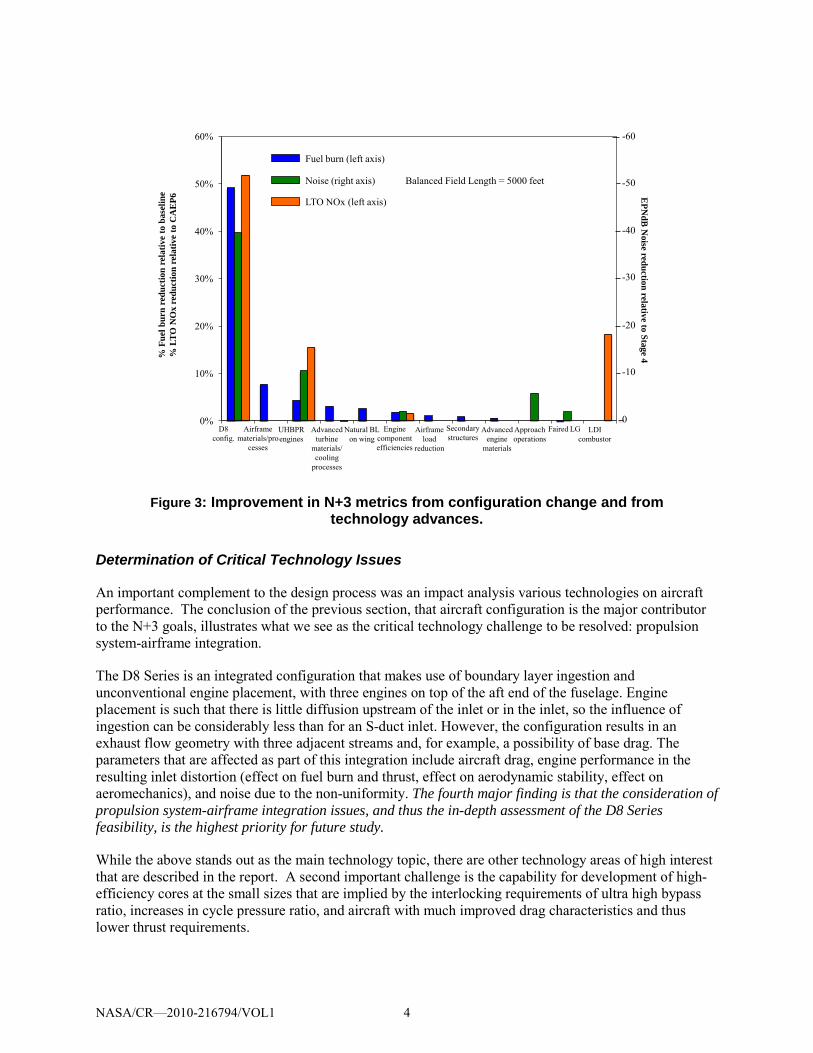
This finding relating to the benefit of the configuration change is shown in Figure 3, which compares benefits of configuration change with benefits due to advanced technologies for fuel burn, noise, and LTO NOx (all D8 aircraft meet the 5000 foot takeoff goal). There is a 49% reduction in fuel burn compared to the baseline, a 40 EPNdB decrease in noise relative to Stage 4, and a 52% reduction in LTO NOx compared to the CAEP 6 standard, provided by the configuration alone for the D8 Series; the technology improvements then bring this number to the total level of improvement given in Table 1. The D8.1 configuration includes the benefits of boundary layer ingestion on the top surface of the fuselage, a slightly increased OPR from the B737 baseline, and a present day but optimized engine cycle for the D8.1 application. The significant step change in capability provided by the D8 Series configuration is the third, but perhaps the most important, finding of this project. It implies that an aircraft configuration change has the potential to alter the face of commercial aviation. Further, as the development of the configuration itself is fairly straightforward, this change could occur on a much shorter time scale than required for maturation of many separate technologies.
NASA/CR—2010-216794/VOL1 3
0%
10%
20%
30%
40%
50%
60%
% F
uel b
urn
redu
ctio
n re
lativ
e to
bas
elin
e %
LTO
NO
x re
duct
ion
rela
tive
to C
AE
P6
D8 config.
Airframe materials/pro
cesses
UHBPR engines
Advanced turbine
materials/ cooling
processes
Natural BL on wing
Engine component efficiencies
Airframe load
reduction
Secondary structures
Advanced engine
materials
Approach operations
Faired LG LDI combustor
-60
-50
-40
-30
-20
-10
0
EPN
dBN
oise reduction relative to Stage 4Fuel burn (left axis)
Noise (right axis)
LTO NOx (left axis)
Balanced Field Length = 5000 feet
Figure 3: Improvement in N+3 metrics from configuration change and from technology advances.
Determination of Critical Technology Issues
An important complement to the design process was an impact analysis various technologies on aircraft performance. The conclusion of the previous section, that aircraft configuration is the major contributor to the N+3 goals, illustrates what we see as the critical technology challenge to be resolved: propulsion system-airframe integration.
The D8 Series is an integrated configuration that makes use of boundary layer ingestion and unconventional engine placement, with three engines on top of the aft end of the fuselage. Engine placement is such that there is little diffusion upstream of the inlet or in the inlet, so the influence of ingestion can be considerably less than for an S-duct inlet. However, the configuration results in an exhaust flow geometry with three adjacent streams and, for example, a possibility of base drag. The parameters that are affected as part of this integration include aircraft drag, engine performance in the resulting inlet distortion (effect on fuel burn and thrust, effect on aerodynamic stability, effect on aeromechanics), and noise due to the non-uniformity. The fourth major finding is that the consideration of propulsion system-airframe integration issues, and thus the in-depth assessment of the D8 Series feasibility, is the highest priority for future study.
While the above stands out as the main technology topic, there are other technology areas of high interest that are described in the report. A second important challenge is the capability for development of high-efficiency cores at the small sizes that are implied by the interlocking requirements of ultra high bypass ratio, increases in cycle pressure ratio, and aircraft with much improved drag characteristics and thus lower thrust requirements.
NASA/CR—2010-216794/VOL1 4
University-Industry Collaboration: Process and Results
As a final point, there are two related aspects of the university-industry collaboration that are worth describing. The first was the virtually seamless interaction between the different organizations. The second, enabled by the first, was the strong emphasis on what is perhaps best described as the primacy of ideas rather than of organization or hierarchy. In other words, concepts and suggestions were considered directly on merit (e.g. content, strategic value, or impact) rather than the originator of the idea, or the legacy of the idea. From the start of the project (and as described in our proposal in 2008) this was emphasized and fostered explicitly in team discussions. The consequence was that the team functioned with open-mindedness to new ideas and, as a direct corollary, a willingness to subject even cherished concepts to in-depth scrutiny; there were several strongly held beliefs that were challenged and altered during the course of the project.
In sum, the goal was to create a team in which “the whole was greater than the sum of the parts” because of strong interactions between participants. Capacity for achievement of this type of enterprise involving students, staff, faculty, and engineers in industry from a number of fields is also a major finding of the project.
1.1 Configuration Definition
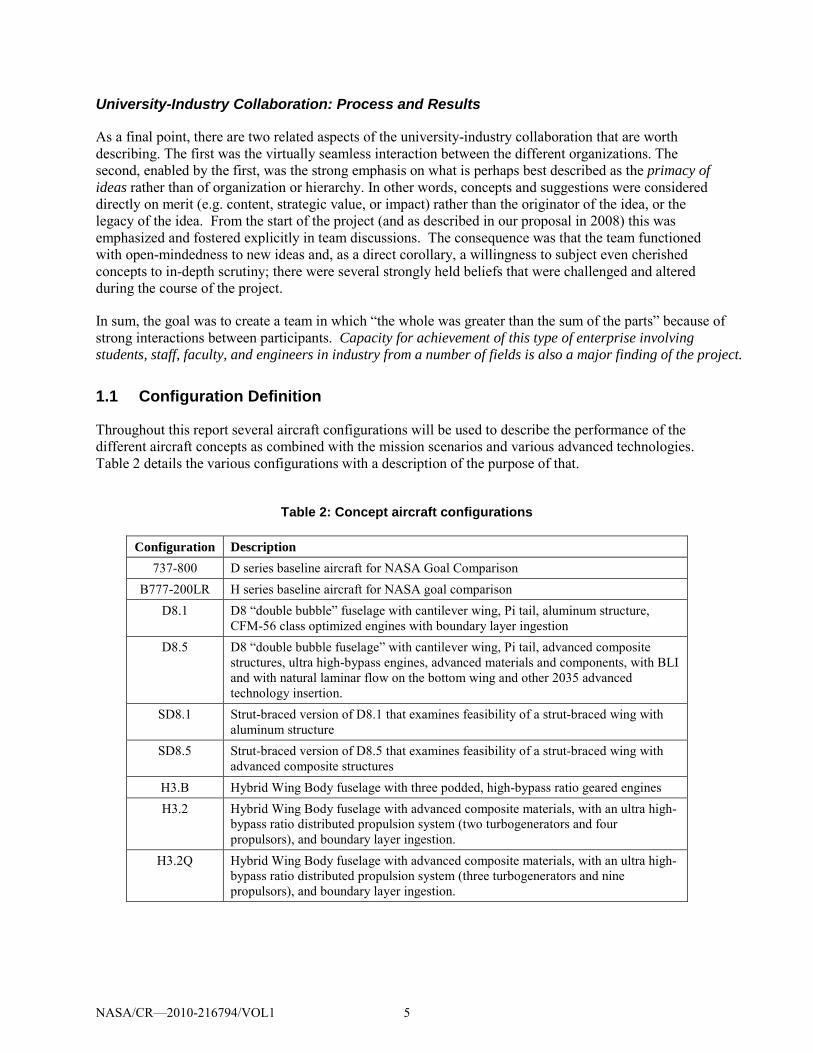
Throughout this report several aircraft configurations will be used to describe the performance of the different aircraft concepts as combined with the mission scenarios and various advanced technologies. Table 2 details the various configurations with a description of the purpose of that.
Table 2: Concept aircraft configurations
Configuration Description 737-800 D series baseline aircraft for NASA Goal Comparison
B777-200LR H series baseline aircraft for NASA goal comparison D8.1 D8 “double bubble” fuselage with cantilever wing, Pi tail, aluminum structure,
CFM-56 class optimized engines with boundary layer ingestion D8.5 D8 “double bubble fuselage” with cantilever wing, Pi tail, advanced composite
structures, ultra high-bypass engines, advanced materials and components, with BLI and with natural laminar flow on the bottom wing and other 2035 advanced technology insertion.
SD8.1 Strut-braced version of D8.1 that examines feasibility of a strut-braced wing with aluminum structure
SD8.5 Strut-braced version of D8.5 that examines feasibility of a strut-braced wing with advanced composite structures
H3.B Hybrid Wing Body fuselage with three podded, high-bypass ratio geared engines H3.2 Hybrid Wing Body fuselage with advanced composite materials, with an ultra high-
bypass ratio distributed propulsion system (two turbogenerators and four propulsors), and boundary layer ingestion.
H3.2Q Hybrid Wing Body fuselage with advanced composite materials, with an ultra high-bypass ratio distributed propulsion system (three turbogenerators and nine propulsors), and boundary layer ingestion.
NASA/CR—2010-216794/VOL1 5
2 Scenario
2.1 Introduction
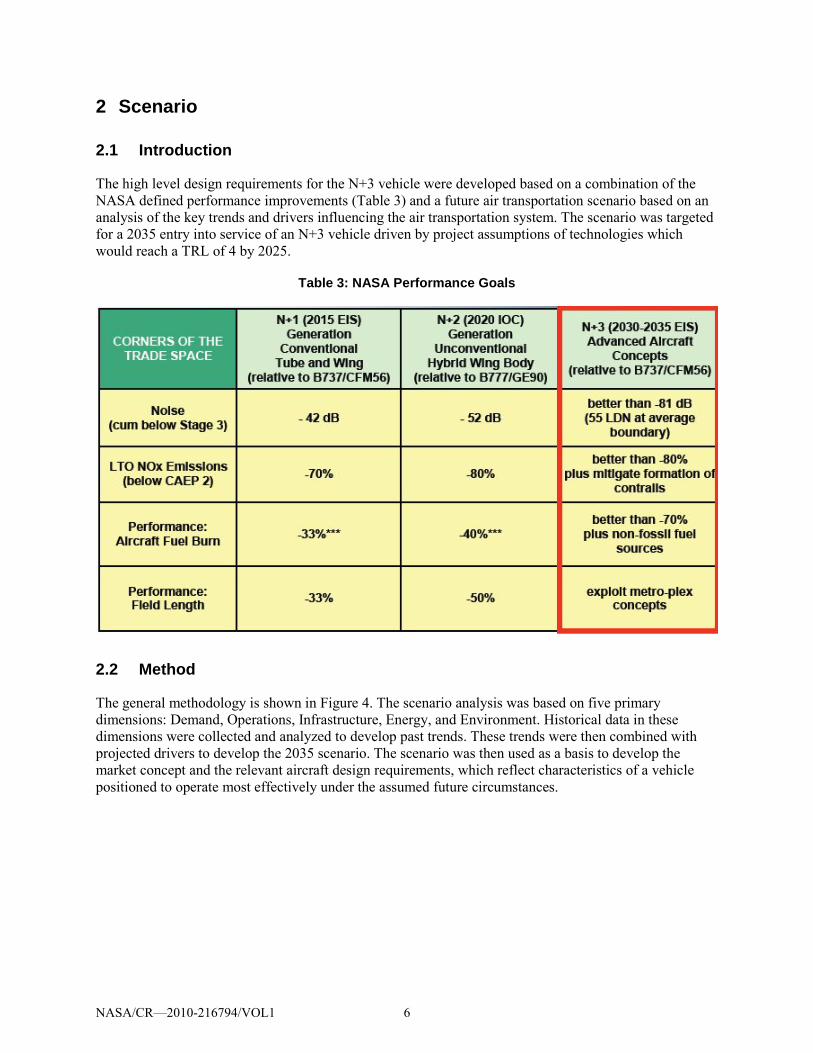
The high level design requirements for the N+3 vehicle were developed based on a combination of the NASA defined performance improvements (Table 3) and a future air transportation scenario based on an analysis of the key trends and drivers influencing the air transportation system. The scenario was targeted for a 2035 entry into service of an N+3 vehicle driven by project assumptions of technologies which would reach a TRL of 4 by 2025.
Table 3: NASA Performance Goals
2.2 Method
The general methodology is shown in Figure 4. The scenario analysis was based on five primary dimensions: Demand, Operations, Infrastructure, Energy, and Environment. Historical data in these dimensions were collected and analyzed to develop past trends. These trends were then combined with projected drivers to develop the 2035 scenario. The scenario was then used as a basis to develop the market concept and the relevant aircraft design requirements, which reflect characteristics of a vehicle positioned to operate most effectively under the assumed future circumstances.
NASA/CR—2010-216794/VOL1 6
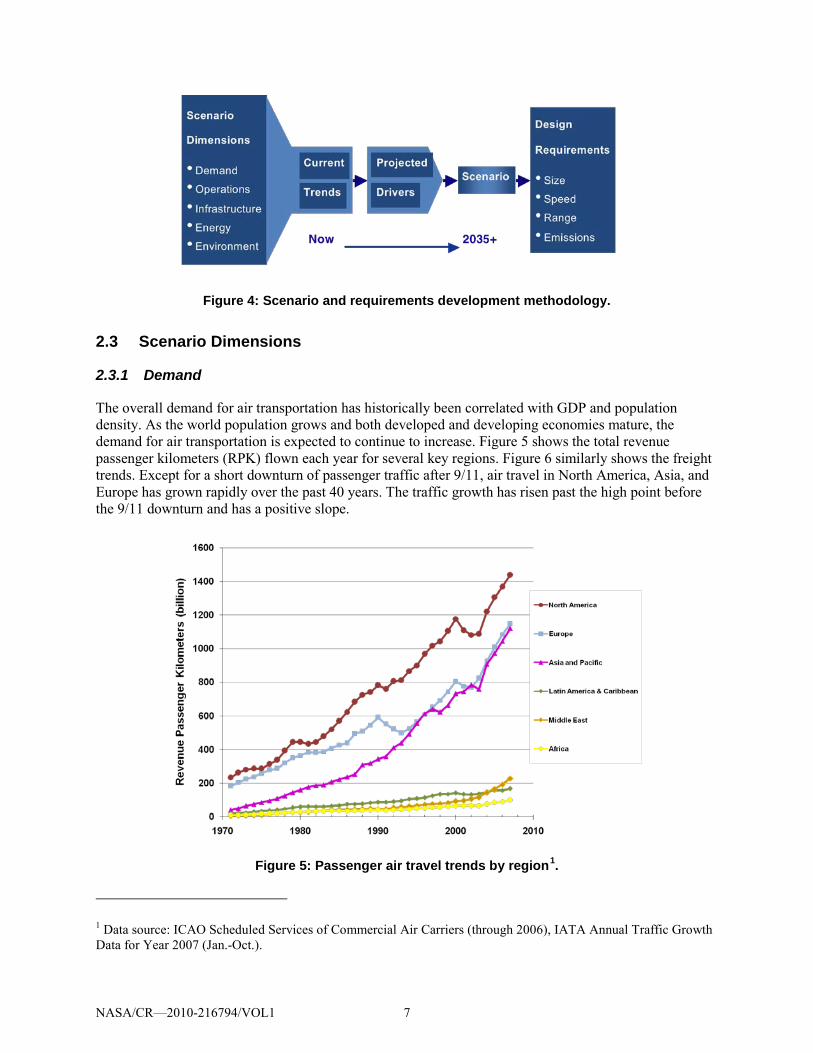
Figure 4: Scenario and requirements development methodology.
2.3 Scenario Dimensions
2.3.1 Demand
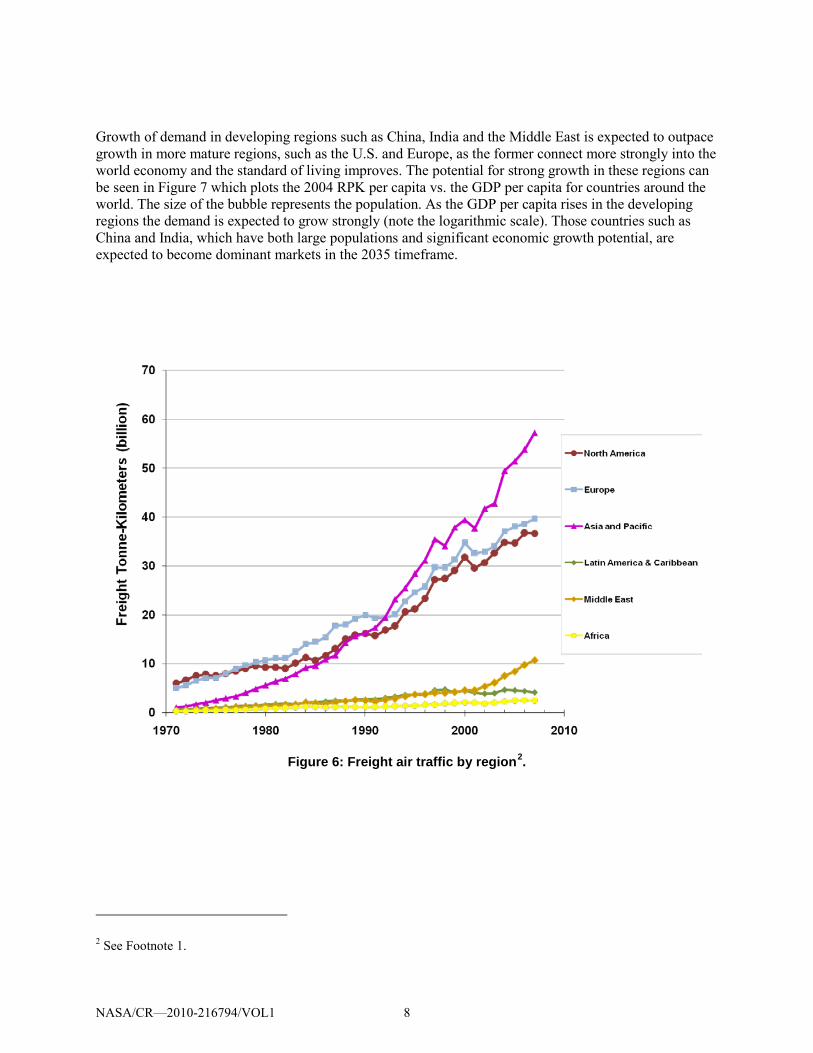
The overall demand for air transportation has historically been correlated with GDP and population density. As the world population grows and both developed and developing economies mature, the demand for air transportation is expected to continue to increase. Figure 5 shows the total revenue passenger kilometers (RPK) flown each year for several key regions. Figure 6 similarly shows the freight trends. Except for a short downturn of passenger traffic after 9/11, air travel in North America, Asia, and Europe has grown rapidly over the past 40 years. The traffic growth has risen past the high point before the 9/11 downturn and has a positive slope.
Figure 5: Passenger air travel trends by region1
1 Data source: ICAO Scheduled Services of Commercial Air Carriers (through 2006), IATA Annual Traffic Growth Data for Year 2007 (Jan.-Oct.).
.
NASA/CR—2010-216794/VOL1 7
Growth of demand in developing regions such as China, India and the Middle East is expected to outpace growth in more mature regions, such as the U.S. and Europe, as the former connect more strongly into the world economy and the standard of living improves. The potential for strong growth in these regions can be seen in Figure 7 which plots the 2004 RPK per capita vs. the GDP per capita for countries around the world. The size of the bubble represents the population. As the GDP per capita rises in the developing regions the demand is expected to grow strongly (note the logarithmic scale). Those countries such as China and India, which have both large populations and significant economic growth potential, are expected to become dominant markets in the 2035 timeframe.
Figure 6: Freight air traffic by region2
.
2 See Footnote 1.
NASA/CR—2010-216794/VOL1 8
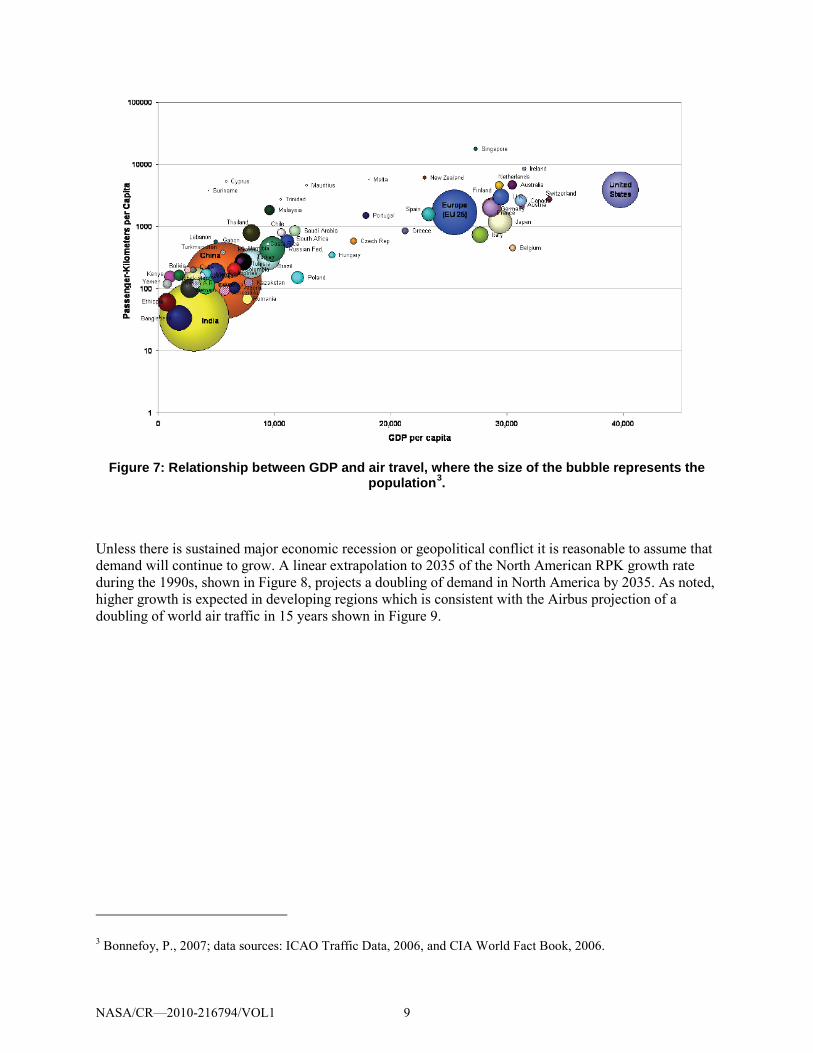
Figure 7: Relationship between GDP and air travel, where the size of the bubble represents the population3
.
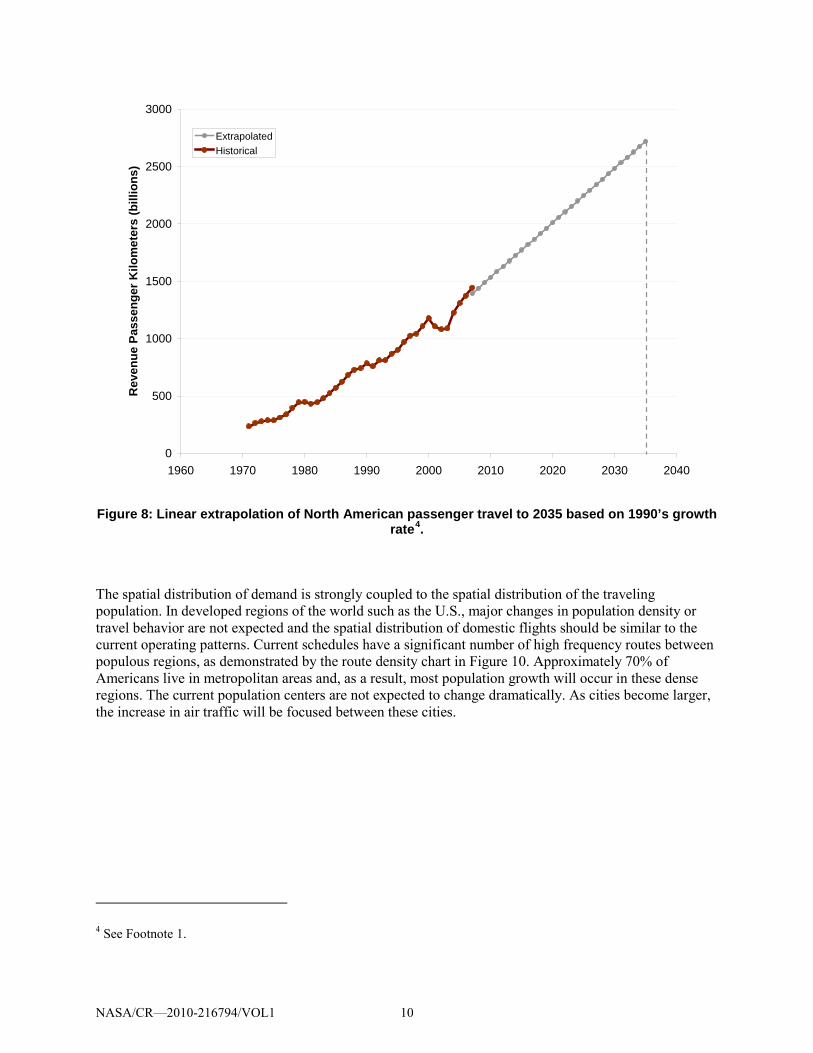
Unless there is sustained major economic recession or geopolitical conflict it is reasonable to assume that demand will continue to grow. A linear extrapolation to 2035 of the North American RPK growth rate during the 1990s, shown in Figure 8, projects a doubling of demand in North America by 2035. As noted, higher growth is expected in developing regions which is consistent with the Airbus projection of a doubling of world air traffic in 15 years shown in Figure 9.
3 Bonnefoy, P., 2007; data sources: ICAO Traffic Data, 2006, and CIA World Fact Book, 2006.
NASA/CR—2010-216794/VOL1 9
0
500
1000
1500
2000
2500
3000
1960 1970 1980 1990 2000 2010 2020 2030 2040
Rev
enue
Pas
seng
er K
ilom
eter
s (b
illio
ns)
ExtrapolatedHistorical
Figure 8: Linear extrapolation of North American passenger travel to 2035 based on 1990’s growth rate4
.
The spatial distribution of demand is strongly coupled to the spatial distribution of the traveling population. In developed regions of the world such as the U.S., major changes in population density or travel behavior are not expected and the spatial distribution of domestic flights should be similar to the current operating patterns. Current schedules have a significant number of high frequency routes between populous regions, as demonstrated by the route density chart in Figure 10. Approximately 70% of Americans live in metropolitan areas and, as a result, most population growth will occur in these dense regions. The current population centers are not expected to change dramatically. As cities become larger, the increase in air traffic will be focused between these cities.
4 See Footnote 1.
NASA/CR—2010-216794/VOL1 10

Figure 9: Airbus prediction of world air traffic doubling within 15 years5
.
Figure 10: Flight density in the U.S., with blue being the lowest and red being the highest density6
While most domestic travel patterns will remain stable, some shifts are expected in the international and leisure markets. Leisure travel may decline as transportation costs increase and high-carbon-footprint flights to distant locations become unpopular in an ever-critical “green” society. The overall distribution of flights throughout the world is, as previously mentioned, expected to grow with GDP. However, the growth will not be uniform. As air travel expands, most increases are expected to occur in Asia, specifically China and India, which have demonstrated rapid GDP growth in recent years.
.
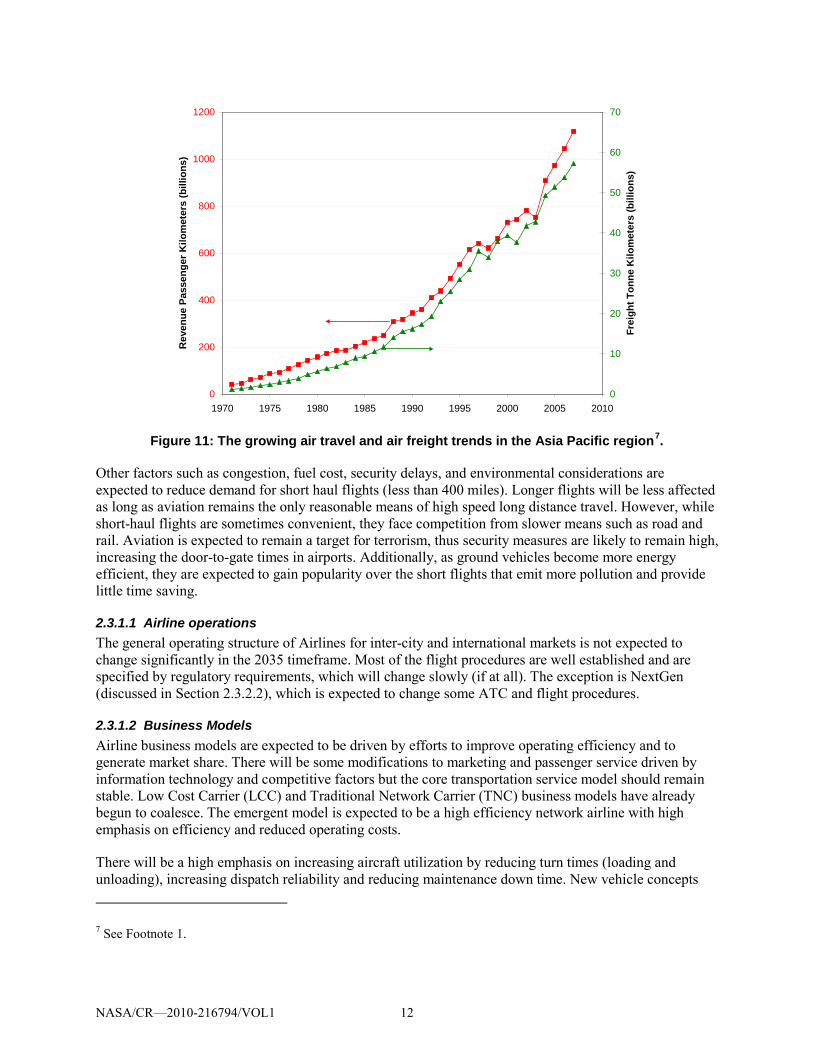
Figure 11 shows an example of the rapid recent growth of both passenger and freight air traffic in the Asia Pacific region indicating that these will be important future markets.
5 Airbus Market Outlook (2008-2028). 6 Bonnefoy, P., 2007; Data source: Enhanced Traffic Management System (ETMS), 2008.
NASA/CR—2010-216794/VOL1 11
0
200
400
600
800
1000
1200
1970 1975 1980 1985 1990 1995 2000 2005 2010
Rev
enue
Pas
seng
er K
ilom
eter
s (b
illio
ns)
0
10
20
30
40
50
60
70
Frei
ght T
onne
Kilo
met
ers
(bill
ions
)
Figure 11: The growing air travel and air freight trends in the Asia Pacific region7
Other factors such as congestion, fuel cost, security delays, and environmental considerations are expected to reduce demand for short haul flights (less than 400 miles). Longer flights will be less affected as long as aviation remains the only reasonable means of high speed long distance travel. However, while short-haul flights are sometimes convenient, they face competition from slower means such as road and rail. Aviation is expected to remain a target for terrorism, thus security measures are likely to remain high, increasing the door-to-gate times in airports. Additionally, as ground vehicles become more energy efficient, they are expected to gain popularity over the short flights that emit more pollution and provide little time saving.
.
2.3.1.1 Airline operations The general operating structure of Airlines for inter-city and international markets is not expected to change significantly in the 2035 timeframe. Most of the flight procedures are well established and are specified by regulatory requirements, which will change slowly (if at all). The exception is NextGen (discussed in Section 2.3.2.2), which is expected to change some ATC and flight procedures.
2.3.1.2 Business Models Airline business models are expected to be driven by efforts to improve operating efficiency and to generate market share. There will be some modifications to marketing and passenger service driven by information technology and competitive factors but the core transportation service model should remain stable. Low Cost Carrier (LCC) and Traditional Network Carrier (TNC) business models have already begun to coalesce. The emergent model is expected to be a high efficiency network airline with high emphasis on efficiency and reduced operating costs.
There will be a high emphasis on increasing aircraft utilization by reducing turn times (loading and unloading), increasing dispatch reliability and reducing maintenance down time. New vehicle concepts
7 See Footnote 1.
NASA/CR—2010-216794/VOL1 12
will have to demonstrate operating cost savings or significant market generation potential if their operating and maintenance costs are high.
2.3.1.3 Network Structure The general airline network structure is expected to remain based on a modified hub and spoke system due to the operational and market efficiency of this structure8. Hubs are useful for maintenance and crew management and have been shown to improve fuel efficiency and equipment utilization9
The spatial distribution of the network and the key hubs will shift slightly. The general structure will continue to be driven by the population distribution; however, capacity limits may prevent current hubs from expanding, resulting in emergence of new hub airports. In addition immature networks in developing regions (such as India and China) will grow.
. Point to point service will exist but will be concentrated on high demand routes. At the high end, network size and density will grow with consolidation and the expected strengthening of network alliances. It is likely that three or four “super airlines” will emerge. At the low end, there will continue to be new entrant start-up airlines, with a limited network, focused on niche markets.
2.3.1.4 IT Impact Information technology will significantly impact airline marketing and distribution, passenger services, scheduling and flight operations. Electronic marketing and ticking distribution will dominate through the evolved web infrastructure with ubiquitous personal communication and computation devices linked to electronic ticketing systems. Because of the high transparency in the electronic marketing and distribution environment, price will continue to be the driver for on-line sales. Passenger entertainment will be based on individual portable devices, so In Flight Entertainment (IFE) infrastructure will be more focused on providing connectivity and power rather than expensive and unreliable in-seat systems.
Scheduling and pricing will be more flexible and based on sophisticated robust optimization algorithms which will be able to broaden the utility space to directly include operating and environmental costs as well as market impact and profitability considerations. The revenue management systems will keep load factors at high levels near 80%. Flight operations will be highly integrated with System Wide Information Management (SWIM) linking aircraft, ATC, dispatch, station, maintenance and scheduling functions enabling more flexible and efficient response to weather, traffic and other flight disruptions.
2.3.1.5 Passenger Baggage and Cargo Although the cabin load factor (percent of seats that are occupied) for aircraft types flown in the U.S. is typically between 70 and 80%, the belly freight capacity is less utilized. From Bureau of Transportation Statistics (BTS) database, one can ascertain the belly freight utilization because airlines report payload weight from both mail and cargo as well as the number of passengers. The BTS database assumes an average passenger weight of 200 lbs.
8 Schipper, Y., and P. Rietveld. “Economic and environmental effects of airline deregulation,” in C. Capineri and P. Rietveld (eds), Networks in Transport and Communications, Aldershot: Ashgate, 325–344.
Peeters, P., Rietveld, P. and Schipper, Y., “Environmental impacts of hub and spoke networks in European aviation”, September, 2001. (http://airneth.nl/index.php/doc_download/309-environmental-impacts-of-hub-and-spoke-networks-in-aviation.html) 9 Azzam, M., P. Bonnefoy, and R.J. Hansman. “Investigation of the Fuel Efficiency of the US Air Transportation Network Structure” (submitted to AIAA Air Transportation Integration and Operations Conference, 2010.)
NASA/CR—2010-216794/VOL1 13
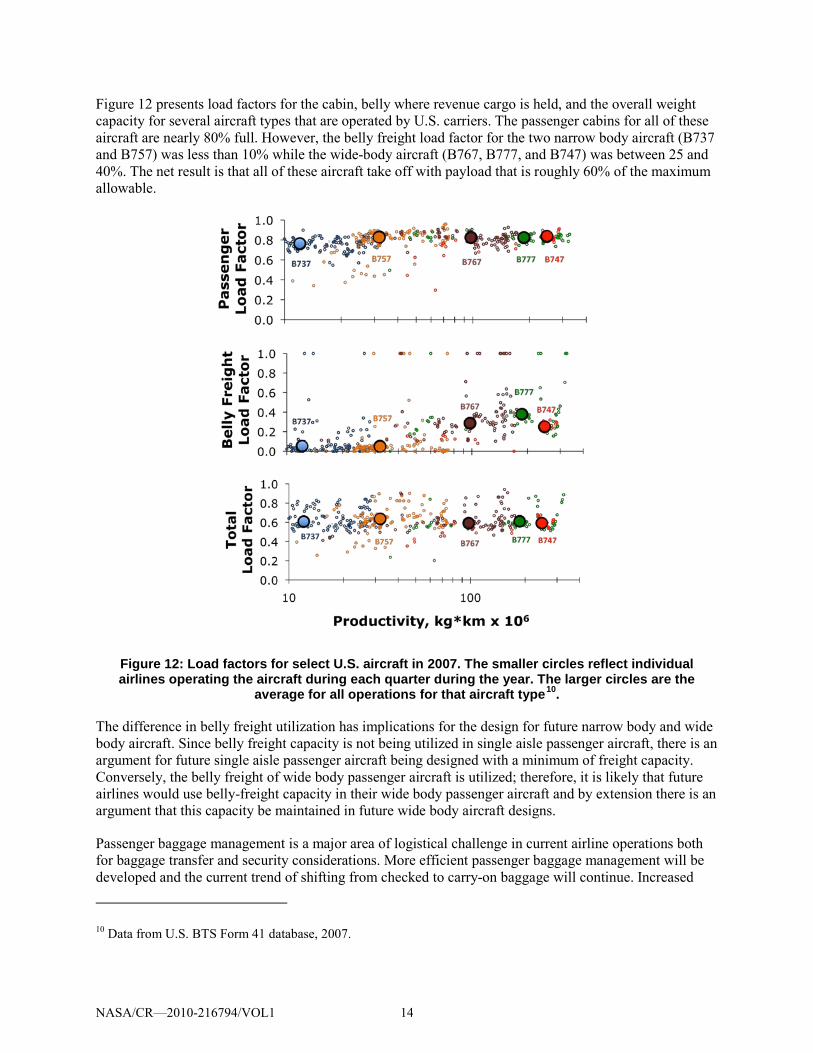
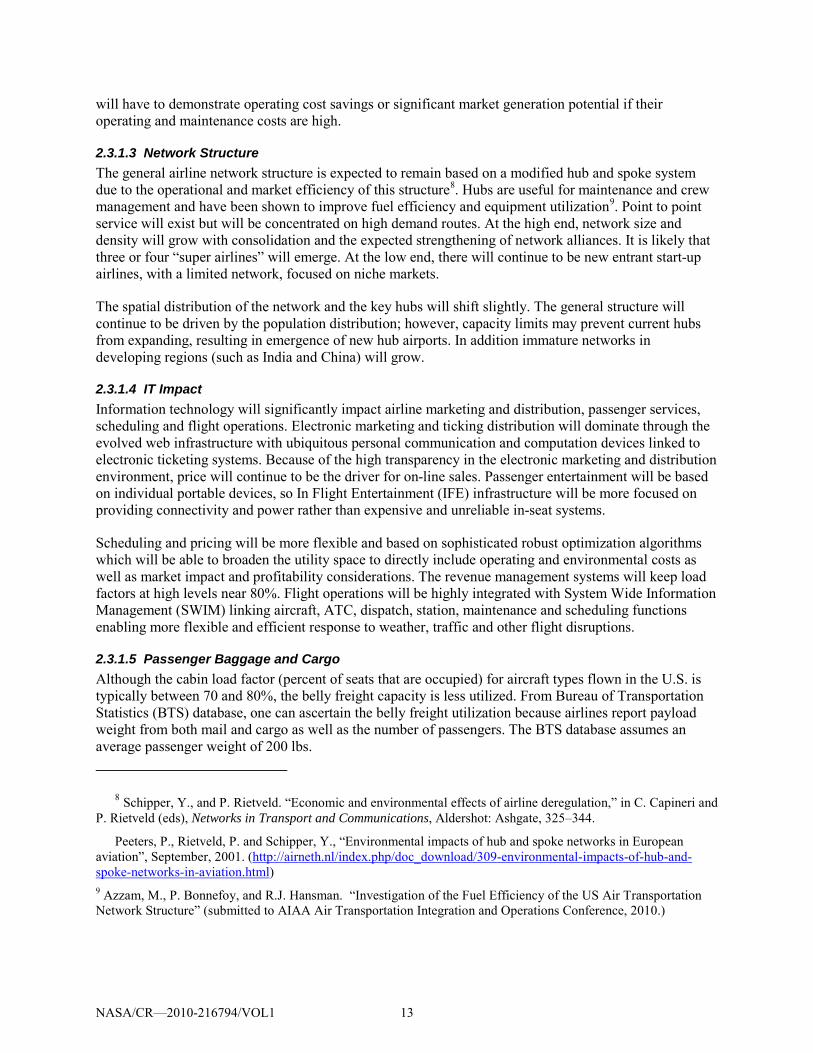
Figure 12 presents load factors for the cabin, belly where revenue cargo is held, and the overall weight capacity for several aircraft types that are operated by U.S. carriers. The passenger cabins for all of these aircraft are nearly 80% full. However, the belly freight load factor for the two narrow body aircraft (B737 and B757) was less than 10% while the wide-body aircraft (B767, B777, and B747) was between 25 and 40%. The net result is that all of these aircraft take off with payload that is roughly 60% of the maximum allowable.
Figure 12: Load factors for select U.S. aircraft in 2007. The smaller circles reflect individual airlines operating the aircraft during each quarter during the year. The larger circles are the
average for all operations for that aircraft type10
The difference in belly freight utilization has implications for the design for future narrow body and wide body aircraft. Since belly freight capacity is not being utilized in single aisle passenger aircraft, there is an argument for future single aisle passenger aircraft being designed with a minimum of freight capacity. Conversely, the belly freight of wide body passenger aircraft is utilized; therefore, it is likely that future airlines would use belly-freight capacity in their wide body passenger aircraft and by extension there is an argument that this capacity be maintained in future wide body aircraft designs.
.
Passenger baggage management is a major area of logistical challenge in current airline operations both for baggage transfer and security considerations. More efficient passenger baggage management will be developed and the current trend of shifting from checked to carry-on baggage will continue. Increased
10 Data from U.S. BTS Form 41 database, 2007.
NASA/CR—2010-216794/VOL1 14
carry-on baggage capacity will be expected in future aircraft configurations as well as more efficient carry-on loading schemes to reduce aircraft turn times.
Cargo and belly freight loads are expected to be lower in 2035 for domestic markets where security considerations and screening have shifted much air cargo such as the U.S. mail from passenger to dedicated air cargo flights or surface transportation. International markets will continue to carry significant air cargo loads.
2.3.1.6 Security Air transportation will continue to be a potential terrorism target within the 2035 timeframe and the security burden is expected to increase particularly following failed or successful attempts. Increased security policies following 9/11 and subsequent attempts have resulted in longer waits at airport terminals and increased “hassle factor”11
2.3.2 Infrastructure
. This has and will continue to erode the demand for short haul flights. While there will be improvement in streamlining security protocols, these gains are expected to be offset by additional requirements over time.
The ability of the air transportation system to grow to accommodate demand will be limited by the ability of the infrastructure to accommodate this growth. In mature air transportation markets such as the U.S., the infrastructure is already approaching its capacity limits at key points as can be seen in increasing magnitude and volatility of delays in Figure 13. The infrastructure can be limited by airport capacity and airspace capacity, both of which will be a factor in the 2035 timeframe.
Figure 13: Increasing delays of U.S. flights12
2.3.2.1 Airport Capacity
.
Currently the major infrastructure constraint in the U.S. system is airport capacity, particularly at key locations in the system such as New York. Airport capacity is generally limited by the runway capacity of the airport although gates and landside constraints can also be a factor. The capacity of a single runway is
11 Blalock, G., V. Kadiyali, and D.H. Simon. “The Impact of Post‐9/11 Airport Security Measures on the Demand for Air Travel.” The Journal of Law and Economics, vol. 50 (2007).
12 Data source: FAA Operational Network (OPSNET).
NASA/CR—2010-216794/VOL1 15
limited due to the wake vortex separation requirements between aircraft. Reducing the wake vortex or making aircraft less vulnerable to wake vortex would significantly improve single airport capacity.
The ability of the U.S. system to add new airports or runways has severely diminished after the National Environmental Policy Act (NEPA) was signed into law in 1970. Since that time new airport and runway growth has plummeted. As a consequence, it is assumed that there will only be less than 20 new runways added to the U.S. system by 2035. Similar limits will apply in Europe. There will be significant new airport and runway expansion in developing regions such as China and India. In 2008, China began an initiative to build 97 regional airports by 2020, up from the 147 civilian airports that existed in 200613
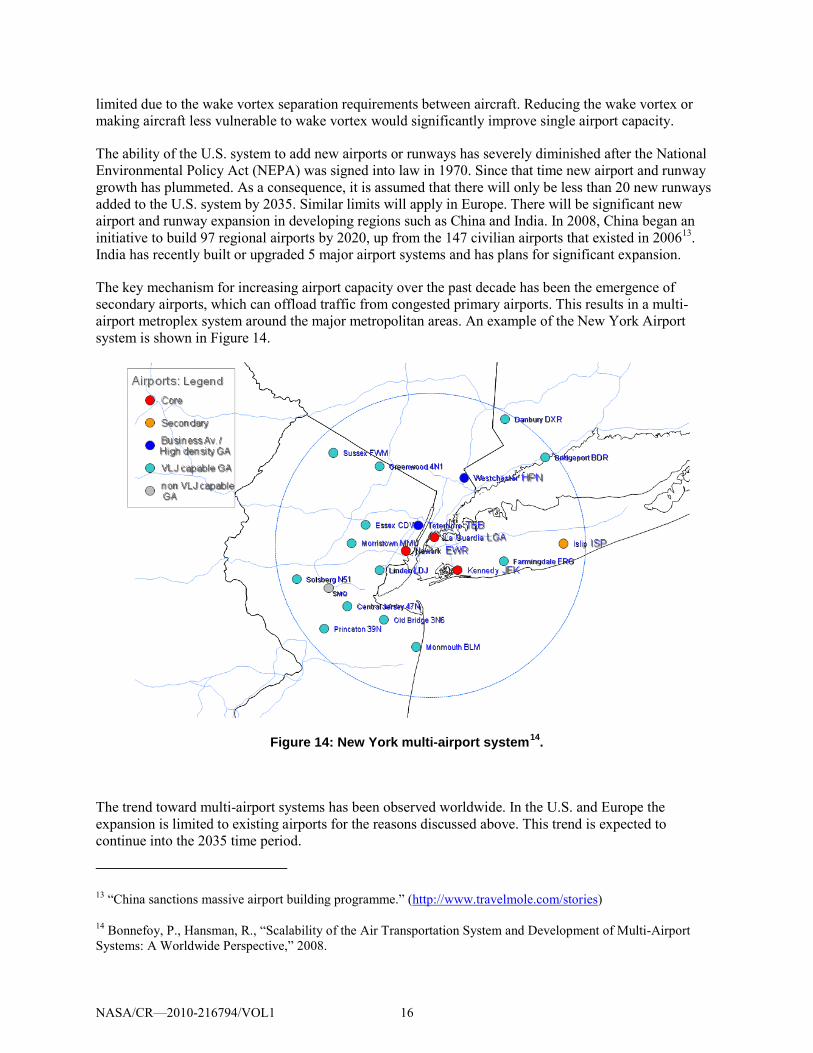
The key mechanism for increasing airport capacity over the past decade has been the emergence of secondary airports, which can offload traffic from congested primary airports. This results in a multi-airport metroplex system around the major metropolitan areas. An example of the New York Airport system is shown in Figure 14.
. India has recently built or upgraded 5 major airport systems and has plans for significant expansion.
Figure 14: New York multi-airport system14
.
The trend toward multi-airport systems has been observed worldwide. In the U.S. and Europe the expansion is limited to existing airports for the reasons discussed above. This trend is expected to continue into the 2035 time period.
13 “China sanctions massive airport building programme.” (http://www.travelmole.com/stories)
14 Bonnefoy, P., Hansman, R., “Scalability of the Air Transportation System and Development of Multi-Airport Systems: A Worldwide Perspective,” 2008.
NASA/CR—2010-216794/VOL1 16
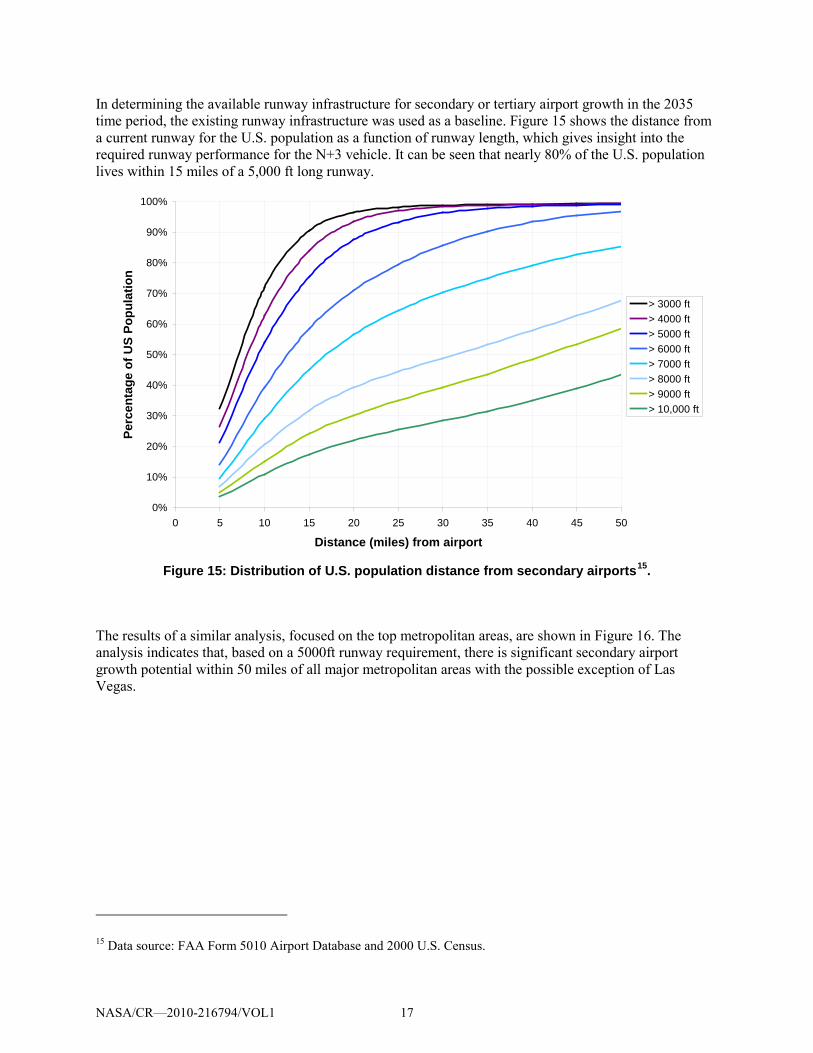
In determining the available runway infrastructure for secondary or tertiary airport growth in the 2035 time period, the existing runway infrastructure was used as a baseline. Figure 15 shows the distance from a current runway for the U.S. population as a function of runway length, which gives insight into the required runway performance for the N+3 vehicle. It can be seen that nearly 80% of the U.S. population lives within 15 miles of a 5,000 ft long runway.
0%
10%
20%
30%
40%
50%
60%
70%
80%
90%
100%
0 5 10 15 20 25 30 35 40 45 50
Distance (miles) from airport
Perc
enta
ge o
f US
Popu
latio
n
> 3000 ft> 4000 ft> 5000 ft> 6000 ft> 7000 ft> 8000 ft> 9000 ft> 10,000 ft
Figure 15: Distribution of U.S. population distance from secondary airports15
.
The results of a similar analysis, focused on the top metropolitan areas, are shown in Figure 16. The analysis indicates that, based on a 5000ft runway requirement, there is significant secondary airport growth potential within 50 miles of all major metropolitan areas with the possible exception of Las Vegas.
15 Data source: FAA Form 5010 Airport Database and 2000 U.S. Census.
NASA/CR—2010-216794/VOL1 17
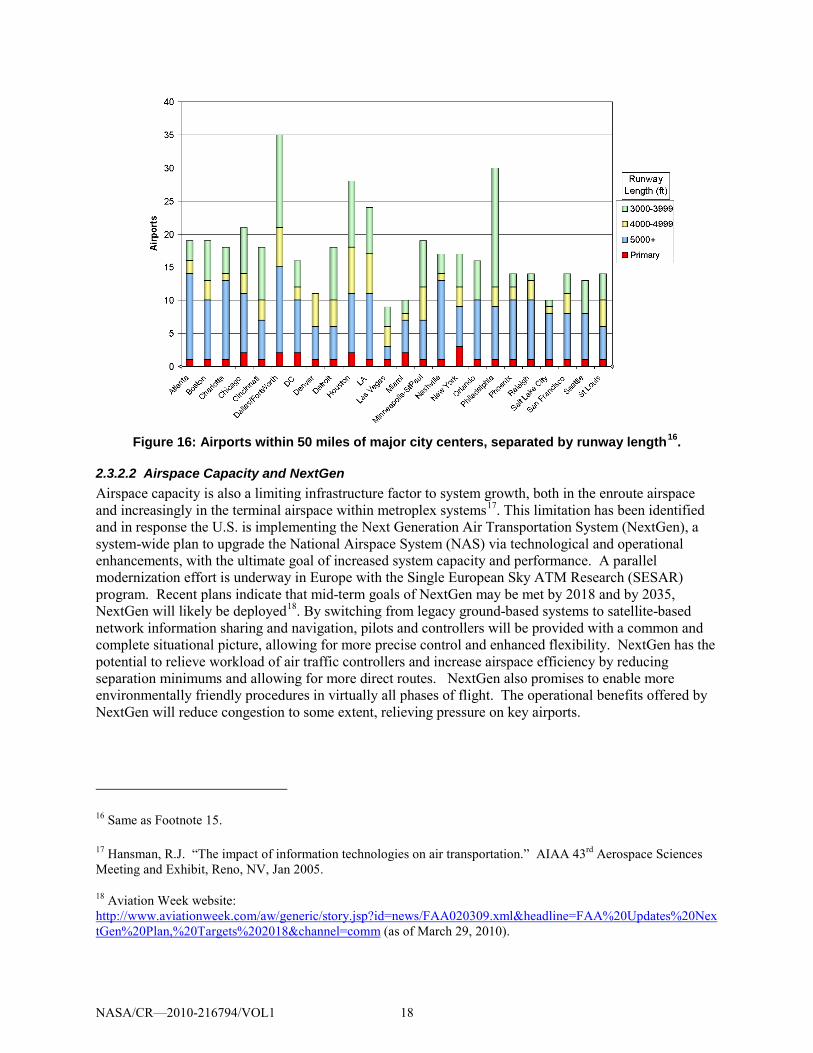
Figure 16: Airports within 50 miles of major city centers, separated by runway length16
2.3.2.2 Airspace Capacity and NextGen
.
Airspace capacity is also a limiting infrastructure factor to system growth, both in the enroute airspace and increasingly in the terminal airspace within metroplex systems17. This limitation has been identified and in response the U.S. is implementing the Next Generation Air Transportation System (NextGen), a system-wide plan to upgrade the National Airspace System (NAS) via technological and operational enhancements, with the ultimate goal of increased system capacity and performance. A parallel modernization effort is underway in Europe with the Single European Sky ATM Research (SESAR) program. Recent plans indicate that mid-term goals of NextGen may be met by 2018 and by 2035, NextGen will likely be deployed18
16 Same as Footnote 15.
. By switching from legacy ground-based systems to satellite-based network information sharing and navigation, pilots and controllers will be provided with a common and complete situational picture, allowing for more precise control and enhanced flexibility. NextGen has the potential to relieve workload of air traffic controllers and increase airspace efficiency by reducing separation minimums and allowing for more direct routes. NextGen also promises to enable more environmentally friendly procedures in virtually all phases of flight. The operational benefits offered by NextGen will reduce congestion to some extent, relieving pressure on key airports.
17 Hansman, R.J. “The impact of information technologies on air transportation.” AIAA 43rd Aerospace Sciences Meeting and Exhibit, Reno, NV, Jan 2005.
18 Aviation Week website: http://www.aviationweek.com/aw/generic/story.jsp?id=news/FAA020309.xml&headline=FAA%20Updates%20NextGen%20Plan,%20Targets%202018&channel=comm (as of March 29, 2010).
NASA/CR—2010-216794/VOL1 18
2.3.3 Energy
The cost and availability of fuel will be a major factor in the 2035 timeframe. Fuel costs have been trending up and are the single largest contributor to airline Direct Operating Costs (DOC). Fuel costs are expected to continue to increase and remain the dominant operating cost factor19
2.3.3.1 Petroleum Outlook
.
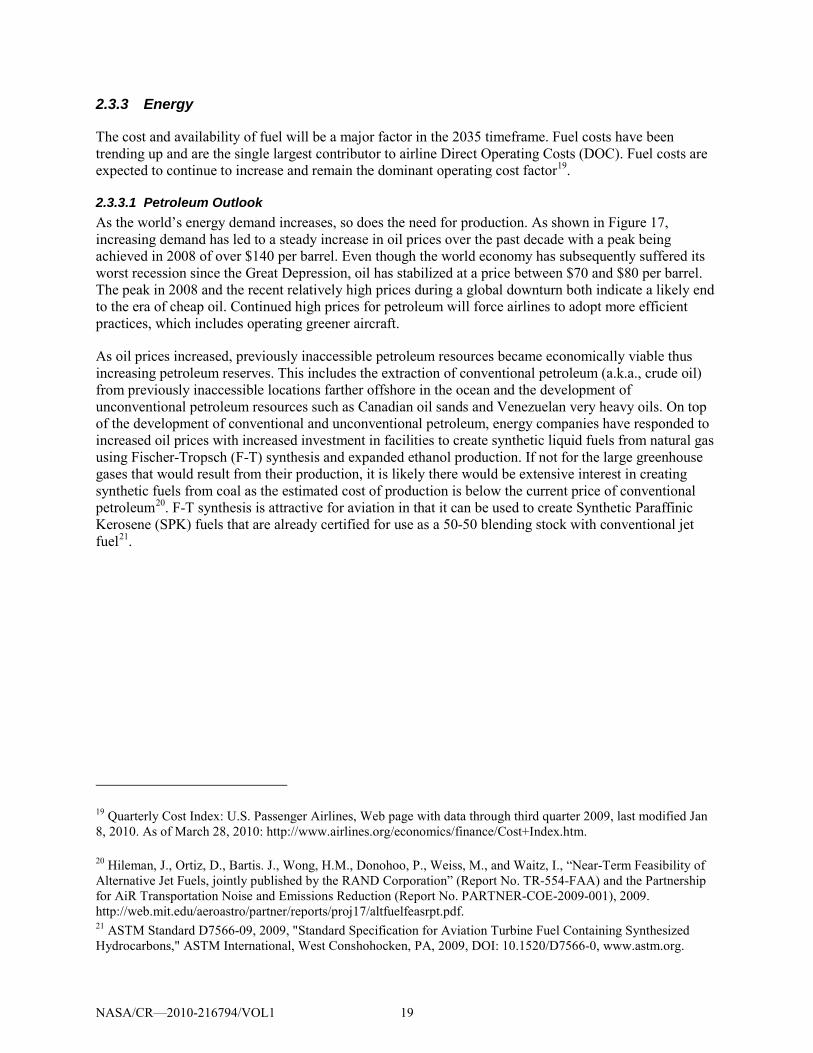
As the world’s energy demand increases, so does the need for production. As shown in Figure 17, increasing demand has led to a steady increase in oil prices over the past decade with a peak being achieved in 2008 of over $140 per barrel. Even though the world economy has subsequently suffered its worst recession since the Great Depression, oil has stabilized at a price between $70 and $80 per barrel. The peak in 2008 and the recent relatively high prices during a global downturn both indicate a likely end to the era of cheap oil. Continued high prices for petroleum will force airlines to adopt more efficient practices, which includes operating greener aircraft.
As oil prices increased, previously inaccessible petroleum resources became economically viable thus increasing petroleum reserves. This includes the extraction of conventional petroleum (a.k.a., crude oil) from previously inaccessible locations farther offshore in the ocean and the development of unconventional petroleum resources such as Canadian oil sands and Venezuelan very heavy oils. On top of the development of conventional and unconventional petroleum, energy companies have responded to increased oil prices with increased investment in facilities to create synthetic liquid fuels from natural gas using Fischer-Tropsch (F-T) synthesis and expanded ethanol production. If not for the large greenhouse gases that would result from their production, it is likely there would be extensive interest in creating synthetic fuels from coal as the estimated cost of production is below the current price of conventional petroleum20. F-T synthesis is attractive for aviation in that it can be used to create Synthetic Paraffinic Kerosene (SPK) fuels that are already certified for use as a 50-50 blending stock with conventional jet fuel21
19 Quarterly Cost Index: U.S. Passenger Airlines, Web page with data through third quarter 2009, last modified Jan 8, 2010. As of March 28, 2010: http://www.airlines.org/economics/finance/Cost+Index.htm.
.
20 Hileman, J., Ortiz, D., Bartis. J., Wong, H.M., Donohoo, P., Weiss, M., and Waitz, I., “Near-Term Feasibility of Alternative Jet Fuels, jointly published by the RAND Corporation” (Report No. TR-554-FAA) and the Partnership for AiR Transportation Noise and Emissions Reduction (Report No. PARTNER-COE-2009-001), 2009. http://web.mit.edu/aeroastro/partner/reports/proj17/altfuelfeasrpt.pdf. 21 ASTM Standard D7566-09, 2009, "Standard Specification for Aviation Turbine Fuel Containing Synthesized Hydrocarbons," ASTM International, West Conshohocken, PA, 2009, DOI: 10.1520/D7566-0, www.astm.org.
NASA/CR—2010-216794/VOL1 19
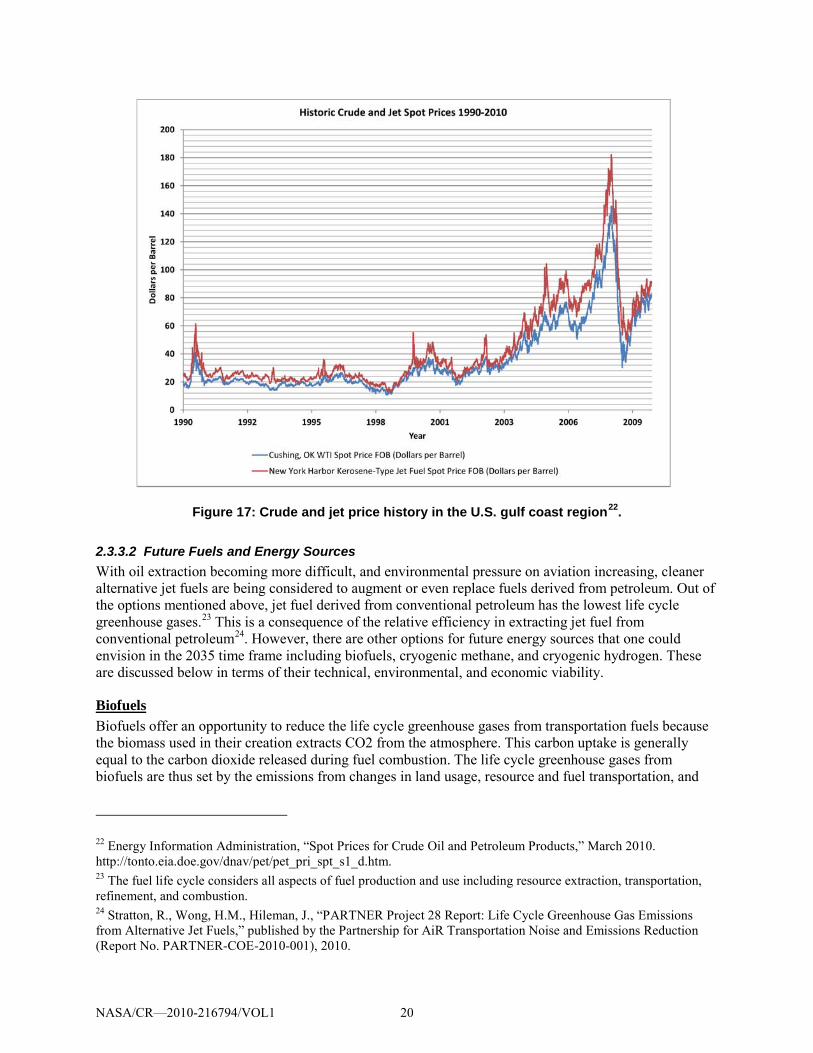
Figure 17: Crude and jet price history in the U.S. gulf coast region22
2.3.3.2 Future Fuels and Energy Sources
.
With oil extraction becoming more difficult, and environmental pressure on aviation increasing, cleaner alternative jet fuels are being considered to augment or even replace fuels derived from petroleum. Out of the options mentioned above, jet fuel derived from conventional petroleum has the lowest life cycle greenhouse gases.23 This is a consequence of the relative efficiency in extracting jet fuel from conventional petroleum24
Biofuels
. However, there are other options for future energy sources that one could envision in the 2035 time frame including biofuels, cryogenic methane, and cryogenic hydrogen. These are discussed below in terms of their technical, environmental, and economic viability.
Biofuels offer an opportunity to reduce the life cycle greenhouse gases from transportation fuels because the biomass used in their creation extracts CO2 from the atmosphere. This carbon uptake is generally equal to the carbon dioxide released during fuel combustion. The life cycle greenhouse gases from biofuels are thus set by the emissions from changes in land usage, resource and fuel transportation, and
22 Energy Information Administration, “Spot Prices for Crude Oil and Petroleum Products,” March 2010. http://tonto.eia.doe.gov/dnav/pet/pet_pri_spt_s1_d.htm. 23 The fuel life cycle considers all aspects of fuel production and use including resource extraction, transportation, refinement, and combustion. 24 Stratton, R., Wong, H.M., Hileman, J., “PARTNER Project 28 Report: Life Cycle Greenhouse Gas Emissions from Alternative Jet Fuels,” published by the Partnership for AiR Transportation Noise and Emissions Reduction (Report No. PARTNER-COE-2010-001), 2010.
NASA/CR—2010-216794/VOL1 20
fuel processing. Biofuels are potentially limited in their ability to augment or replace petroleum by production cost, growth rate, and the land and water resources required for their growth25
Although ground transportation can use a variety of biofuel compositions such as ethanol, butanol, and fatty acid methyl esters (FAME), aviation requires fuels with a high specific energy that are safe to handle on the ground and can withstand cruise altitude conditions. In addition to safety concerns with their use, the reduced specific energy of ethanol and butanol would lead to an increase in fuel energy consumption. Such an increase is not experienced with their use in ground transportation. In addition to a similar problem with its reduced specific energy, thermal stability concerns preclude FAME use in aviation. Because of these concerns and the fact that fuel production pathways exist to create hydrocarbon fuels from biomass resources, alcohols and FAMEs are not considered further.
.
A variety of feedstock-to-fuel pathways exist to create aviation biofuels that are similar in composition to conventional jet fuel. These pathways include the use of F-T synthesis with any biomass resource to create an SPK fuel, hydroprocessing of renewable plant oils to a Hydroprocessed Renewable Jet (HRJ) fuel which is similar to an SPK fuel, the fermentation of sugars to alkanes which is again similar to an SPK fuel, and the pyrolysis of cellulosic biomass to synthetic aromatics that can be mixed with SPK fuels to make a fully synthetic jet fuel. These fuels could all be blended with conventional jet fuel in today’s aircraft as well as the N+3 aircraft concept.
Because of the wide range of opportunities for making biofuels that are compatible with current and future aircraft, the N+3 aircraft concepts that are developed herein for conventional jet fuel would be compatible with aviation biofuels.
Liquefied Natural Gas Liquefied natural gas (LNG) is simply natural gas that has been cooled to its liquid state at about -260 F. Natural gas consists mostly of methane, with small amounts of ethane, propane, and butane, as well as other hydrocarbons. LNG has been used as an intermediary for natural gas transport for over 50 years and its use is currently growing. Natural gas is one of our most abundant energy resources with considerable new unconventional resources, such as coal bed methane and shale gas, being developed around the world. These new resources are such that North America could become a net exporter of LNG instead of an importer26. In addition to these resources, methane hydrates could provide more energy, in the form of methane, than is contained in all other fossil fuels. Methane hydrates are methane molecules encased in ice and are potentially available around the world27
The primary advantage of LNG relative to conventional jet fuel is the potential vastness of the reserves. As will be discussed later, LNG results in fewer life cycle GHG emissions than either conventional jet fuel or F-T fuels produced from natural gas, making it attractive environmentally. The main disadvantage is the storage requirement in terms of dealing with a fuel that not only has lower energy density than conventional jet fuel, but also is cryogenic. LNG would not be compatible with existing aircraft and it would require considerable expansion of the existing worldwide distribution network. Further, LNG is non-renewable like conventional petroleum. In spite of these concerns, LNG is evaluated in this work as a
. At present, the extraction of methane hydrates is difficult due to the location of deposits. Also, handling the ice must be done with caution so that the methane, a potent GreenHouse Gas (GHG), is not released into the atmosphere.
25 See Footnotes 20 and 24. 26 The Economist Newspaper, “An unconventional glut,” March 11, 2010. As of March 28, http://www.economist.com/business-finance/displaystory.cfm?story_id=15661889 27 http://www.netl.doe.gov/technologies/oil-gas/FutureSupply/MethaneHydrates/about-hydrates/occurrences.htm.
NASA/CR—2010-216794/VOL1 21
potential fuel for the N+3 aircraft concepts because of the reduction in GHG emissions and the large methane hydrate resources.
Liquefied Hydrogen Hydrogen has been discussed as a future “fuel” for several decades. Because energy is required to produce hydrogen, it is not technically a fuel, but instead a means of storing energy from a primary source such as nuclear, wind or solar. The low density of gaseous hydrogen means it would need to be liquefied at a temperature of -420°F for use as an energy source for aviation. An aircraft could then harness the primary energy source stored in the cryogenic hydrogen and through combustion or perhaps via a fuel cell.
The success of hydrogen ultimately relies on the ability to produce clean, cheap electricity. Aviation requires cryogenic hydrogen and not gaseous hydrogen, and it is unlikely that hydrogen will be used as an aviation fuel in the 2035 timeframe. Any clean and cheap electricity would first be used to displace fossil fuels for making electricity, as this is the most efficient use of the resource from both an economic and environmental standpoint. For this reason, nuclear, wind and solar resources are being used to replace electricity generation from fossil resources, although these resources will not replace all electricity from fossil fuels before 203528
2.3.4 Environmental Considerations
. If some new form of energy such as fusion were developed that could meet the demand for electricity, excess electricity might be used to create gaseous hydrogen for use in fuel cells or internal combustion engines for ground transportation. It is only after all of the energy requirements for electricity and ground transportation sectors are met that it might be economically viable to create cryogenic hydrogen because liquefied hydrogen would be more expensive to produce and would require a specialized infrastructure for storage and transportation. Although it is outside of the scope of the work considered here, it might ultimately prove cheaper and greener to convert carbon dioxide in the atmosphere to liquid fuels than to create cryogenic hydrogen. As such, cryogenic hydrogen was not considered as an aviation energy source for the N+3 aircraft concepts in this study.
Environmental impacts of aviation have become increasingly important over the last 50 years with the rapid growth of commercial jet aviation. Aircraft noise—the most easily perceived environmental impact—is regulated by the International Civil Aviation Organization (ICAO). Aircraft built today are required to meet noise certification standards adopted by ICAO as contained in the Annex 16: Environmental Protection, Volume I – International Noise Standards29. ICAO also regulates emissions to improve air quality in the vicinity of airports. These emissions standards are detailed in the Annex 16: Environmental Protection, Volume II – Aircraft Engine Emissions for nitrogen oxides, hydrocarbons, carbon monoxide and smoke30. Lastly, ICAO has recently established the Group on International Aviation and Climate Change, which is responsible for providing guidance to ICAO on policies to addresses aviation’s impact on climate31
28 International Energy Agency, “World Energy Outlook,” Paris: Organisation for Economic Co-Operation and Development and International Energy Agency, 2009.
. The United States’ stance on greenhouse gas emissions is reflected in
29 International Civil Aviation Organization (ICAO), “Annex 16: Environmental Protection Volume I: Aircraft Noise,” 4th Edition, 2005. 30 International Civil Aviation Organization (ICAO), “Annex 16: Environmental Protection Volume II: Aircraft Engine Emissions,” 2nd Edition, 2006. 31 International Civil Aviation Organization's Group on International Aviation and Climate Change (GIACC) First Meeting, Summary of Discussions of Day 3, GIACC/1-SD/3, February, 2008. Available at http://www.icao.int/icao/en/env/Meetings/Giacc/sd3 en.pdf.
NASA/CR—2010-216794/VOL1 22
President Obama’s stated goal of reducing carbon emissions to 1990 levels by 2020 and to 80% below 1990 levels by 2050.
This direction of increased environmental regulation and more environmentally conscious policymaking makes it highly likely that environmental considerations will be a major constraint on aviation and other transportation sectors in the 2035 timeframe. The IPCC Fourth Assessment Report estimates the total GHG emissions attributable to aviation to be about 3% of total anthropogenic emissions; however this fraction is expected to increase as other sectors reduce their footprint32
NASA has set aggressive noise, landing and takeoff (LTO) NOx, and fuel burn targets for the N+3 timeline that aim to address these environmental concerns. It is useful to compare the hypothetical impact of meeting these environmental goals to see where the greatest benefit is felt. One tool that can be of assistance for this type of environmental impact modeling is the Aviation environmental Portfolio Management Tool (APMT). APMT-Impacts—developed and run by MIT—is a component of the FAA’s Aviation Environmental Tools Suite that uses a flexible, probabilistic framework for estimating the physical and socio-economic (or monetized) environmental impacts of aviation
. Due to strict power, range, and weight demands on aircraft, these vehicles require high performance fuel, power plants, and materials for which economical “greener” substitutes are difficult to find. Meanwhile, for example, the automotive industry will much more easily adapt to alternative fuels and hybrid power trains with lower power-to-weight but increased fuel efficiency. The resulting relative reduction in other sectors will increase aviation’s share of the global carbon footprint, generating further pressure on aviation to reduce emissions.
33
To assess the impact of the N+3 targets, a sample noise and emissions scenario was acquired from the Volpe National Transportation Systems Center. This captures the noise contours and emissions inventories produced by the U.S. air transportation fleet in the year 2006. This was used as a baseline case and was run through the three APMT-Impacts modules as a means to benchmark the policy scenario in which the three targets are implemented.
. An APMT-Impacts study of the impact of the three NASA N+3 targets as applied to the present-day air transportation fleet can be used to help inform the definition of the scenario in this project and thus to inform the aircraft design process. A summary of the APMT-Impacts, Noise, Air Quality, and Climate modules can be found at http://apmt.aero.
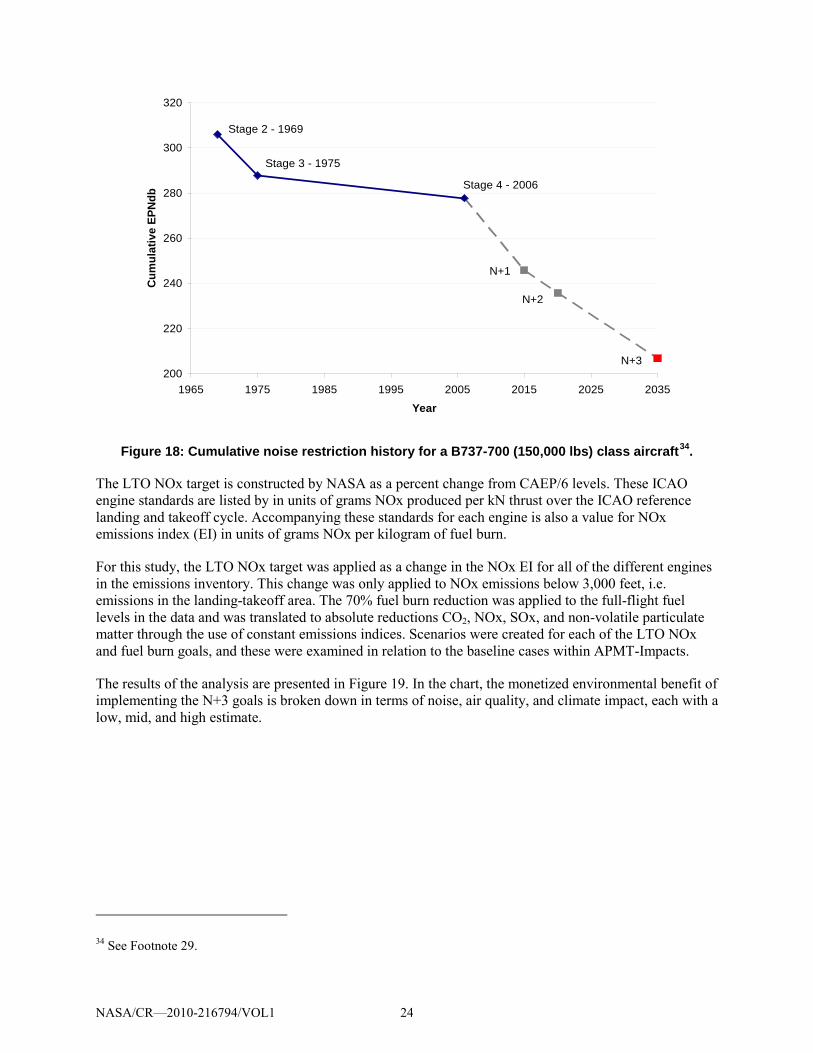
Applying the noise goal of -71 EPNdB (cumulative below Stage 4) was not feasible with the data at hand. Instead, the impact of eliminating aviation noise from the system entirely was used as a proxy for measuring the impact of the N+3 noise goal. This approach overestimates the noise benefits, but suffices for the purposes of comparing impacts across noise, air quality, and climate. Indeed, N+3 noise targets are aggressive, as shown in the noise regulation history diagram in Figure 18.
32 Solomon, S., Intergovernmental Panel on Climate Change, and Intergovernmental Panel on Climate Change. Working Group I, “Climate Change 2007: the physical science basis: contribution of Working Group I to the Fourth Assessment Report of the Intergovernmental Panel on Climate Change,” Cambridge University Press, Cambridge; New York, 2007. 33 Aviation environment Portfolio Management Tool http://apmt.aero/.
NASA/CR—2010-216794/VOL1 23
200
220
240
260
280
300
320
1965 1975 1985 1995 2005 2015 2025 2035
Year
Cum
ulat
ive
EPN
db
Stage 2 - 1969
Stage 4 - 2006
Stage 3 - 1975
N+1
N+2
N+3
Figure 18: Cumulative noise restriction history for a B737-700 (150,000 lbs) class aircraft34
The LTO NOx target is constructed by NASA as a percent change from CAEP/6 levels. These ICAO engine standards are listed by in units of grams NOx produced per kN thrust over the ICAO reference landing and takeoff cycle. Accompanying these standards for each engine is also a value for NOx emissions index (EI) in units of grams NOx per kilogram of fuel burn.
.
For this study, the LTO NOx target was applied as a change in the NOx EI for all of the different engines in the emissions inventory. This change was only applied to NOx emissions below 3,000 feet, i.e. emissions in the landing-takeoff area. The 70% fuel burn reduction was applied to the full-flight fuel levels in the data and was translated to absolute reductions CO2, NOx, SOx, and non-volatile particulate matter through the use of constant emissions indices. Scenarios were created for each of the LTO NOx and fuel burn goals, and these were examined in relation to the baseline cases within APMT-Impacts.
The results of the analysis are presented in Figure 19. In the chart, the monetized environmental benefit of implementing the N+3 goals is broken down in terms of noise, air quality, and climate impact, each with a low, mid, and high estimate.
34 See Footnote 29.
NASA/CR—2010-216794/VOL1 24
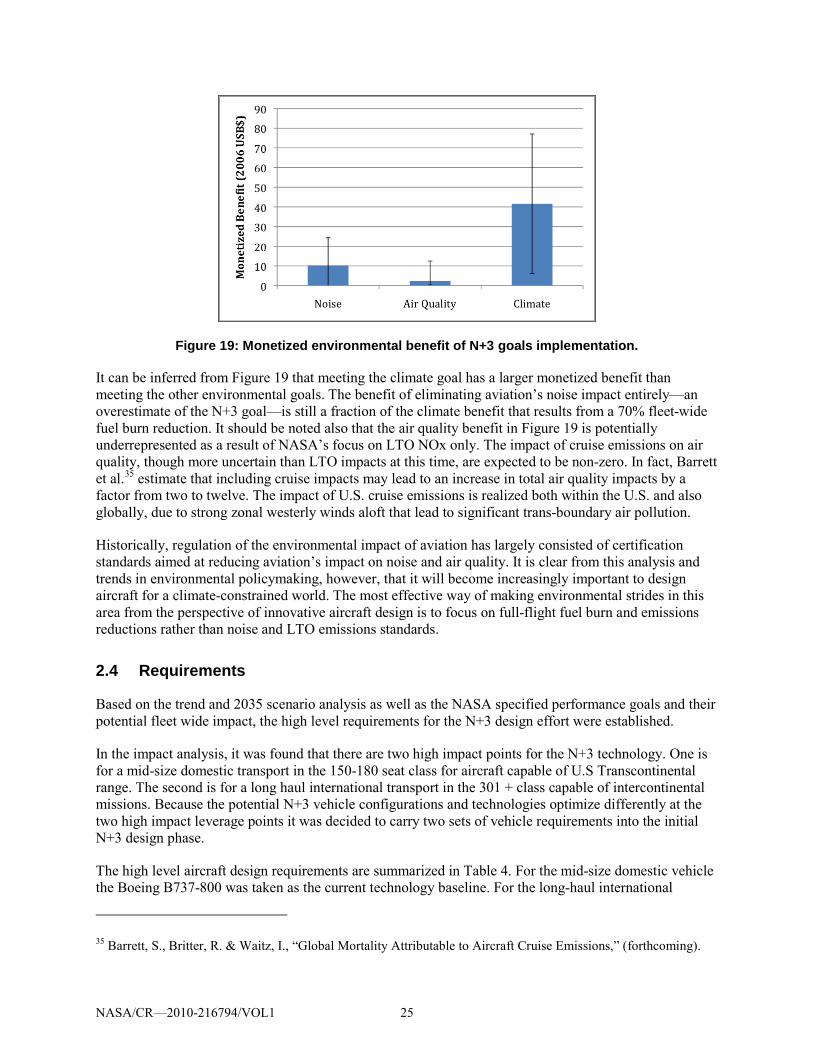
Figure 19: Monetized environmental benefit of N+3 goals implementation.
It can be inferred from Figure 19 that meeting the climate goal has a larger monetized benefit than meeting the other environmental goals. The benefit of eliminating aviation’s noise impact entirely—an overestimate of the N+3 goal—is still a fraction of the climate benefit that results from a 70% fleet-wide fuel burn reduction. It should be noted also that the air quality benefit in Figure 19 is potentially underrepresented as a result of NASA’s focus on LTO NOx only. The impact of cruise emissions on air quality, though more uncertain than LTO impacts at this time, are expected to be non-zero. In fact, Barrett et al.35
Historically, regulation of the environmental impact of aviation has largely consisted of certification standards aimed at reducing aviation’s impact on noise and air quality. It is clear from this analysis and trends in environmental policymaking, however, that it will become increasingly important to design aircraft for a climate-constrained world. The most effective way of making environmental strides in this area from the perspective of innovative aircraft design is to focus on full-flight fuel burn and emissions reductions rather than noise and LTO emissions standards.
estimate that including cruise impacts may lead to an increase in total air quality impacts by a factor from two to twelve. The impact of U.S. cruise emissions is realized both within the U.S. and also globally, due to strong zonal westerly winds aloft that lead to significant trans-boundary air pollution.
2.4 Requirements
Based on the trend and 2035 scenario analysis as well as the NASA specified performance goals and their potential fleet wide impact, the high level requirements for the N+3 design effort were established.
In the impact analysis, it was found that there are two high impact points for the N+3 technology. One is for a mid-size domestic transport in the 150-180 seat class for aircraft capable of U.S Transcontinental range. The second is for a long haul international transport in the 301 + class capable of intercontinental missions. Because the potential N+3 vehicle configurations and technologies optimize differently at the two high impact leverage points it was decided to carry two sets of vehicle requirements into the initial N+3 design phase.
The high level aircraft design requirements are summarized in Table 4. For the mid-size domestic vehicle the Boeing B737-800 was taken as the current technology baseline. For the long-haul international
35 Barrett, S., Britter, R. & Waitz, I., “Global Mortality Attributable to Aircraft Cruise Emissions,” (forthcoming).
NASA/CR—2010-216794/VOL1 25
vehicle the Boeing B777-200LR was used as the current technology baseline. More discussion on the individual requirements is included below.
Table 4: Design Requirements Summary
Mid-Sized Domestic Vehicle Long-Haul International Vehicle
Capacity 180 passengers 350 passengers Design Range 3000 nm 7600 nm Speed greater than Mach 0.72 greater than Mach 0.8 Runway Length 5,000 ft balanced field 9,000 ft balanced field Noise At least 71 EPNdB cumulative reduction below FAA
Stage 4 At most 55 dB LDN at average airport boundary
Fuel Burn 70% below baseline aircraft NOx 75% below CAEP 6 Compliance FAA and JAA safety standards, NextGen compatibility
2.4.1 Vehicle Capacity
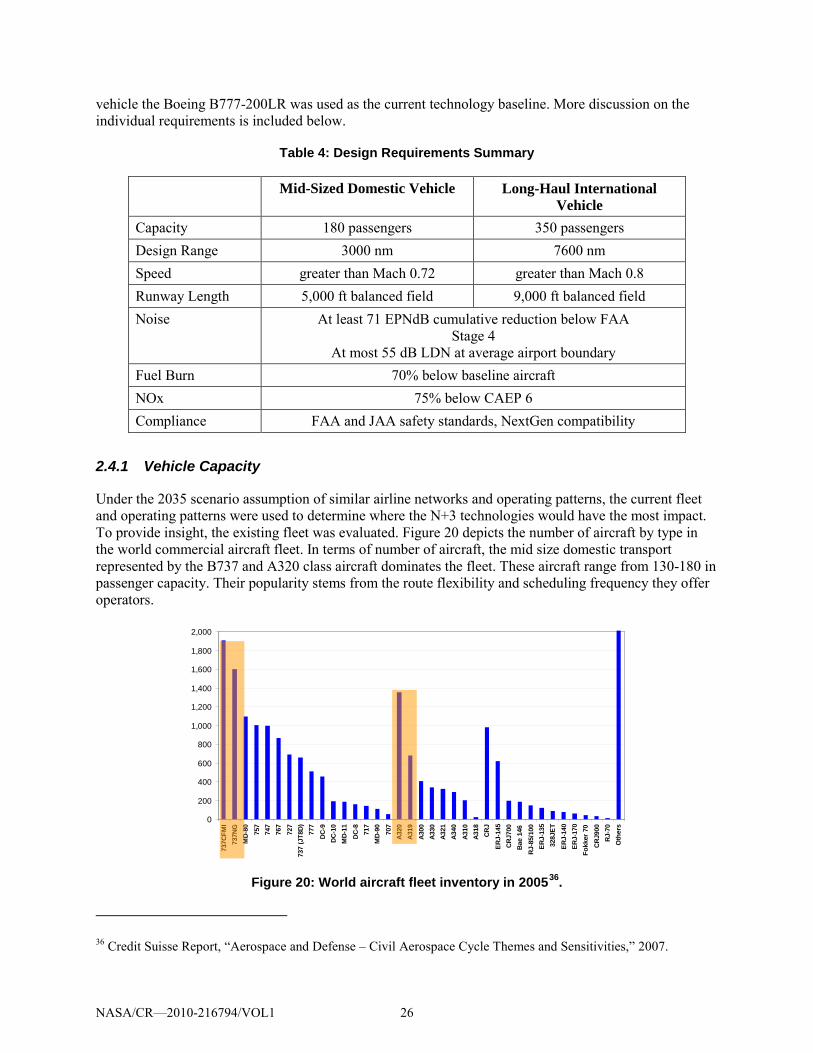
Under the 2035 scenario assumption of similar airline networks and operating patterns, the current fleet and operating patterns were used to determine where the N+3 technologies would have the most impact. To provide insight, the existing fleet was evaluated. Figure 20 depicts the number of aircraft by type in the world commercial aircraft fleet. In terms of number of aircraft, the mid size domestic transport represented by the B737 and A320 class aircraft dominates the fleet. These aircraft range from 130-180 in passenger capacity. Their popularity stems from the route flexibility and scheduling frequency they offer operators.
Figure 20: World aircraft fleet inventory in 200536
36 Credit Suisse Report, “Aerospace and Defense – Civil Aerospace Cycle Themes and Sensitivities,” 2007.
.
0
200
400
600
800
1,000
1,200
1,400
1,600
1,800
2,000
737C
FMI
737N
GM
D-80 757
747
767
727
737
(JT8
D) 777
DC-9
DC-1
0M
D-11
DC-8
717
MD-
90 707
A320
A319
A300
A330
A321
A340
A310
A318
CRJ
ERJ-
145
CRJ7
00Ba
e 14
6RJ
-85/
100
ERJ-
135
328J
ETER
J-14
0ER
J-17
0Fo
kker
70
CRJ9
00RJ
-70
Oth
ers
NASA/CR—2010-216794/VOL1 26
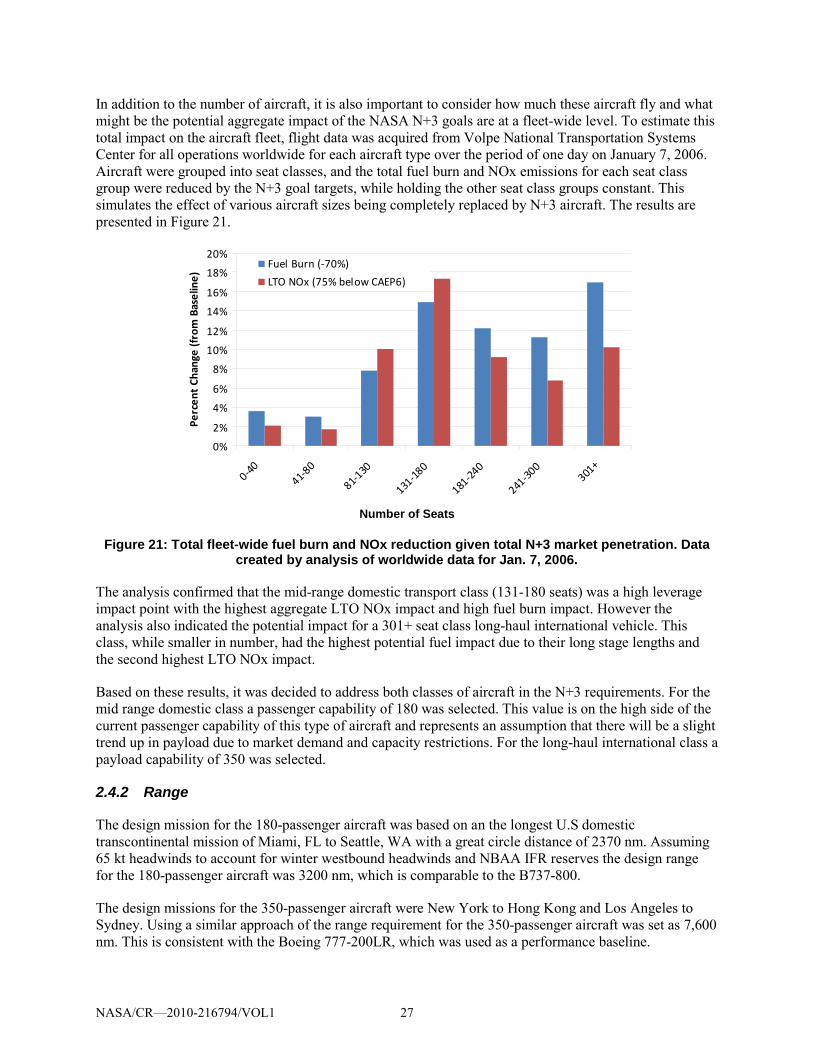
In addition to the number of aircraft, it is also important to consider how much these aircraft fly and what might be the potential aggregate impact of the NASA N+3 goals are at a fleet-wide level. To estimate this total impact on the aircraft fleet, flight data was acquired from Volpe National Transportation Systems Center for all operations worldwide for each aircraft type over the period of one day on January 7, 2006. Aircraft were grouped into seat classes, and the total fuel burn and NOx emissions for each seat class group were reduced by the N+3 goal targets, while holding the other seat class groups constant. This simulates the effect of various aircraft sizes being completely replaced by N+3 aircraft. The results are presented in Figure 21.
0%
2%
4%
6%
8%
10%
12%
14%
16%
18%
20%
0-4041-8
0
81-130
131-18
0
181-24
0
241-30
0301
+
Perc
ent
Chan
ge (f
rom
Bas
elin
e)
Fuel Burn (-70%)
LTO NOx (75% below CAEP6)
Number of Seats
Figure 21: Total fleet-wide fuel burn and NOx reduction given total N+3 market penetration. Data created by analysis of worldwide data for Jan. 7, 2006.
The analysis confirmed that the mid-range domestic transport class (131-180 seats) was a high leverage impact point with the highest aggregate LTO NOx impact and high fuel burn impact. However the analysis also indicated the potential impact for a 301+ seat class long-haul international vehicle. This class, while smaller in number, had the highest potential fuel impact due to their long stage lengths and the second highest LTO NOx impact.
Based on these results, it was decided to address both classes of aircraft in the N+3 requirements. For the mid range domestic class a passenger capability of 180 was selected. This value is on the high side of the current passenger capability of this type of aircraft and represents an assumption that there will be a slight trend up in payload due to market demand and capacity restrictions. For the long-haul international class a payload capability of 350 was selected.
2.4.2 Range
The design mission for the 180-passenger aircraft was based on an the longest U.S domestic transcontinental mission of Miami, FL to Seattle, WA with a great circle distance of 2370 nm. Assuming 65 kt headwinds to account for winter westbound headwinds and NBAA IFR reserves the design range for the 180-passenger aircraft was 3200 nm, which is comparable to the B737-800.
The design missions for the 350-passenger aircraft were New York to Hong Kong and Los Angeles to Sydney. Using a similar approach of the range requirement for the 350-passenger aircraft was set as 7,600 nm. This is consistent with the Boeing 777-200LR, which was used as a performance baseline.
NASA/CR—2010-216794/VOL1 27
2.4.3 Cruise Speed
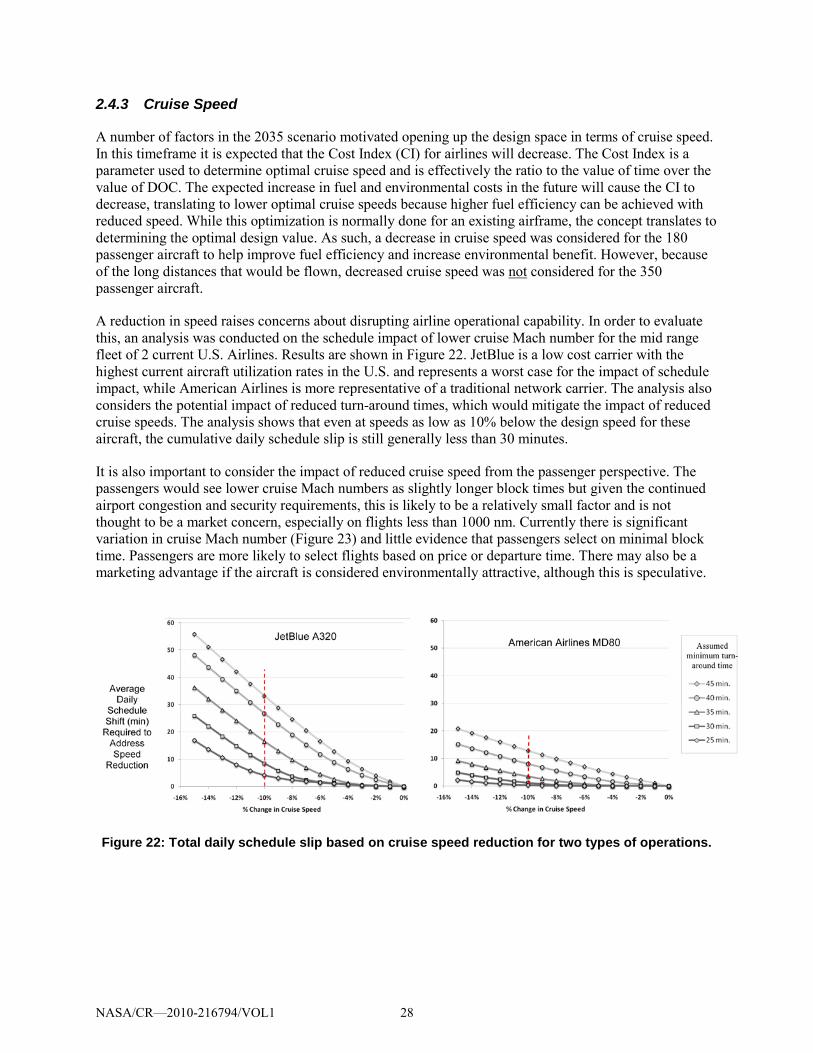
A number of factors in the 2035 scenario motivated opening up the design space in terms of cruise speed. In this timeframe it is expected that the Cost Index (CI) for airlines will decrease. The Cost Index is a parameter used to determine optimal cruise speed and is effectively the ratio to the value of time over the value of DOC. The expected increase in fuel and environmental costs in the future will cause the CI to decrease, translating to lower optimal cruise speeds because higher fuel efficiency can be achieved with reduced speed. While this optimization is normally done for an existing airframe, the concept translates to determining the optimal design value. As such, a decrease in cruise speed was considered for the 180 passenger aircraft to help improve fuel efficiency and increase environmental benefit. However, because of the long distances that would be flown, decreased cruise speed was not considered for the 350 passenger aircraft.
A reduction in speed raises concerns about disrupting airline operational capability. In order to evaluate this, an analysis was conducted on the schedule impact of lower cruise Mach number for the mid range fleet of 2 current U.S. Airlines. Results are shown in Figure 22. JetBlue is a low cost carrier with the highest current aircraft utilization rates in the U.S. and represents a worst case for the impact of schedule impact, while American Airlines is more representative of a traditional network carrier. The analysis also considers the potential impact of reduced turn-around times, which would mitigate the impact of reduced cruise speeds. The analysis shows that even at speeds as low as 10% below the design speed for these aircraft, the cumulative daily schedule slip is still generally less than 30 minutes.
It is also important to consider the impact of reduced cruise speed from the passenger perspective. The passengers would see lower cruise Mach numbers as slightly longer block times but given the continued airport congestion and security requirements, this is likely to be a relatively small factor and is not thought to be a market concern, especially on flights less than 1000 nm. Currently there is significant variation in cruise Mach number (Figure 23) and little evidence that passengers select on minimal block time. Passengers are more likely to select flights based on price or departure time. There may also be a marketing advantage if the aircraft is considered environmentally attractive, although this is speculative.
Figure 22: Total daily schedule slip based on cruise speed reduction for two types of operations.
NASA/CR—2010-216794/VOL1 28
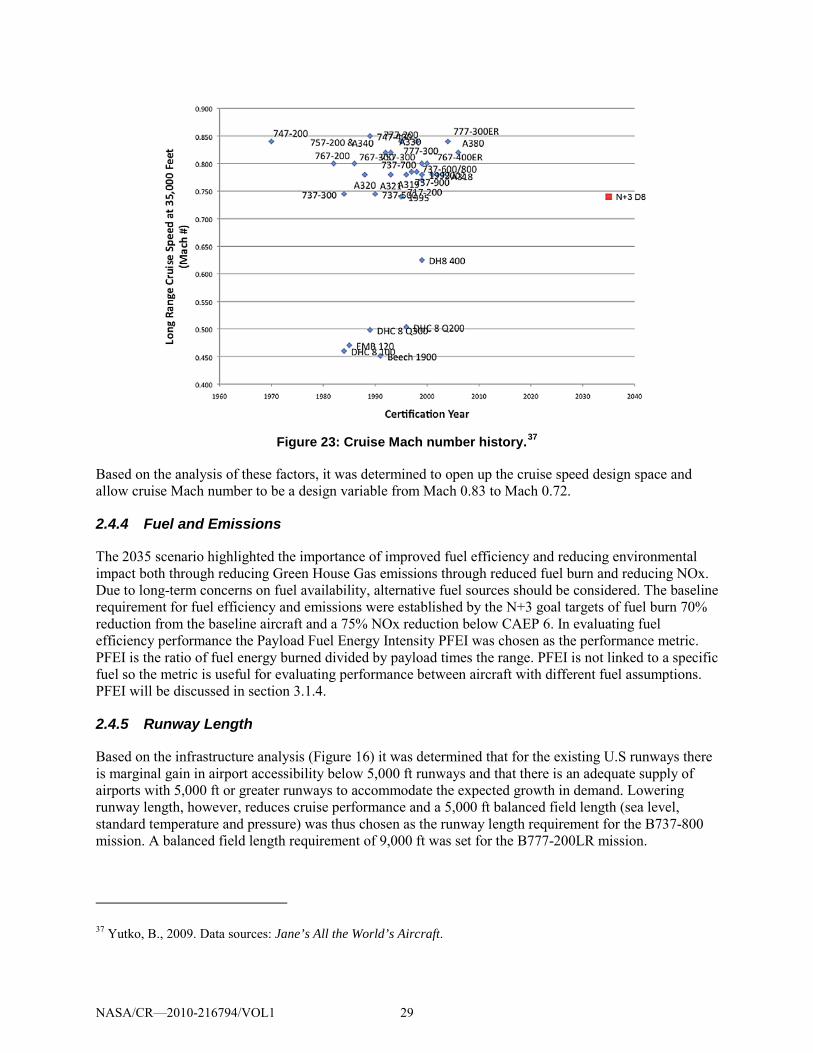
Figure 23: Cruise Mach number history.37
Based on the analysis of these factors, it was determined to open up the cruise speed design space and allow cruise Mach number to be a design variable from Mach 0.83 to Mach 0.72.
2.4.4 Fuel and Emissions
The 2035 scenario highlighted the importance of improved fuel efficiency and reducing environmental impact both through reducing Green House Gas emissions through reduced fuel burn and reducing NOx. Due to long-term concerns on fuel availability, alternative fuel sources should be considered. The baseline requirement for fuel efficiency and emissions were established by the N+3 goal targets of fuel burn 70% reduction from the baseline aircraft and a 75% NOx reduction below CAEP 6. In evaluating fuel efficiency performance the Payload Fuel Energy Intensity PFEI was chosen as the performance metric. PFEI is the ratio of fuel energy burned divided by payload times the range. PFEI is not linked to a specific fuel so the metric is useful for evaluating performance between aircraft with different fuel assumptions. PFEI will be discussed in section 3.1.4.
2.4.5 Runway Length
Based on the infrastructure analysis (Figure 16) it was determined that for the existing U.S runways there is marginal gain in airport accessibility below 5,000 ft runways and that there is an adequate supply of airports with 5,000 ft or greater runways to accommodate the expected growth in demand. Lowering runway length, however, reduces cruise performance and a 5,000 ft balanced field length (sea level, standard temperature and pressure) was thus chosen as the runway length requirement for the B737-800 mission. A balanced field length requirement of 9,000 ft was set for the B777-200LR mission.
37 Yutko, B., 2009. Data sources: Jane’s All the World’s Aircraft.
NASA/CR—2010-216794/VOL1 29

2.4.6 Noise
Noise performance will influence the airport accessibility and community response to airport operations. The 2035 scenario expects expansion into secondary airports where there are limited turbine and air carrier operations so it will be important to minimize the noise footprint. The N+3 goals specify a requirement of 71 EPNdB Cumulative below FAA Stage 4 noise limits, as well as a day-night sound level (LDN) of 55 dB or less at the average airport boundary.
2.4.7 Safety
The aircraft will be required to meet or exceed the FAA and JAA certification standards in the 2035 timeframe, which are expected to be more stringent than current certification standards.
2.4.8 Other
NextGen is assumed to be fully implemented by the 2035 timeframe so the N+3 aircraft should be fully compliant with NextGen requirements and be optimized for the NextGen operating environment of Optimal Profile Descents, 4D trajectory management, close parallel approaches, as well as other emergent Operational Concepts.
Because airport capacity will continue to be limited in the 2035 scenario, a desirable requirement would be to reduce the required vortex separation for the N+3 aircraft either by reducing the vehicle wake or reducing the vulnerability of the N+3 aircraft to wake encounters.
NASA/CR—2010-216794/VOL1 30
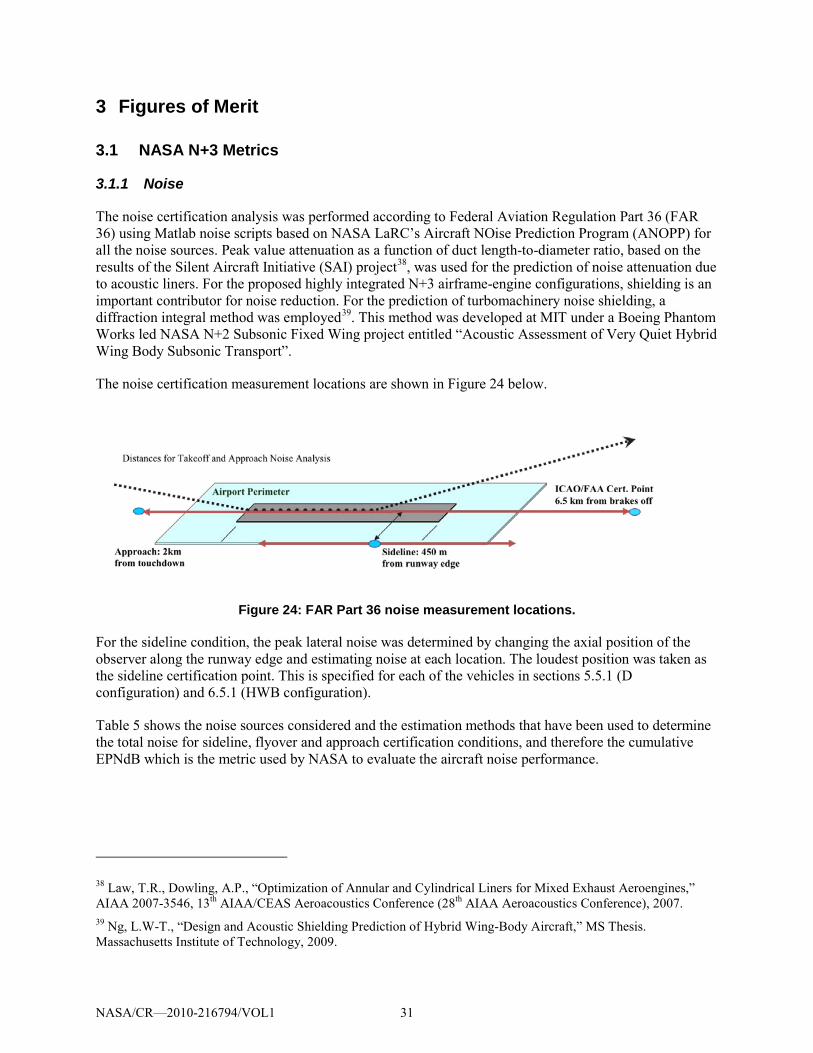
3 Figures of Merit
3.1 NASA N+3 Metrics
3.1.1 Noise
The noise certification analysis was performed according to Federal Aviation Regulation Part 36 (FAR 36) using Matlab noise scripts based on NASA LaRC’s Aircraft NOise Prediction Program (ANOPP) for all the noise sources. Peak value attenuation as a function of duct length-to-diameter ratio, based on the results of the Silent Aircraft Initiative (SAI) project38, was used for the prediction of noise attenuation due to acoustic liners. For the proposed highly integrated N+3 airframe-engine configurations, shielding is an important contributor for noise reduction. For the prediction of turbomachinery noise shielding, a diffraction integral method was employed39
The noise certification measurement locations are shown in
. This method was developed at MIT under a Boeing Phantom Works led NASA N+2 Subsonic Fixed Wing project entitled “Acoustic Assessment of Very Quiet Hybrid Wing Body Subsonic Transport”.
Figure 24 below.
Figure 24: FAR Part 36 noise measurement locations.
For the sideline condition, the peak lateral noise was determined by changing the axial position of the observer along the runway edge and estimating noise at each location. The loudest position was taken as the sideline certification point. This is specified for each of the vehicles in sections 5.5.1 (D configuration) and 6.5.1 (HWB configuration).
Table 5 shows the noise sources considered and the estimation methods that have been used to determine the total noise for sideline, flyover and approach certification conditions, and therefore the cumulative EPNdB which is the metric used by NASA to evaluate the aircraft noise performance.
38 Law, T.R., Dowling, A.P., “Optimization of Annular and Cylindrical Liners for Mixed Exhaust Aeroengines,” AIAA 2007-3546, 13th AIAA/CEAS Aeroacoustics Conference (28th AIAA Aeroacoustics Conference), 2007. 39 Ng, L.W-T., “Design and Acoustic Shielding Prediction of Hybrid Wing-Body Aircraft,” MS Thesis. Massachusetts Institute of Technology, 2009.
NASA/CR—2010-216794/VOL1 31
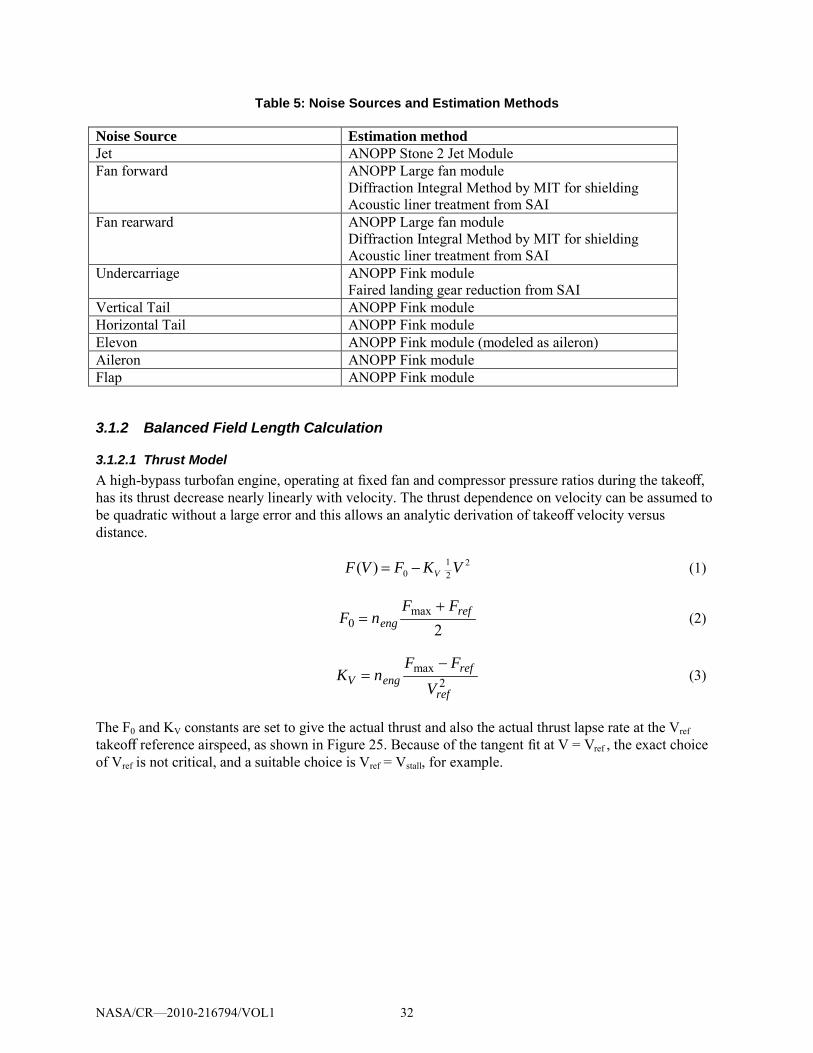
Table 5: Noise Sources and Estimation Methods
Noise Source Estimation method Jet ANOPP Stone 2 Jet Module Fan forward ANOPP Large fan module
Diffraction Integral Method by MIT for shielding Acoustic liner treatment from SAI
Fan rearward ANOPP Large fan module Diffraction Integral Method by MIT for shielding Acoustic liner treatment from SAI
Undercarriage ANOPP Fink module Faired landing gear reduction from SAI
Vertical Tail ANOPP Fink module Horizontal Tail ANOPP Fink module Elevon ANOPP Fink module (modeled as aileron) Aileron ANOPP Fink module Flap ANOPP Fink module
3.1.2 Balanced Field Length Calculation
3.1.2.1 Thrust Model A high-bypass turbofan engine, operating at fixed fan and compressor pressure ratios during the takeoff, has its thrust decrease nearly linearly with velocity. The thrust dependence on velocity can be assumed to be quadratic without a large error and this allows an analytic derivation of takeoff velocity versus distance.
F(V ) = F0 − KV12 V 2 (1)
F0 = nengFmax + Fref
2 (2)
KV = nengFmax − Fref
Vref2 (3)
The F0 and KV constants are set to give the actual thrust and also the actual thrust lapse rate at the Vref takeoff reference airspeed, as shown in Figure 25. Because of the tangent fit at V = Vref , the exact choice of Vref is not critical, and a suitable choice is Vref = Vstall, for example.
NASA/CR—2010-216794/VOL1 32
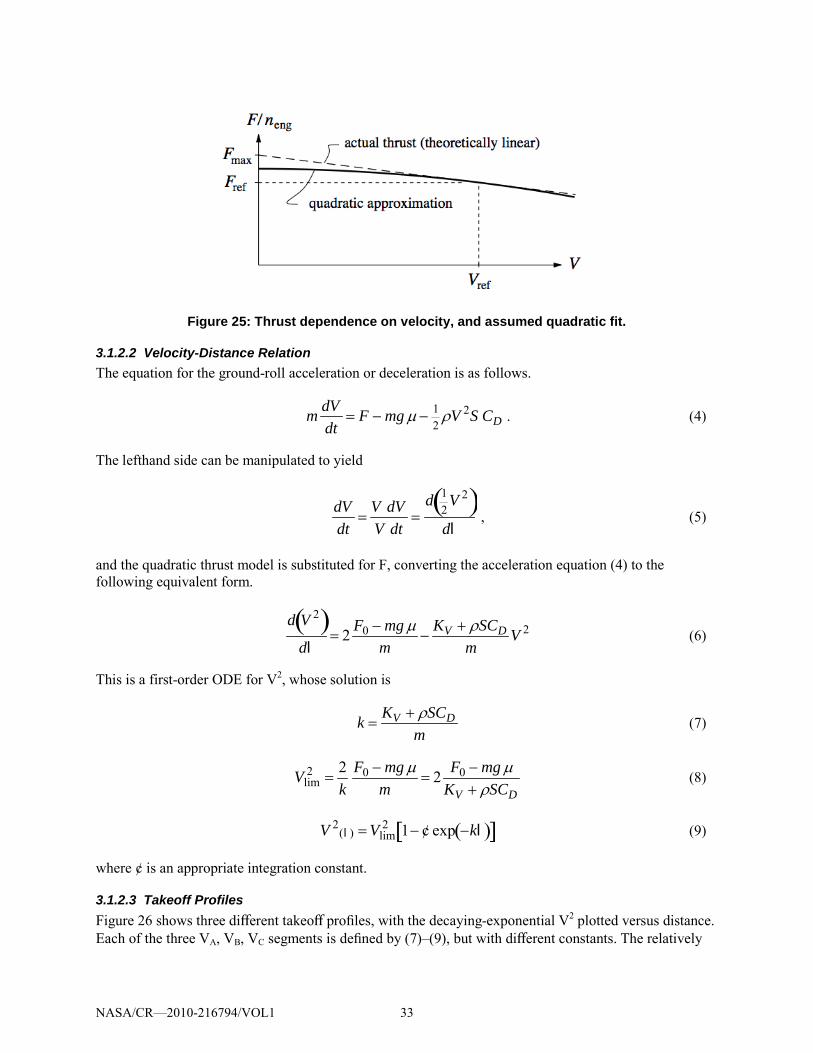
Figure 25: Thrust dependence on velocity, and assumed quadratic fit.
3.1.2.2 Velocity-Distance Relation The equation for the ground-roll acceleration or deceleration is as follows.
m dVdt
= F − mg µ − 12
ρV 2S CD . (4)
The lefthand side can be manipulated to yield
dVdt
=V dVV dt
=d 1
2V 2( )
dl , (5)
and the quadratic thrust model is substituted for F, converting the acceleration equation (4) to the following equivalent form.
d V 2( )dl
= 2 F0 − mg µm
−KV + ρSCD
mV 2 (6)
This is a first-order ODE for V2, whose solution is
k =KV + ρSCD
m (7)
Vlim2 =
2k
F0 − mg µm
= 2 F0 − mg µKV + ρSCD
(8)
V 2(l ) = Vlim
2 1− ¢ exp −kl( )[ ] (9)
where ¢ is an appropriate integration constant.
3.1.2.3 Takeoff Profiles Figure 26 shows three different takeoff profiles, with the decaying-exponential V2 plotted versus distance. Each of the three VA, VB, VC segments is defined by (7)–(9), but with different constants. The relatively
NASA/CR—2010-216794/VOL1 33
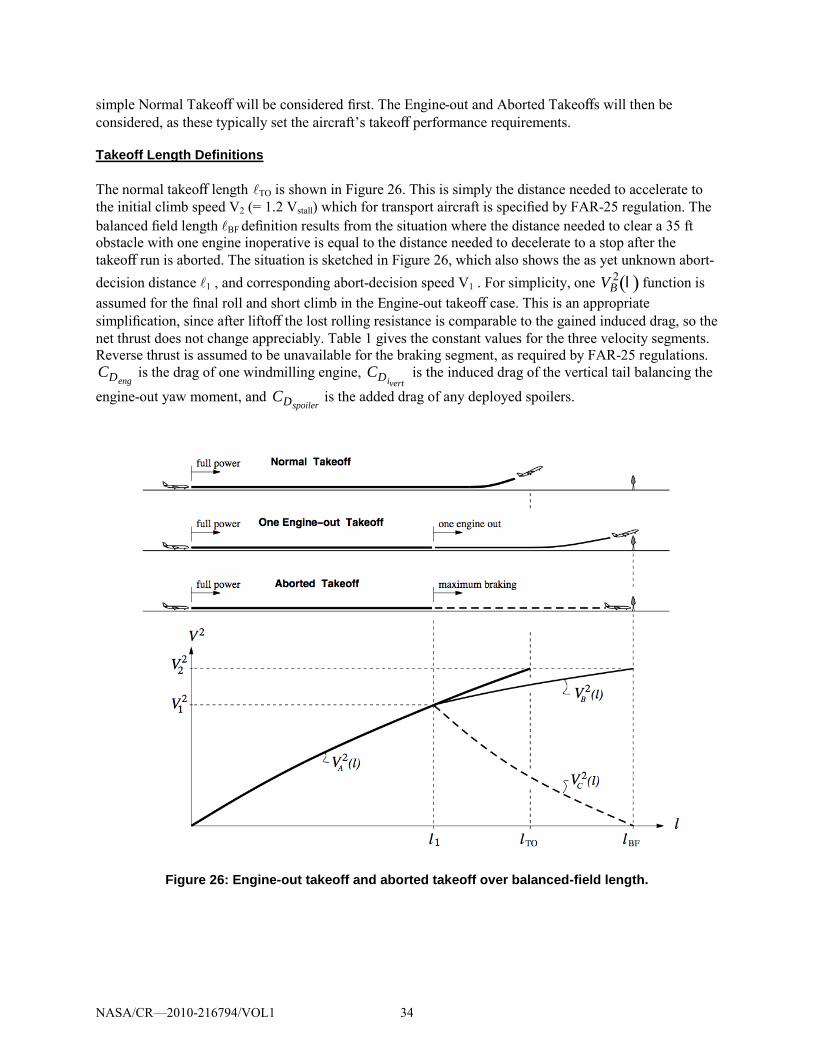
simple Normal Takeoff will be considered first. The Engine-out and Aborted Takeoffs will then be considered, as these typically set the aircraft’s takeoff performance requirements.
Takeoff Length Definitions
The normal takeoff lengthTO is shown in Figure 26. This is simply the distance needed to accelerate to the initial climb speed V2 (= 1.2 Vstall) which for transport aircraft is specified by FAR-25 regulation. The balanced field length BF definition results from the situation where the distance needed to clear a 35 ft obstacle with one engine inoperative is equal to the distance needed to decelerate to a stop after the takeoff run is aborted. The situation is sketched in Figure 26, which also shows the as yet unknown abort-decision distance 1 , and corresponding abort-decision speed V1 . For simplicity, one
VB2 l( ) function is
assumed for the final roll and short climb in the Engine-out takeoff case. This is an appropriate simplification, since after liftoff the lost rolling resistance is comparable to the gained induced drag, so the net thrust does not change appreciably. Table 1 gives the constant values for the three velocity segments. Reverse thrust is assumed to be unavailable for the braking segment, as required by FAR-25 regulations.
CDeng is the drag of one windmilling engine,
CDivert is the induced drag of the vertical tail balancing the
engine-out yaw moment, and
CDspoiler is the added drag of any deployed spoilers.
Figure 26: Engine-out takeoff and aborted takeoff over balanced-field length.
NASA/CR—2010-216794/VOL1 34
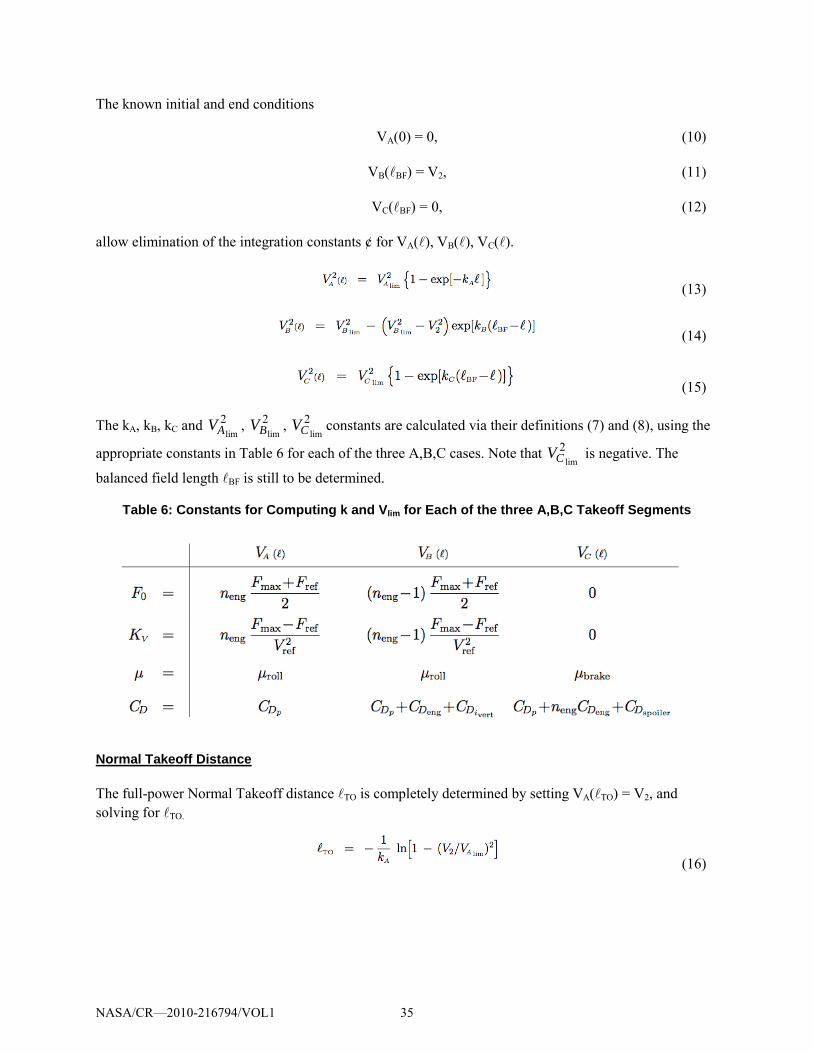
The known initial and end conditions
VA(0) = 0, (10)
VB(BF) = V2, (11)
VC(BF) = 0, (12)
allow elimination of the integration constants ¢ for VA(), VB(), VC().
(13)
(14)
(15)
The kA, kB, kC and
VAlim2 ,
VBlim2 ,
VC lim2 constants are calculated via their definitions (7) and (8), using the
appropriate constants in Table 6 for each of the three A,B,C cases. Note that
VC lim2 is negative. The
balanced field length BF is still to be determined.
Table 6: Constants for Computing k and Vlim for Each of the three A,B,C Takeoff Segments
Normal Takeoff Distance
The full-power Normal Takeoff distance TO is completely determined by setting VA(TO) = V2, and solving for TO.
(16)
NASA/CR—2010-216794/VOL1 35
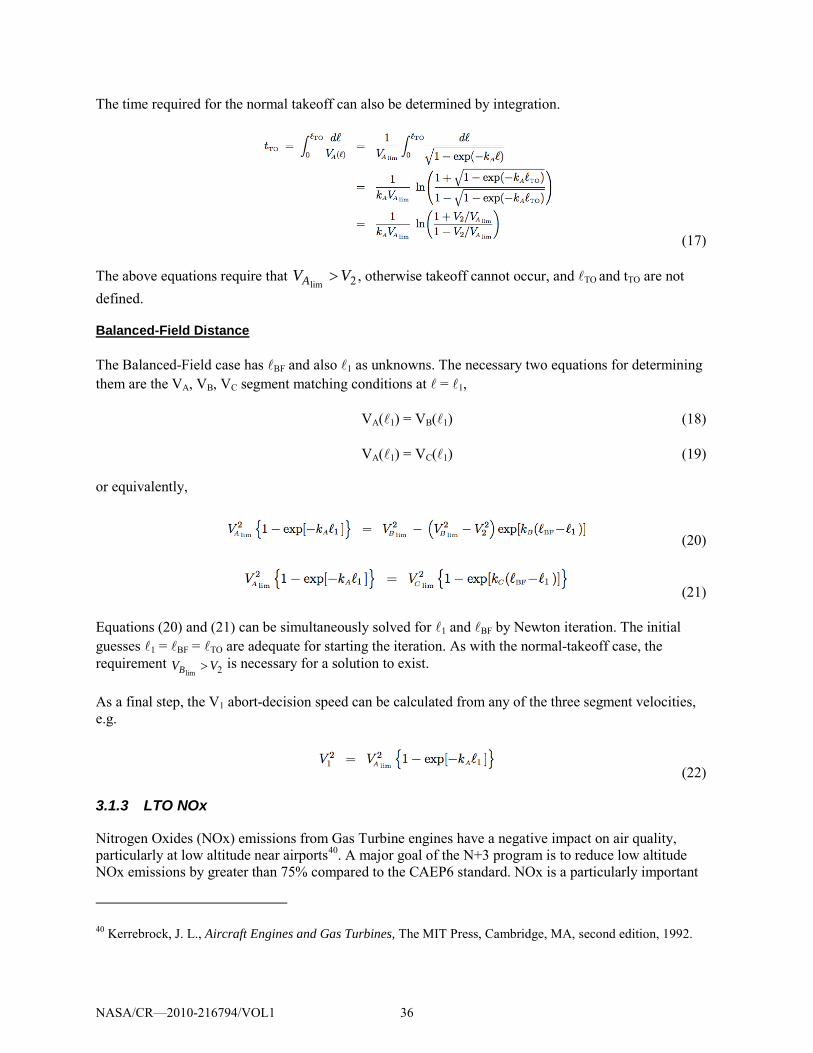
The time required for the normal takeoff can also be determined by integration.
(17)
The above equations require that
VAlim> V2, otherwise takeoff cannot occur, and TO and tTO are not
defined.
Balanced-Field Distance
The Balanced-Field case has BF and also 1 as unknowns. The necessary two equations for determining them are the VA, VB, VC segment matching conditions at = 1,
VA(1) = VB(1) (18)
VA(1) = VC(1) (19)
or equivalently,
(20)
(21)
Equations (20) and (21) can be simultaneously solved for 1 and BF by Newton iteration. The initial guesses 1 = BF = TO are adequate for starting the iteration. As with the normal-takeoff case, the requirement
VBlim> V2 is necessary for a solution to exist.
As a final step, the V1 abort-decision speed can be calculated from any of the three segment velocities, e.g.
(22)
3.1.3 LTO NOx
Nitrogen Oxides (NOx) emissions from Gas Turbine engines have a negative impact on air quality, particularly at low altitude near airports40
40 Kerrebrock, J. L., Aircraft Engines and Gas Turbines, The MIT Press, Cambridge, MA, second edition, 1992.
. A major goal of the N+3 program is to reduce low altitude NOx emissions by greater than 75% compared to the CAEP6 standard. NOx is a particularly important
NASA/CR—2010-216794/VOL1 36
pollutant to regulate because unlike other harmful gas turbine emissions, NOx production is unrelated to the fuel efficiency of the engine. Other pollutants, such as unburned hydrocarbons and overall carbon output are directly related to the amount of fuel burned in the engine and therefore benefit from the pressure to reduce fuel burn. New technologies, such as higher pressure ratios and more efficient combustors that improve engine fuel burn, also reduce the emissions of fuel related pollutants. NOx emissions, however, are a function of combustor temperature, and can therefore be adversely affected by technologies designed to improve engine efficiency such as increased pressure ratio. Currently the most stringent NOx emission standards were set during the 6th meeting of the Committee on Aviation Environmental Protection (CAEP) for engines produced after 2007. The NOx standards are structured to even out the inherent differences in NOx production in different engine classes and types, so that all engine designers face a similarly challenging emissions target. These standards are expressed per-unit thrust (Dp/F∞) and are a function of overall pressure ratio (OPR) and engine thrust class. Engine emissions are measured on a static test stand during a simulated landing/takeoff (LTO) cycle in an effort to quantify the potential NOx impact from low altitude aircraft operation. The standards are 41
:
“for engines of a type or model of which the date of manufacture of the first individual production model was after 31 December 2007: 1) for engines with a pressure ratio of 30 or less:
i. for engines with a maximum rated thrust of more than 89.0 kN:
• Dp/Foo = 16.72 + 1.4080πoo
ii. for engines with a maximum rated thrust of more than 26.7 kN but not more than 89.0 kN:
• Dp/Foo = 38.5486 + 1.6823πoo
- 0.2453Foo - 0.00308
πoo x Foo
2) for engines with a pressure ratio of more than 30 but less than 82.6: i. for engines with a maximum rated thrust of more than 89.0 kN:
• Dp/Foo = -1.04 + 2.0πoo ii. for engines with a maximum rated thrust of more than 26.7 kN but not more than 89.0 kN:
• Dp/Foo = 46.1600 + 1.4286πoo
- 0.5303Foo +
0.00642πoo x Foo 3) for engines with a pressure ratio of 82.6 or more:
Dp/Foo = 32 + 1.6πoo
”
Where: Dp = mass of pollutant emitted during LTO cycle (g), Foo = rated thrust (kN), πoo = rated OPR
An important feature of the CAEP emissions standards is their airframe independence. Utilizing a standard static test cycle forces engine designers to reduce emissions through engine specific technology development, as opposed to taking credit for engine airframe interactions. For N+3 this regulatory approach does not fully capture the emissions benefit of the design concept because embedded propulsion systems lead to reductions in required thrust, irrespective of engine efficiency, and therefore reductions in NOx released in the atmosphere on a per passenger or per operation basis. Coupling the inherent emissions reduction from an N+3 airframe concept with the engine specific emissions reductions leads to a dramatic reduction in the overall environmental impact. The reported NOx reductions are specific to the
41 International Civil Aviation Organization, Annex 16 Volume II, Aircraft Engine Emissions, second edition, 1993, amended 2005.
NASA/CR—2010-216794/VOL1 37
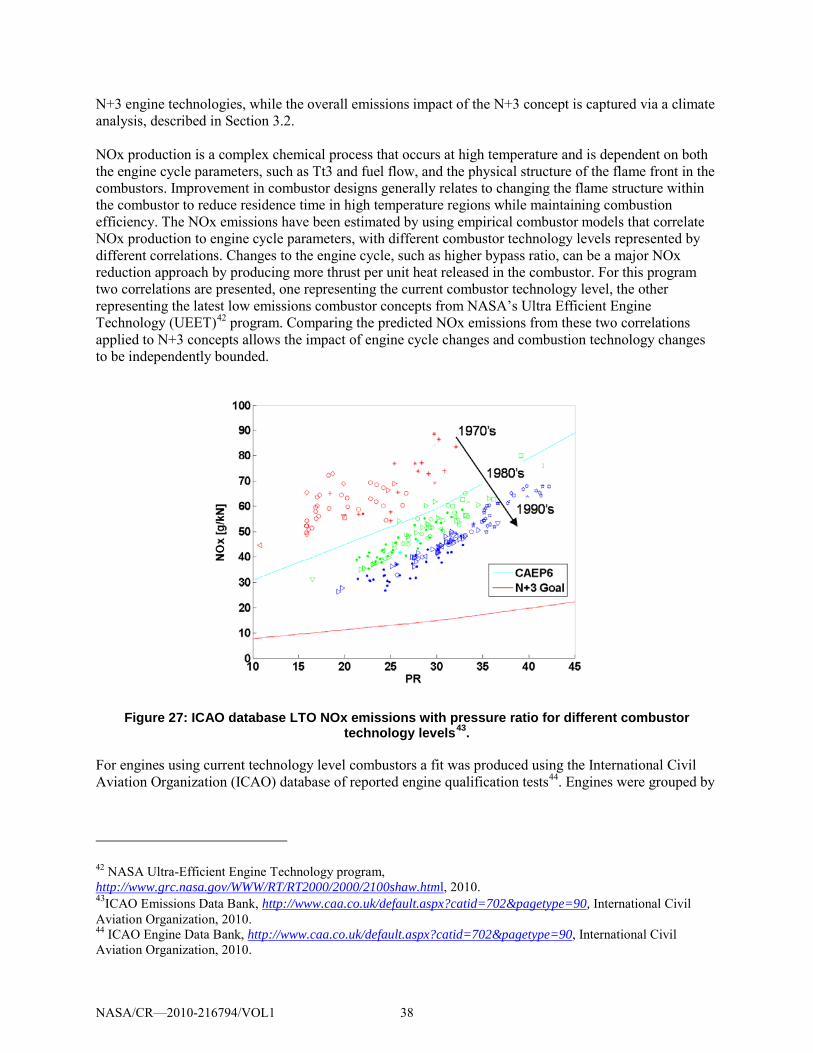
N+3 engine technologies, while the overall emissions impact of the N+3 concept is captured via a climate analysis, described in Section 3.2. NOx production is a complex chemical process that occurs at high temperature and is dependent on both the engine cycle parameters, such as Tt3 and fuel flow, and the physical structure of the flame front in the combustors. Improvement in combustor designs generally relates to changing the flame structure within the combustor to reduce residence time in high temperature regions while maintaining combustion efficiency. The NOx emissions have been estimated by using empirical combustor models that correlate NOx production to engine cycle parameters, with different combustor technology levels represented by different correlations. Changes to the engine cycle, such as higher bypass ratio, can be a major NOx reduction approach by producing more thrust per unit heat released in the combustor. For this program two correlations are presented, one representing the current combustor technology level, the other representing the latest low emissions combustor concepts from NASA’s Ultra Efficient Engine Technology (UEET)42
program. Comparing the predicted NOx emissions from these two correlations applied to N+3 concepts allows the impact of engine cycle changes and combustion technology changes to be independently bounded.
Figure 27: ICAO database LTO NOx emissions with pressure ratio for different combustor technology levels43
For engines using current technology level combustors a fit was produced using the International Civil Aviation Organization (ICAO) database of reported engine qualification tests
.
44
42 NASA Ultra-Efficient Engine Technology program,
. Engines were grouped by
http://www.grc.nasa.gov/WWW/RT/RT2000/2000/2100shaw.html, 2010. 43ICAO Emissions Data Bank, http://www.caa.co.uk/default.aspx?catid=702&pagetype=90, International Civil Aviation Organization, 2010. 44 ICAO Engine Data Bank, http://www.caa.co.uk/default.aspx?catid=702&pagetype=90, International Civil Aviation Organization, 2010.
NASA/CR—2010-216794/VOL1 38
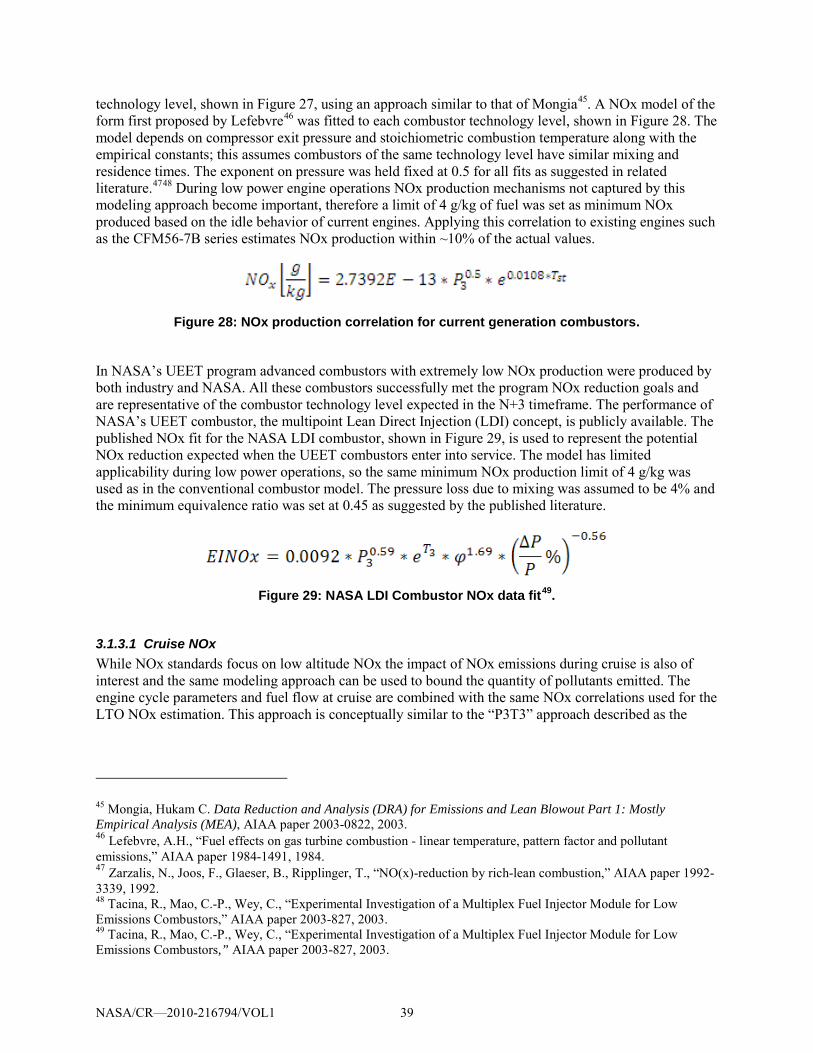
technology level, shown in Figure 27, using an approach similar to that of Mongia45. A NOx model of the form first proposed by Lefebvre46 was fitted to each combustor technology level, shown in Figure 28. The model depends on compressor exit pressure and stoichiometric combustion temperature along with the empirical constants; this assumes combustors of the same technology level have similar mixing and residence times. The exponent on pressure was held fixed at 0.5 for all fits as suggested in related literature.4748 During low power engine operations NOx production mechanisms not captured by this modeling approach become important, therefore a limit of 4 g/kg of fuel was set as minimum NOx produced based on the idle behavior of current engines. Applying this correlation to existing engines such as the CFM56-7B series estimates NOx production within ~10% of the actual values.
Figure 28: NOx production correlation for current generation combustors.
In NASA’s UEET program advanced combustors with extremely low NOx production were produced by both industry and NASA. All these combustors successfully met the program NOx reduction goals and are representative of the combustor technology level expected in the N+3 timeframe. The performance of NASA’s UEET combustor, the multipoint Lean Direct Injection (LDI) concept, is publicly available. The published NOx fit for the NASA LDI combustor, shown in Figure 29, is used to represent the potential NOx reduction expected when the UEET combustors enter into service. The model has limited applicability during low power operations, so the same minimum NOx production limit of 4 g/kg was used as in the conventional combustor model. The pressure loss due to mixing was assumed to be 4% and the minimum equivalence ratio was set at 0.45 as suggested by the published literature.
Figure 29: NASA LDI Combustor NOx data fit49
.
3.1.3.1 Cruise NOx While NOx standards focus on low altitude NOx the impact of NOx emissions during cruise is also of interest and the same modeling approach can be used to bound the quantity of pollutants emitted. The engine cycle parameters and fuel flow at cruise are combined with the same NOx correlations used for the LTO NOx estimation. This approach is conceptually similar to the “P3T3” approach described as the
45 Mongia, Hukam C. Data Reduction and Analysis (DRA) for Emissions and Lean Blowout Part 1: Mostly Empirical Analysis (MEA), AIAA paper 2003-0822, 2003. 46 Lefebvre, A.H., “Fuel effects on gas turbine combustion - linear temperature, pattern factor and pollutant emissions,” AIAA paper 1984-1491, 1984. 47 Zarzalis, N., Joos, F., Glaeser, B., Ripplinger, T., “NO(x)-reduction by rich-lean combustion,” AIAA paper 1992-3339, 1992. 48 Tacina, R., Mao, C.-P., Wey, C., “Experimental Investigation of a Multiplex Fuel Injector Module for Low Emissions Combustors,” AIAA paper 2003-827, 2003. 49 Tacina, R., Mao, C.-P., Wey, C., “Experimental Investigation of a Multiplex Fuel Injector Module for Low Emissions Combustors,” AIAA paper 2003-827, 2003.
NASA/CR—2010-216794/VOL1 39
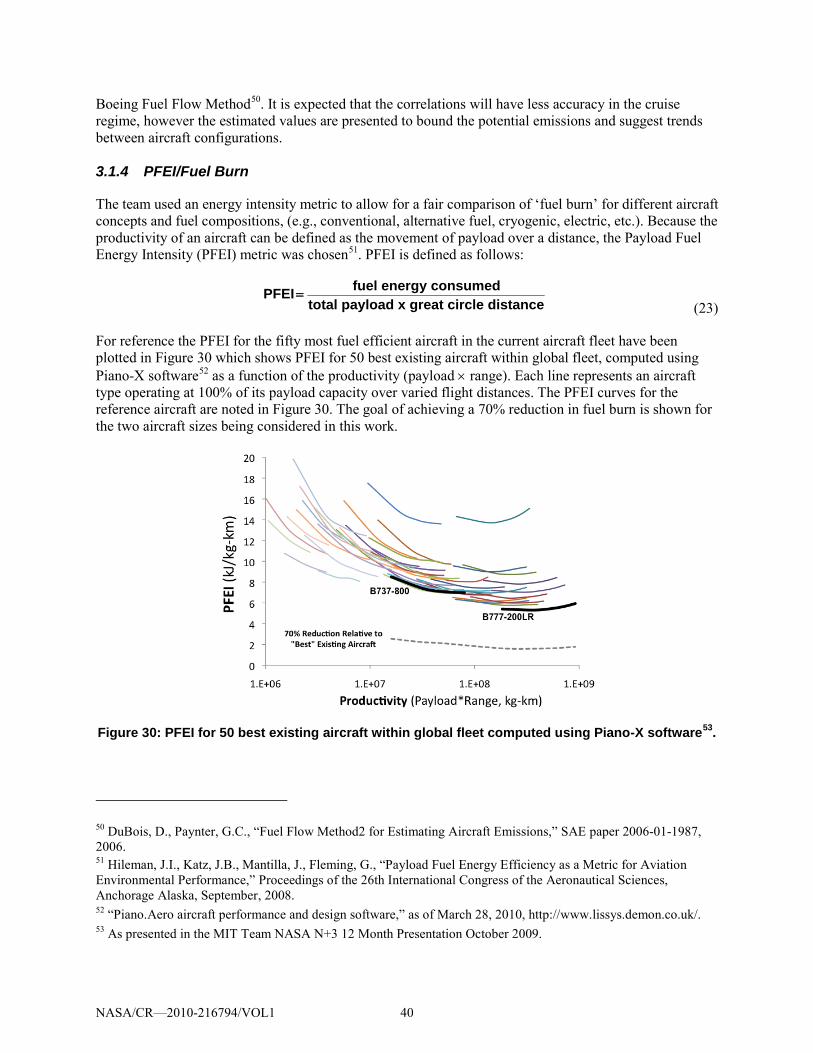
Boeing Fuel Flow Method50
. It is expected that the correlations will have less accuracy in the cruise regime, however the estimated values are presented to bound the potential emissions and suggest trends between aircraft configurations.
3.1.4 PFEI/Fuel Burn
The team used an energy intensity metric to allow for a fair comparison of ‘fuel burn’ for different aircraft concepts and fuel compositions, (e.g., conventional, alternative fuel, cryogenic, electric, etc.). Because the productivity of an aircraft can be defined as the movement of payload over a distance, the Payload Fuel Energy Intensity (PFEI) metric was chosen51
PFEI= fuel energy consumedtotal payload x great circle distance
. PFEI is defined as follows:
(23)
For reference the PFEI for the fifty most fuel efficient aircraft in the current aircraft fleet have been plotted in Figure 30 which shows PFEI for 50 best existing aircraft within global fleet, computed using Piano-X software52 as a function of the productivity (payload × range). Each line represents an aircraft type operating at 100% of its payload capacity over varied flight distances. The PFEI curves for the reference aircraft are noted in Figure 30. The goal of achieving a 70% reduction in fuel burn is shown for the two aircraft sizes being considered in this work.
Figure 30: PFEI for 50 best existing aircraft within global fleet computed using Piano-X software53
50 DuBois, D., Paynter, G.C., “Fuel Flow Method2 for Estimating Aircraft Emissions,” SAE paper 2006-01-1987, 2006.
.
51 Hileman, J.I., Katz, J.B., Mantilla, J., Fleming, G., “Payload Fuel Energy Efficiency as a Metric for Aviation Environmental Performance,” Proceedings of the 26th International Congress of the Aeronautical Sciences, Anchorage Alaska, September, 2008. 52 “Piano.Aero aircraft performance and design software,” as of March 28, 2010, http://www.lissys.demon.co.uk/. 53 As presented in the MIT Team NASA N+3 12 Month Presentation October 2009.
NASA/CR—2010-216794/VOL1 40
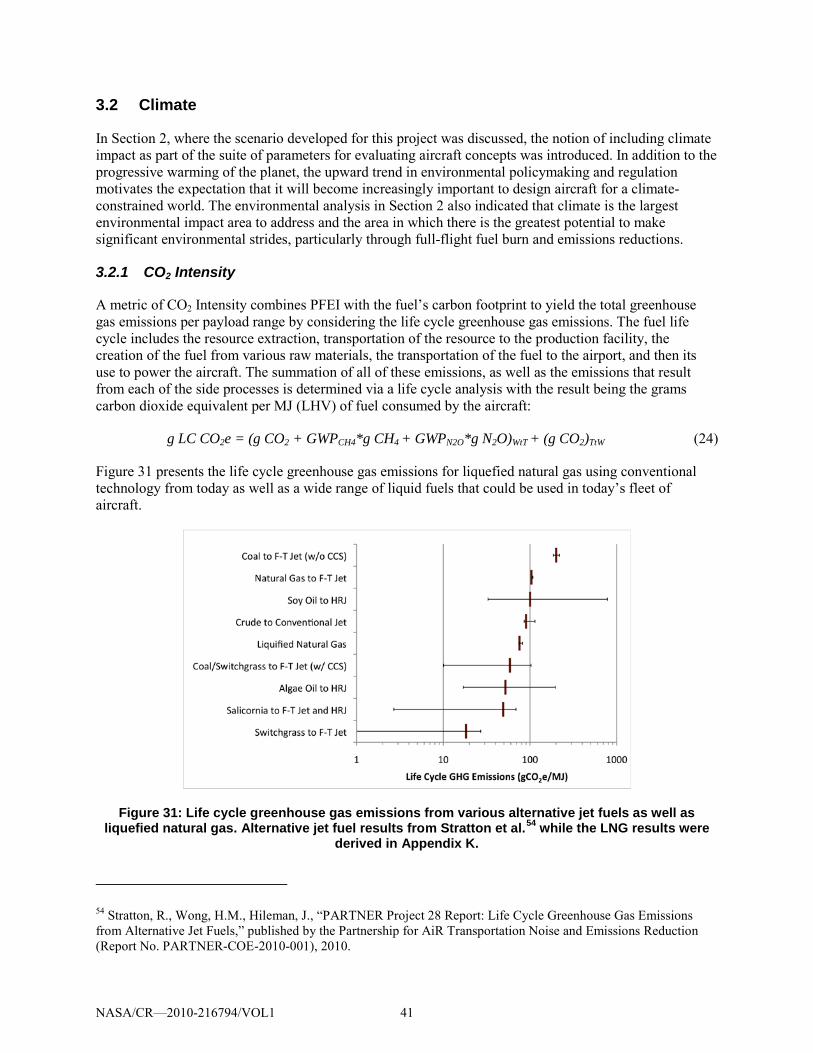
3.2 Climate
In Section 2, where the scenario developed for this project was discussed, the notion of including climate impact as part of the suite of parameters for evaluating aircraft concepts was introduced. In addition to the progressive warming of the planet, the upward trend in environmental policymaking and regulation motivates the expectation that it will become increasingly important to design aircraft for a climate-constrained world. The environmental analysis in Section 2 also indicated that climate is the largest environmental impact area to address and the area in which there is the greatest potential to make significant environmental strides, particularly through full-flight fuel burn and emissions reductions.
3.2.1 CO2 Intensity
A metric of CO2 Intensity combines PFEI with the fuel’s carbon footprint to yield the total greenhouse gas emissions per payload range by considering the life cycle greenhouse gas emissions. The fuel life cycle includes the resource extraction, transportation of the resource to the production facility, the creation of the fuel from various raw materials, the transportation of the fuel to the airport, and then its use to power the aircraft. The summation of all of these emissions, as well as the emissions that result from each of the side processes is determined via a life cycle analysis with the result being the grams carbon dioxide equivalent per MJ (LHV) of fuel consumed by the aircraft:
g LC CO2e = (g CO2 + GWPCH4*g CH4 + GWPN2O*g N2O)WtT + (g CO2)TtW (24)
Figure 31 presents the life cycle greenhouse gas emissions for liquefied natural gas using conventional technology from today as well as a wide range of liquid fuels that could be used in today’s fleet of aircraft.
Figure 31: Life cycle greenhouse gas emissions from various alternative jet fuels as well as liquefied natural gas. Alternative jet fuel results from Stratton et al.54
54 Stratton, R., Wong, H.M., Hileman, J., “PARTNER Project 28 Report: Life Cycle Greenhouse Gas Emissions from Alternative Jet Fuels,” published by the Partnership for AiR Transportation Noise and Emissions Reduction (Report No. PARTNER-COE-2010-001), 2010.
while the LNG results were derived in Appendix K.
NASA/CR—2010-216794/VOL1 41

The life Cycle CO2 Intensity combines life cycle CO2 emissions with PFEI:
LC-CO2I = (g LC CO2e/MJ) * (PFEI, MJ/kg-km) (25)
Using the life cycle GHG emissions of conventional jet fuel, as presented by Stratton et al.55, and the PFEI value from Figure 30, a fully loaded single aisle aircraft, such as the Boeing 737-800, produces roughly 0.6 g CO2e/kg-km. This can be compared to the 2005 fleetwide U.S. average value of 1.37 g CO2e/kg-km, which was computed using data from the U.S. Bureau of Transportation Statistics56
3.2.2 Global Delta Temperature Change
and the life cycle GHG emissions from Stratton et al.
To quantitatively assess the effects on climate, instead of simply accounting for an inventory, it is necessary to specify an appropriate climate metric. Using APMT-Impacts—an environmental impact modeling tool developed by MIT and funded by the FAA Office of Environment and Energy, NASA, and Transport Canada—the research team can look at the impact pathway of a unit of CO2 emissions on climate, as depicted in Figure 32.
55 Stratton, R., Wong, H.M., Hileman, J., “PARTNER Project 28 Report: Life Cycle Greenhouse Gas Emissions from Alternative Jet Fuels,” published by the Partnership for AiR Transportation Noise and Emissions Reduction (Report No. PARTNER-COE-2010-001), 2010. 56 U.S. Department of Transportation, Bureau of Transportation Statistics. Air Carrier Summary Data, Form 41 Schedule T-2 for 1991-2008. Washington DC: Department of Transportation.
NASA/CR—2010-216794/VOL1 42
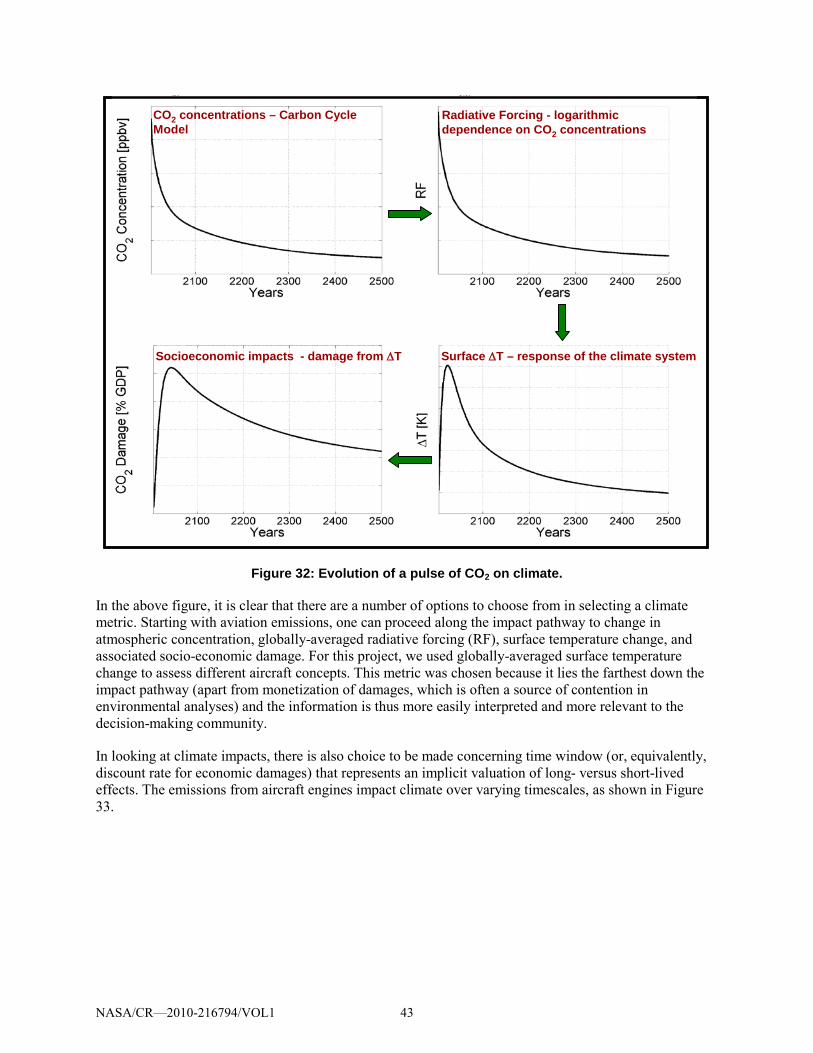
CO2 concentrations – Carbon Cycle Model
Radiative Forcing - logarithmic dependence on CO2 concentrations
Surface ∆T – response of the climate systemSocioeconomic impacts - damage from ∆T
CO2 concentrations – Carbon Cycle Model
Radiative Forcing - logarithmic dependence on CO2 concentrations
Surface ∆T – response of the climate systemSocioeconomic impacts - damage from ∆T
Figure 32: Evolution of a pulse of CO2 on climate.
In the above figure, it is clear that there are a number of options to choose from in selecting a climate metric. Starting with aviation emissions, one can proceed along the impact pathway to change in atmospheric concentration, globally-averaged radiative forcing (RF), surface temperature change, and associated socio-economic damage. For this project, we used globally-averaged surface temperature change to assess different aircraft concepts. This metric was chosen because it lies the farthest down the impact pathway (apart from monetization of damages, which is often a source of contention in environmental analyses) and the information is thus more easily interpreted and more relevant to the decision-making community.
In looking at climate impacts, there is also choice to be made concerning time window (or, equivalently, discount rate for economic damages) that represents an implicit valuation of long- versus short-lived effects. The emissions from aircraft engines impact climate over varying timescales, as shown in Figure 33.
NASA/CR—2010-216794/VOL1 43
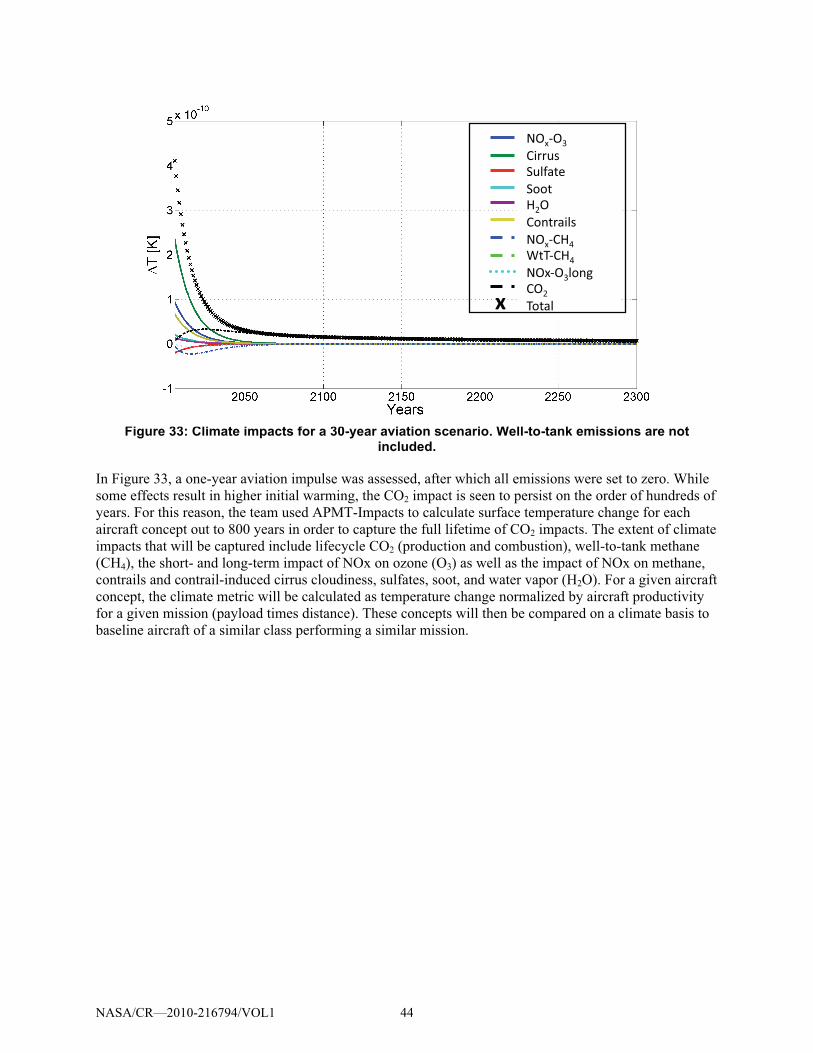
Figure 33: Climate impacts for a 30-year aviation scenario. Well-to-tank emissions are not included.
In Figure 33, a one-year aviation impulse was assessed, after which all emissions were set to zero. While
some effects result in higher initial warming, the CO2 impact is seen to persist on the order of hundreds of
years. For this reason, the team used APMT-Impacts to calculate surface temperature change for each
aircraft concept out to 800 years in order to capture the full lifetime of CO2 impacts. The extent of climate
impacts that will be captured include lifecycle CO2 (production and combustion), well-to-tank methane
(CH4), the short- and long-term impact of NOx on ozone (O3) as well as the impact of NOx on methane,
contrails and contrail-induced cirrus cloudiness, sulfates, soot, and water vapor (H2O). For a given aircraft
concept, the climate metric will be calculated as temperature change normalized by aircraft productivity
for a given mission (payload times distance). These concepts will then be compared on a climate basis to
baseline aircraft of a similar class performing a similar mission.
Fi 33 Cli t i t f 30 i ti i W ll t t k i i
����������� ������� ���������������������������������������������������������
NASA/CR—2010-216794/VOL1 44

4 Program Approach
4.1 Overall Process
The N+3 Phase 1 project was an 18 month collaborative effort between MIT, Aerodyne Research (for the
first year), Aurora Flight Sciences, and Pratt & Whitney. The overall program was structured to
accomplish the following tasks:
Task 1: Scenario Development
Task 2: Feasibility Assessment and Requirements Definition
Task 3: Operational Concept Definition
Task 4: Advanced Vehicle Conceptual Design
Task 5: Trade Studies
Task 6: Environmental, Economic, and Mobility Impact Assessment
Task 7: Credibility Establishment
Task 8: Pros/Cons Identification
Task 9: Risk Assessment and Development Challenge Identification
Task 10: Technology Roadmap Development
Task 11: Phase 2 Proposal Development
Task 12: Reviews
Task 13: Reporting
These thirteen tasks were grouped into process steps and organized into three primary phases of the
program:
� Development of requirement, tools, concepts, and metrics.
� Trade Studies: Including trading the combination of technologies and aircraft concepts, trading
the level of technology to use, as well as trading performance of the aircraft in regard to the
various metrics against each other.
� Performance assessment and Evaluation. This including evaluating the performance against the
baseline mission as well as evaluating the risk and technology maturation of each concept and
included technology.
The following are the different steps in the overall process followed to accomplish the program tasks:
Step 1: Determine a baseline reference aircraft that can be used as the basis of comparison for each of the
concepts generated.
Step 2: Establish a well-documented mission scenario (including aircraft requirements such as payload
capacity, range) to establish comparative parameters of the different aircraft concepts.
Step 3: Develop metrics and tools for designing and evaluating vastly different aircraft configurations
(architectures)
Step 4: Develop candidate technologies and concepts of the technologies that could have the greatest
impact in terms of the evaluated metrics
Step 5: Group the technologies into aircraft concepts that employ the most favorable technology concepts
Step 6: Evaluate aircraft performance using mission scenario from Step 2
Step 7: Compare and contrast aircraft concepts based on program objectives and metrics
Although the list captures the steps, what is not captured in any sequential listing is the degree of iteration
that is needed in a design process with four metrics and with a number of design constraints that must be
closed. Figure 34 thus shows a more realistic (and more complex) view of the process. In addition to the
NASA/CR—2010-216794/VOL1 45
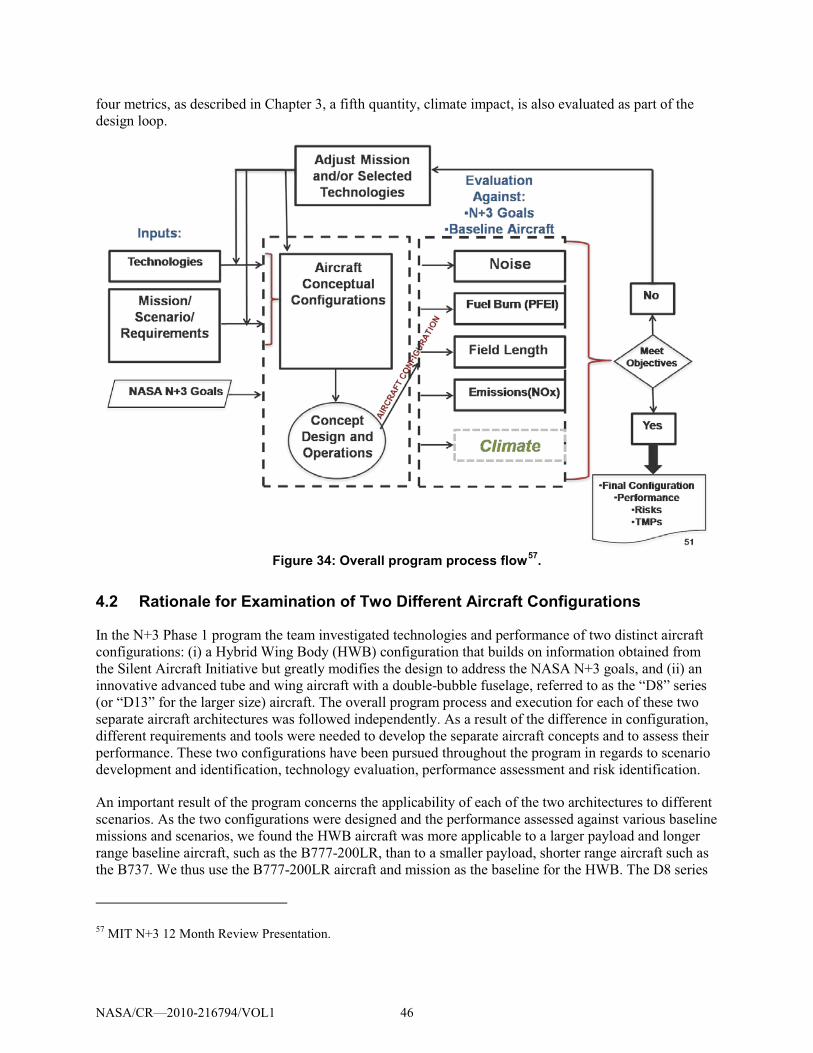
four metrics, as described in Chapter 3, a fifth quantity, climate impact, is also evaluated as part of the
design loop.
Figure 34: Overall program process flow57
4.2 Rationale for Examination of Two Different Aircraft Configurations
.
In the N+3 Phase 1 program the team investigated technologies and performance of two distinct aircraft
configurations: (i) a Hybrid Wing Body (HWB) configuration that builds on information obtained from
the Silent Aircraft Initiative but greatly modifies the design to address the NASA N+3 goals, and (ii) an
innovative advanced tube and wing aircraft with a double-bubble fuselage, referred to as the “D8” series
(or “D13” for the larger size) aircraft. The overall program process and execution for each of these two
separate aircraft architectures was followed independently. As a result of the difference in configuration,
different requirements and tools were needed to develop the separate aircraft concepts and to assess their
performance. These two configurations have been pursued throughout the program in regards to scenario
development and identification, technology evaluation, performance assessment and risk identification.
An important result of the program concerns the applicability of each of the two architectures to different
scenarios. As the two configurations were designed and the performance assessed against various baseline
missions and scenarios, we found the HWB aircraft was more applicable to a larger payload and longer
range baseline aircraft, such as the B777-200LR, than to a smaller payload, shorter range aircraft such as
the B737. We thus use the B777-200LR aircraft and mission as the baseline for the HWB. The D8 series
57 MIT N+3 12 Month Review Presentation.
NASA/CR—2010-216794/VOL1 46

aircraft has as its baseline comparison scenario the B737-800, for which mission it performs extremely
well.
We chose to develop and evaluate both concepts thoroughly, because of the different targets of each
aircraft in the transport aircraft scenario. The two aircraft are presented in separate sections of this
document, with the specific technologies that establish the performance of the aircraft described when
appropriate. Section 5 describes the D8 series aircraft. It also gives a summary of the design modifications
that lead to the performance differences between the baseline B737 and the D8 series. Section 6 then
describes the HWB.
NASA/CR—2010-216794/VOL1 47
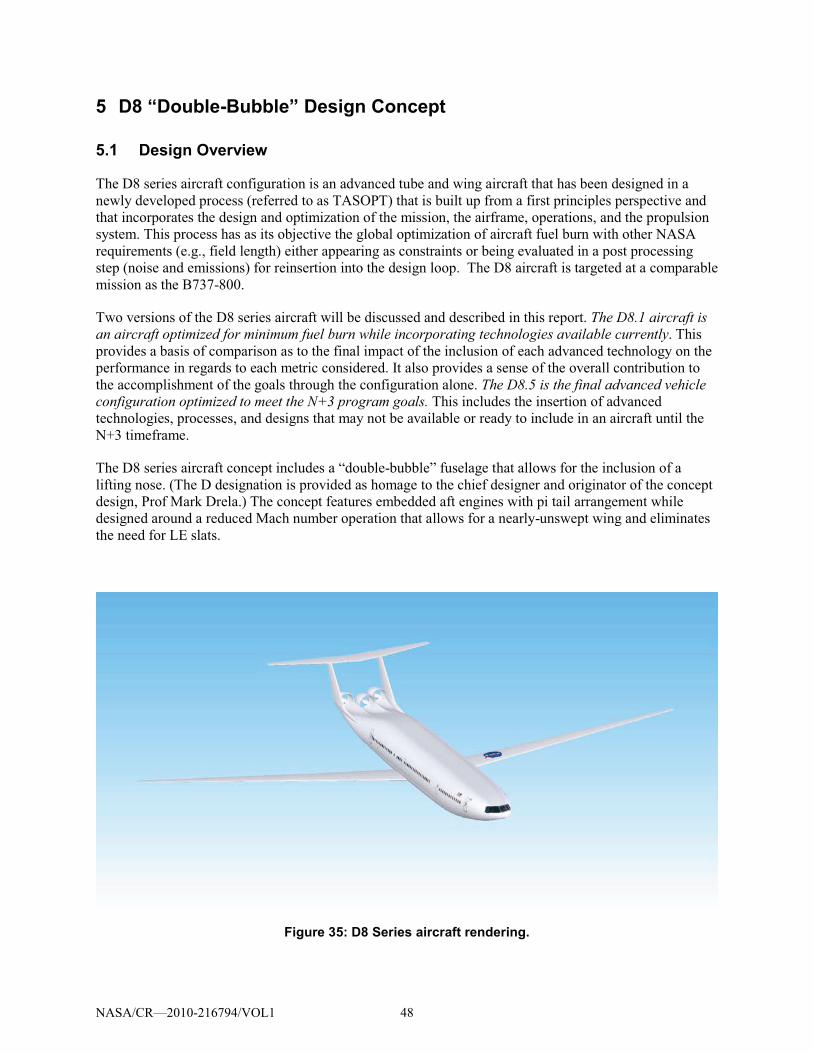
5 D8 “Double-Bubble” Design Concept
5.1 Design Overview
The D8 series aircraft configuration is an advanced tube and wing aircraft that has been designed in a
newly developed process (referred to as TASOPT) that is built up from a first principles perspective and
that incorporates the design and optimization of the mission, the airframe, operations, and the propulsion
system. This process has as its objective the global optimization of aircraft fuel burn with other NASA
requirements (e.g., field length) either appearing as constraints or being evaluated in a post processing
step (noise and emissions) for reinsertion into the design loop. The D8 aircraft is targeted at a comparable
mission as the B737-800.
Two versions of the D8 series aircraft will be discussed and described in this report. The D8.1 aircraft is an aircraft optimized for minimum fuel burn while incorporating technologies available currently. This
provides a basis of comparison as to the final impact of the inclusion of each advanced technology on the
performance in regards to each metric considered. It also provides a sense of the overall contribution to
the accomplishment of the goals through the configuration alone. The D8.5 is the final advanced vehicle configuration optimized to meet the N+3 program goals. This includes the insertion of advanced
technologies, processes, and designs that may not be available or ready to include in an aircraft until the
N+3 timeframe.
The D8 series aircraft concept includes a “double-bubble” fuselage that allows for the inclusion of a
lifting nose. (The D designation is provided as homage to the chief designer and originator of the concept
design, Prof Mark Drela.) The concept features embedded aft engines with pi tail arrangement while
designed around a reduced Mach number operation that allows for a nearly-unswept wing and eliminates
the need for LE slats.
Figure 35: D8 Series aircraft rendering.
NASA/CR—2010-216794/VOL1 48
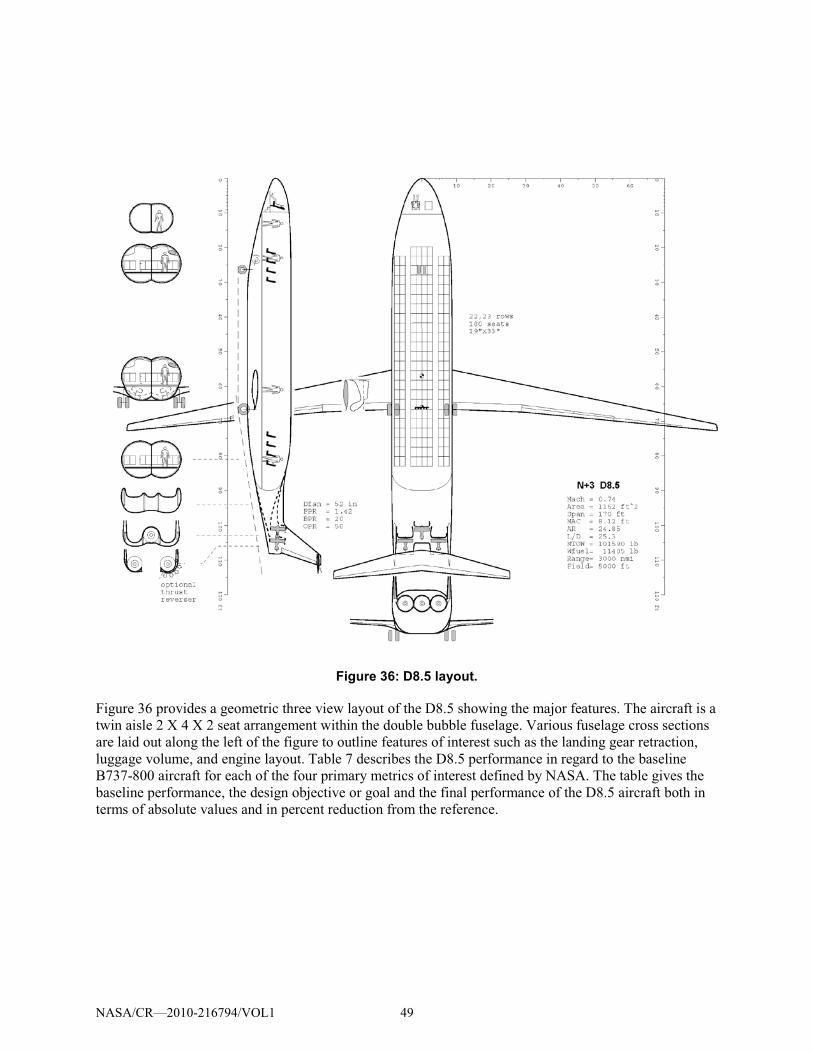
Figure 36: D8.5 layout.
Figure 36 provides a geometric three view layout of the D8.5 showing the major features. The aircraft is a
twin aisle 2 X 4 X 2 seat arrangement within the double bubble fuselage. Various fuselage cross sections
are laid out along the left of the figure to outline features of interest such as the landing gear retraction,
luggage volume, and engine layout. Table 7 describes the D8.5 performance in regard to the baseline
B737-800 aircraft for each of the four primary metrics of interest defined by NASA. The table gives the
baseline performance, the design objective or goal and the final performance of the D8.5 aircraft both in
terms of absolute values and in percent reduction from the reference.
NASA/CR—2010-216794/VOL1 49
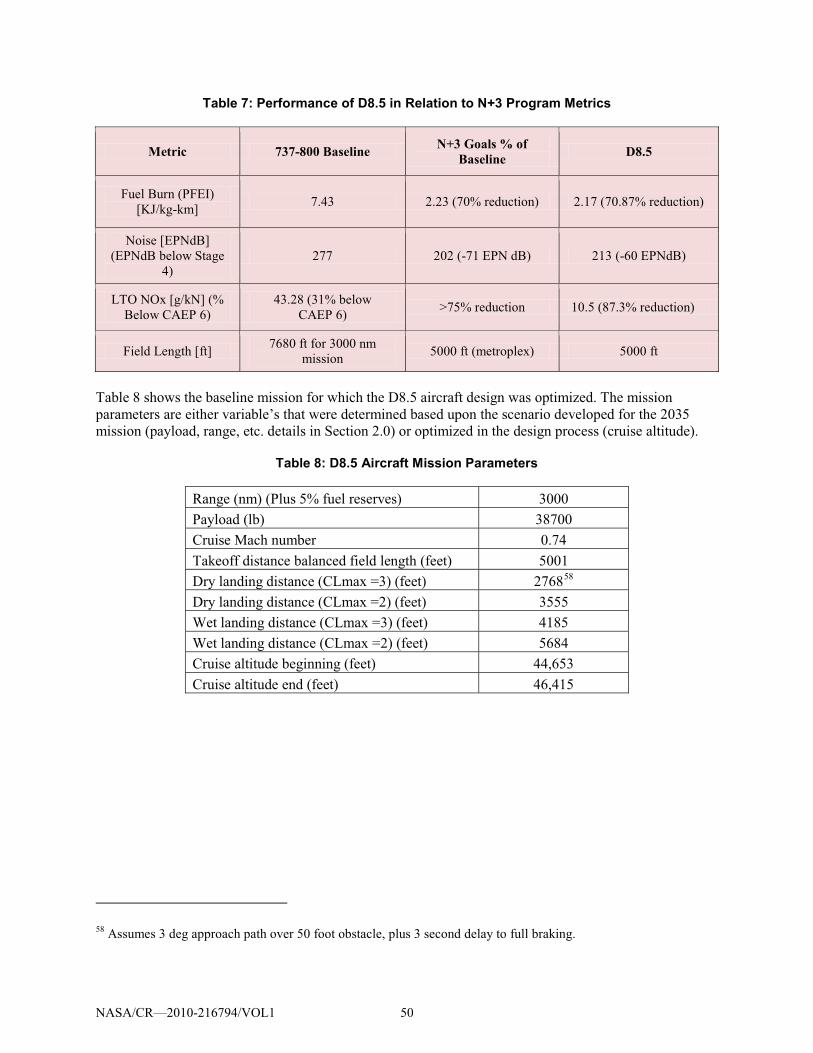
Table 7: Performance of D8.5 in Relation to N+3 Program Metrics
Metric 737-800 Baseline N+3 Goals % of Baseline D8.5
Fuel Burn (PFEI)
[KJ/kg-km] 7.43 2.23 (70% reduction) 2.17 (70.87% reduction)
Noise [EPNdB]
(EPNdB below Stage
4)
277 202 (-71 EPN dB) 213 (-60 EPNdB)
LTO NOx [g/kN] (%
Below CAEP 6)
43.28 (31% below
CAEP 6) >75% reduction 10.5 (87.3% reduction)
Field Length [ft] 7680 ft for 3000 nm
mission 5000 ft (metroplex) 5000 ft
Table 8 shows the baseline mission for which the D8.5 aircraft design was optimized. The mission
parameters are either variable’s that were determined based upon the scenario developed for the 2035
mission (payload, range, etc. details in Section 2.0) or optimized in the design process (cruise altitude).
Table 8: D8.5 Aircraft Mission Parameters
Range (nm) (Plus 5% fuel reserves) 3000
Payload (lb) 38700
Cruise Mach number 0.74
Takeoff distance balanced field length (feet) 5001
Dry landing distance (CLmax =3) (feet) 276858
Dry landing distance (CLmax =2) (feet)
3555
Wet landing distance (CLmax =3) (feet) 4185
Wet landing distance (CLmax =2) (feet) 5684
Cruise altitude beginning (feet) 44,653
Cruise altitude end (feet) 46,415
58 Assumes 3 deg approach path over 50 foot obstacle, plus 3 second delay to full braking.
NASA/CR—2010-216794/VOL1 50
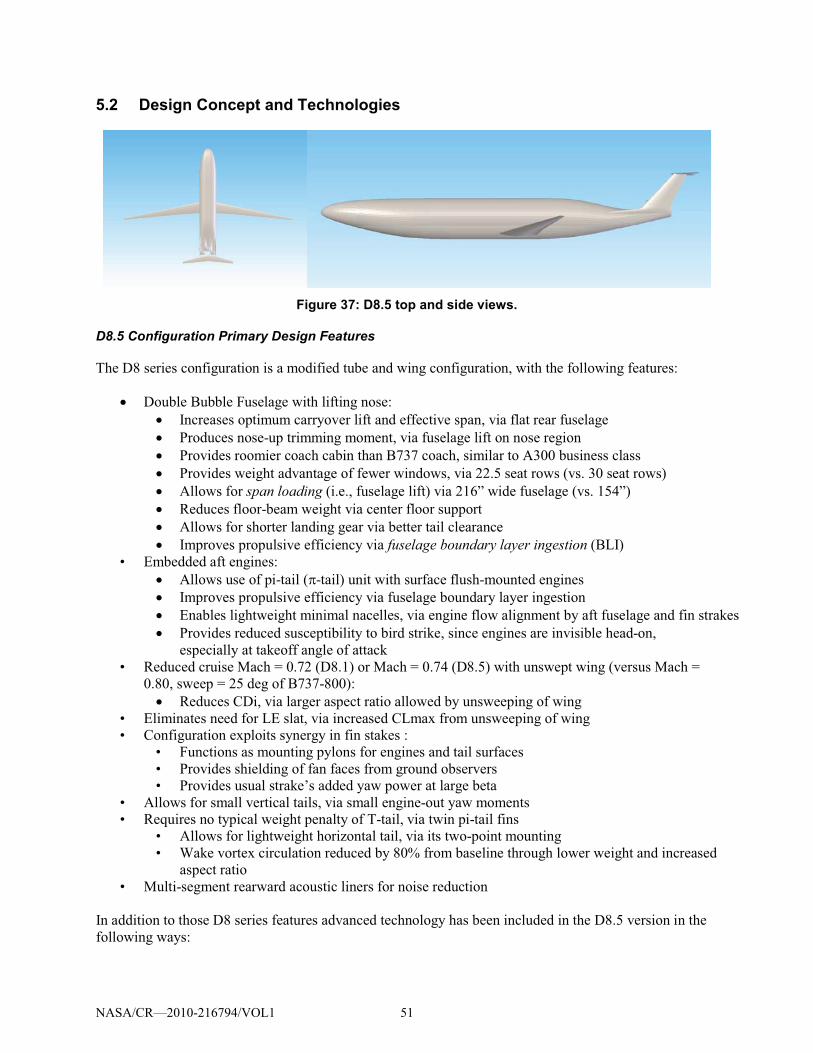
5.2 Design Concept and Technologies
Figure 37: D8.5 top and side views.
D8.5 Configuration Primary Design Features
The D8 series configuration is a modified tube and wing configuration, with the following features:
� Double Bubble Fuselage with lifting nose:
� Increases optimum carryover lift and effective span, via flat rear fuselage
� Produces nose-up trimming moment, via fuselage lift on nose region
� Provides roomier coach cabin than B737 coach, similar to A300 business class
� Provides weight advantage of fewer windows, via 22.5 seat rows (vs. 30 seat rows)
� Allows for span loading (i.e., fuselage lift) via 216” wide fuselage (vs. 154”)
� Reduces floor-beam weight via center floor support
� Allows for shorter landing gear via better tail clearance
� Improves propulsive efficiency via fuselage boundary layer ingestion (BLI)
• Embedded aft engines:
� Allows use of pi-tail (�-tail) unit with surface flush-mounted engines
� Improves propulsive efficiency via fuselage boundary layer ingestion
� Enables lightweight minimal nacelles, via engine flow alignment by aft fuselage and fin strakes
� Provides reduced susceptibility to bird strike, since engines are invisible head-on,
especially at takeoff angle of attack
• Reduced cruise Mach = 0.72 (D8.1) or Mach = 0.74 (D8.5) with unswept wing (versus Mach =
0.80, sweep = 25 deg of B737-800):
� Reduces CDi, via larger aspect ratio allowed by unsweeping of wing
• Eliminates need for LE slat, via increased CLmax from unsweeping of wing
• Configuration exploits synergy in fin stakes :
• Functions as mounting pylons for engines and tail surfaces
• Provides shielding of fan faces from ground observers
• Provides usual strake’s added yaw power at large beta
• Allows for small vertical tails, via small engine-out yaw moments
• Requires no typical weight penalty of T-tail, via twin pi-tail fins
• Allows for lightweight horizontal tail, via its two-point mounting
• Wake vortex circulation reduced by 80% from baseline through lower weight and increased
aspect ratio
• Multi-segment rearward acoustic liners for noise reduction
In addition to those D8 series features advanced technology has been included in the D8.5 version in the
following ways:
NASA/CR—2010-216794/VOL1 51
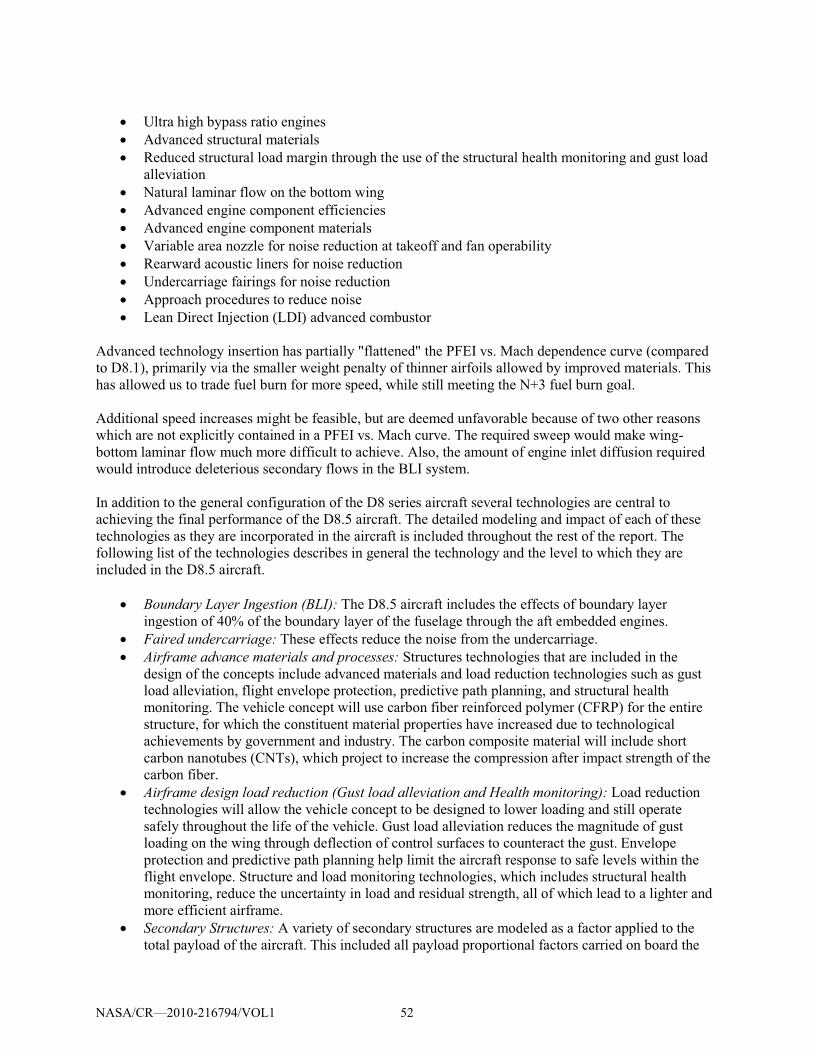
� Ultra high bypass ratio engines
� Advanced structural materials
� Reduced structural load margin through the use of the structural health monitoring and gust load
alleviation
� Natural laminar flow on the bottom wing
� Advanced engine component efficiencies
� Advanced engine component materials
� Variable area nozzle for noise reduction at takeoff and fan operability
� Rearward acoustic liners for noise reduction
� Undercarriage fairings for noise reduction
� Approach procedures to reduce noise
� Lean Direct Injection (LDI) advanced combustor
Advanced technology insertion has partially "flattened" the PFEI vs. Mach dependence curve (compared
to D8.1), primarily via the smaller weight penalty of thinner airfoils allowed by improved materials. This
has allowed us to trade fuel burn for more speed, while still meeting the N+3 fuel burn goal.
Additional speed increases might be feasible, but are deemed unfavorable because of two other reasons
which are not explicitly contained in a PFEI vs. Mach curve. The required sweep would make wing-
bottom laminar flow much more difficult to achieve. Also, the amount of engine inlet diffusion required
would introduce deleterious secondary flows in the BLI system.
In addition to the general configuration of the D8 series aircraft several technologies are central to
achieving the final performance of the D8.5 aircraft. The detailed modeling and impact of each of these
technologies as they are incorporated in the aircraft is included throughout the rest of the report. The
following list of the technologies describes in general the technology and the level to which they are
included in the D8.5 aircraft.
� Boundary Layer Ingestion (BLI): The D8.5 aircraft includes the effects of boundary layer
ingestion of 40% of the boundary layer of the fuselage through the aft embedded engines.
� Faired undercarriage: These effects reduce the noise from the undercarriage.
� Airframe advance materials and processes: Structures technologies that are included in the
design of the concepts include advanced materials and load reduction technologies such as gust
load alleviation, flight envelope protection, predictive path planning, and structural health
monitoring. The vehicle concept will use carbon fiber reinforced polymer (CFRP) for the entire
structure, for which the constituent material properties have increased due to technological
achievements by government and industry. The carbon composite material will include short
carbon nanotubes (CNTs), which project to increase the compression after impact strength of the
carbon fiber.
� Airframe design load reduction (Gust load alleviation and Health monitoring): Load reduction
technologies will allow the vehicle concept to be designed to lower loading and still operate
safely throughout the life of the vehicle. Gust load alleviation reduces the magnitude of gust
loading on the wing through deflection of control surfaces to counteract the gust. Envelope
protection and predictive path planning help limit the aircraft response to safe levels within the
flight envelope. Structure and load monitoring technologies, which includes structural health
monitoring, reduce the uncertainty in load and residual strength, all of which lead to a lighter and
more efficient airframe.
� Secondary Structures: A variety of secondary structures are modeled as a factor applied to the
total payload of the aircraft. This included all payload proportional factors carried on board the
NASA/CR—2010-216794/VOL1 52
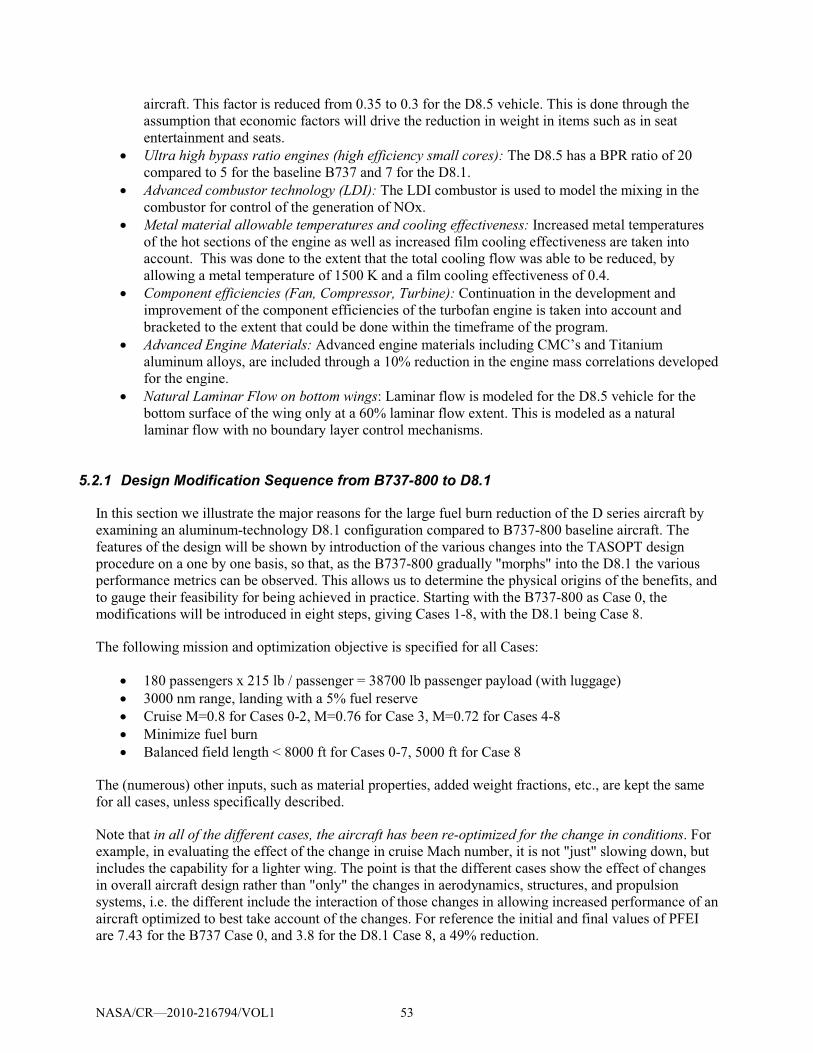
aircraft. This factor is reduced from 0.35 to 0.3 for the D8.5 vehicle. This is done through the
assumption that economic factors will drive the reduction in weight in items such as in seat
entertainment and seats.
� Ultra high bypass ratio engines (high efficiency small cores): The D8.5 has a BPR ratio of 20
compared to 5 for the baseline B737 and 7 for the D8.1.
� Advanced combustor technology (LDI): The LDI combustor is used to model the mixing in the
combustor for control of the generation of NOx.
� Metal material allowable temperatures and cooling effectiveness: Increased metal temperatures
of the hot sections of the engine as well as increased film cooling effectiveness are taken into
account. This was done to the extent that the total cooling flow was able to be reduced, by
allowing a metal temperature of 1500 K and a film cooling effectiveness of 0.4.
� Component efficiencies (Fan, Compressor, Turbine): Continuation in the development and
improvement of the component efficiencies of the turbofan engine is taken into account and
bracketed to the extent that could be done within the timeframe of the program.
� Advanced Engine Materials: Advanced engine materials including CMC’s and Titanium
aluminum alloys, are included through a 10% reduction in the engine mass correlations developed
for the engine.
� Natural Laminar Flow on bottom wings: Laminar flow is modeled for the D8.5 vehicle for the
bottom surface of the wing only at a 60% laminar flow extent. This is modeled as a natural
laminar flow with no boundary layer control mechanisms.
5.2.1 Design Modification Sequence from B737-800 to D8.1
In this section we illustrate the major reasons for the large fuel burn reduction of the D series aircraft by
examining an aluminum-technology D8.1 configuration compared to B737-800 baseline aircraft. The
features of the design will be shown by introduction of the various changes into the TASOPT design
procedure on a one by one basis, so that, as the B737-800 gradually "morphs" into the D8.1 the various
performance metrics can be observed. This allows us to determine the physical origins of the benefits, and
to gauge their feasibility for being achieved in practice. Starting with the B737-800 as Case 0, the
modifications will be introduced in eight steps, giving Cases 1-8, with the D8.1 being Case 8.
The following mission and optimization objective is specified for all Cases:
� 180 passengers x 215 lb / passenger = 38700 lb passenger payload (with luggage)
� 3000 nm range, landing with a 5% fuel reserve
� Cruise M=0.8 for Cases 0-2, M=0.76 for Case 3, M=0.72 for Cases 4-8
� Minimize fuel burn
� Balanced field length < 8000 ft for Cases 0-7, 5000 ft for Case 8
The (numerous) other inputs, such as material properties, added weight fractions, etc., are kept the same
for all cases, unless specifically described.
Note that in all of the different cases, the aircraft has been re-optimized for the change in conditions. For
example, in evaluating the effect of the change in cruise Mach number, it is not "just" slowing down, but
includes the capability for a lighter wing. The point is that the different cases show the effect of changes
in overall aircraft design rather than "only" the changes in aerodynamics, structures, and propulsion
systems, i.e. the different include the interaction of those changes in allowing increased performance of an
aircraft optimized to best take account of the changes. For reference the initial and final values of PFEI
are 7.43 for the B737 Case 0, and 3.8 for the D8.1 Case 8, a 49% reduction.
NASA/CR—2010-216794/VOL1 53
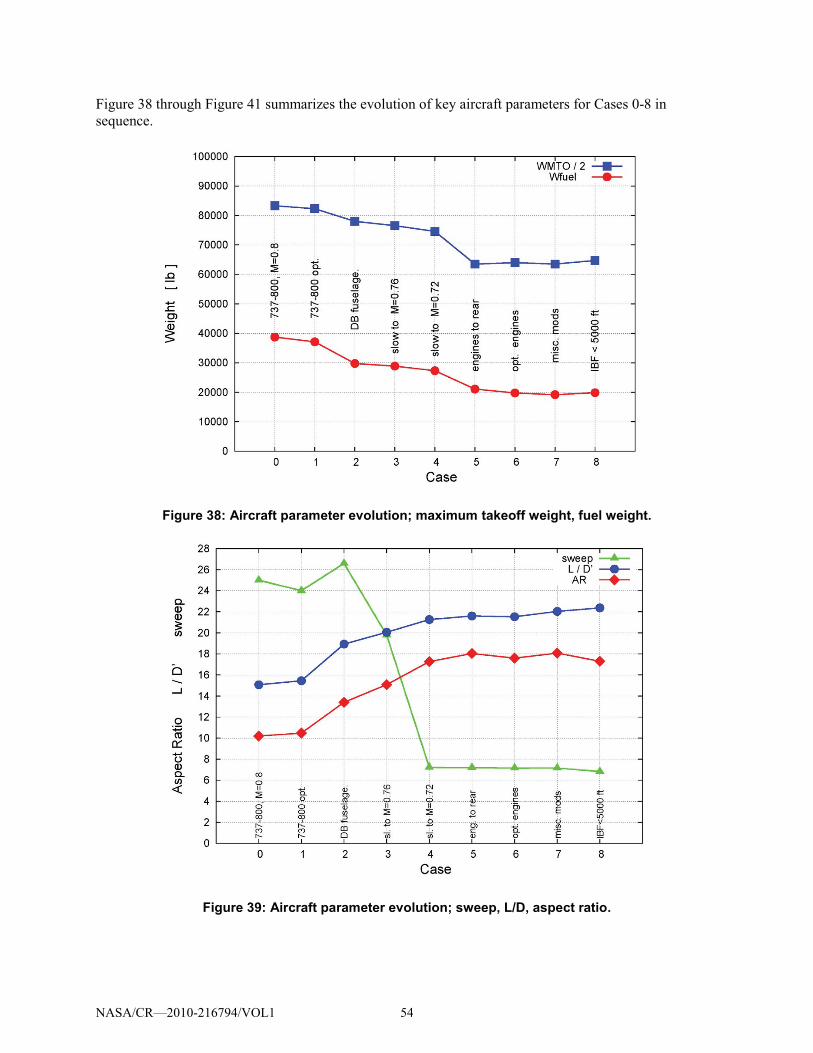
Figure 38 through Figure 41 summarizes the evolution of key aircraft parameters for Cases 0-8 in
sequence.
Figure 38: Aircraft parameter evolution; maximum takeoff weight, fuel weight.
Figure 39: Aircraft parameter evolution; sweep, L/D, aspect ratio.
NASA/CR—2010-216794/VOL1 54
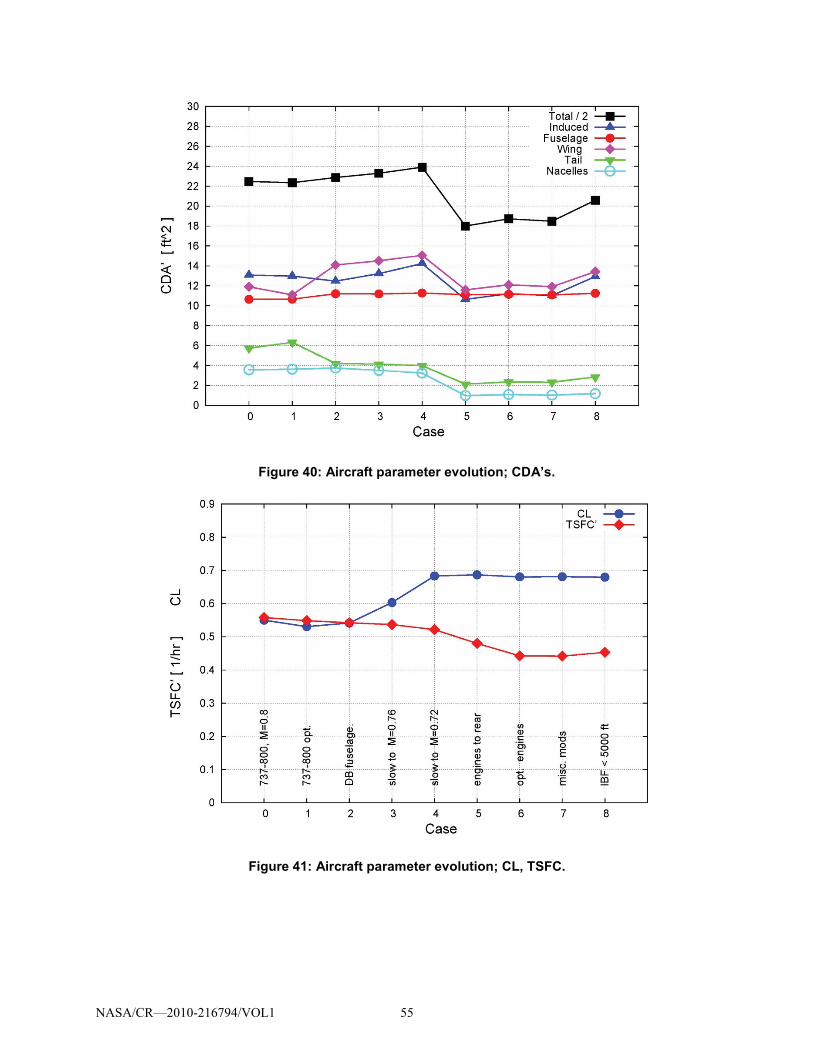
Figure 40: Aircraft parameter evolution; CDA’s.
Figure 41: Aircraft parameter evolution; CL, TSFC.
NASA/CR—2010-216794/VOL1 55
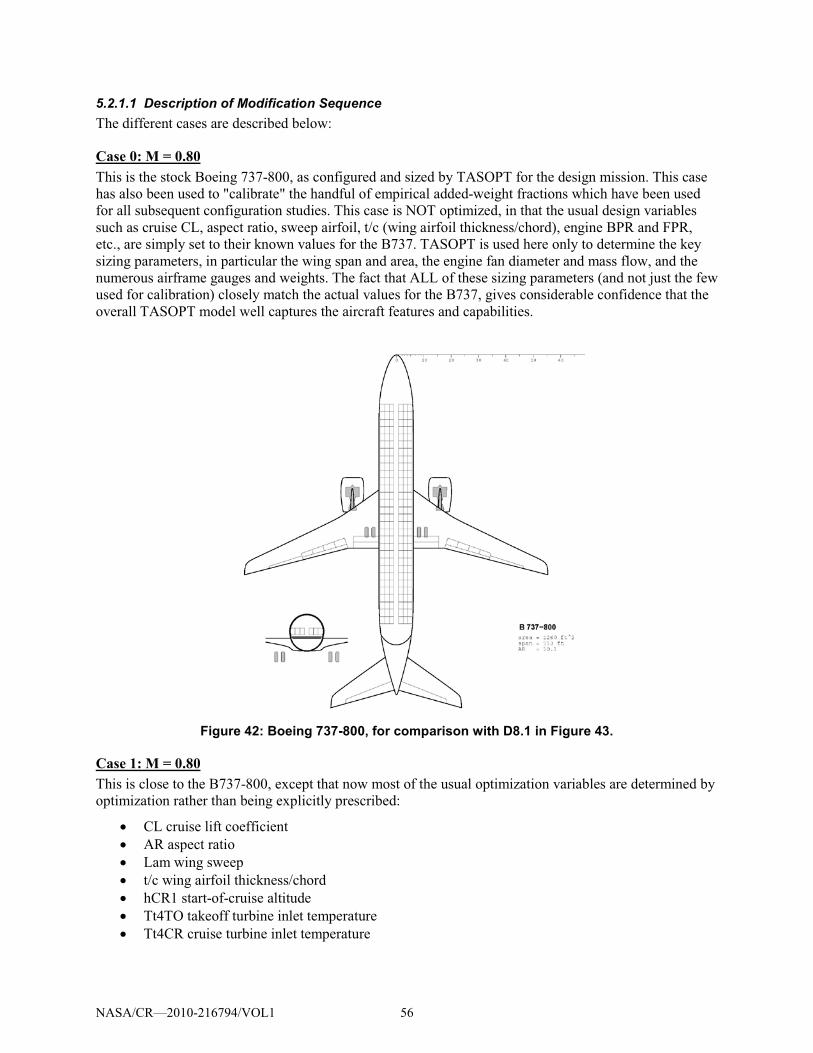
5.2.1.1 Description of Modification Sequence The different cases are described below:
Case 0: M = 0.80 This is the stock Boeing 737-800, as configured and sized by TASOPT for the design mission. This case
has also been used to "calibrate" the handful of empirical added-weight fractions which have been used
for all subsequent configuration studies. This case is NOT optimized, in that the usual design variables
such as cruise CL, aspect ratio, sweep airfoil, t/c (wing airfoil thickness/chord), engine BPR and FPR,
etc., are simply set to their known values for the B737. TASOPT is used here only to determine the key
sizing parameters, in particular the wing span and area, the engine fan diameter and mass flow, and the
numerous airframe gauges and weights. The fact that ALL of these sizing parameters (and not just the few
used for calibration) closely match the actual values for the B737, gives considerable confidence that the
overall TASOPT model well captures the aircraft features and capabilities.
Figure 42: Boeing 737-800, for comparison with D8.1 in Figure 43.
Case 1: M = 0.80 This is close to the B737-800, except that now most of the usual optimization variables are determined by
optimization rather than being explicitly prescribed:
� CL cruise lift coefficient
� AR aspect ratio
� Lam wing sweep
� t/c wing airfoil thickness/chord
� hCR1 start-of-cruise altitude
� Tt4TO takeoff turbine inlet temperature
� Tt4CR cruise turbine inlet temperature
NASA/CR—2010-216794/VOL1 56
The following remaining optimization variables were NOT optimized for this case, but were held at their
known values for the CFM56-7 engine used on the B737-800:
� FPR fan pressure ratio
� BPR bypass ratio
� OPR overall pressure ratio
The reason is that a larger-BPR, larger-diameter engine, which would result from optimization would not
fit under the B737 wing without modifications to the landing gear. Figure 38 through Figure 41 show that
little changed during the optimization from Case 0 to Case 1, providing validity for the TASOPT model
(assuming the B737 aircraft has also been optimized by Boeing). The main changes are
� +4.2% span
� +2.7% AR
� -1.2% MTOW
� +2.5% L/D
� -3.3% fuel burn, mainly via lower induced drag.
These changes are reassuring, since transport aircraft are typically designed to be slightly smaller than
optimum59
Case 2: M = 0.80
with a slight amount of fuel burn sacrificed for a smaller, lighter, and cheaper airframe so as to
minimize total operating cost to the airline.
For this case, the B737 fuselage is replaced with the double-bubble D8 fuselage. The horizontal tail is
now specified indirectly via a static margin of 0.20 at the aftmost CG case, in lieu of the previous B737’s
tail volume specification. This is done so that the nose-up trimming moment of the D8 fuselage can be
properly exploited. The new fuselage gives very substantial benefits:
� +28% AR
� -5.2% MTOW
� -15.4% L/D
� -19.7% fuel burn
The lower weight and improved L/D result from numerous interacting effects. Ironically, the D8 fuselage
itself has a slightly larger drag area by about 5% than the B737-800 fuselage, and it is only about 4%
lighter than the B737 fuselage. Hence, all its benefits come from secondary effects on the rest of the
aircraft. The most dominant of these is the front nose loading which allows the horizontal tail (HT) to be
shrunk for the same overall pitch trimming power and static margin. Furthermore, the D8 fuselage's
larger overall lift fraction and reduced HT download reduce the wing loads, which the optimizer exploits
this by stretching the span and aspect ratio, thus producing the large L/D increase. Additional weight
savings come from the 2-point support of the HT, which greatly reduces its bending moments and weight
over the usual 1-point supported cantilever HT.
Case 3: M = 0.76 The difference between this case and Case 2 is that the cruise Mach has been reduced and the airplane re-
optimized, giving the following benefits:
� +12.5% AR
� -2.9% MTOW
59 Liebeck R.H., personal communication
NASA/CR—2010-216794/VOL1 57
� +6% L/D
� -1.0% TSFC
� -3.0% fuel burn
The larger Aspect Ratio is of course the direct result of the reduced sweep of 19.8 degrees, from 26.6
degrees of Case 1. In addition, the nacelle drag decreases somewhat, since the diffusion into the fan
(from M=0.76 to 0.60) has been reduced by 20%, which reduces the nacelle loading and supervelocities
on the nacelle surface. For this case, the minimum static margin has also been reduced from 0.20 to 0.15,
which is considered permissible in light of the lower Mach and lower sweep which is expected to have a
weaker sensitivity to transonic pitch up.
Case 4: M = 0.72 This is the same as Case 3, but cruise Mach is reduced further. A significant fuel burn reduction is
produced:
� +14.5% AR
� -5.3% MTOW
� +6% L/D
� -2.9% TSFC
� -5.3% fuel burn
The Aspect Ratio increase is allowed by the now nearly unswept wing. The diffusion into the fan is now
only 60% as large as in the M=0.8 case, giving further nacelle drag benefits. The minimum static margin
is now further reduced to 0.10, justified by the very small sweep and no transonic pitch up issues, both
due to the lower Mach number.
Case 5: M = 0.72 The CFM56-class engines are now moved from the wing to the tail and mounted flush with the top
fuselage. Simultaneously, the APU and hydraulic/pneumatic power generation systems weight locations
are moved from the tailcone to just behind the nose gear to help offset the rearward engine weight shift.
The aircraft aft most-CG still shifts back by about 5 feet, taking the main landing gear with it. The
elimination of the underwing engines allows a considerably shortening of the nose and main landing gear,
which are lightened to 3.75% of gross weight from the previous 5.5%. The gear shortening is also
allowed by the shorter D8 fuselage which can be seen to have no tail strike problems.
Moving the engines close to the centerline reduces the engine-out yaw moments by a factor of 5, allowing
a large reduction in the required vertical tail (VT) area, weight and drag. The engine-out case is in fact no
longer limiting, and instead the VT area is now sized by tail volume for the required yaw stability and
damping.
With the rear flush engine mounting, a large fraction of the fuselage boundary layer is now ingested into
the fans, although the cores still take in clean flow -- the ideal situation. This change is considerably
enabled by the Mach number reduction from the previous two cases, in that the potential-flow Mach
number at the engine inlet locations is close to the M=0.60 value required by the engine fans. Hence the
fuselage boundary layer sees little or no deceleration going into the fans, avoiding development of
streamwise vorticity and leaves the distortion more uniformly spread out over the fan face rather than
being highly concentrated. This should considerably improve the fan's ingestion performance and stall
resistance.
In summary, the lower-Mach cruise, the rear-mounted engines, and the BL ingestion all combine in a very
synergistic manner to give a large overall aircraft performance improvement. The net benefits are as
follows:
� +4.4% AR
NASA/CR—2010-216794/VOL1 58
� -14.9% MTOW
� -8.0% TSFC'
� +1.6% L/D'
� -22.8% fuel burn
Several observations on the drag reductions can be made:
1. The reduction in L/D appears modest but is misleading. The drag area of the entire aircraft
shrank by 25%, but the lifting wing area also shrank by 24%, so the ratio changed little. The real
benefit of the drag-area decrease in the case appears entirely in the reduced weight.
2. The fuselage mounting allows more than half of the nacelle wetted area (and weight) to be
eliminated, since the rear fuselage in effect doubles as a flow-aligning nacelle and also acts as an
acoustic shield. So the nacelles themselves have almost no aerodynamic load in cruise, see no
flow misalignment at low speed and high alpha, and have lesser noise shielding demands, so that
they can have a smaller chord than a typical underwing nacelle. In addition, they have surface
velocities below the freestream value, all which combine to produce the extremely low nacelle
drag, as can be seen in Figure 43.
Case 6: M = 0.72 This is the same as Case 5, except that the engine OPR is increased from 30 to 35, and the fan,
compressor, and turbine efficiencies are increased by 1%, all to reflect realistic 15-year engine technology
improvements from the CFM56 baseline. Furthermore, FPR and BPR are now optimized instead of being
held fixed at the CFM56's values of FPR=1.65, BPR=5.1. The result is:
� FPR = 1.68
� BPR = 7.5
� -6.7% MTOW
� -7.8% TSFC'
� -6.7% fuel burn
Most of the benefits are from the increased component efficiencies. The changes in FPR and BPR and
their benefits are small, due to the CFM56 engine parameters fortuitously being not too far from the
optimum in this case. The main reason is that because of the substantial BLI, the fan must perform extra
work just to bring the BL fluid back up freestream total pressure, so it optimizes to a larger FPR than
expected. The corresponding BPR must also be modest, otherwise the core could not drive the fan at the
large FPR. For advanced technology cores, with e.g. improved cooling or turbine materials, the
additional core power would naturally optimize to a significantly lower FPR and larger BPR.
Case 7: M = 0.72 This is the same as Case 6, except that the slats are removed along with their weight. This is considered
feasible since the elimination of sweep has inherently improves CLmax. The excrescence profile drag
factor has also been correspondingly reduced by 3%, from 1.08 to 1.05. The following benefits are
obtained:
� +2.7% AR
� -2.9% MTOW
� -0.2% TSFC'
� +2.4% L/D'
� -2.9% fuel burn
The gain is modest but not insignificant, and perhaps the simplicity and lower cost of a slatless wing
would be a stronger consideration for the impact of this improvement as well as a reduction in noise.
NASA/CR—2010-216794/VOL1 59
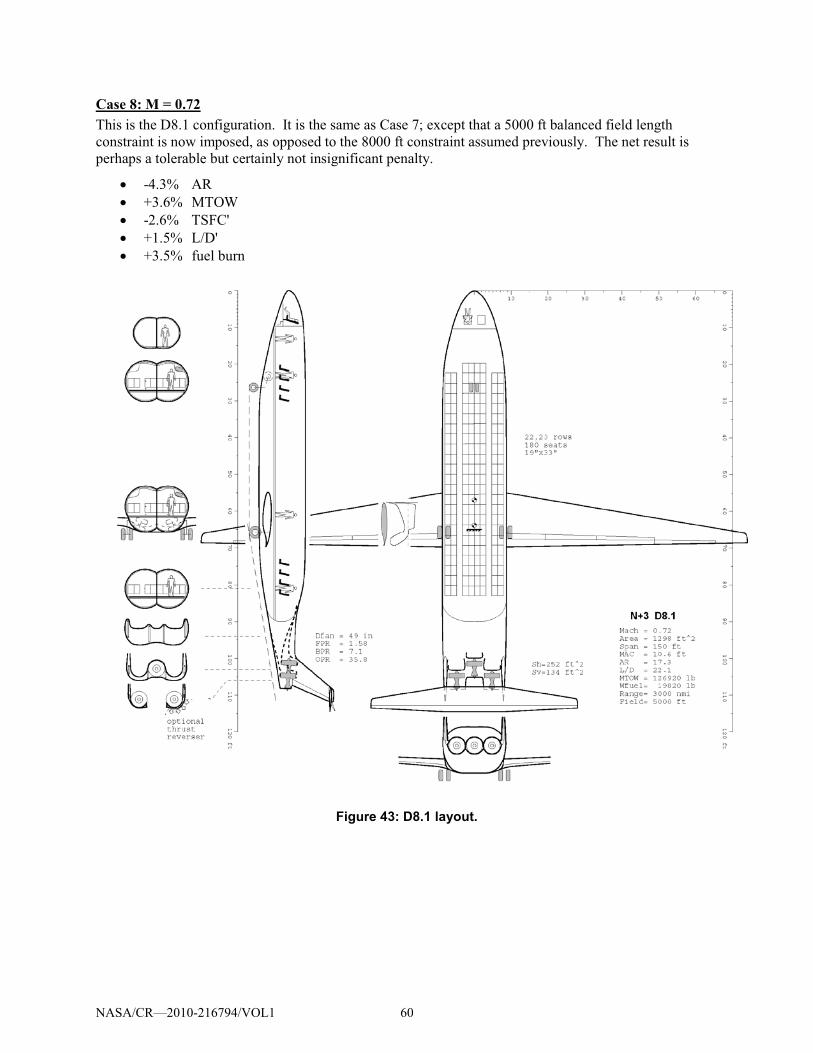
Case 8: M = 0.72 This is the D8.1 configuration. It is the same as Case 7; except that a 5000 ft balanced field length
constraint is now imposed, as opposed to the 8000 ft constraint assumed previously. The net result is
perhaps a tolerable but certainly not insignificant penalty.
� -4.3% AR
� +3.6% MTOW
� -2.6% TSFC'
� +1.5% L/D'
� +3.5% fuel burn
Figure 43: D8.1 layout.
NASA/CR—2010-216794/VOL1 60
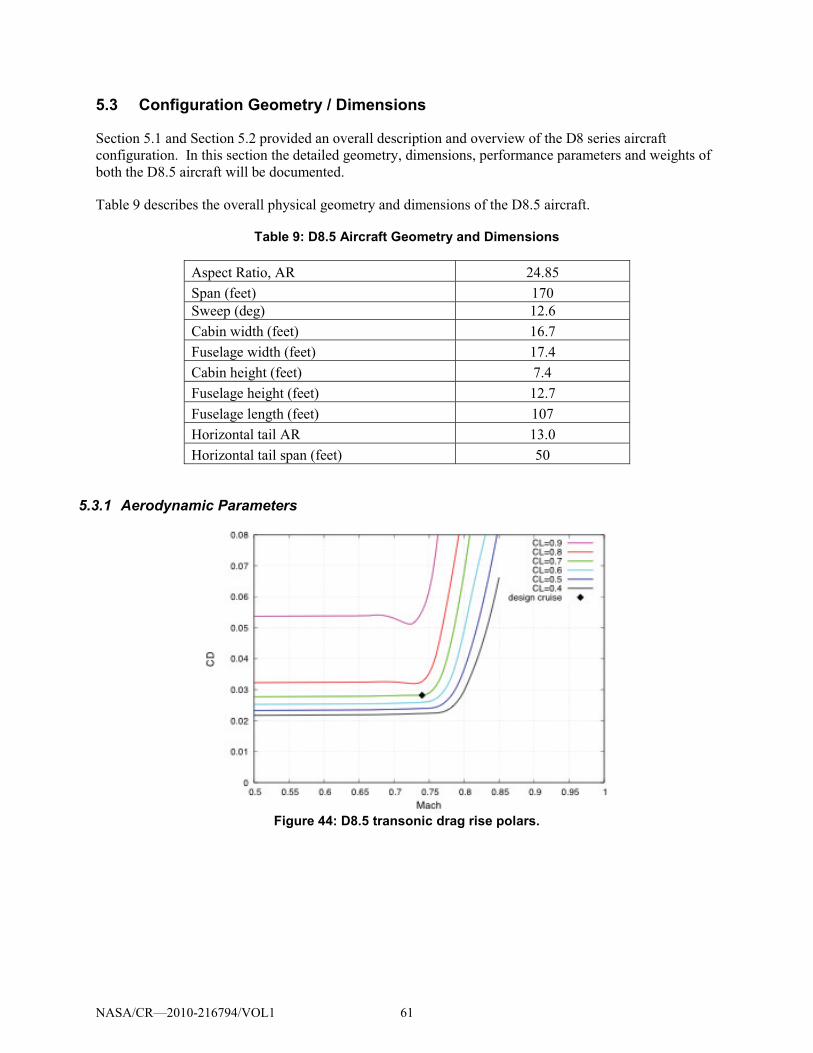
5.3 Configuration Geometry / Dimensions
Section 5.1 and Section 5.2 provided an overall description and overview of the D8 series aircraft
configuration. In this section the detailed geometry, dimensions, performance parameters and weights of
both the D8.5 aircraft will be documented.
Table 9 describes the overall physical geometry and dimensions of the D8.5 aircraft.
Table 9: D8.5 Aircraft Geometry and Dimensions
Aspect Ratio, AR 24.85
Span (feet) 170
Sweep (deg) 12.6
Cabin width (feet) 16.7
Fuselage width (feet) 17.4
Cabin height (feet) 7.4
Fuselage height (feet) 12.7
Fuselage length (feet) 107
Horizontal tail AR 13.0
Horizontal tail span (feet) 50
5.3.1 Aerodynamic Parameters
Figure 44: D8.5 transonic drag rise polars.
NASA/CR—2010-216794/VOL1 61
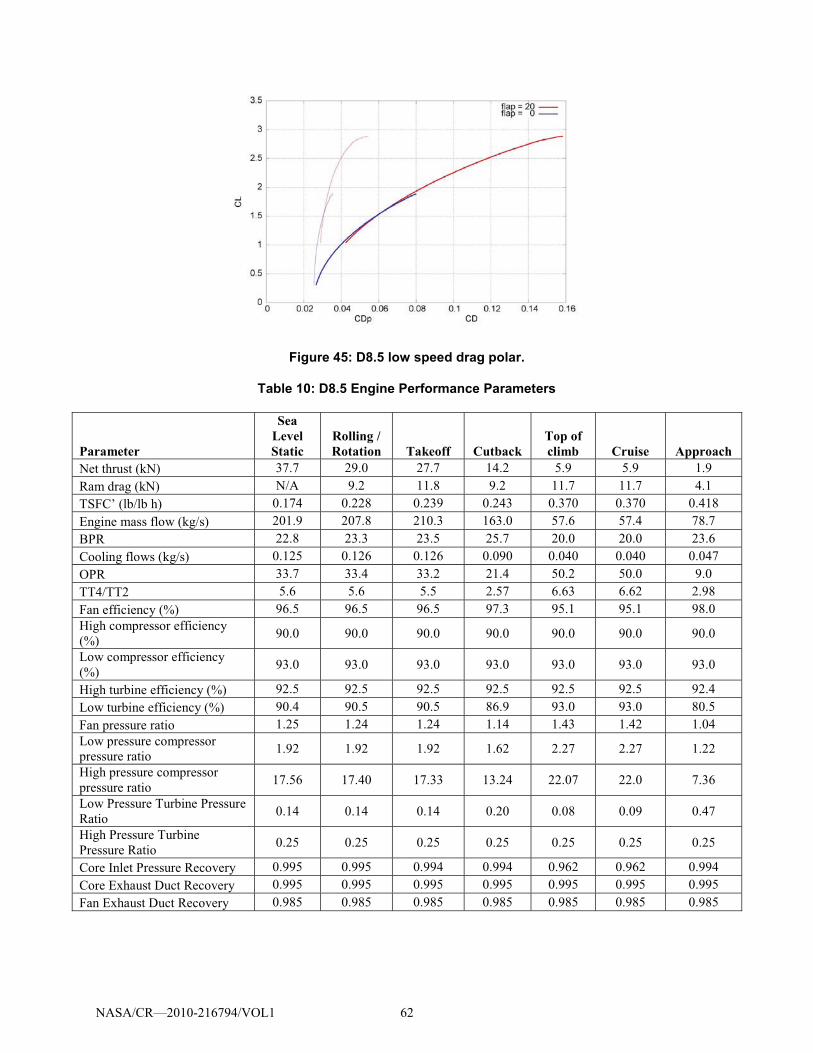
Figure 45: D8.5 low speed drag polar.
Table 10: D8.5 Engine Performance Parameters
Parameter
Sea Level Static
Rolling / Rotation Takeoff Cutback
Top of climb Cruise Approach
Net thrust (kN) 37.7 29.0 27.7 14.2 5.9 5.9 1.9
Ram drag (kN) N/A 9.2 11.8 9.2 11.7 11.7 4.1
TSFC’ (lb/lb h) 0.174 0.228 0.239 0.243 0.370 0.370 0.418
Engine mass flow (kg/s) 201.9 207.8 210.3 163.0 57.6 57.4 78.7
BPR 22.8 23.3 23.5 25.7 20.0 20.0 23.6
Cooling flows (kg/s) 0.125 0.126 0.126 0.090 0.040 0.040 0.047
OPR 33.7 33.4 33.2 21.4 50.2 50.0 9.0
TT4/TT2 5.6 5.6 5.5 2.57 6.63 6.62 2.98
Fan efficiency (%) 96.5 96.5 96.5 97.3 95.1 95.1 98.0
High compressor efficiency
(%) 90.0 90.0 90.0 90.0 90.0 90.0 90.0
Low compressor efficiency
(%) 93.0 93.0 93.0 93.0 93.0 93.0 93.0
High turbine efficiency (%) 92.5 92.5 92.5 92.5 92.5 92.5 92.4
Low turbine efficiency (%) 90.4 90.5 90.5 86.9 93.0 93.0 80.5
Fan pressure ratio 1.25 1.24 1.24 1.14 1.43 1.42 1.04
Low pressure compressor
pressure ratio 1.92 1.92 1.92 1.62 2.27 2.27 1.22
High pressure compressor
pressure ratio 17.56 17.40 17.33 13.24 22.07 22.0 7.36
Low Pressure Turbine Pressure
Ratio 0.14 0.14 0.14 0.20 0.08 0.09 0.47
High Pressure Turbine
Pressure Ratio 0.25 0.25 0.25 0.25 0.25 0.25 0.25
Core Inlet Pressure Recovery 0.995 0.995 0.994 0.994 0.962 0.962 0.994
Core Exhaust Duct Recovery 0.995 0.995 0.995 0.995 0.995 0.995 0.995
Fan Exhaust Duct Recovery 0.985 0.985 0.985 0.985 0.985 0.985 0.985
NASA/CR—2010-216794/VOL1 62
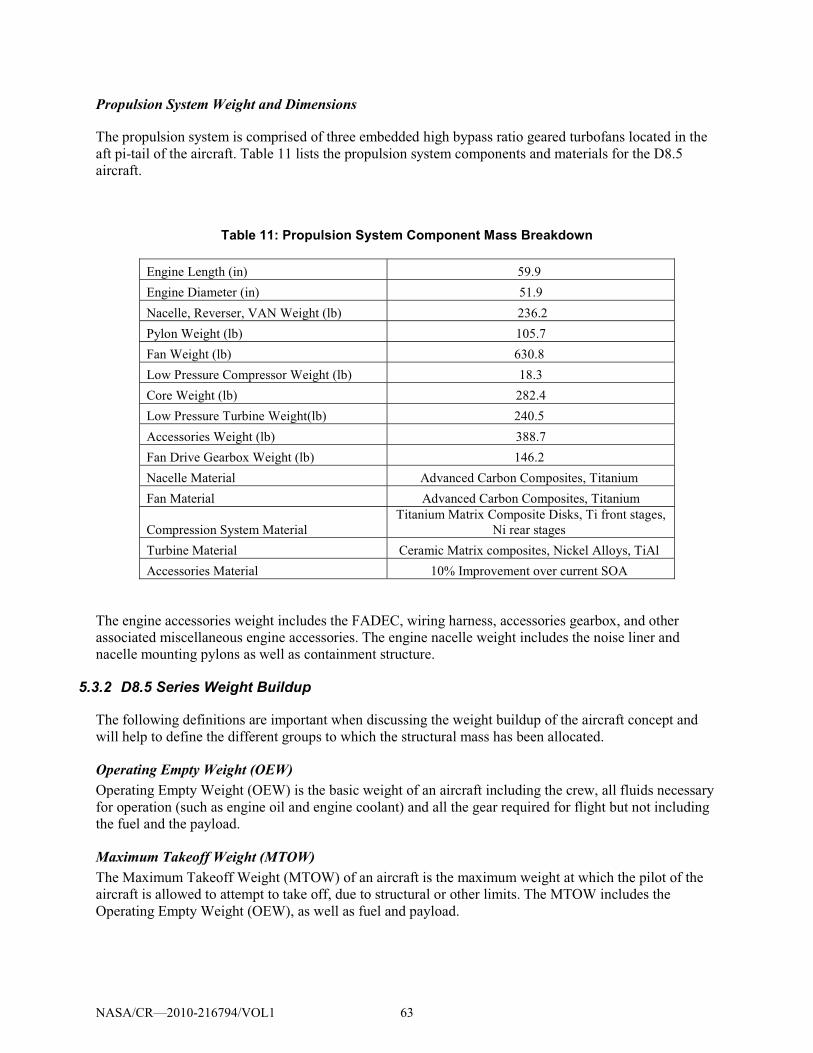
Propulsion System Weight and Dimensions
The propulsion system is comprised of three embedded high bypass ratio geared turbofans located in the
aft pi-tail of the aircraft. Table 11 lists the propulsion system components and materials for the D8.5
aircraft.
Table 11: Propulsion System Component Mass Breakdown
Engine Length (in) 59.9
Engine Diameter (in) 51.9
Nacelle, Reverser, VAN Weight (lb) 236.2
Pylon Weight (lb) 105.7
Fan Weight (lb) 630.8
Low Pressure Compressor Weight (lb) 18.3
Core Weight (lb) 282.4
Low Pressure Turbine Weight(lb) 240.5
Accessories Weight (lb) 388.7
Fan Drive Gearbox Weight (lb) 146.2
Nacelle Material Advanced Carbon Composites, Titanium
Fan Material Advanced Carbon Composites, Titanium
Compression System Material
Titanium Matrix Composite Disks, Ti front stages,
Ni rear stages
Turbine Material Ceramic Matrix composites, Nickel Alloys, TiAl
Accessories Material 10% Improvement over current SOA
The engine accessories weight includes the FADEC, wiring harness, accessories gearbox, and other
associated miscellaneous engine accessories. The engine nacelle weight includes the noise liner and
nacelle mounting pylons as well as containment structure.
5.3.2 D8.5 Series Weight Buildup
The following definitions are important when discussing the weight buildup of the aircraft concept and
will help to define the different groups to which the structural mass has been allocated.
Operating Empty Weight (OEW) Operating Empty Weight (OEW) is the basic weight of an aircraft including the crew, all fluids necessary
for operation (such as engine oil and engine coolant) and all the gear required for flight but not including
the fuel and the payload.
Maximum Takeoff Weight (MTOW) The Maximum Takeoff Weight (MTOW) of an aircraft is the maximum weight at which the pilot of the
aircraft is allowed to attempt to take off, due to structural or other limits. The MTOW includes the
Operating Empty Weight (OEW), as well as fuel and payload.
NASA/CR—2010-216794/VOL1 63
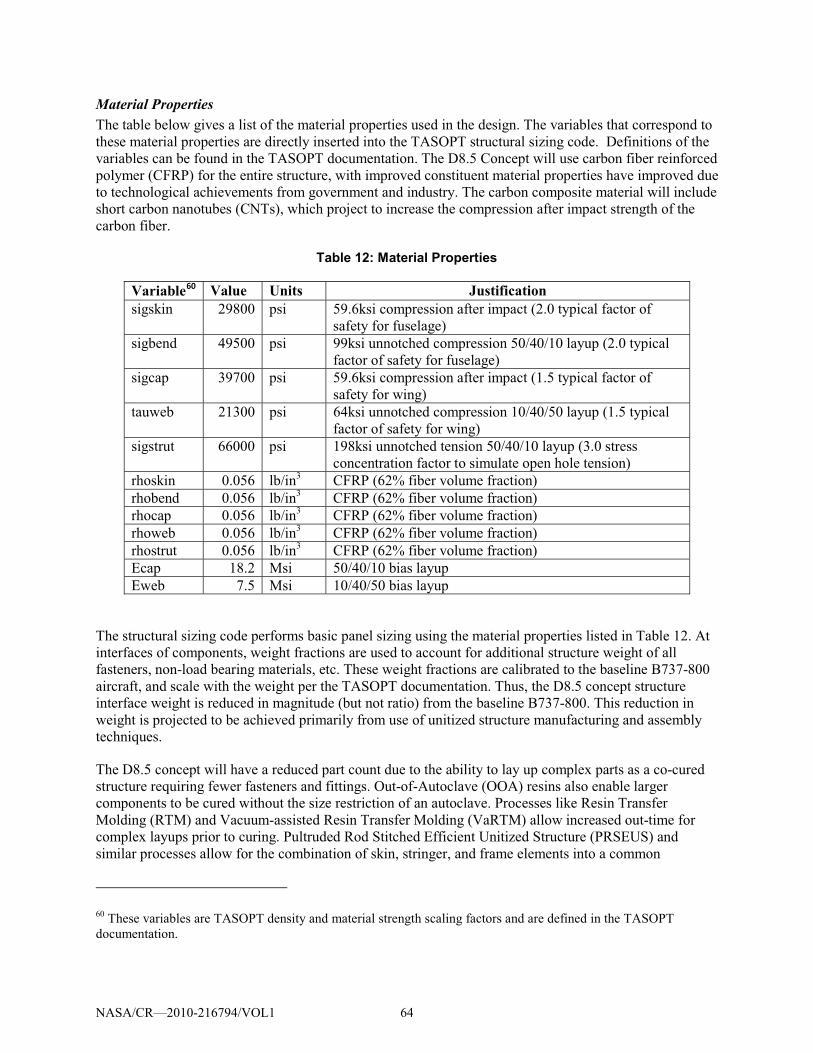
Material Properties The table below gives a list of the material properties used in the design. The variables that correspond to
these material properties are directly inserted into the TASOPT structural sizing code. Definitions of the
variables can be found in the TASOPT documentation. The D8.5 Concept will use carbon fiber reinforced
polymer (CFRP) for the entire structure, with improved constituent material properties have improved due
to technological achievements from government and industry. The carbon composite material will include
short carbon nanotubes (CNTs), which project to increase the compression after impact strength of the
carbon fiber.
Table 12: Material Properties
Variable60 Value Units Justification sigskin 29800 psi 59.6ksi compression after impact (2.0 typical factor of
safety for fuselage)
sigbend 49500 psi 99ksi unnotched compression 50/40/10 layup (2.0 typical
factor of safety for fuselage)
sigcap 39700 psi 59.6ksi compression after impact (1.5 typical factor of
safety for wing)
tauweb 21300 psi 64ksi unnotched compression 10/40/50 layup (1.5 typical
factor of safety for wing)
sigstrut 66000 psi 198ksi unnotched tension 50/40/10 layup (3.0 stress
concentration factor to simulate open hole tension)
rhoskin 0.056 lb/in3 CFRP (62% fiber volume fraction)
rhobend 0.056 lb/in3 CFRP (62% fiber volume fraction)
rhocap 0.056 lb/in3 CFRP (62% fiber volume fraction)
rhoweb 0.056 lb/in3 CFRP (62% fiber volume fraction)
rhostrut 0.056 lb/in3 CFRP (62% fiber volume fraction)
Ecap 18.2 Msi 50/40/10 bias layup
Eweb 7.5 Msi 10/40/50 bias layup
The structural sizing code performs basic panel sizing using the material properties listed in Table 12. At
interfaces of components, weight fractions are used to account for additional structure weight of all
fasteners, non-load bearing materials, etc. These weight fractions are calibrated to the baseline B737-800
aircraft, and scale with the weight per the TASOPT documentation. Thus, the D8.5 concept structure
interface weight is reduced in magnitude (but not ratio) from the baseline B737-800. This reduction in
weight is projected to be achieved primarily from use of unitized structure manufacturing and assembly
techniques.
The D8.5 concept will have a reduced part count due to the ability to lay up complex parts as a co-cured
structure requiring fewer fasteners and fittings. Out-of-Autoclave (OOA) resins also enable larger
components to be cured without the size restriction of an autoclave. Processes like Resin Transfer
Molding (RTM) and Vacuum-assisted Resin Transfer Molding (VaRTM) allow increased out-time for
complex layups prior to curing. Pultruded Rod Stitched Efficient Unitized Structure (PRSEUS) and
similar processes allow for the combination of skin, stringer, and frame elements into a common
60 These variables are TASOPT density and material strength scaling factors and are defined in the TASOPT
documentation.
NASA/CR—2010-216794/VOL1 64
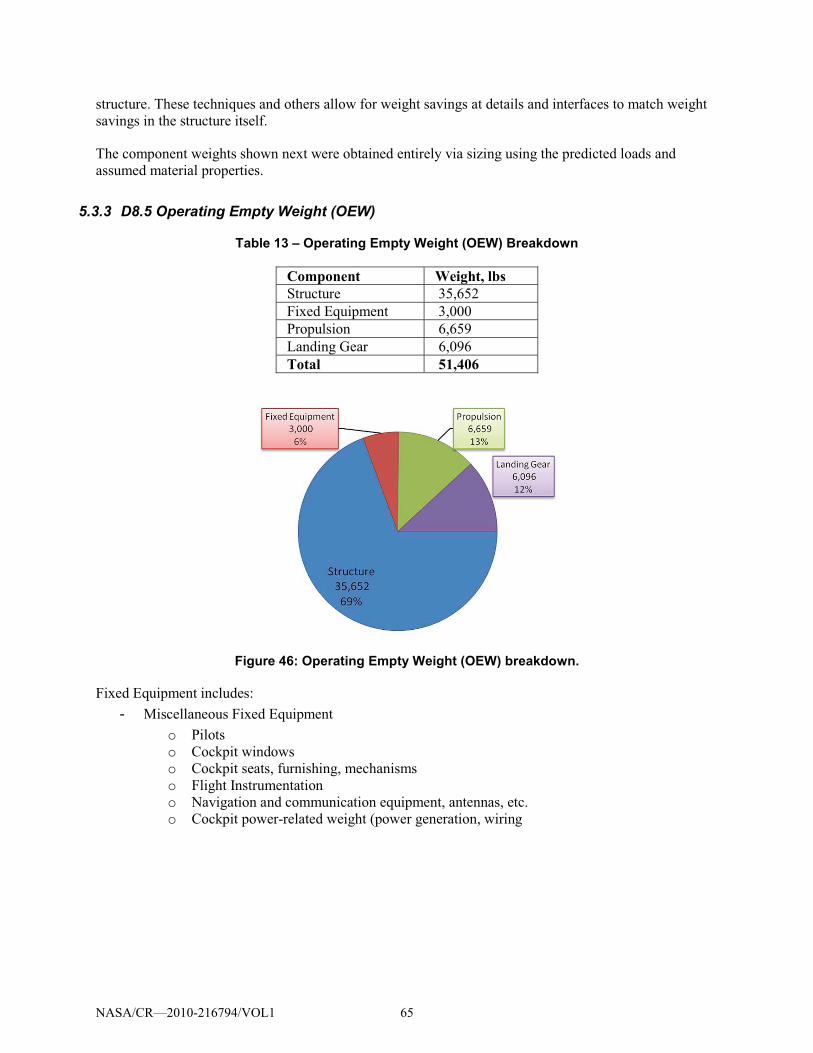
structure. These techniques and others allow for weight savings at details and interfaces to match weight
savings in the structure itself.
The component weights shown next were obtained entirely via sizing using the predicted loads and
assumed material properties.
5.3.3 D8.5 Operating Empty Weight (OEW)
Table 13 – Operating Empty Weight (OEW) Breakdown
Component Weight, lbs Structure 35,652
Fixed Equipment 3,000
Propulsion 6,659
Landing Gear 6,096
Total 51,406
Figure 46: Operating Empty Weight (OEW) breakdown.
Fixed Equipment includes:
- Miscellaneous Fixed Equipment
o Pilots
o Cockpit windows
o Cockpit seats, furnishing, mechanisms
o Flight Instrumentation
o Navigation and communication equipment, antennas, etc.
o Cockpit power-related weight (power generation, wiring
NASA/CR—2010-216794/VOL1 65
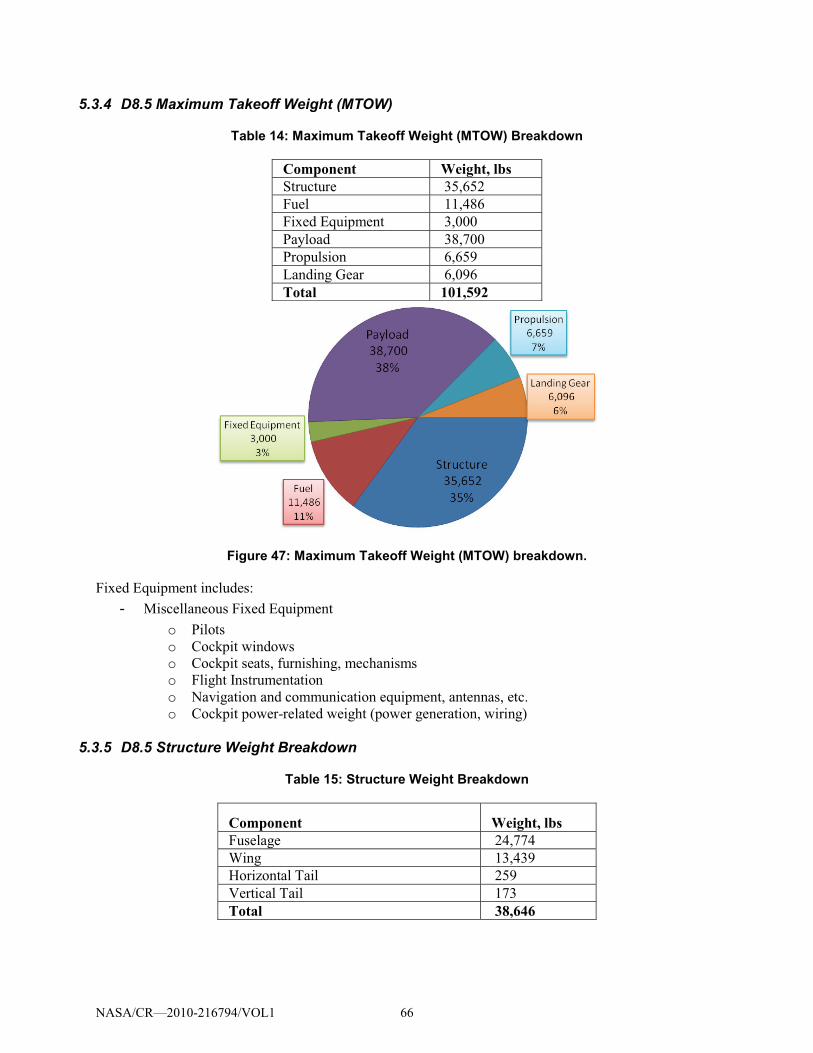
5.3.4 D8.5 Maximum Takeoff Weight (MTOW)
Table 14: Maximum Takeoff Weight (MTOW) Breakdown
Component Weight, lbs Structure 35,652
Fuel 11,486
Fixed Equipment 3,000
Payload 38,700
Propulsion 6,659
Landing Gear 6,096
Total 101,592
Figure 47: Maximum Takeoff Weight (MTOW) breakdown.
Fixed Equipment includes:
- Miscellaneous Fixed Equipment
o Pilots
o Cockpit windows
o Cockpit seats, furnishing, mechanisms
o Flight Instrumentation
o Navigation and communication equipment, antennas, etc.
o Cockpit power-related weight (power generation, wiring)
5.3.5 D8.5 Structure Weight Breakdown
Table 15: Structure Weight Breakdown
Component Weight, lbs Fuselage 24,774
Wing 13,439
Horizontal Tail 259
Vertical Tail 173
Total 38,646
NASA/CR—2010-216794/VOL1 66
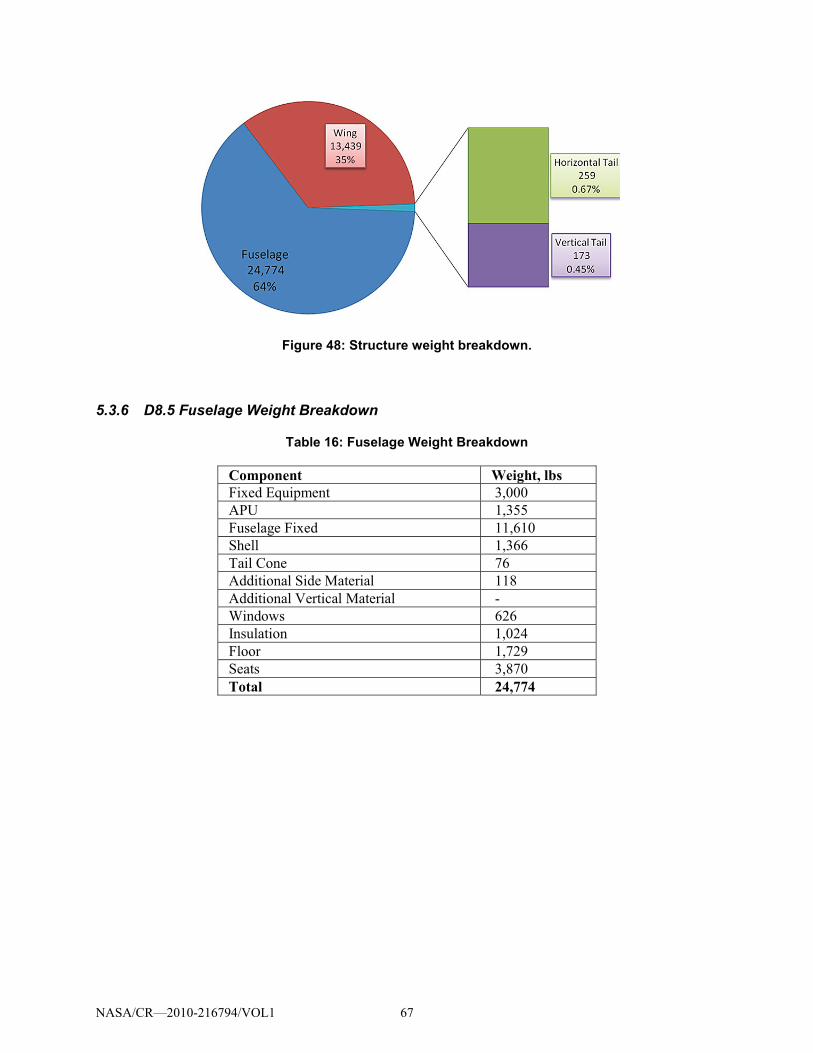
Figure 48: Structure weight breakdown.
5.3.6 D8.5 Fuselage Weight Breakdown
Table 16: Fuselage Weight Breakdown
Component Weight, lbs Fixed Equipment 3,000
APU 1,355
Fuselage Fixed 11,610
Shell 1,366
Tail Cone 76
Additional Side Material 118
Additional Vertical Material -
Windows 626
Insulation 1,024
Floor 1,729
Seats 3,870
Total 24,774
NASA/CR—2010-216794/VOL1 67
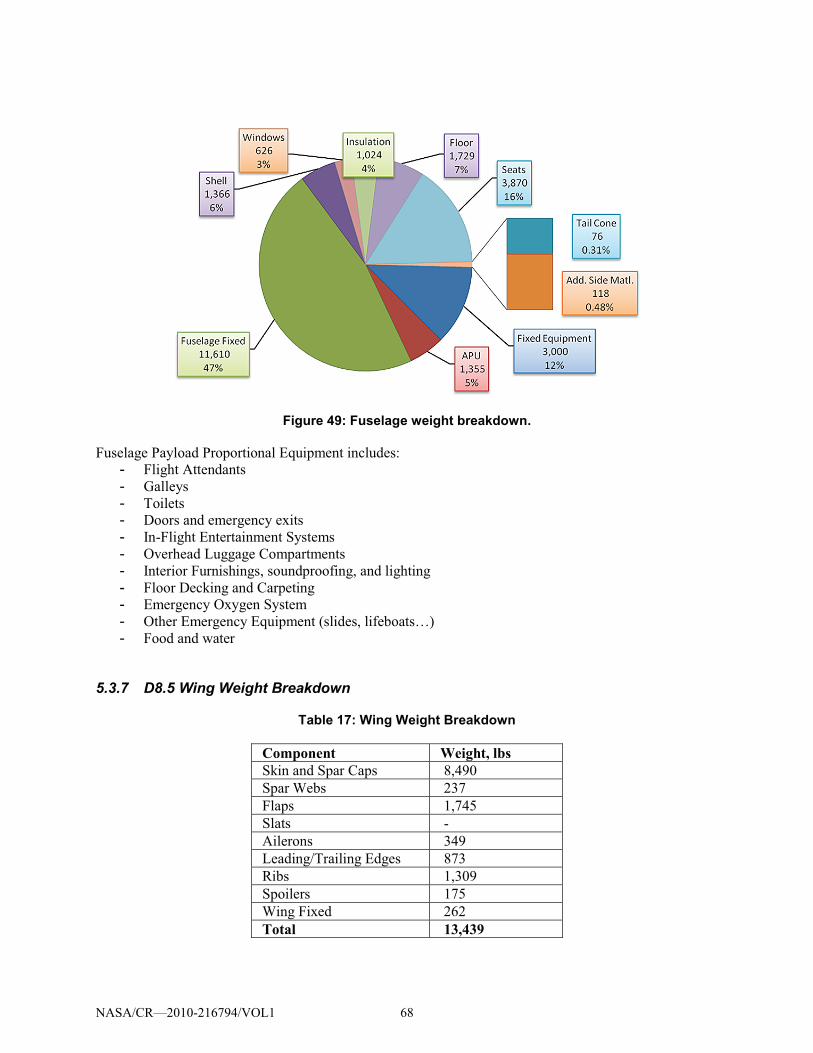
Figure 49: Fuselage weight breakdown.
Fuselage Payload Proportional Equipment includes:
- Flight Attendants
- Galleys
- Toilets
- Doors and emergency exits
- In-Flight Entertainment Systems
- Overhead Luggage Compartments
- Interior Furnishings, soundproofing, and lighting
- Floor Decking and Carpeting
- Emergency Oxygen System
- Other Emergency Equipment (slides, lifeboats…)
- Food and water
5.3.7 D8.5 Wing Weight Breakdown
Table 17: Wing Weight Breakdown
Component Weight, lbs Skin and Spar Caps 8,490
Spar Webs 237
Flaps 1,745
Slats -
Ailerons 349
Leading/Trailing Edges 873
Ribs 1,309
Spoilers 175
Wing Fixed 262
Total 13,439
NASA/CR—2010-216794/VOL1 68
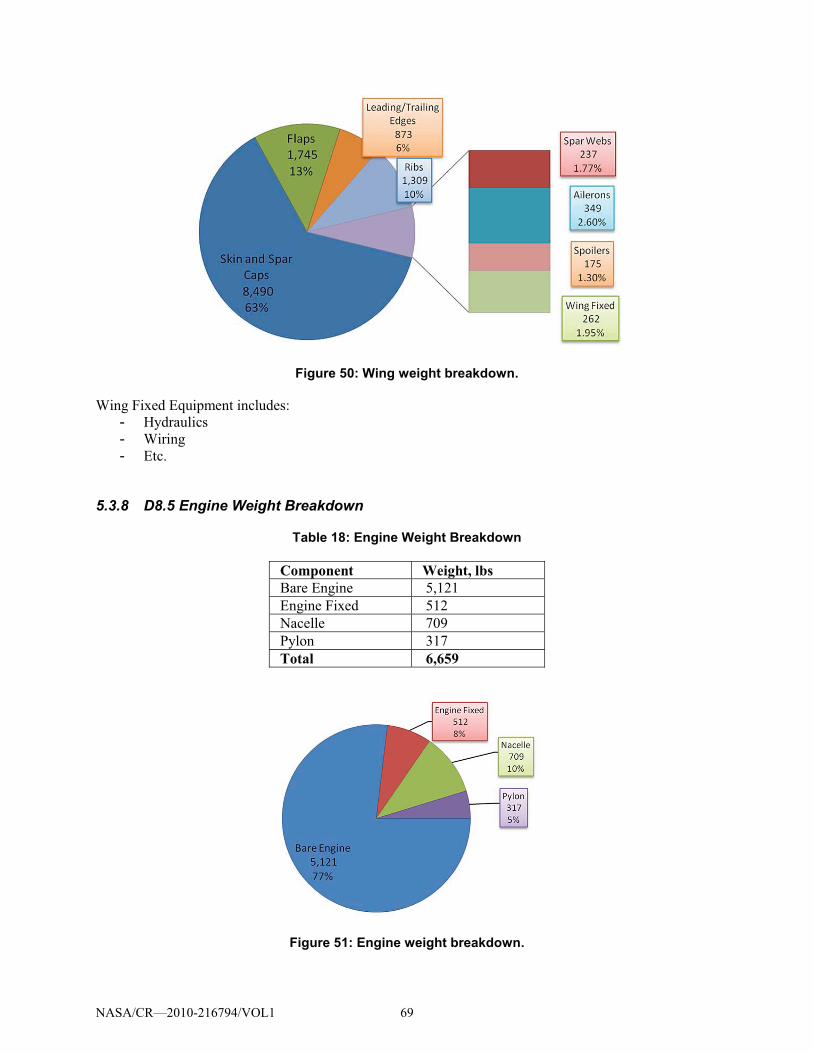
Figure 50: Wing weight breakdown.
Wing Fixed Equipment includes:
- Hydraulics
- Wiring
- Etc.
5.3.8 D8.5 Engine Weight Breakdown
Table 18: Engine Weight Breakdown
Component Weight, lbs Bare Engine 5,121
Engine Fixed 512
Nacelle 709
Pylon 317
Total 6,659
Figure 51: Engine weight breakdown.
NASA/CR—2010-216794/VOL1 69
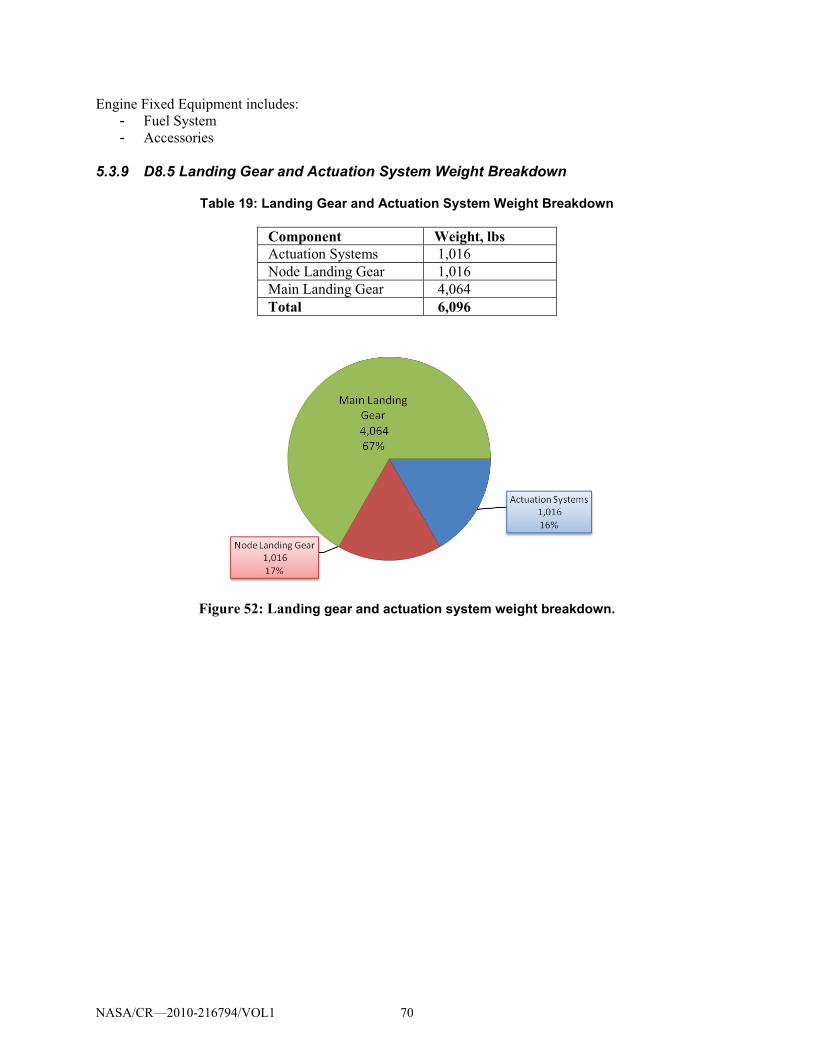
Engine Fixed Equipment includes:
- Fuel System
- Accessories
5.3.9 D8.5 Landing Gear and Actuation System Weight Breakdown
Table 19: Landing Gear and Actuation System Weight Breakdown
Component Weight, lbs Actuation Systems 1,016
Node Landing Gear 1,016
Main Landing Gear 4,064
Total 6,096
Figure 52: Landing gear and actuation system weight breakdown.
NASA/CR—2010-216794/VOL1 70
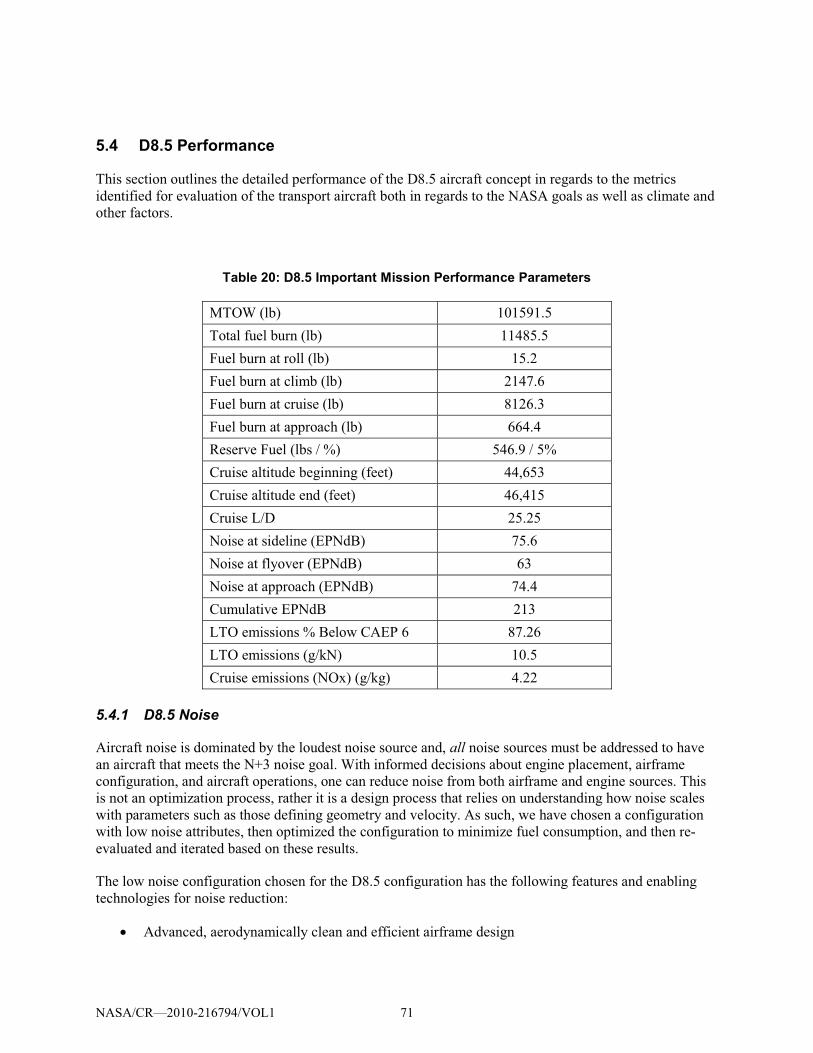
5.4 D8.5 Performance
This section outlines the detailed performance of the D8.5 aircraft concept in regards to the metrics
identified for evaluation of the transport aircraft both in regards to the NASA goals as well as climate and
other factors.
Table 20: D8.5 Important Mission Performance Parameters
MTOW (lb) 101591.5
Total fuel burn (lb) 11485.5
Fuel burn at roll (lb) 15.2
Fuel burn at climb (lb) 2147.6
Fuel burn at cruise (lb) 8126.3
Fuel burn at approach (lb) 664.4
Reserve Fuel (lbs / %) 546.9 / 5%
Cruise altitude beginning (feet) 44,653
Cruise altitude end (feet) 46,415
Cruise L/D 25.25
Noise at sideline (EPNdB) 75.6
Noise at flyover (EPNdB) 63
Noise at approach (EPNdB) 74.4
Cumulative EPNdB 213
LTO emissions % Below CAEP 6 87.26
LTO emissions (g/kN) 10.5
Cruise emissions (NOx) (g/kg) 4.22
5.4.1 D8.5 Noise
Aircraft noise is dominated by the loudest noise source and, all noise sources must be addressed to have
an aircraft that meets the N+3 noise goal. With informed decisions about engine placement, airframe
configuration, and aircraft operations, one can reduce noise from both airframe and engine sources. This
is not an optimization process, rather it is a design process that relies on understanding how noise scales
with parameters such as those defining geometry and velocity. As such, we have chosen a configuration
with low noise attributes, then optimized the configuration to minimize fuel consumption, and then re-
evaluated and iterated based on these results.
The low noise configuration chosen for the D8.5 configuration has the following features and enabling
technologies for noise reduction:
� Advanced, aerodynamically clean and efficient airframe design
NASA/CR—2010-216794/VOL1 71
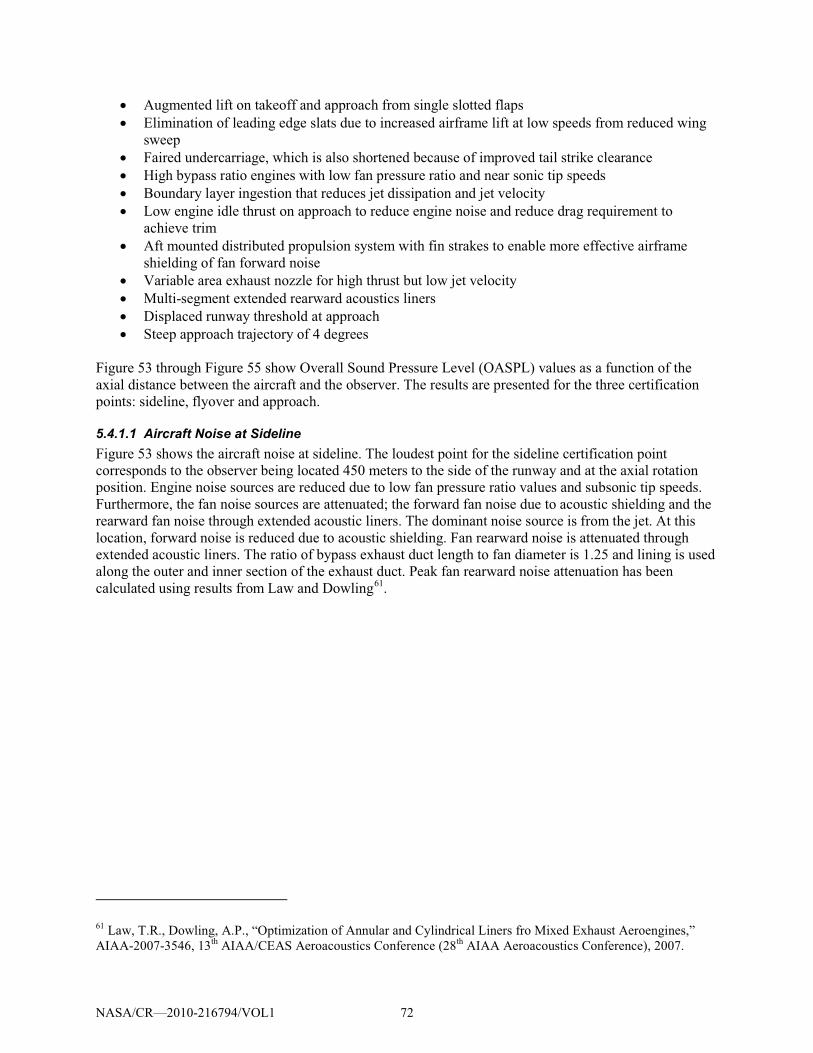
� Augmented lift on takeoff and approach from single slotted flaps
� Elimination of leading edge slats due to increased airframe lift at low speeds from reduced wing
sweep
� Faired undercarriage, which is also shortened because of improved tail strike clearance
� High bypass ratio engines with low fan pressure ratio and near sonic tip speeds
� Boundary layer ingestion that reduces jet dissipation and jet velocity
� Low engine idle thrust on approach to reduce engine noise and reduce drag requirement to
achieve trim
� Aft mounted distributed propulsion system with fin strakes to enable more effective airframe
shielding of fan forward noise
� Variable area exhaust nozzle for high thrust but low jet velocity
� Multi-segment extended rearward acoustics liners
� Displaced runway threshold at approach
� Steep approach trajectory of 4 degrees
Figure 53 through Figure 55 show Overall Sound Pressure Level (OASPL) values as a function of the
axial distance between the aircraft and the observer. The results are presented for the three certification
points: sideline, flyover and approach.
5.4.1.1 Aircraft Noise at Sideline Figure 53 shows the aircraft noise at sideline. The loudest point for the sideline certification point
corresponds to the observer being located 450 meters to the side of the runway and at the axial rotation
position. Engine noise sources are reduced due to low fan pressure ratio values and subsonic tip speeds.
Furthermore, the fan noise sources are attenuated; the forward fan noise due to acoustic shielding and the
rearward fan noise through extended acoustic liners. The dominant noise source is from the jet. At this
location, forward noise is reduced due to acoustic shielding. Fan rearward noise is attenuated through
extended acoustic liners. The ratio of bypass exhaust duct length to fan diameter is 1.25 and lining is used
along the outer and inner section of the exhaust duct. Peak fan rearward noise attenuation has been
calculated using results from Law and Dowling61
61 Law, T.R., Dowling, A.P., “Optimization of Annular and Cylindrical Liners fro Mixed Exhaust Aeroengines,”
AIAA-2007-3546, 13th
AIAA/CEAS Aeroacoustics Conference (28th
AIAA Aeroacoustics Conference), 2007.
.
NASA/CR—2010-216794/VOL1 72
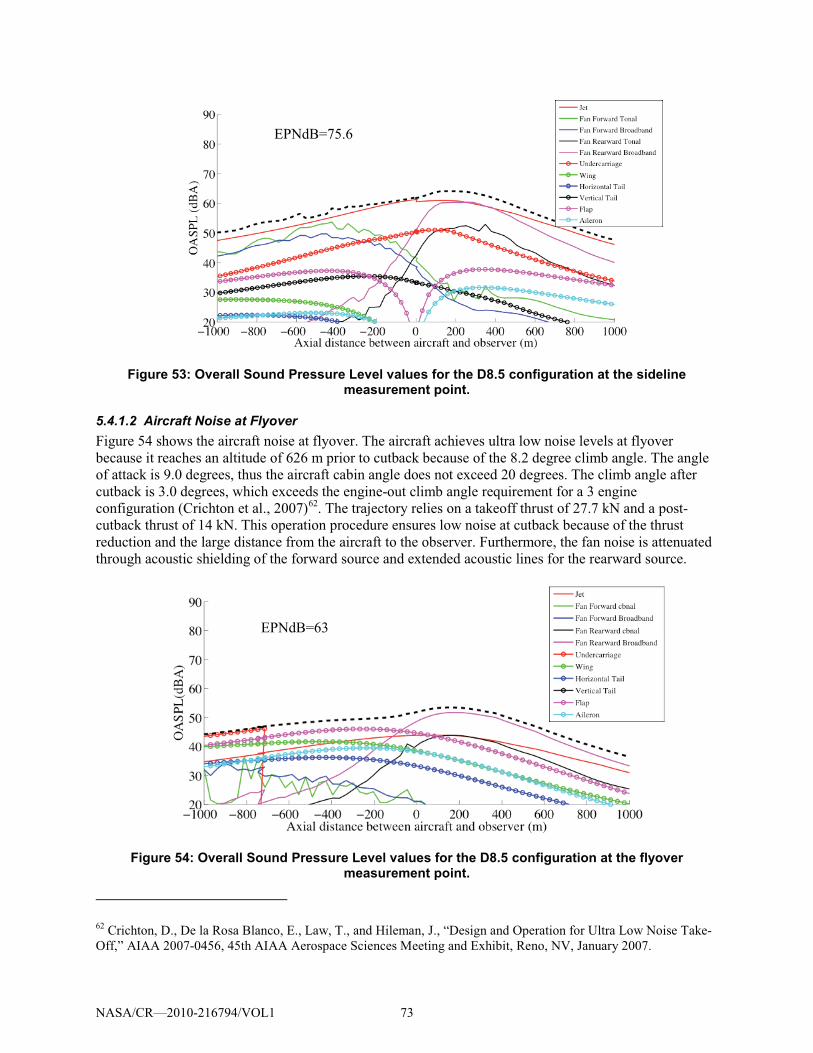
Figure 53: Overall Sound Pressure Level values for the D8.5 configuration at the sideline measurement point.
5.4.1.2 Aircraft Noise at Flyover Figure 54 shows the aircraft noise at flyover. The aircraft achieves ultra low noise levels at flyover
because it reaches an altitude of 626 m prior to cutback because of the 8.2 degree climb angle. The angle
of attack is 9.0 degrees, thus the aircraft cabin angle does not exceed 20 degrees. The climb angle after
cutback is 3.0 degrees, which exceeds the engine-out climb angle requirement for a 3 engine
configuration (Crichton et al., 2007)62
. The trajectory relies on a takeoff thrust of 27.7 kN and a post-
cutback thrust of 14 kN. This operation procedure ensures low noise at cutback because of the thrust
reduction and the large distance from the aircraft to the observer. Furthermore, the fan noise is attenuated
through acoustic shielding of the forward source and extended acoustic lines for the rearward source.
Figure 54: Overall Sound Pressure Level values for the D8.5 configuration at the flyover measurement point.
62 Crichton, D., De la Rosa Blanco, E., Law, T., and Hileman, J., “Design and Operation for Ultra Low Noise Take-
Off,” AIAA 2007-0456, 45th AIAA Aerospace Sciences Meeting and Exhibit, Reno, NV, January 2007.
EPNdB=75.6
EPNdB=63
NASA/CR—2010-216794/VOL1 73
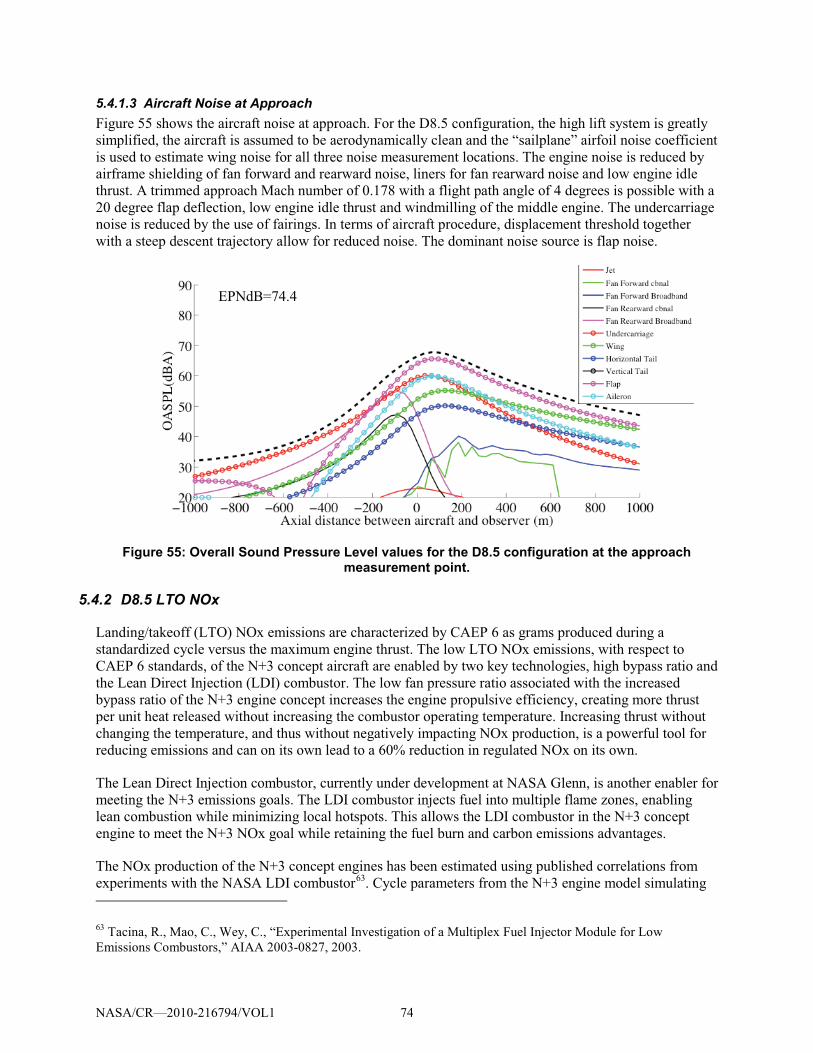
5.4.1.3 Aircraft Noise at Approach Figure 55 shows the aircraft noise at approach. For the D8.5 configuration, the high lift system is greatly
simplified, the aircraft is assumed to be aerodynamically clean and the “sailplane” airfoil noise coefficient
is used to estimate wing noise for all three noise measurement locations. The engine noise is reduced by
airframe shielding of fan forward and rearward noise, liners for fan rearward noise and low engine idle
thrust. A trimmed approach Mach number of 0.178 with a flight path angle of 4 degrees is possible with a
20 degree flap deflection, low engine idle thrust and windmilling of the middle engine. The undercarriage
noise is reduced by the use of fairings. In terms of aircraft procedure, displacement threshold together
with a steep descent trajectory allow for reduced noise. The dominant noise source is flap noise.
Figure 55: Overall Sound Pressure Level values for the D8.5 configuration at the approach measurement point.
5.4.2 D8.5 LTO NOx
Landing/takeoff (LTO) NOx emissions are characterized by CAEP 6 as grams produced during a
standardized cycle versus the maximum engine thrust. The low LTO NOx emissions, with respect to
CAEP 6 standards, of the N+3 concept aircraft are enabled by two key technologies, high bypass ratio and
the Lean Direct Injection (LDI) combustor. The low fan pressure ratio associated with the increased
bypass ratio of the N+3 engine concept increases the engine propulsive efficiency, creating more thrust
per unit heat released without increasing the combustor operating temperature. Increasing thrust without
changing the temperature, and thus without negatively impacting NOx production, is a powerful tool for
reducing emissions and can on its own lead to a 60% reduction in regulated NOx on its own.
The Lean Direct Injection combustor, currently under development at NASA Glenn, is another enabler for
meeting the N+3 emissions goals. The LDI combustor injects fuel into multiple flame zones, enabling
lean combustion while minimizing local hotspots. This allows the LDI combustor in the N+3 concept
engine to meet the N+3 NOx goal while retaining the fuel burn and carbon emissions advantages.
The NOx production of the N+3 concept engines has been estimated using published correlations from
experiments with the NASA LDI combustor63
63 Tacina, R., Mao, C., Wey, C., “Experimental Investigation of a Multiplex Fuel Injector Module for Low
Emissions Combustors,” AIAA 2003-0827, 2003.
. Cycle parameters from the N+3 engine model simulating
EPNdB=74.4
NASA/CR—2010-216794/VOL1 74
relevant operating conditions from the LTO cycle (100%, 85%, 30%, and 7% SLS max thrust) are used as
inputs to the correlation. A limit of 4 grams of NOx per kg of fuel was used to represent the minimum
NOx production based on existing engine data at idle, as suggested by Dr. Chi-Ming Lee at NASA GRC.
The percentage of CAEP 6 NOx produced by each engine concept is determined by integrating the
predicted NOx production over the time specified by the CAEP LTO cycle. Cruise NOx was estimated
based on the calculated engine conditions at cruise with the same combustor correlations and limits.
Table 21: D8.5 NOx Performance Results
LTO emissions % Below CAEP 6 87.26
LTO emissions (g/kN) 10.5
Cruise emissions (NOx) (g/kg) 4.22
5.4.3 D8.5 PFEI
The reference mission for the D8 series aircraft was selected in order to have the greatest impact if this
aircraft were inserted into the fleet. A 180 passenger B737 type aircraft would provide the D8.5 an
opportunity to replace a significant portion of the currently operating fleet. The choice of a 3000 nm
mission with reserves would allow the D8.5 aircraft to complete a North American transcontinental route
such as Seattle to Miami. This combination of a 180 passenger payload with a 3000 nm mission puts the
total aircraft productivity outside of that of the currently operated B737-800 configurations. To validate
the design/optimization code for the D8 aircraft a B737-800 class aircraft was designed and run through
the optimization process (See Figure 42). Once the design code output matched that of the B737-800
stated performance, the code was rerun with a single class 180 passenger configuration, at a range of 3000
nm. This optimized design output was used as the baseline for comparison for the NASA N+3 goals. For
reference the calculated PFEI was 7.43 kJ/kg-km and the PFEI of a B737-800 presented in the 12 month
review and shown in Figure 30 in Section 3.1.4, was 7.1 KJ/kg-km.
Table 22: Payload Fuel Energy Intensity Performance
D8.5 PFEI (kJ/kg-km) 2.17 (-70.8%)64
D8.1 PFEI (kJ/kg-km)
3.79 (-48.9%)
737-800 TASOPT Baseline (kJ/kg-km) 7.43 (-0%)
NASA N+3 Goal PFEI (kJ/kg-km) 2.23 (-70%)
Although aircraft may be designed to meet a specific range and payload capacity, airlines fly their aircraft
over a wide variety of distances to meet the needs of their route structures. To this variation, the Bureau
of Transportation Statistics (BTS) database was examined to find the actual variation in payload carried
and range flown. The result is shown in Figure 56, which contains a map of operation-weighted contours
of payload and range for U.S. operations of the Boeing 737-800 in 2006. Darker colors indicate more
operations flown for a given payload-range combination. The payload range diagram is given for
comparison.
The average distance flown was 1096 nm with standard deviation 556 nm. As is typical for all aircraft
types, the Boeing 737-800 was generally operated at a range well below R1 (defined here as the
64 Percent reduction from B737-800 baseline as calculated from validated TASOPT B737 case.
NASA/CR—2010-216794/VOL1 75
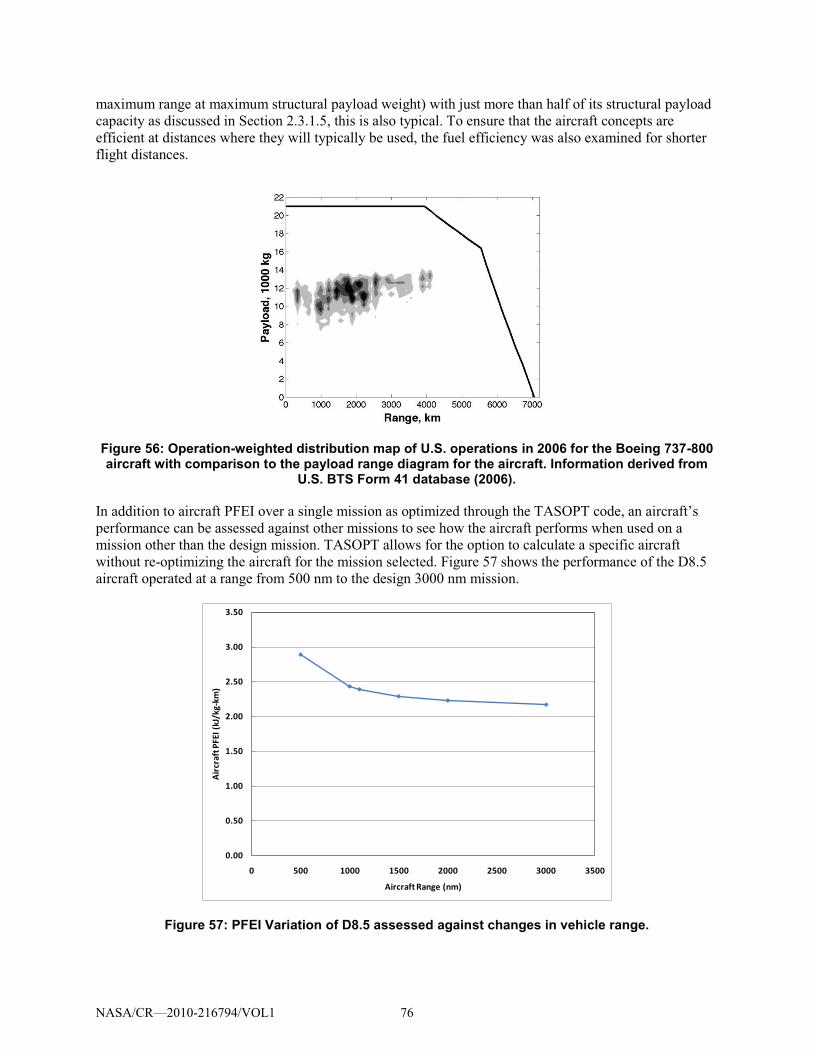
maximum range at maximum structural payload weight) with just more than half of its structural payload
capacity as discussed in Section 2.3.1.5, this is also typical. To ensure that the aircraft concepts are
efficient at distances where they will typically be used, the fuel efficiency was also examined for shorter
flight distances.
Figure 56: Operation-weighted distribution map of U.S. operations in 2006 for the Boeing 737-800 aircraft with comparison to the payload range diagram for the aircraft. Information derived from
U.S. BTS Form 41 database (2006).
In addition to aircraft PFEI over a single mission as optimized through the TASOPT code, an aircraft’s
performance can be assessed against other missions to see how the aircraft performs when used on a
mission other than the design mission. TASOPT allows for the option to calculate a specific aircraft
without re-optimizing the aircraft for the mission selected. Figure 57 shows the performance of the D8.5
aircraft operated at a range from 500 nm to the design 3000 nm mission.
0.00
0.50
1.00
1.50
2.00
2.50
3.00
3.50
0 500 1000 1500 2000 2500 3000 3500
Air
craf
t PFE
I (kJ
/kg-
km)
Aircraft Range (nm)
Figure 57: PFEI Variation of D8.5 assessed against changes in vehicle range.
NASA/CR—2010-216794/VOL1 76
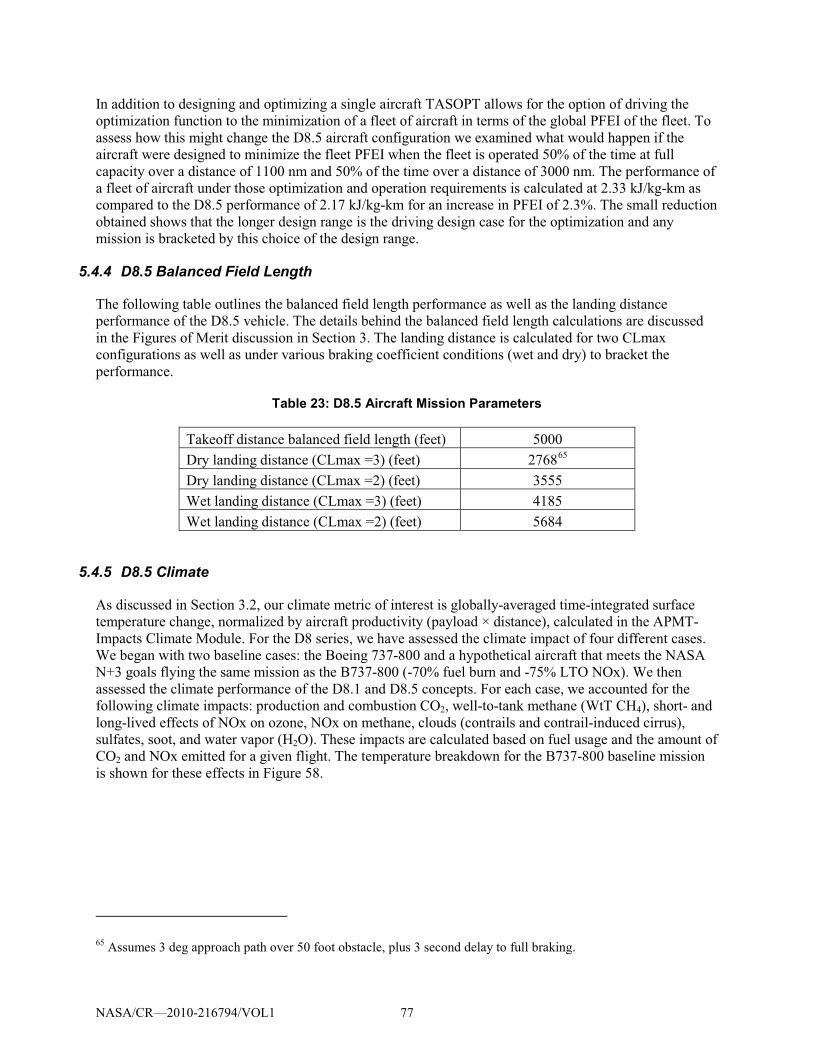
In addition to designing and optimizing a single aircraft TASOPT allows for the option of driving the
optimization function to the minimization of a fleet of aircraft in terms of the global PFEI of the fleet. To
assess how this might change the D8.5 aircraft configuration we examined what would happen if the
aircraft were designed to minimize the fleet PFEI when the fleet is operated 50% of the time at full
capacity over a distance of 1100 nm and 50% of the time over a distance of 3000 nm. The performance of
a fleet of aircraft under those optimization and operation requirements is calculated at 2.33 kJ/kg-km as
compared to the D8.5 performance of 2.17 kJ/kg-km for an increase in PFEI of 2.3%. The small reduction
obtained shows that the longer design range is the driving design case for the optimization and any
mission is bracketed by this choice of the design range.
5.4.4 D8.5 Balanced Field Length
The following table outlines the balanced field length performance as well as the landing distance
performance of the D8.5 vehicle. The details behind the balanced field length calculations are discussed
in the Figures of Merit discussion in Section 3. The landing distance is calculated for two CLmax
configurations as well as under various braking coefficient conditions (wet and dry) to bracket the
performance.
Table 23: D8.5 Aircraft Mission Parameters
Takeoff distance balanced field length (feet) 5000
Dry landing distance (CLmax =3) (feet) 276865
Dry landing distance (CLmax =2) (feet)
3555
Wet landing distance (CLmax =3) (feet) 4185
Wet landing distance (CLmax =2) (feet) 5684
5.4.5 D8.5 Climate
As discussed in Section 3.2, our climate metric of interest is globally-averaged time-integrated surface
temperature change, normalized by aircraft productivity (payload × distance), calculated in the APMT-
Impacts Climate Module. For the D8 series, we have assessed the climate impact of four different cases.
We began with two baseline cases: the Boeing 737-800 and a hypothetical aircraft that meets the NASA
N+3 goals flying the same mission as the B737-800 (-70% fuel burn and -75% LTO NOx). We then
assessed the climate performance of the D8.1 and D8.5 concepts. For each case, we accounted for the
following climate impacts: production and combustion CO2, well-to-tank methane (WtT CH4), short- and
long-lived effects of NOx on ozone, NOx on methane, clouds (contrails and contrail-induced cirrus),
sulfates, soot, and water vapor (H2O). These impacts are calculated based on fuel usage and the amount of
CO2 and NOx emitted for a given flight. The temperature breakdown for the B737-800 baseline mission
is shown for these effects in Figure 58.
65 Assumes 3 deg approach path over 50 foot obstacle, plus 3 second delay to full braking.
NASA/CR—2010-216794/VOL1 77
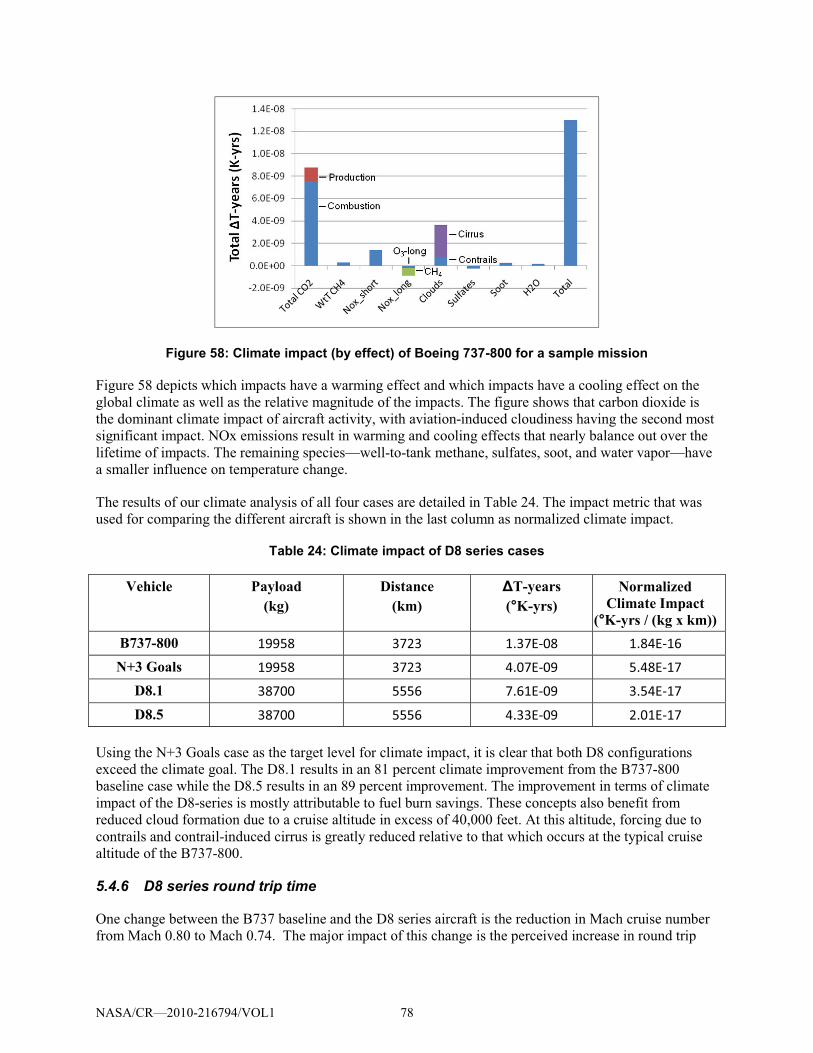
Figure 58: Climate impact (by effect) of Boeing 737-800 for a sample mission
Figure 58 depicts which impacts have a warming effect and which impacts have a cooling effect on the
global climate as well as the relative magnitude of the impacts. The figure shows that carbon dioxide is
the dominant climate impact of aircraft activity, with aviation-induced cloudiness having the second most
significant impact. NOx emissions result in warming and cooling effects that nearly balance out over the
lifetime of impacts. The remaining species—well-to-tank methane, sulfates, soot, and water vapor—have
a smaller influence on temperature change.
The results of our climate analysis of all four cases are detailed in Table 24. The impact metric that was
used for comparing the different aircraft is shown in the last column as normalized climate impact.
Table 24: Climate impact of D8 series cases
Vehicle Payload (kg)
Distance (km)
�T-years (°K-yrs)
Normalized Climate Impact
(°K-yrs / (kg x km)) B737-800 19958 3723 1.37E-08 1.84E-16
N+3 Goals 19958 3723 4.07E-09 5.48E-17
D8.1 38700 5556 7.61E-09 3.54E-17
D8.5 38700 5556 4.33E-09 2.01E-17
Using the N+3 Goals case as the target level for climate impact, it is clear that both D8 configurations
exceed the climate goal. The D8.1 results in an 81 percent climate improvement from the B737-800
baseline case while the D8.5 results in an 89 percent improvement. The improvement in terms of climate
impact of the D8-series is mostly attributable to fuel burn savings. These concepts also benefit from
reduced cloud formation due to a cruise altitude in excess of 40,000 feet. At this altitude, forcing due to
contrails and contrail-induced cirrus is greatly reduced relative to that which occurs at the typical cruise
altitude of the B737-800.
5.4.6 D8 series round trip time
One change between the B737 baseline and the D8 series aircraft is the reduction in Mach cruise number
from Mach 0.80 to Mach 0.74. The major impact of this change is the perceived increase in round trip
NASA/CR—2010-216794/VOL1 78
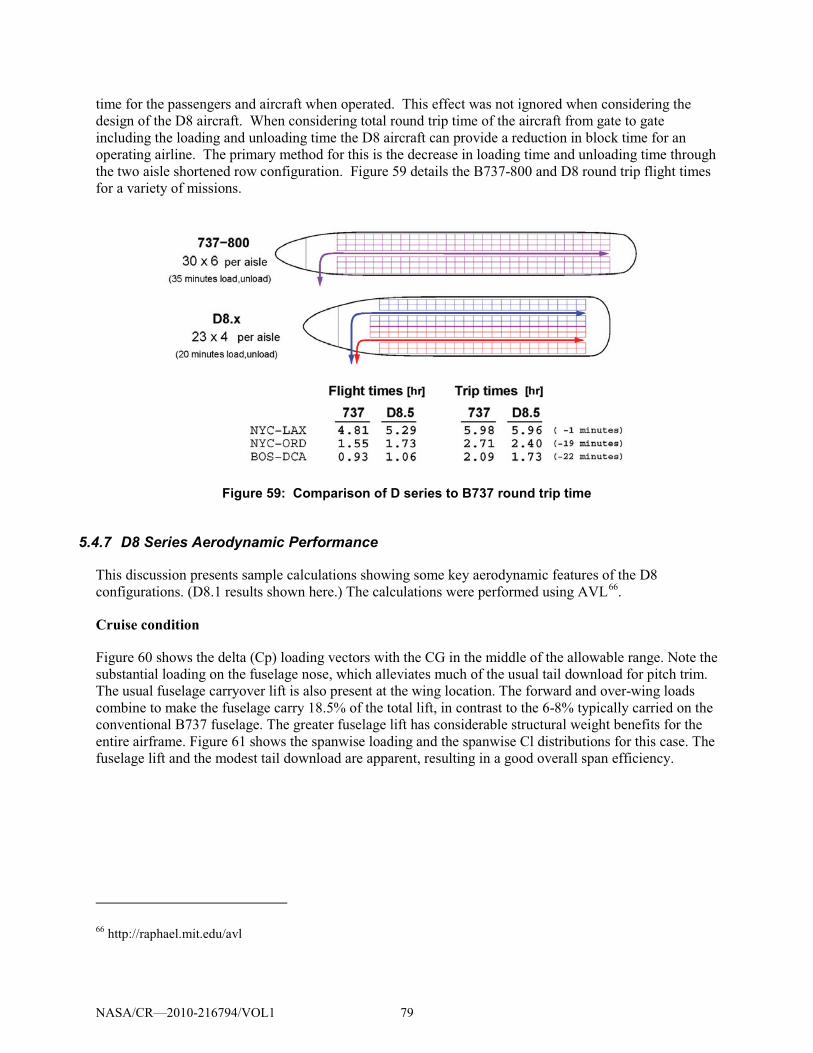
time for the passengers and aircraft when operated. This effect was not ignored when considering the
design of the D8 aircraft. When considering total round trip time of the aircraft from gate to gate
including the loading and unloading time the D8 aircraft can provide a reduction in block time for an
operating airline. The primary method for this is the decrease in loading time and unloading time through
the two aisle shortened row configuration. Figure 59 details the B737-800 and D8 round trip flight times
for a variety of missions.
Figure 59: Comparison of D series to B737 round trip time
5.4.7 D8 Series Aerodynamic Performance
This discussion presents sample calculations showing some key aerodynamic features of the D8
configurations. (D8.1 results shown here.) The calculations were performed using AVL66
Cruise condition
.
Figure 60 shows the delta (Cp) loading vectors with the CG in the middle of the allowable range. Note the
substantial loading on the fuselage nose, which alleviates much of the usual tail download for pitch trim.
The usual fuselage carryover lift is also present at the wing location. The forward and over-wing loads
combine to make the fuselage carry 18.5% of the total lift, in contrast to the 6-8% typically carried on the
conventional B737 fuselage. The greater fuselage lift has considerable structural weight benefits for the
entire airframe. Figure 61 shows the spanwise loading and the spanwise Cl distributions for this case. The
fuselage lift and the modest tail download are apparent, resulting in a good overall span efficiency.
66 http://raphael.mit.edu/avl
NASA/CR—2010-216794/VOL1 79
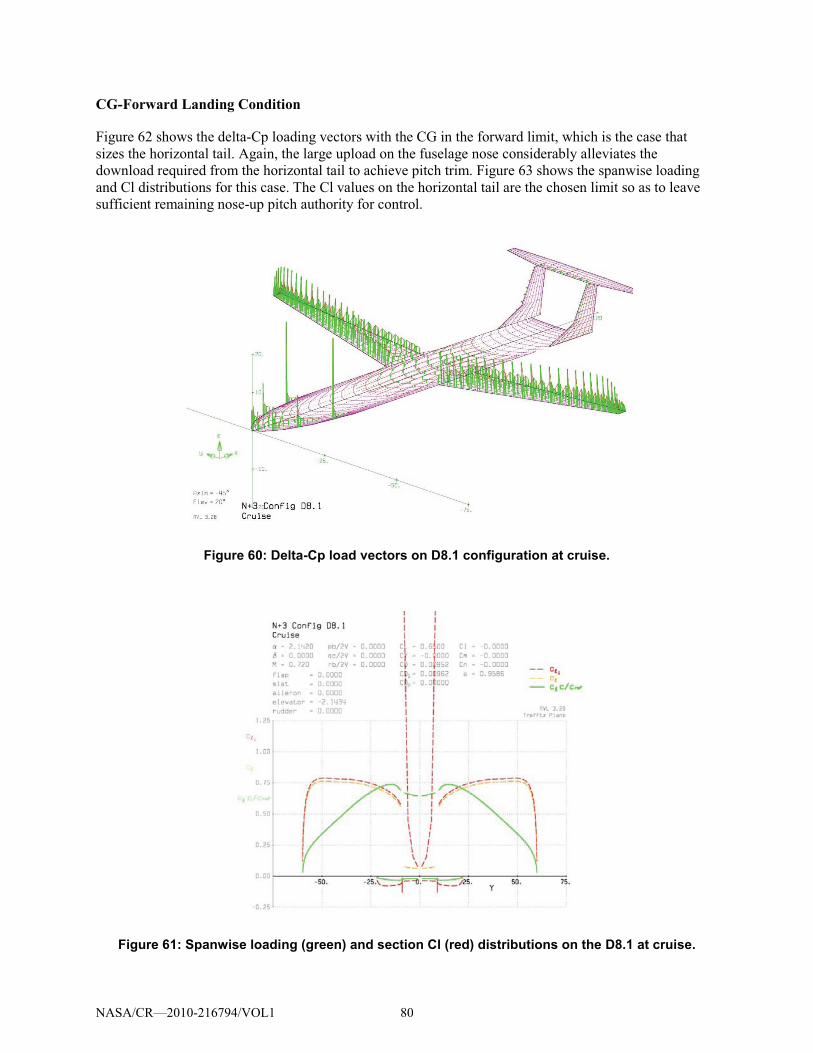
CG-Forward Landing Condition
Figure 62 shows the delta-Cp loading vectors with the CG in the forward limit, which is the case that
sizes the horizontal tail. Again, the large upload on the fuselage nose considerably alleviates the
download required from the horizontal tail to achieve pitch trim. Figure 63 shows the spanwise loading
and Cl distributions for this case. The Cl values on the horizontal tail are the chosen limit so as to leave
sufficient remaining nose-up pitch authority for control.
Figure 60: Delta-Cp load vectors on D8.1 configuration at cruise.
Figure 61: Spanwise loading (green) and section Cl (red) distributions on the D8.1 at cruise.
NASA/CR—2010-216794/VOL1 80
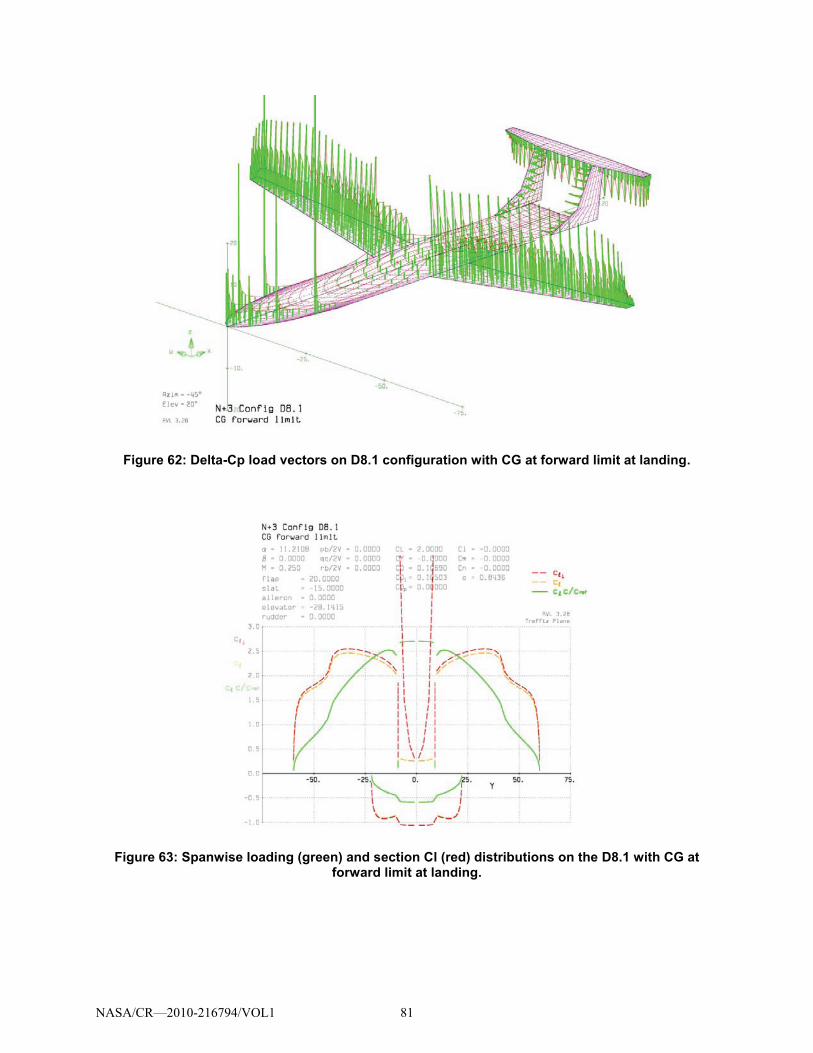
Figure 62: Delta-Cp load vectors on D8.1 configuration with CG at forward limit at landing.
Figure 63: Spanwise loading (green) and section Cl (red) distributions on the D8.1 with CG at forward limit at landing.
NASA/CR—2010-216794/VOL1 81
5.4.8 Preliminary Flutter Study for D8.5
A preliminary flutter study has been performed for the D8.5 configuration using the
structural/aero/control ASWING code. Its flutter prediction capability has been validated against
Theodorsen theory in the primary reference67
, and independently versus NASTRAN by Love et al68
5.4.8.1 ASWING model
.
The physical ASWING model consists of a set of connected beams allowing arbitrarily large
deformations. The beams have distributed mass and inertia representing the structure, payload, and fuel,
and also point masses representing the engines, landing gear, and other major items. The aero loads are
modeled with a compressible unsteady lifting-line formulation and slender-body formulation. Flutter
predictions are computed by an eigenmode analysis of the full linearization of the nonlinear model taken
about any solution state. Analysis over a set of states, over increasing flight speeds for example, gives a
root locus.
5.4.8.2 D8.5 flutter case examined The examined flutter case is flight at max weight at 20 kft altitude, where maximum indicated airspeeds
reach the expected Mach buffet boundary M � 0.8, presumably in a dive. Figure 64 shows the ASWING
system eigenvalues for eight indicated airspeeds from 160 to 188 m/s (311 to 365 kt). No roots cross over
the imaginary axis, which indicates that no static and no dynamic instabilities are present.
67 Drela, M., “Integrated simulation model for preliminary aerodynamic, structural, and control-law design of
aircraft,” AIAA 40th
SDM Conference, Paper 99-1394, April 1999. Also at http://raphael.mit.edu/aswing/.
68 Love, M., Zink, P., Wieselmann, P., Youngren, H., “Body freedom flutter of high aspect ratio flying wings,”
AIAA 46th
SDM Conference, Paper 05-1947, April 2005.
NASA/CR—2010-216794/VOL1 82
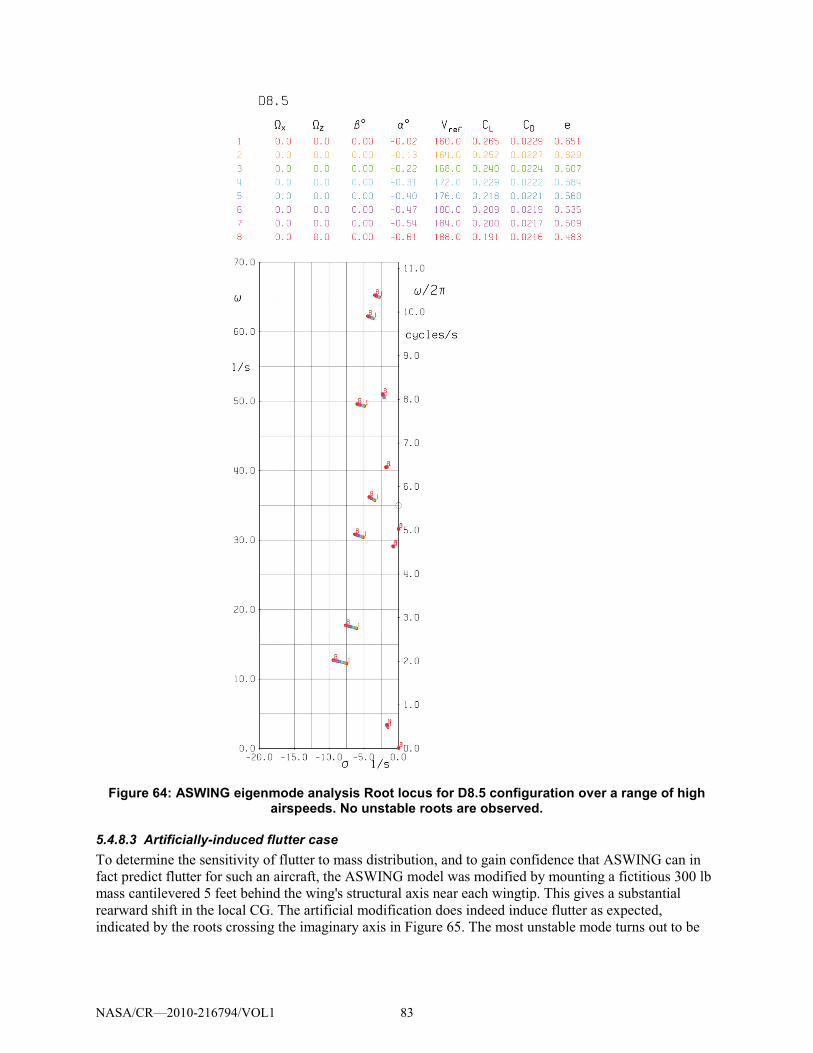
Figure 64: ASWING eigenmode analysis Root locus for D8.5 configuration over a range of high airspeeds. No unstable roots are observed.
5.4.8.3 Artificially-induced flutter case To determine the sensitivity of flutter to mass distribution, and to gain confidence that ASWING can in
fact predict flutter for such an aircraft, the ASWING model was modified by mounting a fictitious 300 lb
mass cantilevered 5 feet behind the wing's structural axis near each wingtip. This gives a substantial
rearward shift in the local CG. The artificial modification does indeed induce flutter as expected,
indicated by the roots crossing the imaginary axis in Figure 65. The most unstable mode turns out to be
NASA/CR—2010-216794/VOL1 83
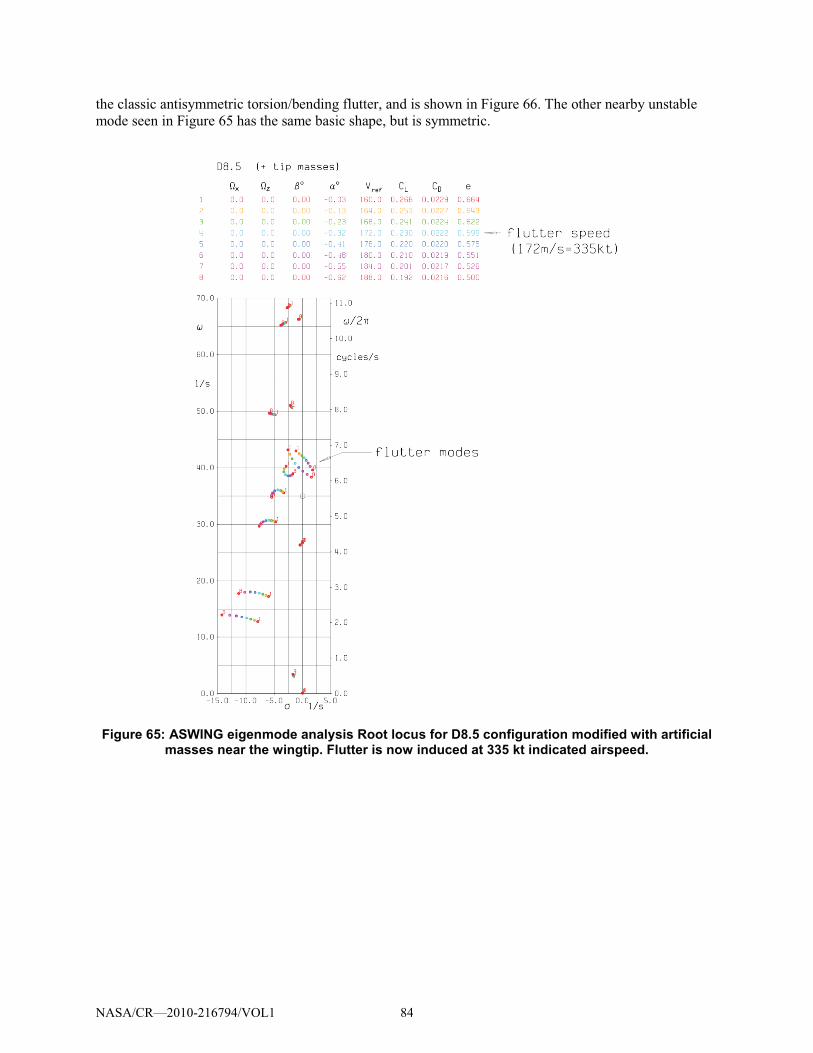
the classic antisymmetric torsion/bending flutter, and is shown in Figure 66. The other nearby unstable
mode seen in Figure 65 has the same basic shape, but is symmetric.
Figure 65: ASWING eigenmode analysis Root locus for D8.5 configuration modified with artificial masses near the wingtip. Flutter is now induced at 335 kt indicated airspeed.
NASA/CR—2010-216794/VOL1 84
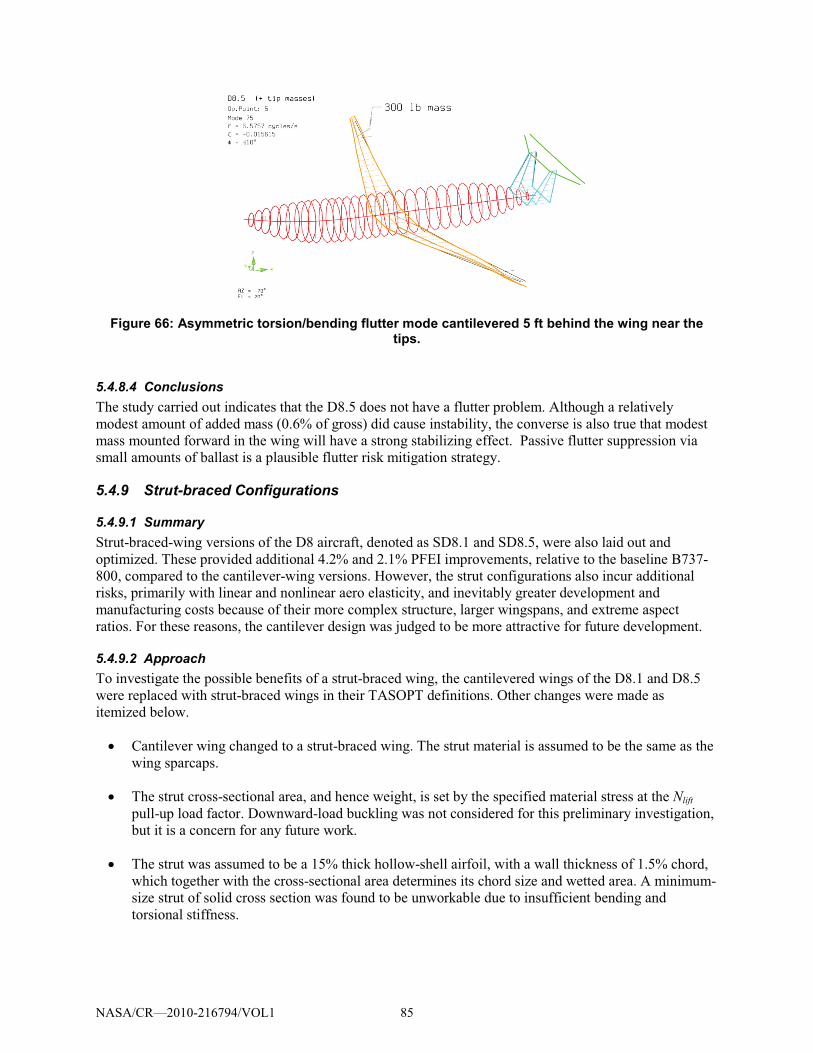
Figure 66: Asymmetric torsion/bending flutter mode cantilevered 5 ft behind the wing near the tips.
5.4.8.4 Conclusions The study carried out indicates that the D8.5 does not have a flutter problem. Although a relatively
modest amount of added mass (0.6% of gross) did cause instability, the converse is also true that modest
mass mounted forward in the wing will have a strong stabilizing effect. Passive flutter suppression via
small amounts of ballast is a plausible flutter risk mitigation strategy.
5.4.9 Strut-braced Configurations
5.4.9.1 Summary Strut-braced-wing versions of the D8 aircraft, denoted as SD8.1 and SD8.5, were also laid out and
optimized. These provided additional 4.2% and 2.1% PFEI improvements, relative to the baseline B737-
800, compared to the cantilever-wing versions. However, the strut configurations also incur additional
risks, primarily with linear and nonlinear aero elasticity, and inevitably greater development and
manufacturing costs because of their more complex structure, larger wingspans, and extreme aspect
ratios. For these reasons, the cantilever design was judged to be more attractive for future development.
5.4.9.2 Approach To investigate the possible benefits of a strut-braced wing, the cantilevered wings of the D8.1 and D8.5
were replaced with strut-braced wings in their TASOPT definitions. Other changes were made as
itemized below.
� Cantilever wing changed to a strut-braced wing. The strut material is assumed to be the same as the
wing sparcaps.
� The strut cross-sectional area, and hence weight, is set by the specified material stress at the Nlift
pull-up load factor. Downward-load buckling was not considered for this preliminary investigation,
but it is a concern for any future work.
� The strut was assumed to be a 15% thick hollow-shell airfoil, with a wall thickness of 1.5% chord,
which together with the cross-sectional area determines its chord size and wetted area. A minimum-
size strut of solid cross section was found to be unworkable due to insufficient bending and
torsional stiffness.
NASA/CR—2010-216794/VOL1 85
� The main landing gear weight fraction was increased from 4.0% to 5.5% of max gross weight. This
is the estimated weight penalty for the additional structure needed to cantilever the gear strut
attachments sideways from the fuselage, rather than having them in the wing directly over the gear.
Additional weight would also be needed to reinforce the few fuselage frames, which connect the
low main gear with the high wing and prevent the wing from crushing the cabin (the 6g landing
impact requirement).
� The center wingbox was excluded from the available fuel volume. This is considered necessary to
reduce the possibility of flooding the cabin with fuel in the event of a wingbox rupture caused by a
crash.
The aircraft were subsequently re-optimized in TASOPT with these changes. The resulting changes were
mostly in wing size and weight, with only minor changes in the engine and tail sizes and weights. The
major design features are described below.
5.4.9.3 SD8.1 Results The optimized SD8.1 aluminum-technology aircraft is shown in Figure 67. Its key parameters are
compared against those of the D8.1 in Table 25. The fuel burn benefit is 4.2% compared to the baseline,
or 8% compared to the cantilevered version. Most of this due to the L/D improvement, and the rest due to
the weight improvement.
The configuration changes generated by the TASOPT optimizer are as expected. The wing airfoils end
up thinner than for the cantilever wings, which allow a slight increase in the CL and a slight decrease in
the sweep. The inner wing airfoil has an inverse taper, with the maximum thickness at the strut
attachment.
The SD8.1 has the field length constraint active at the specified 5000 ft, which makes the wing larger than
the unconstrained optimum would be. The oversized wing also means that the airplane is not fuel-volume
limited.
Table 25: Comparison of cantilever D8.1 and strut-braced SD8.1 aluminum aircraft
Parameter D8.1 SD8.1 Units MTOW 126,900 123,310 Lb
Wfuel 19,820 18,270 Lb
Span 150 182 Ft
Area 1298 1282 ft2
Sweep 5.8 0 Deg
AR 17.3 25.9
t/co 0.144 0.100
t/cs 0.131 0.126
CLCR 0.684 0.772
L/D 22.1 23.9
BFL 5000 5000 Ft
PFEI 3.79 3.48 kJ/kg-m
NASA/CR—2010-216794/VOL1 86
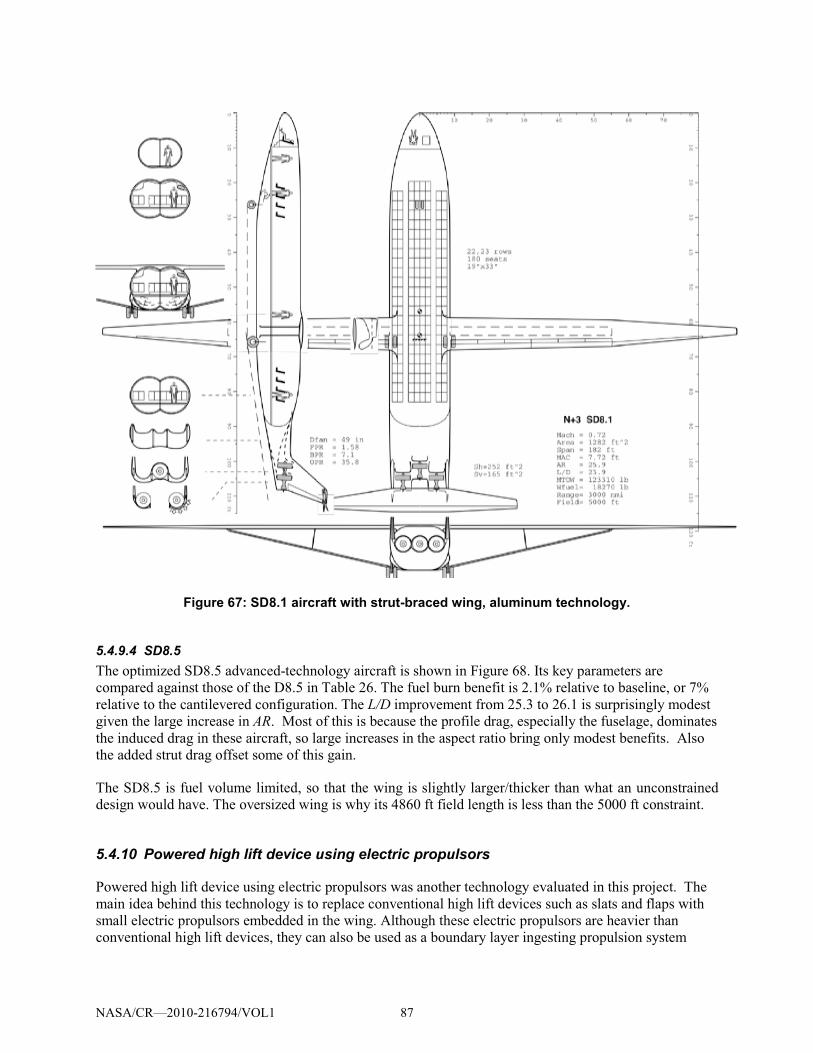
Figure 67: SD8.1 aircraft with strut-braced wing, aluminum technology.
5.4.9.4 SD8.5 The optimized SD8.5 advanced-technology aircraft is shown in Figure 68. Its key parameters are
compared against those of the D8.5 in Table 26. The fuel burn benefit is 2.1% relative to baseline, or 7%
relative to the cantilevered configuration. The L/D improvement from 25.3 to 26.1 is surprisingly modest
given the large increase in AR. Most of this is because the profile drag, especially the fuselage, dominates
the induced drag in these aircraft, so large increases in the aspect ratio bring only modest benefits. Also
the added strut drag offset some of this gain.
The SD8.5 is fuel volume limited, so that the wing is slightly larger/thicker than what an unconstrained
design would have. The oversized wing is why its 4860 ft field length is less than the 5000 ft constraint.
5.4.10 Powered high lift device using electric propulsors
Powered high lift device using electric propulsors was another technology evaluated in this project. The
main idea behind this technology is to replace conventional high lift devices such as slats and flaps with
small electric propulsors embedded in the wing. Although these electric propulsors are heavier than
conventional high lift devices, they can also be used as a boundary layer ingesting propulsion system
NASA/CR—2010-216794/VOL1 87
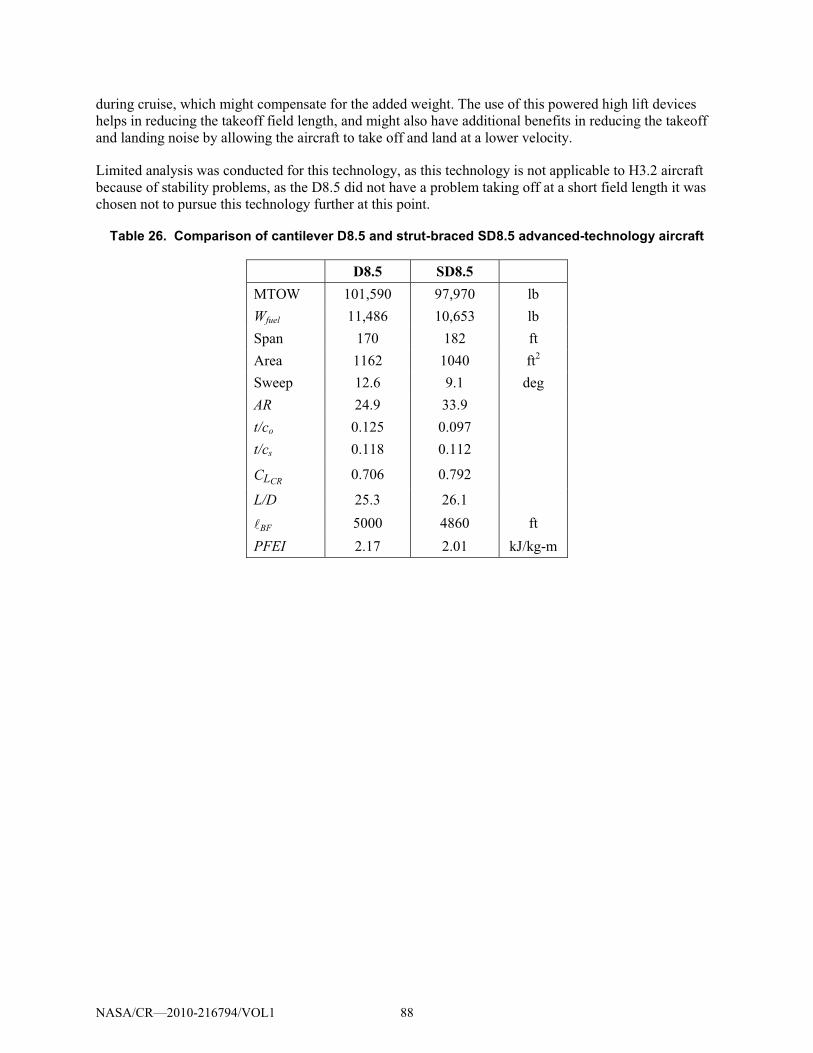
during cruise, which might compensate for the added weight. The use of this powered high lift devices
helps in reducing the takeoff field length, and might also have additional benefits in reducing the takeoff
and landing noise by allowing the aircraft to take off and land at a lower velocity.
Limited analysis was conducted for this technology, as this technology is not applicable to H3.2 aircraft
because of stability problems, as the D8.5 did not have a problem taking off at a short field length it was
chosen not to pursue this technology further at this point.
Table 26. Comparison of cantilever D8.5 and strut-braced SD8.5 advanced-technology aircraft
D8.5 SD8.5 MTOW 101,590 97,970 lb
Wfuel 11,486 10,653 lb
Span 170 182 ft
Area 1162 1040 ft2
Sweep 12.6 9.1 deg
AR 24.9 33.9
t/co 0.125 0.097
t/cs 0.118 0.112
CLCR 0.706 0.792
L/D 25.3 26.1
�BF 5000 4860 ft
PFEI 2.17 2.01 kJ/kg-m
NASA/CR—2010-216794/VOL1 88
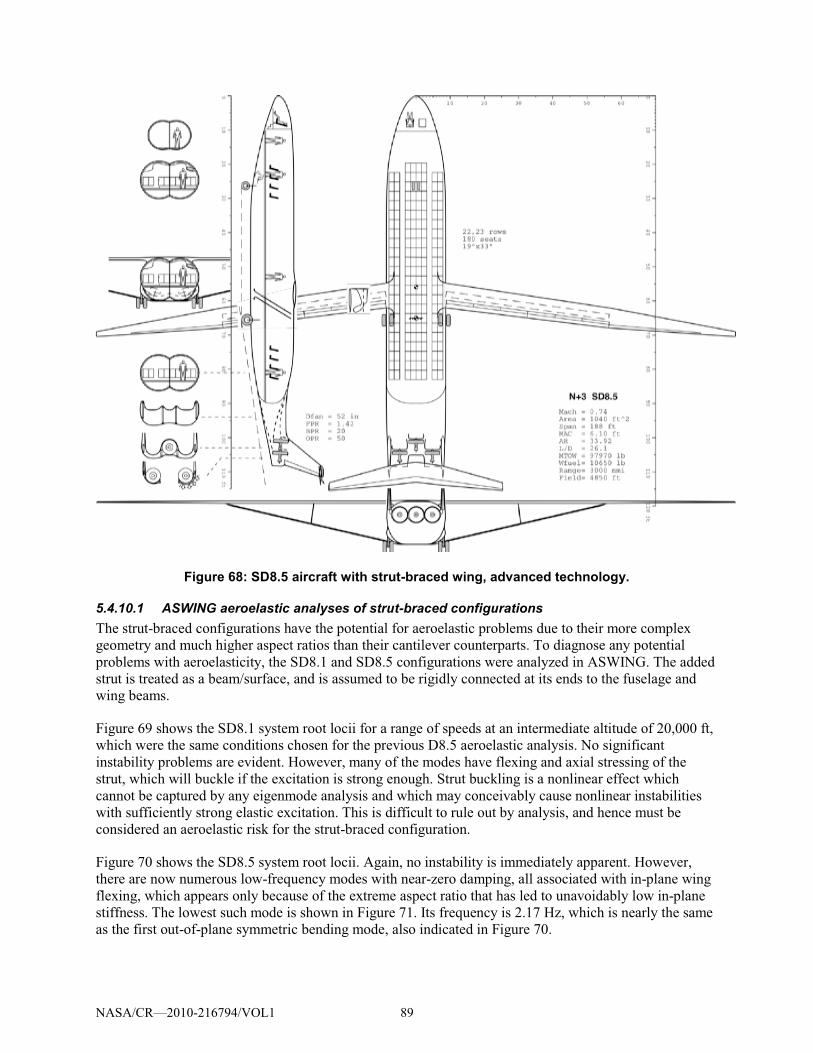
Figure 68: SD8.5 aircraft with strut-braced wing, advanced technology.
5.4.10.1 ASWING aeroelastic analyses of strut-braced configurations The strut-braced configurations have the potential for aeroelastic problems due to their more complex
geometry and much higher aspect ratios than their cantilever counterparts. To diagnose any potential
problems with aeroelasticity, the SD8.1 and SD8.5 configurations were analyzed in ASWING. The added
strut is treated as a beam/surface, and is assumed to be rigidly connected at its ends to the fuselage and
wing beams.
Figure 69 shows the SD8.1 system root locii for a range of speeds at an intermediate altitude of 20,000 ft,
which were the same conditions chosen for the previous D8.5 aeroelastic analysis. No significant
instability problems are evident. However, many of the modes have flexing and axial stressing of the
strut, which will buckle if the excitation is strong enough. Strut buckling is a nonlinear effect which
cannot be captured by any eigenmode analysis and which may conceivably cause nonlinear instabilities
with sufficiently strong elastic excitation. This is difficult to rule out by analysis, and hence must be
considered an aeroelastic risk for the strut-braced configuration.
Figure 70 shows the SD8.5 system root locii. Again, no instability is immediately apparent. However,
there are now numerous low-frequency modes with near-zero damping, all associated with in-plane wing
flexing, which appears only because of the extreme aspect ratio that has led to unavoidably low in-plane
stiffness. The lowest such mode is shown in Figure 71. Its frequency is 2.17 Hz, which is nearly the same
as the first out-of-plane symmetric bending mode, also indicated in Figure 70.
NASA/CR—2010-216794/VOL1 89
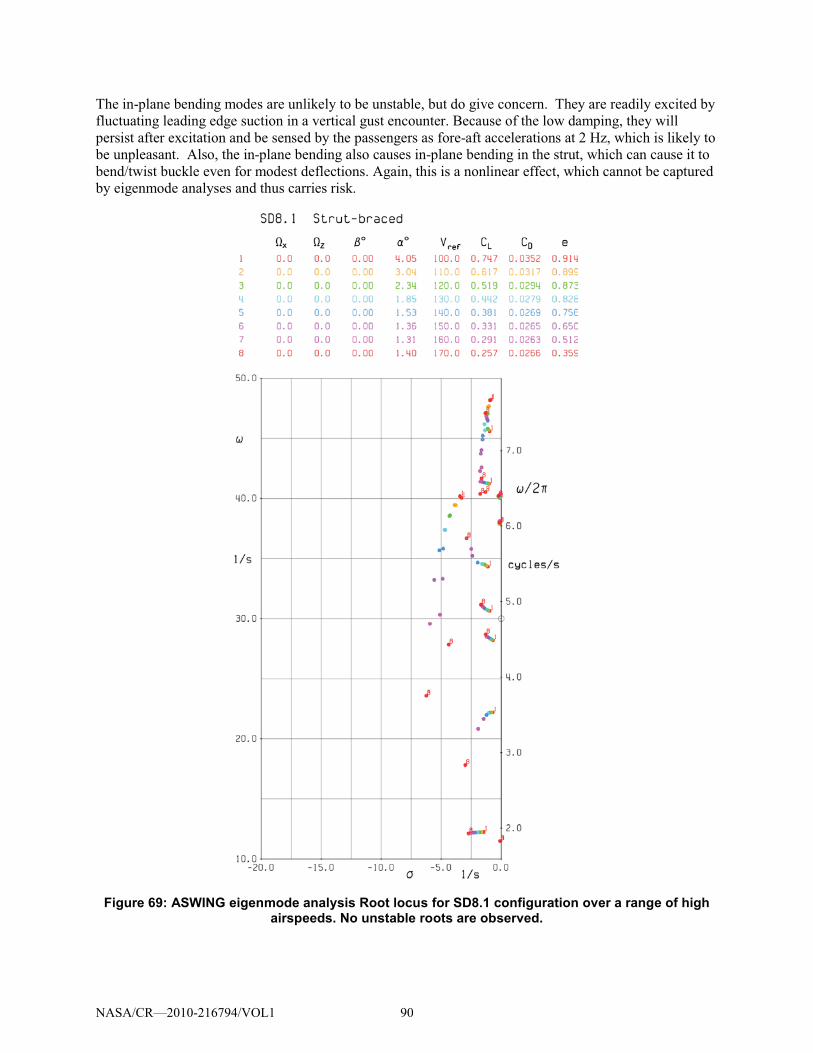
The in-plane bending modes are unlikely to be unstable, but do give concern. They are readily excited by
fluctuating leading edge suction in a vertical gust encounter. Because of the low damping, they will
persist after excitation and be sensed by the passengers as fore-aft accelerations at 2 Hz, which is likely to
be unpleasant. Also, the in-plane bending also causes in-plane bending in the strut, which can cause it to
bend/twist buckle even for modest deflections. Again, this is a nonlinear effect, which cannot be captured
by eigenmode analyses and thus carries risk.
Figure 69: ASWING eigenmode analysis Root locus for SD8.1 configuration over a range of high airspeeds. No unstable roots are observed.
NASA/CR—2010-216794/VOL1 90
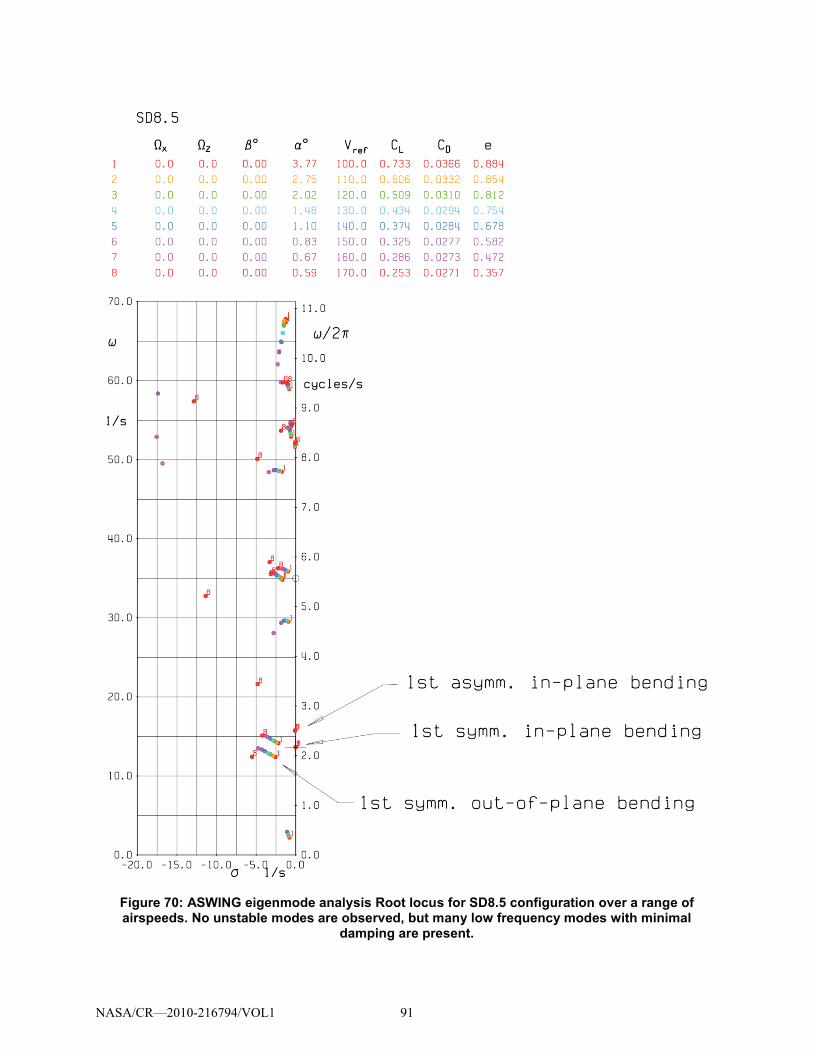
Figure 70: ASWING eigenmode analysis Root locus for SD8.5 configuration over a range of airspeeds. No unstable modes are observed, but many low frequency modes with minimal
damping are present.
NASA/CR—2010-216794/VOL1 91
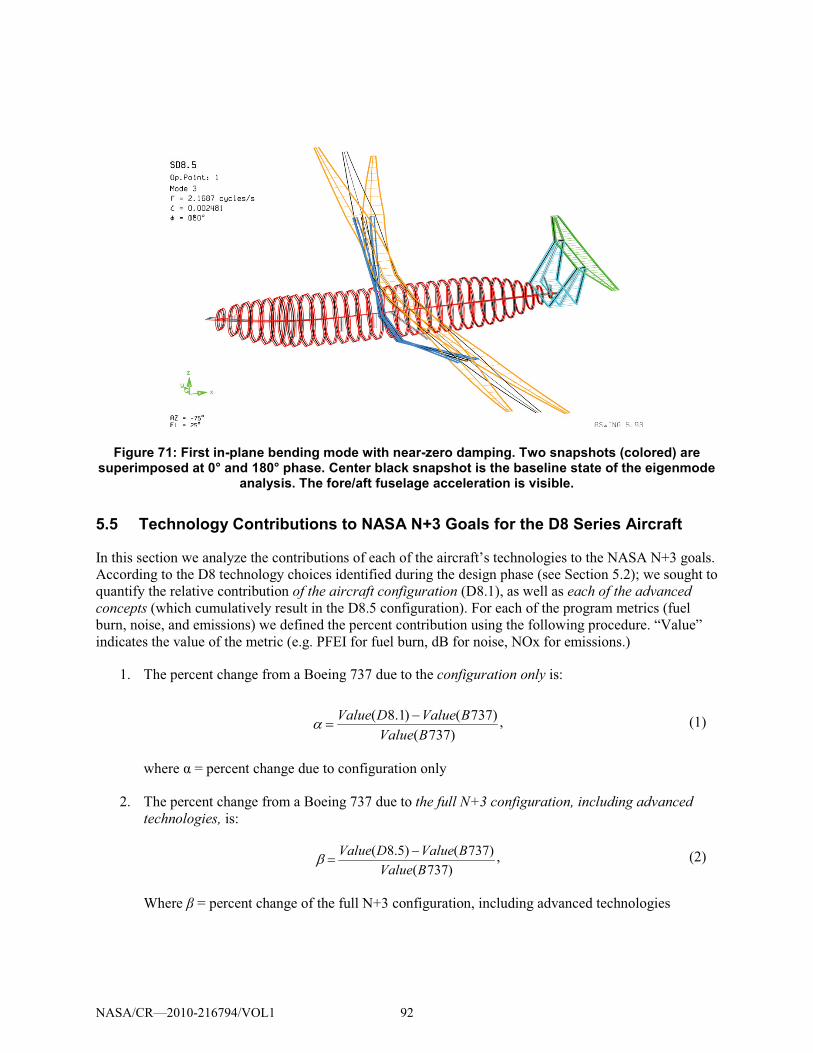
Figure 71: First in-plane bending mode with near-zero damping. Two snapshots (colored) are superimposed at 0° and 180° phase. Center black snapshot is the baseline state of the eigenmode
analysis. The fore/aft fuselage acceleration is visible.
5.5 Technology Contributions to NASA N+3 Goals for the D8 Series Aircraft
In this section we analyze the contributions of each of the aircraft’s technologies to the NASA N+3 goals.
According to the D8 technology choices identified during the design phase (see Section 5.2); we sought to
quantify the relative contribution of the aircraft configuration (D8.1), as well as each of the advanced concepts (which cumulatively result in the D8.5 configuration). For each of the program metrics (fuel
burn, noise, and emissions) we defined the percent contribution using the following procedure. “Value”
indicates the value of the metric (e.g. PFEI for fuel burn, dB for noise, NOx for emissions.)
1. The percent change from a Boeing 737 due to the configuration only is:
� �Value(D8.1) �Value(B737)
Value(B737), (1)
where ��= percent change due to configuration only
2. The percent change from a Boeing 737 due to the full N+3 configuration, including advanced technologies, is:
� � Value(D8.5) �Value(B737)
Value(B737), (2)
Where � = percent change of the full N+3 configuration, including advanced technologies
NASA/CR—2010-216794/VOL1 92

3. Next, we sought to find the contribution of each of the advanced technologies described in the
roadmaps in Section 8.2. To do this, we began with the D8.5 configuration, and removed various
advanced technologies, listed in Figure 72 through Figure 74 (that is, set that value of the variable
affected by that metric to its D8.1 value, which is equivalent to the B737 value). We then ran the
calculations with this one variable altered from the D8.5 value to the D8.1 value. We could thus
identify the difference in the metrics (fuel burn, noise, and emissions) for an aircraft with and
without the advanced technology, with all other technologies still optimized to their advanced
values (D8.5 configuration). The contribution of each of the i individual technologies is:
i �Value(D8.5) �Value(D8.5_ no techi)
Value(D8.5) �Value(D8.1), (3)
where i = percent change due to technology i, relative to the overall difference between D8.1 and
D8.5.
4. If the i value for all of the advanced technologies are added together, they will result in some
total sum percentagei
i�all . However, we have already found, from items 1 and 2 above, that the
actual percentage difference (relative to a B737) between the D8.1 (no advanced technologies)
and the D8.5 (with all advanced technologies) is equal to ��–��. We therefore define a scaling
factor that allows us to translate the percent change for each technology (calculated in Equation
3) to the percent change for each technology relative to the B737. This scaling factor S is equal
to:
S � Percentage difference in value between D8.5 and D8.1
Unscaled sum of all advanced technologies' percentage differences�� ��
ii�all
(4)
5. This scaling factor allows us to determine the relative percent contribution of each advanced
technology:
�i � S i� , (5)
where �i is equal to the relative percent contribution of each technology.
6. To summarize, the total percent change in value between the D8.5 and the B737 is thus the sum
of each of these individual components:
%change(N+3 concept) = %change(due to configuration) + %change(due to advanced
technologies), or
� � � � �i,i�all (6)
where �i �������������� ��������������������in Equation 1�� ����������������quation 2.
5.5.1 Technology Contributions to Noise
Figure 72 shows the contribution of the most relevant technologies to the NASA N+3 noise goal, 71
EPNdB below Stage 4. For the D8.5 configuration this corresponds to 202 cumulative EPNdB.
NASA/CR—2010-216794/VOL1 93
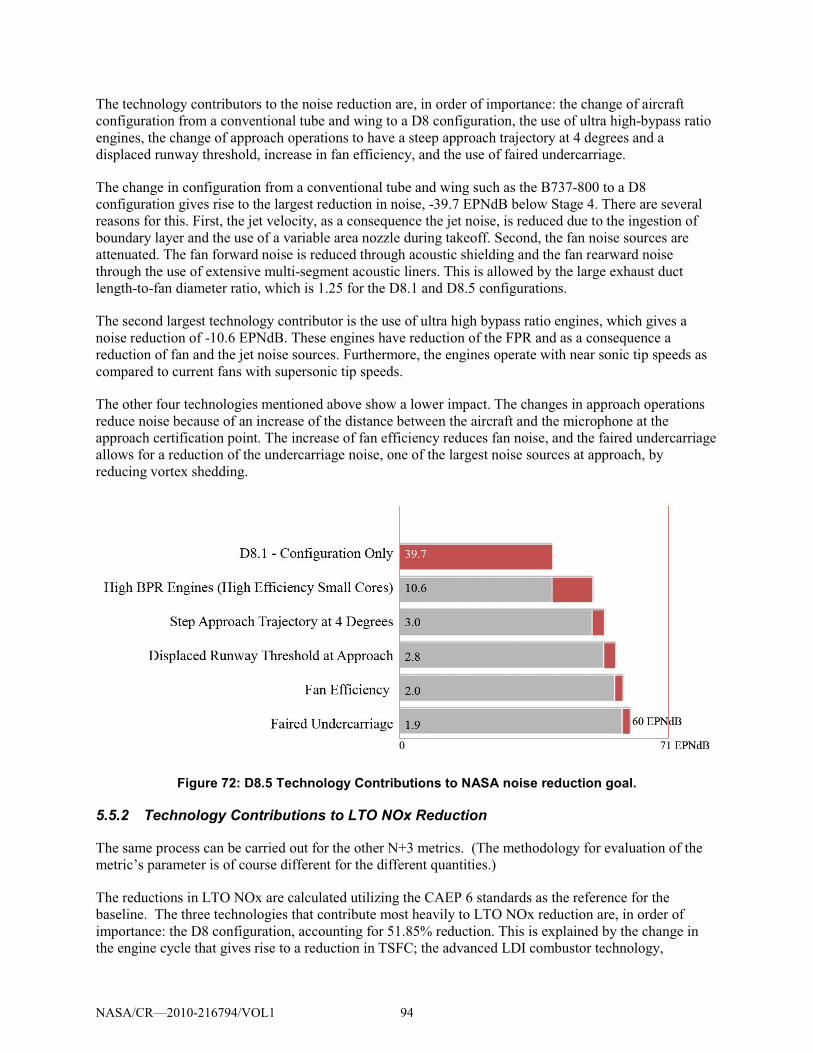
The technology contributors to the noise reduction are, in order of importance: the change of aircraft
configuration from a conventional tube and wing to a D8 configuration, the use of ultra high-bypass ratio
engines, the change of approach operations to have a steep approach trajectory at 4 degrees and a
displaced runway threshold, increase in fan efficiency, and the use of faired undercarriage.
The change in configuration from a conventional tube and wing such as the B737-800 to a D8
configuration gives rise to the largest reduction in noise, -39.7 EPNdB below Stage 4. There are several
reasons for this. First, the jet velocity, as a consequence the jet noise, is reduced due to the ingestion of
boundary layer and the use of a variable area nozzle during takeoff. Second, the fan noise sources are
attenuated. The fan forward noise is reduced through acoustic shielding and the fan rearward noise
through the use of extensive multi-segment acoustic liners. This is allowed by the large exhaust duct
length-to-fan diameter ratio, which is 1.25 for the D8.1 and D8.5 configurations.
The second largest technology contributor is the use of ultra high bypass ratio engines, which gives a
noise reduction of -10.6 EPNdB. These engines have reduction of the FPR and as a consequence a
reduction of fan and the jet noise sources. Furthermore, the engines operate with near sonic tip speeds as
compared to current fans with supersonic tip speeds.
The other four technologies mentioned above show a lower impact. The changes in approach operations
reduce noise because of an increase of the distance between the aircraft and the microphone at the
approach certification point. The increase of fan efficiency reduces fan noise, and the faired undercarriage
allows for a reduction of the undercarriage noise, one of the largest noise sources at approach, by
reducing vortex shedding.
Figure 72: D8.5 Technology Contributions to NASA noise reduction goal.
5.5.2 Technology Contributions to LTO NOx Reduction
The same process can be carried out for the other N+3 metrics. (The methodology for evaluation of the
metric’s parameter is of course different for the different quantities.)
The reductions in LTO NOx are calculated utilizing the CAEP 6 standards as the reference for the
baseline. The three technologies that contribute most heavily to LTO NOx reduction are, in order of
importance: the D8 configuration, accounting for 51.85% reduction. This is explained by the change in
the engine cycle that gives rise to a reduction in TSFC; the advanced LDI combustor technology,
NASA/CR—2010-216794/VOL1 94
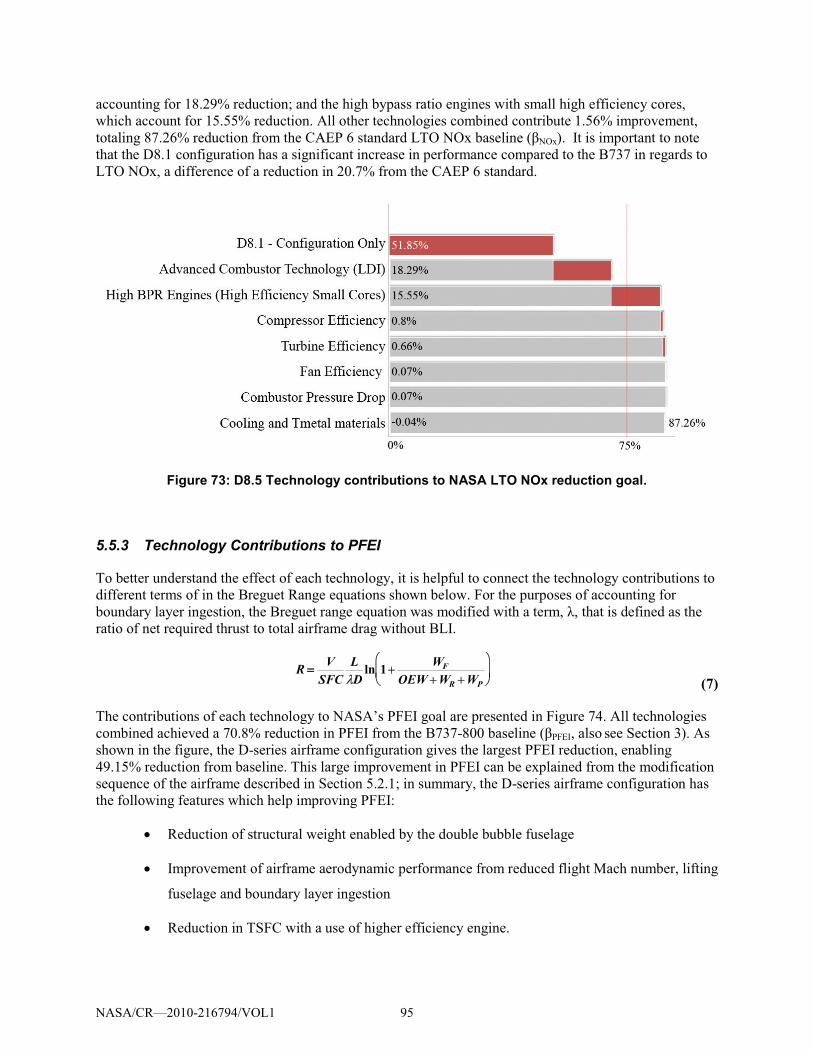
accounting for 18.29% reduction; and the high bypass ratio engines with small high efficiency cores,
which account for 15.55% reduction. All other technologies combined contribute 1.56% improvement,
totaling 87.26% reduction from the CAEP 6 standard ��������� ��������NOx). It is important to note
that the D8.1 configuration has a significant increase in performance compared to the B737 in regards to
LTO NOx, a difference of a reduction in 20.7% from the CAEP 6 standard.
Figure 73: D8.5 Technology contributions to NASA LTO NOx reduction goal.
5.5.3 Technology Contributions to PFEI
To better understand the effect of each technology, it is helpful to connect the technology contributions to
different terms of in the Breguet Range equations shown below. For the purposes of accounting for
boundary layer ingestion, the Breguet range equation was modified with a term, �, that is defined as the
ratio of net required thrust to total airframe drag without BLI.
R �� VSFC
L�D
ln 1� WF
OEW �WR �WP
��
����
��
���� (7)
The contributions of each technology to NASA’s PFEI goal are presented in Figure 74. All technologies
combined achieved a 70.8% reduction in PFEI from the B737-����� ��������PFEI, also see Section 3). As
shown in the figure, the D-series airframe configuration gives the largest PFEI reduction, enabling
49.15% reduction from baseline. This large improvement in PFEI can be explained from the modification
sequence of the airframe described in Section 5.2.1; in summary, the D-series airframe configuration has
the following features which help improving PFEI:
� Reduction of structural weight enabled by the double bubble fuselage
� Improvement of airframe aerodynamic performance from reduced flight Mach number, lifting
fuselage and boundary layer ingestion
� Reduction in TSFC with a use of higher efficiency engine.
NASA/CR—2010-216794/VOL1 95
As we can see from the range equation, the reduction of OEW is one of key parameters that affect the
PFEI of an aircraft, and there are a few technologies in D8.5 that focuses on reducing this parameter. The
largest contributor in the category is the airframe advanced material and processes, which gives an
additional 7.55% reduction in PFEI. This is the result of reducing the weight of the aircraft structure
which is the heaviest component. With this improvement, the empty weight fraction of this vehicle
changed from 54% in the D8.1 to 50% in the D8.5. Although other weight reduction technologies, such as
airframe design load reduction, secondary structures, advanced engine materials and cockpit fixed weight
each has a relatively small impact on PFEI, it still contributes to an additional 2.5% reduction in PFEI
altogether.
Another major parameter to focus on is the corrected lift to drag ratio (L/ � D) of the aircraft, which
indicates the aerodynamic performance of the airframe. The D8.5 has two important technologies
associated with the aerodynamics of the aircraft: Boundary Layer Ingestion (BLI) and natural laminar
flow on wing bottom surface. BLI reduces the � in the corrected lift to drag ratio, providing a reduction of
2.57% in PFEI. Applying laminar flow on wing bottom surface reduces the profile drag of the wing
section, contributing to a reduction of 2.54% in PFEI.
The final important parameter that affects the PFEI is the thrust specific fuel consumption (TSFC) of the
propulsion system. The propulsion system technology that gives the largest contribution to PFEI of the
vehicle is the use of ultra high bypass ratio engines with high efficiency small cores, which increases the
propulsive efficiency of the engine. This technology alone contributes to 4.24% reduction in PFEI. Other
engine technologies such as increased hot section allowable metal temperatures, further improvements in
component efficiencies, increased cooling effectiveness, and advanced combustors add another 5.11% in
PFEI reduction.
In summary, the D8.5 gets an improvement of 49.15% from the airframe configuration, 10.05% from
further reduction of structural weight, 2.54% in additional aerodynamic improvement, and 9.35% from
improvements in engine performance.
NASA/CR—2010-216794/VOL1 96
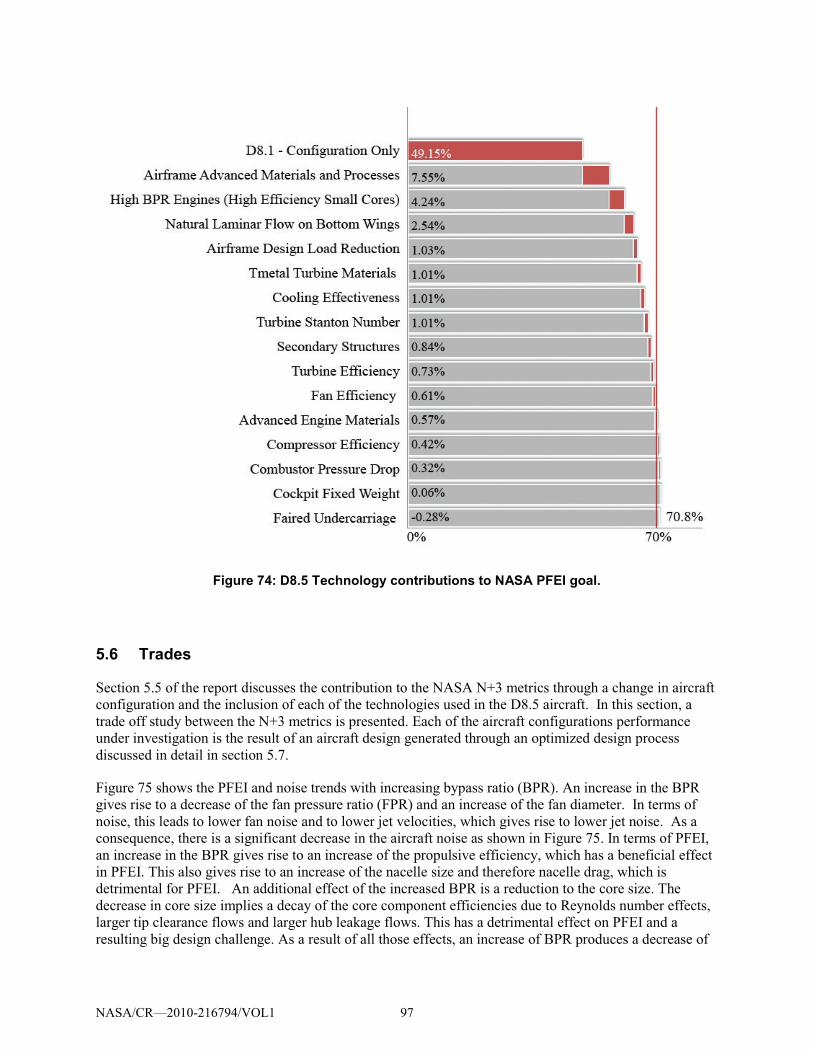
Figure 74: D8.5 Technology contributions to NASA PFEI goal.
5.6 Trades
Section 5.5 of the report discusses the contribution to the NASA N+3 metrics through a change in aircraft
configuration and the inclusion of each of the technologies used in the D8.5 aircraft. In this section, a
trade off study between the N+3 metrics is presented. Each of the aircraft configurations performance
under investigation is the result of an aircraft design generated through an optimized design process
discussed in detail in section 5.7.
Figure 75 shows the PFEI and noise trends with increasing bypass ratio (BPR). An increase in the BPR
gives rise to a decrease of the fan pressure ratio (FPR) and an increase of the fan diameter. In terms of
noise, this leads to lower fan noise and to lower jet velocities, which gives rise to lower jet noise. As a
consequence, there is a significant decrease in the aircraft noise as shown in Figure 75. In terms of PFEI,
an increase in the BPR gives rise to an increase of the propulsive efficiency, which has a beneficial effect
in PFEI. This also gives rise to an increase of the nacelle size and therefore nacelle drag, which is
detrimental for PFEI. An additional effect of the increased BPR is a reduction to the core size. The
decrease in core size implies a decay of the core component efficiencies due to Reynolds number effects,
larger tip clearance flows and larger hub leakage flows. This has a detrimental effect on PFEI and a
resulting big design challenge. As a result of all those effects, an increase of BPR produces a decrease of
NASA/CR—2010-216794/VOL1 97
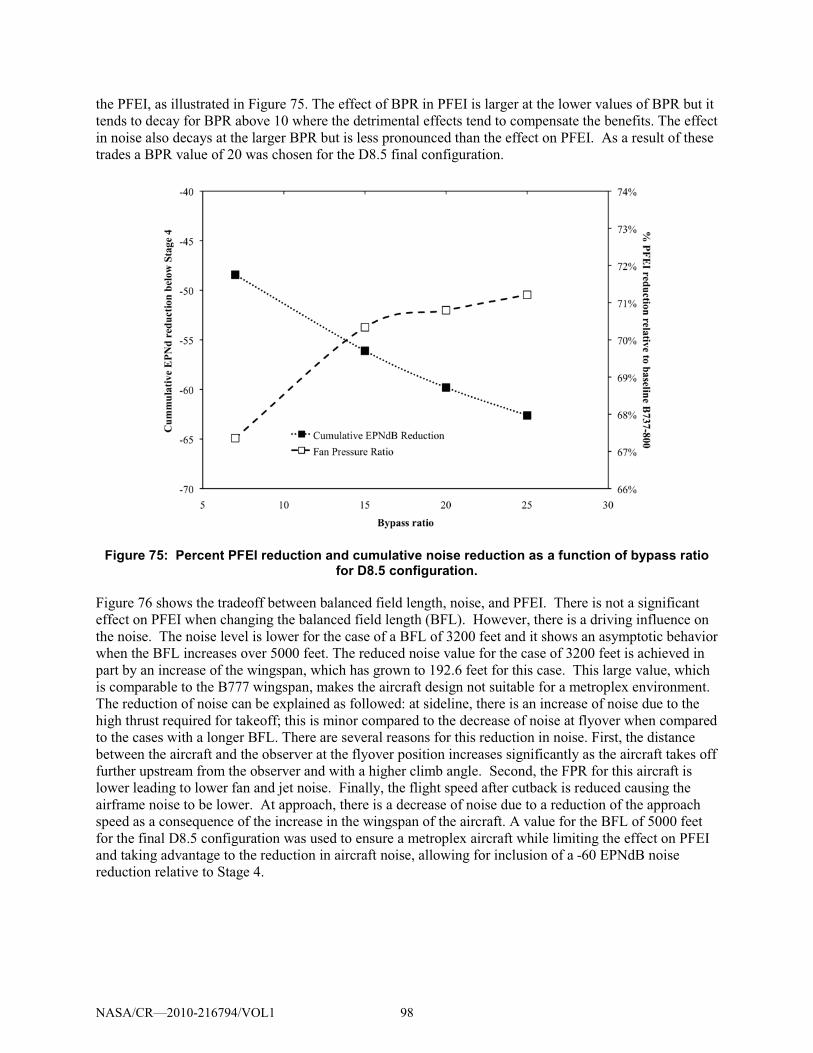
the PFEI, as illustrated in Figure 75. The effect of BPR in PFEI is larger at the lower values of BPR but it
tends to decay for BPR above 10 where the detrimental effects tend to compensate the benefits. The effect
in noise also decays at the larger BPR but is less pronounced than the effect on PFEI. As a result of these
trades a BPR value of 20 was chosen for the D8.5 final configuration.
Figure 75: Percent PFEI reduction and cumulative noise reduction as a function of bypass ratio for D8.5 configuration.
Figure 76 shows the tradeoff between balanced field length, noise, and PFEI. There is not a significant
effect on PFEI when changing the balanced field length (BFL). However, there is a driving influence on
the noise. The noise level is lower for the case of a BFL of 3200 feet and it shows an asymptotic behavior
when the BFL increases over 5000 feet. The reduced noise value for the case of 3200 feet is achieved in
part by an increase of the wingspan, which has grown to 192.6 feet for this case. This large value, which
is comparable to the B777 wingspan, makes the aircraft design not suitable for a metroplex environment.
The reduction of noise can be explained as followed: at sideline, there is an increase of noise due to the
high thrust required for takeoff; this is minor compared to the decrease of noise at flyover when compared
to the cases with a longer BFL. There are several reasons for this reduction in noise. First, the distance
between the aircraft and the observer at the flyover position increases significantly as the aircraft takes off
further upstream from the observer and with a higher climb angle. Second, the FPR for this aircraft is
lower leading to lower fan and jet noise. Finally, the flight speed after cutback is reduced causing the
airframe noise to be lower. At approach, there is a decrease of noise due to a reduction of the approach
speed as a consequence of the increase in the wingspan of the aircraft. A value for the BFL of 5000 feet
for the final D8.5 configuration was used to ensure a metroplex aircraft while limiting the effect on PFEI
and taking advantage to the reduction in aircraft noise, allowing for inclusion of a -60 EPNdB noise
reduction relative to Stage 4.
NASA/CR—2010-216794/VOL1 98
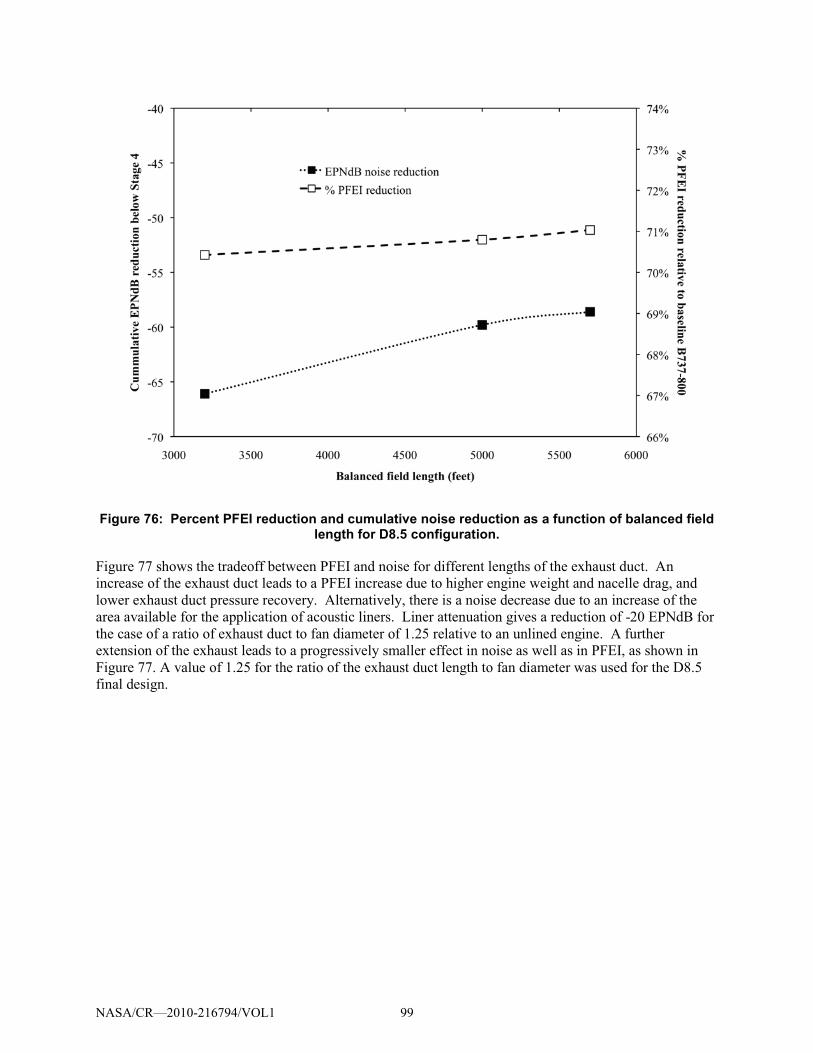
Figure 76: Percent PFEI reduction and cumulative noise reduction as a function of balanced field length for D8.5 configuration.
Figure 77 shows the tradeoff between PFEI and noise for different lengths of the exhaust duct. An
increase of the exhaust duct leads to a PFEI increase due to higher engine weight and nacelle drag, and
lower exhaust duct pressure recovery. Alternatively, there is a noise decrease due to an increase of the
area available for the application of acoustic liners. Liner attenuation gives a reduction of -20 EPNdB for
the case of a ratio of exhaust duct to fan diameter of 1.25 relative to an unlined engine. A further
extension of the exhaust leads to a progressively smaller effect in noise as well as in PFEI, as shown in
Figure 77. A value of 1.25 for the ratio of the exhaust duct length to fan diameter was used for the D8.5
final design.
NASA/CR—2010-216794/VOL1 99
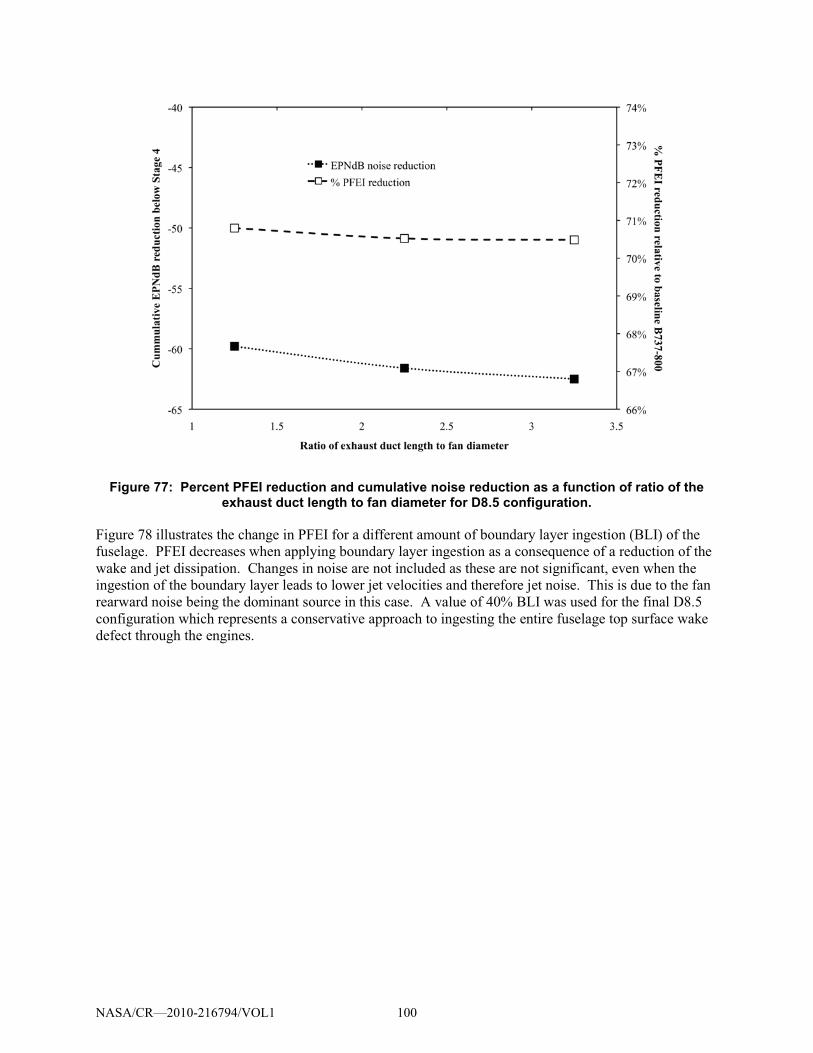
Figure 77: Percent PFEI reduction and cumulative noise reduction as a function of ratio of the exhaust duct length to fan diameter for D8.5 configuration.
Figure 78 illustrates the change in PFEI for a different amount of boundary layer ingestion (BLI) of the
fuselage. PFEI decreases when applying boundary layer ingestion as a consequence of a reduction of the
wake and jet dissipation. Changes in noise are not included as these are not significant, even when the
ingestion of the boundary layer leads to lower jet velocities and therefore jet noise. This is due to the fan
rearward noise being the dominant source in this case. A value of 40% BLI was used for the final D8.5
configuration which represents a conservative approach to ingesting the entire fuselage top surface wake
defect through the engines.
NASA/CR—2010-216794/VOL1 100
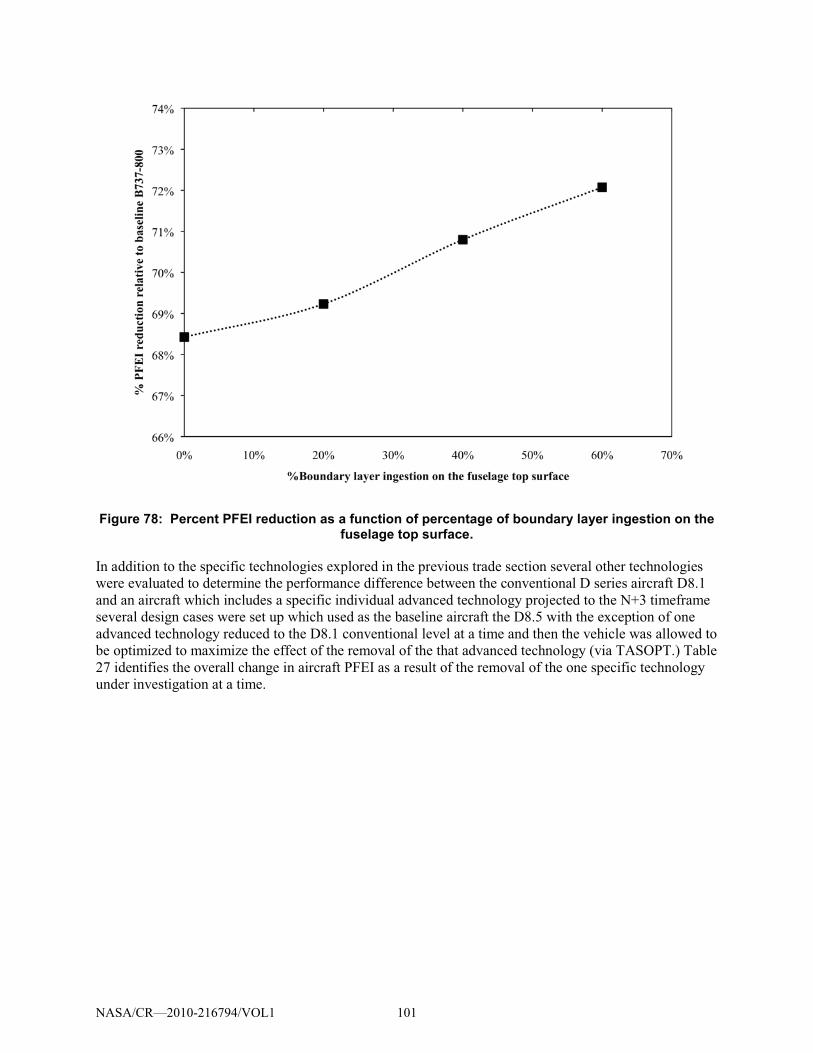
Figure 78: Percent PFEI reduction as a function of percentage of boundary layer ingestion on the fuselage top surface.
In addition to the specific technologies explored in the previous trade section several other technologies
were evaluated to determine the performance difference between the conventional D series aircraft D8.1
and an aircraft which includes a specific individual advanced technology projected to the N+3 timeframe
several design cases were set up which used as the baseline aircraft the D8.5 with the exception of one
advanced technology reduced to the D8.1 conventional level at a time and then the vehicle was allowed to
be optimized to maximize the effect of the removal of the that advanced technology (via TASOPT.) Table
27 identifies the overall change in aircraft PFEI as a result of the removal of the one specific technology
under investigation at a time.
NASA/CR—2010-216794/VOL1 101
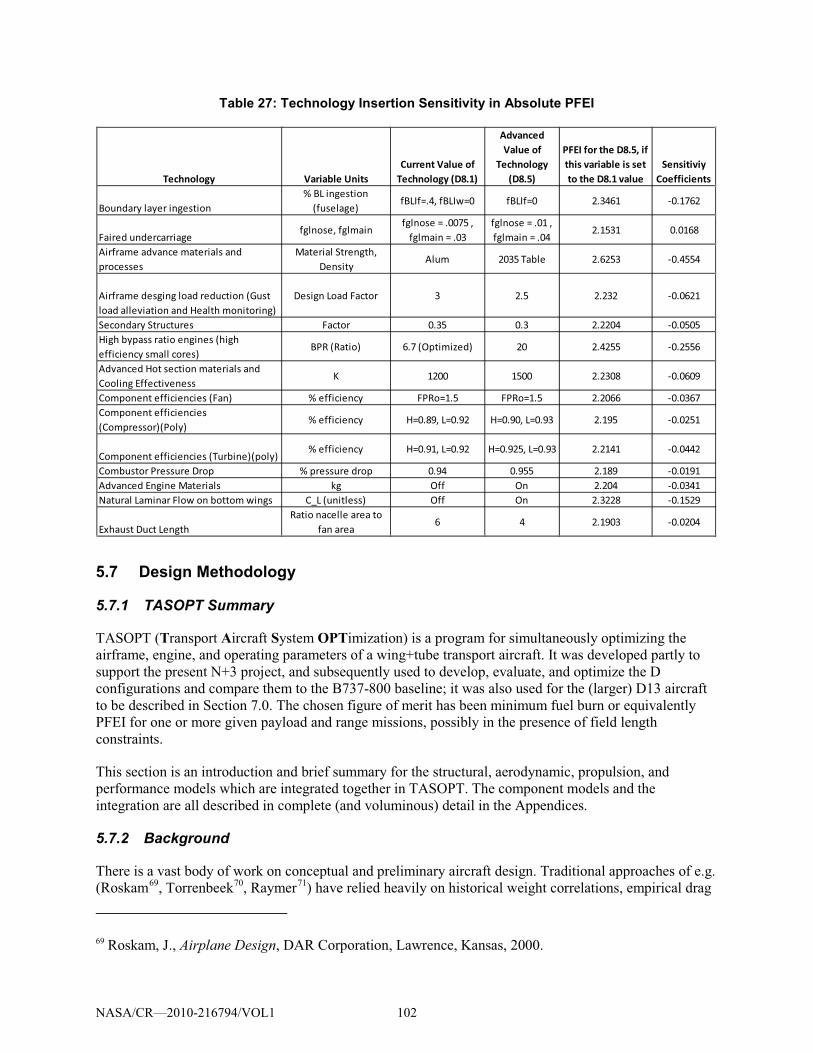
Table 27: Technology Insertion Sensitivity in Absolute PFEI
Technology Variable UnitsCurrent Value of
Technology (D8.1)
Advanced Value of
Technology (D8.5)
PFEI for the D8.5, if this variable is set to the D8.1 value
Sensitiviy Coefficients
Boundary layer ingestion% BL ingestion
(fuselage)fBLIf=.4, fBLIw=0 fBLIf=0 2.3461 -0.1762
Faired undercarriage fglnose, fglmain
fglnose = .0075 , fglmain = .03
fglnose = .01 , fglmain = .04
2.1531 0.0168
Airframe advance materials and processes
Material Strength, Density
Alum 2035 Table 2.6253 -0.4554
Airframe desging load reduction (Gust load alleviation and Health monitoring)
Design Load Factor 3 2.5 2.232 -0.0621
Secondary Structures Factor 0.35 0.3 2.2204 -0.0505High bypass ratio engines (high efficiency small cores)
BPR (Ratio) 6.7 (Optimized) 20 2.4255 -0.2556
Advanced Hot section materials and Cooling Effectiveness
K 1200 1500 2.2308 -0.0609
Component efficiencies (Fan) % efficiency FPRo=1.5 FPRo=1.5 2.2066 -0.0367Component efficiencies (Compressor)(Poly)
% efficiency H=0.89, L=0.92 H=0.90, L=0.93 2.195 -0.0251
Component efficiencies (Turbine)(poly)% efficiency H=0.91, L=0.92 H=0.925, L=0.93 2.2141 -0.0442
Combustor Pressure Drop % pressure drop 0.94 0.955 2.189 -0.0191Advanced Engine Materials kg Off On 2.204 -0.0341Natural Laminar Flow on bottom wings C_L (unitless) Off On 2.3228 -0.1529
Exhaust Duct LengthRatio nacelle area to
fan area6 4 2.1903 -0.0204
5.7 Design Methodology
5.7.1 TASOPT Summary
TASOPT (Transport Aircraft System OPTimization) is a program for simultaneously optimizing the
airframe, engine, and operating parameters of a wing+tube transport aircraft. It was developed partly to
support the present N+3 project, and subsequently used to develop, evaluate, and optimize the D
configurations and compare them to the B737-800 baseline; it was also used for the (larger) D13 aircraft
to be described in Section 7.0. The chosen figure of merit has been minimum fuel burn or equivalently
PFEI for one or more given payload and range missions, possibly in the presence of field length
constraints.
This section is an introduction and brief summary for the structural, aerodynamic, propulsion, and
performance models which are integrated together in TASOPT. The component models and the
integration are all described in complete (and voluminous) detail in the Appendices.
5.7.2 Background
There is a vast body of work on conceptual and preliminary aircraft design. Traditional approaches of e.g.
(Roskam69, Torrenbeek
70, Raymer
71
69 Roskam, J., Airplane Design, DAR Corporation, Lawrence, Kansas, 2000.
) have relied heavily on historical weight correlations, empirical drag
NASA/CR—2010-216794/VOL1 102
build-ups, and established engine performance data for their design evaluations. The ACSYNT
program72,73
likewise relies on such models, with a more detailed treatment of the geometry. More
recently, optimization-based approaches such as those of Knapp74
, the WingMOD code of
Wakayama75,76
, and in particular the PASS program of Kroo77
The recent advent of turbofan engines with extremely high bypass ratios (Pratt geared turbofan),
advanced composite materials (Boeing 787), and possibly less restrictive operational restrictions (Free-
Flight ATC concept), make it of great interest to re-examine the overall aircraft/engine/operation system
to maximize transportation efficiency. The present NASA N+3 effort is one example of research towards
this goal. In addition, greater emphasis on limiting noise and emissions dictates that such aircraft design
examination should be done under possibly stringent environmental constraints.
perform tradeoffs in a much more detailed
geometry parameter space, but still rely on simple drag and engine performance models.
5.7.3 General TASOPT Approach
To examine and evaluate future aircraft with potentially unprecedented airframe, aerodynamic, engine, or
operation parameters, it is desirable to dispense with as many of the historically-based methods as
possible, since these cannot be relied on outside of their data-fit ranges. The approach used by TASOPT
is to instead rely on low-order physical models that implement fundamental structural, aerodynamic, and thermodynamic theory and associated computational methods for all primary predictions. Historical
correlations are used only where absolutely necessary and in particular only for some of the secondary
structure and for aircraft equipment. Modeling the bulk of the aircraft structure, aerodynamics, and
propulsion from a fundamental basis gives considerable confidence that the resulting optimized design is
realizable, and not some artifact of inappropriate extrapolated data fits. All of the details of the structural
and aerodynamic models can be found in the various sections of Appendices A - F. The following
descriptions are meant as an overview to explain the process.
70 Torrenbeek, E., Synthesis of Subsonic Airplane Design, Delft University Press, 1988.
71 Raymer, D.P., Aircraft Design: A Conceptual Approach, AIAA Education Series. AIAA, 1992.
72 Jayaram, S., Myklebust, A., Gelhausen, P., “ACSYNT – A standards-based system for parametric
computer aided conceptual design of aircraft,” AIAA Paper 92-1268, Feb 1992. 73
Mason, W.H., Arledge, T.K., “ACSYNT aerodynamic estimation – An examination and validation for
use in conceptual design,” AIAA Paper 93-0973, Feb 1993. 74
Knapp, B., “Applications of a nonlinear wing planform design program,” Master’s thesis, MIT, Aug
1996. 75
Wakayama, S., “Lifting surface design using multidisciplinary optimization,” PhD thesis, Stanford,
June 1994. 76
Wakayama, S., “Blended-wing-body optimization setup,” AIAA Paper 00-4740, Sept 2000. 77
Kroo, I., PASS, program for aircraft synthesis studies, Software Package, Desktop Aeronautics, Palo
Alto, CA, 2005.
NASA/CR—2010-216794/VOL1 103
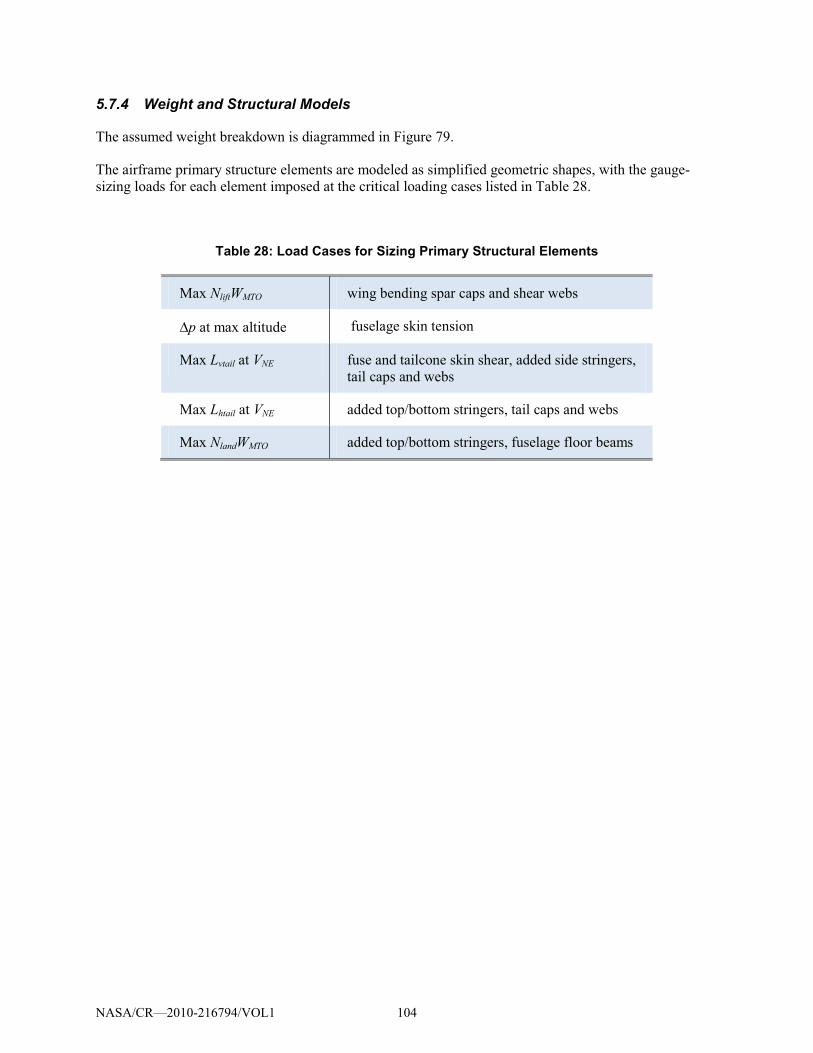
5.7.4 Weight and Structural Models
The assumed weight breakdown is diagrammed in Figure 79.
The airframe primary structure elements are modeled as simplified geometric shapes, with the gauge-
sizing loads for each element imposed at the critical loading cases listed in Table 28.
Table 28: Load Cases for Sizing Primary Structural Elements
Max NliftWMTO wing bending spar caps and shear webs
�p at max altitude fuselage skin tension
Max Lvtail at VNE fuse and tailcone skin shear, added side stringers,
tail caps and webs
Max Lhtail at VNE added top/bottom stringers, tail caps and webs
Max NlandWMTO added top/bottom stringers, fuselage floor beams
NASA/CR—2010-216794/VOL1 104
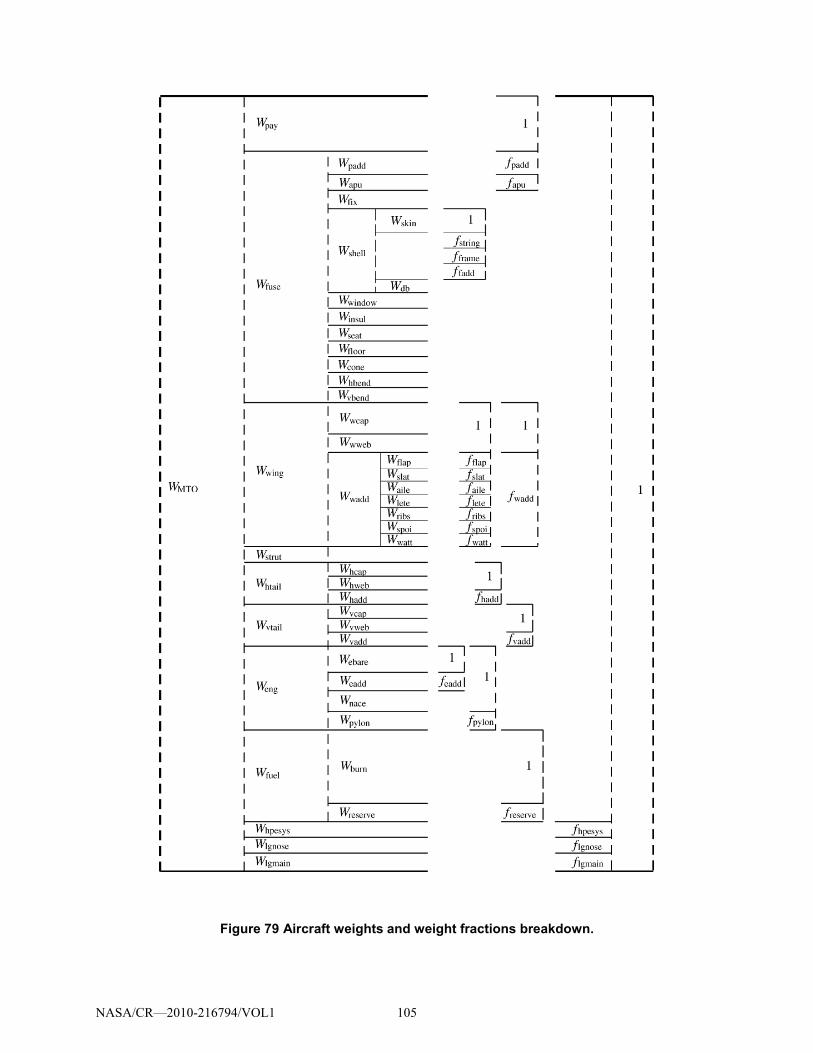
Figure 79 Aircraft weights and weight fractions breakdown.
NASA/CR—2010-216794/VOL1 105
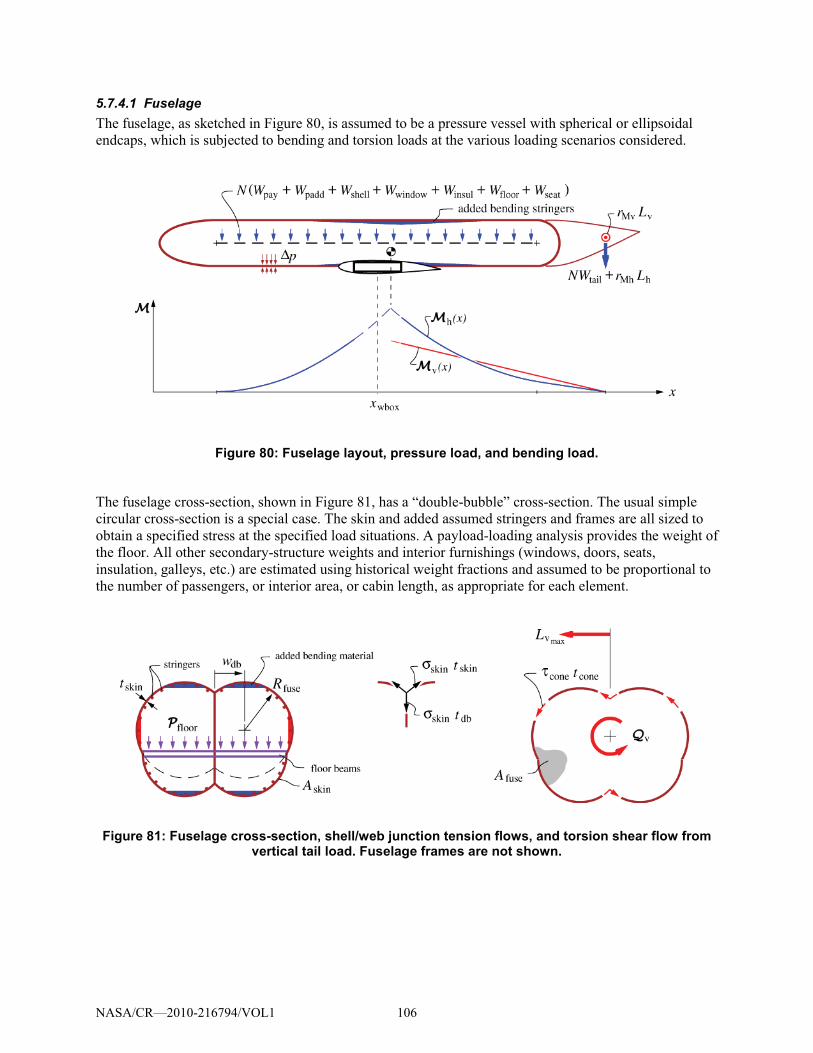
5.7.4.1 Fuselage The fuselage, as sketched in Figure 80, is assumed to be a pressure vessel with spherical or ellipsoidal
endcaps, which is subjected to bending and torsion loads at the various loading scenarios considered.
Figure 80: Fuselage layout, pressure load, and bending load.
The fuselage cross-section, shown in Figure 81, has a “double-bubble” cross-section. The usual simple
circular cross-section is a special case. The skin and added assumed stringers and frames are all sized to
obtain a specified stress at the specified load situations. A payload-loading analysis provides the weight of
the floor. All other secondary-structure weights and interior furnishings (windows, doors, seats,
insulation, galleys, etc.) are estimated using historical weight fractions and assumed to be proportional to
the number of passengers, or interior area, or cabin length, as appropriate for each element.
Figure 81: Fuselage cross-section, shell/web junction tension flows, and torsion shear flow from vertical tail load. Fuselage frames are not shown.
NASA/CR—2010-216794/VOL1 106
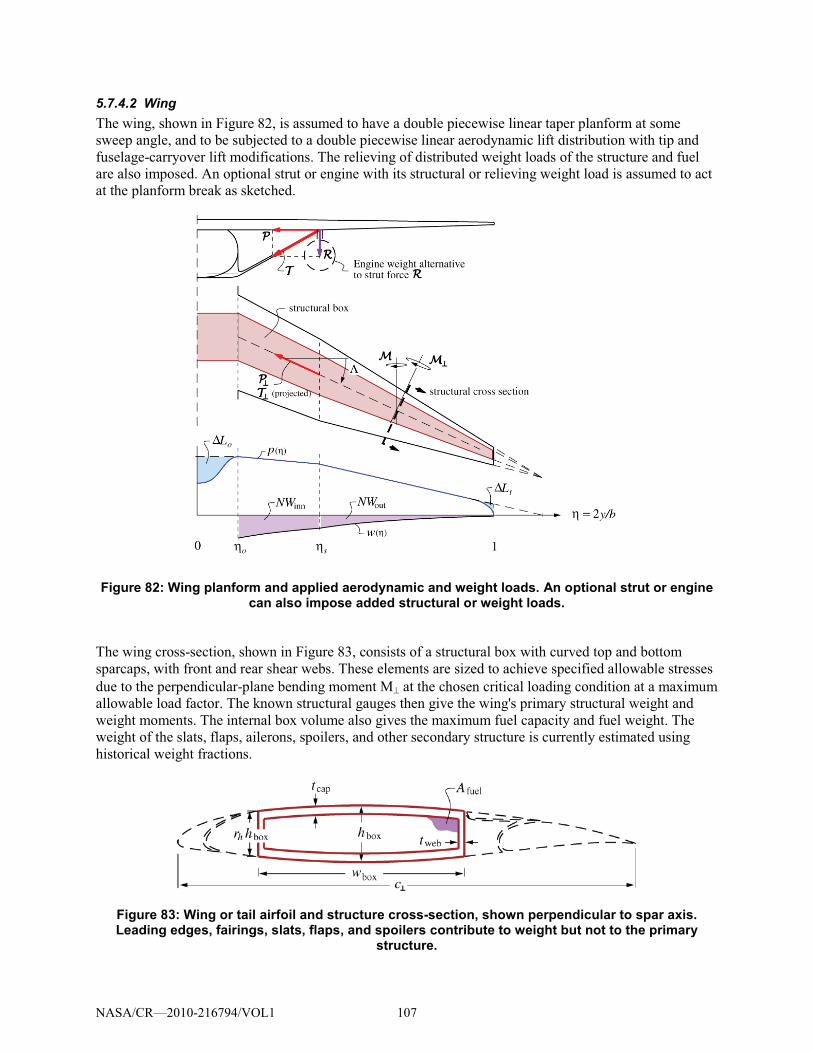
5.7.4.2 Wing The wing, shown in Figure 82, is assumed to have a double piecewise linear taper planform at some
sweep angle, and to be subjected to a double piecewise linear aerodynamic lift distribution with tip and
fuselage-carryover lift modifications. The relieving of distributed weight loads of the structure and fuel
are also imposed. An optional strut or engine with its structural or relieving weight load is assumed to act
at the planform break as sketched.
Figure 82: Wing planform and applied aerodynamic and weight loads. An optional strut or engine can also impose added structural or weight loads.
The wing cross-section, shown in Figure 83, consists of a structural box with curved top and bottom
sparcaps, with front and rear shear webs. These elements are sized to achieve specified allowable stresses
due to the perpendicular-plane bending moment M� at the chosen critical loading condition at a maximum
allowable load factor. The known structural gauges then give the wing's primary structural weight and
weight moments. The internal box volume also gives the maximum fuel capacity and fuel weight. The
weight of the slats, flaps, ailerons, spoilers, and other secondary structure is currently estimated using
historical weight fractions.
Figure 83: Wing or tail airfoil and structure cross-section, shown perpendicular to spar axis. Leading edges, fairings, slats, flaps, and spoilers contribute to weight but not to the primary
structure.
NASA/CR—2010-216794/VOL1 107
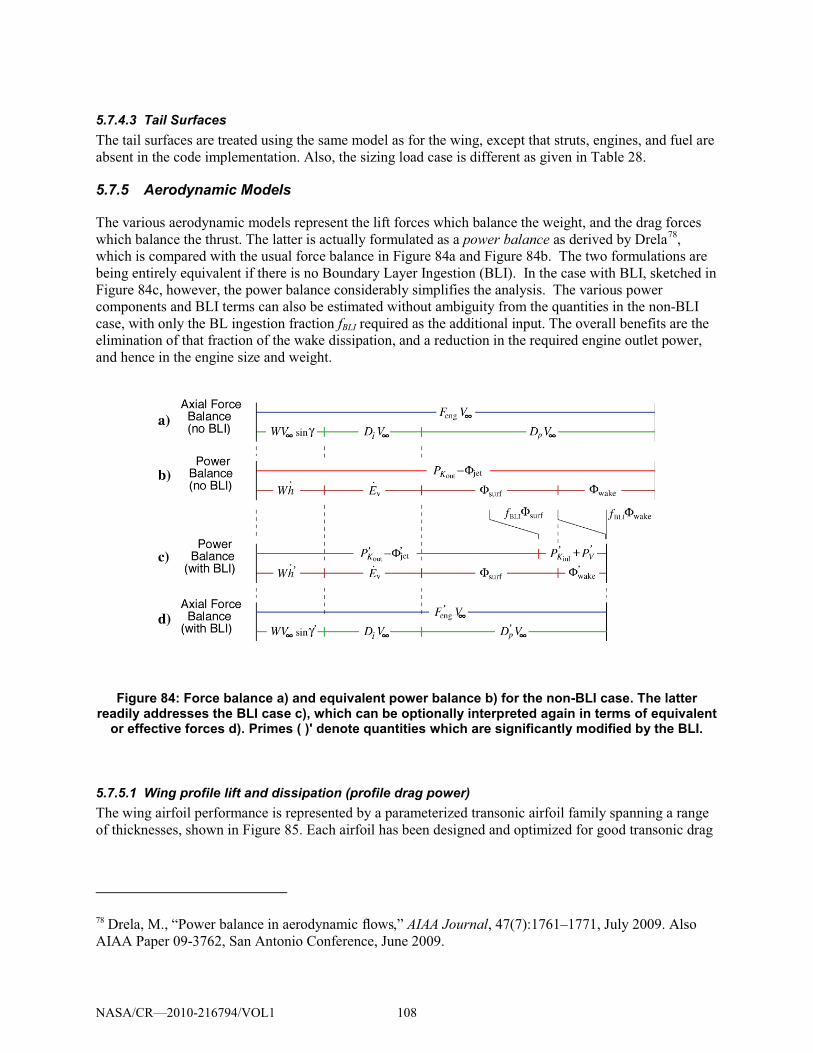
5.7.4.3 Tail Surfaces The tail surfaces are treated using the same model as for the wing, except that struts, engines, and fuel are
absent in the code implementation. Also, the sizing load case is different as given in Table 28.
5.7.5 Aerodynamic Models
The various aerodynamic models represent the lift forces which balance the weight, and the drag forces
which balance the thrust. The latter is actually formulated as a power balance as derived by Drela78
Figure 84
,
which is compared with the usual force balance in a and Figure 84b. The two formulations are
being entirely equivalent if there is no Boundary Layer Ingestion (BLI). In the case with BLI, sketched in
Figure 84c, however, the power balance considerably simplifies the analysis. The various power
components and BLI terms can also be estimated without ambiguity from the quantities in the non-BLI
case, with only the BL ingestion fraction fBLI required as the additional input. The overall benefits are the
elimination of that fraction of the wake dissipation, and a reduction in the required engine outlet power,
and hence in the engine size and weight.
Figure 84: Force balance a) and equivalent power balance b) for the non-BLI case. The latter readily addresses the BLI case c), which can be optionally interpreted again in terms of equivalent
or effective forces d). Primes ( )' denote quantities which are significantly modified by the BLI.
5.7.5.1 Wing profile lift and dissipation (profile drag power) The wing airfoil performance is represented by a parameterized transonic airfoil family spanning a range
of thicknesses, shown in Figure 85. Each airfoil has been designed and optimized for good transonic drag
78 Drela, M., “Power balance in aerodynamic �!�,” AIAA Journal, 47(7):1761–1771, July 2009. Also
AIAA Paper 09-3762, San Antonio Conference, June 2009.
NASA/CR—2010-216794/VOL1 108
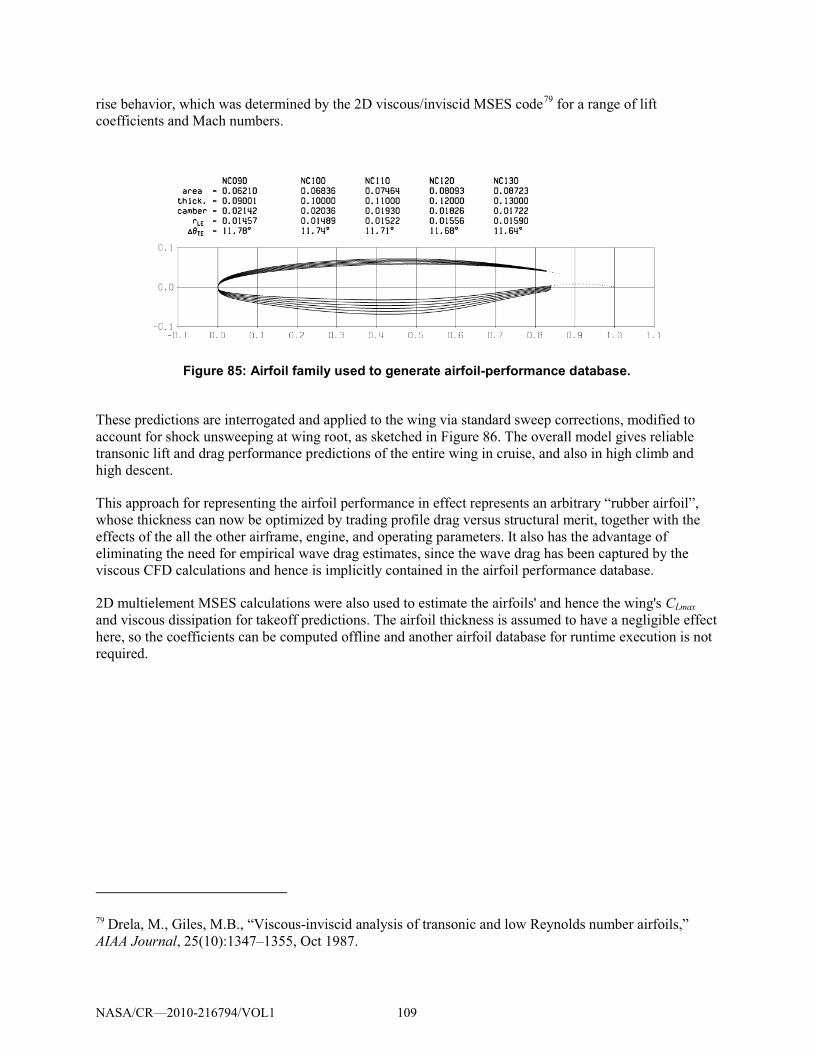
rise behavior, which was determined by the 2D viscous/inviscid MSES code79
for a range of lift
coefficients and Mach numbers.
Figure 85: Airfoil family used to generate airfoil-performance database.
These predictions are interrogated and applied to the wing via standard sweep corrections, modified to
account for shock unsweeping at wing root, as sketched in Figure 86. The overall model gives reliable
transonic lift and drag performance predictions of the entire wing in cruise, and also in high climb and
high descent.
This approach for representing the airfoil performance in effect represents an arbitrary “rubber airfoil”,
whose thickness can now be optimized by trading profile drag versus structural merit, together with the
effects of the all the other airframe, engine, and operating parameters. It also has the advantage of
eliminating the need for empirical wave drag estimates, since the wave drag has been captured by the
viscous CFD calculations and hence is implicitly contained in the airfoil performance database.
2D multielement MSES calculations were also used to estimate the airfoils' and hence the wing's CLmax
and viscous dissipation for takeoff predictions. The airfoil thickness is assumed to have a negligible effect
here, so the coefficients can be computed offline and another airfoil database for runtime execution is not
required.
79 Drela, M., Giles, M.B., “Viscous-inviscid analysis of transonic and low Reynolds number airfoils,”
AIAA Journal, 25(10):1347–1355, Oct 1987.
NASA/CR—2010-216794/VOL1 109
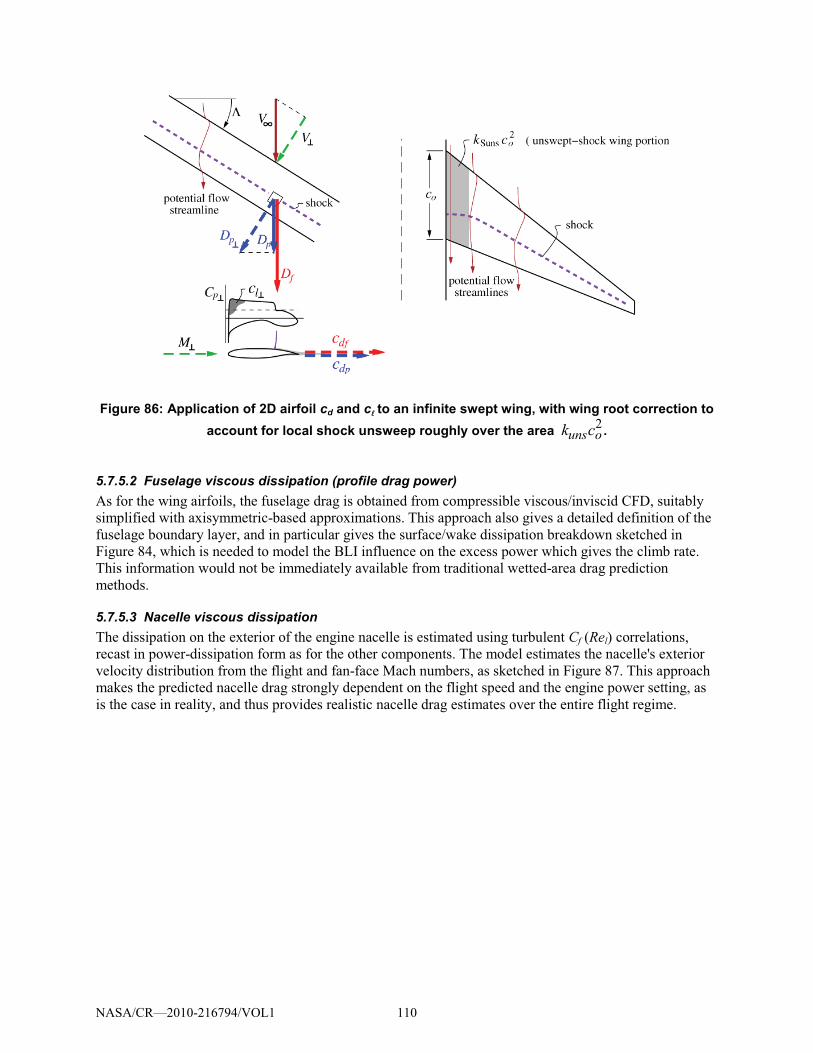
Figure 86: Application of 2D airfoil cd and c���to an infinite swept wing, with wing root correction to account for local shock unsweep roughly over the area kunsco
2 .
5.7.5.2 Fuselage viscous dissipation (profile drag power) As for the wing airfoils, the fuselage drag is obtained from compressible viscous/inviscid CFD, suitably
simplified with axisymmetric-based approximations. This approach also gives a detailed definition of the
fuselage boundary layer, and in particular gives the surface/wake dissipation breakdown sketched in
Figure 84, which is needed to model the BLI influence on the excess power which gives the climb rate.
This information would not be immediately available from traditional wetted-area drag prediction
methods.
5.7.5.3 Nacelle viscous dissipation The dissipation on the exterior of the engine nacelle is estimated using turbulent Cf (Rel) correlations,
recast in power-dissipation form as for the other components. The model estimates the nacelle's exterior
velocity distribution from the flight and fan-face Mach numbers, as sketched in Figure 87. This approach
makes the predicted nacelle drag strongly dependent on the flight speed and the engine power setting, as
is the case in reality, and thus provides realistic nacelle drag estimates over the entire flight regime.
NASA/CR—2010-216794/VOL1 110
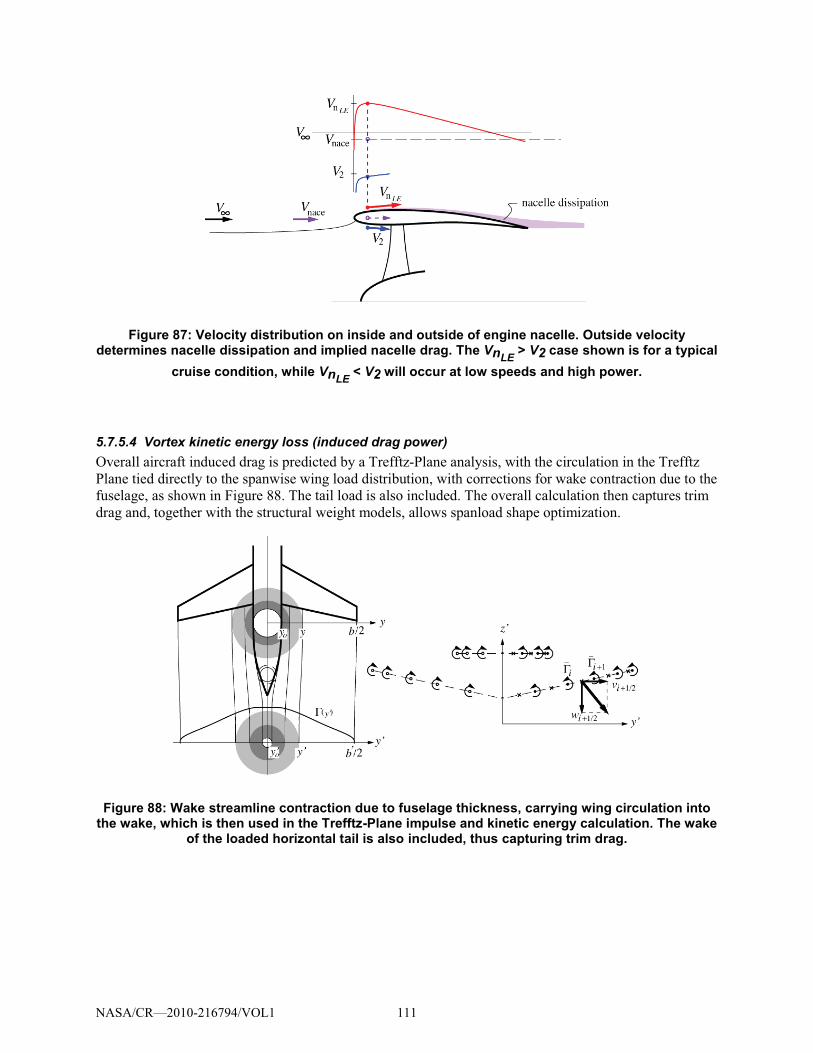
Figure 87: Velocity distribution on inside and outside of engine nacelle. Outside velocity determines nacelle dissipation and implied nacelle drag. The VnLE > V2 case shown is for a typical
cruise condition, while VnLE < V2 will occur at low speeds and high power.
5.7.5.4 Vortex kinetic energy loss (induced drag power) Overall aircraft induced drag is predicted by a Trefftz-Plane analysis, with the circulation in the Trefftz
Plane tied directly to the spanwise wing load distribution, with corrections for wake contraction due to the
fuselage, as shown in Figure 88. The tail load is also included. The overall calculation then captures trim
drag and, together with the structural weight models, allows spanload shape optimization.
Figure 88: Wake streamline contraction due to fuselage thickness, carrying wing circulation into the wake, which is then used in the Trefftz-Plane impulse and kinetic energy calculation. The wake
of the loaded horizontal tail is also included, thus capturing trim drag.
NASA/CR—2010-216794/VOL1 111
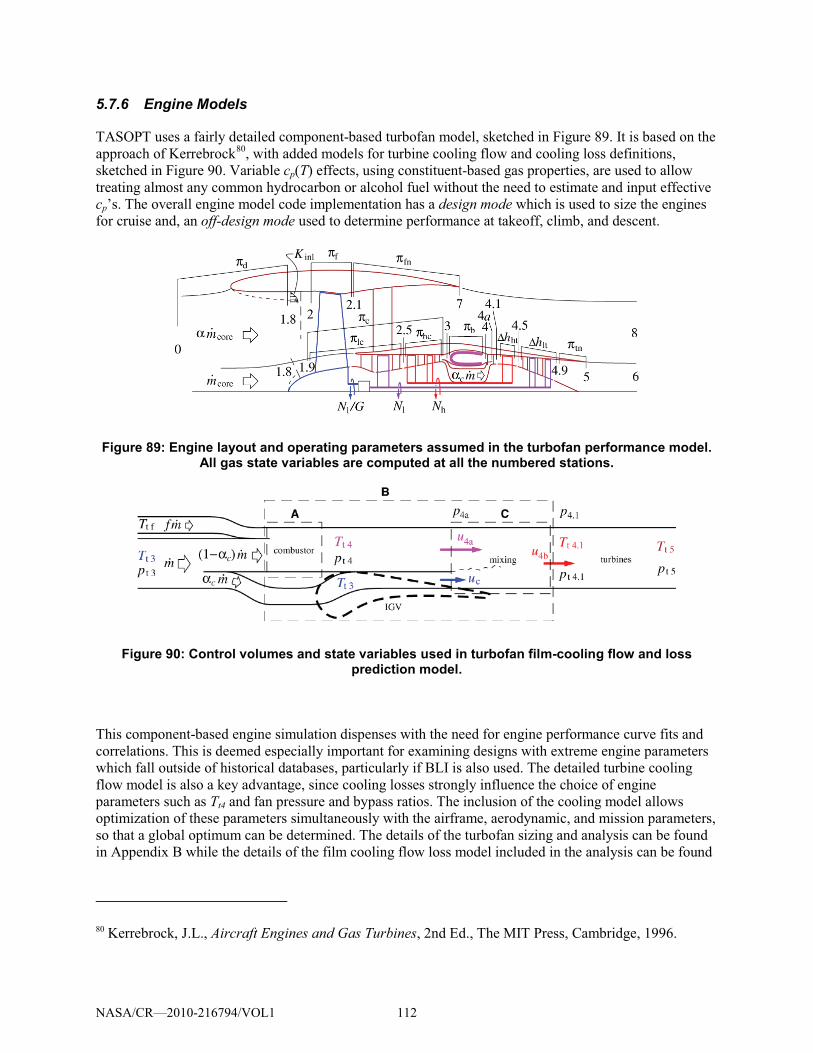
5.7.6 Engine Models
TASOPT uses a fairly detailed component-based turbofan model, sketched in Figure 89. It is based on the
approach of Kerrebrock80
Figure 90
, with added models for turbine cooling flow and cooling loss definitions,
sketched in . Variable cp(T) effects, using constituent-based gas properties, are used to allow
treating almost any common hydrocarbon or alcohol fuel without the need to estimate and input effective
cp’s. The overall engine model code implementation has a design mode which is used to size the engines
for cruise and, an off-design mode used to determine performance at takeoff, climb, and descent.
Figure 89: Engine layout and operating parameters assumed in the turbofan performance model. All gas state variables are computed at all the numbered stations.
Figure 90: Control volumes and state variables used in turbofan film-cooling flow and loss prediction model.
This component-based engine simulation dispenses with the need for engine performance curve fits and
correlations. This is deemed especially important for examining designs with extreme engine parameters
which fall outside of historical databases, particularly if BLI is also used. The detailed turbine cooling
flow model is also a key advantage, since cooling losses strongly influence the choice of engine
parameters such as Tt4 and fan pressure and bypass ratios. The inclusion of the cooling model allows
optimization of these parameters simultaneously with the airframe, aerodynamic, and mission parameters,
so that a global optimum can be determined. The details of the turbofan sizing and analysis can be found
in Appendix B while the details of the film cooling flow loss model included in the analysis can be found
80 Kerrebrock, J.L., Aircraft Engines and Gas Turbines, 2nd Ed., The MIT Press, Cambridge, 1996.
NASA/CR—2010-216794/VOL1 112
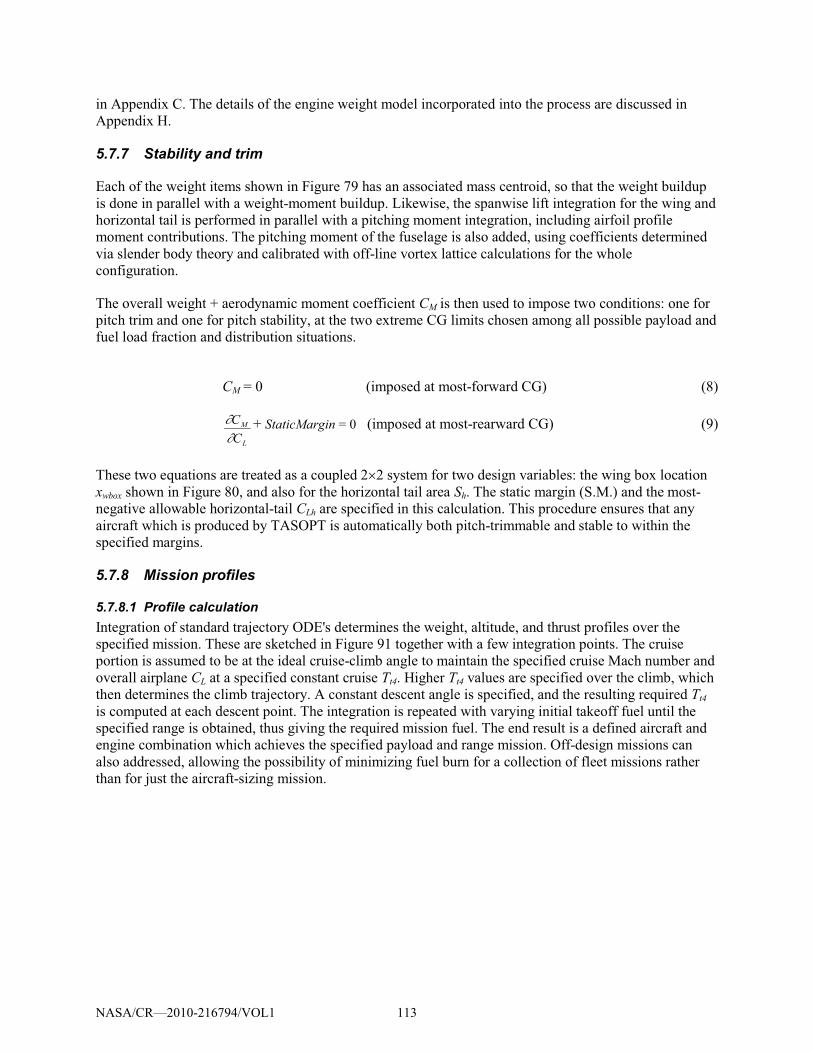
in Appendix C. The details of the engine weight model incorporated into the process are discussed in
Appendix H.
5.7.7 Stability and trim
Each of the weight items shown in Figure 79 has an associated mass centroid, so that the weight buildup
is done in parallel with a weight-moment buildup. Likewise, the spanwise lift integration for the wing and
horizontal tail is performed in parallel with a pitching moment integration, including airfoil profile
moment contributions. The pitching moment of the fuselage is also added, using coefficients determined
via slender body theory and calibrated with off-line vortex lattice calculations for the whole
configuration.
The overall weight + aerodynamic moment coefficient CM is then used to impose two conditions: one for
pitch trim and one for pitch stability, at the two extreme CG limits chosen among all possible payload and
fuel load fraction and distribution situations.
CM = 0 (imposed at most-forward CG) (8)
L
M
CC�� + StaticMargin = 0 (imposed at most-rearward CG) (9)
These two equations are treated as a coupled 2�2 system for two design variables: the wing box location
xwbox shown in Figure 80, and also for the horizontal tail area Sh. The static margin (S.M.) and the most-
negative allowable horizontal-tail CLh are specified in this calculation. This procedure ensures that any
aircraft which is produced by TASOPT is automatically both pitch-trimmable and stable to within the
specified margins.
5.7.8 Mission profiles
5.7.8.1 Profile calculation Integration of standard trajectory ODE's determines the weight, altitude, and thrust profiles over the
specified mission. These are sketched in Figure 91 together with a few integration points. The cruise
portion is assumed to be at the ideal cruise-climb angle to maintain the specified cruise Mach number and
overall airplane CL at a specified constant cruise Tt4. Higher Tt4 values are specified over the climb, which
then determines the climb trajectory. A constant descent angle is specified, and the resulting required Tt4
is computed at each descent point. The integration is repeated with varying initial takeoff fuel until the
specified range is obtained, thus giving the required mission fuel. The end result is a defined aircraft and
engine combination which achieves the specified payload and range mission. Off-design missions can
also addressed, allowing the possibility of minimizing fuel burn for a collection of fleet missions rather
than for just the aircraft-sizing mission.
NASA/CR—2010-216794/VOL1 113
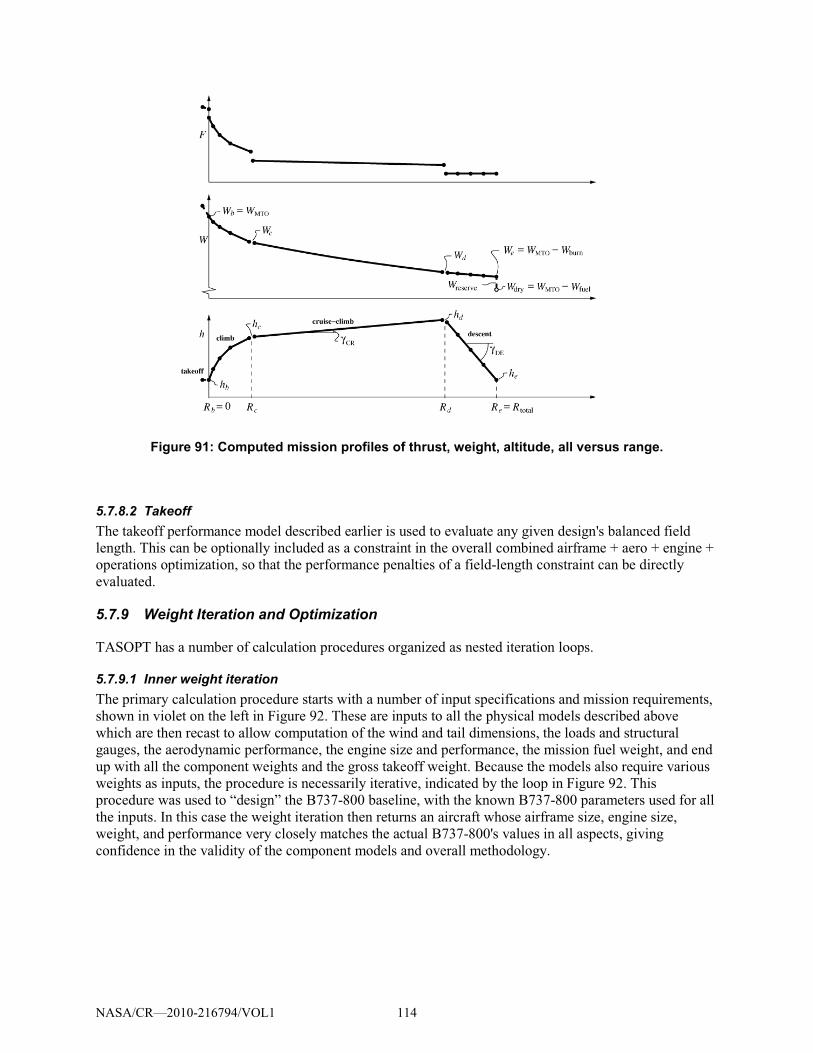
Figure 91: Computed mission profiles of thrust, weight, altitude, all versus range.
5.7.8.2 Takeoff The takeoff performance model described earlier is used to evaluate any given design's balanced field
length. This can be optionally included as a constraint in the overall combined airframe + aero + engine +
operations optimization, so that the performance penalties of a field-length constraint can be directly
evaluated.
5.7.9 Weight Iteration and Optimization
TASOPT has a number of calculation procedures organized as nested iteration loops.
5.7.9.1 Inner weight iteration The primary calculation procedure starts with a number of input specifications and mission requirements,
shown in violet on the left in Figure 92. These are inputs to all the physical models described above
which are then recast to allow computation of the wind and tail dimensions, the loads and structural
gauges, the aerodynamic performance, the engine size and performance, the mission fuel weight, and end
up with all the component weights and the gross takeoff weight. Because the models also require various
weights as inputs, the procedure is necessarily iterative, indicated by the loop in Figure 92. This
procedure was used to “design” the B737-800 baseline, with the known B737-800 parameters used for all
the inputs. In this case the weight iteration then returns an aircraft whose airframe size, engine size,
weight, and performance very closely matches the actual B737-800's values in all aspects, giving
confidence in the validity of the component models and overall methodology.
NASA/CR—2010-216794/VOL1 114
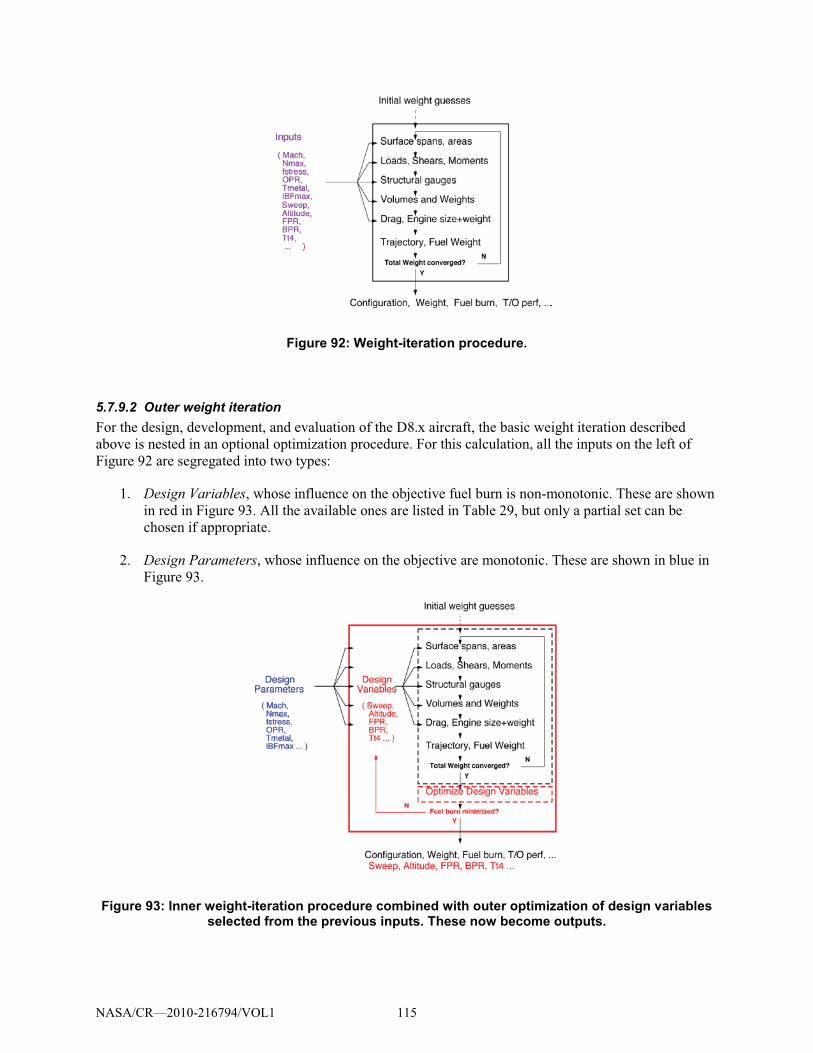
Figure 92: Weight-iteration procedure.
5.7.9.2 Outer weight iteration For the design, development, and evaluation of the D8.x aircraft, the basic weight iteration described
above is nested in an optional optimization procedure. For this calculation, all the inputs on the left of
Figure 92 are segregated into two types:
1. Design Variables, whose influence on the objective fuel burn is non-monotonic. These are shown
in red in Figure 93. All the available ones are listed in Table 29, but only a partial set can be
chosen if appropriate.
2. Design Parameters, whose influence on the objective are monotonic. These are shown in blue in
Figure 93.
Figure 93: Inner weight-iteration procedure combined with outer optimization of design variables selected from the previous inputs. These now become outputs.
NASA/CR—2010-216794/VOL1 115
Table 29: List of Design Variables Selectable for Optimization
CLCR cruise lift coefficient
AR overall aspect ratio
� wing sweep angle
(t/c)o airfoil thickness at �o (wing root)
(t/c)s airfoil thickness at �s (planform break or strut-attach)
�s inner panel taper ratio
�t outer panel taper ratio
��rc� s
clean cl at �s (planform break)
��rc� t
clean cl at 1 (tip)
FPRD design fan pressure ratio
BPRD design bypass ratio
hCR start-of cruise altitude
Tt4CR cruise turbine inlet temperature
Tt4TO takeoff turbine inlet temperature
The optimization procedure then adjusts the design variables and repeatedly invokes the weight-iteration
procedure in a descent process in order to minimize the fuel-burn objective function. Constraints on
balanced field length or fuel volume can be optionally imposed during this process. The chosen design
variables, which were previously inputs, are now outputs and give the global design optimum which gives
the minimum fuel burn.
5.7.9.3 Parametric Sensitivities Using the optimization procedure shown in Figure 93, post-optimum sensitivities of the outputs to the
inputs can be determined, for example
��
� PFEIopt� �MCR
,� PFEIopt� �Nmax
,� PFEIopt� �OPRD
� (10)
These are presented in the sensitivity-study in section 5.6.
5.7.10 Restriction to wing+tube aircraft
The description of the structural and aerodynamic models above suggests why TASOPT is restricted to
tube+wing configurations – most other configurations would be quite difficult or impossible to treat with
NASA/CR—2010-216794/VOL1 116

these models. For example, a joined-wing configuration81
has a relatively complex structure with out-of-
plane deformations and the possibility of coupled twist/bend buckling in the presence of eccentricity from
the airloads, which requires a greatly more complex structural analysis than straightforward beam theory.
A blended-wing-body configuration82
with non-circular cabin cross sections likewise has non-obvious
critical load cases and load paths, and its transonic aerodynamics are dominated by 3D effects. For these
reasons such non-traditional configurations are simply outside the scope of the TASOPT methodology.
81 Wolkovitch, J., “The joined wing: An overview,” Journal of Aircraft, 23(3), Mar 1986.
82 Liebeck, R., “Design of the blended wing body subsonic transport,” Journal of Aircraft, 41(1), Jan
2004.
NASA/CR—2010-216794/VOL1 117
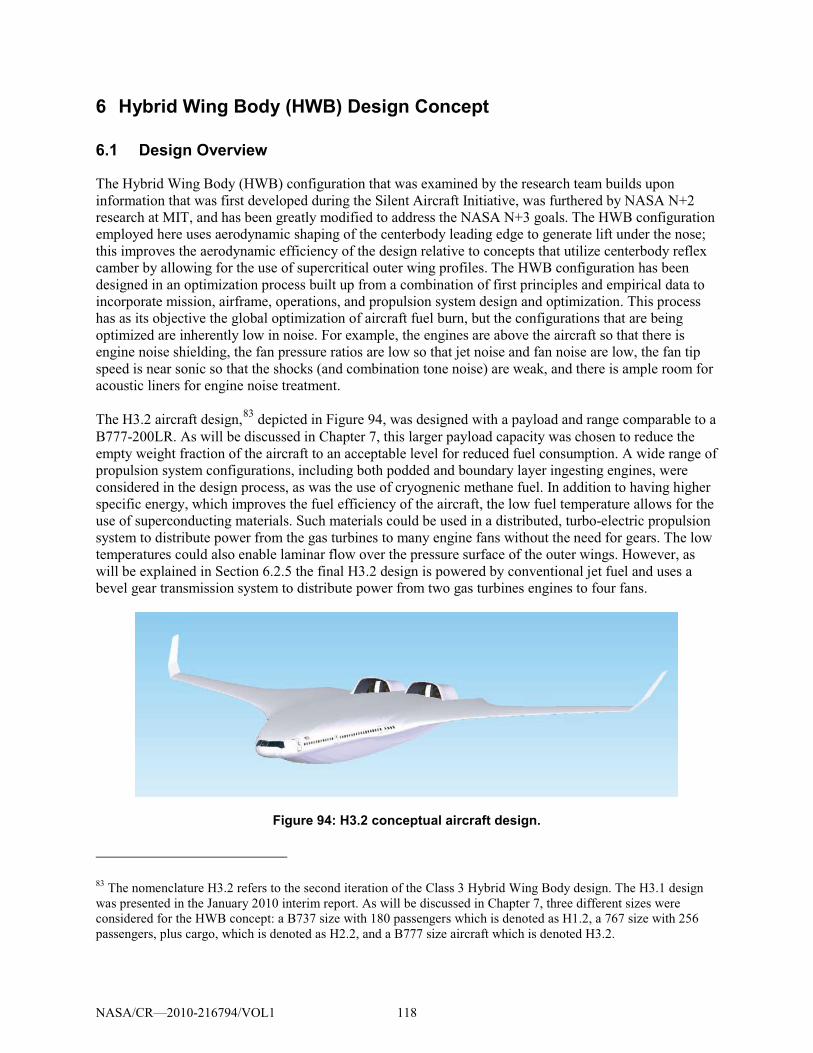
6 Hybrid Wing Body (HWB) Design Concept
6.1 Design Overview
The Hybrid Wing Body (HWB) configuration that was examined by the research team builds upon
information that was first developed during the Silent Aircraft Initiative, was furthered by NASA N+2
research at MIT, and has been greatly modified to address the NASA N+3 goals. The HWB configuration
employed here uses aerodynamic shaping of the centerbody leading edge to generate lift under the nose;
this improves the aerodynamic efficiency of the design relative to concepts that utilize centerbody reflex
camber by allowing for the use of supercritical outer wing profiles. The HWB configuration has been
designed in an optimization process built up from a combination of first principles and empirical data to
incorporate mission, airframe, operations, and propulsion system design and optimization. This process
has as its objective the global optimization of aircraft fuel burn, but the configurations that are being
optimized are inherently low in noise. For example, the engines are above the aircraft so that there is
engine noise shielding, the fan pressure ratios are low so that jet noise and fan noise are low, the fan tip
speed is near sonic so that the shocks (and combination tone noise) are weak, and there is ample room for
acoustic liners for engine noise treatment.
The H3.2 aircraft design,83
depicted in Figure 94, was designed with a payload and range comparable to a
B777-200LR. As will be discussed in Chapter 7, this larger payload capacity was chosen to reduce the
empty weight fraction of the aircraft to an acceptable level for reduced fuel consumption. A wide range of
propulsion system configurations, including both podded and boundary layer ingesting engines, were
considered in the design process, as was the use of cryognenic methane fuel. In addition to having higher
specific energy, which improves the fuel efficiency of the aircraft, the low fuel temperature allows for the
use of superconducting materials. Such materials could be used in a distributed, turbo-electric propulsion
system to distribute power from the gas turbines to many engine fans without the need for gears. The low
temperatures could also enable laminar flow over the pressure surface of the outer wings. However, as
will be explained in Section 6.2.5 the final H3.2 design is powered by conventional jet fuel and uses a
bevel gear transmission system to distribute power from two gas turbines engines to four fans.
Figure 94: H3.2 conceptual aircraft design.
83 The nomenclature H3.2 refers to the second iteration of the Class 3 Hybrid Wing Body design. The H3.1 design
was presented in the January 2010 interim report. As will be discussed in Chapter 7, three different sizes were
considered for the HWB concept: a B737 size with 180 passengers which is denoted as H1.2, a 767 size with 256
passengers, plus cargo, which is denoted as H2.2, and a B777 size aircraft which is denoted H3.2.
NASA/CR—2010-216794/VOL1 118
Each of the design features used for the H-Series of aircraft is discussed below:
• HWB configuration with lifting nose:
� Allows for supercritical outer wing profiles and improved aerodynamic performance
through built-in nose-up trimming moment, via fuselage lift on nose region.
� Includes coach cabin and cargo capacity designed according to Boeing 777-200LR
rules
� Allows for shorter landing gear via better tail clearance
� Improves propulsive efficiency via fuselage boundary layer ingestion (BLI)
� Incorporates an assumed 30% reduction in structure weight, using structural weight
based on Boeing WingMOD based response surface model (used for NASA N2A
aircraft design) through use of advanced materials and manufacturing techniques
� Incorporates drooped leading edge device to increase CLmax during takeoff and
approach for reduced velocities, and airframe noise, during takeoff and approach
� Uses faired undercarriage for reduced noise
• Embedded aft engines:
� Improve propulsive efficiency via fuselage boundary layer ingestion
� Provides reduced susceptibility to bird strike, since engines are invisible head-on,
especially at takeoff angle of attack
� Provide complete shielding of fan faces from ground observers
� Allow for extensive acoustic liners, for reduced noise
• Distributed propulsion system:
� Includes two gas turbine cores powering four fans providing a high bypass ratio of 20
� Provides a reduced fan diameter to allow for longer effective acoustic liners for
reduced noise, higher fan RPM (also to reduce fan noise) and lower engine speeds
during approach while meeting go-around maneuver requirements
� Incorporates a bevel gear transmission system, which distributes power from low
pressure turbine to fans
� Requires fan design development concerning the need to cope with distortion caused
by ingested boundary layer flow
• Thrust vectoring, variable area nozzle:
� Allows for reduced jet noise during takeoff, optimum cruise performance, and
enables operation at low fan speed.
� Provides pitch trim during cruise to minimize profile drag
� Allows increase in induced drag for aircraft trim on approach using thrust vectoring
combined with elevon
In addition, multiple other features were considered but ultimately not chosen in the final design. Each of
these design features are discussed below:
• Cryogenic methane fuel:
� Well suited to large wing volume of HWB configuration
� Can be practical if methane hydrates are developed as a fuel source
� Increases energy efficiency of aircraft system as fuel weight is reduced
� Reduces life cycle greenhouse gas emissions as fewer greenhouse gases are produced
per unit of energy in the aircraft tank
� Promotes laminar flow on lower wing surface through lower temperature
NASA/CR—2010-216794/VOL1 119
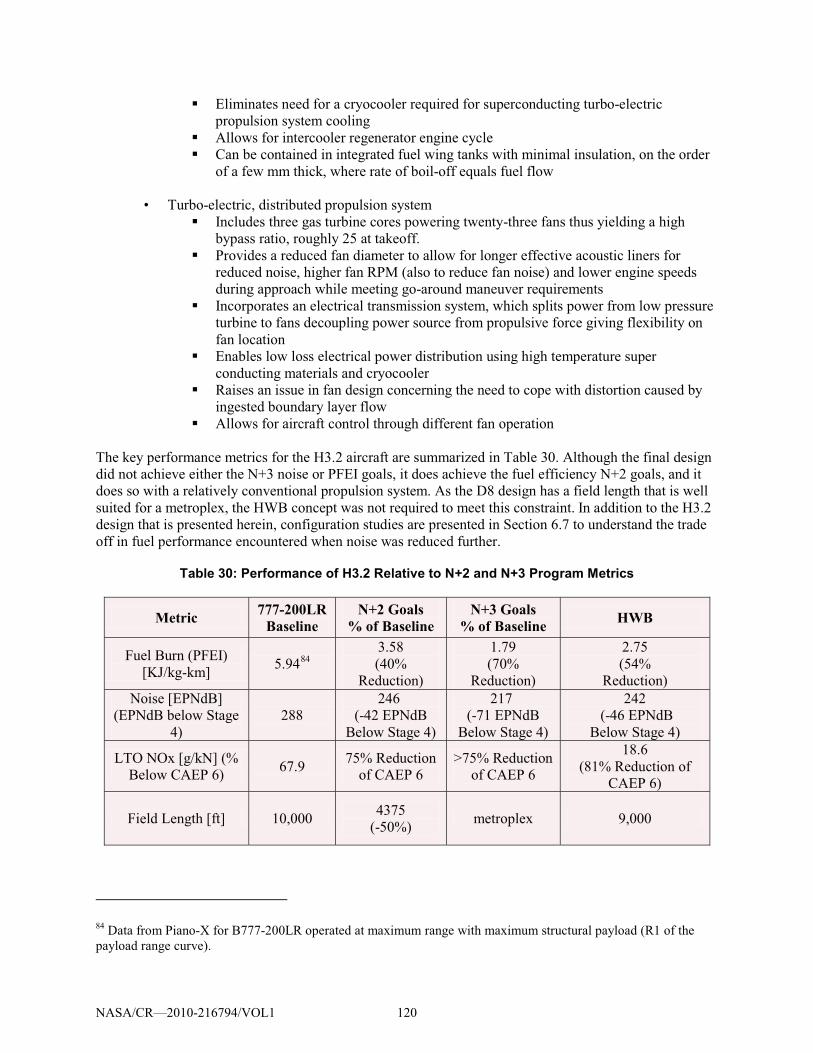
� Eliminates need for a cryocooler required for superconducting turbo-electric
propulsion system cooling
� Allows for intercooler regenerator engine cycle
� Can be contained in integrated fuel wing tanks with minimal insulation, on the order
of a few mm thick, where rate of boil-off equals fuel flow
• Turbo-electric, distributed propulsion system
� Includes three gas turbine cores powering twenty-three fans thus yielding a high
bypass ratio, roughly 25 at takeoff.
� Provides a reduced fan diameter to allow for longer effective acoustic liners for
reduced noise, higher fan RPM (also to reduce fan noise) and lower engine speeds
during approach while meeting go-around maneuver requirements
� Incorporates an electrical transmission system, which splits power from low pressure
turbine to fans decoupling power source from propulsive force giving flexibility on
fan location
� Enables low loss electrical power distribution using high temperature super
conducting materials and cryocooler
� Raises an issue in fan design concerning the need to cope with distortion caused by
ingested boundary layer flow
� Allows for aircraft control through different fan operation
The key performance metrics for the H3.2 aircraft are summarized in Table 30. Although the final design
did not achieve either the N+3 noise or PFEI goals, it does achieve the fuel efficiency N+2 goals, and it
does so with a relatively conventional propulsion system. As the D8 design has a field length that is well
suited for a metroplex, the HWB concept was not required to meet this constraint. In addition to the H3.2
design that is presented herein, configuration studies are presented in Section 6.7 to understand the trade
off in fuel performance encountered when noise was reduced further.
Table 30: Performance of H3.2 Relative to N+2 and N+3 Program Metrics
Metric 777-200LR Baseline
N+2 Goals % of Baseline
N+3 Goals % of Baseline HWB
Fuel Burn (PFEI)
[KJ/kg-km] 5.94
843.58
(40%
Reduction)
1.79
(70%
Reduction)
2.75
(54%
Reduction)
Noise [EPNdB]
(EPNdB below Stage
4)
288
246
(-42 EPNdB
Below Stage 4)
217
(-71 EPNdB
Below Stage 4)
242
(-46 EPNdB
Below Stage 4)
LTO NOx [g/kN] (%
Below CAEP 6) 67.9
75% Reduction
of CAEP 6
>75% Reduction
of CAEP 6
18.6
(81% Reduction of
CAEP 6)
Field Length [ft] 10,000 4375
(-50%) metroplex 9,000
84 Data from Piano-X for B777-200LR operated at maximum range with maximum structural payload (R1 of the
payload range curve).
NASA/CR—2010-216794/VOL1 120
Table 31. H3.2 Aircraft Mission Parameters
Range (nm) (Plus 5% fuel reserves) 7600
Payload (lb) 134,431
Cruise Mach number 0.83
Takeoff distance balanced field length (feet) 9000
Landing distance (feet) 4966
Cruise altitude beginning (feet) 34,921
Cruise altitude end (feet) 40,850
6.2 Technologies
6.2.1 Airframe
The airframe architecture uses an all-lifting hybrid wing body (HWB) with control and low speed lift
augmentation being provided by outer wing elevons, drooped leading edge, thrust vectoring and winglets.
The wide all-lifting centerbody houses the passenger cabin while also providing forward shielding of
engine noise and enabling extensive boundary layer ingestion. The large internal volume also enables the
use of alternative fuels with low volumetric energy density such as LNG. The HWB centerbody uses a
forward cambered airfoil developed during the Silent Aircraft Initiative (SAI) for the SAX-40 aircraft
concept85,86
which was also used on the NASA N2A/N2B87,88
designs. This airfoil has a carved leading
edge producing forward lift to trim the aft lift from the supercritical outer wing at cruise89
As was demonstrated with the SAX-40 and the N2A/N2B designs, the HWB configuration offers the
opportunity for low noise emission. In addition to shielding forward radiating engine noise, the large
centerbody of the HWB design provides ample room for high bypass ratio engines and extensive exhaust
liners. These airframe features combine to enable a dramatic reduction in engine noise. The large lifting
surface eliminates the need for flaps to augment lift at low speeds, which removes a dominant noise
source on conventional aircraft, while also enabling the use of a drooped leading edge to augment lift on
. The tailless
aircraft can be trimmed in other flight segments using the elevons and thrust vectoring. Parameterization
of the twist distribution allows design for trimmed flight at start of cruise in a clean configuration along
with elliptical span loading to minimize induced drag. This also results in a non-elliptical lift distribution
with increased induced drag for a quiet, trimmed approach.
85 Hileman J., Z. Spakovsky, M. Drela, and M. Sargeant. "Airframe design for ’Silent Aircraft’," AIAA-2007-0453,
45th AIAA Aerospace Sciences Meeting and Exhibit, Reno, NV, 2007. 86
Hileman J., Z. Spakovsky, M. Drela, M. Sargeant, and A. Jones. "Airframe Design for Silent Fuel-Efficient
Aircraft," accepted to Journal of Aircraft, 2010. 87
Ng, L., “Design and Acoustic Shielding Prediction of Hybrid Wing-Body Aircraft,” Master of Science Thesis,
Massachusetts Institute of Technology, Cambridge, Massachusetts, 2009. 88
Tong, M., S. Jones, and J. Haller. “Engine Conceptual Design Studies for a Hybrid Wing Body Aircraft,” NASA
TM-2009-215680, Nov. 2009. 89
Sargeant, M., T. Hynes, W. Graham, J. Hileman, M. Drela, and Z. Spakovszky. “Stability of Hybrid-Wing–Body-
Type Aircraft with Centerbody Leading-Edge Carving,” accepted to Journal of Aircraft, 2010.
NASA/CR—2010-216794/VOL1 121
takeoff and approach. The drooped leading edge does not add to the airfoil noise90
thus allowing for
decreased approach speeds without additional noise being incurred. Decreased approach speed is
desirable as all airframe noise sources scale with velocity to the 5th or 6th power. Because of this, there is
an incentive to design for reduced stall speed since approach speed is set as 1.23 x stall speed. Because
increased wing area, which increases drag, can also be used to lower the aircraft stall speed there is a
tradeoff between airframe noise and cruise performance, which is discussed in detail in Section 6.7.
Because of this implicit tradeoff, the HWB optimization was optimized for both PFEI and approach noise.
The HWB concept employed here was designed with fairings on the landing gear to reduce undercarriage
noise; it must be noted that this is not a unique feature to the HWB concept as it can be used on any
aircraft concept91
6.2.2 Airframe Structure and Materials
.
Structures technologies that are included in the design of the H3.2 configuration include advanced
materials and load reduction technologies such as gust load alleviation, flight envelope protection,
predictive path planning, and structural health monitoring.
The airframe concept will use carbon fiber reinforced polymer (CFRP) for the entire structure, assuming
improved constituent material properties. The carbon composite material will include short carbon
nanotubes (CNTs), which project to increase the compression after impact strength of the carbon fiber.
Safety factors have been added to the material properties to account for ultimate loading and residual
strength requirements. If 60% of the structure could realize this weight fraction while the other 40% of the
air vehicle structure would be unchanged due to sizing not based on strength then the overall structural
weight fraction would be approximately 0.7 of present day composite technology. It should be noted that
at interfaces of structural components are also reduced in weight by primarily using the unitized structure
manufacturing and assembly techniques. The HWB concept will have a reduced part count due to the
ability to layup complex parts as a co-cured structure requiring fewer fasteners and fittings. Out-of-
Autoclave (OOA) resins enable larger components to be cured without the size restriction of an
autoclave. Processes like Resin Transfer Modeling (RTM) and Vacuum-assisted Resin Transfer Molding
(VaRTM) allow increased out-time for complex layups prior to curing. Pultruded Rod Stitched Efficient
Unitized Structure (PRSEUS) and similar processes allow for the combination of skin, stringer, and frame
elements into a common structure. These techniques and others would allow for weight savings at details
and interfaces to match weight savings in the structure itself. Additional details are provided in Appendix
G.
Load reduction technologies will allow the vehicle concept to be designed to lower loading and still
operate safely throughout the life of the vehicle. Gust load alleviation reduces the magnitude of gust
loading on the wing through deflection of control surfaces to counteract the gust. Envelope protection
and predictive path planning help limit the aircraft response to safe levels within the flight envelope.
Structure and load monitoring technologies, which includes structural health monitoring, reduce the
uncertainty in load and residual strength, all of which lead to the ability to design a lighter more efficient
airframe.
90 Andreoum, C., W. Graham, and H. Shin. "Aeroacoustic comparison of airfoil leading-edge slat and droop,"
AIAA-2007-0230, 45th AIAA Aerospace Sciences Meeting and Exhibit, Reno, NV, 2007. 91
Quayle A., A. Dowling, H. Babinsky, W. Graham, H. Shin, and P. Sijtsma. "Landing Gear for a Silent Aircraft,"
AIAA-2007-0231, 45th AIAA Aerospace Sciences Meeting and Exhibit, Reno, NV, 2007.
NASA/CR—2010-216794/VOL1 122
6.2.3 Boundary layer ingestion
Boundary layer ingestion (BLI) is one of the technologies used for the H3.2 design. BLI by the engines
could benefit the vehicle aerodynamic performance by eliminating kinetic energy dissipation in the wake
and by reducing dissipation in the mixing of engine exhaust jet. The first effect comes from the
elimination of the wake defect itself through ingestion, while the second effect comes from the reduction
of jet kinetic energy required associated with the first effect. Detailed analysis on benefits of boundary
layer ingestion is described in Appendix F.
Although boundary layer ingestion improves the aerodynamic performance of the aircraft, there are
drawbacks associated with this technology, such as the degradation of the propulsion system
performance. The ingestion of low kinetic energy flow (and hence low total pressure flow) increases the
specific fuel consumption of the engine. Furthermore, inlet pressure non-uniformity and distortion
coming into the fan gives rise to additional aero-mechanical vibration, a decrease on the stability margin
and reduction of fan efficiency, further increasing the specific fuel consumption. These issues can be
alleviated through innovative inlets designs. The rise in specific fuel consumption increases with the
amount of boundary layer ingested by the propulsion system, which leads to a tradeoff between
aerodynamic performance of the vehicle and the efficiency of the propulsion system. Due to the wide
fuselage that is characteristic of HWB configurations, the propulsion system can be distributed covering
the whole centerbody, which makes the tradeoff between boundary layer ingestion and propulsion system
performance very relevant for this type of aircraft.
6.2.4 Propulsion System
The H3.2 concept uses an advanced geared distributed turbofan propulsion system with major
improvements in material technology and flowpath aerodynamics. It has also been equipped with an
advanced combustor to allow for significant reduction in specific fuel consumption and emissions.
The use of distributed propulsion in the H3 configuration enhances the ingestion of the vehicle boundary
layer to improve propulsive efficiency. This also allows for a more effective packaging of very high
bypass ratio engines without the subsequent increase in wetted area and resulting drag. There is also a
benefit in noise associated with the H3 propulsion system. The reduction of the fan diameter leads to
narrower exhaust duct (higher length-to-diameter ratio) that, when lined with acoustic liners, are more
effective at attenuating fan rearward noise. In addition, smaller fans have higher rotational speed giving
rise to an increase in the blade passing frequency, which results in noise that is more readily attenuated.
Advanced materials with higher allowable hot section temperatures, more efficient turbine cooling
schemes – such as improved cooling hole design, and prime reliant thermal barrier coatings will enable
turbine operation at higher burner exit temperatures, allowing for higher bypass ratios and better
propulsive efficiency. Cruise fuel consumption is also reduced due to a reduction in the required turbine
cooling air flow at takeoff.
Evolutionary gains in component performances are assumed. In particular, new design and machining
processes will be necessary to create efficient high pressure turbines with small blade heights. As core
size (measured by the corrected flow leaving a compressor) decreases, current machines experience a
large degradation of efficiency below certain values (3 lbs/s). High efficiency at core sizes lower than
this is critical in reaching higher overall pressure ratios for increased thermal efficiency.
Advanced Lean Direct Injection (LDI) combustors, currently under development at NASA Glenn, were
assumed to be in use to enable the N+3 emissions goal. The LDI combustor injects fuel into multiple
flame zones, enabling lean combustion while minimizing local hotspots. This allows the LDI combustor
NASA/CR—2010-216794/VOL1 123
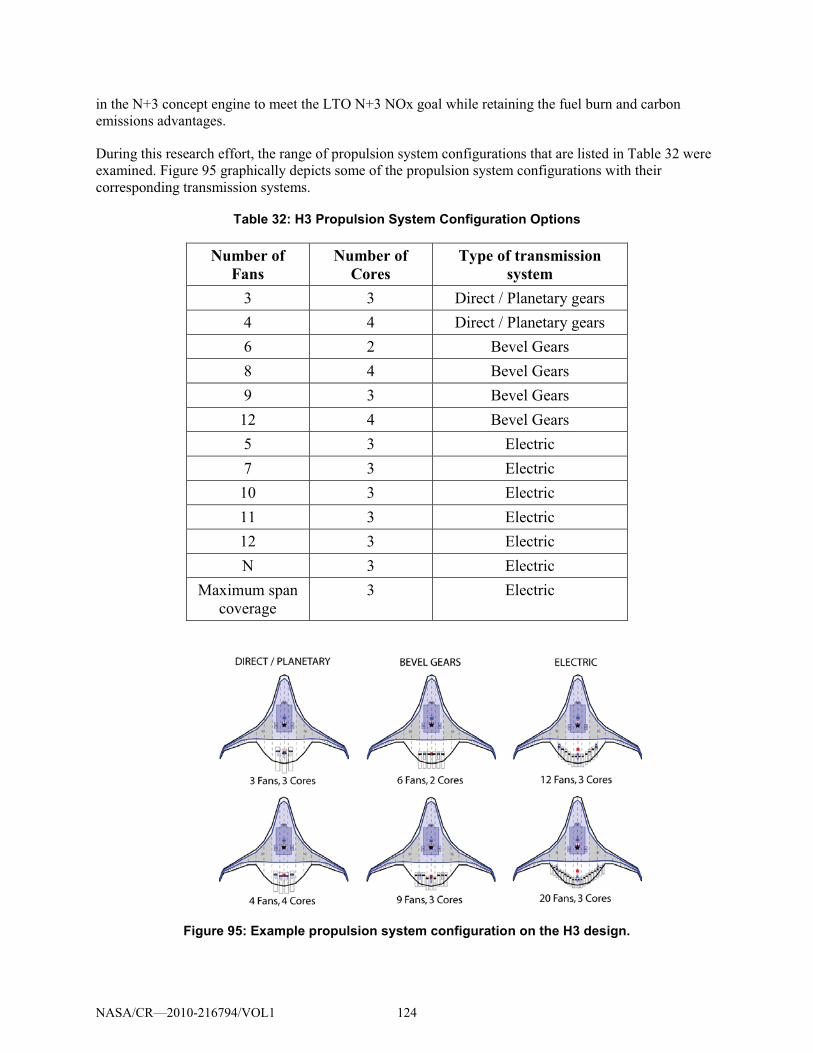
in the N+3 concept engine to meet the LTO N+3 NOx goal while retaining the fuel burn and carbon
emissions advantages.
During this research effort, the range of propulsion system configurations that are listed in Table 32 were
examined. Figure 95 graphically depicts some of the propulsion system configurations with their
corresponding transmission systems.
Table 32: H3 Propulsion System Configuration Options
Number of Fans
Number of Cores
Type of transmission system
3 3 Direct / Planetary gears
4 4 Direct / Planetary gears
6 2 Bevel Gears
8 4 Bevel Gears
9 3 Bevel Gears
12 4 Bevel Gears
5 3 Electric
7 3 Electric
10 3 Electric
11 3 Electric
12 3 Electric
N 3 Electric
Maximum span
coverage
3 Electric
Figure 95: Example propulsion system configuration on the H3 design.
NASA/CR—2010-216794/VOL1 124
6.2.5 Choice of H3.2 propulsion system and fuel
As a result of the airframe and propulsion system optimization, a propulsion system using four fans and
two cores was selected for the H3.2 aircraft design.
This choice of propulsion system was largely a result of a tradeoff between boundary layer ingestion and
propulsion system performance. The chord length decreases rapidly with increasing spanwise distance
from the aircraft centerline, the gain in boundary layer ingestion decreases as the span covered by the
propulsion system increases. This results in the optimal being a relatively small value of 45%, which can
be covered with relatively few fans. This spanwise coverage translates to the engines ingesting 60% of the
boundary layer on the top fuselage surface. The final design has a mechanical transmission system
(beveled) because these tend to be lighter and less complex as compared to electrical transmission
systems. A mechanical design also further drove the propulsion system to a design with fewer fans.
Finally, a propulsion system with two cores was chosen over three cores because of the higher engine
component efficiencies that are associated with larger core size.
Because the optimization process led to a design with a mechanical transmission system, instead of an
electrical transmissions system, the research team selected conventional jet fuel over LNG to power the
H3.2. Although the use of LNG did result in a few percentage points of improvement in PFEI relative to
conventional jet fuel, which was a result of the improved specific energy of the fuel, the improvement
was not deemed to be sufficiently large to merit the large risks that would be incurred in having two
airport fueling systems.
6.3 Design Methodology
6.3.1 Overview
The hybrid wing body (HWB) design methodology utilizes a modular design framework packaged into
the HWBOpt Matlab program. The methodology consists of a complete aircraft system design loop
wrapped in a global optimization routine. As shown in Figure 96, the design loop is organized to be
modular by discipline to accommodate continuous evolution of the program, while minimizing feedback
loops.
NASA/CR—2010-216794/VOL1 125
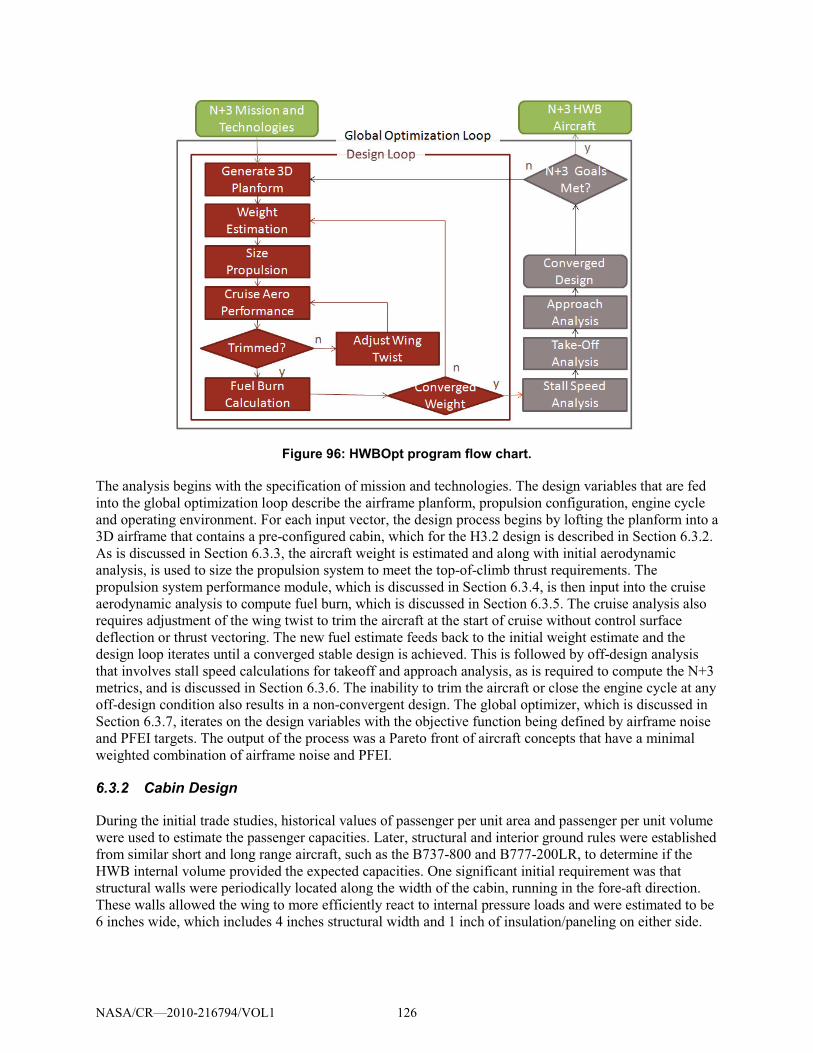
Figure 96: HWBOpt program flow chart.
The analysis begins with the specification of mission and technologies. The design variables that are fed
into the global optimization loop describe the airframe planform, propulsion configuration, engine cycle
and operating environment. For each input vector, the design process begins by lofting the planform into a
3D airframe that contains a pre-configured cabin, which for the H3.2 design is described in Section 6.3.2.
As is discussed in Section 6.3.3, the aircraft weight is estimated and along with initial aerodynamic
analysis, is used to size the propulsion system to meet the top-of-climb thrust requirements. The
propulsion system performance module, which is discussed in Section 6.3.4, is then input into the cruise
aerodynamic analysis to compute fuel burn, which is discussed in Section 6.3.5. The cruise analysis also
requires adjustment of the wing twist to trim the aircraft at the start of cruise without control surface
deflection or thrust vectoring. The new fuel estimate feeds back to the initial weight estimate and the
design loop iterates until a converged stable design is achieved. This is followed by off-design analysis
that involves stall speed calculations for takeoff and approach analysis, as is required to compute the N+3
metrics, and is discussed in Section 6.3.6. The inability to trim the aircraft or close the engine cycle at any
off-design condition also results in a non-convergent design. The global optimizer, which is discussed in
Section 6.3.7, iterates on the design variables with the objective function being defined by airframe noise
and PFEI targets. The output of the process was a Pareto front of aircraft concepts that have a minimal
weighted combination of airframe noise and PFEI.
6.3.2 Cabin Design
During the initial trade studies, historical values of passenger per unit area and passenger per unit volume
were used to estimate the passenger capacities. Later, structural and interior ground rules were established
from similar short and long range aircraft, such as the B737-800 and B777-200LR, to determine if the
HWB internal volume provided the expected capacities. One significant initial requirement was that
structural walls were periodically located along the width of the cabin, running in the fore-aft direction.
These walls allowed the wing to more efficiently react to internal pressure loads and were estimated to be
6 inches wide, which includes 4 inches structural width and 1 inch of insulation/paneling on either side.
NASA/CR—2010-216794/VOL1 126
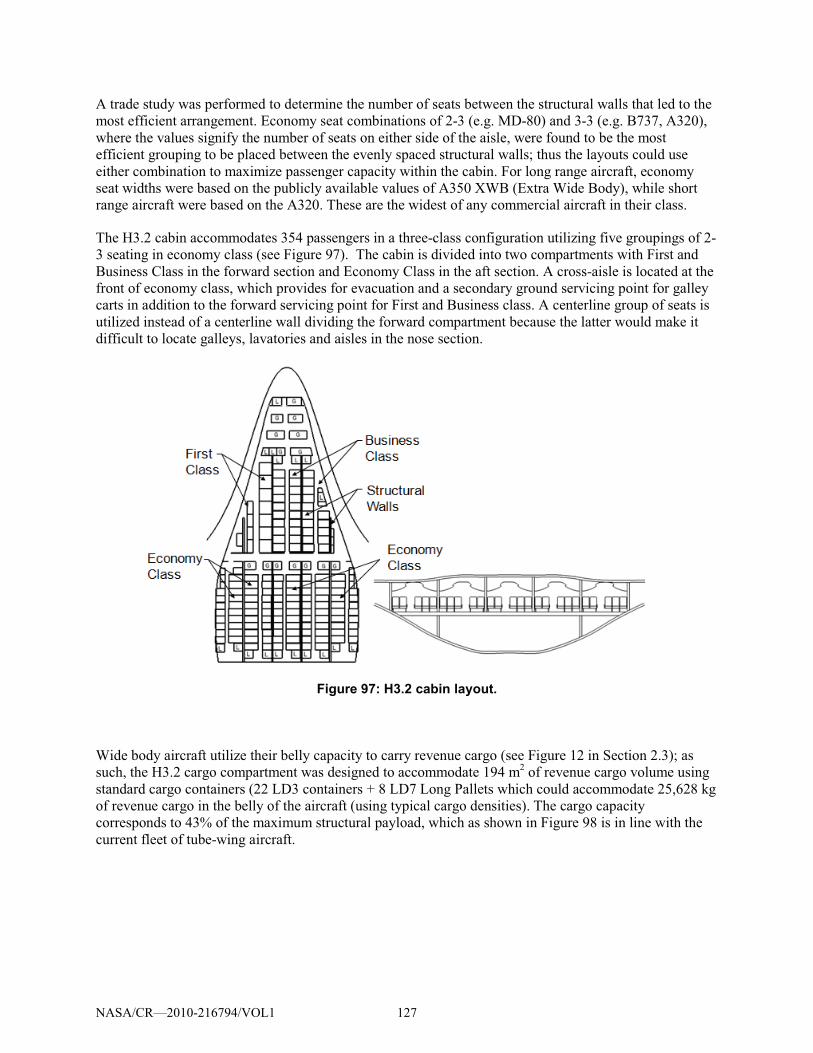
A trade study was performed to determine the number of seats between the structural walls that led to the
most efficient arrangement. Economy seat combinations of 2-3 (e.g. MD-80) and 3-3 (e.g. B737, A320),
where the values signify the number of seats on either side of the aisle, were found to be the most
efficient grouping to be placed between the evenly spaced structural walls; thus the layouts could use
either combination to maximize passenger capacity within the cabin. For long range aircraft, economy
seat widths were based on the publicly available values of A350 XWB (Extra Wide Body), while short
range aircraft were based on the A320. These are the widest of any commercial aircraft in their class.
The H3.2 cabin accommodates 354 passengers in a three-class configuration utilizing five groupings of 2-
3 seating in economy class (see Figure 97). The cabin is divided into two compartments with First and
Business Class in the forward section and Economy Class in the aft section. A cross-aisle is located at the
front of economy class, which provides for evacuation and a secondary ground servicing point for galley
carts in addition to the forward servicing point for First and Business class. A centerline group of seats is
utilized instead of a centerline wall dividing the forward compartment because the latter would make it
difficult to locate galleys, lavatories and aisles in the nose section.
Figure 97: H3.2 cabin layout.
Wide body aircraft utilize their belly capacity to carry revenue cargo (see Figure 12 in Section 2.3); as
such, the H3.2 cargo compartment was designed to accommodate 194 m2 of revenue cargo volume using
standard cargo containers (22 LD3 containers + 8 LD7 Long Pallets which could accommodate 25,628 kg
of revenue cargo in the belly of the aircraft (using typical cargo densities). The cargo capacity
corresponds to 43% of the maximum structural payload, which as shown in Figure 98 is in line with the
current fleet of tube-wing aircraft.
NASA/CR—2010-216794/VOL1 127
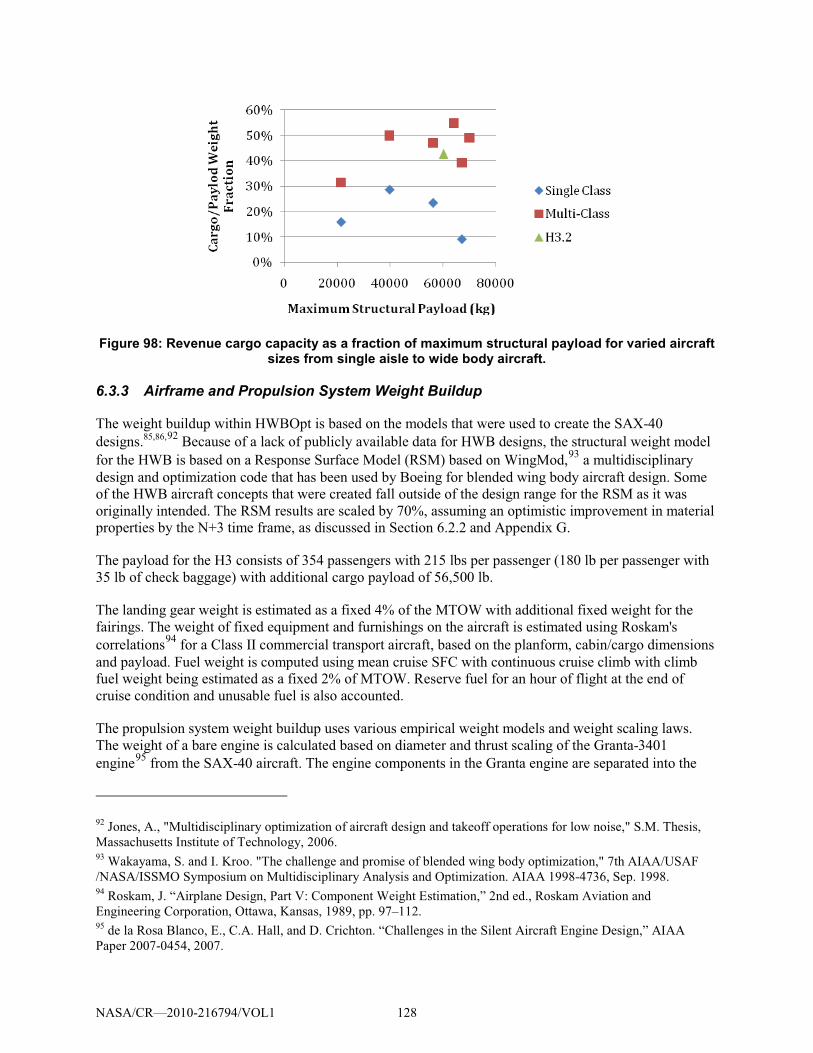
Figure 98: Revenue cargo capacity as a fraction of maximum structural payload for varied aircraft sizes from single aisle to wide body aircraft.
6.3.3 Airframe and Propulsion System Weight Buildup
The weight buildup within HWBOpt is based on the models that were used to create the SAX-40
designs.85,86,92
Because of a lack of publicly available data for HWB designs, the structural weight model
for the HWB is based on a Response Surface Model (RSM) based on WingMod,93
6.2.2
a multidisciplinary
design and optimization code that has been used by Boeing for blended wing body aircraft design. Some
of the HWB aircraft concepts that were created fall outside of the design range for the RSM as it was
originally intended. The RSM results are scaled by 70%, assuming an optimistic improvement in material
properties by the N+3 time frame, as discussed in Section and Appendix G.
The payload for the H3 consists of 354 passengers with 215 lbs per passenger (180 lb per passenger with
35 lb of check baggage) with additional cargo payload of 56,500 lb.
The landing gear weight is estimated as a fixed 4% of the MTOW with additional fixed weight for the
fairings. The weight of fixed equipment and furnishings on the aircraft is estimated using Roskam's
correlations94
The propulsion system weight buildup uses various empirical weight models and weight scaling laws.
The weight of a bare engine is calculated based on diameter and thrust scaling of the Granta-3401
engine
for a Class II commercial transport aircraft, based on the planform, cabin/cargo dimensions
and payload. Fuel weight is computed using mean cruise SFC with continuous cruise climb with climb
fuel weight being estimated as a fixed 2% of MTOW. Reserve fuel for an hour of flight at the end of
cruise condition and unusable fuel is also accounted.
95
92 Jones, A., "Multidisciplinary optimization of aircraft design and takeoff operations for low noise," S.M. Thesis,
Massachusetts Institute of Technology, 2006.
from the SAX-40 aircraft. The engine components in the Granta engine are separated into the
93Wakayama, S. and I. Kroo. "The challenge and promise of blended wing body optimization," 7th AIAA/USAF
/NASA/ISSMO Symposium on Multidisciplinary Analysis and Optimization. AIAA 1998-4736, Sep. 1998. 94
Roskam, J. “Airplane Design, Part V: Component Weight Estimation,” 2nd ed., Roskam Aviation and
Engineering Corporation, Ottawa, Kansas, 1989, pp. 97–112. 95
de la Rosa Blanco, E., C.A. Hall, and D. Crichton. “Challenges in the Silent Aircraft Engine Design,” AIAA
Paper 2007-0454, 2007.
NASA/CR—2010-216794/VOL1 128
fan and the core. The weight of the fan is scaled based on its diameter, and the weight of the core is scaled
based on the design thrust generated by the engine at cruise. The weight of the nacelle and the exhaust
duct is computed based on an empirical correlation96
Since different transmissions were assessed, different weight correlations were established for each
engine transmissions system. The weight calculation of planetary gears uses the correlation from NASA
GRC WATE++
, which is based on fan diameter, duct length to
diameter ratio, and the inlet geometry.
97
6.3.4 Engine Design
model. This correlation relates the weight of the transmission system with the fan mass
flow and core shaft power output at takeoff condition. The weight of bevel gear transmission is based on
scaling the torque carried by the transmission system, using the transmission weight of the Granta-3401
as a baseline. Finally, the weight calculation of the electric transmission system, which includes the
HTSC generator and motor, cryocooler, inverter was conducted using the weight correlation developed by
the research team (Appendix K.) This model uses core shaft power and torque to compute the weight of
each component in the electric transmission system.
Engine cycle performance and sizing calculations were conducted using a semi-perfect gas cycle model.
Engine flows are assumed to be a mixture of semi-perfect gases with tabulated specific heat data (the
specific heat of each constituent is temperature-dependent). This provides higher fidelity than a perfect
gas model with a minimum of added complexity. It also has the benefit of eliminating the need for fuel
heating values, since the fuel is also treated as a semi-perfect gas (so the heat released in combustion is a
function of the state of both the air and fuel prior to burning); this is particularly useful when analyzing
LNG as a fuel, since fuel temperature may have a significant effect on cycle performance and thermal
management of the entire aircraft system. Details of the gas model and cycle performance calculations
can be found in the Appendices B, C, and D.
Figure 99 illustrates the aircraft design procedure for the H3.2 design. For a given aircraft design, the
design model sizes the propulsion system to meet the cruise thrust requirement of the airframe. Because
of the close coupling between the propulsion system and the airframe, multiple iteration loops were
required to match the propulsion system and the airframe. Because of the coupling between the inlet
pressure recovery and engine size, one iteration loop was required to match the inlet pressure recovery
assumed by the engine cycle calculation and the physical inlet pressure recovery calculated from the size
of the propulsion system. The H3.2 final engine design assumes clean flow in the engine core.
Furthermore, another iteration loop was required to solve for the required aircraft cruise thrust, which was
closely coupled with the propulsion system weight and its fuel consumption. The sizing of propulsion
system was only conducted at cruise condition, assuming that the propulsion can meet other off-design
requirements such as takeoff and top of climb. Detailed off-design calculations were conducted using the
commercial software package Gasturb with the finalized aircraft design to check that the propulsion
system met all operational requirements.
96 Raymer, D., Aircraft Design: A Conceptual Approach AIAA Education Series, New York, NY, 2006. ISBN 1-
56347-829-3. 97
Tong M. and B. Naylor. “An Object-Oriented Computer Code for Aircraft Engine Weight Estimation,”
NASA/TM—2009-215656, 2009.
NASA/CR—2010-216794/VOL1 129
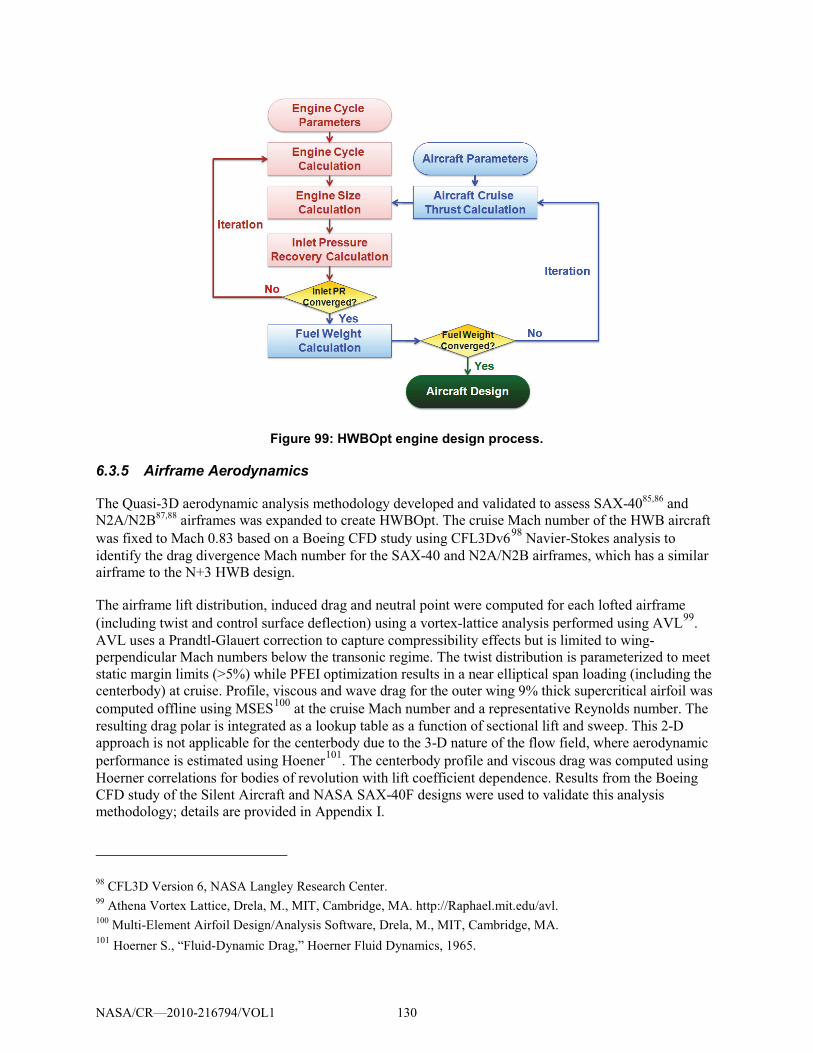
Figure 99: HWBOpt engine design process.
6.3.5 Airframe Aerodynamics
The Quasi-3D aerodynamic analysis methodology developed and validated to assess SAX-4085,86
and
N2A/N2B87,88
airframes was expanded to create HWBOpt. The cruise Mach number of the HWB aircraft
was fixed to Mach 0.83 based on a Boeing CFD study using CFL3Dv698
The airframe lift distribution, induced drag and neutral point were computed for each lofted airframe
(including twist and control surface deflection) using a vortex-lattice analysis performed using AVL
Navier-Stokes analysis to
identify the drag divergence Mach number for the SAX-40 and N2A/N2B airframes, which has a similar
airframe to the N+3 HWB design.
99.
AVL uses a Prandtl-Glauert correction to capture compressibility effects but is limited to wing-
perpendicular Mach numbers below the transonic regime. The twist distribution is parameterized to meet
static margin limits (>5%) while PFEI optimization results in a near elliptical span loading (including the
centerbody) at cruise. Profile, viscous and wave drag for the outer wing 9% thick supercritical airfoil was
computed offline using MSES100
at the cruise Mach number and a representative Reynolds number. The
resulting drag polar is integrated as a lookup table as a function of sectional lift and sweep. This 2-D
approach is not applicable for the centerbody due to the 3-D nature of the flow field, where aerodynamic
performance is estimated using Hoener101
98 CFL3D Version 6, NASA Langley Research Center.
. The centerbody profile and viscous drag was computed using
Hoerner correlations for bodies of revolution with lift coefficient dependence. Results from the Boeing
CFD study of the Silent Aircraft and NASA SAX-40F designs were used to validate this analysis
methodology; details are provided in Appendix I.
99 Athena Vortex Lattice, Drela, M., MIT, Cambridge, MA. http://Raphael.mit.edu/avl.
100 Multi-Element Airfoil Design/Analysis Software, Drela, M., MIT, Cambridge, MA.
101 Hoerner S., “Fluid-Dynamic Drag,” Hoerner Fluid Dynamics, 1965.
NASA/CR—2010-216794/VOL1 130
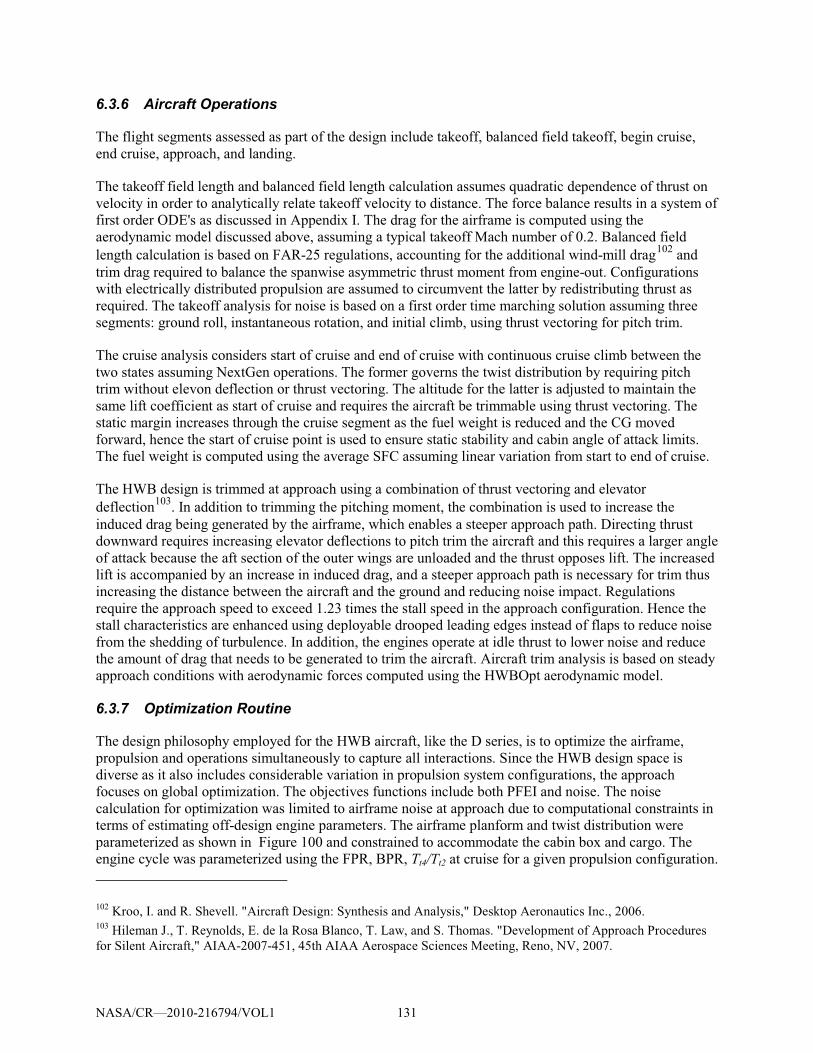
6.3.6 Aircraft Operations
The flight segments assessed as part of the design include takeoff, balanced field takeoff, begin cruise,
end cruise, approach, and landing.
The takeoff field length and balanced field length calculation assumes quadratic dependence of thrust on
velocity in order to analytically relate takeoff velocity to distance. The force balance results in a system of
first order ODE's as discussed in Appendix I. The drag for the airframe is computed using the
aerodynamic model discussed above, assuming a typical takeoff Mach number of 0.2. Balanced field
length calculation is based on FAR-25 regulations, accounting for the additional wind-mill drag102
The cruise analysis considers start of cruise and end of cruise with continuous cruise climb between the
two states assuming NextGen operations. The former governs the twist distribution by requiring pitch
trim without elevon deflection or thrust vectoring. The altitude for the latter is adjusted to maintain the
same lift coefficient as start of cruise and requires the aircraft be trimmable using thrust vectoring. The
static margin increases through the cruise segment as the fuel weight is reduced and the CG moved
forward, hence the start of cruise point is used to ensure static stability and cabin angle of attack limits.
The fuel weight is computed using the average SFC assuming linear variation from start to end of cruise.
and
trim drag required to balance the spanwise asymmetric thrust moment from engine-out. Configurations
with electrically distributed propulsion are assumed to circumvent the latter by redistributing thrust as
required. The takeoff analysis for noise is based on a first order time marching solution assuming three
segments: ground roll, instantaneous rotation, and initial climb, using thrust vectoring for pitch trim.
The HWB design is trimmed at approach using a combination of thrust vectoring and elevator
deflection103
6.3.7 Optimization Routine
. In addition to trimming the pitching moment, the combination is used to increase the
induced drag being generated by the airframe, which enables a steeper approach path. Directing thrust
downward requires increasing elevator deflections to pitch trim the aircraft and this requires a larger angle
of attack because the aft section of the outer wings are unloaded and the thrust opposes lift. The increased
lift is accompanied by an increase in induced drag, and a steeper approach path is necessary for trim thus
increasing the distance between the aircraft and the ground and reducing noise impact. Regulations
require the approach speed to exceed 1.23 times the stall speed in the approach configuration. Hence the
stall characteristics are enhanced using deployable drooped leading edges instead of flaps to reduce noise
from the shedding of turbulence. In addition, the engines operate at idle thrust to lower noise and reduce
the amount of drag that needs to be generated to trim the aircraft. Aircraft trim analysis is based on steady
approach conditions with aerodynamic forces computed using the HWBOpt aerodynamic model.
The design philosophy employed for the HWB aircraft, like the D series, is to optimize the airframe,
propulsion and operations simultaneously to capture all interactions. Since the HWB design space is
diverse as it also includes considerable variation in propulsion system configurations, the approach
focuses on global optimization. The objectives functions include both PFEI and noise. The noise
calculation for optimization was limited to airframe noise at approach due to computational constraints in
terms of estimating off-design engine parameters. The airframe planform and twist distribution were
parameterized as shown in Figure 100 and constrained to accommodate the cabin box and cargo. The
engine cycle was parameterized using the FPR, BPR, Tt4/Tt2 at cruise for a given propulsion configuration.
102 Kroo, I. and R. Shevell. "Aircraft Design: Synthesis and Analysis," Desktop Aeronautics Inc., 2006.
103 Hileman J., T. Reynolds, E. de la Rosa Blanco, T. Law, and S. Thomas. "Development of Approach Procedures
for Silent Aircraft," AIAA-2007-451, 45th AIAA Aerospace Sciences Meeting, Reno, NV, 2007.
NASA/CR—2010-216794/VOL1 131
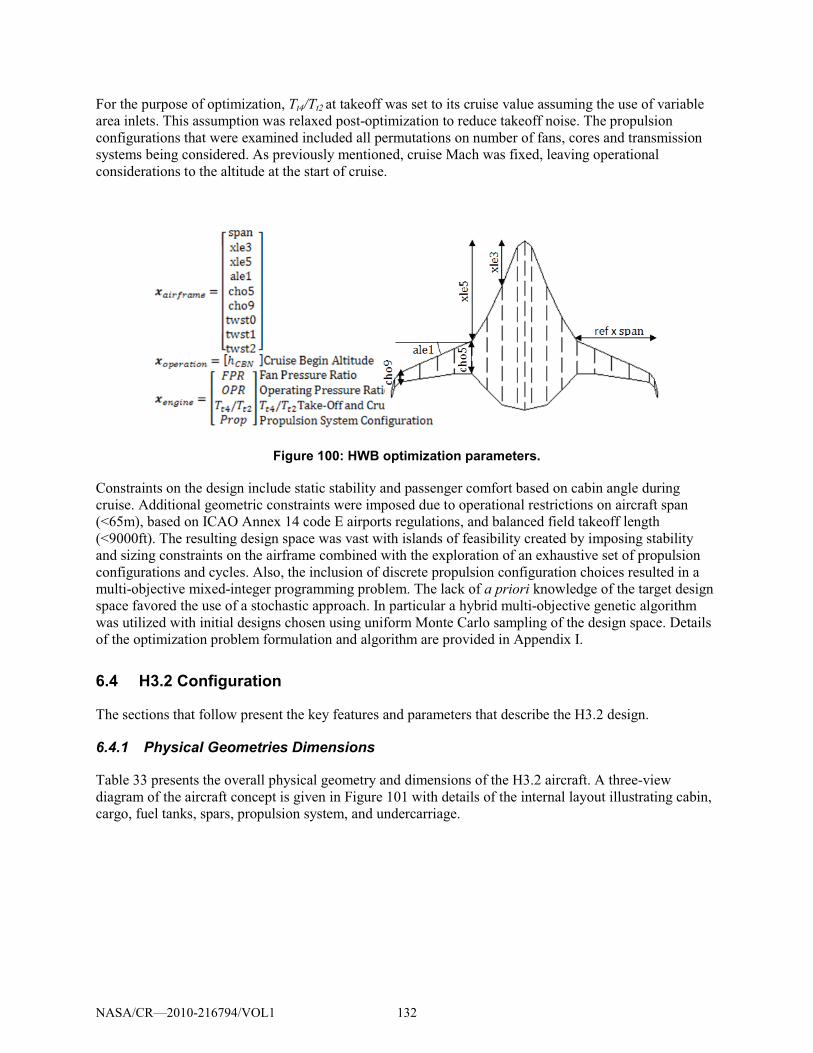
For the purpose of optimization, Tt4/Tt2 at takeoff was set to its cruise value assuming the use of variable
area inlets. This assumption was relaxed post-optimization to reduce takeoff noise. The propulsion
configurations that were examined included all permutations on number of fans, cores and transmission
systems being considered. As previously mentioned, cruise Mach was fixed, leaving operational
considerations to the altitude at the start of cruise.
Figure 100: HWB optimization parameters.
Constraints on the design include static stability and passenger comfort based on cabin angle during
cruise. Additional geometric constraints were imposed due to operational restrictions on aircraft span
(<65m), based on ICAO Annex 14 code E airports regulations, and balanced field takeoff length
(<9000ft). The resulting design space was vast with islands of feasibility created by imposing stability
and sizing constraints on the airframe combined with the exploration of an exhaustive set of propulsion
configurations and cycles. Also, the inclusion of discrete propulsion configuration choices resulted in a
multi-objective mixed-integer programming problem. The lack of a priori knowledge of the target design
space favored the use of a stochastic approach. In particular a hybrid multi-objective genetic algorithm
was utilized with initial designs chosen using uniform Monte Carlo sampling of the design space. Details
of the optimization problem formulation and algorithm are provided in Appendix I.
6.4 H3.2 Configuration
The sections that follow present the key features and parameters that describe the H3.2 design.
6.4.1 Physical Geometries Dimensions
Table 33 presents the overall physical geometry and dimensions of the H3.2 aircraft. A three-view
diagram of the aircraft concept is given in Figure 101 with details of the internal layout illustrating cabin,
cargo, fuel tanks, spars, propulsion system, and undercarriage.
NASA/CR—2010-216794/VOL1 132
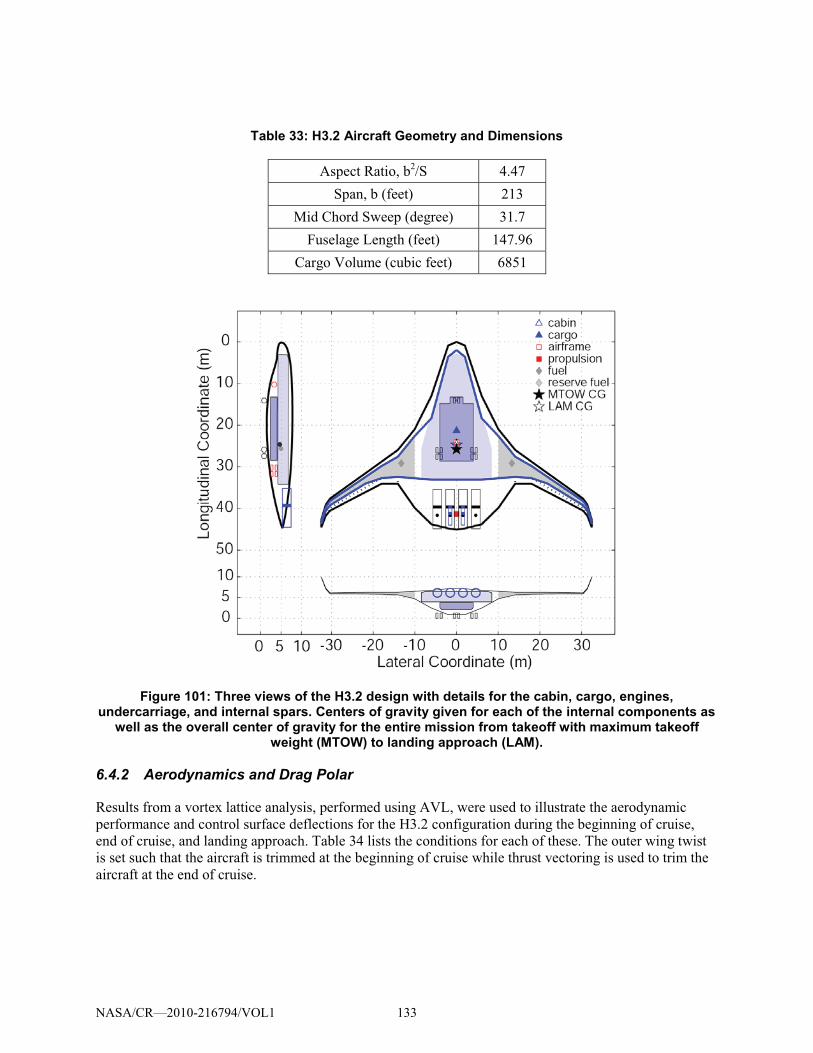
Table 33: H3.2 Aircraft Geometry and Dimensions
Aspect Ratio, b2/S 4.47
Span, b (feet) 213
Mid Chord Sweep (degree) 31.7
Fuselage Length (feet) 147.96
Cargo Volume (cubic feet) 6851
Figure 101: Three views of the H3.2 design with details for the cabin, cargo, engines, undercarriage, and internal spars. Centers of gravity given for each of the internal components as
well as the overall center of gravity for the entire mission from takeoff with maximum takeoff weight (MTOW) to landing approach (LAM).
6.4.2 Aerodynamics and Drag Polar
Results from a vortex lattice analysis, performed using AVL, were used to illustrate the aerodynamic
performance and control surface deflections for the H3.2 configuration during the beginning of cruise,
end of cruise, and landing approach. Table 34 lists the conditions for each of these. The outer wing twist
is set such that the aircraft is trimmed at the beginning of cruise while thrust vectoring is used to trim the
aircraft at the end of cruise.
NASA/CR—2010-216794/VOL1 133
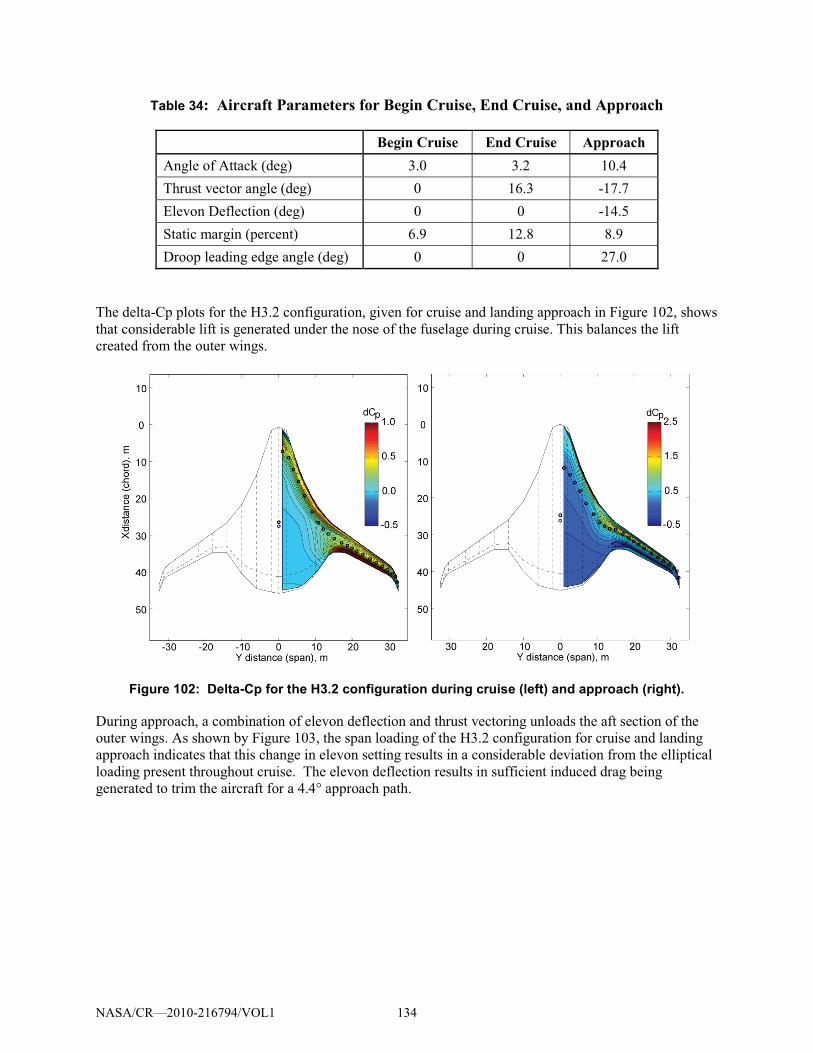
Table 34: Aircraft Parameters for Begin Cruise, End Cruise, and Approach
Begin Cruise End Cruise Approach Angle of Attack (deg) 3.0 3.2 10.4
Thrust vector angle (deg) 0 16.3 -17.7
Elevon Deflection (deg) 0 0 -14.5
Static margin (percent) 6.9 12.8 8.9
Droop leading edge angle (deg) 0 0 27.0
The delta-Cp plots for the H3.2 configuration, given for cruise and landing approach in Figure 102, shows
that considerable lift is generated under the nose of the fuselage during cruise. This balances the lift
created from the outer wings.
Figure 102: Delta-Cp for the H3.2 configuration during cruise (left) and approach (right).
During approach, a combination of elevon deflection and thrust vectoring unloads the aft section of the
outer wings. As shown by Figure 103, the span loading of the H3.2 configuration for cruise and landing
approach indicates that this change in elevon setting results in a considerable deviation from the elliptical
loading present throughout cruise. The elevon deflection results in sufficient induced drag being
generated to trim the aircraft for a 4.4° approach path.
NASA/CR—2010-216794/VOL1 134
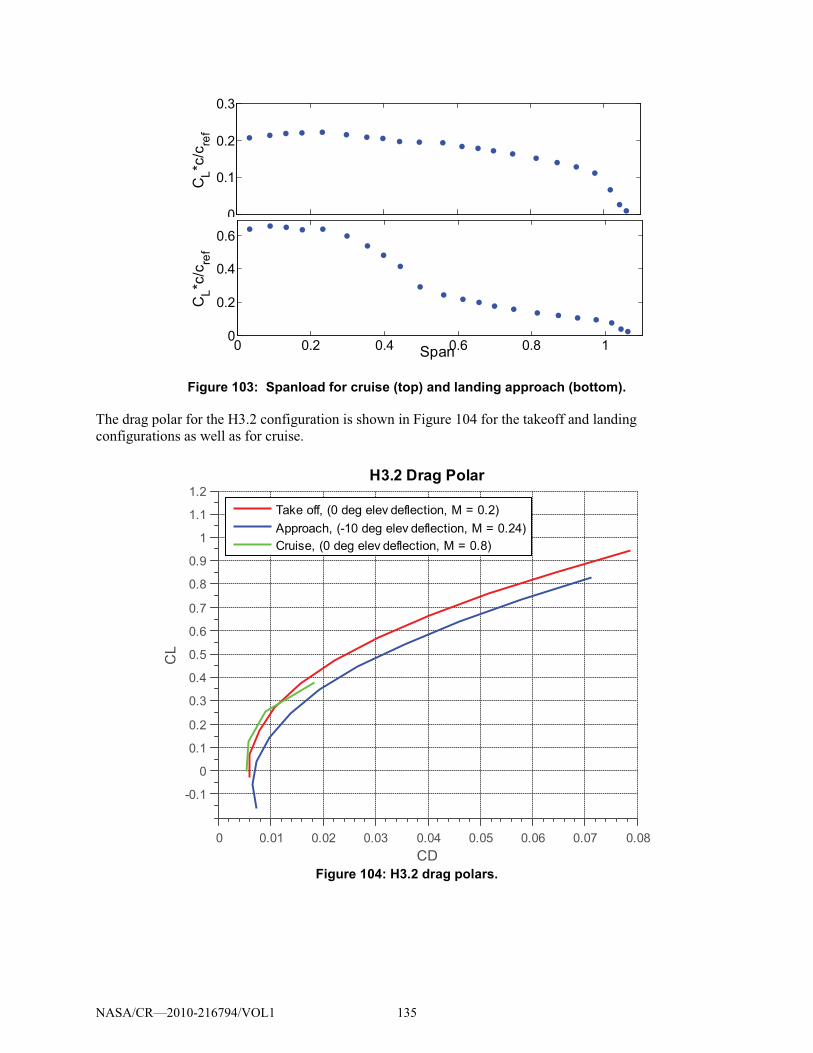
0
0.1
0.2
0.3
CL*c
/cre
f
0 0.2 0.4 0.6 0.8 10
0.2
0.4
0.6
Span
CL*c
/cre
f
Figure 103: Spanload for cruise (top) and landing approach (bottom).
The drag polar for the H3.2 configuration is shown in Figure 104 for the takeoff and landing
configurations as well as for cruise.
0 0.01 0.02 0.03 0.04 0.05 0.06 0.07 0.08
-0.1
0
0.1
0.2
0.3
0.4
0.5
0.6
0.7
0.8
0.9
1
1.1
1.2H3.2 Drag Polar
CD
CL
Take off, (0 deg elev deflection, M = 0.2)Approach, (-10 deg elev deflection, M = 0.24)Cruise, (0 deg elev deflection, M = 0.8)
Figure 104: H3.2 drag polars.
NASA/CR—2010-216794/VOL1 135
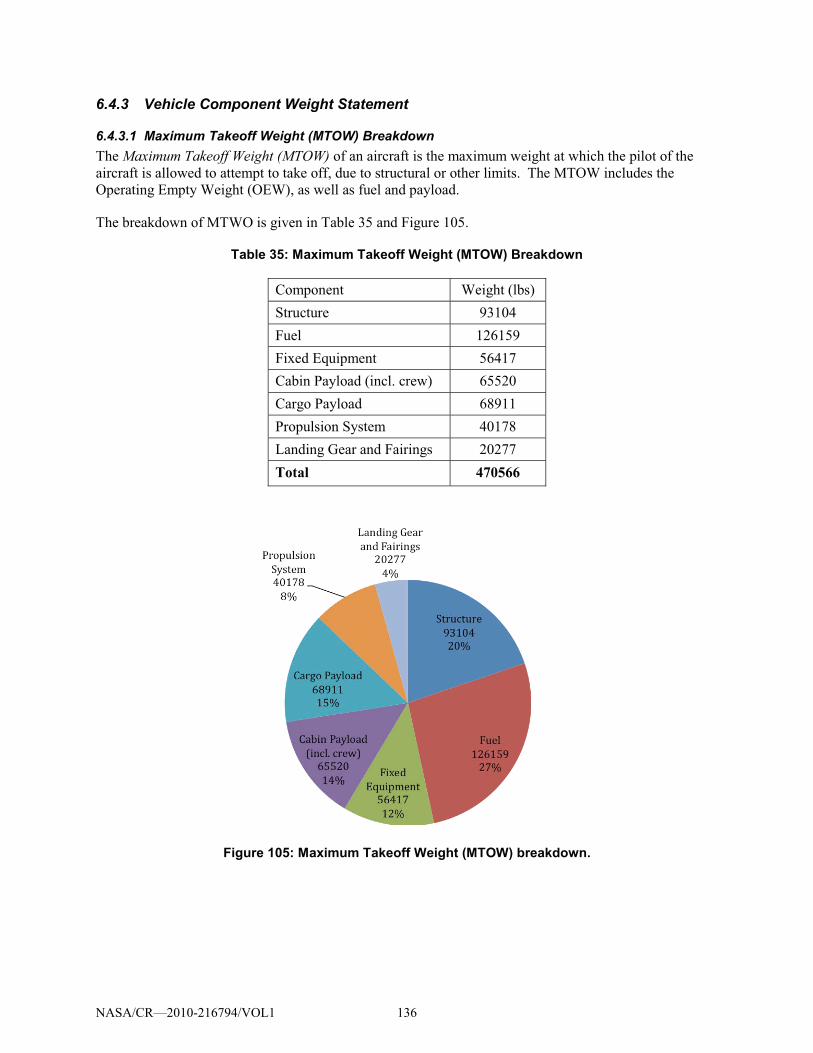
6.4.3 Vehicle Component Weight Statement
6.4.3.1 Maximum Takeoff Weight (MTOW) Breakdown The Maximum Takeoff Weight (MTOW) of an aircraft is the maximum weight at which the pilot of the
aircraft is allowed to attempt to take off, due to structural or other limits. The MTOW includes the
Operating Empty Weight (OEW), as well as fuel and payload.
The breakdown of MTWO is given in Table 35 and Figure 105.
Table 35: Maximum Takeoff Weight (MTOW) Breakdown
Component Weight (lbs)
Structure 93104
Fuel 126159
Fixed Equipment 56417
Cabin Payload (incl. crew) 65520
Cargo Payload 68911
Propulsion System 40178
Landing Gear and Fairings 20277
Total 470566
Figure 105: Maximum Takeoff Weight (MTOW) breakdown.
NASA/CR—2010-216794/VOL1 136
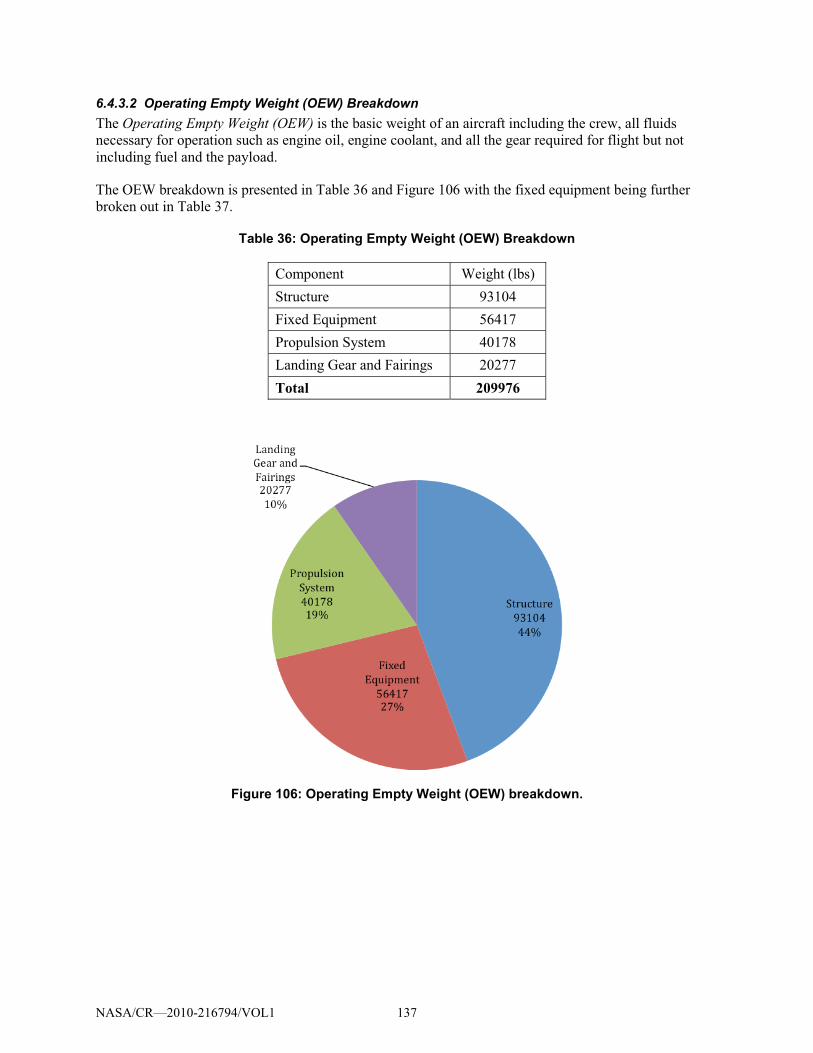
6.4.3.2 Operating Empty Weight (OEW) Breakdown The Operating Empty Weight (OEW) is the basic weight of an aircraft including the crew, all fluids
necessary for operation such as engine oil, engine coolant, and all the gear required for flight but not
including fuel and the payload.
The OEW breakdown is presented in Table 36 and Figure 106 with the fixed equipment being further
broken out in Table 37.
Table 36: Operating Empty Weight (OEW) Breakdown
Component Weight (lbs)
Structure 93104
Fixed Equipment 56417
Propulsion System 40178
Landing Gear and Fairings 20277
Total 209976
Figure 106: Operating Empty Weight (OEW) breakdown.
NASA/CR—2010-216794/VOL1 137
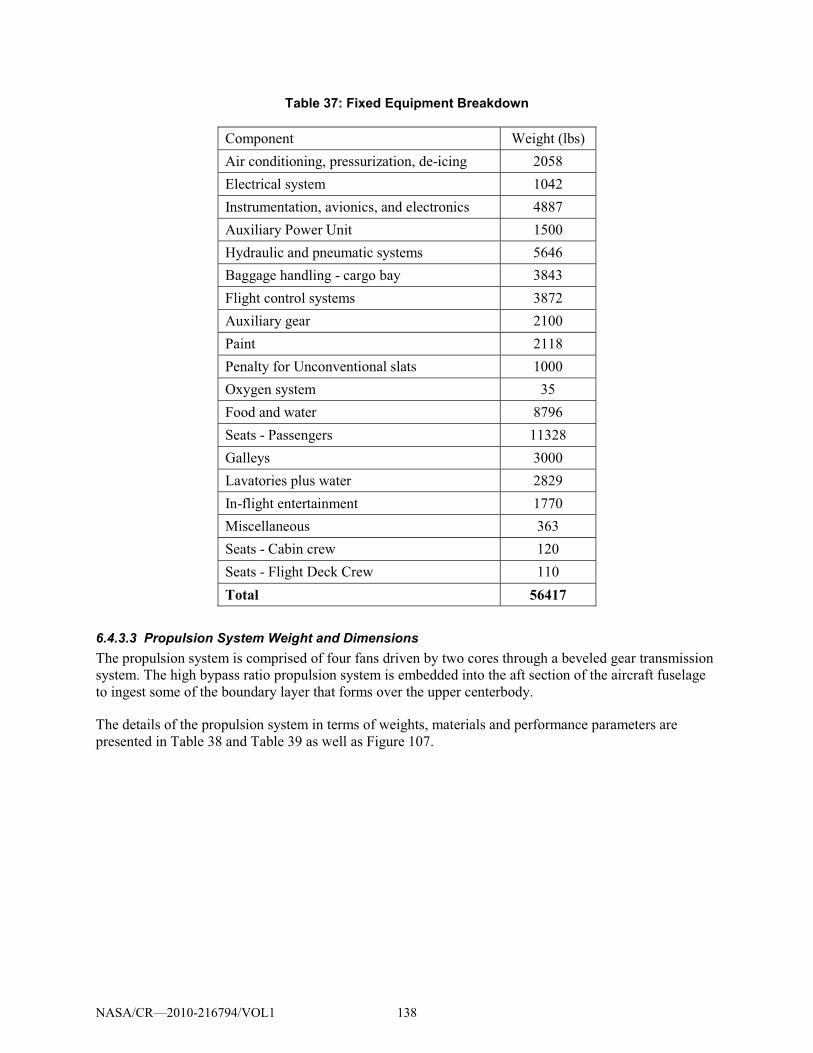
Table 37: Fixed Equipment Breakdown
Component Weight (lbs)
Air conditioning, pressurization, de-icing 2058
Electrical system 1042
Instrumentation, avionics, and electronics 4887
Auxiliary Power Unit 1500
Hydraulic and pneumatic systems 5646
Baggage handling - cargo bay 3843
Flight control systems 3872
Auxiliary gear 2100
Paint 2118
Penalty for Unconventional slats 1000
Oxygen system 35
Food and water 8796
Seats - Passengers 11328
Galleys 3000
Lavatories plus water 2829
In-flight entertainment 1770
Miscellaneous 363
Seats - Cabin crew 120
Seats - Flight Deck Crew 110
Total 56417
6.4.3.3 Propulsion System Weight and Dimensions The propulsion system is comprised of four fans driven by two cores through a beveled gear transmission
system. The high bypass ratio propulsion system is embedded into the aft section of the aircraft fuselage
to ingest some of the boundary layer that forms over the upper centerbody.
The details of the propulsion system in terms of weights, materials and performance parameters are
presented in Table 38 and Table 39 as well as Figure 107.
NASA/CR—2010-216794/VOL1 138
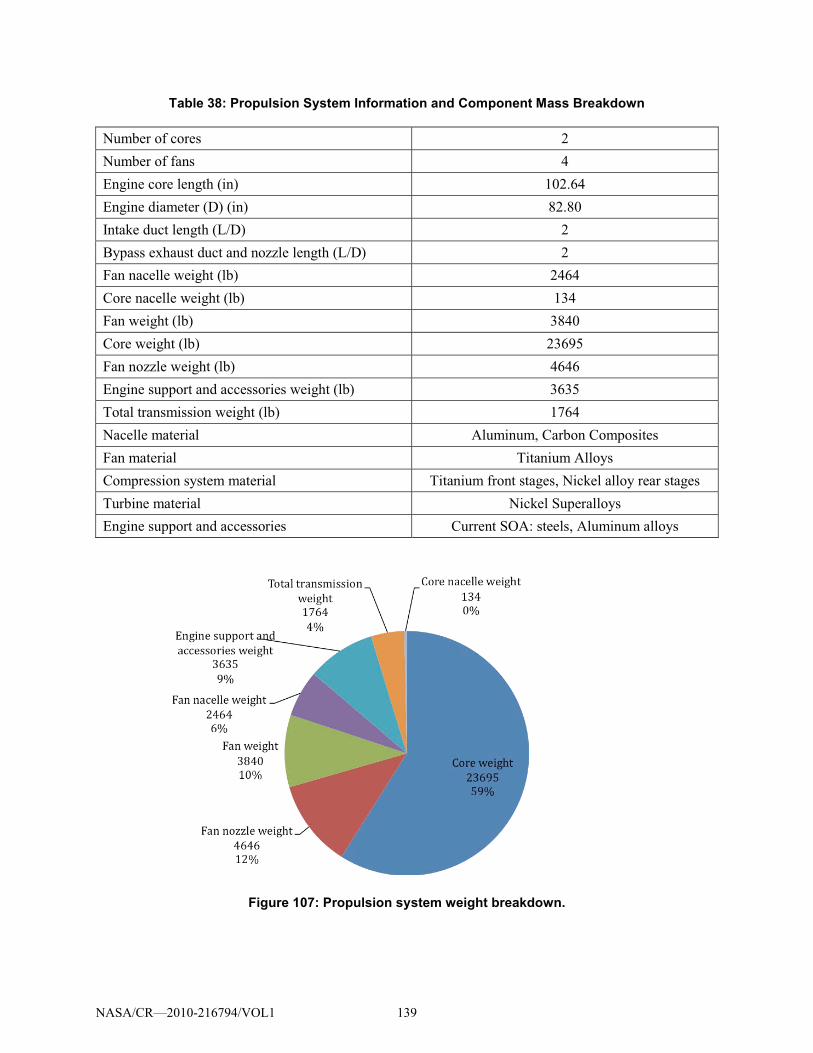
Table 38: Propulsion System Information and Component Mass Breakdown
Number of cores 2
Number of fans 4
Engine core length (in) 102.64
Engine diameter (D) (in) 82.80
Intake duct length (L/D) 2
Bypass exhaust duct and nozzle length (L/D) 2
Fan nacelle weight (lb) 2464
Core nacelle weight (lb) 134
Fan weight (lb) 3840
Core weight (lb) 23695
Fan nozzle weight (lb) 4646
Engine support and accessories weight (lb) 3635
Total transmission weight (lb) 1764
Nacelle material Aluminum, Carbon Composites
Fan material Titanium Alloys
Compression system material Titanium front stages, Nickel alloy rear stages
Turbine material Nickel Superalloys
Engine support and accessories Current SOA: steels, Aluminum alloys
Figure 107: Propulsion system weight breakdown.
NASA/CR—2010-216794/VOL1 139
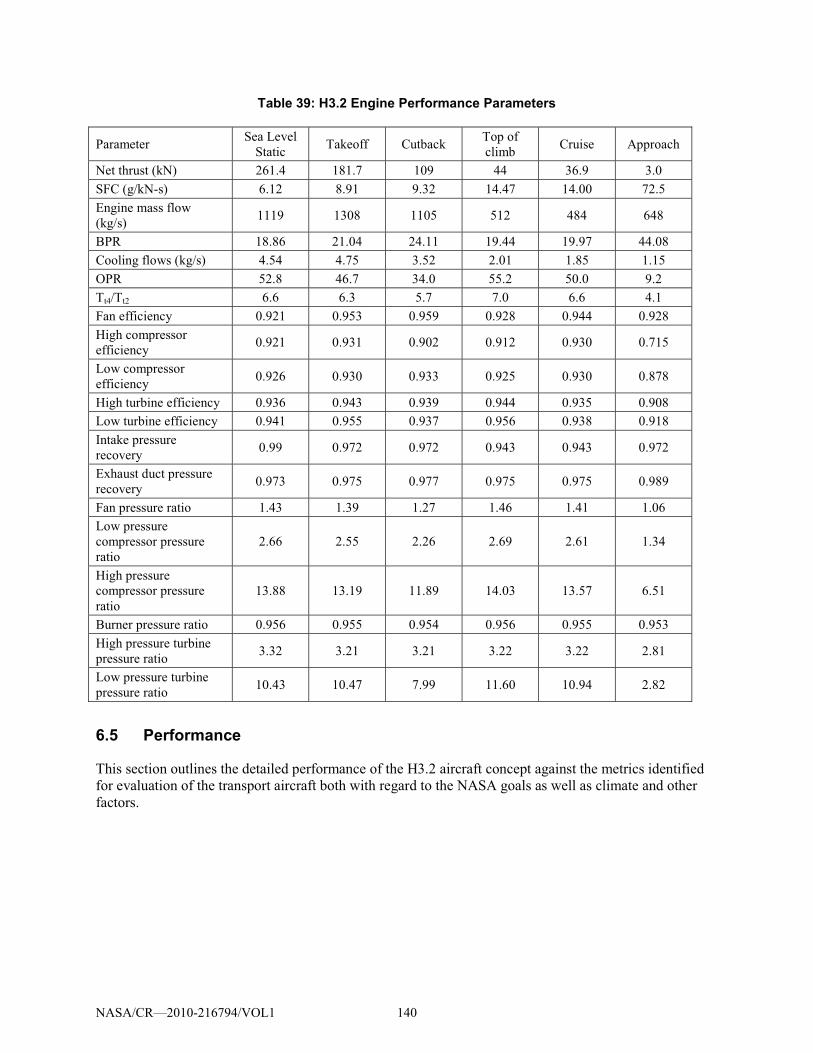
Table 39: H3.2 Engine Performance Parameters
Parameter Sea Level
Static Takeoff Cutback
Top of
climb Cruise Approach
Net thrust (kN) 261.4 181.7 109 44 36.9 3.0
SFC (g/kN-s) 6.12 8.91 9.32 14.47 14.00 72.5
Engine mass flow
(kg/s) 1119 1308 1105 512 484 648
BPR 18.86 21.04 24.11 19.44 19.97 44.08
Cooling flows (kg/s) 4.54 4.75 3.52 2.01 1.85 1.15
OPR 52.8 46.7 34.0 55.2 50.0 9.2
Tt4/Tt2 6.6 6.3 5.7 7.0 6.6 4.1
Fan efficiency 0.921 0.953 0.959 0.928 0.944 0.928
High compressor
efficiency 0.921 0.931 0.902 0.912 0.930 0.715
Low compressor
efficiency 0.926 0.930 0.933 0.925 0.930 0.878
High turbine efficiency 0.936 0.943 0.939 0.944 0.935 0.908
Low turbine efficiency 0.941 0.955 0.937 0.956 0.938 0.918
Intake pressure
recovery 0.99 0.972 0.972 0.943 0.943 0.972
Exhaust duct pressure
recovery 0.973 0.975 0.977 0.975 0.975 0.989
Fan pressure ratio 1.43 1.39 1.27 1.46 1.41 1.06
Low pressure
compressor pressure
ratio
2.66 2.55 2.26 2.69 2.61 1.34
High pressure
compressor pressure
ratio
13.88 13.19 11.89 14.03 13.57 6.51
Burner pressure ratio 0.956 0.955 0.954 0.956 0.955 0.953
High pressure turbine
pressure ratio 3.32 3.21 3.21 3.22 3.22 2.81
Low pressure turbine
pressure ratio 10.43 10.47 7.99 11.60 10.94 2.82
6.5 Performance
This section outlines the detailed performance of the H3.2 aircraft concept against the metrics identified
for evaluation of the transport aircraft both with regard to the NASA goals as well as climate and other
factors.
NASA/CR—2010-216794/VOL1 140
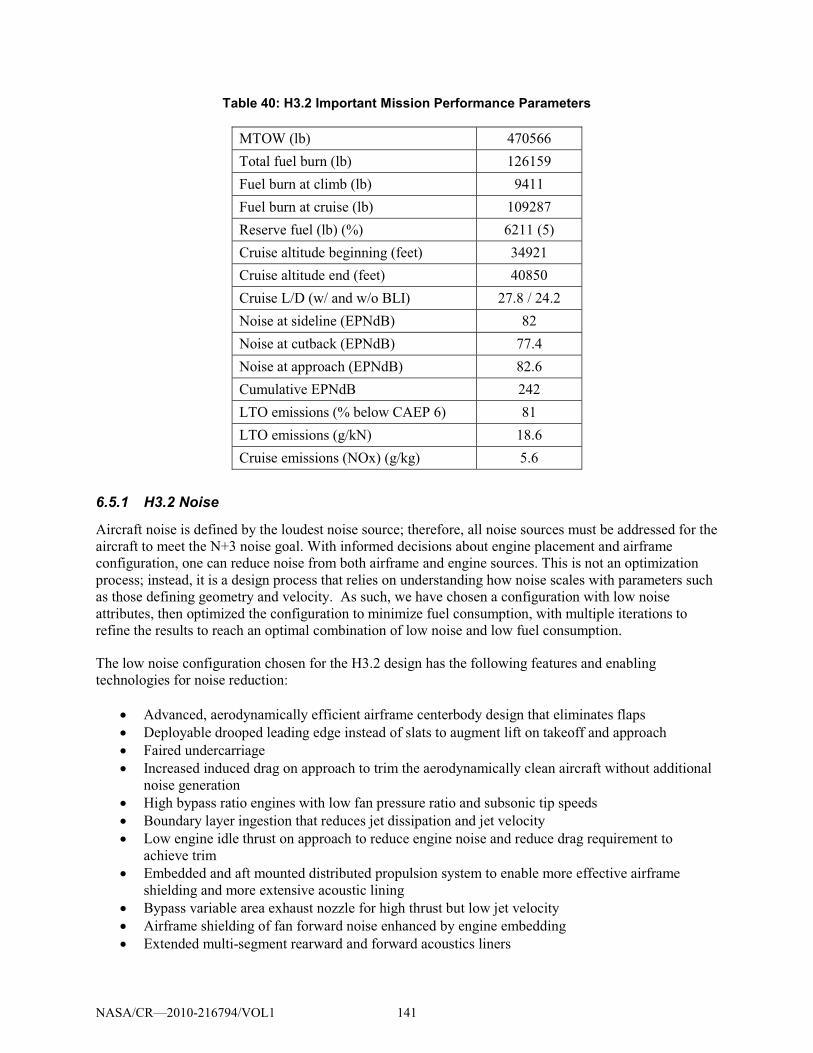
Table 40: H3.2 Important Mission Performance Parameters
MTOW (lb) 470566
Total fuel burn (lb) 126159
Fuel burn at climb (lb) 9411
Fuel burn at cruise (lb) 109287
Reserve fuel (lb) (%) 6211 (5)
Cruise altitude beginning (feet) 34921
Cruise altitude end (feet) 40850
Cruise L/D (w/ and w/o BLI) 27.8 / 24.2
Noise at sideline (EPNdB) 82
Noise at cutback (EPNdB) 77.4
Noise at approach (EPNdB) 82.6
Cumulative EPNdB 242
LTO emissions (% below CAEP 6) 81
LTO emissions (g/kN) 18.6
Cruise emissions (NOx) (g/kg) 5.6
6.5.1 H3.2 Noise
Aircraft noise is defined by the loudest noise source; therefore, all noise sources must be addressed for the
aircraft to meet the N+3 noise goal. With informed decisions about engine placement and airframe
configuration, one can reduce noise from both airframe and engine sources. This is not an optimization
process; instead, it is a design process that relies on understanding how noise scales with parameters such
as those defining geometry and velocity. As such, we have chosen a configuration with low noise
attributes, then optimized the configuration to minimize fuel consumption, with multiple iterations to
refine the results to reach an optimal combination of low noise and low fuel consumption.
The low noise configuration chosen for the H3.2 design has the following features and enabling
technologies for noise reduction:
� Advanced, aerodynamically efficient airframe centerbody design that eliminates flaps
� Deployable drooped leading edge instead of slats to augment lift on takeoff and approach
� Faired undercarriage
� Increased induced drag on approach to trim the aerodynamically clean aircraft without additional
noise generation
� High bypass ratio engines with low fan pressure ratio and subsonic tip speeds
� Boundary layer ingestion that reduces jet dissipation and jet velocity
� Low engine idle thrust on approach to reduce engine noise and reduce drag requirement to
achieve trim
� Embedded and aft mounted distributed propulsion system to enable more effective airframe
shielding and more extensive acoustic lining
� Bypass variable area exhaust nozzle for high thrust but low jet velocity
� Airframe shielding of fan forward noise enhanced by engine embedding
� Extended multi-segment rearward and forward acoustics liners
NASA/CR—2010-216794/VOL1 141
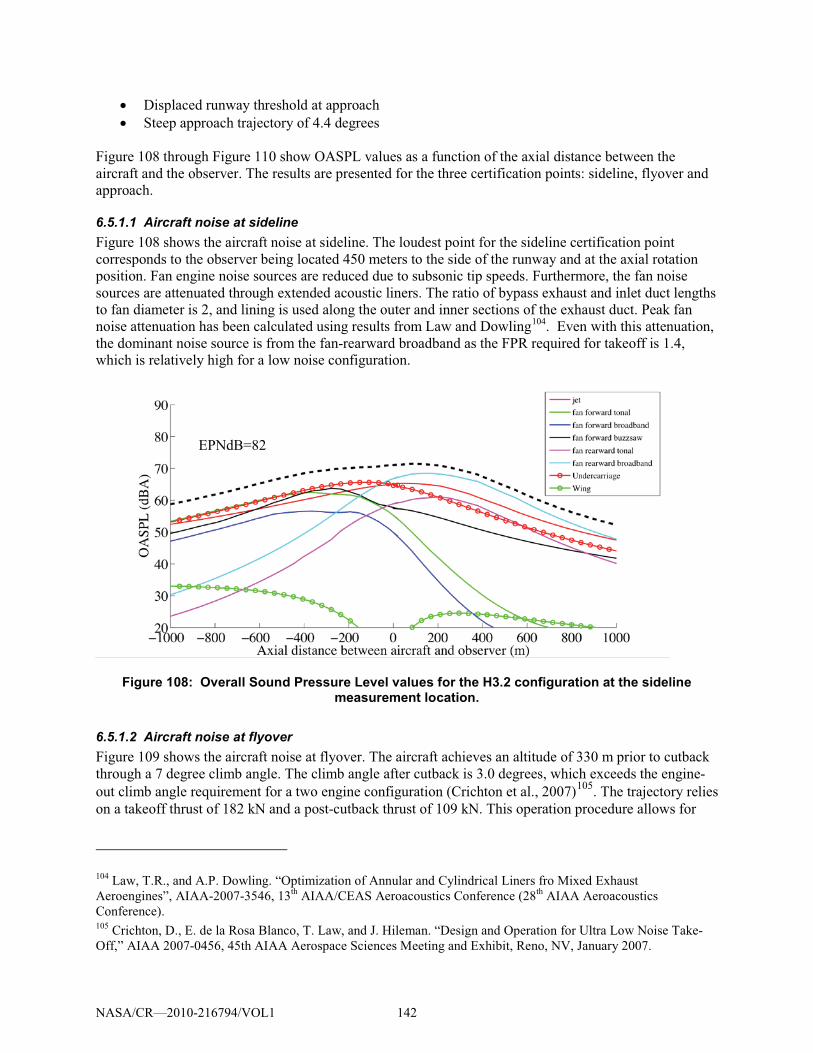
� Displaced runway threshold at approach
� Steep approach trajectory of 4.4 degrees
Figure 108 through Figure 110 show OASPL values as a function of the axial distance between the
aircraft and the observer. The results are presented for the three certification points: sideline, flyover and
approach.
6.5.1.1 Aircraft noise at sideline Figure 108 shows the aircraft noise at sideline. The loudest point for the sideline certification point
corresponds to the observer being located 450 meters to the side of the runway and at the axial rotation
position. Fan engine noise sources are reduced due to subsonic tip speeds. Furthermore, the fan noise
sources are attenuated through extended acoustic liners. The ratio of bypass exhaust and inlet duct lengths
to fan diameter is 2, and lining is used along the outer and inner sections of the exhaust duct. Peak fan
noise attenuation has been calculated using results from Law and Dowling104. Even with this attenuation,
the dominant noise source is from the fan-rearward broadband as the FPR required for takeoff is 1.4,
which is relatively high for a low noise configuration.
Figure 108: Overall Sound Pressure Level values for the H3.2 configuration at the sideline measurement location.
6.5.1.2 Aircraft noise at flyover Figure 109 shows the aircraft noise at flyover. The aircraft achieves an altitude of 330 m prior to cutback
through a 7 degree climb angle. The climb angle after cutback is 3.0 degrees, which exceeds the engine-
out climb angle requirement for a two engine configuration (Crichton et al., 2007)105
104 Law, T.R., and A.P. Dowling. “Optimization of Annular and Cylindrical Liners fro Mixed Exhaust
Aeroengines”, AIAA-2007-3546, 13th
AIAA/CEAS Aeroacoustics Conference (28th
AIAA Aeroacoustics
Conference).
. The trajectory relies
on a takeoff thrust of 182 kN and a post-cutback thrust of 109 kN. This operation procedure allows for
105 Crichton, D., E. de la Rosa Blanco, T. Law, and J. Hileman. “Design and Operation for Ultra Low Noise Take-
Off,” AIAA 2007-0456, 45th AIAA Aerospace Sciences Meeting and Exhibit, Reno, NV, January 2007.
EPNdB=82
NASA/CR—2010-216794/VOL1 142
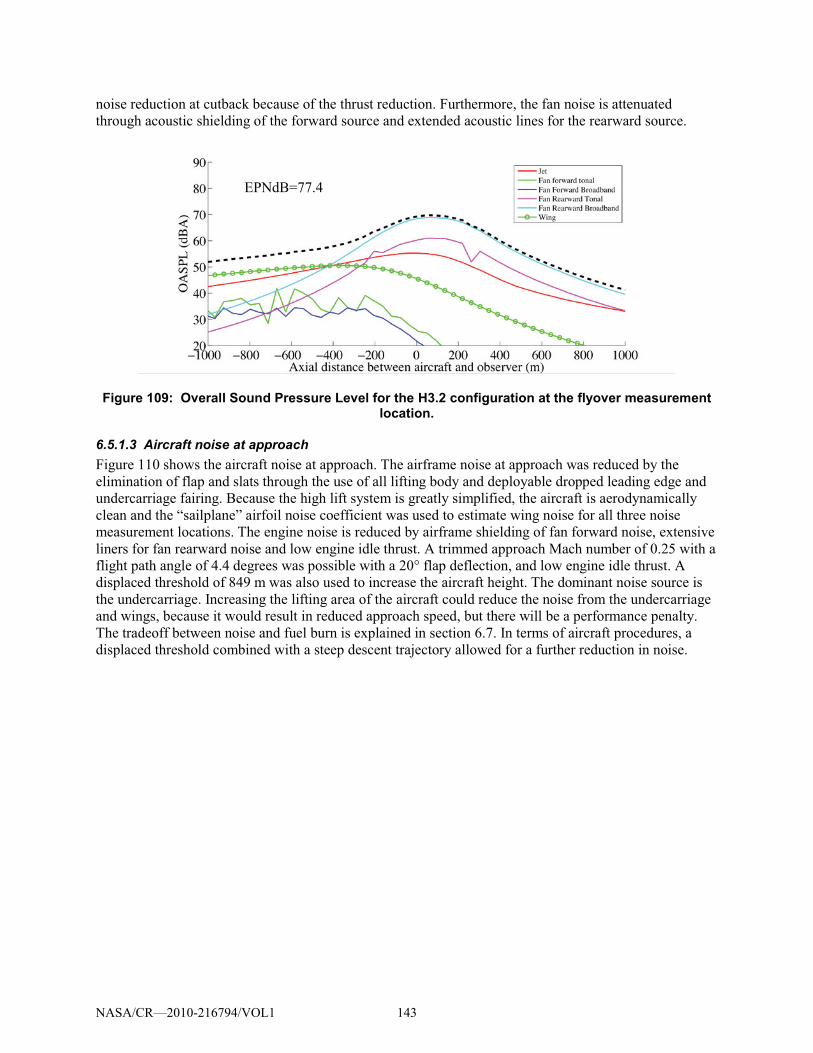
noise reduction at cutback because of the thrust reduction. Furthermore, the fan noise is attenuated
through acoustic shielding of the forward source and extended acoustic lines for the rearward source.
Figure 109: Overall Sound Pressure Level for the H3.2 configuration at the flyover measurement location.
6.5.1.3 Aircraft noise at approach Figure 110 shows the aircraft noise at approach. The airframe noise at approach was reduced by the
elimination of flap and slats through the use of all lifting body and deployable dropped leading edge and
undercarriage fairing. Because the high lift system is greatly simplified, the aircraft is aerodynamically
clean and the “sailplane” airfoil noise coefficient was used to estimate wing noise for all three noise
measurement locations. The engine noise is reduced by airframe shielding of fan forward noise, extensive
liners for fan rearward noise and low engine idle thrust. A trimmed approach Mach number of 0.25 with a
flight path angle of 4.4 degrees was possible with a 20° flap deflection, and low engine idle thrust. A
displaced threshold of 849 m was also used to increase the aircraft height. The dominant noise source is
the undercarriage. Increasing the lifting area of the aircraft could reduce the noise from the undercarriage
and wings, because it would result in reduced approach speed, but there will be a performance penalty.
The tradeoff between noise and fuel burn is explained in section 6.7. In terms of aircraft procedures, a
displaced threshold combined with a steep descent trajectory allowed for a further reduction in noise.
EPNdB=77.4
NASA/CR—2010-216794/VOL1 143
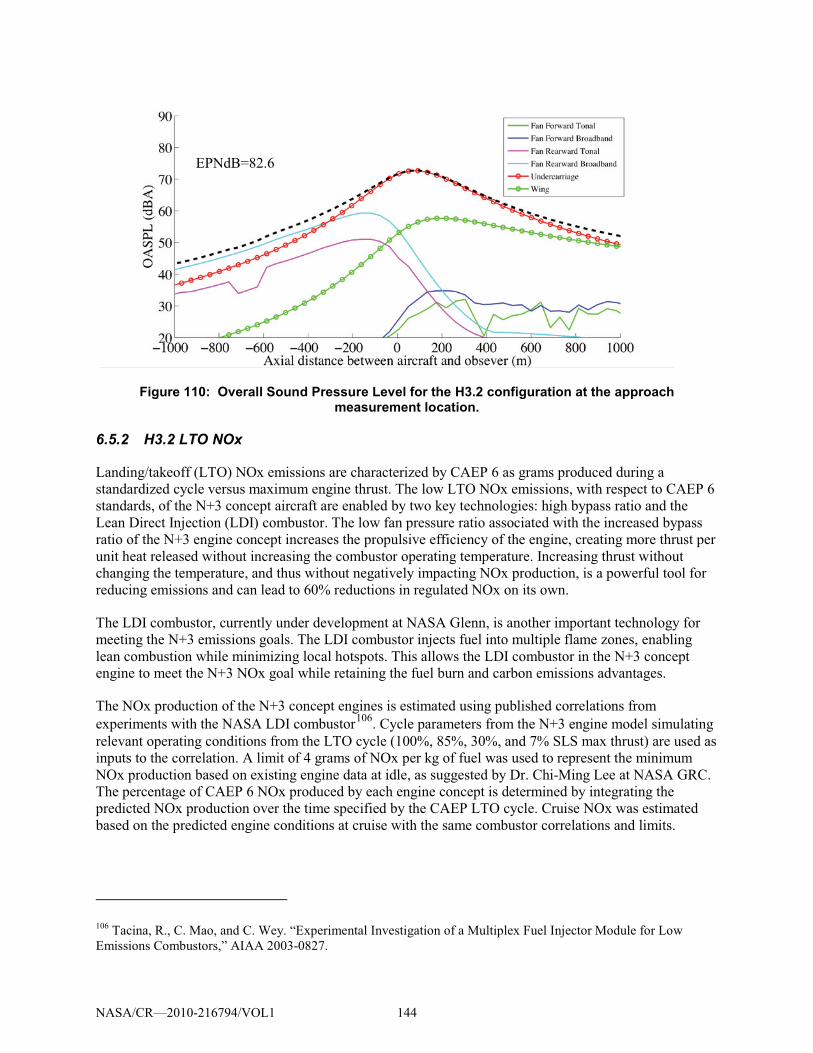
Figure 110: Overall Sound Pressure Level for the H3.2 configuration at the approach measurement location.
6.5.2 H3.2 LTO NOx
Landing/takeoff (LTO) NOx emissions are characterized by CAEP 6 as grams produced during a
standardized cycle versus maximum engine thrust. The low LTO NOx emissions, with respect to CAEP 6
standards, of the N+3 concept aircraft are enabled by two key technologies: high bypass ratio and the
Lean Direct Injection (LDI) combustor. The low fan pressure ratio associated with the increased bypass
ratio of the N+3 engine concept increases the propulsive efficiency of the engine, creating more thrust per
unit heat released without increasing the combustor operating temperature. Increasing thrust without
changing the temperature, and thus without negatively impacting NOx production, is a powerful tool for
reducing emissions and can lead to 60% reductions in regulated NOx on its own.
The LDI combustor, currently under development at NASA Glenn, is another important technology for
meeting the N+3 emissions goals. The LDI combustor injects fuel into multiple flame zones, enabling
lean combustion while minimizing local hotspots. This allows the LDI combustor in the N+3 concept
engine to meet the N+3 NOx goal while retaining the fuel burn and carbon emissions advantages.
The NOx production of the N+3 concept engines is estimated using published correlations from
experiments with the NASA LDI combustor106
. Cycle parameters from the N+3 engine model simulating
relevant operating conditions from the LTO cycle (100%, 85%, 30%, and 7% SLS max thrust) are used as
inputs to the correlation. A limit of 4 grams of NOx per kg of fuel was used to represent the minimum
NOx production based on existing engine data at idle, as suggested by Dr. Chi-Ming Lee at NASA GRC.
The percentage of CAEP 6 NOx produced by each engine concept is determined by integrating the
predicted NOx production over the time specified by the CAEP LTO cycle. Cruise NOx was estimated
based on the predicted engine conditions at cruise with the same combustor correlations and limits.
106 Tacina, R., C. Mao, and C. Wey. “Experimental Investigation of a Multiplex Fuel Injector Module for Low
Emissions Combustors,” AIAA 2003-0827.
EPNdB=82.6
NASA/CR—2010-216794/VOL1 144
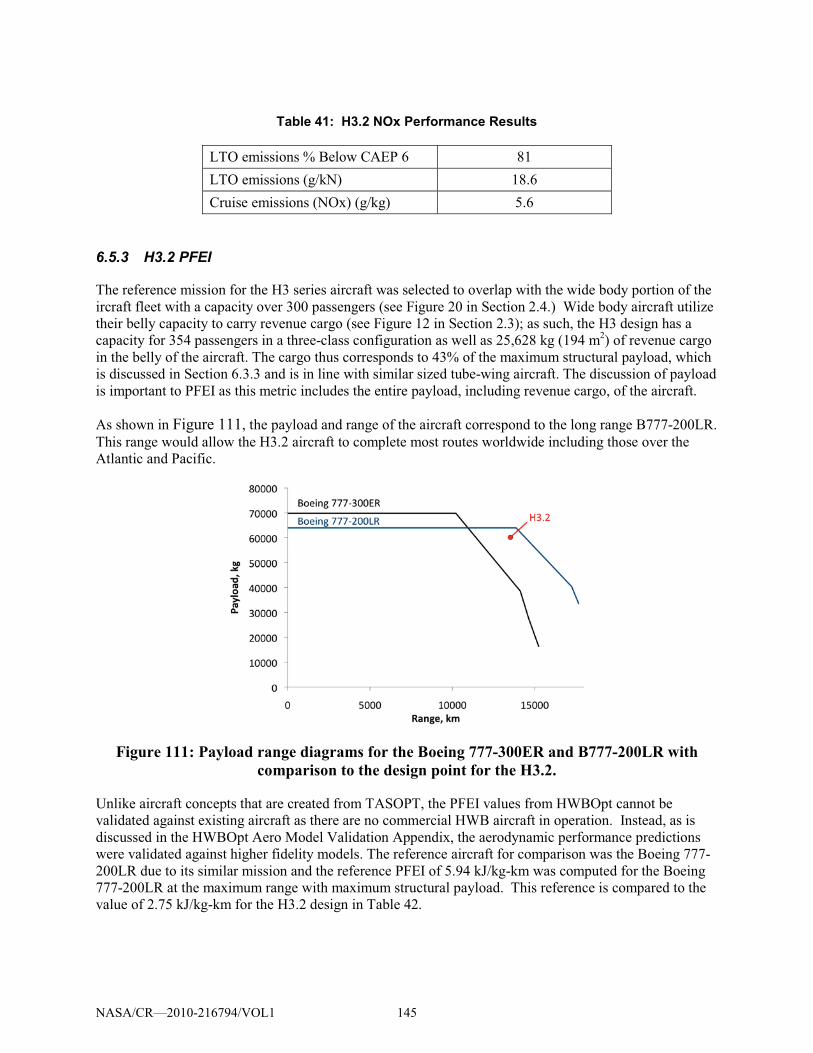
Table 41: H3.2 NOx Performance Results
LTO emissions % Below CAEP 6 81
LTO emissions (g/kN) 18.6
Cruise emissions (NOx) (g/kg) 5.6
6.5.3 H3.2 PFEI
The reference mission for the H3 series aircraft was selected to overlap with the wide body portion of the
ircraft fleet with a capacity over 300 passengers (see Figure 20 in Section 2.4.) Wide body aircraft utilize
their belly capacity to carry revenue cargo (see Figure 12 in Section 2.3); as such, the H3 design has a
capacity for 354 passengers in a three-class configuration as well as 25,628 kg (194 m2) of revenue cargo
in the belly of the aircraft. The cargo thus corresponds to 43% of the maximum structural payload, which
is discussed in Section 6.3.3 and is in line with similar sized tube-wing aircraft. The discussion of payload
is important to PFEI as this metric includes the entire payload, including revenue cargo, of the aircraft.
As shown in Figure 111, the payload and range of the aircraft correspond to the long range B777-200LR.
This range would allow the H3.2 aircraft to complete most routes worldwide including those over the
Atlantic and Pacific.
Figure 111: Payload range diagrams for the Boeing 777-300ER and B777-200LR with comparison to the design point for the H3.2.
Unlike aircraft concepts that are created from TASOPT, the PFEI values from HWBOpt cannot be
validated against existing aircraft as there are no commercial HWB aircraft in operation. Instead, as is
discussed in the HWBOpt Aero Model Validation Appendix, the aerodynamic performance predictions
were validated against higher fidelity models. The reference aircraft for comparison was the Boeing 777-
200LR due to its similar mission and the reference PFEI of 5.94 kJ/kg-km was computed for the Boeing
777-200LR at the maximum range with maximum structural payload. This reference is compared to the
value of 2.75 kJ/kg-km for the H3.2 design in Table 42.
NASA/CR—2010-216794/VOL1 145
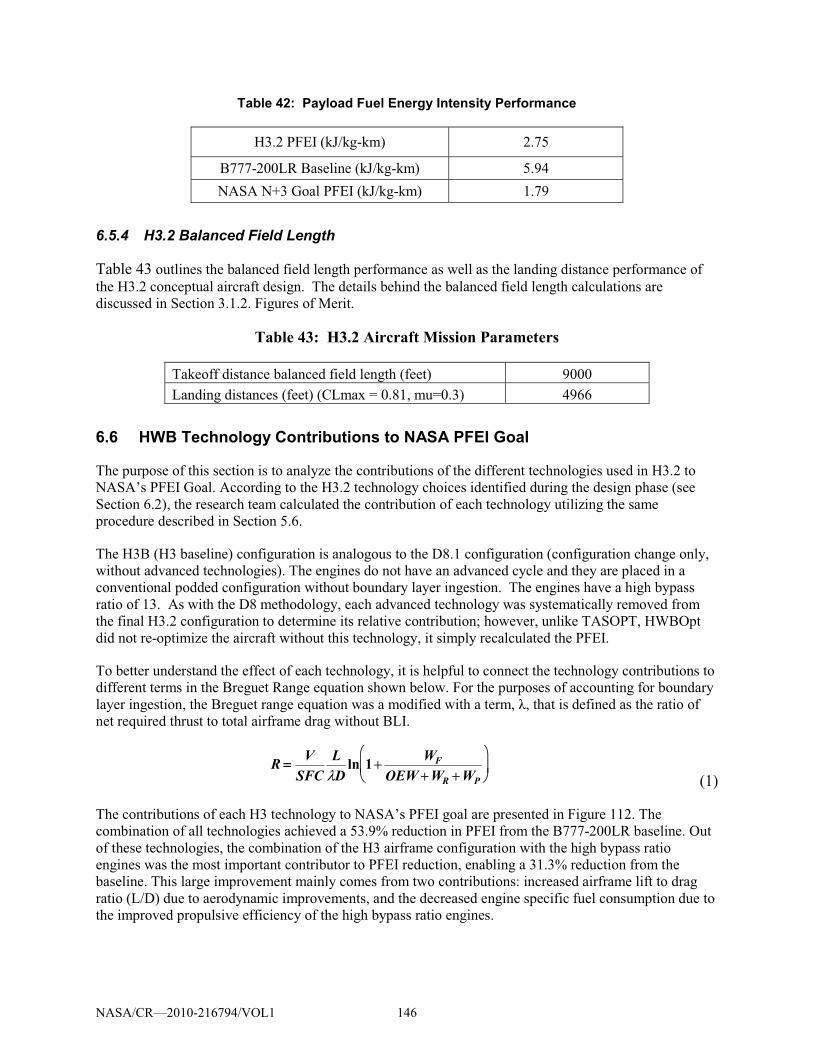
Table 42: Payload Fuel Energy Intensity Performance
H3.2 PFEI (kJ/kg-km) 2.75
B777-200LR Baseline (kJ/kg-km) 5.94
NASA N+3 Goal PFEI (kJ/kg-km) 1.79
6.5.4 H3.2 Balanced Field Length
Table 43 outlines the balanced field length performance as well as the landing distance performance of
the H3.2 conceptual aircraft design. The details behind the balanced field length calculations are
discussed in Section 3.1.2. Figures of Merit.
Table 43: H3.2 Aircraft Mission Parameters
Takeoff distance balanced field length (feet) 9000
Landing distances (feet) (CLmax = 0.81, mu=0.3) 4966
6.6 HWB Technology Contributions to NASA PFEI Goal
The purpose of this section is to analyze the contributions of the different technologies used in H3.2 to
NASA’s PFEI Goal. According to the H3.2 technology choices identified during the design phase (see
Section 6.2), the research team calculated the contribution of each technology utilizing the same
procedure described in Section 5.6.
The H3B (H3 baseline) configuration is analogous to the D8.1 configuration (configuration change only,
without advanced technologies). The engines do not have an advanced cycle and they are placed in a
conventional podded configuration without boundary layer ingestion. The engines have a high bypass
ratio of 13. As with the D8 methodology, each advanced technology was systematically removed from
the final H3.2 configuration to determine its relative contribution; however, unlike TASOPT, HWBOpt
did not re-optimize the aircraft without this technology, it simply recalculated the PFEI.
To better understand the effect of each technology, it is helpful to connect the technology contributions to
different terms in the Breguet Range equation shown below. For the purposes of accounting for boundary
� "�#��$��������%��&#�$����# $����� ����! �� �'�������!��%� ���#'������% ����������� ���%��# ������net required thrust to total airframe drag without BLI.
R �� VSFC
L�D
ln 1� WF
OEW �WR �WP
��
����
��
���� (1)
The contributions of each H3 technology to NASA’s PFEI goal are presented in Figure 112. The
combination of all technologies achieved a 53.9% reduction in PFEI from the B777-200LR baseline. Out
of these technologies, the combination of the H3 airframe configuration with the high bypass ratio
engines was the most important contributor to PFEI reduction, enabling a 31.3% reduction from the
baseline. This large improvement mainly comes from two contributions: increased airframe lift to drag
ratio (L/D) due to aerodynamic improvements, and the decreased engine specific fuel consumption due to
the improved propulsive efficiency of the high bypass ratio engines.
NASA/CR—2010-216794/VOL1 146
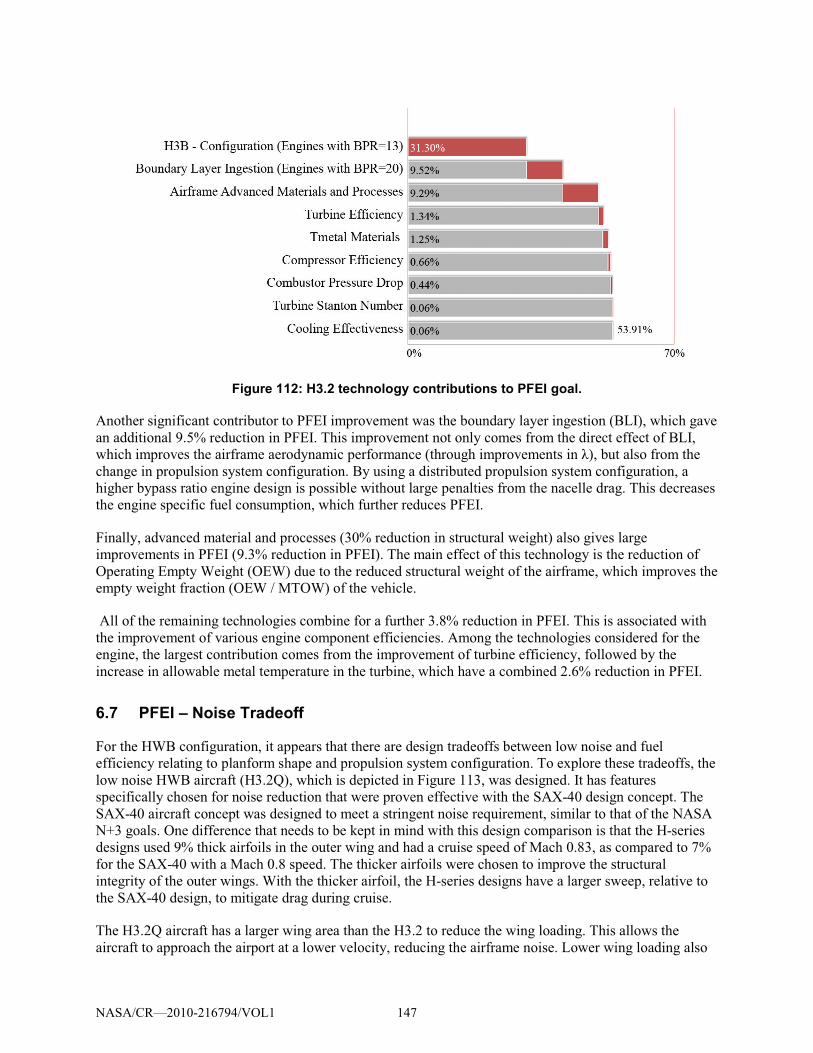
Figure 112: H3.2 technology contributions to PFEI goal.
Another significant contributor to PFEI improvement was the boundary layer ingestion (BLI), which gave
an additional 9.5% reduction in PFEI. This improvement not only comes from the direct effect of BLI,
!%�(%��')#�*����%�� �## '�� �#��" '�(�)�#�#' (����%#��$%��')#�*�'�������������� ����#�'��%��change in propulsion system configuration. By using a distributed propulsion system configuration, a
higher bypass ratio engine design is possible without large penalties from the nacelle drag. This decreases
the engine specific fuel consumption, which further reduces PFEI.
Finally, advanced material and processes (30% reduction in structural weight) also gives large
improvements in PFEI (9.3% reduction in PFEI). The main effect of this technology is the reduction of
Operating Empty Weight (OEW) due to the reduced structural weight of the airframe, which improves the
empty weight fraction (OEW / MTOW) of the vehicle.
All of the remaining technologies combine for a further 3.8% reduction in PFEI. This is associated with
the improvement of various engine component efficiencies. Among the technologies considered for the
engine, the largest contribution comes from the improvement of turbine efficiency, followed by the
increase in allowable metal temperature in the turbine, which have a combined 2.6% reduction in PFEI.
6.7 PFEI – Noise Tradeoff
For the HWB configuration, it appears that there are design tradeoffs between low noise and fuel
efficiency relating to planform shape and propulsion system configuration. To explore these tradeoffs, the
low noise HWB aircraft (H3.2Q), which is depicted in Figure 113, was designed. It has features
specifically chosen for noise reduction that were proven effective with the SAX-40 design concept. The
SAX-40 aircraft concept was designed to meet a stringent noise requirement, similar to that of the NASA
N+3 goals. One difference that needs to be kept in mind with this design comparison is that the H-series
designs used 9% thick airfoils in the outer wing and had a cruise speed of Mach 0.83, as compared to 7%
for the SAX-40 with a Mach 0.8 speed. The thicker airfoils were chosen to improve the structural
integrity of the outer wings. With the thicker airfoil, the H-series designs have a larger sweep, relative to
the SAX-40 design, to mitigate drag during cruise.
The H3.2Q aircraft has a larger wing area than the H3.2 to reduce the wing loading. This allows the
aircraft to approach the airport at a lower velocity, reducing the airframe noise. Lower wing loading also
NASA/CR—2010-216794/VOL1 147
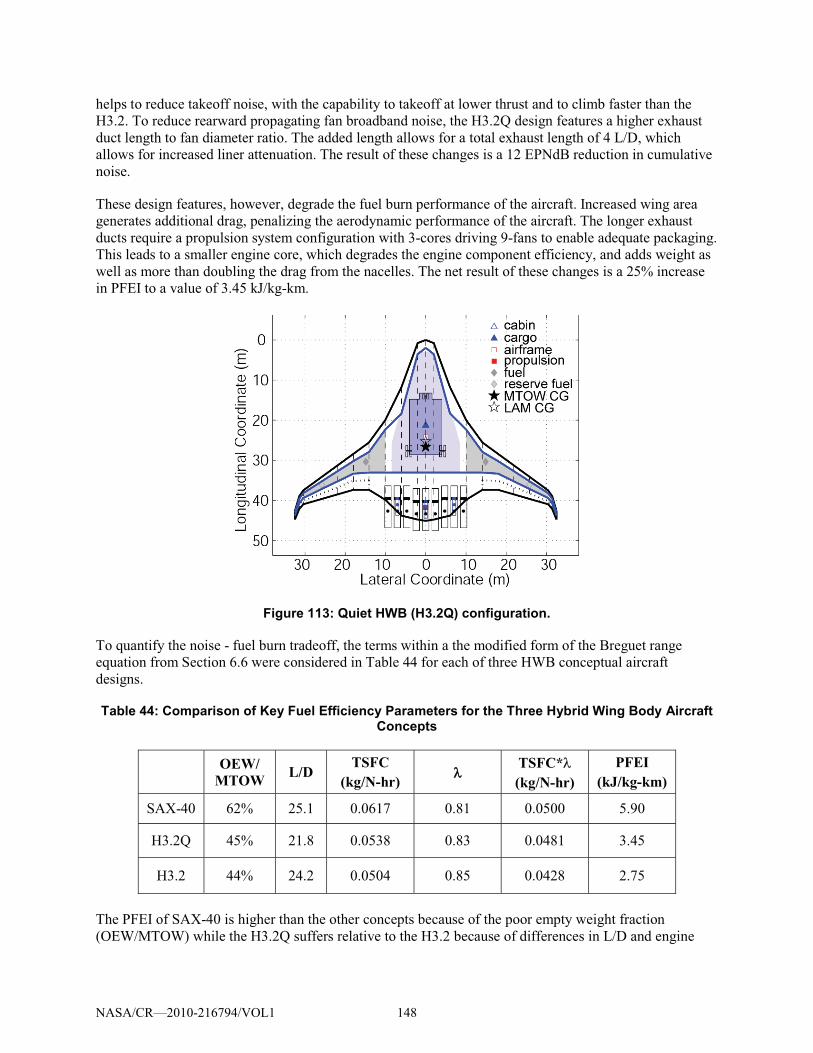
helps to reduce takeoff noise, with the capability to takeoff at lower thrust and to climb faster than the
H3.2. To reduce rearward propagating fan broadband noise, the H3.2Q design features a higher exhaust
duct length to fan diameter ratio. The added length allows for a total exhaust length of 4 L/D, which
allows for increased liner attenuation. The result of these changes is a 12 EPNdB reduction in cumulative
noise.
These design features, however, degrade the fuel burn performance of the aircraft. Increased wing area
generates additional drag, penalizing the aerodynamic performance of the aircraft. The longer exhaust
ducts require a propulsion system configuration with 3-cores driving 9-fans to enable adequate packaging.
This leads to a smaller engine core, which degrades the engine component efficiency, and adds weight as
well as more than doubling the drag from the nacelles. The net result of these changes is a 25% increase
in PFEI to a value of 3.45 kJ/kg-km.
Figure 113: Quiet HWB (H3.2Q) configuration.
To quantify the noise - fuel burn tradeoff, the terms within a the modified form of the Breguet range
equation from Section 6.6 were considered in Table 44 for each of three HWB conceptual aircraft
designs.
Table 44: Comparison of Key Fuel Efficiency Parameters for the Three Hybrid Wing Body Aircraft Concepts
OEW/ MTOW L/D
TSFC (kg/N-hr) ��
TSFC*� (kg/N-hr)
PFEI (kJ/kg-km)
SAX-40 62% 25.1 0.0617 0.81 0.0500 5.90
H3.2Q 45% 21.8 0.0538 0.83 0.0481 3.45
H3.2 44% 24.2 0.0504 0.85 0.0428 2.75
The PFEI of SAX-40 is higher than the other concepts because of the poor empty weight fraction
(OEW/MTOW) while the H3.2Q suffers relative to the H3.2 because of differences in L/D and engine
NASA/CR—2010-216794/VOL1 148
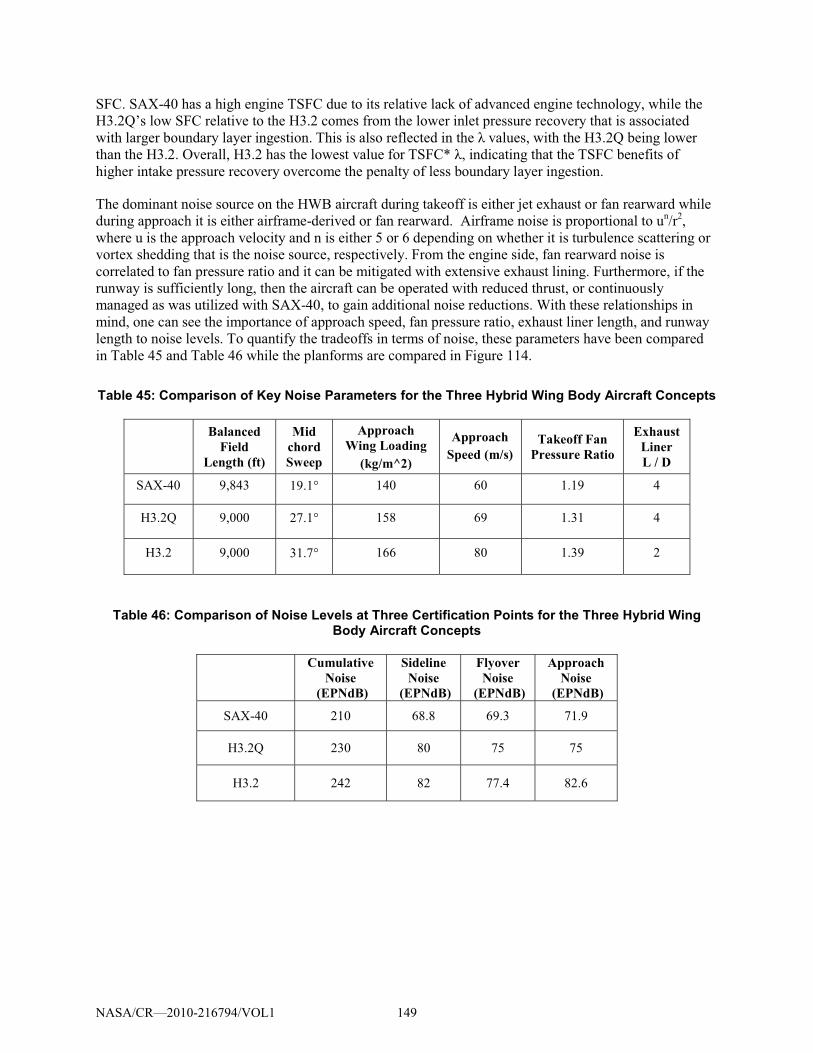
SFC. SAX-40 has a high engine TSFC due to its relative lack of advanced engine technology, while the
H3.2Q’s low SFC relative to the H3.2 comes from the lower inlet pressure recovery that is associated
with larger boundary layer ingestion. This is also reflected in the � values, with the H3.2Q being lower
than the H3.2. Overall, H3.2 has the lowest value for TSFC* �, indicating that the TSFC benefits of
higher intake pressure recovery overcome the penalty of less boundary layer ingestion.
The dominant noise source on the HWB aircraft during takeoff is either jet exhaust or fan rearward while
during approach it is either airframe-derived or fan rearward. Airframe noise is proportional to un/r
2,
where u is the approach velocity and n is either 5 or 6 depending on whether it is turbulence scattering or
vortex shedding that is the noise source, respectively. From the engine side, fan rearward noise is
correlated to fan pressure ratio and it can be mitigated with extensive exhaust lining. Furthermore, if the
runway is sufficiently long, then the aircraft can be operated with reduced thrust, or continuously
managed as was utilized with SAX-40, to gain additional noise reductions. With these relationships in
mind, one can see the importance of approach speed, fan pressure ratio, exhaust liner length, and runway
length to noise levels. To quantify the tradeoffs in terms of noise, these parameters have been compared
in Table 45 and Table 46 while the planforms are compared in Figure 114.
Table 45: Comparison of Key Noise Parameters for the Three Hybrid Wing Body Aircraft Concepts
Balanced
Field Length (ft)
Mid chord Sweep
Approach Wing Loading
(kg/m^2)
Approach Speed (m/s)
Takeoff Fan Pressure Ratio
Exhaust Liner L / D
SAX-40 9,843 19.1� 140 60 1.19 4
H3.2Q 9,000 27.1� 158 69 1.31 4
H3.2 9,000 31.7� 166 80 1.39 2
Table 46: Comparison of Noise Levels at Three Certification Points for the Three Hybrid Wing Body Aircraft Concepts
Cumulative
Noise (EPNdB)
Sideline Noise
(EPNdB)
Flyover Noise
(EPNdB)
Approach Noise
(EPNdB)
SAX-40 210 68.8 69.3 71.9
H3.2Q 230 80 75 75
H3.2 242 82 77.4 82.6
NASA/CR—2010-216794/VOL1 149
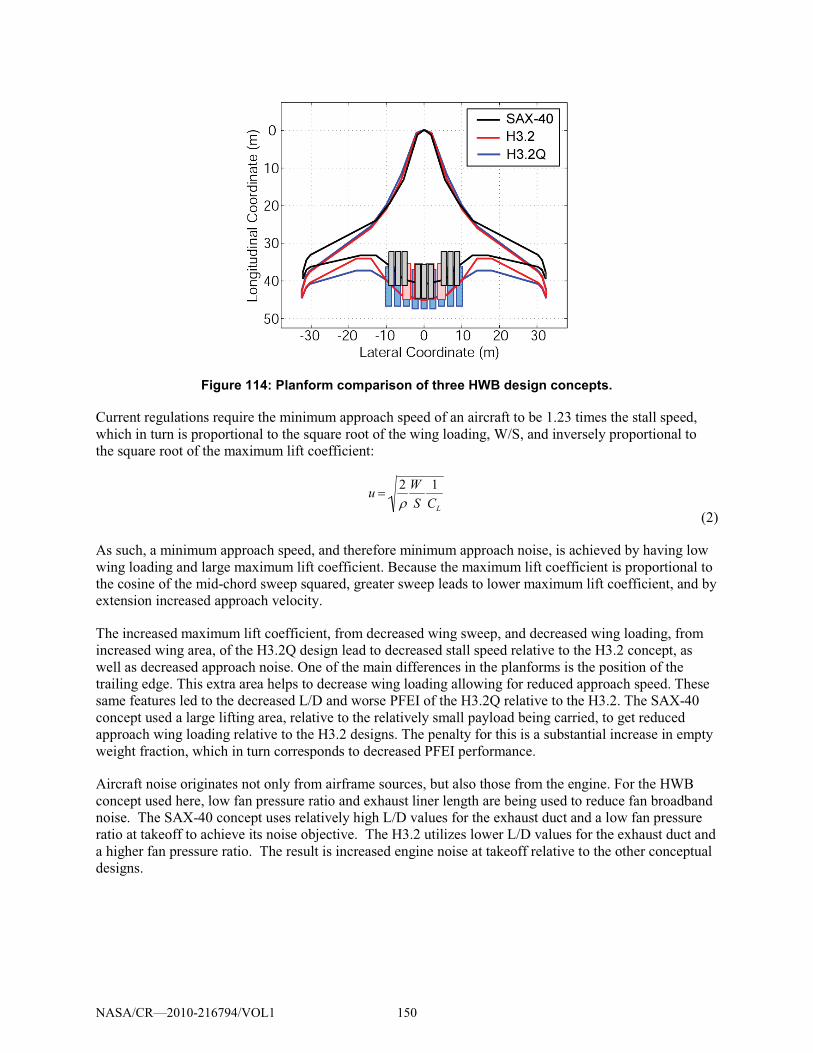
Figure 114: Planform comparison of three HWB design concepts.
Current regulations require the minimum approach speed of an aircraft to be 1.23 times the stall speed,
which in turn is proportional to the square root of the wing loading, W/S, and inversely proportional to
the square root of the maximum lift coefficient:
u � 2
�WS
1
CL (2)
As such, a minimum approach speed, and therefore minimum approach noise, is achieved by having low
wing loading and large maximum lift coefficient. Because the maximum lift coefficient is proportional to
the cosine of the mid-chord sweep squared, greater sweep leads to lower maximum lift coefficient, and by
extension increased approach velocity.
The increased maximum lift coefficient, from decreased wing sweep, and decreased wing loading, from
increased wing area, of the H3.2Q design lead to decreased stall speed relative to the H3.2 concept, as
well as decreased approach noise. One of the main differences in the planforms is the position of the
trailing edge. This extra area helps to decrease wing loading allowing for reduced approach speed. These
same features led to the decreased L/D and worse PFEI of the H3.2Q relative to the H3.2. The SAX-40
concept used a large lifting area, relative to the relatively small payload being carried, to get reduced
approach wing loading relative to the H3.2 designs. The penalty for this is a substantial increase in empty
weight fraction, which in turn corresponds to decreased PFEI performance.
Aircraft noise originates not only from airframe sources, but also those from the engine. For the HWB
concept used here, low fan pressure ratio and exhaust liner length are being used to reduce fan broadband
noise. The SAX-40 concept uses relatively high L/D values for the exhaust duct and a low fan pressure
ratio at takeoff to achieve its noise objective. The H3.2 utilizes lower L/D values for the exhaust duct and
a higher fan pressure ratio. The result is increased engine noise at takeoff relative to the other conceptual
designs.
NASA/CR—2010-216794/VOL1 150
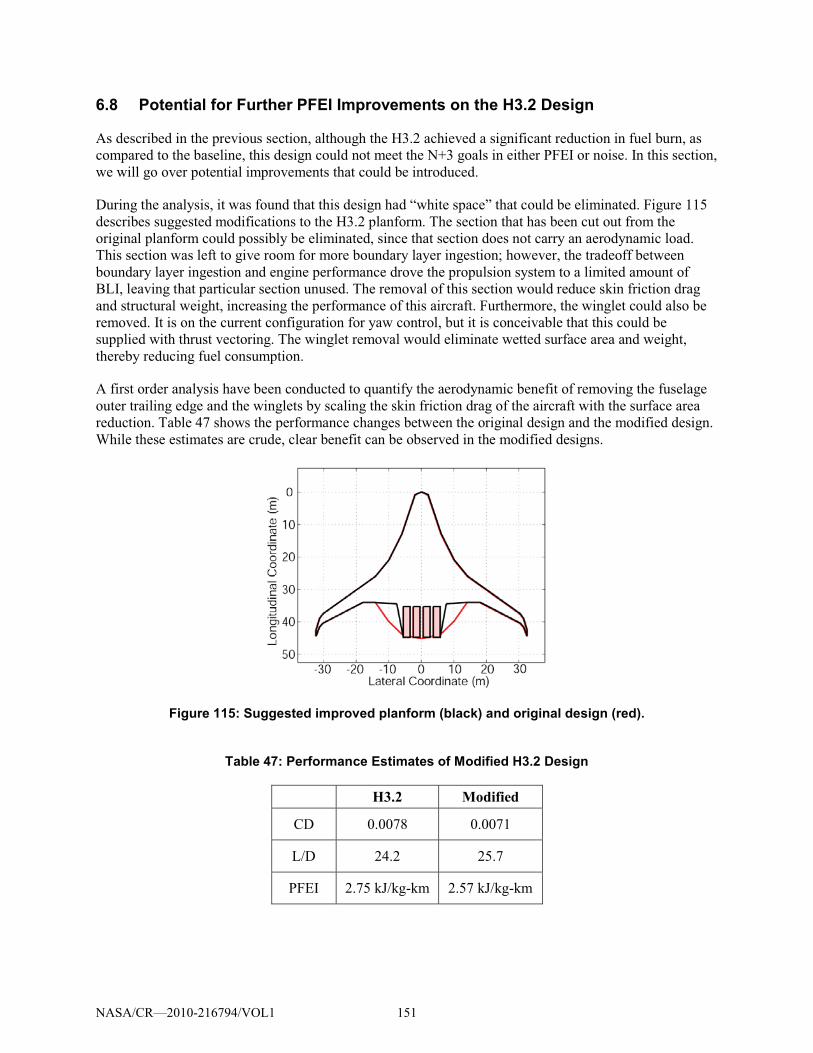
6.8 Potential for Further PFEI Improvements on the H3.2 Design
As described in the previous section, although the H3.2 achieved a significant reduction in fuel burn, as
compared to the baseline, this design could not meet the N+3 goals in either PFEI or noise. In this section,
we will go over potential improvements that could be introduced.
During the analysis, it was found that this design had “white space” that could be eliminated. Figure 115
describes suggested modifications to the H3.2 planform. The section that has been cut out from the
original planform could possibly be eliminated, since that section does not carry an aerodynamic load.
This section was left to give room for more boundary layer ingestion; however, the tradeoff between
boundary layer ingestion and engine performance drove the propulsion system to a limited amount of
BLI, leaving that particular section unused. The removal of this section would reduce skin friction drag
and structural weight, increasing the performance of this aircraft. Furthermore, the winglet could also be
removed. It is on the current configuration for yaw control, but it is conceivable that this could be
supplied with thrust vectoring. The winglet removal would eliminate wetted surface area and weight,
thereby reducing fuel consumption.
A first order analysis have been conducted to quantify the aerodynamic benefit of removing the fuselage
outer trailing edge and the winglets by scaling the skin friction drag of the aircraft with the surface area
reduction. Table 47 shows the performance changes between the original design and the modified design.
While these estimates are crude, clear benefit can be observed in the modified designs.
Figure 115: Suggested improved planform (black) and original design (red).
Table 47: Performance Estimates of Modified H3.2 Design
H3.2 Modified
CD 0.0078 0.0071
L/D 24.2 25.7
PFEI 2.75 kJ/kg-km 2.57 kJ/kg-km
NASA/CR—2010-216794/VOL1 151
6.9 Discussion on Technologies Explored But Not Selected
In addition to the technologies previously discussed in this section there are a few technologies that have
been evaluated and modeled for integration into the H series aircraft. As a result of either a determination
that the technology will not be mature in the target timeframe of the N+3, the technology was not
compatible with other technologies selected for inclusion in the concepts or the final aircraft performance
was not optimal when the technology was included, these technologies have not been used in the final
aircraft performance reported previously. In most cases an extensive amount of modeling analyses was
completed towards the exploration of these technologies. This section is to provide a brief description of
those technologies. In some cases detailed information in regards to these technologies is included in the
Appendix.
6.9.1 Liquefied Natural Gas (LNG)
6.9.1.1 LNG as Aircraft Fuel The evaluation of alternative fuels focused on conventional Liquefied Natural Gas (LNG) which is natural
gas (~90% methane) liquefied to -162oC at 1 atm. It was considered as a viable fuel for future aviation
based on the following comparison relative to conventional jet fuel:
� 16% lower well-to-wake lifecycle carbon emissions for conventional extraction methods (refer to
Appendix K on LNG)
� 16% higher specific energy, in addition to 33% lower energy density
� Large potential resource base. The U.S. Department of Energy estimates natural gas from
methane hydrates sources to have tremendous supply potential107
Integration of the cryogenic fuel imposes additional thermal, structural and volumetric constraints and
risks. The use of non-integral tanks was evaluated and shown to impose more than 3% tank/fuel weight
penalty for typical thermal loads and structure sized for emergency landing. Additional penalties would
be incurred due to increased wing bending moments for relocating the fuel from the wings to the fuselage.
However, assuming adequate wing design, fuel storage in the wing box eliminates the structural loading
requirements. Additionally, with minimal insulation on O (mm), the boiling point of LNG is well
matched to promote laminar flow using wall cooling on the lower wing surface at typical cruise speeds.
Wall cooling results in a viscosity gradient in air at the wall, reducing the boundary layer shape factor and
increasing the critical Reynolds number. Additionally, for Tollmien-Schlichting instabilities that typically
dominate transition at cruise, wall cooling is also seen to diminish the range of linearly amplified
frequencies and their growth rate
, though research on extraction
viability and costs is ongoing.
108
107 U.S. Department of Energy, “Methane Hydrate - Future Energy Within Our Grasp.”
. Overall, delayed transition is favored resulting in an estimated ~17%
skin friction drag reduction with a minimal ~1% insulation/fuel weight penalty. The onboard heat sink
also enables the use of alternative engine cycles such as chiller-regenerator cycle and regenerator cycles.
These cycles have the benefit of higher thermal efficiency and core power than the standard Brayton
cycle. Detailed description of the benefit of alternative cycles is given in Appendix K. Not considered
herein are details regarding the heat management system and additional requirements to disable the
system at low altitude due to humidity and icing considerations. Details on tank sizing for both tank
architectures are included in the Appendix K on LNG.
108 Reshotko, E. “Drag Reduction by Cooling in Hydrogen-Fueled Aircraft,” Journal of Aircraft, Vol. 16, No. 9,
Article No. 79-4112, Feb. 1979.
NASA/CR—2010-216794/VOL1 152
6.9.1.2 LNG-Enabled Electric Distributed Propulsion System Another technology evaluated over the course of this project is an electric transmission system. The main
feature of this technology is to replace the mechanical transmission system between the low pressure
turbine and the fan to an electric transmission system, consisting of High Temperature Super Conductor
(HTSC) generator and motor, cryocooler and inverter. Major benefits of this technology to the
performance of the aircraft include:
� Large boundary layer ingestion enabled by the flexible distribution of propulsors,
� Mechanical decoupling between fan and core,
� Thrust redistribution between propulsors for vehicle control.
One of the main penalties associated with this technology is the increase in weight of the transmission
system. By coupling this technology to the use of LNG, the power to weight ratio of the electric
transmission system can be improved, mainly from the weight reduction of cryocoolers required to
maintain superconductivity in the windings of generators and motors.
In order to quantify the benefits of this technology, the performance and weight model of the electric
transmission system was first developed. Details of electric transmission system models and aircraft
system level analysis are included in Appendix K. This model was then applied to the airframe system
designs, and compared to aircraft designs with various propulsion system configurations with different
transmission systems (details are given in section 6.2.4 above). Although the electric distributed
propulsion gave better performance than podded propulsion system, the optimal amount of boundary
layer ingestion was found to occur at a much lower fuselage span coverage, which could be obtained
using beveled gear transmission system with lower weight than the electrical system.
6.9.1.3 Climate Impact of LNG Use as Aircraft Fuel We explored the potential climate benefit of using liquefied natural gas in a Boeing 777-300ER using our
climate metric of globally-averaged time-integrated surface temperature change, normalized by aircraft
productivity (payload × distance), calculated in the APMT-Impacts Climate Module. In order to
determine fuel usage of the LNG case, we assumed equivalent energy consumption across the baseline Jet
A case and the LNG aircraft concept. We then used emissions indices specific to LNG for lifecycle CO2
and CH4 emissions and combustion NOx emissions. We also assumed zero SOX or particulate matter
emissions for the LNG case. While there would also likely be differences in emissions of water vapor in
moving from Jet A to LNG, for the purposes of this analysis, we assumed these emissions to be
unchanged across the cases. The results of the fuel comparison are shown in Table 48.
Table 48: Climate impact of Jet A vs. LNG Fuel (Boeing 777-300ER)
Vehicle Payload (kg)
Distance (km)
�T-years (°K-yrs)
Normalized Climate Impact
(°K-yrs / (kg x km)) Jet A 34785 11908 1.11E-07 2.69E-16
LNG 34785 11908 9.96E-08 2.40E-16
The expected climate benefit of an LNG aircraft comes primarily from a reduction in combustion CO2
emissions of approximately 25 percent on the basis of fuel energy consumed. This benefit is mitigated
somewhat, however, by increased production CO2 and life cycle methane emissions. In total, the LNG
aircraft improves upon Jet A in terms of climate impact by approximately 11 percent for the same aircraft
flying the same mission.
NASA/CR—2010-216794/VOL1 153
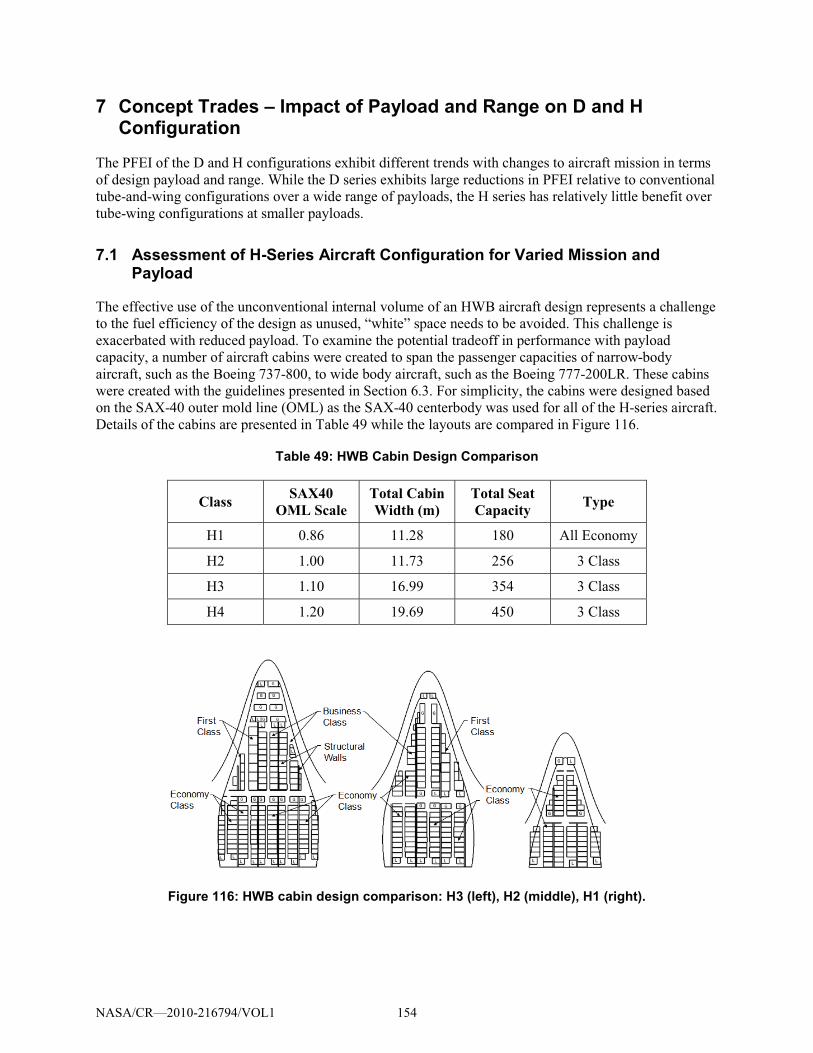
7 Concept Trades – Impact of Payload and Range on D and H Configuration
The PFEI of the D and H configurations exhibit different trends with changes to aircraft mission in terms
of design payload and range. While the D series exhibits large reductions in PFEI relative to conventional
tube-and-wing configurations over a wide range of payloads, the H series has relatively little benefit over
tube-wing configurations at smaller payloads.
7.1 Assessment of H-Series Aircraft Configuration for Varied Mission and Payload
The effective use of the unconventional internal volume of an HWB aircraft design represents a challenge
to the fuel efficiency of the design as unused, “white” space needs to be avoided. This challenge is
exacerbated with reduced payload. To examine the potential tradeoff in performance with payload
capacity, a number of aircraft cabins were created to span the passenger capacities of narrow-body
aircraft, such as the Boeing 737-800, to wide body aircraft, such as the Boeing 777-200LR. These cabins
were created with the guidelines presented in Section 6.3. For simplicity, the cabins were designed based
on the SAX-40 outer mold line (OML) as the SAX-40 centerbody was used for all of the H-series aircraft.
Details of the cabins are presented in Table 49 while the layouts are compared in Figure 116.
Table 49: HWB Cabin Design Comparison
Class SAX40 OML Scale
Total Cabin Width (m)
Total Seat Capacity Type
H1 0.86 11.28 180 All Economy
H2 1.00 11.73 256 3 Class
H3 1.10 16.99 354 3 Class
H4 1.20 19.69 450 3 Class
Figure 116: HWB cabin design comparison: H3 (left), H2 (middle), H1 (right).
NASA/CR—2010-216794/VOL1 154
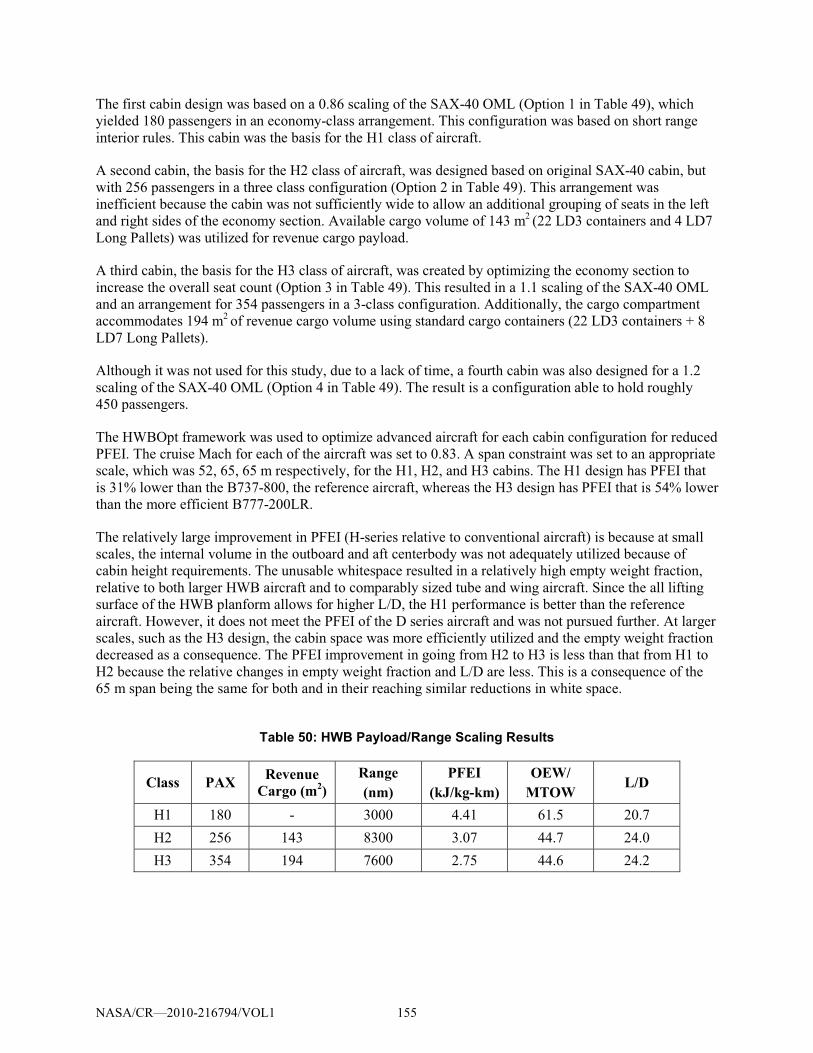
The first cabin design was based on a 0.86 scaling of the SAX-40 OML (Option 1 in Table 49), which
yielded 180 passengers in an economy-class arrangement. This configuration was based on short range
interior rules. This cabin was the basis for the H1 class of aircraft.
A second cabin, the basis for the H2 class of aircraft, was designed based on original SAX-40 cabin, but
with 256 passengers in a three class configuration (Option 2 in Table 49). This arrangement was
inefficient because the cabin was not sufficiently wide to allow an additional grouping of seats in the left
and right sides of the economy section. Available cargo volume of 143 m2 (22 LD3 containers and 4 LD7
Long Pallets) was utilized for revenue cargo payload.
A third cabin, the basis for the H3 class of aircraft, was created by optimizing the economy section to
increase the overall seat count (Option 3 in Table 49). This resulted in a 1.1 scaling of the SAX-40 OML
and an arrangement for 354 passengers in a 3-class configuration. Additionally, the cargo compartment
accommodates 194 m2 of revenue cargo volume using standard cargo containers (22 LD3 containers + 8
LD7 Long Pallets).
Although it was not used for this study, due to a lack of time, a fourth cabin was also designed for a 1.2
scaling of the SAX-40 OML (Option 4 in Table 49). The result is a configuration able to hold roughly
450 passengers.
The HWBOpt framework was used to optimize advanced aircraft for each cabin configuration for reduced
PFEI. The cruise Mach for each of the aircraft was set to 0.83. A span constraint was set to an appropriate
scale, which was 52, 65, 65 m respectively, for the H1, H2, and H3 cabins. The H1 design has PFEI that
is 31% lower than the B737-800, the reference aircraft, whereas the H3 design has PFEI that is 54% lower
than the more efficient B777-200LR.
The relatively large improvement in PFEI (H-series relative to conventional aircraft) is because at small
scales, the internal volume in the outboard and aft centerbody was not adequately utilized because of
cabin height requirements. The unusable whitespace resulted in a relatively high empty weight fraction,
relative to both larger HWB aircraft and to comparably sized tube and wing aircraft. Since the all lifting
surface of the HWB planform allows for higher L/D, the H1 performance is better than the reference
aircraft. However, it does not meet the PFEI of the D series aircraft and was not pursued further. At larger
scales, such as the H3 design, the cabin space was more efficiently utilized and the empty weight fraction
decreased as a consequence. The PFEI improvement in going from H2 to H3 is less than that from H1 to
H2 because the relative changes in empty weight fraction and L/D are less. This is a consequence of the
65 m span being the same for both and in their reaching similar reductions in white space.
Table 50: HWB Payload/Range Scaling Results
Class PAX Revenue Cargo (m2)
Range (nm)
PFEI (kJ/kg-km)
OEW/ MTOW
L/D
H1 180 - 3000 4.41 61.5 20.7
H2 256 143 8300 3.07 44.7 24.0
H3 354 194 7600 2.75 44.6 24.2
NASA/CR—2010-216794/VOL1 155
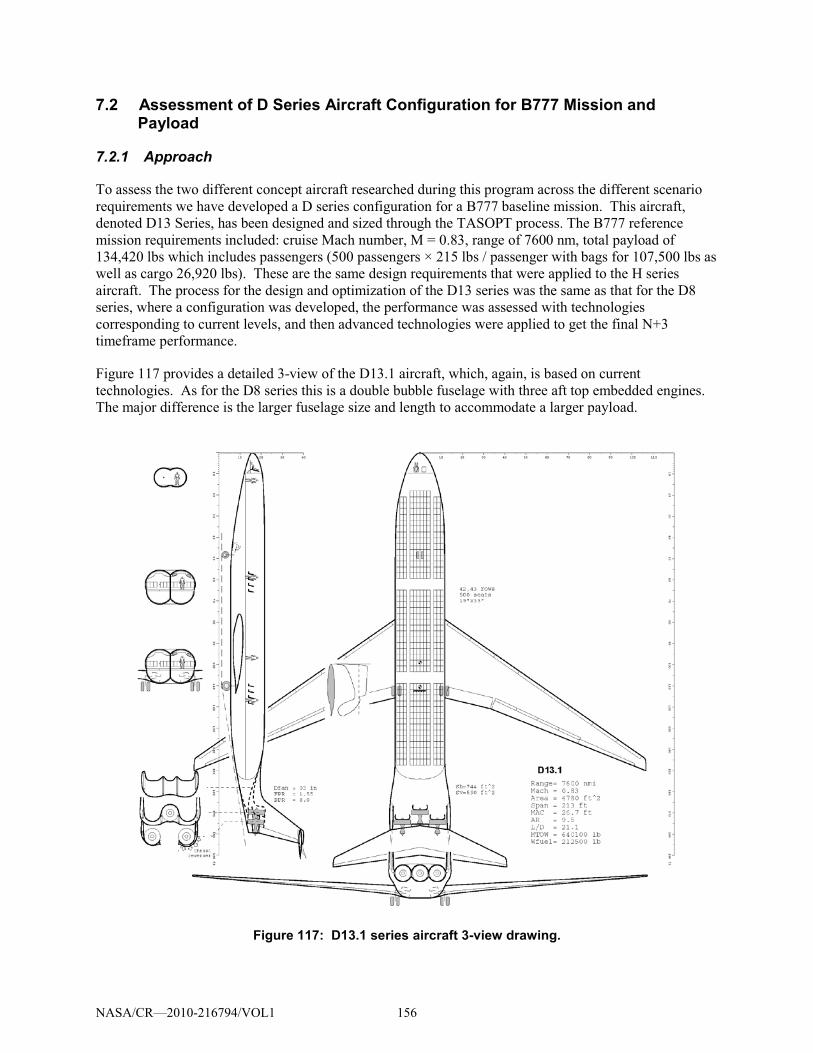
7.2 Assessment of D Series Aircraft Configuration for B777 Mission and Payload
7.2.1 Approach
To assess the two different concept aircraft researched during this program across the different scenario
requirements we have developed a D series configuration for a B777 baseline mission. This aircraft,
denoted D13 Series, has been designed and sized through the TASOPT process. The B777 reference
mission requirements included: cruise Mach number, M = 0.83, range of 7600 nm, total payload of
134,420 lbs which includes passengers (500 passengers × 215 lbs / passenger with bags for 107,500 lbs as
well as cargo 26,920 lbs). These are the same design requirements that were applied to the H series
aircraft. The process for the design and optimization of the D13 series was the same as that for the D8
series, where a configuration was developed, the performance was assessed with technologies
corresponding to current levels, and then advanced technologies were applied to get the final N+3
timeframe performance.
Figure 117 provides a detailed 3-view of the D13.1 aircraft, which, again, is based on current
technologies. As for the D8 series this is a double bubble fuselage with three aft top embedded engines.
The major difference is the larger fuselage size and length to accommodate a larger payload.
Figure 117: D13.1 series aircraft 3-view drawing.
NASA/CR—2010-216794/VOL1 156
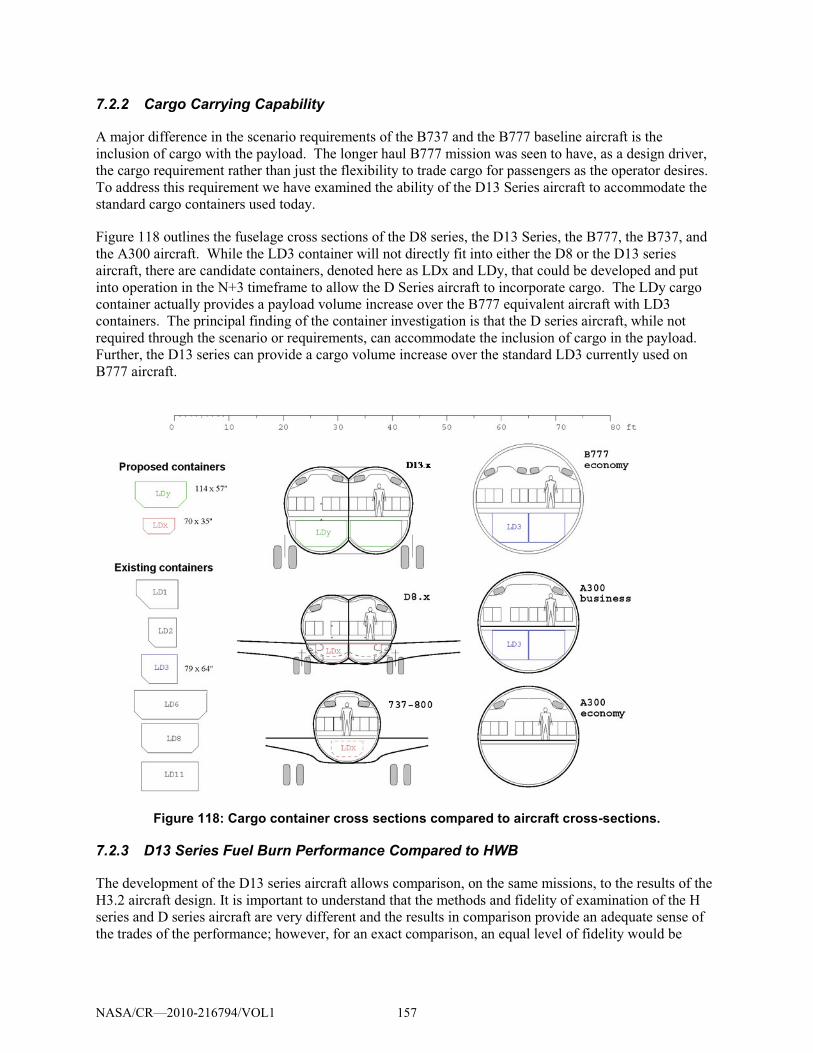
7.2.2 Cargo Carrying Capability
A major difference in the scenario requirements of the B737 and the B777 baseline aircraft is the
inclusion of cargo with the payload. The longer haul B777 mission was seen to have, as a design driver,
the cargo requirement rather than just the flexibility to trade cargo for passengers as the operator desires.
To address this requirement we have examined the ability of the D13 Series aircraft to accommodate the
standard cargo containers used today.
Figure 118 outlines the fuselage cross sections of the D8 series, the D13 Series, the B777, the B737, and
the A300 aircraft. While the LD3 container will not directly fit into either the D8 or the D13 series
aircraft, there are candidate containers, denoted here as LDx and LDy, that could be developed and put
into operation in the N+3 timeframe to allow the D Series aircraft to incorporate cargo. The LDy cargo
container actually provides a payload volume increase over the B777 equivalent aircraft with LD3
containers. The principal finding of the container investigation is that the D series aircraft, while not
required through the scenario or requirements, can accommodate the inclusion of cargo in the payload.
Further, the D13 series can provide a cargo volume increase over the standard LD3 currently used on
B777 aircraft.
Figure 118: Cargo container cross sections compared to aircraft cross-sections.
7.2.3 D13 Series Fuel Burn Performance Compared to HWB
The development of the D13 series aircraft allows comparison, on the same missions, to the results of the
H3.2 aircraft design. It is important to understand that the methods and fidelity of examination of the H
series and D series aircraft are very different and the results in comparison provide an adequate sense of
the trades of the performance; however, for an exact comparison, an equal level of fidelity would be
NASA/CR—2010-216794/VOL1 157
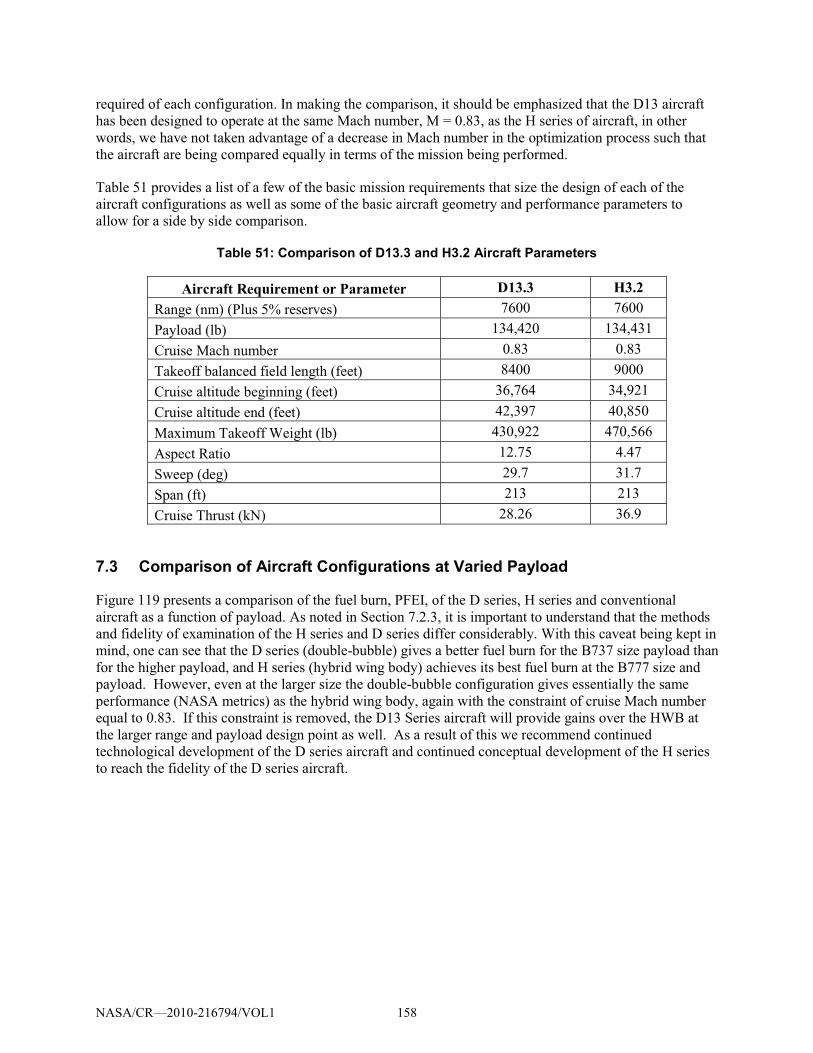
required of each configuration. In making the comparison, it should be emphasized that the D13 aircraft
has been designed to operate at the same Mach number, M = 0.83, as the H series of aircraft, in other
words, we have not taken advantage of a decrease in Mach number in the optimization process such that
the aircraft are being compared equally in terms of the mission being performed.
Table 51 provides a list of a few of the basic mission requirements that size the design of each of the
aircraft configurations as well as some of the basic aircraft geometry and performance parameters to
allow for a side by side comparison.
Table 51: Comparison of D13.3 and H3.2 Aircraft Parameters
Aircraft Requirement or Parameter D13.3 H3.2 Range (nm) (Plus 5% reserves) 7600 7600
Payload (lb) 134,420 134,431
Cruise Mach number 0.83 0.83
Takeoff balanced field length (feet) 8400 9000
Cruise altitude beginning (feet) 36,764 34,921
Cruise altitude end (feet) 42,397 40,850
Maximum Takeoff Weight (lb) 430,922 470,566
Aspect Ratio 12.75 4.47
Sweep (deg) 29.7 31.7
Span (ft) 213 213
Cruise Thrust (kN) 28.26 36.9
7.3 Comparison of Aircraft Configurations at Varied Payload
Figure 119 presents a comparison of the fuel burn, PFEI, of the D series, H series and conventional
aircraft as a function of payload. As noted in Section 7.2.3, it is important to understand that the methods
and fidelity of examination of the H series and D series differ considerably. With this caveat being kept in
mind, one can see that the D series (double-bubble) gives a better fuel burn for the B737 size payload than
for the higher payload, and H series (hybrid wing body) achieves its best fuel burn at the B777 size and
payload. However, even at the larger size the double-bubble configuration gives essentially the same
performance (NASA metrics) as the hybrid wing body, again with the constraint of cruise Mach number
equal to 0.83. If this constraint is removed, the D13 Series aircraft will provide gains over the HWB at
the larger range and payload design point as well. As a result of this we recommend continued
technological development of the D series aircraft and continued conceptual development of the H series
to reach the fidelity of the D series aircraft.
NASA/CR—2010-216794/VOL1 158
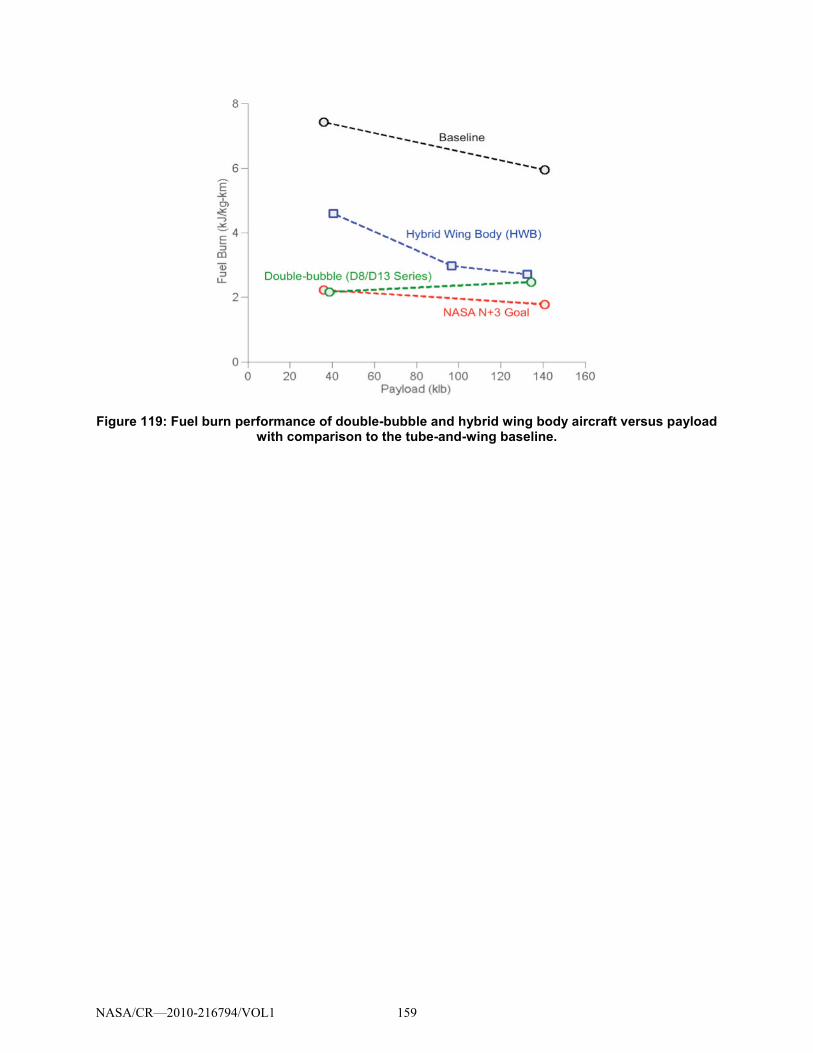
Figure 119: Fuel burn performance of double-bubble and hybrid wing body aircraft versus payload with comparison to the tube-and-wing baseline.
NASA/CR—2010-216794/VOL1 159
8 Technology Roadmaps
8.1 Risk Assessment and Technology Maturation Plans
8.1.1 Objectives and Definitions
The objective of the N+3 risk assessment activity was to quantify the risks associated with the
development of each advanced vehicle concept, identify technological barriers, and provide technology
roadmaps to mitigate risks and overcome these barriers.
According to the Department of Defense, risk is defined as the “measure of uncertainty in achieving
program goals and objectives within defined costs, schedule and performance constraints”109. This
definition excludes environmental, safety and occupational health hazards. Applying this same definition
to the N+3 project, we interpret risk as the measure of uncertainty in advancing an aircraft concept capable of achieving NASA N+3 goals to TRL 4 by 2025. (TRL 4 is defined by NASA as “component
and/or breadboard validation in laboratory environment”110
8.1.2 Technology Forecasting Methodology
). Thus, to assess this uncertainty we need to
forecast the feasibility and performance of each technology by 2025.
We utilized the Delphi method111
to assess the risk of the different technologies identified during the
design phase (see Sections 5.2 and 6.2). This method utilizes expert judgment to evaluate the probability
of developing each technology to TRL 4 by 2025. While Delphi is a subjective method, it is useful for
new technologies that lack historical data. To increase the validity of the risk assessment approach, we
utilized technology trend extrapolation techniques112
whenever data was available. This method relies on
historical data and assumes the technology performance improvement will be sustained over time. The
two approaches have been extensively described in the literature, and have been applied to aircraft design
in the past113
For the Delphi method, we identified an initial set of recognized experts from industry, academia, and
government agencies including NASA. To increase the reliability of their judgment, we utilized snowball
sampling until each technology was covered by at least two experts (some experts covered more than one
technology). Eighteen subject matter experts were consulted for the purpose of this project. They
provided information on (a) the state-of-the-art of different technologies, (b) the probability of these
technologies achieving at least TRL 4 by 2025, (c) the major technological barriers, and (d) technology
maturation plans.
.
When available, we compared the experts’ risk assessments with the results obtained through the
technology trend extrapolation. Technologies can follow different performance improvement trends
which depend on the observation period (e.g. short vs. long timeframe), the level of technology saturation
109 Department of Defense, Risk Management Guide for DOD Acuisitions, Department of Defense, 2006, 6th Ed.
110 Mankins, J.C., Technology Readiness Levels, NASA: Advanced Concepts Office/Office of Space Access and
Technology, April 6, 1995. 111
Linstone, H.A. and T. Murray. The Delphi Method - Techniques and Applications, Reading, MA: Addison-
Wesley Publishing Company, 1975. 112
Porter, A.L., et al., Forecasting and Management of Technology, New York, NY: John Wiley & Sons, Inc., 1991. 113
Kirby, M.R. and D.N. Mavris. Forecasting Technolgy Uncertianty in Preeliminary Aircraft Design, World
Aviation Congress. San Francisco, CA: SAE Paper 1999-01-5631.
NASA/CR—2010-216794/VOL1 160
(e.g. fan efficiency cannot reach 100%), or the presence of competing technologies (e.g. increase in
turbine material temperature reduces the need for cooling technologies). Different forecasting models are
recommended depending on this growth pattern. For short periods of time or slow performance growth,
linear trends are useful114
, for low saturation (i.e. new technologies), exponential curves are
appropriate115
, and for competing technologies or high saturation, S-shaped curves are useful116
.
(1)
For S-shaped curves, A is a scaling factor (equal to 100% in case of saturation), and the parameters B and
C are obtained by minimizing the standard deviation of errors between historical and forecasted data.
In case of discrepancy between Delphi and the trend extrapolation results, we solicited a second round of
interviews with the domain experts, after which all answers converged. Combining the individual
technology contributions to NASA goals (See Sections 5.6 and 6.6) with the results of this risk
assessment, we obtained the “Risk vs. Gain” charts presented in Section 8.3. Similarly, utilizing the
experts’ information on technology barriers and technology maturation plans, we constructed the
technology roadmaps presented in Section 8.4.
8.1.3 Vehicle Technology Risks vs. Gains Analysis
The following subsections contain risk vs. gain analyses for the different vehicle technologies and their
impact on NASA N+3 goals (PFEI, NOx, and Noise reductions).
8.1.3.1 D8 Technology Risks vs. Gains Analysis
Technology Risks vs. PFEI Gains
Figure 120 shows the percentage improvement in PFEI for each of the technologies considered as a
function of the probability of not developing the technology to TRL 4 by 2025. The PFEI improvement
has been calculated using TASOPT. As mentioned in Section 5.6, the advancement that contributes the
most to PFEI reduction is the change to the D8.1 configuration (49% reduction in PFEI). According to the
experts, there is 20% of probability of not developing this configuration to TRL 4 by 2025. The risk is
associated to the integration of the airframe with the propulsion system equipped with a tolerant distortion
high efficiency fan. The other two technologies with the highest PFEI contribution are airframe advanced
materials and processes and ultra high bypass ratio engines. They show 10% and 20% risk, respectively.
In the case of the ultra high bypass ratio engines, the main concern is the development of high efficiency
small cores. The technologies with highest risks correspond to further improvements on engine
component efficiencies, especially the compressor given the core size. Increasing the cooling
effectiveness for 0.3 to 0.4 and developing advanced engine materials have a 25% risk. All other
technologies have at least 80% probability of success.
114 Porter, A.L., et al., Forecasting and Management of Technology, New York, NY: John Wiley & Sons, Inc., 1991.
115 See Footnote 114.
116 Foster, R.N., The S-Curve: A New Forecasting Tool, Innovation, The Attacker's Advantage. New York, NY:
Summit Books, Simon and Schuster, 1986, pp. 88-111.
NASA/CR—2010-216794/VOL1 161
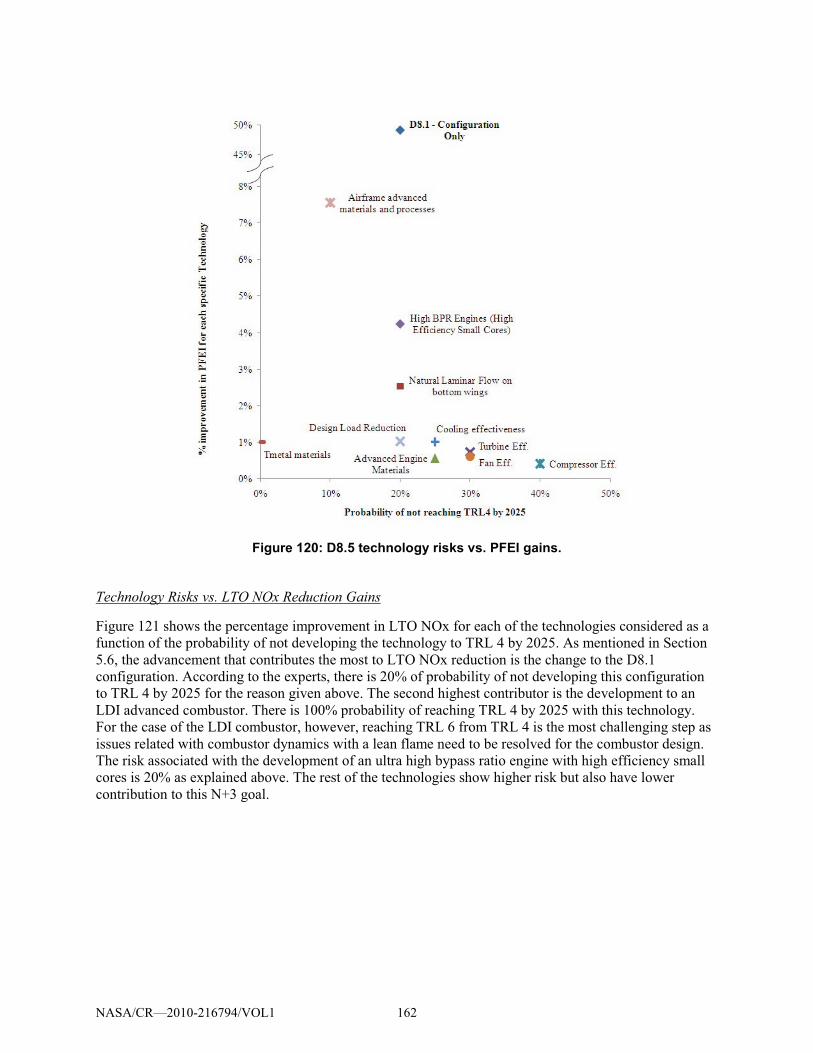
Figure 120: D8.5 technology risks vs. PFEI gains.
Technology Risks vs. LTO NOx Reduction Gains
Figure 121 shows the percentage improvement in LTO NOx for each of the technologies considered as a
function of the probability of not developing the technology to TRL 4 by 2025. As mentioned in Section
5.6, the advancement that contributes the most to LTO NOx reduction is the change to the D8.1
configuration. According to the experts, there is 20% of probability of not developing this configuration
to TRL 4 by 2025 for the reason given above. The second highest contributor is the development to an
LDI advanced combustor. There is 100% probability of reaching TRL 4 by 2025 with this technology.
For the case of the LDI combustor, however, reaching TRL 6 from TRL 4 is the most challenging step as
issues related with combustor dynamics with a lean flame need to be resolved for the combustor design.
The risk associated with the development of an ultra high bypass ratio engine with high efficiency small
cores is 20% as explained above. The rest of the technologies show higher risk but also have lower
contribution to this N+3 goal.
NASA/CR—2010-216794/VOL1 162
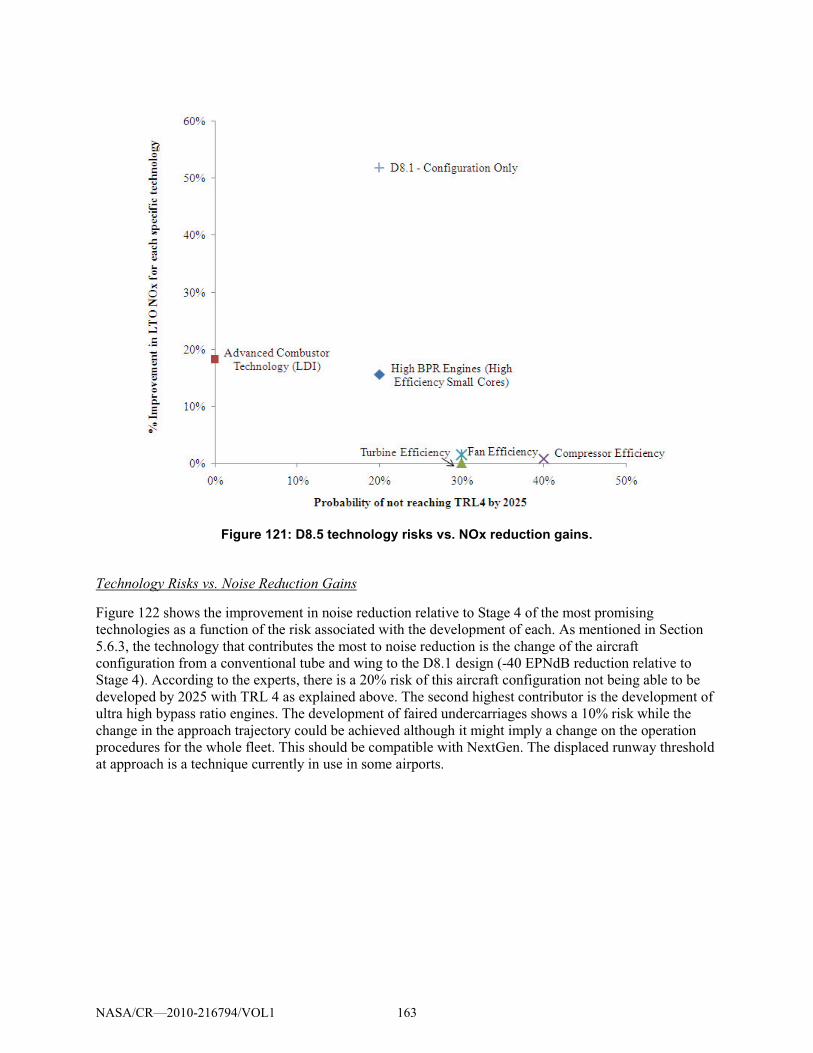
Figure 121: D8.5 technology risks vs. NOx reduction gains.
Technology Risks vs. Noise Reduction Gains
Figure 122 shows the improvement in noise reduction relative to Stage 4 of the most promising
technologies as a function of the risk associated with the development of each. As mentioned in Section
5.6.3, the technology that contributes the most to noise reduction is the change of the aircraft
configuration from a conventional tube and wing to the D8.1 design (-40 EPNdB reduction relative to
Stage 4). According to the experts, there is a 20% risk of this aircraft configuration not being able to be
developed by 2025 with TRL 4 as explained above. The second highest contributor is the development of
ultra high bypass ratio engines. The development of faired undercarriages shows a 10% risk while the
change in the approach trajectory could be achieved although it might imply a change on the operation
procedures for the whole fleet. This should be compatible with NextGen. The displaced runway threshold
at approach is a technique currently in use in some airports.
NASA/CR—2010-216794/VOL1 163
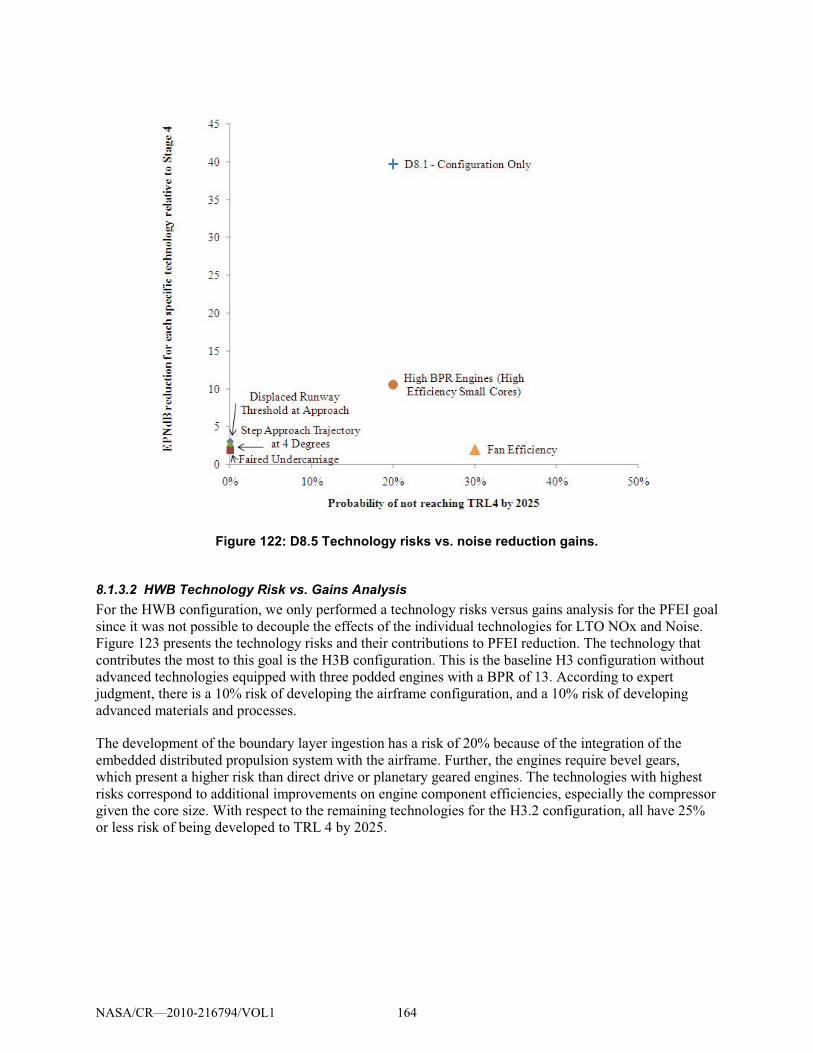
Figure 122: D8.5 Technology risks vs. noise reduction gains.
8.1.3.2 HWB Technology Risk vs. Gains Analysis For the HWB configuration, we only performed a technology risks versus gains analysis for the PFEI goal
since it was not possible to decouple the effects of the individual technologies for LTO NOx and Noise.
Figure 123 presents the technology risks and their contributions to PFEI reduction. The technology that
contributes the most to this goal is the H3B configuration. This is the baseline H3 configuration without
advanced technologies equipped with three podded engines with a BPR of 13. According to expert
judgment, there is a 10% risk of developing the airframe configuration, and a 10% risk of developing
advanced materials and processes.
The development of the boundary layer ingestion has a risk of 20% because of the integration of the
embedded distributed propulsion system with the airframe. Further, the engines require bevel gears,
which present a higher risk than direct drive or planetary geared engines. The technologies with highest
risks correspond to additional improvements on engine component efficiencies, especially the compressor
given the core size. With respect to the remaining technologies for the H3.2 configuration, all have 25%
or less risk of being developed to TRL 4 by 2025.
NASA/CR—2010-216794/VOL1 164
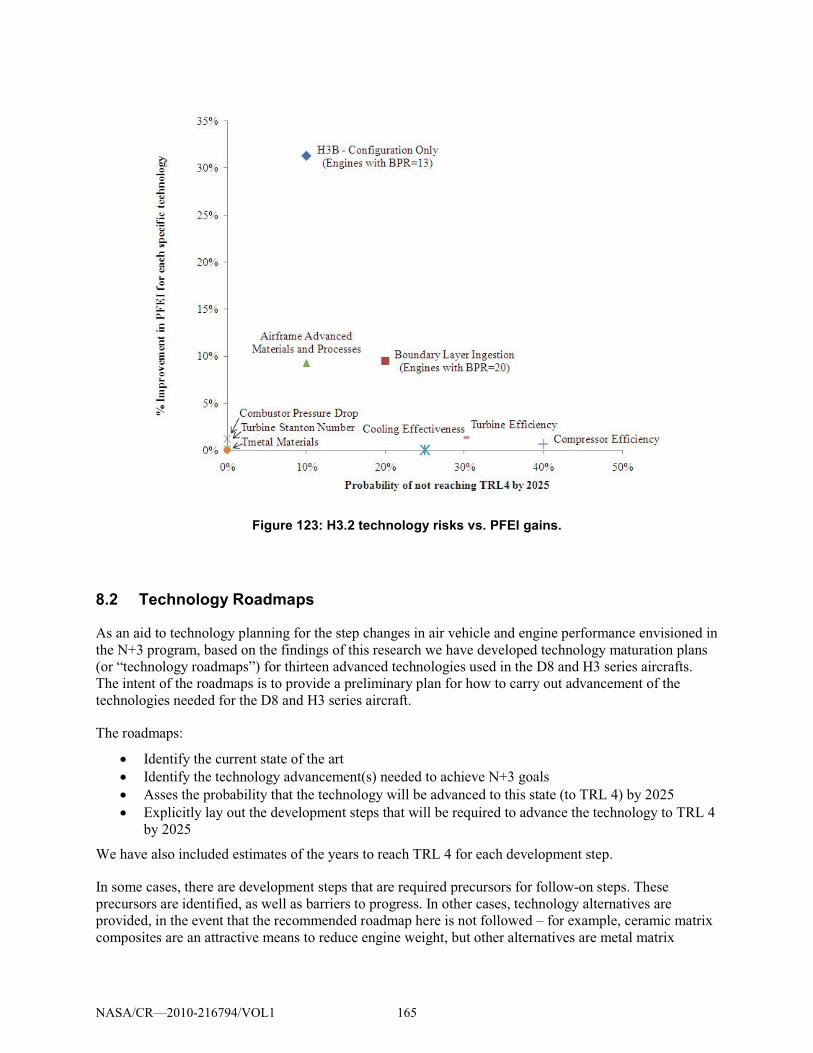
Figure 123: H3.2 technology risks vs. PFEI gains.
8.2 Technology Roadmaps
As an aid to technology planning for the step changes in air vehicle and engine performance envisioned in
the N+3 program, based on the findings of this research we have developed technology maturation plans
(or “technology roadmaps”) for thirteen advanced technologies used in the D8 and H3 series aircrafts.
The intent of the roadmaps is to provide a preliminary plan for how to carry out advancement of the
technologies needed for the D8 and H3 series aircraft.
The roadmaps:
� Identify the current state of the art
� Identify the technology advancement(s) needed to achieve N+3 goals
� Asses the probability that the technology will be advanced to this state (to TRL 4) by 2025
� Explicitly lay out the development steps that will be required to advance the technology to TRL 4
by 2025
We have also included estimates of the years to reach TRL 4 for each development step.
In some cases, there are development steps that are required precursors for follow-on steps. These
precursors are identified, as well as barriers to progress. In other cases, technology alternatives are
provided, in the event that the recommended roadmap here is not followed – for example, ceramic matrix
composites are an attractive means to reduce engine weight, but other alternatives are metal matrix
NASA/CR—2010-216794/VOL1 165
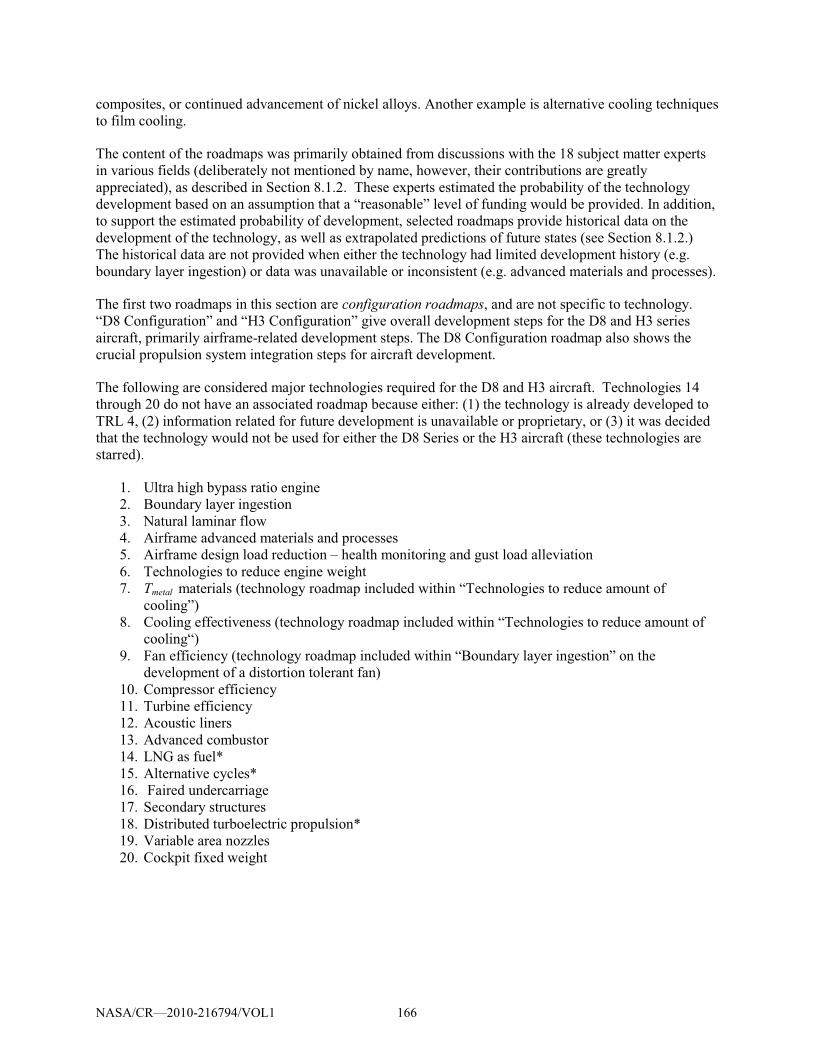
composites, or continued advancement of nickel alloys. Another example is alternative cooling techniques
to film cooling.
The content of the roadmaps was primarily obtained from discussions with the 18 subject matter experts
in various fields (deliberately not mentioned by name, however, their contributions are greatly
appreciated), as described in Section 8.1.2. These experts estimated the probability of the technology
development based on an assumption that a “reasonable” level of funding would be provided. In addition,
to support the estimated probability of development, selected roadmaps provide historical data on the
development of the technology, as well as extrapolated predictions of future states (see Section 8.1.2.)
The historical data are not provided when either the technology had limited development history (e.g.
boundary layer ingestion) or data was unavailable or inconsistent (e.g. advanced materials and processes).
The first two roadmaps in this section are configuration roadmaps, and are not specific to technology.
“D8 Configuration” and “H3 Configuration” give overall development steps for the D8 and H3 series
aircraft, primarily airframe-related development steps. The D8 Configuration roadmap also shows the
crucial propulsion system integration steps for aircraft development.
The following are considered major technologies required for the D8 and H3 aircraft. Technologies 14
through 20 do not have an associated roadmap because either: (1) the technology is already developed to
TRL 4, (2) information related for future development is unavailable or proprietary, or (3) it was decided
that the technology would not be used for either the D8 Series or the H3 aircraft (these technologies are
starred).
1. Ultra high bypass ratio engine
2. Boundary layer ingestion
3. Natural laminar flow
4. Airframe advanced materials and processes
5. Airframe design load reduction – health monitoring and gust load alleviation
6. Technologies to reduce engine weight
7. Tmetal materials (technology roadmap included within “Technologies to reduce amount of
cooling”)
8. Cooling effectiveness (technology roadmap included within “Technologies to reduce amount of
cooling“)
9. Fan efficiency (technology roadmap included within “Boundary layer ingestion” on the
development of a distortion tolerant fan)
10. Compressor efficiency
11. Turbine efficiency
12. Acoustic liners
13. Advanced combustor
14. LNG as fuel*
15. Alternative cycles*
16. Faired undercarriage
17. Secondary structures
18. Distributed turboelectric propulsion*
19. Variable area nozzles
20. Cockpit fixed weight
NASA/CR—2010-216794/VOL1 166
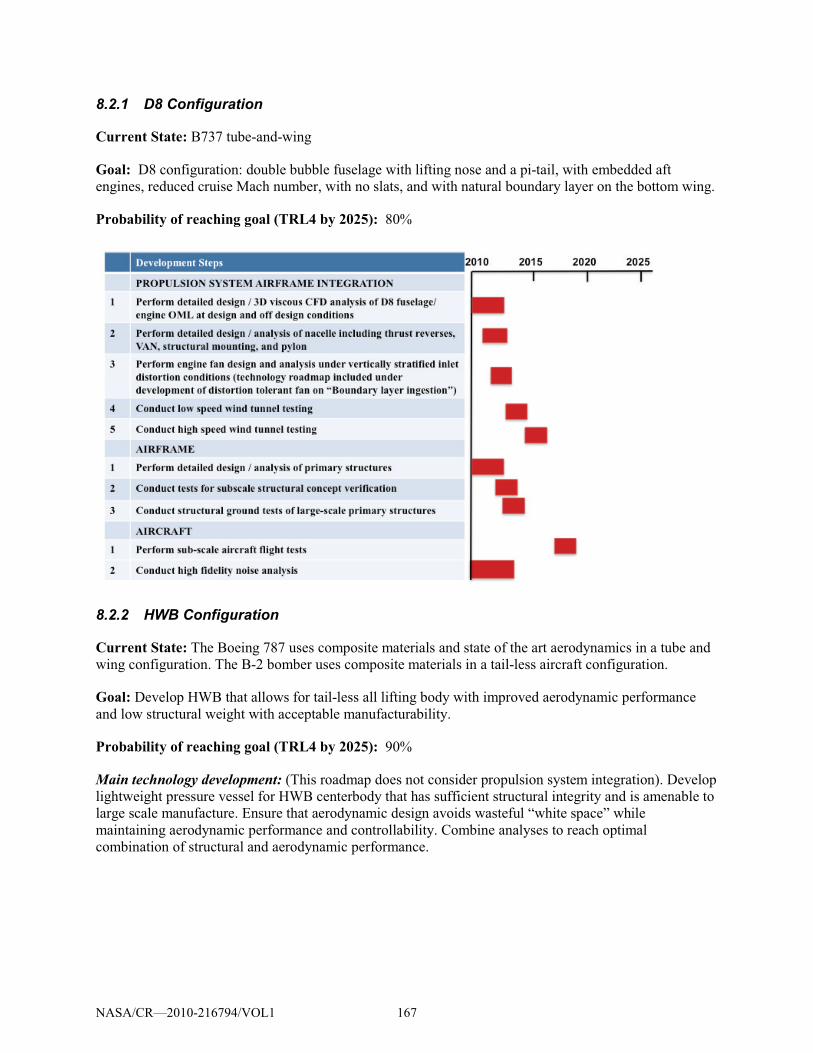
8.2.1 D8 Configuration
Current State: B737 tube-and-wing
Goal: D8 configuration: double bubble fuselage with lifting nose and a pi-tail, with embedded aft
engines, reduced cruise Mach number, with no slats, and with natural boundary layer on the bottom wing.
Probability of reaching goal (TRL4 by 2025): 80%
8.2.2 HWB Configuration
Current State: The Boeing 787 uses composite materials and state of the art aerodynamics in a tube and
wing configuration. The B-2 bomber uses composite materials in a tail-less aircraft configuration.
Goal: Develop HWB that allows for tail-less all lifting body with improved aerodynamic performance
and low structural weight with acceptable manufacturability.
Probability of reaching goal (TRL4 by 2025): 90%
Main technology development: (This roadmap does not consider propulsion system integration). Develop
lightweight pressure vessel for HWB centerbody that has sufficient structural integrity and is amenable to
large scale manufacture. Ensure that aerodynamic design avoids wasteful “white space” while
maintaining aerodynamic performance and controllability. Combine analyses to reach optimal
combination of structural and aerodynamic performance.
NASA/CR—2010-216794/VOL1 167
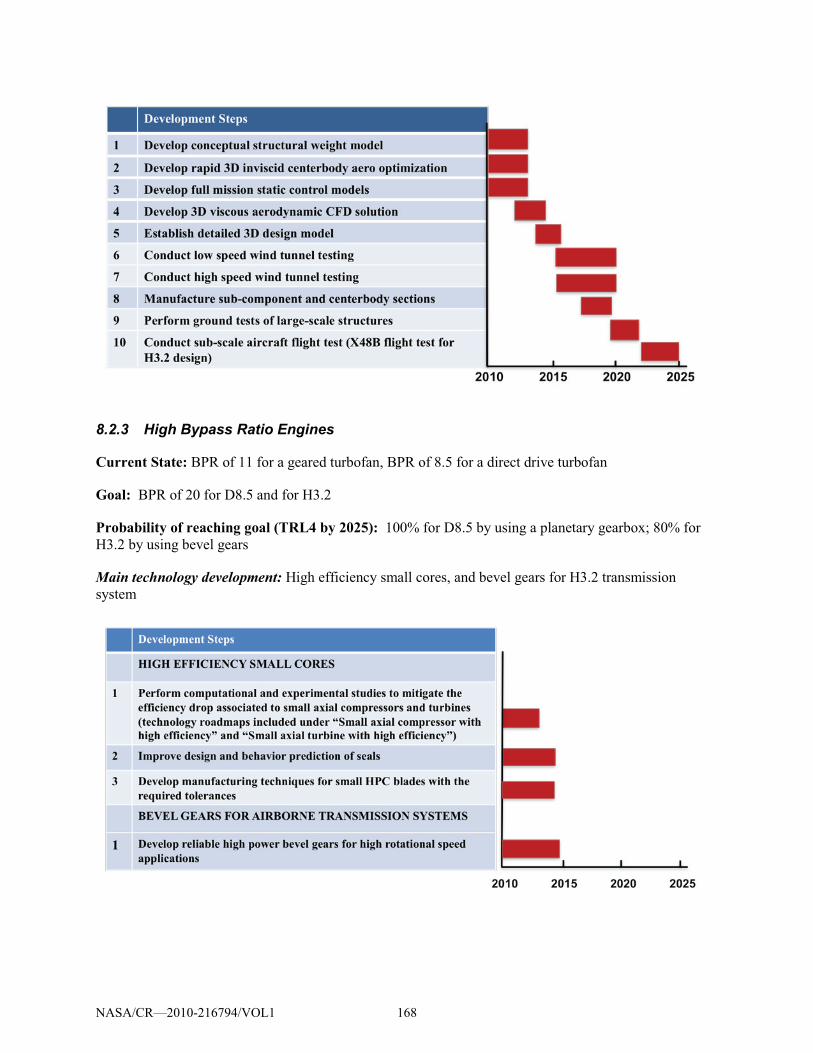
8.2.3 High Bypass Ratio Engines
Current State: BPR of 11 for a geared turbofan, BPR of 8.5 for a direct drive turbofan
Goal: BPR of 20 for D8.5 and for H3.2
Probability of reaching goal (TRL4 by 2025): 100% for D8.5 by using a planetary gearbox; 80% for
H3.2 by using bevel gears
Main technology development: High efficiency small cores, and bevel gears for H3.2 transmission
system
NASA/CR—2010-216794/VOL1 168
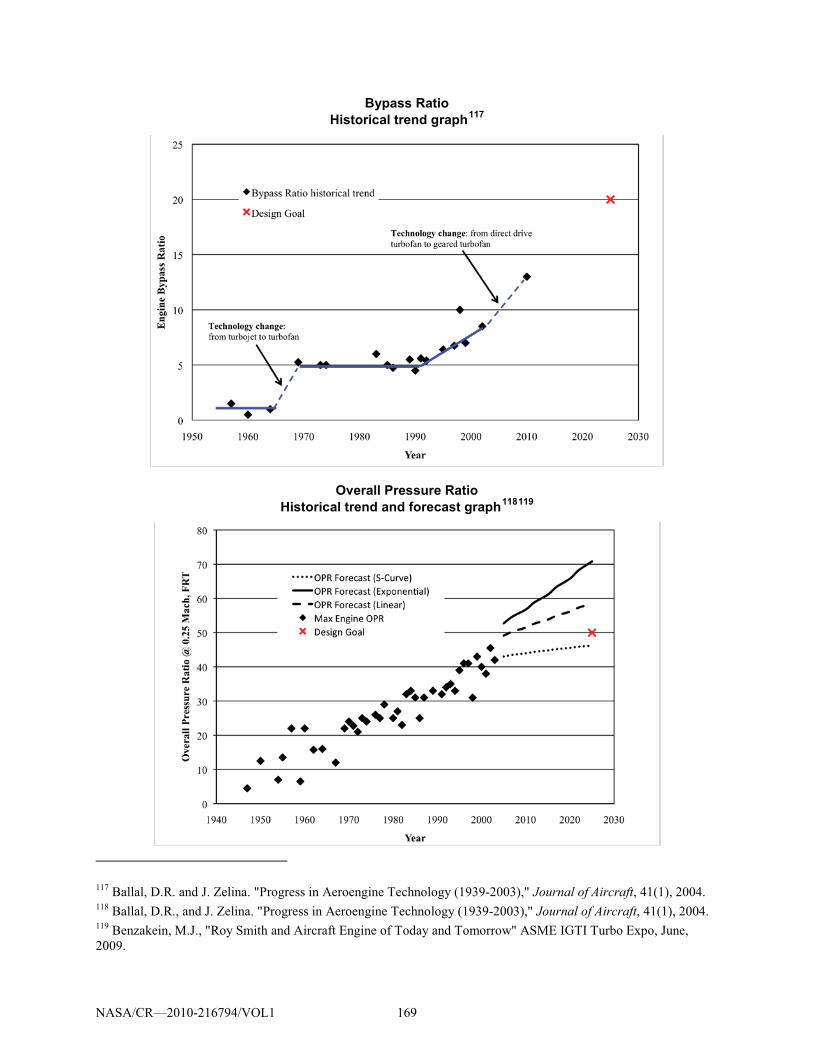
Bypass Ratio Historical trend graph117
Overall Pressure Ratio Historical trend and forecast graph118119
117 Ballal, D.R. and J. Zelina. "Progress in Aeroengine Technology (1939-2003)," Journal of Aircraft, 41(1), 2004.
118 Ballal, D.R., and J. Zelina. "Progress in Aeroengine Technology (1939-2003)," Journal of Aircraft, 41(1), 2004.
119 Benzakein, M.J., "Roy Smith and Aircraft Engine of Today and Tomorrow" ASME IGTI Turbo Expo, June,
2009.
NASA/CR—2010-216794/VOL1 169
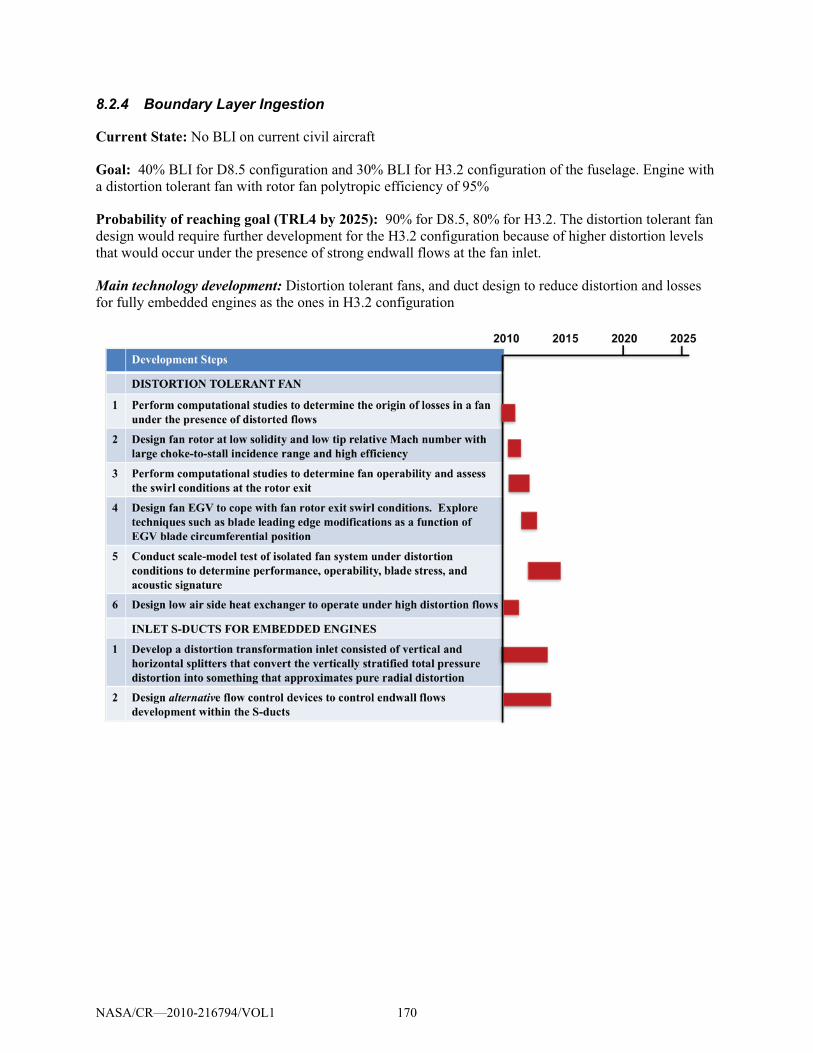
8.2.4 Boundary Layer Ingestion
Current State: No BLI on current civil aircraft
Goal: 40% BLI for D8.5 configuration and 30% BLI for H3.2 configuration of the fuselage. Engine with
a distortion tolerant fan with rotor fan polytropic efficiency of 95%
Probability of reaching goal (TRL4 by 2025): 90% for D8.5, 80% for H3.2. The distortion tolerant fan
design would require further development for the H3.2 configuration because of higher distortion levels
that would occur under the presence of strong endwall flows at the fan inlet.
Main technology development: Distortion tolerant fans, and duct design to reduce distortion and losses
for fully embedded engines as the ones in H3.2 configuration
NASA/CR—2010-216794/VOL1 170
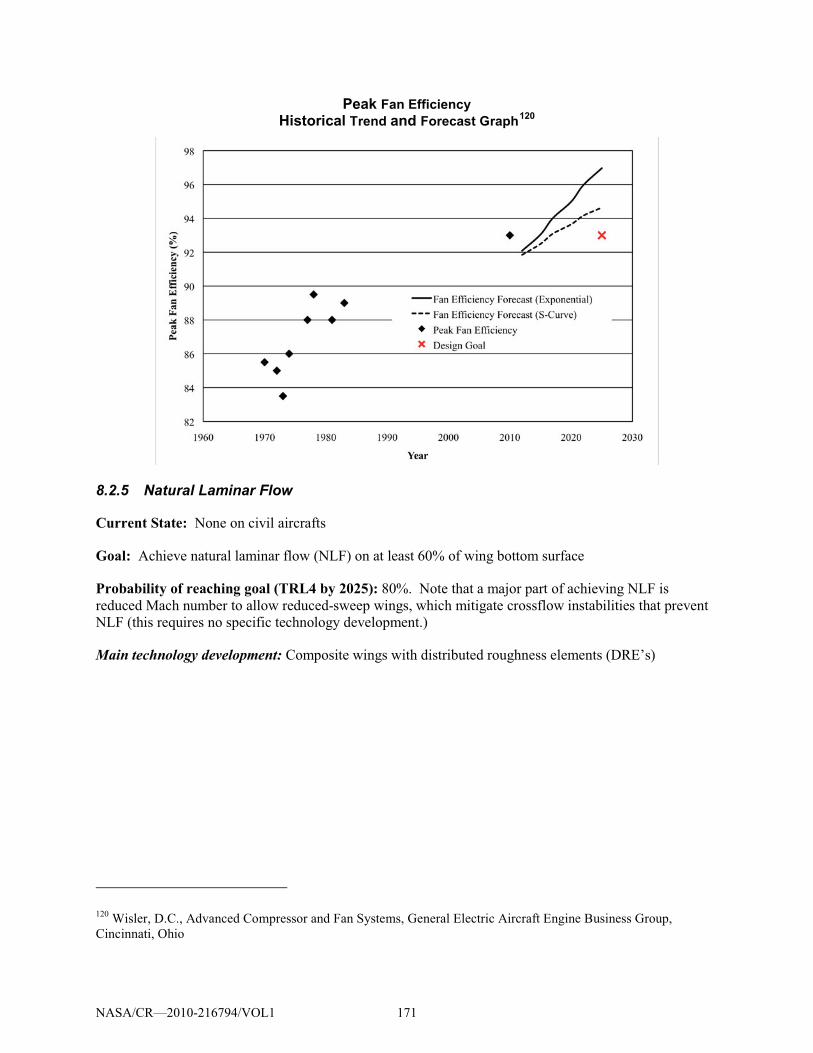
Peak Fan Efficiency Historical Trend and Forecast Graph120
8.2.5 Natural Laminar Flow
Current State: None on civil aircrafts
Goal: Achieve natural laminar flow (NLF) on at least 60% of wing bottom surface
Probability of reaching goal (TRL4 by 2025): 80%. Note that a major part of achieving NLF is
reduced Mach number to allow reduced-sweep wings, which mitigate crossflow instabilities that prevent
NLF (this requires no specific technology development.)
Main technology development: Composite wings with distributed roughness elements (DRE’s)
120 Wisler, D.C., Advanced Compressor and Fan Systems, General Electric Aircraft Engine Business Group,
Cincinnati, Ohio
NASA/CR—2010-216794/VOL1 171
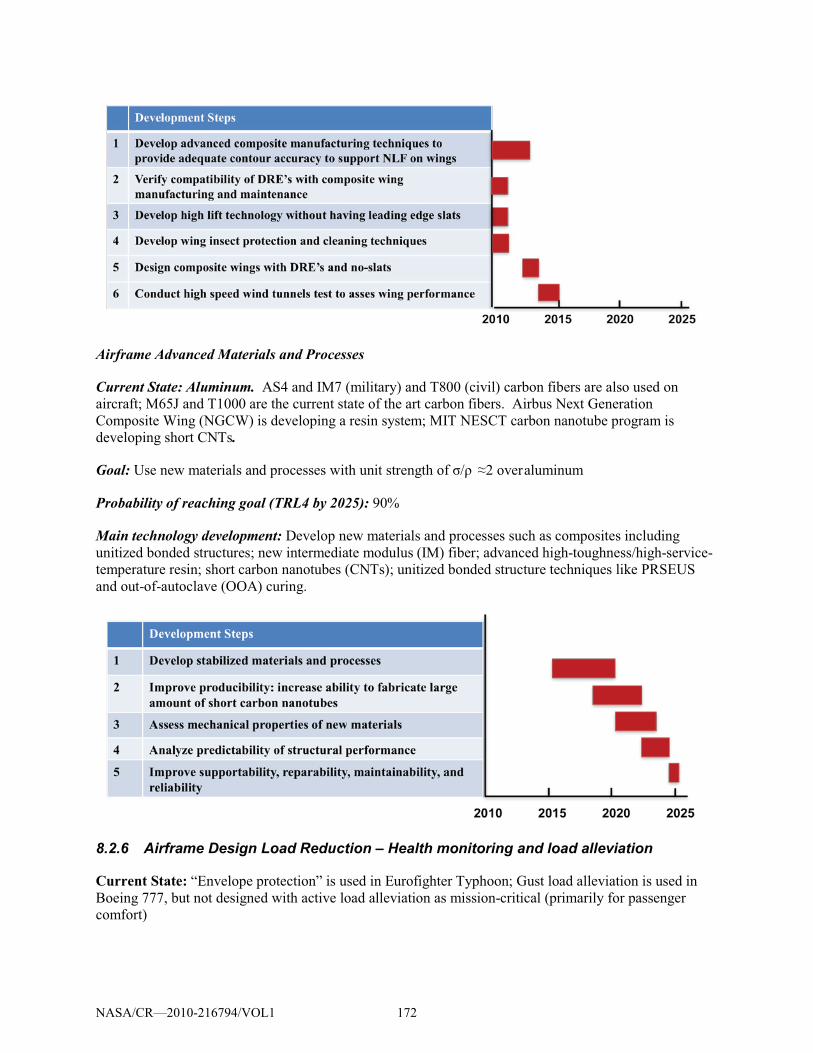
Airframe Advanced Materials and Processes
Current State: Aluminum. AS4 and IM7 (military) and T800 (civil) carbon fibers are also used on
aircraft; M65J and T1000 are the current state of the art carbon fibers. Airbus Next Generation
Composite Wing (NGCW) is developing a resin system; MIT NESCT carbon nanotube program is
developing short CNTs.
Goal: +����!�' ��#� ��� ��)#�(������!��%�������#�$�%���,-.� �/��*�#�aluminum
Probability of reaching goal (TRL4 by 2025): 90%
Main technology development: Develop new materials and processes such as composites including
unitized bonded structures; new intermediate modulus (IM) fiber; advanced high-toughness/high-service-
temperature resin; short carbon nanotubes (CNTs); unitized bonded structure techniques like PRSEUS
and out-of-autoclave (OOA) curing.
8.2.6 Airframe Design Load Reduction – Health monitoring and load alleviation
Current State: “Envelope protection” is used in Eurofighter Typhoon; Gust load alleviation is used in
Boeing 777, but not designed with active load alleviation as mission-critical (primarily for passenger
comfort)
NASA/CR—2010-216794/VOL1 172
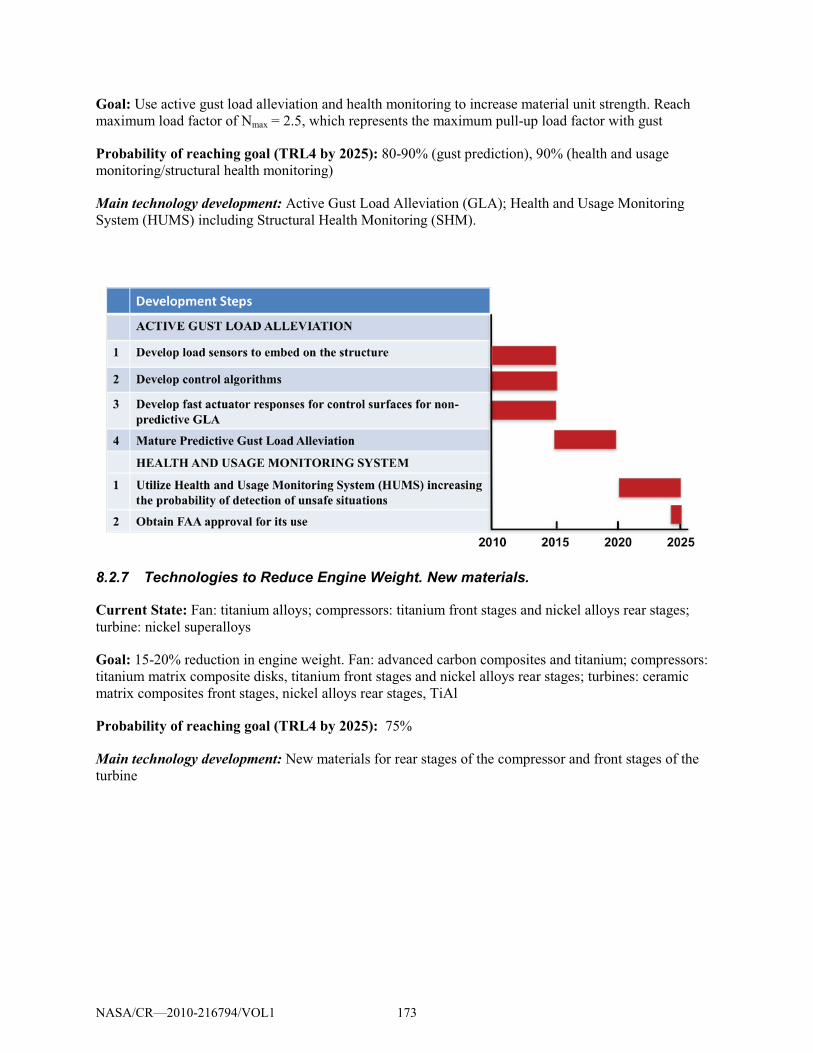
Goal: Use active gust load alleviation and health monitoring to increase material unit strength. Reach
maximum load factor of Nmax = 2.5, which represents the maximum pull-up load factor with gust
Probability of reaching goal (TRL4 by 2025): 80-90% (gust prediction), 90% (health and usage
monitoring/structural health monitoring)
Main technology development: Active Gust Load Alleviation (GLA); Health and Usage Monitoring
System (HUMS) including Structural Health Monitoring (SHM).
8.2.7 Technologies to Reduce Engine Weight. New materials.
Current State: Fan: titanium alloys; compressors: titanium front stages and nickel alloys rear stages;
turbine: nickel superalloys
Goal: 15-20% reduction in engine weight. Fan: advanced carbon composites and titanium; compressors:
titanium matrix composite disks, titanium front stages and nickel alloys rear stages; turbines: ceramic
matrix composites front stages, nickel alloys rear stages, TiAl
Probability of reaching goal (TRL4 by 2025): 75%
Main technology development: New materials for rear stages of the compressor and front stages of the
turbine
NASA/CR—2010-216794/VOL1 173
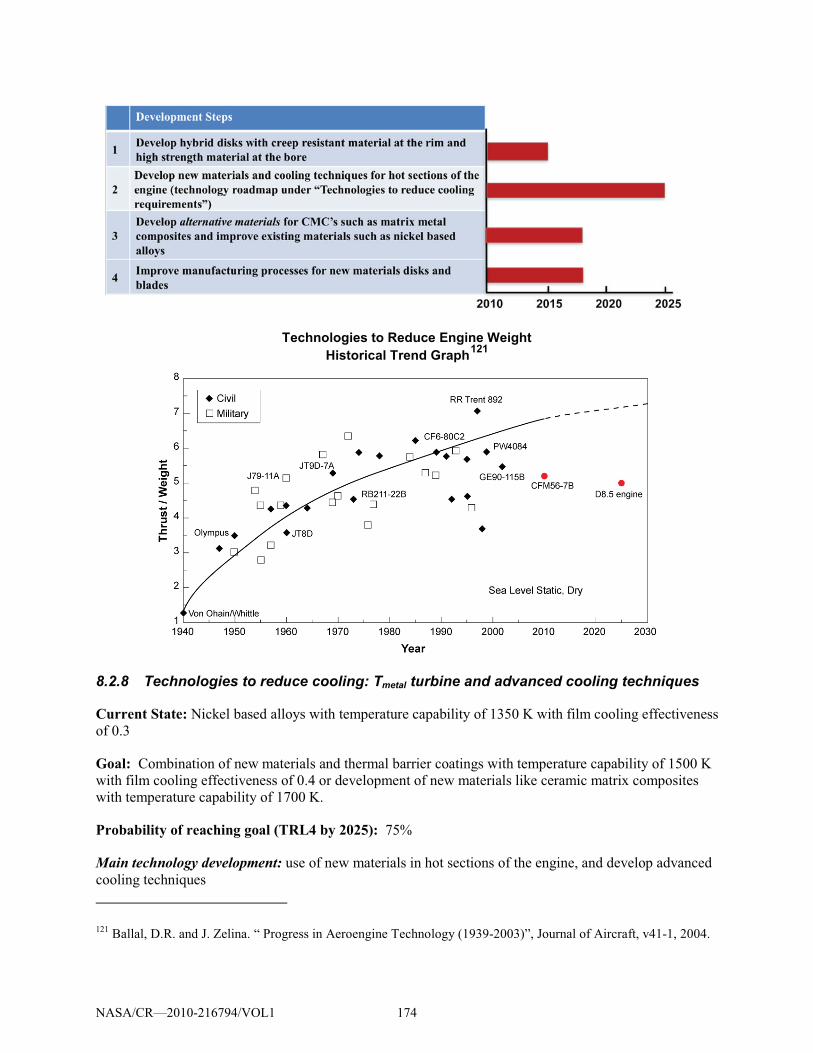
Technologies to Reduce Engine Weight Historical Trend Graph121
8.2.8 Technologies to reduce cooling: Tmetal turbine and advanced cooling techniques
Current State: Nickel based alloys with temperature capability of 1350 K with film cooling effectiveness
of 0.3
Goal: Combination of new materials and thermal barrier coatings with temperature capability of 1500 K
with film cooling effectiveness of 0.4 or development of new materials like ceramic matrix composites
with temperature capability of 1700 K.
Probability of reaching goal (TRL4 by 2025): 75%
Main technology development: use of new materials in hot sections of the engine, and develop advanced
cooling techniques
121 Ballal, D.R. and J. Zelina. “ Progress in Aeroengine Technology (1939-2003)”, Journal of Aircraft, v41-1, 2004.
NASA/CR—2010-216794/VOL1 174
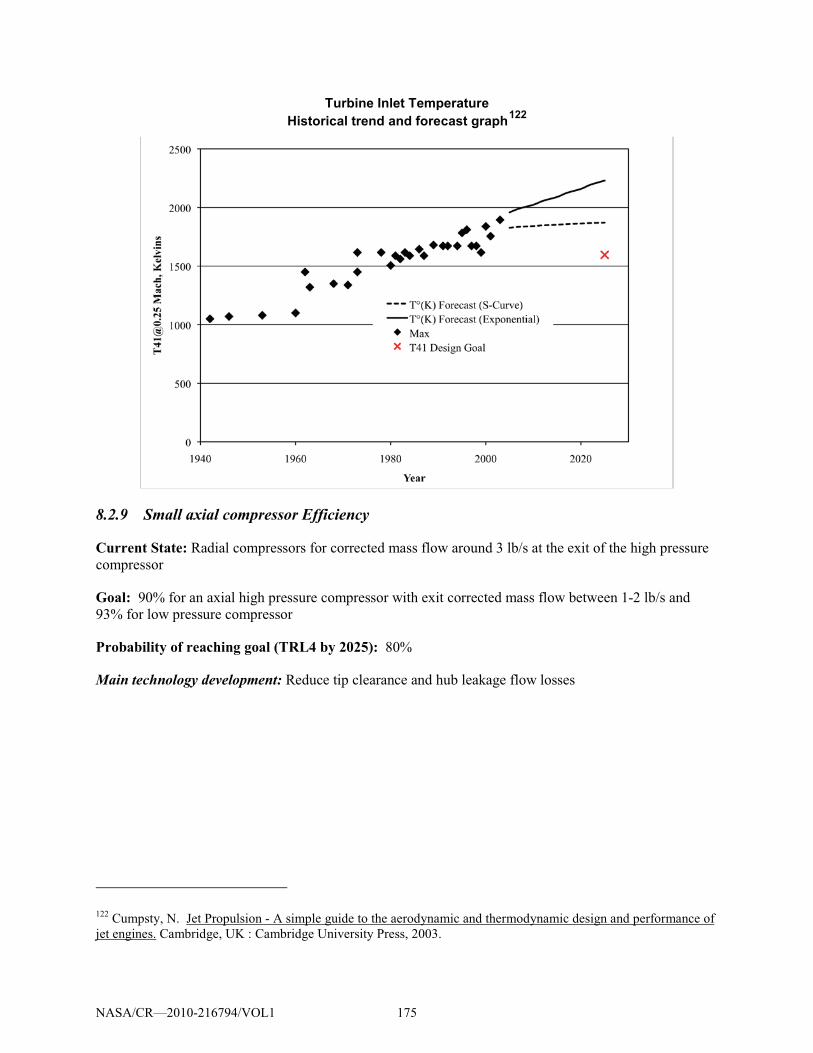
Turbine Inlet Temperature Historical trend and forecast graph122
8.2.9 Small axial compressor Efficiency
Current State: Radial compressors for corrected mass flow around 3 lb/s at the exit of the high pressure
compressor
Goal: 90% for an axial high pressure compressor with exit corrected mass flow between 1-2 lb/s and
93% for low pressure compressor
Probability of reaching goal (TRL4 by 2025): 80%
Main technology development: Reduce tip clearance and hub leakage flow losses
122 Cumpsty, N. Jet Propulsion - A simple guide to the aerodynamic and thermodynamic design and performance of
jet engines. Cambridge, UK : Cambridge University Press, 2003.
NASA/CR—2010-216794/VOL1 175
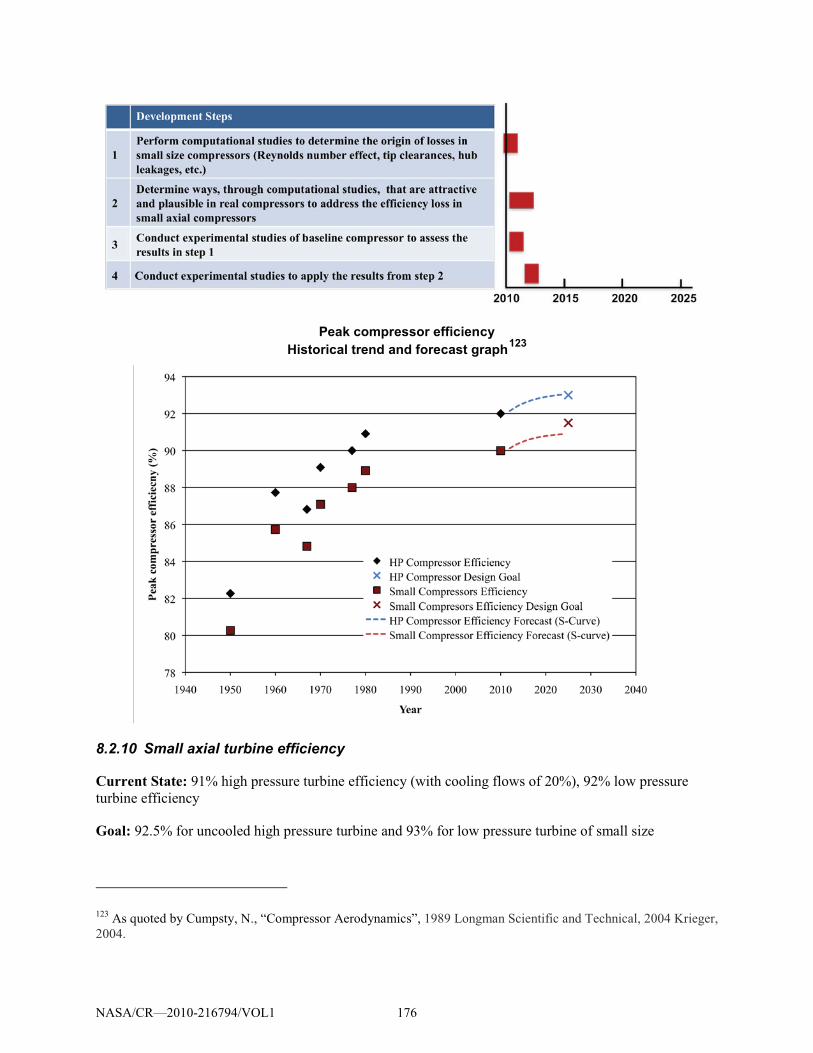
Peak compressor efficiency Historical trend and forecast graph123
8.2.10 Small axial turbine efficiency
Current State: 91% high pressure turbine efficiency (with cooling flows of 20%), 92% low pressure
turbine efficiency
Goal: 92.5% for uncooled high pressure turbine and 93% for low pressure turbine of small size
123 As quoted by Cumpsty, N., “Compressor Aerodynamics”, 1989 Longman Scientific and Technical, 2004 Krieger,
2004.
NASA/CR—2010-216794/VOL1 176
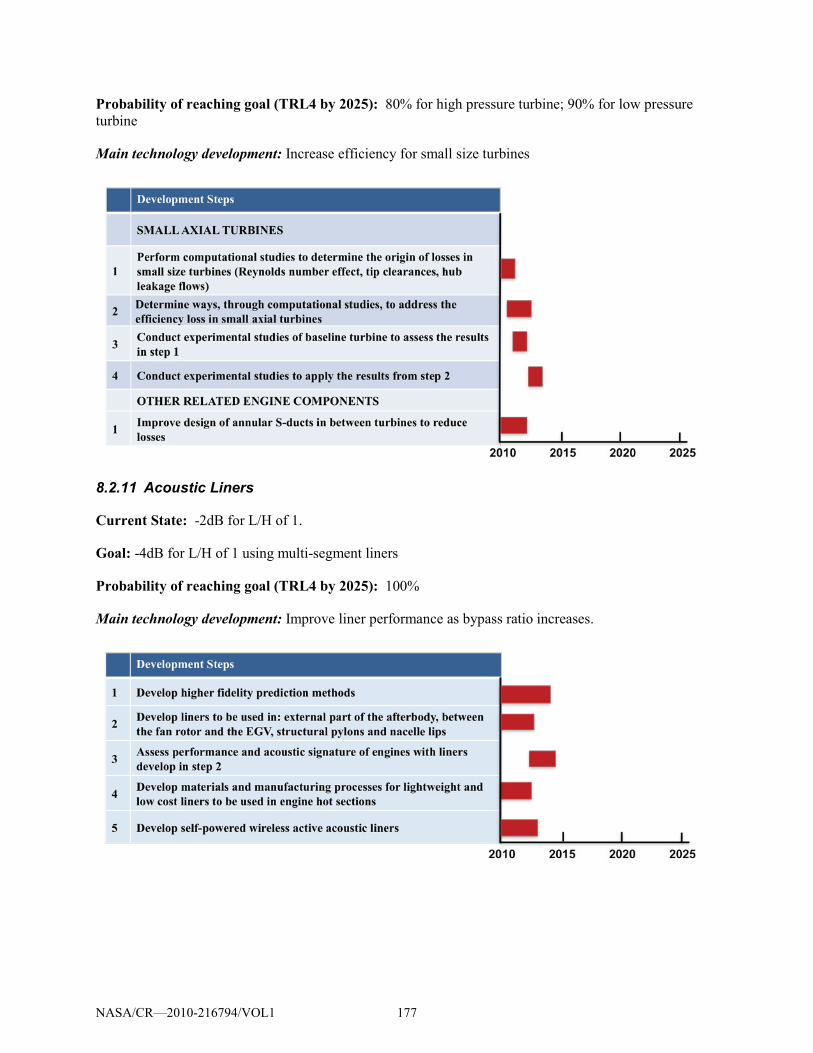
Probability of reaching goal (TRL4 by 2025): 80% for high pressure turbine; 90% for low pressure
turbine
Main technology development: Increase efficiency for small size turbines
8.2.11 Acoustic Liners
Current State: -2dB for L/H of 1.
Goal: -4dB for L/H of 1 using multi-segment liners
Probability of reaching goal (TRL4 by 2025): 100%
Main technology development: Improve liner performance as bypass ratio increases.
NASA/CR—2010-216794/VOL1 177
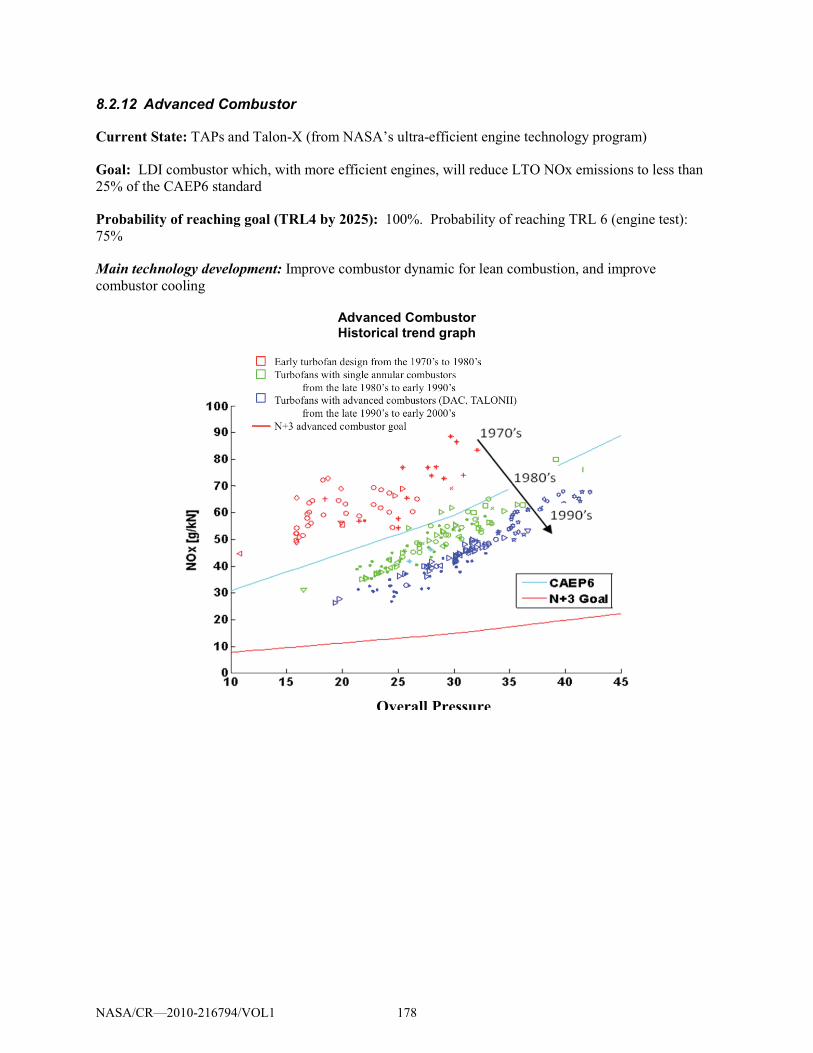
8.2.12 Advanced Combustor
Current State: TAPs and Talon-X (from NASA’s ultra-efficient engine technology program)
Goal: LDI combustor which, with more efficient engines, will reduce LTO NOx emissions to less than
25% of the CAEP6 standard
Probability of reaching goal (TRL4 by 2025): 100%. Probability of reaching TRL 6 (engine test):
75%
Main technology development: Improve combustor dynamic for lean combustion, and improve
combustor cooling
Advanced Combustor Historical trend graph
Overall Pressure
NASA/CR—2010-216794/VOL1 178
REPORT DOCUMENTATION PAGE Form Approved
OMB No. 0704-0188 The public reporting burden for this collection of information is estimated to average 1 hour per response, including the time for reviewing instructions, searching existing data sources, gathering and maintaining the data needed, and completing and reviewing the collection of information. Send comments regarding this burden estimate or any other aspect of this collection of information, including suggestions for reducing this burden, to Department of Defense, Washington Headquarters Services, Directorate for Information Operations and Reports (0704-0188), 1215 Jefferson Davis Highway, Suite 1204, Arlington, VA 22202-4302. Respondents should be aware that notwithstanding any other provision of law, no person shall be subject to any penalty for failing to comply with a collection of information if it does not display a currently valid OMB control number. PLEASE DO NOT RETURN YOUR FORM TO THE ABOVE ADDRESS.
1. REPORT DATE (DD-MM-YYYY) 01-12-2010
2. REPORT TYPE Final Contractor Report
3. DATES COVERED (From - To)
4. TITLE AND SUBTITLE N+3 Aircraft Concept Designs and Trade Studies, Final Report Volume 1
5a. CONTRACT NUMBER
5b. GRANT NUMBER
5c. PROGRAM ELEMENT NUMBER
6. AUTHOR(S) Greitzer, E., M.; Bonnefoy, P., A.; Blanco, E., De la Rosa; Dorbian, C., S.; Drela, M.; Hall, D., K.; Hansman, R., J.; Hileman, J., I.; Liebeck, R., H.; Lovegren, J.; Mody, P.; Pertuze, J., A.; Sato, S.; Spakovszky, Z., S.; Tan, C., S.; Hollman, J., S.; Duda, J., E.; Fitzgerald, N.; Houghton, J.; Kerrebrock, J., L.; Kiwada, G., F.; Kordonowy, D.; Parrish, J., C.; Tylko, J.; Wen, E., A.; Lord, W., K.
5d. PROJECT NUMBER NNX08AW63A
5e. TASK NUMBER
5f. WORK UNIT NUMBER WBS 561581.02.08.03.13.03
7. PERFORMING ORGANIZATION NAME(S) AND ADDRESS(ES) Massachusetts Institute of Technology
8. PERFORMING ORGANIZATION REPORT NUMBER E-17419-1
9. SPONSORING/MONITORING AGENCY NAME(S) AND ADDRESS(ES) National Aeronautics and Space Administration Washington, DC 20546-0001
10. SPONSORING/MONITOR'S ACRONYM(S) NASA
11. SPONSORING/MONITORING REPORT NUMBER NASA/CR-2010-216794-VOL1
12. DISTRIBUTION/AVAILABILITY STATEMENT Unclassified-Unlimited Subject Category: 05 Available electronically at http://gltrs.grc.nasa.gov This publication is available from the NASA Center for AeroSpace Information, 443-757-5802
13. SUPPLEMENTARY NOTES
14. ABSTRACT MIT, Aerodyne Research, Aurora Flight Sciences, and Pratt & Whitney have collaborated to address NASA’s desire to pursue revolutionary conceptual designs for a subsonic commercial transport that could enter service in the 2035 timeframe. The MIT team brings together multidisciplinary expertise and cutting-edge technologies to determine, in a rigorous and objective manner, the potential for improvements in noise, emissions, and performance for subsonic fixed wing transport aircraft. The collaboration incorporates assessment of the trade space in aerodynamics, propulsion, operations, and structures to ensure that the full spectrum of improvements is identified. Although the analysis focuses on these key areas, the team has taken a system-level approach to find the integrated solutions that offer the best balance in performance enhancements. Based on the trade space analyses and system-level assessment, two aircraft have been identified and carried through conceptual design to show both the indepth engineering that underpins the benefits envisioned and also the technology paths that need to be followed to enable, within the next 25 years, the development of aircraft three generations ahead in capabilities from those flying today. 15. SUBJECT TERMS Jet propulsion; Subsonic aircraft
16. SECURITY CLASSIFICATION OF: 17. LIMITATION OF ABSTRACT UU
18. NUMBER OF PAGES
187
19a. NAME OF RESPONSIBLE PERSON STI Help Desk (email:[email protected])
a. REPORT U
b. ABSTRACT U
c. THIS PAGE U
19b. TELEPHONE NUMBER (include area code) 443-757-5802
Standard Form 298 (Rev. 8-98)Prescribed by ANSI Std. Z39-18