multi-sim behaviour in tanzanian telecom market
TRANSCRIPT

MULTI-SIM BEHAVIOUR IN TANZANIAN TELECOM
MARKET: DRIVERS AND ECONOMIC IMPLICATIONS FOR
MOBILE OPERATORS
By
Jackson Joseph Walwa
A Dissertation submitted in partial fulfilment of the requirements for Award of
the Degree of Masters of Science in Applied Economics and Business
Management (MSc. AEB) of Mzumbe University
2019

i
CERTIFICATION
We, the undersigned, certify that we have read and hereby recommend for
acceptance by the Mzumbe University, a dissertation entitled Multi-sim behaviour in
Tanzanian telecom market: Drivers and economic implications for mobile
operators in partial fulfilment of the requirements for award of the degree of Degree
of Master of Science in applied Economics (MSc.) of Mzumbe University.
_______________
Major Supervisor
_______________
Internal Examiner
_______________
External Examiner
Accepted for the Board of MUDCC
______________________________________________________
PRINCIPAL, DAR ES SALAAM CAMPUS COLLEGE BOARD

ii
DECLARATION AND COPYRIGHT
I, Jackson Walwa declare that this dissertation is my own original work and that it
has not been presented and will not be presented to any other University for a similar
or any other degree award.
Signature ……………………………….
Date…………………………………….
© 2019
This dissertation is a copyright material protected under the Berne Convention, the
Copyright Act 1999 and other international and national enactments, in that behalf,
on intellectual property. It may not be reproduced by any means in full or in part,
except for short extracts in fair dealings, for research or private study, critical
scholarly review or discourse with an acknowledgement, without the written
permission of Mzumbe University, on behalf of the author.

iii
ACKNOWLEDGEMENT
I am so grateful to all respondents that gave their time and the details which made
this research possible. I would like to extend my gratitude to Dr. Ilembo for all the
guidance and support that he has given me during the research process and for being
my dissertation supervisor.
My sincere gratitude goes to my wife Beatrice and my sons Ian and Gian, for their
mental and physical support. My deepest thanks goes to my parents, my sisters , my
classmates and friends for motivating and inspiring me to work hard on my study;
and as I can’t mention them all, I would like to send my warm thanks to all who
made it possible for me to complete this work.

iv
DEDICATION
I dedicate this work to my beloved mother Annastazia Malulu, my wife Beatrice
Christian and my sons Ian and Gian.
v
LIST OF ABBREVIATIONS
ARPA Average Revenue per Account
GSMA Global System for Mobile Communications Association
HHI Herfindahl-Hirschman Index
IoT Internet of Things
ITU International Telecommunication Union
MULTSIM Multiple Subscriber Identification Modules
NBS National Bureau of Statistics
NDC National Destination Code
ROI Return on Investment
SIM Subscriber Identification Module
SMS Short Messaging Service
TCRA Tanzania Communications Regulatory Authority
TRA Tanzania Revenue Authority
USSD Unstructured Supplementary Service Data

vi
ABSTRACT
The main objective of this study was to find out the factors of Multi SIM owning and
usage in the mobile services and its economic implications to mobile operators in
Tanzania. The study was carried out on mobiles subscribers in Tanzania using a
random sample of 288 respondents from six mobile operators. The operators
involved were Vodacom, Tigo, Airtel, Halotel, Zantel and TCCL.
Primary data was collected through structured questionnaire which was administered
using random digital dialling (RDD). Secondary data was collected through
published and printed text books, journals, government statistics reports and trusted
websites. Proportionate stratified random sampling was used to select the sample,
random subscribers from each of the mobile operators, the basis of the strata was the
mobile operator.
The collected data were processed and analysed by R software for both descriptive
and statistical analysis. In statistical analysis binary logistic regression model was
used. The findings inferred that operators’ dispersion in quality of service
performance on network availability and product range drives customer to own
multiple SIMs. The multi SIMs users are satisfied with multiple operators as no one
operator provides the combination of their communication needs successfully.
Distribution related reasons like availability of sim swap and airtime points of sales
reduces the customer’s SIM multiplicity. The analysis result also showed that SIM
multiplicity is driven by multiSIM devices, SIM bills been paid by employers and
mobile money service dissatisfaction.
The behaviour of customers to own multiple SIM cards increases the level of
customer spend sharing among operators and reduces customer profitability among
operators. This demands management to improve network quality, promotional
activity and customer care in order to win the customers’ share of spend.

vii
TABLE OF CONTENTS
CERTIFICATION ...................................................................................................... i
DECLARATION AND COPYRIGHT .................................................................... ii
ACKNOWLEDGEMENT ........................................................................................ iii
DEDICATION ........................................................................................................... iv
LIST OF ABBREVIATIONS.................................................................................... v
ABSTRACT ............................................................................................................... vi
LIST OF TABLES ..................................................................................................... x
LIST OF FIGURES .................................................................................................. xi
CHAPTER ONE......................................................................................................... 1
INTRODUCTION ...................................................................................................... 1
1.1 Research Background ............................................................................................. 1
1.2 Statement of the Problem ....................................................................................... 6
1.3 Research Objectives ............................................................................................... 7
1.3.1 Specific Research Objectives .............................................................................. 7
1.3.2 Research Hypotheses .......................................................................................... 7
1.4 Research Significance ............................................................................................ 8
1.5 Scope of the Study ............................................................................................... 10
CHAPTER TWO ..................................................................................................... 11
LITERATURE REVIEW ........................................................................................ 11
2.1 Introduction .......................................................................................................... 11
2.2 Theoretical Literature Review .............................................................................. 11
2.2.1 Multi-SIM ownership ........................................................................................ 11
2.2.2 Behavioural Economics Theory ........................................................................ 12
2.2.2.1 Bounded rationality ........................................................................................ 13
2.2.2.2 Hyperbolic discounting .................................................................................. 15
2.2.3 Multi-brand loyalty ........................................................................................... 16
2.2.4 Share of Wallet .................................................................................................. 18
2.3 Empirical Literature Review ................................................................................ 19
2.3.1 Drivers of Multi-SIM Usage ............................................................................. 19
2.3.2 Determinants of use of multiple SIMs .............................................................. 20

viii
2.4 Telephone Interviews as method of data collection ............................................. 21
2.5 Conceptual Framework ........................................................................................ 21
2.5.1 Description of the conceptual framework ......................................................... 24
CHAPTER THREE ................................................................................................. 26
RESEARCH METHODOLOGY ........................................................................... 26
3.1 Introduction .......................................................................................................... 26
3.2 Area of the study .................................................................................................. 26
3.3 Research design .................................................................................................... 26
3.4 Target populations and Sample Size .................................................................... 27
3.4.1 Target Population .............................................................................................. 27
3.4.2 Sample Size ....................................................................................................... 27
3.5 Sampling procedures ............................................................................................ 28
3.6 Data Collection Methods...................................................................................... 29
3.6.1 Primary Data ..................................................................................................... 29
3.6.1.2 Questionnaire ................................................................................................. 29
3.7 Data Analysis Methods ........................................................................................ 30
3.7.1 Research Statistical Model ................................................................................ 30
3.8 Ethical considerations .......................................................................................... 31
CHAPTER FOUR .................................................................................................... 33
RESEARCH FINDINGS AND ANALYSIS .......................................................... 33
4.1 Introduction .......................................................................................................... 33
4.2 Demographic profiles of respondents .................................................................. 33
4.2.1 Gender distribution of respondents ................................................................... 34
4.2.2 Age distribution of respondents ........................................................................ 34
4.2.3 Level of education of respondents .................................................................... 35
4.2.4 Employment status of respondents .................................................................... 36
4.3 Mobile usage profiles of respondents .................................................................. 38
4.3.1 Tenure on mobile service .................................................................................. 38
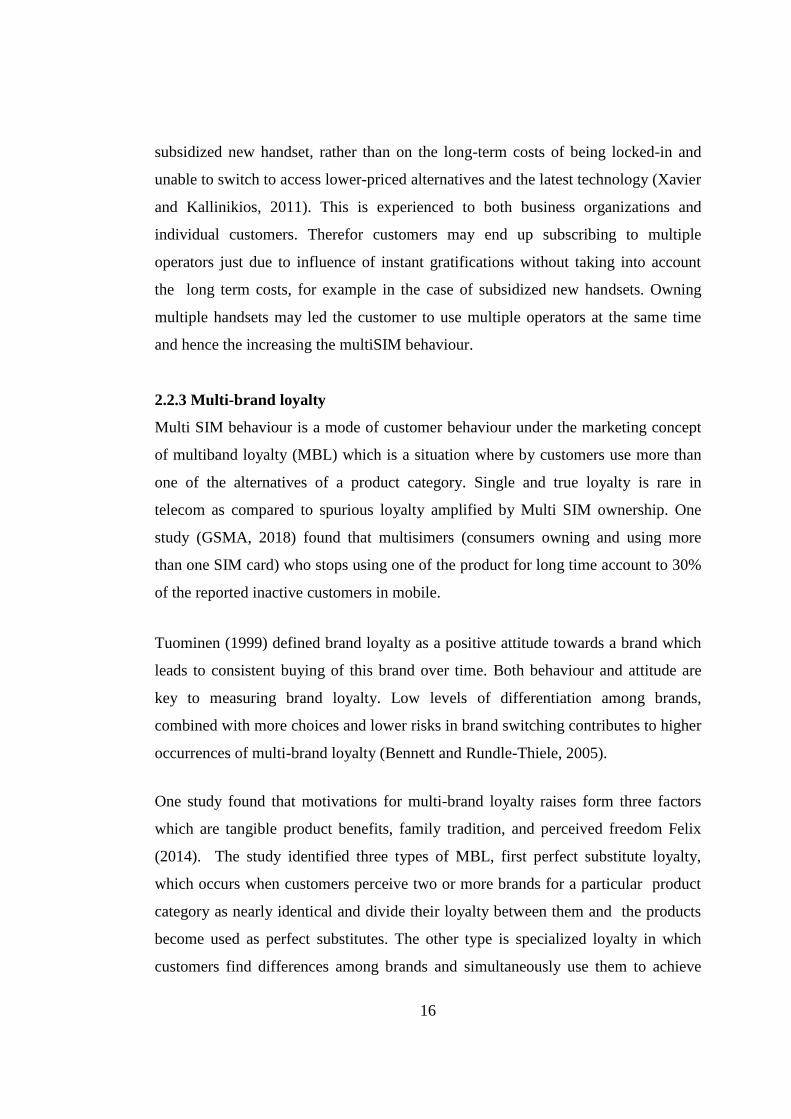
4.3.2 Mobile Products Usage ..................................................................................... 39
4.4 Number of Individuals vs Number of SIM cards ................................................. 40
4.5 Share of Main SIMs per operator ......................................................................... 41

ix
4.6 Share of Wallet per Operator ............................................................................... 42
4.7 Modes of MultiSIM.............................................................................................. 43
4.8 Descriptive analysis MultiSIM usage reasons ..................................................... 43
4.9 Binary Logit Model Results and Interpretations .................................................. 44
4.10 Marginal Effects and Interpretations .................................................................. 47
4.10.1 Marginal Effects .............................................................................................. 47
4.10.2 Interpretations of marginal effects .................................................................. 48
CHAPTER FIVE ...................................................................................................... 50
SUMMARY, CONCLUSION AND RECOMMENDATIONS ............................ 50
5.1 Introduction .......................................................................................................... 50
5.2 Summary .............................................................................................................. 50
5.3 Conclusions .......................................................................................................... 52
5.4 Limitations of the Study ....................................................................................... 53
5.5 Recommendations and Policy implication ........................................................... 54
5.5.1 Policy implication ............................................................................................. 54
5.5.2 Managerial Implication ..................................................................................... 54
5.5.3 Recommendations for further study .................................................................. 56
REFERENCES ......................................................................................................... 57
APPENDICES .......................................................................................................... 63
Annex 1. Introduction letter ....................................................................................... 63
Annex 2: Questionnaire for mobile phone users. ....................................................... 63

x
LIST OF TABLES
Table 2. 1: Concepts to indicators mapping ............................................................... 23
Table 3. 1: Sample size Distribution .......................................................................... 29
Table 4. 1: Gender of respondents ............................................................................. 34
Table 4. 2: Age of respondents .................................................................................. 35
Table 4. 3: Education level of respondents ................................................................ 36
Table 4. 4: Employment Status of respondents .......................................................... 36
Table 4. 5: Tenure on mobile service of respondents ................................................ 38
Table 4. 6: Mobile Products Usage of respondents .................................................... 39
Table 4. 7: Product usage penetration by operator ..................................................... 40
Table 4. 8: Respondents’ Number of SIMs ................................................................ 41
Table 4. 9: SIMs and Main SIMs per operator ........................................................... 42
Table 4. 10: Revenue share per operator .................................................................... 42
Table 4. 11: Modes of MultiSIM ............................................................................... 43
Table 4.12: Frequency for the dependent variable .................................................... 44
Table 4.13: Logistic Model Fit Assessment ............................................................... 45
Table 4.14: Logit Model Estimates ............................................................................ 45
Table 4. 15: Marginal effects ..................................................................................... 47

xi
LIST OF FIGURES
Figure 2. 1: Conceptual Framework ........................................................................... 22
Figure 4. 3: Prompted Reasons for using Multiple SIMs........................................... 44

1
CHAPTER ONE
INTRODUCTION
1.1 Research Background
The global number of mobile connections of individuals excluding Internet of things
(IoT) is reported to be 7.8 billion as of 2017 while the unique users reached 5.0
billion the same period (GSMA Mobile Economy, 2018). This is equivalent to a ratio
of around 1.5 SIMs per individual user. Ownership of multiple SIM card is a
common phenomenon among mobile service users especially in developing
countries, in Sub-Saharan Africa the SIM ratio is (1.7) which is higher than the
global average. Mobile customers use multiple SIMs from different mobile
operators, mostly through dual-SIM handsets. (GSMA, 2018).
Tanzania Telecommunications service sector has a total of 40.38 million
subscriptions according to Tanzania Communications Regulatory Authority (TCRA)
statistics as March 2018. (TCRA Quarterly Communications Statistics, 2018).
The main products of operators in Tanzania are voice calls, short messaging service
(SMS), data and mobile money services. Voice subscriptions is 40.38 million, data
subscriptions is 19 million and Mobile money services have 19.3 million accounts as
of march 2018. (TCRA, 2018)
Tanzania telecommunication sector contributes 2.1% of the national GDP as of Q3
2016 (NBS Gross domestic product by activity at current prices, 2017). The inflation
rates per sector up to December 2016 shows that the communication service rate was
declining at -0.9% making it the only sector at the time which had negative inflation
rate while the other sectors inflation rates were positive. The overall inflation rate in
December was at 5.0%. The declining inflation rate of communication sector can be
attributed to price wars to win market share among the telecommunication players in
the country. Price wars has resulted into drop in price driven by operators trying to
come up with more affordable offers than competition to attract consumer especially

2
on data products. According to research done by Research ICT Africa (RIA, 2016),
Tanzania had the lowest data prices in Africa having the price of 0.9 USD per GB.
This means that operators in Tanzania depend heavily on price competition as a
driver for revenue growth and market share gain.
This research analyses, the drivers and their weights on consumer preference that
operators in Tanzania telecom market can exploit to improve their profitability and
ARPU share which is the real value driver rather than market share alone. Tanzania
Market provides a good field to assess such drivers as the industry competition in
this sector is fierce. The Tanzania telecom market’s Herfindahl-Hirschman Index
(HII) is well within oligopoly market structure with a value of 2600, which indicates
a competitive market space.
The government of Tanzania requires that SIM registration are done using one of
the authorized IDs like national ID, Voters ID, Driving license and Zanzibar ID but
this does not restrict people to own multiple number of SIM cards they what as
longer as they are all registered using a valid ID (TCRA, 2018) .
Tanzania mobile communication service has important contribution to both
economic growth and social development. In 2016 the total value added generated by
the mobile operators alone, which include direct and indirect and productivity
effects, was around $2.5 billion, equivalent to 5.2% of GDP. The mobile sector also
employs more than 1.5 million people on direct and indirect basis, which
corresponds to 2.6% of the population. The government also uses mobile as a
channel to propel its e-government strategy. Public institutions use SMS and
unstructured supplementary service data (USSD) platforms to deliver services to
citizens. Also government institutions like Tanzania revenue authority (TRA) and
police use mobile money services collect payments. Mobile network investment is
significant, mobile operators have invested around TZS6 trillion ($2.6 billion) in the
country, primarily in network infrastructure and increasingly in new platforms that

3
enable digital services, such as mobile money and machine to machine (M2M)
services.(GSMA,2018)
With the growth of usage of data through mobile broadband Tanzania has seen fast
growth in smartphone penetration. The current figures shows that the mobile
operators has a total of more than 19 million users as of end 2017 (TCRA, 2018).
Data enabled device are advanced and most have dual SIM capability. So the growth
of data usage also pose a challenge of multiple SIM usage. However at the same time
it gives companies an access to a digital channel to connect with their customer and
an opportunity for gleaning insights to understand better their needs (Mayeh, 2012).
Such insights include that from mining data from digital source such as social media
complaints and reviews. For telecom companies this means to enhance better
customer experience and reduce non-loyalty or multi-loyalty behaviour which is in
form of multiSIM usage.
A study done on university students revealed that more than 30% of the students
surveyed at UDOM University had more than one SIM card (Anatory, 2015). There
have been a number of marketing campaigns among mobile operators to emphasize
their users to keep only one SIM card (Airtel, 2018) which hinged on lower rates of
call across networks. Such campaigns shows the prevalence of multiSIM usage in
Tanzania as opposed to single Sim usage. TCRA significantly lowered the
interconnect costs by 38% from 26 Tshs per minute to 16 Tshs per minute starting
from Jan 2018 (TCRA, 2017). This was followed by operators dropping their ex-net
tariff. It would have been expected that people can use only one SIM card to call
across networks and cater for all the commutation needs by using a single SIM at
lower rates however the number of subscriptions have not declined.
Tanzania is among the top 10 M2M markets by connections in Sub-Saharan Africa,
with 397,000 connections, equivalent to 1% of total mobile connections, at the end of
2018 (GSMA,2018). A number of M2M use cases are beginning to emerge in the
country and are expected to drive growth in the coming years. These new uses case

4
increases the number of SIM cards reported from operators and can increase the
multiSIM ratio.
The behaviour of mobile users to own multiple SIMs makes the official statistics
reported by telecom authorities based on SIM subscription among operators to be
overstated if are to be considered as number of individuals using mobile services. In
Tanzania TCRA reported the total number of subscription to have reached 42 million
as of March 2018. This is almost twice the eligible population of age 15 or above
which is around 20 million (NBS, 2018). Therefore, the subscriptions numbers do
not show the real number of unique people who have access to mobile service in the
country. The behaviour of the customer using multiple SIM cards makes it difficult
for operators to assess the value of their customers based on service usage. Customer
usage in this case is split among SIMs from different operators. Return on investment
(ROI) of decisions such as planning for capacity expansion and new coverage
services investment are highly impacted by maintaining customer value (Firli,
Primiana & Kaltum, 2015). In the case of multiple SIM usage, the real value of the
customer is split among operators hence decreases as SIM ratio increases.
The ability for customer to move among networks without changing numbers,
Mobile number portability (NMP), was launched in Tanzania in 2016.
NMP would have lowered the Multiple SIM usage behaviour through reducing
rotational churn. Rotational churn behaviour is when the same customer stops using
one number and starts using another number in the same accounting period, hence
counted as both churned and reconnected. Besides NMP the number of SIM
subscriptions has kept on growing.
MultiSIM ownership in telecom networks (using one device with dual SIM or
separate two devices) apart from providing consumers with freedom of choice and
enable them to switch in real time on services from different operators, is a source of
declining revenue per account (ARPA) among operators. APRA decline is mainly

5
due to customer’s personal arbitrage where price discrimination and product
differentiation becomes difficult to implement. This is due to possibility of a
consumer accessing bundles that were targeted to another consumer since their usage
profiles are split among multiple SIM cards.
Multi-SIM ownership is a form of multi-brand loyalty (MBL) where customers are
loyal and use more than one brand in the same category. There have been studies like
that from Mamun (2015) and Felix (2014) on areas of multi-brand loyalty. The
studies showed that what influences such consumer behaviour are factors like
customer freedom and social norms have a strong relationship to such choices.
MultiSIM ownership enables customer to be multi-brand loyal since it facilitates ease
of switching among network mobile operators. Agustin and Singh (2005) found that
achieving single brand loyalty and hence wining customer value share is influence by
three factors which are transactional satisfaction, trust and relational value which is
the consumer’s perceptions of the benefits enjoyed versus the perceived cost in the
maintenance of an ongoing exchange relationship.
This research is aimed at examining the drivers and their contribution weights in
influencing customers into MultiSIM behaviour. This research is set to present in
particular the preference consumer have towards choice of services from multiple
operators in Tanzania through analysis of qualitative data collected using
questionnaires administered using telephonic survey. This has implication on
understanding user’s preference that can help mobile firms and other mobile industry
players to understand the multiSIM drivers for their decisions. The research covers
personal characteristics that can influences customer decisions to brand choices of
whether to be single brand loyal or being multi brand loyal. The research focuses on
factors associated to product and service choices such as design, performance, prices
and availability. Market competition as well may not only influence reduction in
price of goods due increase in supply but also may lead to increase in customers with
a high variety-seeking propensity.

6
1.2 Statement of the Problem
The multiSIM behaviour is a common to find phenomenon in Sub Sahara countries
where the SIM ratio is 1.7 (GSMA, 2018). The phenomenon has been significantly
spurred by the advancement in technology and falling prices of mobile devices most
of which are dual SIM. Technological advancement has also enabled the emergency
of eSIMs mobile phones. Such kind of phones enable the customer to switch among
multiple network mobile operators (MNO) in one devices and in real time without
the need of physical SIM cards. The use of multiple SIM is a challenge to incumbent
market players as it causes dilution of existing customers’ average revenue per user
(ARPU) due to split of spend among operators. Parallel to this it also poses an
opportunity to new and small players to be used as secondary SIMs. This enables the
new operators to share the same market with established incumbents. Research has
shown the existence of multiple SIM users in Tanzania owning and using SIM cards
from different operators at the same time (Anatory, 2015). This research has covered
drivers influencing customers to own and use multiple SIM cards in Tanzania. It
examines particularly the contribution weights of these drivers on the multiSIM
behaviour.
The reasons that drive multiple SIM usage are dependent on local mobile market
environment and societal factors and so are particular to each country (Sutherland,
2009). This research was aimed at analysing such drivers in Tanzania telecom market
which is highly competed among 7 players as of 2018. (TCRA, 2018). The players
are Vodacom, Tigo, Airtel, Halotel, Zantel, TTCL and Smart. Understanding the
extent and the reasons of customers’ transition from single brand to multiple brands
is essential for increasing customer wallet share on company’s products and
positively affect the company’s financial profitability.
The Tanzania telecom market is highly competed by seven players with the top three
having comparatively close subscriber’s market shares, these are Vodacom 32%,
Tigo 28% and Airtel 27%. Other operators include Halotel 9%, Zantel 3%, TTCL
1% and Smart (0.3%). The mobile money market shares are Vodacom 39%, Tigo

7
32% and Airtel 21%. Other operators include Halotel 6%, Zantel 2%, and TTCL
0.13%. Smart does not have mobile money services. (TCRA, 2018).
1.3 Research Objectives
To examine factors for multiple SIM cards owning and usage among mobile phone
subscribers and its economic implication to mobile service providers in Tanzania.
1.3.1 Specific Research Objectives
Specifically the study is focused on the following key issues:-
i. To examine the factors that influence the owning and usage of multiple SIM
cards in Tanzania.
ii. To determine the multiplicity of SIM cards among different demographic
profiles Tanzania.
iii. To estimate the share of revenue among mobile operators in Tanzania.
1.3.2 Research Hypotheses
The study is guided by the following null hypotheses:
H01: There is no relationship between quality of services (QoS) dispersion and
MultiSIM owning and usage
H02: There is no relationship between availability of multiple SIMslots Handsets and
MultiSIM owning and usage in Tanzania.
H03: There is no relationship between employer paying SIM bill and MultiSIM
owning and usage in Tanzania.
H04: There is no relationship between availability of SIM swaps points and
MultiSIM owning and usage in Tanzania.
H05: There is no relationship between ease of SIM availability and MultiSIM
owning and usage in Tanzania.

8
H06: There is no relationship between Friends and Family influence and MultiSIM
owning and usage in Tanzania.
H07: There is no relationship between subscriber ARPU and MultiSIM usage in
Tanzania
H08: There is no relationship between ease of airtime availability and MultiSIM
usage in Tanzania.
H09: There is no relationship between satisfaction in promotional offers and
MultiSIM usage in Tanzania.
H010: There is no relationship between affordability of on-net calls (same network
calls) MultiSIM usage in Tanzania.
H011: There is no relationship between satisfaction in network availability and
MultiSIM usage in Tanzania
H012: There is no relationship between quality of customer service and MultiSIM
usage in Tanzania
H013: There is no relationship between quality of mobile money services and
MultiSIM usage in Tanzania
1.4 Research Significance
The study is significant endeavour in providing a comprehensive snapshot of drivers
of multiple SIM usage in Tanzania. The study intends to benefit the business
stakeholders, customers and the policymakers. Business will benefit by having
valuable data and methods to assist them in marketing and consumer decisions. This
is achieved through understanding the phenomena of consumer using multiple

9
mobile providers, its growth drivers and how it distorts indicators like market share.
This enables them to measure the real value of the telecom spend of their customers
and how to generate a fair share in revenue. Utilization of such findings and how to
track them will be of importance in business initiatives such as new product
development, pricing decision making and strategy formulation. It is also critical in
market sizing for both new entrants and incumbent in planning for capacity
expansion and network coverage investments.
The insights gained provides marketing practitioners with suggestions on how to
achieve customer loyalty in increasingly competitive marketplaces like Tanzania.
Customer loyalty contributes to profitability uplift and long-term survival of
companies (Agustin and Singh, 2005). Achieving single brand loyalty and winning
customer share of wallet is therefore critical for company’s existence as it directly
impacts its bottom-line returns. Understating the loyalty determinants to in particular
target segment and relational context is a crucial to gaining customer loyalty and
hence influencing Single SIM usage.
Competitive market environments characterized by customers with more complex
and dispersed behaviours and altitude patterns needs deeper customer loyalty
comprehension to achieve commercial goals. Overall, the findings of this research
address an important gap in the literature by integrating both multi brand loyalty
(MBL) and fast changing services of telecommunication markets.
Policymakers will benefit by understating what is the real number of mobile
ownership in Tanzania. That is the real fraction of the population that own mobile
SIMs as opposed to mere number of mobile subscriptions. This is key input to be
factored in for a number of decisions such sample selections when doing mobile
survey to represent the population, or planning to roll out government initiatives
based on mobile phones penetration such as E-government projects.

10
1.5 Scope of the Study
This study covers mobile subscribes of 6 mobile operators in Tanzania. The mobile
operators that are included are those which have at least one percent (1%) of
subscriber market share in the country. These operators are Vodacom, Tigo, Airtel,
Zantel, Halotel and TTCL. The study is limited to investigate drivers of customers to
use multiple SIM cards at least once in the past three months. The three moth’s
definition is in alignment with the official definition of the International
Telecommunication Union (ITU) definitions of an active subscription. The study
uses random digital dialling (RDD) approach therefore its scope covers all the
mobile users in Tanzania who are subscribed to the above mentioned six operators.
Since the RDD method uses random selection then the sample within one operator
are also random.
All the six operators used in this study are statistically represented. Stratified
clustering approach was used to get a share of samples which is representative of the
market share of the respective operators.
11
CHAPTER TWO
LITERATURE REVIEW
2.1 Introduction
This section focuses on understanding the coverage of other studies available on the
topic. This chapter consists of four sections, section 2.1 focuses on theoretical review
defining Multi-SIM behaviour, its forms and adoption respectively. Section 2.2
focuses on empirical review of Multi-SIM behaviour and its implications to mobile
operators. Section 2.3 reviews literature on telephonic interviews, particularly on
modes of delivery and reliability. Section 2.4 presents conceptual framework on
drivers of multiple SIM usage by mobile consumers.
2.2 Theoretical Literature Review
2.2.1 Multi-SIM ownership
Multi-SIM behaviour is a consumer behaviour where by a customer keeps and uses
more than one SIM card concurrently in a defined period time. The active mobile
subscriptions is counted on 90 days basis in telecom as per definitions of world
Telecommunication/ICT Indicators (ITU, 2010). The global tele-density is now
around 103 excluding IoT (GSMA, 2018). Even a figure of 100 per cent mobile
phone ownership is not possible. There are always people who will not use phones
due to various reasons as young age, too old and too disabled to use a mobile phone,
poverty, some are forbidden to use since are in asylums and prisons and those who
opt not use the service voluntarily (Sutherland, 2009). So for sure the tele-density is a
measure of number of SIM connections and does not give any information of the real
number of users unless the multiSIM ratio is given.
Sutherland (2009) outlined on his policy research paper the reasons for people to use
multiple phones and SIM cards and telephone numbers includes overcoming patchy
or poor network coverage, avoiding network congestion, saving money by making
on‐net calls, benefitting from discounted or bundled tariffs for voice or for data,
receiving calls or voicemail to an older number. He proposed that detailed research

12
to identify the relative importance attached to each of these should be done
independently on each particular market as each market is unique.
Valdecantos (2009) classified the drivers of Multi SIM behaviour into four groups of
which were those related to operators, mobile market, mobile ecosystem and society.
Operator related factors includes actions of operators such as promotional offers and
pricing strategies that use the on net discounts advantage as an attempt to gain
market share drive multiple SIM usage.
Drivers grouped as Mobile ecosystem includes availability of unlocked handsets,
availability of multiple SIM handsets and availability of niche devices such as SIM-
slot net-books and blackberries. The handset is a key driver in growth of Multi SIM
behaviour, it reduced the cost of initiation especially in the Dual SIM phone mode of
a multi-Simmer. Other modes of Multi SIM based on handset include Multi-SIM by
physically switching SIM cards in their phones, having multiple phones.
Mobile market drivers are quality of services, coverage and aggressive acquisition by
new market entrants or followers as a result of large market share gap among
operators. Multiple SIM occurrence is also attributed to social composition, norms,
rhythm of life and cultural specific these also include a number of non-rational
factors such as social status, image and relationships (Valdecantos, 2008).
2.2.2 Behavioural Economics Theory
Behavioural Economic Theory (BET) deals with variables affecting decision making
and consumer demand (Francisco, Madden, & Borrero, 2009).Neoclassical economic
theory assumed that human actors have stable preferences and engage in maximizing
utility. Consumer choice were therefore able to be predicted by using expected utility
optimization. Samuelson (1947) suggested an approach to measure utility in what is
known as the theory of revealed preference. The theory drive preference from
observing agents make choices.
Therefore what drives satisfaction for the user when uses a good are the
characteristics of that good he choices as compared to alternatives. (Lancaster, 1966).

13
These neoclassical economics approaches assume that human decision-makers are
fully rational. However theoretical approaches and experimental economics has
shown that human nature does not exhibit fully rationality rather bounded rationality
(Dhami, 2016).
2.2.2.1 Bounded rationality
Human decision makers are not expected utility maximizing decision makers who
can process all available information and follow the rules of classical statistics. That
means they are not fully homo economicus as assumed to be by neoclassical
economics. (Dhami, 2016). The fact that human exhibit bounded rationality can be
explained based on three categories of rationality limitations. These limitations
include judgement heuristics, cognitive biases and framing effects (Tom, 2011).
Judgement heuristics are ways in which people make decisions by systematically
selecting only part of the available information and hence make decisions that are
both fast and minimize the amount of information used in processing the decision.
These selective use of information implements what is called rule of thumbs.
(Dhami, 2016). When the decision environment is complex relative to their mental
and computational capabilities consumers often take short cuts such as what others
say or do. For example, terms and usage limits, especially presented in fine print are
unlikely to impact on decisions (Xavier and Kallinikios, 2011). Normally customers
would therefore register on offers from different operators due to the reasons related
to friend’s recommendations and operator and end up owning multiple operators.
Heuristics can be divided into four groups which are anchoring, availability,
representativeness, and herd behaviour.
Cognitive biases include overconfidence and over-optimism, status quo bias, loss
aversion and confirmation bias. One study on the role of cognitive biases for users’
decision-making in usage of information systems suggested that a proper application
of cognitive biases can direct decisions to a desired outcome (Amirpur, 2017)

14
Framing refers to the effects of context and presentation, which can change how
people process information and make decisions. Tversky and Kahneman (1981)
studied the effect of variations in framing and illustrated that a decision-maker
adopts a frame which is controlled by both the formulation of the problem and by
his/her norms, habits, and personal characteristics.
Because of these cognitive limitations and the systematic ways in which they can be
studied the real people who are subscribers to mobile networks make decisions that
are both irrational and predictable. In this research the model of choice of using
multiple mobile service is based on telecom service drivers such as of call quality.
Also it includes contextual parameters such as level of perceived customer services,
convenience and individual characteristics.
It should be noted that the criteria used by consumer to choose goods or bundles are
partly influenced by rationality based on functional needs and partly by cognitive
limitations. Therefore the models of customer choice of SIM made by a function of
features, context, circumstance and characteristics of the subscriber. The choice
criteria which does not influence satisfaction normally have less impact on re-
purchase and loyalty and wallet share. It is only the choice criteria which also
influences satisfactions have greater impact of re-purchase and hence customer
loyalty and wallet share which are key in service sector like the telecommunications.

15
Customer choice can change due to situation, context and task-specific factors like
time-pressures (Dhar, Nowlis & Sherman, 2000) and (Adamowicz & Swait, 2001).
Multiple SIM cards allow the customer to switch in real time among the operators
that suit the context and specific tasks. Christensen (2015) argued that these tasks the
customer needs to accomplish in a specific context are called jobs to be done.
These are tasks which the customer wants to accomplish and thus hires the solution
to perform the job. In this analogy SIM cards can be regarded as alternative solutions
that are hired for specific task that they best satisfy. Christensen (2015) suggested
that customers are not loyal to companies or brands but they are loyal to the jobs they
want to be done so they hire and fire brands (as alternative solutions) depending on
the job requirement which take into account functionality of features, context and
circumstance.
2.2.2.2 Hyperbolic discounting
Intertemporal choice indicates a trade-off between utility over different time periods.
This is explained by a subjective discount rate that is the rate by which people
discount future utility depending on the points in time it is realized. Discounted
utility theory uses assumption that people discount all future utilities at a constant
rate, which implies that preferences are stable across time. An exponential function
can be used to explain such behaviour. However the exponential function cannot
accommodate an instant gratification effect because it does not decline more heavily
in the short run. However, a hyperbolic function can capture the fact that today’s
preferences differ from tomorrow’s. People may employ a higher rate when
discounting in the short run hence exhibit to present bias.
In telecommunication services both consumers and service providers may tend to be
present biased when making decisions overvaluing immediate costs or benefits
against future costs or benefits.
For example, consumers may enter long-term telecommunication contracts because
they place more value on the immediate benefits of the offer, such as a heavily
16
subsidized new handset, rather than on the long-term costs of being locked-in and
unable to switch to access lower-priced alternatives and the latest technology (Xavier
and Kallinikios, 2011). This is experienced to both business organizations and
individual customers. Therefor customers may end up subscribing to multiple
operators just due to influence of instant gratifications without taking into account
the long term costs, for example in the case of subsidized new handsets. Owning
multiple handsets may led the customer to use multiple operators at the same time
and hence the increasing the multiSIM behaviour.
2.2.3 Multi-brand loyalty
Multi SIM behaviour is a mode of customer behaviour under the marketing concept
of multiband loyalty (MBL) which is a situation where by customers use more than
one of the alternatives of a product category. Single and true loyalty is rare in
telecom as compared to spurious loyalty amplified by Multi SIM ownership. One
study (GSMA, 2018) found that multisimers (consumers owning and using more
than one SIM card) who stops using one of the product for long time account to 30%
of the reported inactive customers in mobile.
Tuominen (1999) defined brand loyalty as a positive attitude towards a brand which
leads to consistent buying of this brand over time. Both behaviour and attitude are
key to measuring brand loyalty. Low levels of differentiation among brands,
combined with more choices and lower risks in brand switching contributes to higher
occurrences of multi-brand loyalty (Bennett and Rundle-Thiele, 2005).
One study found that motivations for multi-brand loyalty raises form three factors
which are tangible product benefits, family tradition, and perceived freedom Felix
(2014). The study identified three types of MBL, first perfect substitute loyalty,
which occurs when customers perceive two or more brands for a particular product
category as nearly identical and divide their loyalty between them and the products
become used as perfect substitutes. The other type is specialized loyalty in which
customers find differences among brands and simultaneously use them to achieve

17
different needs or change their purchases to fit to different contexts. The third one is
biased loyalty, which develops when customers have differential preference to
several brands, which leads to one brand to have more repurchases than the other.
However all the brands in customers loyalty set are alternatives to each other and
recommended to friends and family.
Additionally, Walsh et al. (2007) illustrated that situations like information overload
and ambiguous product information may prompt consumers to become less loyal to a
single brand therefore revert to multiple brand loyalty. The benefit of flexibility
attracts customer to be multi brand loyal. In a study of loyalty programs, Xiong et al.
(2014) found that customers use multiple loyalty programs in order to benefit from
flexibility in accumulating their loyalty points.
Loyal consumers are less price sensitive compared to non-loyal consumers. Yoon
and Tran (2011) showed that value-conscious customer are loyal than deal-prone
customers, and also variety-seeking non loyal are insensitive to pricing compered to
deal-prone non loyal customers. Deal proneness tends to make customer move from
one brand to another without taking into account the full value in long term, while
the value conscious customers stay loyal. This effect can be explained in terms of
customer irrationality in decision making, customers are present-biased as is
explained through hyperbolic discounting model of delay discounting.
Dick and Basu (1994) suggested that multi-brand loyalty is derived from individual’s
strong attitude toward brands with little perceived differentiation, so brands are
regarded as alternatives to each other and are viewed as equally satisfying. This may
lead to MBL because the alternatives have the same perceived satisfaction.
Telecommunication services providers are likely to be undisguisable in their core
services since they have a similar product mix. In Tanzania the mobile operators
offer the same core service which are voice, SMS, data and mobile money. The
differentiation can only be derived from their different quality of service and
customer service levels. Therefore Telecommunications is an industry where the
tangible product benefits are not differentiated, the preference of multi brand loyalty

18
is high hence operators have to rely on perceived freedom and superior customer
experience to command a leading value share.
2.2.4 Share of Wallet
Share of wallet is the percentage of customers’ spending in the category or product
line that is allocated to the brand of interest. The method of calculating the share of
wallet can be based on a method known as Wallet Allocation Rule (WAR)
(Keiningham, Aksoy, Williams and Buoye, 2015). Share is calculated by summing
the total spend of the customers times weighted rank of each brand by using
customers ranking of different brands and their values. This approach is adopted to
estimate share of revenue among operators in Tanzania.
SHARE OF WALLET=
The operator important goal in a multiSIM market is to increase share of revenue
(percentage of customer’s spend on its network) as opposed to merely share of
subscriptions or SIMs. Operator strategy towards multiSIM ownership and
maximizing their share of spend depends on the operator’s market position. For
leaders and established incumbents pre-emptive and share win back strategies are
useful. For new entrants aggressive market attacks are favourable as they lead to fast
base increase and hence revenue increase (Valdecantos, 2009). EY's survey called
Global telecommunications study (2015) shows that new points of differentiation are
key drivers for digital players in telecommunications sector in order to maximize
their share of customer spend.
The brand’s relevance to customer needs in the moment is increasingly influencing
people buying decision far beyond brand’s loyalty. Thanks to digital transformation,
customer are more exposed to information about brands and their products and
services. Clarity of product information is key in a competitive market with flooding
product marketing.

19
2.3 Empirical Literature Review
2.3.1 Drivers of Multi-SIM Usage
Studies done in India as of 2015 shows that Multi-SIM users were growing at rate of
62% over the past two years. This finding cut across all social economic classes with
the high class been the fastest growing. Also it showed that multiple SIM usage was
high among smartphone users.
The drivers for carrying and using more than one SIM card included availability of
service, the need of quality voice and data services and pricing plans (Family, 2012).
Brand loyalty was identified as one of the factors of MultiSIM usage among
customers, according to Vebrova, Venclová1and Rojíkl (2016), most loyalty
customers have only one SIM card and 73 % of them use a tariff. And also for highly
involved customers 80% own only one SIM card. Multi-SIM usage is a form of
multi-brand loyalty and a real-time form of brand switching.
The GSMA’s Tanzania rural coverage pilots Performance report (GSMA, 2018)
found that consumers in locations with less reliable network, use a number of tactics
to increase reliability one being use of Multiple SIMs. Users own multiple SIMs, to
get coverage in different areas. The respondents who were rural subscribers revealed
that they had one particular network SIM to cover them when they are in the village
and another network SIM to cover them when they travel to more urban areas.
A study carried out by Kubi (2010) on the factors that influence the Ghanaian
consumer to use multiple SIM cards found out that multiple SIM usage are
influenced by factors such as overcoming poor network coverage, saving money by
making on-net calls, benefiting from discounted or sales promotions and avoiding
network congestion. The study found that the respondents who used Multiple SIM
due to those reason were 26% (overcoming patchy or poor network coverage), 21 %(
Saving money by making on-net call), 19% (Benefiting from offers or sales
promotion were 19%).

20
A study by Family showed that Dual SIM handsets where more popular among SIM
cards users. The Family study has found that 61 percent of handsets used by multi-
SIM owners are dual SIM. (Family, 2012).
Device Atlas for Q2 2017, showed that developing countries topped the list of
Multiple SIM devices. India leading with 68% , Nigeria 49% while developed
markets like USA, Canada, and Australia had only between 3% to 4% of dual SIM
handsets.
2.3.2 Determinants of use of multiple SIMs
Mamun (2015) on a research done targeting Bangladesh university students found
that 77.8% of undergraduate students and 93.6% of graduate students are using
multiple SIMs to fulfil their necessity to communicating with more persons by
minimizing costs and experiencing better network performance. The same data was
used to prove, using The Chi-Square test, that there is significant difference in using
multiple SIMs by the students of different level of education in Bangladesh. The
research further found that among the respondents, users of dual SIM cards were the
majority (46%) followed by triple SIM users (41%) and single SIM users (13%).
Also with regard to gender influence in using Multiple SIMs, The male respondents
were found to have high percentage of multiSIM usage than females, ninety five
percent and seventy five percent respectively.
Kumar, Vani, and Vandana (2011) found that service quality is the most important
factor influencing the mobile subscriber intention to switch service provider
compared to promotional offers and service affordability.
The mobile operator selection modelled as a complex multi-criteria decision problem
using super-matrix found different expectation for different clusters of users
depending on their changing expectations and context which it makes it difficult for
the customers to choose one operator who suits all occasions and expectations
(Hemmati, 2013).

21
Social pressure or influence on mobile adoption was found to be an important factor
in increasing the probability of adoption, with an odds ratio of 1.37. That means
adopting a mobile phone increases by 37% for each additional member in the
network having adopted a phone (Silva, 2009). It was found, in the same study, that
the likelihood of adoption increases significantly, with an odds ratio of 4.86 when the
number of persons owning a phone among the closest five contacts increases from
none to five. Social influence in mobile adoption plays a role of exerting pressure to
individuals from peers to adopt and such groups help to generate benefits associated
to social networks that are tied in with economic and business networks.
2.4 Telephone Interviews as method of data collection
Telephone interviews is one of the methods of data collection via questionnaire.
Mobile telephone survey using random digit dialling (RDD) approach have been
found to yield same quality of results as other methods such as fixed telephone
(Vicente, Reis & Maria, 2009) as well as face to face interviews. For example
(Thulasingam, 2008) found that characteristics of the subjects and the response from
a survey administered face to face and those from telephone based methods were
similar. The male to female similarity ratio, for example, was statistically significant
at a significance level (p-value) of less than 0.05 and the achieved response rate of
telephone surveys was (94.3%) similar to the face-to-face surveys which was
(96.2%) .
2.5 Conceptual Framework
This section introduces a conceptual framework and the methodology for analysing
consumer preference of communications service which leads to the consumer to use
one operator or multiple operators at the same time. The conceptual formwork model
of drivers of multiSIM behaviour is driven form literature of multi brand loyalty and
multi SIM usage and modelled by the researcher.

22
Figure 2. 1: Conceptual Framework
Independent Variables Dependent Variable
`
Operator Actions Ease Of SIM Availability
Mobile Money Service
Cheap On Net Calls
Customer Service
Network Availability
Promotional Offers
Situational Influences Airtime Availability
Sim Swaps Points
Mobile Market Reasons ARPU
Multiple SIMslots Handsets
Multi SIM
owning and
usage
Social Norms Employer Paying SIM Bill
Friends And Family (FNF)
Specialized Products QoS Dispersion

23
The concepts have been defined in terms of indicators that are measurable, in order
to operationize them, as shown on table 2.1.
Table 2. 1: Concepts to indicators mapping
Concept Indicators Comments
Operator Actions
Ease of SIM Availability
Mobile Money Service
Cheap On Net Calls
Customer Service
Network Availability
Promotional Offers
Specific actions that
operators do take time to
time that lead to multiSIM
behaviour to subscribers.
Situational Influences
Airtime Availability
Sim Swaps Points
These are situational
Circumstances that make
a person own a SIM just
to use it temporary and
throw it afterwards.
Mobile Market reasons
ARPU
Multiple SIMslots
Handsets
Prepaid or postpaid
Specialized Products
QoS Dispersion
Accessibility and quality
level of Mobile money,
Internet, Voice,
Entertainment products,
gaming and Loan
services.
Social Norms
Family and Friends
preference of operators
Employer Paying Bill
(Separate business and
personal uses)

24
2.5.1 Description of the conceptual framework
MultiSIM usage (dependent variable) can be influenced by a number of factors as
shown on the above figure. The basis of this study is that there are independent
drivers that influence customer decisions to use multiple Sim cards. First category of
these drivers are those which are grouped as operator actions. Operator actions are
the action taken by operators on pricing, acquisition offers, bundling of services and
using aggressive retailer incentives for sales acquisition of new SIMs.
The other reasons are related to mobile market factors such as availability of dual
handset, MTR regulations, availability of niche products. Dual handsets since can
carry two SIM cards at a time may directly influence the propensity of subscribers to
use multiple SIM cards since it does not require additional cost which would be
require to buy an additional handset and avoids the hassle of swapping SIM cards in
case one would use a single SIM handset.
Specialized products influences multiSIM usage under premise that one operator
doesn’t have the range of all products and quality of products that the other
counterparts offer. This means that different operators can have different levels of
innovation and quality of service in mobile money, data or value added services like
sports, music and gaming. Customers are able to get the full range of services and at
the quality the need by resort in into subscribing to multiple SIMs from different
operators and the same time.
Social Norms plays roles in product decisions and can effect multiSIM ownership.
Reasons like subscribers need to maintain different social circles like work, business
and friends. Friend and family influences impact decisions on brand choice such as
family tradition (Felix, 2014). Identity enhancement is achieved through
consumption practices and the use of material and symbolic consumption, consumers
define, shape and communicate their identities (Ulver and Ostberg, 2014).
Consumers therefore may increasingly construct a fragmented sense of self, which
can be ambivalent, contradictory and conflicting especially in postmodern world
(Fírat et al., 1995).

25
This situation may lead consumers to end up using different brands to reflect their
conflicting identities. Also some subscribers may not what to combine both business
communications and personal communications hence end up owning multiple sim
cards and become multi sim users. Situational influences are also part of the
independent variables that affect the MultiSIM usage status dependant variable.
Situational influences includes unavailability of distribution services such airtime
and SIM swap points.
Also network outages and network coverage especially in rural areas could impact
subscribers who move from one place to another for example business people who
travel across urban and rural areas.

26
CHAPTER THREE
RESEARCH METHODOLOGY
3.1 Introduction
This chapter presents the research methodologies which were used by the researcher
for target population sampling, gathering data from the field and methods of
analysing the collected data. It describes, research design, study area, sampling
techniques, tools that were used in collecting data and the applied data analysis
techniques.
3.2 Area of the study
Tanzania was used as the area of study. Tanzania is a developing country in East
Africa. The population according to official government authority for statistics, NBS,
was 52.5 million as of 2017 (NBS, 2018). The HHI index of telecom sector in
Tanzania is 2,600 indicating a highly competitive market. This gives an opportunity
to study customer choice amid fierce competition. This is a particular differentiator
to other east African markets, for example in Uganda the HHI is 4,477 (UCC, 2018)
and in Kenya the market has a HHI of 4,653 (CA Kenya, 2018).
3.3 Research design
Research design refers to the arrangement of conditions for collecting and analysing
data in a manner that aims at combining relevance to the research purpose with
economy in procedure (Selltiz, Jahoda, Deutsch & Cook, 1965). Moreover research
design refers to the strategy to integrate the different components of the research
project in a cohesive and coherent way. It is a means to streamline a research project
in a way that addresses a defined set of questions (Trochim & Land, 1982).
In this study, the researcher has used case study design which involved collection of
empirical data from 6 mobile operator’s subscribers in Tanzania. The operators
included are those which had at least 1% of subscription market share as of March

27
2018 (TCRA, 2018). These operators are Vodacom, Tigo, Airtel, Halotel, Zantel and
TTCL.
3.4 Target populations and Sample Size
3.4.1 Target Population
A population comprises of any set of persons or objects that have at least one
common characteristic (Busha & Harter, 1980). According to Kothari (2004),
population is the total number of units from which data can be collected such as
people, events, artefacts or organizations. The population is the entire group the
searcher is interested in, that means the group about which the researcher wishes to
draw conclusions. The population can be very large or small, depending upon the
size of the group of persons or objects from which researcher plans to make an
inference. According to national house hold census of 2012, Tanzania has a
population of 56,000,000 with an average annual growth rate of 2.7%. The target
population of this research is composed of owners of SIM cards who have used it at
least once in the last 90 days.
3.4.2 Sample Size
A sample is a small group of respondent drawn from the population that the
researcher is interested in gaining information and drawing conclusion. This is the
part of the population which is used by researchers in an experiment or survey to
represent the whole population. Researchers use samples instead of studying a
complete pupation because of the budget and time constraints (Baradyana & Ame,
2007).
The sample was calculated using Cochran’s formula for calculating sample size as
shown in the formula below:-
S= Zα/22 *p*(1-p) / MOE2.
Where:-
α is the significance level (0.1 is used)

28
p is the proportion of population with MultiSIM, (1-p) is the Single SIM. 0.5 was
used to allow maximum variability since the ratio of Tanzania unique subscribers
using MultiSIM was not found in literature.
MOE is the tolerable margin of error (5% was used).
S= 1.645 2 (0.5*0.5)/0.05 2 = 271
Therefore the required sample size at significance of α=0.1 and margin of error of
0.05 is 271 subscriptions. Therefore the sample size for the study was chosen to be
288 respondents (Table 3.1) who have used at least once any of the mobile services
in the last 3 months. The three months definition (90 days) is adapted from ITU
standard definition of an active mobile subscription indictors.
3.5 Sampling procedures
Probability sampling methods were employed by the researcher. Stratified random
sampling was used to select the samples i.e. Each subscriber of a particular mobile
operator (the mobile operator is the basis of the strata) have an equal and
independent chance of being included. The sample was selected from the frame of all
active NDC for each operator in Tanzania. The size of each strata (operator) samples
was made to correspond to the market share distribution of operators as reported by
TCRA in March 2018. The proportionate stratified sampling was used to reflect the
number of the subscribers per operator in the sample.
The sample numbers was generated randomly using Random digit dialling (RDD)
approach. The three-digit prefix, namely NDC, identifies the mobile operators. So
mobile phone numbers were created by a generator of six -digit random numbers.
The NDC plus the six digits the forms a mobile number in Tanzania. The selection
method is a simple random sample from a set of numbers, for the number which is
not active another sample is selected. Similar approach was used in telephone
interview research in Portugal (Vicente et al., 2009).

29
Table 3. 1: Sample size Distribution
No. Category Of Respondents Frequency Percentage
1. Vodacom Subscribers 92 32%
2. Tigo Subscribers 79 27%
3 Airtel Subscribers 76 26%
4 Halotel Subscribers 29 10%
5. Zantel Subscribers 7 2%
6 TCCL Subscribers 5 2%
Total 288 100%
3.6 Data Collection Methods
Data collection is the process of gathering and measuring information related to
study variables in an established and systematic way that helps in answering research
questions, aid in testing hypotheses and evaluating outcomes (Konar,
2011).Therefore the ability to answer research questions accurately relies on ensuring
accurate and appropriate data collection.
The researcher employed a number of data collection methods which include primary
data and secondary data. In the primary data collection the tool used was
questionnaire administered through interview guide by telephone. Secondary data
collection included documentation from Tanzania government agencies which are
NBS and TCRA, international telecommunication agencies included ITU and
GSMA.
3.6.1 Primary Data
3.6.1.2 Questionnaire
This method was used by the researcher to obtain information related to the
multiSIM ratio and the drivers of multiSIM usage. According to Orodho (2008),
questionnaires provides both a quick and a precise way of gathering data on current
conditions, practices, opinions and attitudes and are extensively used for the same.
The researcher ensured that the questionnaire was structured to capture and collect

30
data that reflected the variables under study and their relationship to the dependant
variables. The questionnaire contained both closed and open-ended questions.
3.7 Data Analysis Methods
The dataset collected was analysed using R statistical language. Analysis comprised
of examining data based on attributes and demographics from the respondents
collected. Descriptive methods were used to explore and make the data more explicit
and understandable. Descriptive analysis included reporting, visualizing and
summarizing the information from the dataset into relevant aggregations. Inferential
statistics was used to provide evidence to answers of research questions by
hypothesis testing thus accepting or rejecting the hypothesis. Specifically a binary
logistic regression model was used to run the analysis. This is following the premise
that the multiSIM usage status is binary response [yes or no]. The predictors
(dependent variables) were run in one instance to assess their predictive ability and
also to control for the effects of predictors on each other in the model.
3.7.1 Research Statistical Model
The model uses proxy variables from the five drivers mentioned above as
independent variables and the MultiSIM usage status as the dependant variable. The
following binary logistic regression model was implemented. Probability of a
customer been multiSIM is determined from the below binary logistic equation:-
P ( ) =
Where x is obtained from below equation:-

31
Binary logistic regression estimates the probability that a characteristic is present.
MULTISM = Y (Dependent variable, a dichotomous multiSIM status of customer i,
takes values of YES=1, NO=0)
QOS_DISPERSION = Independent variable 1, for quality of service dispersion
SIMSLOTS = Independent variable 2 for multiSIM handsets
EMPLOYERPAYSBILL = Independent variable 3 for if employee pays phone bill
SIM_SWAP= Independent variable 4, for ease of Sim swap
SIM_CHANNEL = Independent variable 5, for channel of SIM purchase
FNF = Independent variable 6, for friends and family influence
APRU = Independent variable 7, for average monthly spend of a customer
AIRTIME_AVAILABILITY= Independent variable 8, for airtime availability
PROMOTIONS= Independent variable 9, for promotions satisfaction
ON_NET_CALLS = Independent variable 10, for affordability of on-net calls
NETWORK_AVAILABILITY = Independent variable 11, for network availability
CUSTOMER_SERVICE = Independent variable 12, for customer service
satisfaction
MOBILE_MONEY = Independent variable 13, for mobile money satisfaction
= A constant
= Beta coefficient for independent variable 1 to 12.
3.8 Ethical considerations
Researches consist of collection of data from individuals and/or institutions which
are party of the society. Ethical behaviour is expected to guide the researcher with
regard to areas of honesty, objectivity, intellectual property, social responsibility, and
confidentiality. Also the researcher needs to obtain an informed consent from those
involved in the research. An informed consent has to explain the purpose of the
research, expected benefit to the participants or society and who the researches are as
well as privacy issues.
A research must uphold the ethical standards in order for the public to support to the
research. Ethical issues may come up during data requesting, recording from the

32
respondents and using the collected data (Kvale & Brinkman, 2009). Therefore, this
study ensured the ethical issues were adhered. This included the participant’s
freedom to withdraw at any time for any reason during the calls or postpone the call
to another time.
Proper introduction was done prior to starting the interview, an official introduction
letters from Mzumbe University College - Dar es Salaam Campus (Annex 1) was
obtained for the same purpose. The letter provided the necessary information in case
any participant wanted to be guaranteed of the legitimacy of the research and contact
were included that would help the participant to contact the university in case
needed. In the Tanzania market, this is key as the RDD is prone to resistance by
participants as it has been associated with social engineering and phishing to steal
individual’s information and mobile money. (Zacharia, 2018).

33
CHAPTER FOUR
RESEARCH FINDINGS AND ANALYSIS
4.1 Introduction
This chapter presents the analyses and interpretation of data collected on the
drivers of multiSIM usage in Tanzania mobile market. It presents the results
of the data analysis, starting with a descriptive analysis of the data collected
by the researcher from the field. It also explores the results of demographic
attributes analysis, testing of hypothesis through a binary logistic regression
analysis and marginal effects. In each analysis, interpretation, findings and
the results are presented in details.
The data were analysed to reveal the distribution of demographic
characteristics of the respondents from the collected data of the 6 operators
in Tanzania. This section therefore presents the summarized results of the
finding, interpret figures and drive statistical measures that are detailed
enough to enable conclusions to be derived and justified.
Detailed discussions of the results are done based on research objectives and
questions and similar findings are cited wherever required. Data is presented and
discussed with the help of tables and figures as a means of summarizing. Data
analysis is done to compare and contrast the findings with the research questions
underlying the study. The statistical findings are described with their respective
significant levels. The discussions brings together the study findings in relation to
those identified in the literature review in terms of similarity and differences.
4.2 Demographic profiles of respondents
Individual characteristics form an important part of behavioural economics in
relation to the analysis of choices that people make. The respondent’s demographic
characteristics whose data were collected in this research includes gender, education
level, region, employment status and age.

34
4.2.1 Gender distribution of respondents
The respondents’ gender distribution was 43% Female and 57% Male as shown table
4.1, this implies that phone adoption is higher among males as compared to females.
The national gender distribution in Tanzania, according to national census, is around
50/50 for male and female. (NBS, 2018). Also the percentage of Male respondents
with multiple SIM was higher at 73% compared to female at 70%.
Table 4. 1: Gender of respondents
Gender No. Of
Respondents
Percentage
Contribution
Single SIM
users
Multiple SIM
users
% of Multiple
SIM users
Female 124 43% 37 87 70%
Male 164 57% 42 122 74%
Total 288 100% 79 209 73%
Source: Field data
4.2.2 Age distribution of respondents
Age distribution on table 4.2, shows that majority of Multiple SIM owners in terms
of age group penetration are youth with the age group from 25 to 34 and 35 to 44
which has 78% and 82% penetration respectively. This can be explained by the fact
that youth are more active users who seek for better deals and variety of services
among operators. This also reflect the contribution of respondent to the countries age
profile where majority of the population are youth.

35
Table 4. 2: Age of respondents
Age group No. Of
Respondents
Percentage
Contribution
Single SIM
users
Multiple SIM
users
% Multiple SIM
users
Under 18 2 1% 2 0 0%
18-24 48 17% 15 33 69%
25-34 136 47% 30 106 78%
35-44 50 17% 9 41 82%
45-54 29 10% 14 15 52%
55-64 16 6% 6 10 63%
65+ 7 2% 3 4 57%
Total 288 100% 79 209 73%
Source: Field data
4.2.3 Level of education of respondents
Table 4.3 shows that only 4% of respondents were illiterate, 27% had primary level
education while 30 % had secondary education and around 40% had tertiary or
university education. According to UNESCO data on Tanzania illiterate rates is
reported to be around 10%, compared to the 4% respondents found in this research
shows that mobile penetration is still relatively low among the illiterate in the
country. Since mobile technology is a generally new service its diffusion would be
expected to be fast within the educated.

36
Table 4. 3: Education level of respondents
Age group No. Of
Respondents
Percentage
Contribution
Single SIM
users
Multiple SIM
users
Multiple
SIM users
%
Illiterate 11 4% 8 3 27%
Primary 79 27% 31 48 61%
Secondary 85 30% 25 60 71%
Tertiary 66 23% 11 55 83%
University 47 16% 4 43 91%
Total 288 100% 79 209 73%
Source: Field data
The level of education correlates to the multiSIM usage status of respondents. The
percentage of multiple SIM users increases from 27% on illiterates, steadily across
education ladder, to 91% on university level as shown on Figure 4.1.
Figure 4. 2: Respondents’ SIM multiplicity by education level
Source: Field data
4.2.4 Employment status of respondents
Table 4. 4: Employment Status of respondents

37
Employment Status No. Of
Respondents
Percentage
Contribution
Single
SIM
Multiple
SIMs
Multiple
SIM Users %
Student 27 9% 12 15 56%
Farmer 53 18% 24 29 55%
Self-employed 94 33% 20 74 79%
Permanent employed 31 11% 3 28 90%
Temporary
employed 38 13% 5 33 87%
Unemployed 40 14% 13 27 68%
Retired 5 2% 2 3 60%
Total 288 100% 79 209 73%
Source: Field data
Employment status of respondents shows that the biggest group of mobile service
users are self-employed (33%), followed by farmers (18%), unemployed workers
(14%), and temporary workers (13%) and permanent employed (11%).
SIM multiplicity is highest in permanent employed respondents at 90%, and lowest
in farmers at 55%. This as seen in the reasons respondent can be attributed to
employees need to separate office uses and personal uses. Also this is attributable to
the fact that the office used for SIM purpose its bills are paid by employer so the
employee has room to own and pay for a second SIM. In case of Tanzania there is an
addition cofounding factor as the most of permanent employed tend to leave in cities
and sub urban where there is good coverage from most mobile operators compared to
rural areas where coverage is limited to few or only one operator. Operator
availability in rural areas can be attributed to the low number of multiple SIMs
among farmers for example as compared to permanent employed users.

38
4.3 Mobile usage profiles of respondents
4.3.1 Tenure on mobile service
Table 4. 5: Tenure on mobile service of respondents
Tenure on mobile
service
No. Of
Respondents
Percentage
Contribution Single SIM
Multiple
SIMs
Multiple
SIM
Users %
Below 6 Months 5 2% 4 1 20%
6Months to 1 year 5 2% 5
0%
1 to 3 years 29 10% 11 18 62%
3 to 5 years 59 20% 19 40 68%
5 to 10 years 107 37% 24 83 78%
More than 10 years 83 29% 16 67 81%
Total 288 100% 79 209 73%
Source: Field data
The distribution of respondents by their tenure of using mobile service shows that
about one third of them have been using mobile service for more than ten years to
date. The distribution shows that only 4% of the users have used mobile service for
the first time within a year. This in conjunction with data from the TCRA report for
year over year growth of 3.6% as of June 2018, implies a steadily growing telecom
market in the country.
In terms of multiple SIM usage, respondents who have longer tenure on mobile
service generally have high rates of multiple SIM usage compared to short tenure
respondents. Tenacity could imply that customer are more tech-savvy to demand
more services and also have matured big demands for service hence want to own
multiple SIMs for both service satisfaction and save on prices. From Table 4.5, the
respondents with more than 10 years of using mobile telecom services have 81%
penetration of multiSIM higher than the national average of 73%.
39
4.3.2 Mobile Products Usage
Multiple SIM card customers can use different product from different operators.
Table 4.6 shows the number of product users by each operator among the
respondents. Even though the sample had only 288 respondents but these
respondents reported also the services they use with their other SIM cards in case of
multiple SIM owners. The number of product usage associated to the six operators
from the respondents was 514 as shown in Table 4.6. There is about 33 number SIM
owned different to the number of products usage by operator, hence the total number
would be 547 as shown on table 4.8. This is caused by the particular respondents not
mentioning the actual product they use by each of the operators.
Table 4. 6: Mobile Products Usage of respondents
Operator Calls SMS Internet Mobile Money Entertainment Total
Vodacom 141 112 80 156 49 175
Tigo 104 90 51 93 38 136
Airtel 100 85 72 69 39 116
Halotel 31 42 39 12 8 58
Zantel 9 6 5 4 3 14
TTCL 9 4 10 1 2 15
Total 394 339 257 335 139 514
Source: Field data
The usage of different services among operators is non-uniform. According to table
4.7 operators which perform well in one of the service perform low in another
service within their customers.
The ranking of customer affinity for services among its users is different for each
operator. Overall voice call is the most popular service among all operators.
However Vodacom outstands on mobile money performance. TTCL and Halotel of
which overall market shares are low have above average usage of internet among
their customers. Airtel has the highest penetration of its base using voice and SMS
and VAS products.

40
Table 4. 7: Product usage penetration by operator
Operator Calls SMS Internet Mobile
Money Entertainment Total
Vodacom 81% 64% 46% 89% 28% 100%
Tigo 76% 66% 38% 68% 28% 100%
Airtel 86% 73% 62% 59% 34% 100%
Halotel 53% 72% 67% 21% 14% 100%
Zantel 64% 43% 36% 29% 21% 100%
TTCL 60% 27% 67% 7% 13% 100%
4.4 Number of Individuals vs Number of SIM cards
The most common number of SIMs owned by respondents is two (57%), followed by
one (27%) then three (14%). Four and five are extreme cases which together
accounted for only 1% of the respondents. The overall SIM ratio which is the number
of SIMs to number of Individuals is 1.9. This implies that on average the number of
SIMs in the Tanzanian market is almost double the number of actual individuals
using the SIMs. That means from the number of SIMs in the country as reported by
the telecommunication authority to get the number of individuals one needs to divide
that number by the SIM ratio. The SIM ratio of 1.9 obtained from this research is
higher as compared to the average in Sub-Saharan Africa which 1.7. This means
Tanzania has high rate of SIM multiplicity than the Sub-Saharan average. As of
December the number of SIMs reported were 43.6 million, using the SIM ratio of 1.9
this is equivalent to 22.9 million unique individuals who have at least one
subscription of mobile services.

41
Table 4. 8: Respondents’ Number of SIMs
Number of SIMs No. Of Respondents Percentage
Respondents Total SIMs
1 79 27% 79
2 164 57% 328
3 41 14% 123
4 3 1% 12
5 1 0% 5
Total 288 100% 547
4.5 Share of Main SIMs per operator
Table 4.6 shows the contribution of SIMs, which is the number of actual contacted
respondents per operator, and the number of Main SIMs (the respondents who use
the operator as their main SIM). Vodacom is the only operator that has its Main
SIMs share above its total SIMs share. Halotel has the same share in both main SIM
and total SIMs shares. Main SIM share is an important measure of profitability per
customer. The customer who uses an operator as her/his main SIM tends to spend
more on that operator and this has an impact of increasing the operator’s share of
wallet from that customer. In a multiproduct market setting, share of wallet is more
important than mere number of customer acquisitions. Main SIM choices reflect
customer experience with the particular networks which then drives customer
satisfaction and patronage of operator’s services.

42
Table 4. 9: SIMs and Main SIMs per operator
Operator No. of SIMs SIMs
Contribution
No. of Main
SIMs
Main SIMs
Contributions
Vodacom 92 32% 108 38%
Tigo 79 27% 73 25%
Airtel 76 26% 70 24%
Halotel 29 10% 29 10%
Zantel 7 2% 6 2%
TTCL 5 2% 2 1%
Total 288 100% 288 100%
4.6 Share of Wallet per Operator
Share of wallet is the percentage of customers’ spending allocated to a brand. This is
used to predict the revenue share of the operator’s brands in this research. The
average of all the shares of wallet of all the customers in a particular market
determines the share of revenue among the operators in the market. The formula used
in this analysis is the wallet allocation rule WAR (Keiningham et al., 2015). In this
research the ranking data used is up to 3 since majority of respondents own between
1 to 3 Sims. The formula is as show on below equation:
SHARE OF WALLET=
Table 4. 10: Revenue share per operator
Operator RANK =1 RANK=2 RANK=3 RANK=4 Revenue
share
Vodacom 108 56 5 1 36%
Tigo 73 57 13 0 27%
Airtel 70 32 10 0 24%
Halotel 29 13 10 1 10%
Zantel 6 3 0 0 2%
TTCL 2 3 2 1 1%
Total 288 164 40 3 100%
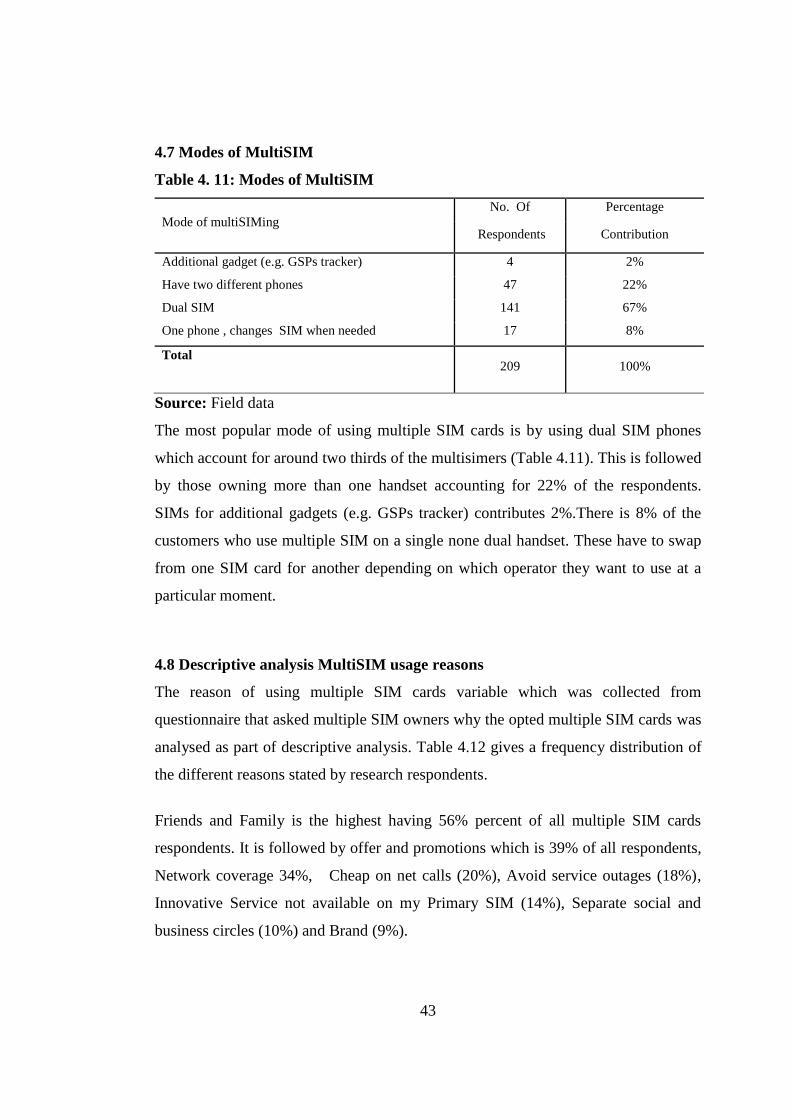
43
4.7 Modes of MultiSIM
Table 4. 11: Modes of MultiSIM
Mode of multiSIMing
No. Of Percentage
Respondents Contribution
Additional gadget (e.g. GSPs tracker) 4 2%
Have two different phones 47 22%
Dual SIM 141 67%
One phone , changes SIM when needed 17 8%
Total
209 100%
Source: Field data
The most popular mode of using multiple SIM cards is by using dual SIM phones
which account for around two thirds of the multisimers (Table 4.11). This is followed
by those owning more than one handset accounting for 22% of the respondents.
SIMs for additional gadgets (e.g. GSPs tracker) contributes 2%.There is 8% of the
customers who use multiple SIM on a single none dual handset. These have to swap
from one SIM card for another depending on which operator they want to use at a
particular moment.
4.8 Descriptive analysis MultiSIM usage reasons
The reason of using multiple SIM cards variable which was collected from
questionnaire that asked multiple SIM owners why the opted multiple SIM cards was
analysed as part of descriptive analysis. Table 4.12 gives a frequency distribution of
the different reasons stated by research respondents.
Friends and Family is the highest having 56% percent of all multiple SIM cards
respondents. It is followed by offer and promotions which is 39% of all respondents,
Network coverage 34%, Cheap on net calls (20%), Avoid service outages (18%),
Innovative Service not available on my Primary SIM (14%), Separate social and
business circles (10%) and Brand (9%).

44
Figure 4. 3: Prompted Reasons for using Multiple SIMs
Source: Field data
4.9 Binary Logit Model Results and Interpretations
Table 4.12: Frequency for the dependent variable
MultiSIM Status Count Percent Cumulative responses,%
NO 79 27.4 27.4
YES 209 72.6 100
Total 288 100
Table 4.12 shows that he dependent variable MultiSIM Status (customer status of
owning multiple SIM cards) has received 209 (72.6%) YES response and 79 (27.4%)
NO responses. This is implies that users with multiple SIM cards are many that those
with single SIM card making Tanzania predominately a multiSIM market.

45
Table 4.13: Logistic Model Fit Assessment
X- squared df p-value
13.701 8 0.0899
Table 4.13 displays the significance of the model from Hosmer and Lemeshow
goodness of fit (GOF) test, the chi-square value for the model is a p-value of 0.089.
This p-value is greater than the significant level of 0.05, hence there is no evidence
that the model do not have good fit at 0.05, and hence the model for fits well the
data.
The logistic regression results for the dependent variable MultiSIMStatus is given by
the following results:
Table 4.14: Logit Model Estimates
Coefficients Estimate Std. Error z value Pr(>|z|)
(Intercept) -1.6388 1.0782 -1.52 0.12853
AIRTIME_AVAILABILITY -0.44005 0.22384 1.966 0.0493 *
ARPU 0.49051 0.19942 2.46 0.0139 *
CUSTOMER_SERVICE -0.42653 0.70957 0.601 0.54776
EMPLOYERPAYSBILL 1.75959 0.78788 2.233 0.02553 *
FNF 0.27105 0.21855 1.24 0.2149
MOBILE_MONEY 2.08588 0.93926 2.221 0.02637 *
NETWORK_AVAILABILITY -0.04768 0.45009 0.106 0.91563
ON_NET_CALLS 0.11459 0.43158 0.266 0.79062
PROMOTIONS -0.14774 0.52265 0.283 0.77743
QOS_DISPERSION 0.78206 0.33102 2.363 0.01815 *
SIM_CHANNEL 0.946 0.32998 2.867 0.00415 **
SIM_SWAP -0.5578 0.27334 2.041 0.04128 *
SIMSLOTS 1.10689 0.23069 4.798 1.60E-06 ***
Signif. Codes: 0 ‘***’ 0.001 ‘**’ 0.01 ‘*’ 0.05 ‘.’ 0.1 ‘ ’ 1
The estimation result in Table 4.13 indicates partial effects of the explanatory
variables on the multiSIM behaviour of mobile telecom customers in Tanzania. The
variables SIMSLOTS, SIM_CHANNEL, ARPU, QOS_DISPERSION,

46
EMPLOYERPAYSBILL, SIM_SWAP, AIRTIME_AVAILABILITY and
MOBILE_MONEY are statistically significant associated with the multiSIM usage
behaviour at 5% level of significance whilst variables FNF, PROMOTIONS,
ON_NET_CALLS, CUSTOMER_SERVICE and NETWORK_AVAILABILITY are not
statistically significant associated with multiSIM usage behaviour at 5% level of
significance, there is no p-value less than 0.05.
On the significant variables, only SIM_swap negatively associated multiSIM usage
behaviour which implies its availability discourages people to own multiple SIM
cards. Availability of SIM swap points represents situational influence factors. So its
non-availability makes people opt for multiple SIM cards.
The other significant variables have positive coefficients meaning that they are
positively related to the ownership multiple SIM cards. The positively coefficient
variables implies that they have a significant role in the ownership multiple SIM
cards in Tanzania.
The significance of QoS dispersion variable on the model indicates the difference in
perceived quality of service and products differentiation among operators. According
to Bennett and Rundle-Thiele (2005), the low levels of differentiation among brands,
more choices and lower risks in brand switching impacts occurrence of multi-brand
customers due to product specialization with less differences in the overall category.
Availability of multiple SIM phones and availability of SIM card shops as market
reasons and operator actions reasons respectively, gives favourable environment for
Multiple Sim cards ownership to flourish in Tanzania. Conveniently available SIM
card shops where people can go and buy SIM cards on demand (SIM Channel
variable) influence the ownership of Sim cards positively. However, satisfaction on
availability of SIM swap points affects negatively the use of multiple SIM cards.
This can be explained by the fact that SIM swap point gives customer an assurance in
case they damage or lose their SIM cards they can easily replace it and get back
online otherwise they would have to buy a new SIM card which to use to avoid such

47
an intermittent situation. Accessibility to swap points influenced customer to
continue using his ‘lost’ SIM card and elongate his SIM tenure and behaviour loyalty
which has low multiple SIM ownership propensity. Vebrov et al. (2016).
4.10 Marginal Effects and Interpretations
4.10.1 Marginal Effects
The binary logistic regression was used to identify which factors are significant in
driving the use of multiple SIM by mobile customer in Tanzania. The coefficients of
the logistics model give only the sign (direction) which shows how the independent
variable affects the dependent variable. However to understand the partial effects
each of the variables have on the dependent variable in terms of magnitude a
margins analysis was perfumed and results are presented in this section.
Table 4. 15: Marginal effects
Factor AME SE z p lower upper
AIRTIME_AVAILABILITY -0.0641 0.0319 -2.0108 0.0443 -0.1266 -0.0016
ARPU 0.0715 0.028 2.548 0.0108 0.0165 0.1264
EMPLOYERPAYSBILL 0.2001 0.0611 3.2753 0.0011 0.0803 0.3198
FNF 0.0395 0.0316 1.2513 0.2108 -0.0224 0.1013
PROMOTIONS -0.0222 0.0793 -0.2801 0.7794 -0.1775 0.1331
ON_NET_CALLS 0.0166 0.0623 0.2665 0.7899 -0.1055 0.1387
NETWORK_AVAILABILITY -0.0071 0.0669 -0.1057 0.9158 -0.1381 0.124
CUSTOMER_SERVICE -0.0664 0.1138 -0.5829 0.56 -0.2895 0.1568
MOBILE_MONEY 0.2113 0.0652 3.241 0.0012 0.0835 0.339
QOS_DISPERSION 0.1139 0.0466 2.4429 0.0146 0.0225 0.2053
SIM_SWAP -0.0813 0.0388 -2.0934 0.0363 -0.1573 -0.0052
SIM_CHANNEL 0.1487 0.0532 2.7942 0.0052 0.0444 0.253
SIMSLOTS 0.1612 0.0288 5.6037 0 0.1048 0.2176
Table 4.14 is evident that there are eight independent variables (ON_NET_CALLS,
FNF, ARPU, QOS_DISPERSION, SIM_CHANNEL, SIMSLOTS,

48
EMPLOYERPAYSBILL and MOBILE_MONEY) that have positive marginal effects
and five independent variables (SIM_SWAP, NETWORK_AVAILABILITY,
PROMOTIONS CUSTOMER_SERVICE and AIRTIME_AVAILABILITY) with
negative marginal effects respectively.
4.10.2 Interpretations of marginal effects
From Table 4.4 it can be deduced that any unit change on the independent variable
either increase or decrease the probability of occurrence in the dependent variable by
the percentage of the coefficient in the column of the average marginal effects
(AME). Below is the interpretation for the positive marginal effects:-
1. EMPLOYERPAYSBILL (Separate business and personal uses as a social
norm influence): Subscribers who have a SIM card of which bills are paid by
employers are 20 per cent more likely to own multiple SIM cards than
another subscribers whose bills are not paid by employers , ceteris paribus
2. ARPU (Average revenue per user in a month): Subscribers who have a
higher ARPU bracket are more likely to own multiple SIM cards than other
subscribers who are in a lower ARPU bracket, ceteris paribus.
3. MOBILE_MONEY (Mobile money service satisfaction as an operator
action influences) Customers who are dissatisfied on mobile money services
has 21 percent more likely to own multiple SIM cards, ceteris paribus
4. QOS_DISPERSION (Product specialization) Customers with dispersion in
their assessment of operator’s quality of service for various products, (Their
perceived position in service quality on each product is not the same), has 11
per cent more likely to own multiple SIMs, ceteris paribus,
5. SIM_CHANNEL (Availability of SIM card shops as an operator action
factor) the availability of Service shops where customers can go and buy
their SIM cards increases the multiSIM ownership by 15 per cent, ceteris
paribus.
6. SIMSLOTS (Availability of phones with multiple SIM slots as a market
reason) A device which carries two or more slots of SIM cards increase the
like hood to own multiple SIM cards by 16 per cent, ceteris paribus

49
The interpretations for the negative marginal effects of the variables
(SIM_SWAP, NETWORK_AVAILABILITY, PROMOTIONS
CUSTOMER_SERVICE and AIRTIME_AVAILABILITY) are as provided, only
AIRTIME_AVAILABILITY and SIM_SWAP are significant among the five:-
1. SIM_SWAP (SIM swap points to get back SIM card in case it is damaged,
lost or stolen as a situational influence) Customers with sufficient SIM swap
services access have 8 per cent less likely to own multiple SIM cards, ceteris
paribus
2. AIRTIME_AVAILABILITY (Airtime availability as a situational
influence) Customers who are satisfied with airtime availability have 6
percent less likely to own multiple SIM cards, ceteris paribus

50
CHAPTER FIVE
SUMMARY, CONCLUSION AND RECOMMENDATIONS
5.1 Introduction
This chapter presents the main research findings of the study, conclusions,
recommendations and suggestions for further research. The chapter starts by
highlighting the major statistical findings from the results section. Findings are
interpreted based on the main question of the study which is why do mobile
subscribers in Tanzania own multiple SIM cards. Then, conclusions are discussed
based on researcher insights gained from the study findings and limitations. Finally,
recommendations and suggestions for further research are presented.
5.2 Summary
The aim of the study was to find out the reasons why mobile subscribers in
Tanzanian telecom market own multiple SIM cards. Customers using any of six
mobile operators, Vodacom, Tigo, Airtel, Zantel, Halotel and TTCL, were involved
in this study with a target of reaching at least 288 subscribers. Through RDD method
the responses from 288 unique respondents were collected that was equal to 100% of
the target number of respondents for a statistically valid analysis.
As the results and analysis show, there is a significant relationship between operator
actions like sim swap service and financial service to usage of multiple Sims in
Tanzania telecom market. This implies that operator actions entice customers to own
multiple SIM cards to take advantages of such actions. The customer is therefore
able to maintain two or more usage profiles that are switched from one operator to
another. This switching habit enables the customer to obtain the optimal value for his
communication budget. Depending on the actions of the operators on offer and
promotions the customer will be constantly switching among operators.

51
The study findings show there is a significant influence of mobile market reasons on
multiple SIM usage. This is explained by availability of multiple SIM devices that
make it easy for customers to maintain multiple SIM cards seamlessly by putting
them together on one phone. But also low penetration of contract tariffs influences
customers to maintain multiple SIM cards. As the result shows most customers on
prepaid tariffs maintain multiple SIM cards.
The study findings show there is a significant influence of specialized products on
multiple SIM usage. When one brand fail to meet all the customers’ communication
expectations in terms of the range of services offers customers’ option becomes
Multiple SIM cards to enjoy the services ranges from multiple brands. The findings
show that quality of product dispersion among operators is key driver of customers to
own multiple SIM cards. This is due to the fact that customers want to take
advantage of services from each operator whose they perceive to be offered
satisfactorily.
The study findings show that there is a significant influence of situational influence
on multiple SIM usage. Situations like using the phone for temporary contacts and
then throw it away later on. Situations like not finding the agents at the right time
and place of the main Sims makes customers opt for an alternative operator whose
services are available at that time and place.
The study findings show there is a significant influence of social norms on multiple
SIM usage. People are influenced by friends and family in their decisions of opting
to multiple Sims. Also the concept of separating important contacts such as business
to other contacts was an important variable in people opting to multiple SIM cards.
This came strongly in both descriptive analysis on the reasons to use sim cards as
well as from the statistical binary logistic marginal effects analysis.
The findings also show that the ARPU of users also influence their ability to own
multiple sim cards. For low ARPU the cost of ownership and maintaining two Sim

52
cards seems not to be compensate for the benefit achieved. So the higher the ARPU
of the user was found to be the higher the propensity to own multiple Sim cards.
Additionally the multiple SIMs ratio of 1.9 found in this research is slightly higher
compared to the one found in literature which was 1.8 (GSMA, 2019)
5.3 Conclusions
This study has provided evidence that customers are driven to opt multiple Sims to
avoid disparities in quality among different services from operators. This can be
reduced by providing a conducive environment to operator to invest in developing
their infrastructure to serving their customers seamlessly. The contribution of mobile
communications is fundamental to countries’ economic and social development. The
availability quality and affordable mobile services for everyone improves individual
and companies productivity, promotes trade, creates jobs and generates wealth and
enhances social welfare. However, in developing countries individual mobile
operators have not been able to provide national wide coverage due to a number of
limitations (GSMA, 2011).
Reliable networks, proper coverage and full range of services will help Tanzania
mobile operators reduce the high rate of multiSIM usage that is necessary for their
profitability and further development of innovative products for their customers. This
would also foster the overall development of the telecom industry.
The influences due to social norms are hard to deal with from operator perspective as
they are customer centred. This type of multiSIM users are bound to remain
regardless of changes in operator actions and mobile market conditions. The issue of
multiple Sims used to separate social circles and separates business and personal
communications is an opportunity for operators to complete for SIM cards that are
meant for different purposes which are independent from spend perceptive. Provided
the owners are centrally registered as in case of Tanzania for people to own Sim
cards for difference use cases. Other opportunity of multiple Sim Cards per
individual is in the IoT area. This kind of Sim cards does not split spend of an

53
individual rather it adds another service type which can be monetized by
telecommunications. Operators have opportunity to ensure their communication
customers uses also the IoT services from them through strategies such as product
bundling.
5.4 Limitations of the Study
One of the limitations of this research study was the constitution of the sample. Even
though the numbers were generated randomly from a range of possible active
subscribers, those who were not reachable during administration of the questionnaire
were omitted. This can have led to bias in the data with regards to customers who are
not always connected for example, in rural areas due to power problems or MultiSIM
using a single phone while the with a contacted number was not inserted. However
such bias due to the method of administration is unlikely to affect the conclusion as
such scenarios are also expected to be random to customers in terms of what
influence them to use multiple Sims. The sample of mobiles users was taken from
Tanzania which is a highly prepaid tariffs market. Therefore, the results might not
generalize to other subscriber populations in other countries, particularly those
markets highly dominated by contract tariffs.
A market share effect also most likely influenced multiple Sims usage due to family
and friends being in other networks reason. Stiff competition exit in Tanzania
telecom market whereby there is no clear dominant player, the market leader having
only 32% of subscription shares. This effect might have influenced the performance
of the family and friends factor, as such social contacts are inherently spread across
networks. This level of influence may be particularly in Tanzania’s current market
conditions and may not be necessary hold the same when a dominant player emerges
or in other countries with different market concentration.

54
5.5 Recommendations and Policy implication
5.5.1 Policy implication
The study found that the actual number of unique mobile service users is a way far
from the number of subscribers by a SIM ratio multiple of 1.9. There are less number
of individuals owning Sims by almost halve the number of SIMs. This study has also
provided weight of various reasons of why the multiSIM behaviour exists in
Tanzania. Based on the finding of this research on why people use multiple SIM
cards, the phenomenon is bound to persist. However knowing the true numbers of
people using mobile phones in the country in crucial with regard to government
planning and effective policy formulations.
The Government through the Tanzania Communication Regulatory Authority
(TCRA) and NIDA have to use the ongoing SIM card registration exercise to
centralize the identification of Sim cards in a way that it will enable to establish real
number of subscribers who exist is the country time to time. The count of actual
unique number of user can also be published, same way as currently done for number
of subscriptions. This consequently will enable planers and private sectors players to
utilize the real subscriber numbers for their planning and market forecasts instead of
current number of SIM cards subscriptions.
5.5.2 Managerial Implication
The findings of the study provide several managerial implications. First, the results
highlight the importance of understanding customer demands in the multiSIM
environment as customer are able to switch in real time and silently to alternative
operators without login any complaints for improvement to current operators.
MultiSIM empowers customers to seek satisfaction of their communication needs
from whoever operator can provide. Hence they do not patronage any operator to the
extent of been patient to wait for operators to resolve issues or improve their
services. However, when frustrated customers are able to switch from one operator to
another that fast, it gives room to operators to pitch their products and try and turn
these spurious loyal customers to be their permanent customers.

55
The winning strategy in such multiSIM market shifts from being owning many
customers, as in dominantly single Sims markets, to being been the most preferable
operator. That means to be the operator whose services are patronised and used by
customers more frequent than those of other operators in the market. Building
attitudinal loyalty increases the brands market power and increases the likelihood of
customers to resist competitive offers. Therefore operators should design marketing
programs that modify attitudinal loyalty because behavioural loyal customers who
have consistent attitudes towards the brand will stay loyal to the same brand
regardless of the ease of switching among operators. Promotional programs that
address only behavioural loyalty can easily be countered by competitors as customers
doesn’t have emotional attribute that drive their attachment to the brand. Since
loyalty is purely build based on transactions it can be easily replaced for lowly priced
products from other operators. Hence operators should adopt both company loyalty
and program loyalty for customers to be attracted to their products and increase their
usage respectively.
The mobile operators in Tanzania should use effective marketing to tap into the
potential of multiSIM behaviour and avoid the pitfall associated with it. Fully
understanding the customer behaviour under multi brand loyalty, leads to launching
of relevant programs which are geared toward keeping the brand as the most
preferable among its alternatives.
Operators should enhance and maintain high quality networks and widen their
coverage nationally. This includes speed of internet connections and reliability of
voice calls on their networks.
In multi brand context of telecommunication service where most customer have
multiple SIM cards, hence viable alternatives in real- time, number of complaints
may reduce. Customer can switch among operators without disruption of their usage
and hence doesn’t give time to operators to resolve their issues. Customer complaints

56
about a service component are from those who don’t have a viable alternative, those
who can seamlessly switch doesn’t necessary need log complaints. Management
should not assume the reduction in customer complaint on particular services means
that its performance it good it may just mean that customers found an immediate and
better alternative thus the silence. This is a case to other brands where customers
exhibit multi-brand loyalty with easy of switching.
5.5.3 Recommendations for further study
A further study needs to be conducted to identify and investigate other factors that
influence users to use multiple SIM cards which are not covered in this research. In
addition, there is a need for a research on the impact of adoption of multiple SIM
card to the users total spend. That is the relationship between multiple SIM cards and
total spend of the user before and after adopting multiple SIMs. This would
determine if a user lowers his total telecom spend if he adopts multiple SIM cards
usage through price arbitrage or he splits it among operators and increases his total
spend in the process.
57
REFERENCES
Adamowicz and W. Swait J, (2001). The Influence of Task on Consumer Choice: A
Latent Class Model of Decision Strategy Switching. Journal of
Consumer Research. 28 (1), 135-148
Amirpur, M (2017). The Role of Cognitive Biases for Users’ Decision-Making in IS
Usage Contexts, Retrieved April 24, 2018 from the World Wide Web:
https://tuprints.ulb.tu-darmstadt.de/6848/
Anatory, J (2015). Consumer Preferences for Mobile Carriers in Tanzania: A Case of
Group, Family, Age and Gender. IJCA Journal, 15(16).
Arifine, G., Felix, R., & Furrer, O. (2019). Multi-Brand Loyalty in Consumer
Markets: A Qualitatively-Driven Mixed Methods Approach. European
Journal of Marketing
Bennett, R., and Rundle-Thiele, S. (2005). The Brand Loyalty Life Cycle:
Implications for Marketers. Journal of Brand Management, 12(4), 250-
263
Beshears, John, Choi, James J. & Laibson, David, Madrian, Brigitte C., (2008). How
are preferences revealed? National bureau of economic research.
Baradyana, J. S. and Ame, A. M., (2007) Quantitative Techniques for Business
Decisions, Dar es Salaam: Mkuki na Nyota Publishers ltd.
Busha, H., and Harter P. (1980) Research Methods in Librarianship: Techniques and
Interpretation, Orlando, FL: Academic Press
CA (2019), Third Quarter Sector Statistics Report for the Financial Year 2018/2019,
Retrieved June 29, 2019 from the World Wide Web: https://ca.go.ke/wp-
content/uploads/2019/06/Sector-Statistics-Report-Q3-2018-19.pdf

58
Clayton C., Hall, T., Dillon. & Duncan, D. (2016) Competing Against Luck: The
Story of Innovation and Customer Choice. New York: Harper Business.
Dhami, S (2016). The Foundations of Behavioural Economic Analysis. London:
Oxford University Press.
Dhar, Ravi, Nowlis M., Stephen, Sherman J., Steven. (2000). Trying Hard or Hardly
Trying: An Analysis of Context Effects in Choice. Journal of Consumer
Psychology. 9. 189-200.
Dick, A.S. and Basu, K. (1994) Customer Loyalty: Toward an Integrated Conceptual
Framework. Journal of the Academy of Marketing Science.
EY (2015). Global telecommunications study: navigating the road to 2020
Family, F. (2012). The Rise of Multi-SIM users: Customers shifting to dual SIM
phones to have effective control over costs. Nielsen Featured Insights
Fírat, A.F., Dholakia, N. and Venkatesh, A. (1995), Marketing in a postmodern
world, European Journal of Marketing, Vol. 29 No. 1, pp. 40-56.
Felix, R. (2014). Multi-brand loyalty: When one brand is not enough, Qualitative
Market Research: An International Journal, Vol. 17 Issue: 4,
pp.464-480
Firli, A., Primiana, I., Kaltum, U. (2015). The Impact of Increasing CAPEX on
Customer Number, Profit, and ROI in Indonesia Telecommunication
Industry. American Journal of Economics 5 (2), 135-138
GSMA (2018). The Mobile Economy 2018. Global System for Mobile
Communications (GSMA), GSM Association
GSMA (2019). Digital transformation in Tanzania, The role of mobile technology
and impact on development goals. GSM Association

59
GSMA (2019). Tanzania rural coverage pilots Performance report. GSM Association
Hemmati,S., Shapouri F., Keramati, A. (2013) Evaluating the Iran Mobile
Communication Operators by Analytical Network Process (ANP). J
Telecommun Syst Manage 2: 109
ITU (2010). Definitions of World Telecommunication/ICT Indicators, March 2010.
International Telecommunication Union.
Keiningham, T., Aksoy, L., Williams, L., Buoye, A. (2015). The Wallet Allocation
Rule: Winning the Battle for Share. New York: Willey
Konar A. (2009). The Ray Measure: an Alternative Derivation of Marshalls (1890).
Elasticity of Demand. Journal of Quantitative Economics, 7 (2), pp 73-
79.
Kothari, C.R. (2004). Research methodology: Methods and techniques. 2nd. edn.
New Delhi: New Age International (P) Limited.
Kubi, A. (2010). A Survey on the Factors Influencing Multiple Sim Usage in Ghana:
implication for Marketing Strategy
Kumar, S. G. N., Vani, H. and Vandana, S. (2011). An Empirical Research on
Factors Affecting Mobile Subscriber Intention for Switching
between Service Providers in India, International Journal of
Management & Business Studies, Vol. 1, Issue 3, September
Kvale, S., & Brinkman, S. (2009). InterViews: Learning the craft of qualitative
research interviewing (2nd Ed.). Thousand Oaks, CA: Sage
Mamun, (2015). Usages of Multiple Channel to Enjoy Services Conveniently: A
Study on Usage of Multiple Sims by University Students in Sylhet,
Bangladesh.

60
Mayeh, M., Scheepers, R., Valos, M., (2012). Understanding the Role of Social
Media Monitoring in Generating External Intelligence, Researchgate.
NBS. (2018). National Bureau of Statistics, National Population Projections,
Ministry of Finance and Planning, Dar es Salaam
NBS (2017). Gross domestic product by activity at current prices. Dar es Salaam,
National Bureau of Statistics, Ministry of Finance and Planning
Orodho, J. A. (2008). Techniques of Writing Research Proposals and Reports in
Education and Social Sciences, Second Edition, Maseno, Kanezja HP
Enterprises
Research ICT Africa (RIA), 2016. State of the Prepaid Market-Cost of
communication submission to South Africa Parliament.
http://www.researchictafrica.net/home.php?h=187
Silva D., Dimuthu, R. (2009). Social Influence in the Adoption of Mobile Phones in
Bottom of the Pyramid (Bop) Countries. SSRN Electronic Journal 7(3)
Selltiz, C., Jahoda, M., Deutsch, M & Cook, S.(1967). Research methods in social
relations. New York: Holt, Rinehart and Winston, Inc.
Sutherland E, (2009) Counting customers, subscribers and mobile phone numbers.
Info, 11(2), pp.6-23
TCRA, (2018). Quarterly Communications Statistics. Retrieved April 29, 2018 from
the World Wide Web:https://www.tcra.go.tz/index.php/quarterly-
telecommunications-statistics
Thulasingam M, (2008), Telephone Survey as a Method of Data Collection in South
India. Indian J Community Med. 2008 Oct; 33(4): 268–270.
61
Tom C. W., (2011). A Behavioural Framework for Securities Risk, 34 Seattle U. L.
Rev. 325 Retrieved April 29, 2018, from World Wide
Webhttp://scholarship.law.ufl.edu/facultypub/114
Trochim, W. & Land, D. (1982). Designing designs for research Advances in Quasi-
Experimentation. The Researcher, 1, 1-6
Tuominen, P. (1999). Managing Brand Equity. Turku School of Economics and
Business Administration, 65-100.
UCC, (2018). Post, Broadcasting and Telecommunications Market & Industry Q2
Report, 2018. Retrieved April 29, 2018 from the World Wide:
https://www.ucc.co.ug/wp-content/uploads/2017/09/Communication-
Sector-Performance-for-the-Quarter-ending-June-2018.pdf
Ulver S., & Ostberg J. (2014) Moving up, down or sideways? Exploring consumer
experience of identity and status incongruence, European Journal of
Marketing, Vol. 48 Issue: 5/6, pp.833-853
Valdecantos, C. (2008). Emerging Markets – Mobile Market Review. Retrieved
April 24, 2018 from the World Wide Web:
https://www.scribd.com/doc/49868568/mmC-Group-s-PoVon-Multiple-
SIM
Vicente, Reis and Maria, S. (2009). Using mobile phones for survey research, a
comparison with fixed phones. International Journal of Market Research
Vol. 51 Issue 5
Vebrová, T. Venclová1, K. Rojík1, S., (2016). Customer segmentation by factors
influencing brand loyalty and customer involvement. Acta Universitatis
Agriculturae et Silviculturae Mendelianae Brunensis, 64(5): 1797–1804.
Xavier, P. and Kallinikios, J. 2011. Behavioural economics and customer complaints
in the communications sector. Communication Economics and

62
Electronic Markets Research Centre (ed), International
Telecommunications Society 5th Africa-Asia-Australasia Regional
Conference, Nov 13 2011.
Yoon, K. and Thanh V (2011). Revisiting the Relationship between Consumer
Loyalty and Price Sensitivity: The Moderating Role of Deal-Proneness.
Journal of Marketing Theory and Practice.
Zacharia, A. (2018, May 22). Caution as mobile money theft rise. The Citizen.
Retrieved June 23, 2018 from the World Wide Web:
https://www.thecitizen.co.tz/news/-Caution-as-mobile-money-theft
rises/1840340-4573960-7h9n8/index.html
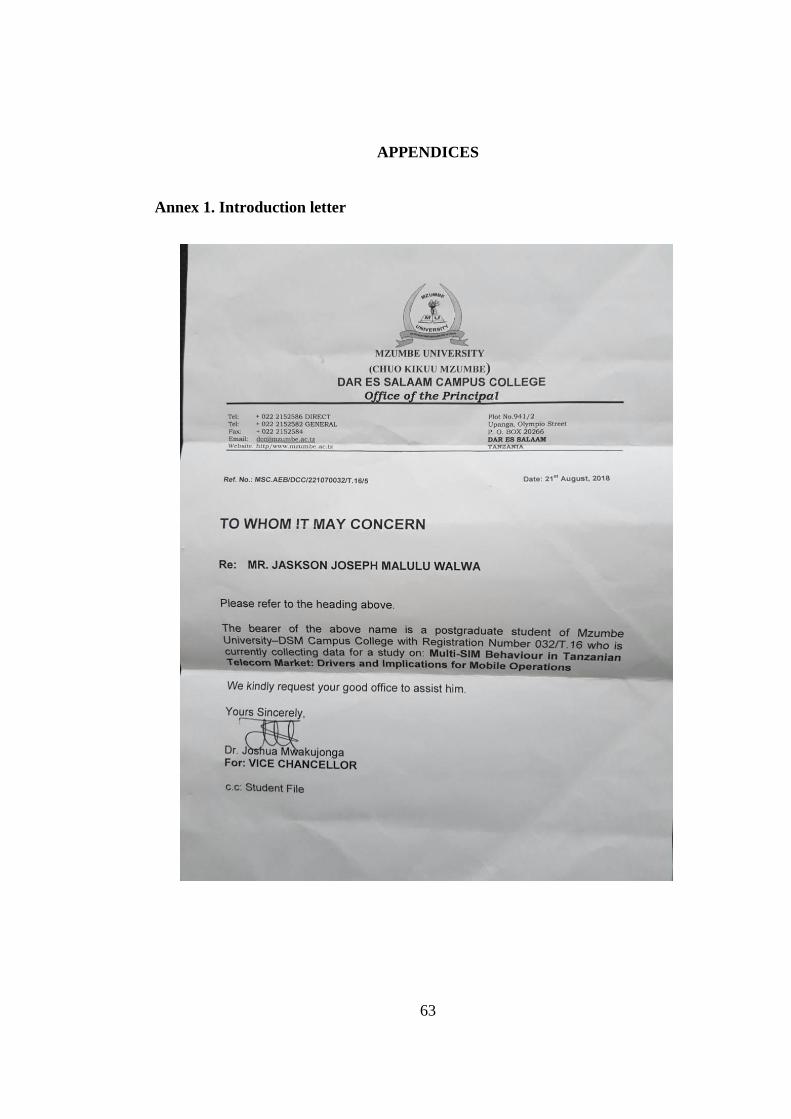
63
APPENDICES
Annex 1. Introduction letter

64
Annex 2: Questionnaire for mobile phone users.
Dear participant,
I’m a student of MSc. Applied Economics and Business at Mzumbe University
College - Dar es Salaam Campus. I’m conducting my thesis on MULTI-SIM
BEHAVIOUR IN TANZANIAN TELECOM MARKET: DRIVERS AND
ECONOMIC IMPLICATIONS FOR MOBILE OPERATORS. The aim of this
study is to provide a comprehensive analysis of drivers of multiple SIM usage by
mobile subscribers in Tanzania. The study intends to benefit the telecom companies,
customers and policymakers. It will provide valuable data and insights to assist
telecom companies and policymakers in understanding the phenomena of consumer
using multiple SIM cards which will help them design competitive strategies and
efficient policies respectively, and hence improve overall mobile customer
experience. I will request for your participation by answering below questions. Your
responses will remain confidential and will be used only for the purpose of this
study.

65
1. What is your gender?
Female
Male
2. What age group are you in?
Under 18
18-24
25-34
35-44
45-54
55-64
65+
3. What is your educational level?
None
Primary
Secondary
Tertiary
University
4. Which of the following categories best describes your employment status?
Employed, working full-time
Employed, working part-time
Self-employed (Personal business)
Student
Retired
Not Employed
5. If you are employed, does your employer pay for your mobile bills?
66
YES
NO
6. In total, how long have you been using mobile services?
Less than 6 months
6 Months to 1 year
3 years to 5 years
5 years to 10 years
More than 10 years
7. How long have you been using this mobile phone number?
Less than 6 months
6 Months to 1 year
3 years to 5 years
5 years to 10 years
More than 10 years
8. How many SIM cards do you have (have used at least once in the last three
months)?
1
2
3
4
5
6
7
More than 7
9. How did you acquire your SIM card
Another person bought it for me

67
Sales person recommended it for me
I went myself knowing which Sim card to buy
Given for free by sales person
10. How many SIM card slots does the phone you are using have?
One
Two
Three
More than three
I don’t know
11. Which of mobile you are using? Rank by order of usage frequency
Vodacom Tigo Airtel Halotel Zantel TTCL Smart
Number
1
Number
2
Number
3
Number
4
Number
5
Number
6
Number
7
12. How do you use more than one SIM card on your mobile phone?

68
I have two different two phones
I have a mobile phone that holds more than one SIM card at once
My mobile phone holds one SIM card only, which I change manually
as required
I have a second device which uses data or SMS only ( Modem, Car
Tracking, Tablet)
13. If you recently acquired a new SIM card (i.e. this month), how do you plan to
use the new SIM card?
Keep both old and new
Use it only temporally as second SIM
Switch from the previous and only use this new SIM
I haven't acquired a new SIM recently
14. Which services do you use with the mobile SIM cards
Voice SMS
Internet
services
Mobile
Money
Extra
services
(VAS)
Vodacom
Tigo
Airtel
Halotel
Zantel
TTCL
Smart
15. How many of the calls are made to people who use the different network as
you using this number?
I don’t make calls to other mobiles networks
About a quarter

69
About half
About three-quarters
16. How likely are you to switch to another brand if this alternative was cheaper?
Not Likely
Likely
Most likely
17. How likely are you to switch to another network if more than half of your
friends start using a new network
Not Likely
Likely
Most likely
18. When choosing a mobile network, which of the following factors is most
important to you?
Products and Services
Price
Network Quality
Convenience
Brand
Network Coverage
Operator that has closed user group offers (CUG)
19. Which mobile plan do you use with your MAIN operator?
Prepaid
Postpaid
Both (Hybrid)
20. What is the range of your total mobile spend for voice, SMS and internet
during one month period in TZS?

70
Below 1,000
1,001-5,000
5,001- 20,000
20,001-50,000
Above 50,00
21. Which network offers you the best quality of service for each of these
products?
Vodacom Tigo Airtel Halotel TTCL Zantel Smart
Internet
Mobile
money
Voice
SMS
Entertainment
Gaming
Loan
22. How would you rate the quality of service of your operator (This number) on
the following items in terms of satisfaction?
dissatisfied satisfied
very
satisfied
Call centre
Airtime Availability
SIM swap points
Service Shops
New SIM card
Viability
Wakala Availability
(Pesa)

71
23. What are the reasons that make you use more than one SIM card?
Overcome poor network coverage
Avoiding service outages
Cheap on-net calls
Discounts and sales promotions
Prestige or social statue
Separate business and personal uses
Family and Friends use those Networks
24. What do you dislike most about your mobile services
Poor network coverage
Service outages
Expensive calls to other networks
Very few promotions
Lack of innovation
25. Which of the following mobile operators SIM do you have (i.e., used at least
once in the last 3 months)?
Vodacom
Tigo
Airtel
Halotel
Zantel
TTCL
Smart