comba telecom (2342.hk)
TRANSCRIPT

证券研究报告 COMPANY RESEARCH
请务必阅读正文之后的信息披露和重要声明
Key Data Apr. 16, 2018
Closing Price(HKD) 2.08
Total Shares (Bn) 2.47
Shares Outstanding (Bn) 2.47
Market Cap(HKD/Bn) 5.15
Market Float(HKD/Bn) 5.15
Net Assets (HKD/Bn) 3.81
Total Assets (HKD/Bn) 11.3
BVPS(HKD) 1.35
Analyst
ZHANG Yidong
SAC: S0190510110012
SFC: BIS749
Contact
Jie Liu
SAC:S0190119030006
Outperform
(Initiated) TMT
Comba Telecom (2342.HK) Leading Position in BTS Antennas, Waiting for 5G
17/04/2019
Key Financial Indicators
FY 2018A 2019E 2020E 2021E
Revenue (Mn/HKD) 5,663 6,426 7,504 8,917
YoY (%) 1.8% 13.5% 16.8% 18.8%
Net Profit (Mn/HKD) -171 209 380 607
YoY (%) NA NA 82% 59%
Gross Margin (%) 25.8% 25.7% 26.8% 27.7%
Net Profit Margin (%) -3.5% 2.8% 4.8% 6.7%
ROE (%) -5.2% 4.5% 8.3% 12.0%
EPS (HK cents) -7.07 8.63 15.69 25.03
OCFPS (HKD) 34.09 5.94 20.94 23.74
Highlights
As the worldwide Tier1 BTS antennas supplier, Comba’s BTS antennas shipment accounts for 13% of
worldwide shipment and the construction of 5G network will bring about huge development
opportunities. The company has been selected as the worldwide Tier1 BTS antennas supplier by EJL
Wireless Research for 7 years. The company’s BTS antennas shipment takes up about 13% of
worldwide shipment, which is only secondary to Huawei. Its industrial position is steady. We
predicted that the whole market size of 5G BTS antenna will reach 81 billion CNY, and the market will
reach 19.8 billion CNY at the summit of construction (Year 2023), which is 192% larger than that of
4G era. With the construction of 5G, the revenue of Antennas & Subsystems business will be
3.01/3.41/4.04 billion CNY, with a year-on-year growth rate of 6%/13%/18%.
As the leading position of small-cell industry, the 4G expansion will bring out high-speed development
chance for the company and small-cell will be blooming during middle and later construction periods
of 5G network. Comba started to arrange the development of small cells from 2009. Its product
portfolios can satisfy different demands proposed by telecom operators. In 2018, China Mobile
started a concentrated purchase of distributed PicoRRU of 823 thousand. In this purchase, the
company takes up about 16% quotient, which is 112 million CNY in total. This purchase will benefit
the company’s small-cell business a lot. Also, it indicated that the telecom operators start the 4G
expansion and the small-cell business will enter high-speed development period. We predict that
2019-21 the revenue of company’s network system will be 1.13/1.34/1.60 billion CNY, with a
year-on-year growth rate of 48%/18%/19%.
High research and development expense help to maintain the leading position in technology, and the
company has increased its relative expensive for past 5 years and be well-prepared for 5G technology.
The company’s R&D expense are larger than any other BTS antennas company in China. The high
expense also guarantees the quick response to new products, and realize high-speed iteration of
products to maintain the leading position in industry. The R&D expense rate rises from 2.9% in 2014
to 5.8% in 2018. The company is well-prepared for 5G construction and we believe that the
company will maintain its leading position in 5G era.
Earnings forecasts and investment recommendations:
We predict that 2019-21 the total revenue will be 6.43/7.50/8.92 billion HKD, the net income
attributed to shareholder’s equity will be 0.21/0.38/0.61 billion HKD and the BVPS will be
1.44/1.60/1.85 HKD. According to the average PB of 1.6x, we give the 2019 target price of 2.30 HKD,
which is 10.58% higher than the closing price of Apr. 16th 2019. We give the “Outperform” rating for
initiating coverage.
Potential risks:
The telecom operators’ capex is less than expected; the construction size is less than expected; the
industry competition is severe and the product price decreases.
This English translation of the original Chinese version <京信通信(2342.HK)基站天线龙头,静候
5G 佳音_20190414> issued by Industrial Securities on 2019.4.14 is for information purpose only. In
case of a discrepancy, the Chinese original will prevail.
20385125/36139/20190417 14:25
证券研究报告 COMPANY RESEARCH
请务必阅读正文之后的信息披露和重要声明
- 2 -
Table of Contents
1、Worldwide Tier1 BTS Antennas Supplier, Direct Beneficiary of Telecom Network Construction ................................................................................................................ - 4 -
1.1、Brief introduction ........................................................................................... - 4 -
1.2、The development history of Comba ............................................................... - 6 -
1.3、The equity structure of Comba ...................................................................... - 7 -
2、Steady Position in BTS Antennas and Leading Position in Small Cells .................... - 7 -
2.1、The top manufacturer in BTS Antennas, the position is steady ...................... - 7 -
2.2、Bellwether in small cell industry ................................................................... - 13 -
2.3、High R&D expense ensures leading position ................................................ - 16 -
3、In 5G era Comba’s Businesses May Experience Relaying Type Development ...... - 17 -
3.1、BTS antennas: Increase in both quantity and price, the market may increase rapidly ................................................................................................................... - 17 -
3.2、Small cells: started from wireless enhancement and will relay the development in 5G ...................................................................................................................... - 20 -
4、Prediction and Valuation ..................................................................................... - 21 -
5、Potential Risks: .................................................................................................... - 23 -
Fig.1、 FY2012-18 Company’s revenue, net income and their growth rate .............. - 4 -
Fig.2、 FY2012-17 Company’s gross margin, net income margin and ROE ................ - 4 -
Fig.3、 FY2012-18 Company’s cash flow ................................................................... - 5 -
Fig.4、 FY2012-18 Company’s expenses .................................................................... - 5 -
Fig.5、 FY2016-18 Company’s revenue of different businesses ................................ - 5 -
Fig.6、 FY2016-18 Company’s revenue with different customers ............................. - 5 -
Fig.7、 Development history ..................................................................................... - 6 -
Fig.8、 Equity structure until Jun. 30th, 2018 ............................................................. - 7 -
Fig.9、 The construction of macro-station ................................................................ - 8 -
Fig.10、 FY2012-17 China mainland manufacturers BTS antennas shipment ratio among the world ..................................................................................................................... - 9 -
Fig.11、 FY2017 shipment ratio of different BTS antennas manufacturers ............... - 9 -
Fig.12、 FY 2007-18 China 2G/3G/4G macro-stations number ............................... - 10 -
Fig.13、 FY2012-17 The price of Tongyu’s BTS antennas and its growth rate and gross margin ....................................................................................................................... - 11 -
Fig.14、 FY2012-18 China BTS antennas market size and its growth rate, with the ratio of Comba ................................................................................................................... - 11 -
Fig.15、 Company’s antennas & subsystems products ............................................ - 12 -
Fig.16、 FY 2008-19 Capex of telecom operators and its growth rate ..................... - 13 -
Fig.17、 FY2007-18 Revenue of company’s antennas & subsystems revenue and its growth rate ............................................................................................................... - 13 -
Fig.18、 FY 2015-25 Worldwide newly built small cells under different circumstances
and their total growth rate ........................................................................................ - 14 -
Fig.19、 FY2018 Newly built small cells in different areas ....................................... - 15 -
Fig.20、 FY2018 Newly built small cells under different circumstances .................. - 15 -
Fig.21、 FY2007-18 R&D expense of BTS antennas manufacturers in China ........... - 16 -
Fig.22、 FY 2019-25 prediction of newly built 5G macro-staitons ........................... - 18 -
Fig.23、 Evolution of BTS antennas ......................................................................... - 18 -
Fig.24、 5G Massive-MIMO ..................................................................................... - 19 -
Fig.25、 Antennas and RRU will be combined as AAU ............................................. - 20 -
Fig.26、 The components that AAU includes .......................................................... - 20 -
20385125/36139/20190417 14:25

证券研究报告 COMPANY RESEARCH
请务必阅读正文之后的信息披露和重要声明
- 3 -
Fig.27、 FY2021-28 market size of small cells and its growth rate .......................... - 21 -
Table 1、 Arrangement of BTS working frequency in China .................................... - 8 -
Table 2、 Comparison between Small cells and Macro stations ........................... - 14 -
Table 3、 Previous concentrated purchase of small cells from China Mobile ....... - 15 -
Table 4、 FY2018-2021 company’s financial data and prediction results ............. - 23 - Appendix ................................................................................................................... - 24 -
20385125/36139/20190417 14:25
证券研究报告 COMPANY RESEARCH
请务必阅读正文之后的信息披露和重要声明
- 4 -
Full text of report
1、Worldwide Tier1 BTS Antennas Supplier, Direct Beneficiary of Telecom Network Construction
1.1、Brief introduction
As the worldwide tier1 BTS antennas supplier, Comba has steady industrial position.
Comba telecom is a wireless solution provider integrated research and development,
production, sale and service. Its core business is to provide wireless access, wireless
enhancement, antennas & subsystems, wireless transmission and other multiple
products and services. The company has been elected as the worldwide tier1 BTS
antennas supplier by EJL Wireless Research for 7 years. And according to the report
established by EJL Wireless Research in 2017, the market share by shipment of Comba
is 13% worldwide, which is secondary to Huawei. Its market share in China is about 20%.
Besides, the company started to arrange for small cell business from about ten years
ago, and it’s now taking a leading position in this industry. In recent concentrated
purchase of telecom operators, the company has also got a relatively large quotient.
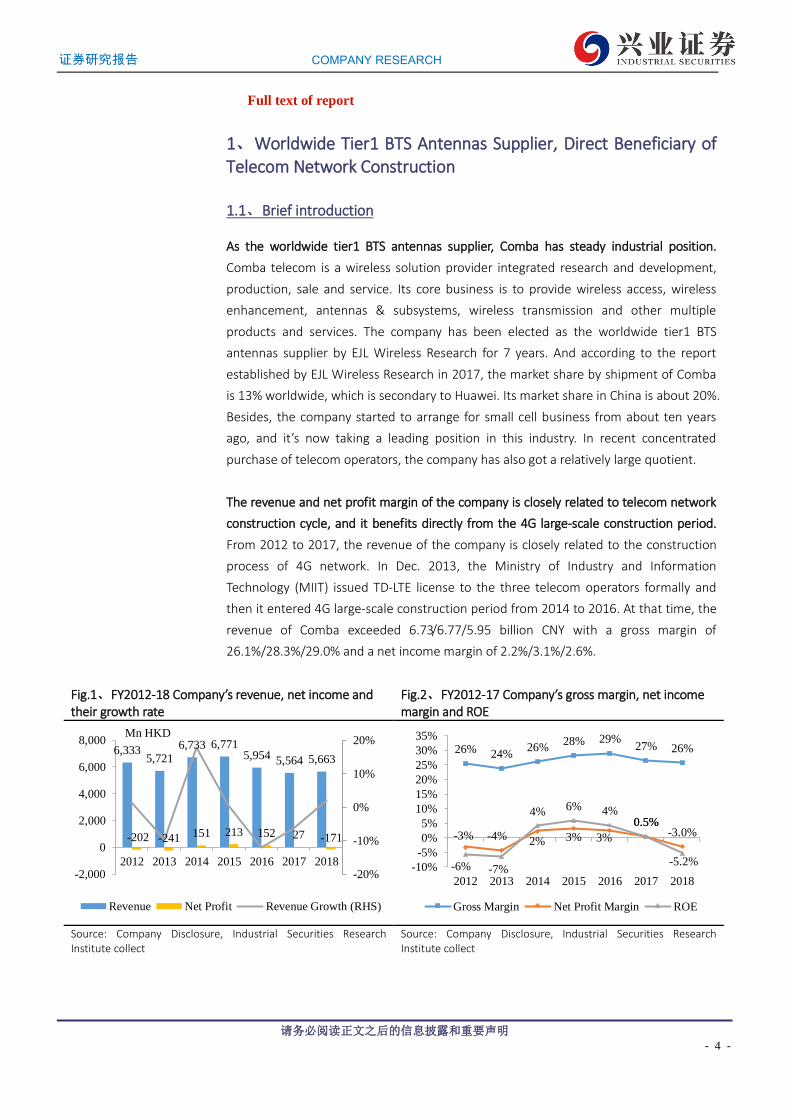
The revenue and net profit margin of the company is closely related to telecom network
construction cycle, and it benefits directly from the 4G large-scale construction period.
From 2012 to 2017, the revenue of the company is closely related to the construction
process of 4G network. In Dec. 2013, the Ministry of Industry and Information
Technology (MIIT) issued TD-LTE license to the three telecom operators formally and
then it entered 4G large-scale construction period from 2014 to 2016. At that time, the
revenue of Comba exceeded 6.73/6.77/5.95 billion CNY with a gross margin of
26.1%/28.3%/29.0% and a net income margin of 2.2%/3.1%/2.6%.
Fig.1、FY2012-18 Company’s revenue, net income and their growth rate
Fig.2、FY2012-17 Company’s gross margin, net income margin and ROE
6,3335,721
6,733 6,7715,954 5,564 5,663
-202 -241 151 213 152 27 -171
-20%
-10%
0%
10%
20%
-2,000
0
2,000
4,000
6,000
8,000
2012 2013 2014 2015 2016 2017 2018
Revenue Net Profit Revenue Growth (RHS)
Mn HKD
26% 24%26%
28% 29%27% 26%
-3% -4% 2% 3% 3%
0.5%-3.0%
-6% -7%
4% 6% 4%0.5%
-5.2%-10%
-5%
0%
5%
10%
15%
20%
25%
30%
35%
2012 2013 2014 2015 2016 2017 2018
Gross Margin Net Profit Margin ROE
Source: Company Disclosure, Industrial Securities Research Institute collect
Source: Company Disclosure, Industrial Securities Research Institute collect
20385125/36139/20190417 14:25
证券研究报告 COMPANY RESEARCH
请务必阅读正文之后的信息披露和重要声明
- 5 -
Fig.3、FY2012-18 Company’s cash flow Fig.4、FY2012-18 Company’s expenses
201 301 141
1,089
412 322
826
-69
-533
-143 -179
-536 -693
279
-56 13
-386
-107 12
-1,000
-500
-
500
1,000
1,500
2012 2013 2014 2015 2016 2017 2018
Operating Cash Flow Investment Cash Flow
Financing Cash Flow
Mn HKD
8%9%
8% 7%
9% 9%8%
14% 14%
12% 12% 12%10%
12%
6%
4%3%
3%
4%6% 6%
3%4%
4% 5%
3%3% 3%
0%
5%
10%
15%
2012 2013 2014 2015 2016 2017 2018
Selling Expense Ratio G&A Expense Ratio
R&D Expense Ratio Finatial Expense Ratio
Source: Company Disclosure, Industrial Securities Research Institute collect
Source: Company Disclosure, Industrial Securities Research Institute collect
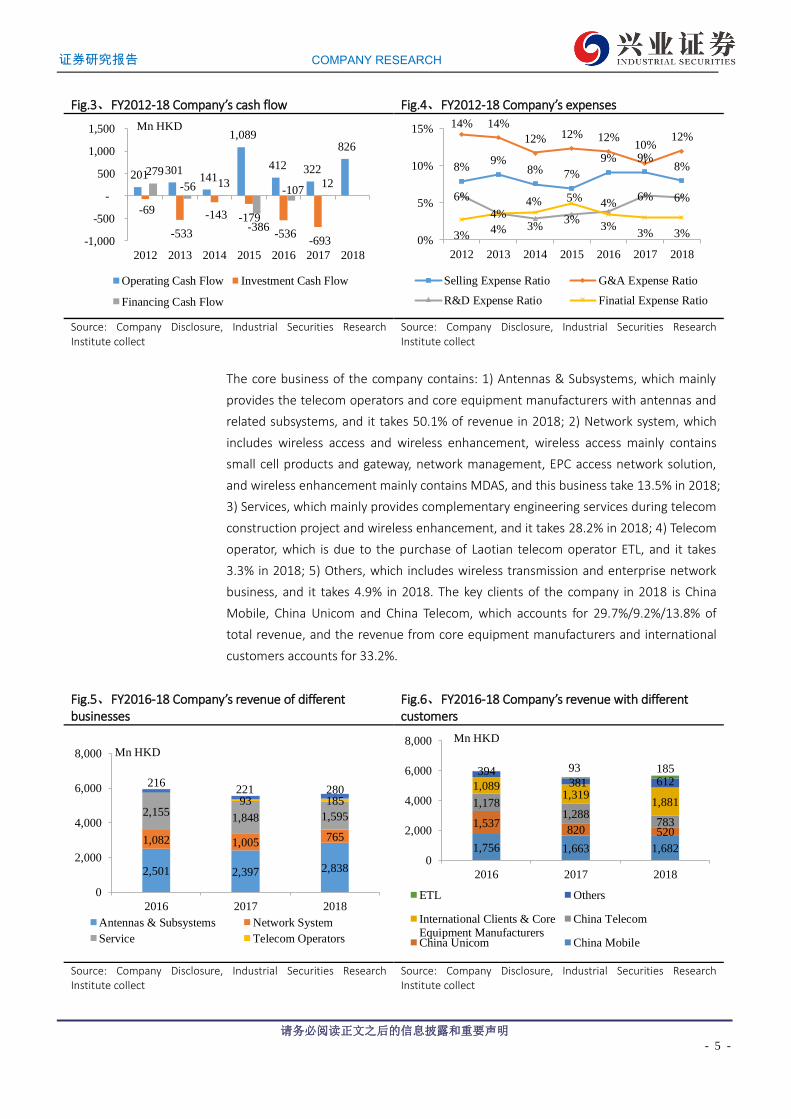
The core business of the company contains: 1) Antennas & Subsystems, which mainly
provides the telecom operators and core equipment manufacturers with antennas and
related subsystems, and it takes 50.1% of revenue in 2018; 2) Network system, which
includes wireless access and wireless enhancement, wireless access mainly contains
small cell products and gateway, network management, EPC access network solution,
and wireless enhancement mainly contains MDAS, and this business take 13.5% in 2018;
3) Services, which mainly provides complementary engineering services during telecom
construction project and wireless enhancement, and it takes 28.2% in 2018; 4) Telecom
operator, which is due to the purchase of Laotian telecom operator ETL, and it takes
3.3% in 2018; 5) Others, which includes wireless transmission and enterprise network
business, and it takes 4.9% in 2018. The key clients of the company in 2018 is China
Mobile, China Unicom and China Telecom, which accounts for 29.7%/9.2%/13.8% of
total revenue, and the revenue from core equipment manufacturers and international
customers accounts for 33.2%.
Fig.5、FY2016-18 Company’s revenue of different businesses
Fig.6、FY2016-18 Company’s revenue with different customers
2,501 2,397 2,838
1,082 1,005765
2,1551,848 1,595
93 185
216221 280
0
2,000
4,000
6,000
8,000
2016 2017 2018
Antennas & Subsystems Network System
Service Telecom Operators
Mn HKD
1,756 1,663 1,682
1,537820 520
1,1781,288
783
1,0891,319
1,881
394381 612
93 185
0
2,000
4,000
6,000
8,000
2016 2017 2018
ETL Others
International Clients & Core
Equipment Manufacturers
China Telecom
China Unicom China Mobile
Mn HKD
Source: Company Disclosure, Industrial Securities Research Institute collect
Source: Company Disclosure, Industrial Securities Research Institute collect
20385125/36139/20190417 14:25
证券研究报告 COMPANY RESEARCH
请务必阅读正文之后的信息披露和重要声明
- 6 -
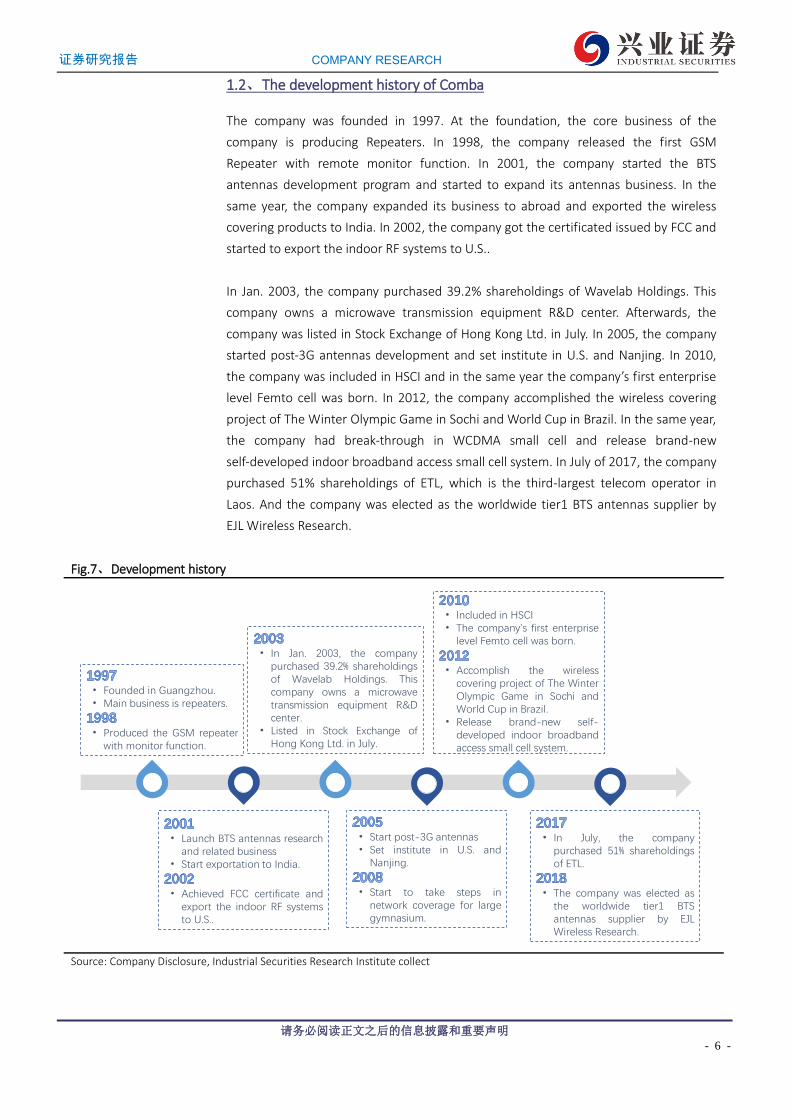
1.2、The development history of Comba
The company was founded in 1997. At the foundation, the core business of the
company is producing Repeaters. In 1998, the company released the first GSM
Repeater with remote monitor function. In 2001, the company started the BTS
antennas development program and started to expand its antennas business. In the
same year, the company expanded its business to abroad and exported the wireless
covering products to India. In 2002, the company got the certificated issued by FCC and
started to export the indoor RF systems to U.S..
In Jan. 2003, the company purchased 39.2% shareholdings of Wavelab Holdings. This
company owns a microwave transmission equipment R&D center. Afterwards, the
company was listed in Stock Exchange of Hong Kong Ltd. in July. In 2005, the company
started post-3G antennas development and set institute in U.S. and Nanjing. In 2010,
the company was included in HSCI and in the same year the company’s first enterprise
level Femto cell was born. In 2012, the company accomplished the wireless covering
project of The Winter Olympic Game in Sochi and World Cup in Brazil. In the same year,
the company had break-through in WCDMA small cell and release brand-new
self-developed indoor broadband access small cell system. In July of 2017, the company
purchased 51% shareholdings of ETL, which is the third-largest telecom operator in
Laos. And the company was elected as the worldwide tier1 BTS antennas supplier by
EJL Wireless Research.
Fig.7、Development history
• Launch BTS antennas researchand related business
• Start exportation to India.
• Achieved FCC certificate andexport the indoor RF systemsto U.S..
• In Jan. 2003, the companypurchased 39.2% shareholdingsof Wavelab Holdings. Thiscompany owns a microwavetransmission equipment R&Dcenter.
• Listed in Stock Exchange ofHong Kong Ltd. in July.
• Included in HSCI• The company’s first enterprise
level Femto cell was born.
• Accomplish the wirelesscovering project of The WinterOlympic Game in Sochi andWorld Cup in Brazil.
• Release brand-new self-developed indoor broadbandaccess small cell system.
• In July, the companypurchased 51% shareholdingsof ETL.
• The company was elected asthe worldwide tier1 BTSantennas supplier by EJLWireless Research.
• Founded in Guangzhou.• Main business is repeaters.
• Produced the GSM repeaterwith monitor function.
• Start post-3G antennas• Set institute in U.S. and
Nanjing.
• Start to take steps innetwork coverage for largegymnasium.
Source: Company Disclosure, Industrial Securities Research Institute collect
20385125/36139/20190417 14:25
证券研究报告 COMPANY RESEARCH
请务必阅读正文之后的信息披露和重要声明
- 7 -
1.3、The equity structure of Comba
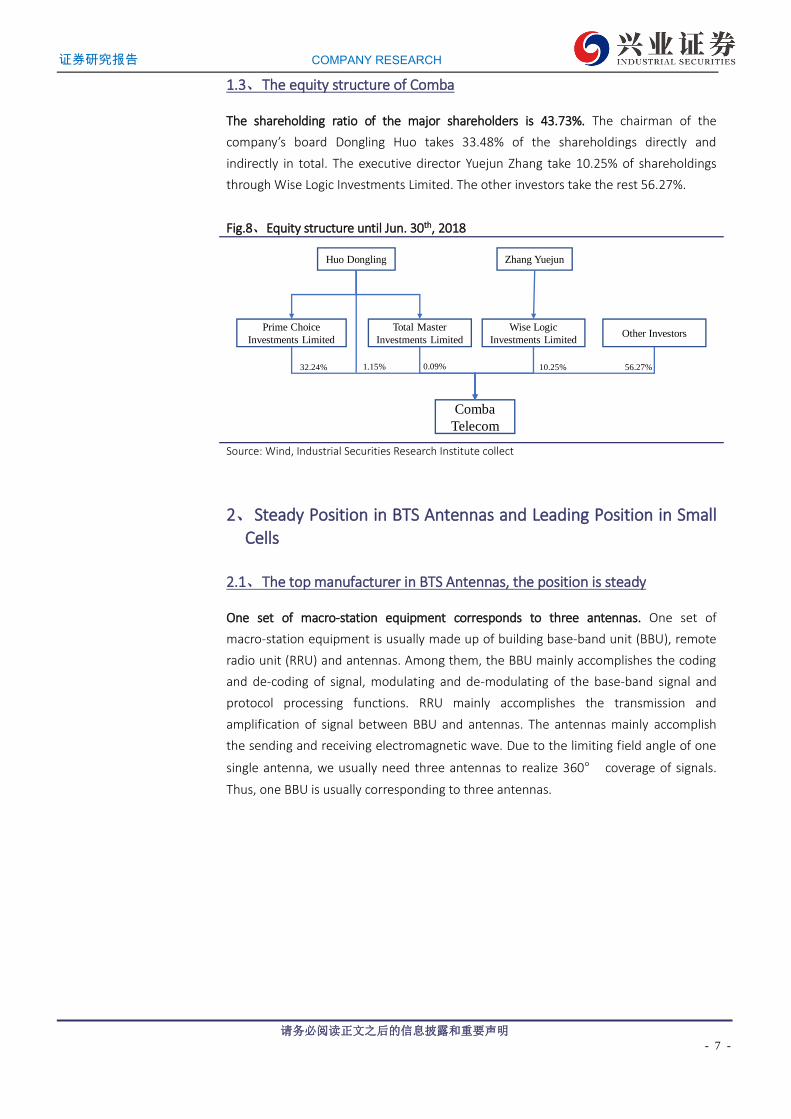
The shareholding ratio of the major shareholders is 43.73%. The chairman of the
company’s board Dongling Huo takes 33.48% of the shareholdings directly and
indirectly in total. The executive director Yuejun Zhang take 10.25% of shareholdings
through Wise Logic Investments Limited. The other investors take the rest 56.27%.
Fig.8、Equity structure until Jun. 30th, 2018
Comba
Telecom
Prime Choice
Investments Limited
Wise Logic
Investments Limited
Huo Dongling
32.24% 10.25%1.15% 56.27%
Other Investors
Zhang Yuejun
Total Master
Investments Limited
0.09%
Source: Wind, Industrial Securities Research Institute collect
2、Steady Position in BTS Antennas and Leading Position in Small Cells
2.1、The top manufacturer in BTS Antennas, the position is steady
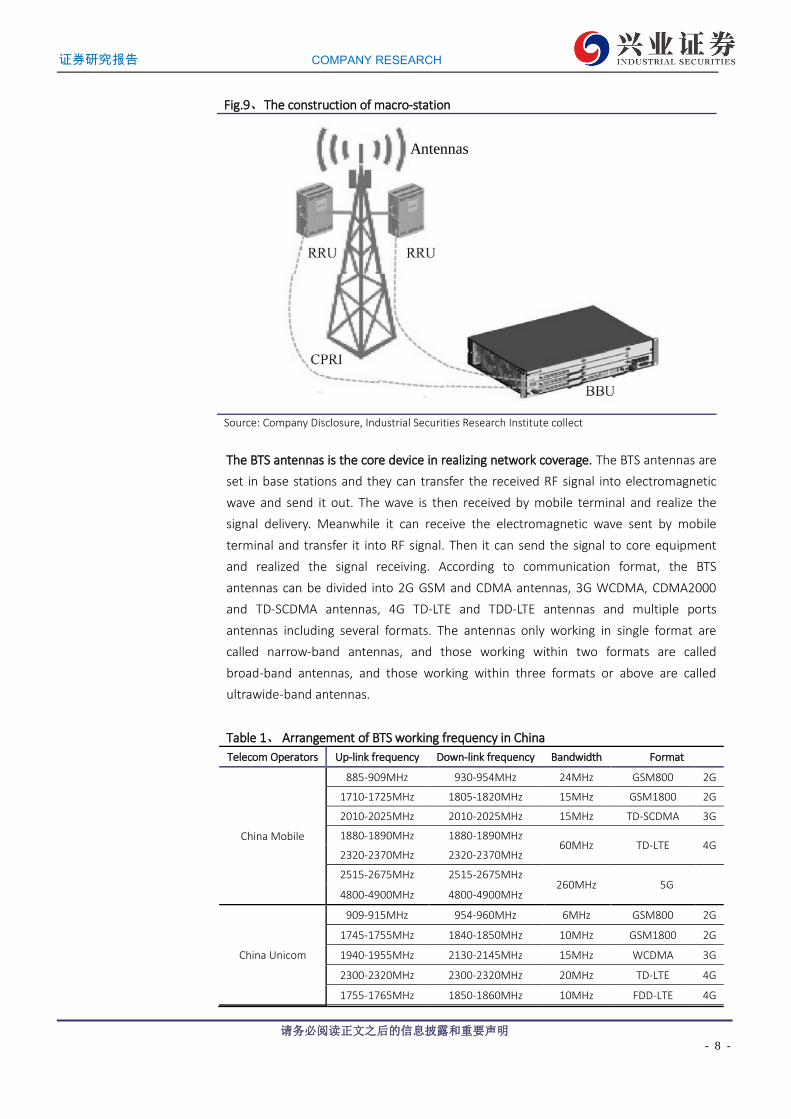
One set of macro-station equipment corresponds to three antennas. One set of
macro-station equipment is usually made up of building base-band unit (BBU), remote
radio unit (RRU) and antennas. Among them, the BBU mainly accomplishes the coding
and de-coding of signal, modulating and de-modulating of the base-band signal and
protocol processing functions. RRU mainly accomplishes the transmission and
amplification of signal between BBU and antennas. The antennas mainly accomplish
the sending and receiving electromagnetic wave. Due to the limiting field angle of one
single antenna, we usually need three antennas to realize 360° coverage of signals.
Thus, one BBU is usually corresponding to three antennas.
20385125/36139/20190417 14:25
证券研究报告 COMPANY RESEARCH
请务必阅读正文之后的信息披露和重要声明
- 8 -
Fig.9、The construction of macro-station
Antennas
Source: Company Disclosure, Industrial Securities Research Institute collect
The BTS antennas is the core device in realizing network coverage. The BTS antennas are
set in base stations and they can transfer the received RF signal into electromagnetic
wave and send it out. The wave is then received by mobile terminal and realize the
signal delivery. Meanwhile it can receive the electromagnetic wave sent by mobile
terminal and transfer it into RF signal. Then it can send the signal to core equipment
and realized the signal receiving. According to communication format, the BTS
antennas can be divided into 2G GSM and CDMA antennas, 3G WCDMA, CDMA2000
and TD-SCDMA antennas, 4G TD-LTE and TDD-LTE antennas and multiple ports
antennas including several formats. The antennas only working in single format are
called narrow-band antennas, and those working within two formats are called
broad-band antennas, and those working within three formats or above are called
ultrawide-band antennas.
Table 1、 Arrangement of BTS working frequency in China
Telecom Operators Up-link frequency Down-link frequency Bandwidth Format
China Mobile
885-909MHz 930-954MHz 24MHz GSM800 2G
1710-1725MHz 1805-1820MHz 15MHz GSM1800 2G
2010-2025MHz 2010-2025MHz 15MHz TD-SCDMA 3G
1880-1890MHz 1880-1890MHz 60MHz TD-LTE 4G
2320-2370MHz 2320-2370MHz
2515-2675MHz 2515-2675MHz 260MHz 5G
4800-4900MHz 4800-4900MHz
China Unicom
909-915MHz 954-960MHz 6MHz GSM800 2G
1745-1755MHz 1840-1850MHz 10MHz GSM1800 2G
1940-1955MHz 2130-2145MHz 15MHz WCDMA 3G
2300-2320MHz 2300-2320MHz 20MHz TD-LTE 4G
1755-1765MHz 1850-1860MHz 10MHz FDD-LTE 4G
20385125/36139/20190417 14:25

证券研究报告 COMPANY RESEARCH
请务必阅读正文之后的信息披露和重要声明
- 9 -
3500-3600MHz 3500-3600MHz 100MHz 5G
China Telecom
825-840MHz 870-885MHz 15MHz CDMA 2G
1920-1935MHz 2110-2125MHz 15MHz CDMA2000 3G
2370-2390MHz 2370-2390MHz 20MHz TD-LTE 4G
1765-1780MHz 1860-1875MHz 15MHz FDD-LTE 4G
3400-3500MHz 3400-3500MHz 100MHz 5G
Source: MIIT, Industrial Securities Research Institute collect
The shipment of Chinese BTS antennas manufacturers exceeds 50% of the total market
size and Comba is one of the top manufacturers in BTS antennas industry. With the
construction of 3G/4G network, the manufacturing level of Chinese telecom equipment
and devices is promoted step by step and the market share is gradually increased. From
2012 to 2017, the ratio is increased from 35.0% to 62.0%. Among them, Comba is one
of the top manufacturers and it takes up 13% of worldwide shipment in 2017, which is
only secondary to Huawei.
Fig.10、FY2012-17 China mainland manufacturers BTS antennas shipment ratio among the world
13% 16% 17% 18% 14% 13%
5% 5% 7% 7% 7% 7%6%
7%9% 11% 13%
8%7%
11%14%
26%21% 32%
4%2%
3%
2%2%
2%65% 59%
50%36%
43% 38%
0%
20%
40%
60%
80%
100%
2012 2013 2014 2015 2016 2017
Comba Tongyu Mobi Huawei Shenglu Fiberhome Others
Source: EJL Wireless Research, Industrial Securities Research Institute collect
Fig.11、FY2017 shipment ratio of different BTS antennas manufacturers
32%
13%
12%
8%
7%
7%
5%
16%
Huawei
Comba
CommScope
Mobi
Tongyu
ACE
Kathrein
Others
Source: EJL Wireless Research, Industrial Securities Research Institute collect
At the beginning construction of new network, the number of base stations is growing
fast and spurs the high-speed development of BTS antennas industry. From 2007 to 2018,
the number of Chinese base station grows from 461 thousand to 6.48 million, with a
20385125/36139/20190417 14:25

证券研究报告 COMPANY RESEARCH
请务必阅读正文之后的信息披露和重要声明
- 10 -
CAGR of 27.2%. Nowadays, the number of 2G/3G/4G base stations is 1.59/1.17/3.72
million, In January of 2009, the MIIT issued the 3G license formally, which indicated
that we entered into the large-scale construction of 3G network. At that year, the
growth rate of base station reached 62.5%, and the construction speed gradually slows
down. In December of 2013, MIIT issued TD-LTE license formally, and we entered into
the large-scale construction of 4G network. In the next year, the growth rate of base
station reached 41.0%, and slows down afterwards. Driven by the construction of base
stations, the size of Chinese BTS antennas industry grows rapidly. In 2014, the growth
rate of the BTS antennas industry achieved 31.6%.
Fig.12、FY 2007-18 China 2G/3G/4G macro-stations number
461 689 832 939 1,120 1,246 1,317 1,383 1,457 1,550 1,570 1,5900 0
287 459 632 820 1,093 1,284 1,440 1,410 1,340 1,170
0 00 0
00
0730
1,7712,630 3,280 3,720
0%
10%
20%
30%
40%
50%
60%
70%
0
1,000
2,000
3,000
4,000
5,000
6,000
7,000
2007 2008 2009 2010 2011 2012 2013 2014 2015 2016 2017 2018
2G Stations 3G Stations 4G Stations Total Number YoY(RHS)
Thousand sites 4G EraDec. 2013 4G license released
3G EraJan. 2009 3G license released
Source: MIIT, Industrial Securities Research Institute collect
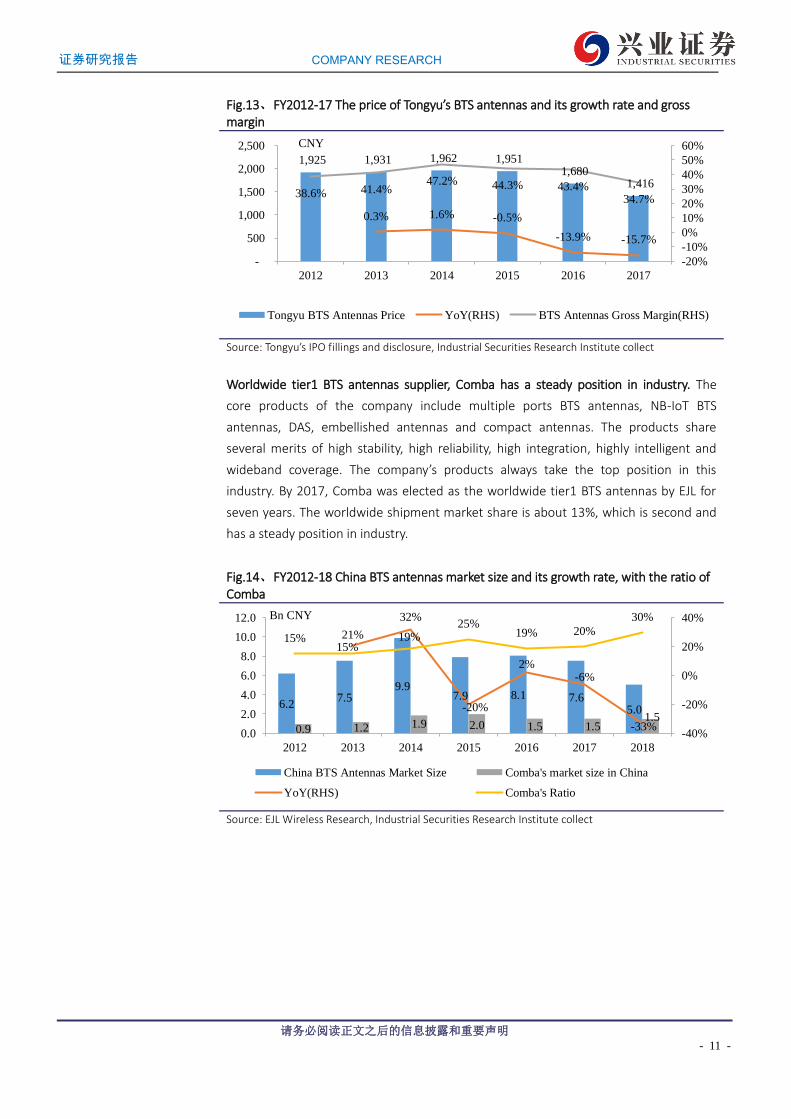
At the beginning of the construction cycle, the price of BTS antennas is relatively high
and will decrease gradually with the expansion of the construction. In the construction
cycle of the newest telecom network, the price of BTS antennas appears to be high at
the beginning and lower in the end. The price is relatively high is due to the following
two reasons. This first one is that the telecom operators usually raise the construction
speed to attribute the top customers and they will offer a relatively high price to make
sure the sufficient supply of the products. The second one is that the technique is not
mature yet and only a few antennas manufacturer has the massive production ability,
and they have the bargain power. Otherwise, the original cost is relatively high, the final
price is relatively high. With the expansion of the construction, the new technique
becomes mature gradually and the scale effect shows up. The cost of the product is
lower and the price is lower. Meanwhile, the gross margin of the BTS antennas also
drops.
20385125/36139/20190417 14:25
证券研究报告 COMPANY RESEARCH
请务必阅读正文之后的信息披露和重要声明
- 11 -
Fig.13、FY2012-17 The price of Tongyu’s BTS antennas and its growth rate and gross margin
1,925 1,931 1,962 1,951 1,680
1,416
0.3% 1.6% -0.5%
-13.9% -15.7%
38.6% 41.4%47.2% 44.3% 43.4%
34.7%
-20%
-10%
0%
10%
20%
30%
40%
50%
60%
-
500
1,000
1,500
2,000
2,500
2012 2013 2014 2015 2016 2017
Tongyu BTS Antennas Price YoY(RHS) BTS Antennas Gross Margin(RHS)
CNY
Source: Tongyu’s IPO fillings and disclosure, Industrial Securities Research Institute collect
Worldwide tier1 BTS antennas supplier, Comba has a steady position in industry. The
core products of the company include multiple ports BTS antennas, NB-IoT BTS
antennas, DAS, embellished antennas and compact antennas. The products share
several merits of high stability, high reliability, high integration, highly intelligent and
wideband coverage. The company’s products always take the top position in this
industry. By 2017, Comba was elected as the worldwide tier1 BTS antennas by EJL for
seven years. The worldwide shipment market share is about 13%, which is second and
has a steady position in industry.
Fig.14、FY2012-18 China BTS antennas market size and its growth rate, with the ratio of Comba
6.27.5
9.97.9 8.1 7.6
5.0
0.9 1.2 1.9 2.0 1.5 1.51.5
21%
32%
-20%
2%-6%
-33%
15%15%
19%25%
19% 20%
30%
-40%
-20%
0%
20%
40%
0.0
2.0
4.0
6.0
8.0
10.0
12.0
2012 2013 2014 2015 2016 2017 2018
China BTS Antennas Market Size Comba's market size in China
YoY(RHS) Comba's Ratio
Bn CNY
Source: EJL Wireless Research, Industrial Securities Research Institute collect
20385125/36139/20190417 14:25

证券研究报告 COMPANY RESEARCH
请务必阅读正文之后的信息披露和重要声明
- 12 -
Fig.15、Company’s antennas & subsystems products
Macro-station Tower
Antenna Subsystems
BTS Antennas
Source: Company Website, Industrial Securities Research Institute collect
The revenue of antennas & subsystems business is influenced significantly by the
construction process of Chinese telecom network. The key customers of the company
are the three telecom operators and core equipment manufacturers. Thus, the
antennas & subsystems business is influenced by construction process. With the
construction of domestic 3G network, the capex of the three telecom operators
reached 279.9 billion CNY, with a year-on-year growth rate of 9.7%. The revenue of
antennas & subsystems business reached 1.4 billion HKD in 2009, with a year-on-year
growth rate of 71.0%. Afterwards in large scale construction of 4G network, from 2013
to 2015, the capex of telecom operators was 338.4/376.9/438.6 billion CNY, with a
year-on-year growth rate of 20.5%/11.4%/16.4%. From 2014 to 2015, the revenue of
antennas & subsystems reached 2.6/3.1 billion HKD, with a year-on-year growth rate of
40.2%/18.2%. Each time the antennas & subsystems will experience high-speed
development with large scale construction of domestic network construction, and the
slows down gradually afterwards. In 2019, the g) is expected to be 122.9 billion with a
year-on-year growth rate of 5.1%. Besides, the 5G capex will be 34 billion CNY. We
predict that with the increasing of the telecom operators’ capex, the revenue of the
BTS antennas & subsystems will increase furtherly.
20385125/36139/20190417 14:25

证券研究报告 COMPANY RESEARCH
请务必阅读正文之后的信息披露和重要声明
- 13 -
Fig.16、FY 2008-19 Capex of telecom operators and its growth rate
9.7%
-15.1%
7.3%10.2%
20.5%
11.4%
16.4%
-18.8%
-13.4%
-7.0%
5.9%
-25%
-20%
-15%
-10%
-5%
0%
5%
10%
15%
20%
25%
0
100
200
300
400
500
2008 2009 2010 2011 2012 2013 2014 2015 2016 2017 2018 2019E
China Mobile China Unicom
China Telecom Total Capex YoY(RHS)
Bn CNY
Source: Telecom Operators Disclosure,Industrial Securities Research Institute collect
Fig.17、FY2007-18 Revenue of company’s antennas & subsystems revenue and its growth rate
0.5 0.8
1.4 1.4
1.8 1.8 1.9
2.6
3.1
2.5 2.4
2.8
-40%
-20%
0%
20%
40%
60%
80%
-
0.5
1.0
1.5
2.0
2.5
3.0
3.5
2007 2008 2009 2010 2011 2012 2013 2014 2015 2016 2017 2018
Antennas & Subsystems Revenue YoY (RHS)
Bn HKD
Source: Company Disclosure, Industrial Securities Research Institute collect
2.2、Bellwether in small cell industry
Small cells were born from femtocells and for indoor wireless enhancement. The
prototypes of small cells are femtocells. The femtocells were born during transition
time from 2G to 3G. Due to the higher carrier frequency used in 3G, the transmission
loss is much larger during the signal propagates from outdoor to indoor and there are
many blind areas indoor. The indoor telecom network quality drops significantly.
Besides, 70-80% of telephony and data services are indoor demands. To solve this
problem, the femtocells are invented. With the development of femtocells, this kind of
cells is turned into small cells and the application scenarios are expanded to enterprise,
urban public, rural and remote.
Realizing dense telecom network with low cost, small cells can satisfy higher capacity and
data demand. With the increasing number of telecom users and demand of data
services, the capacity of indoor and outdoor telecom network is growing gradually. This
also brings out huge challenge to carrying ability of the nowadays network. Utilizing
20385125/36139/20190417 14:25

证券研究报告 COMPANY RESEARCH
请务必阅读正文之后的信息披露和重要声明
- 14 -
ultra-dense sites was proved to be more effective and feasible and the small cells are
born for this purpose. The small cells are indoor/outdoor accessing sites with the ability
to cover tens/hundreds of meters of area with low power. This can increase the number
of sites with low cost to realize the in-depth coverage of telecom network.
Table 2、 Comparison between Small cells and Macro stations Small cells Macro Stations
FemtoCell Picocell Microcell
Coverage 50 m 250 m 500 m 200 m to 2 km
Users 8-16 person 32-64 person 32-200 person Thousands
Power
consumption 100mW 250mW 2-5W Hundreds of W
Price (CNY) 1000 to 100000 10000 to 100000
Application
scenarios Family and enterprise
Public indoor area
including airports,
railway stations,
shopping malls, etc.
Outdoor Outdoor
Source: Huaqiang Electrical Website, Industrial Securities Research Institute collect
The overseas small cells were born in 3G era and the domestic small cells just take off.
For the overseas market, the American telecom operator Sprint start to commercialize
Airave small cells from July of 2007. And Softbank started to popularize 3G small cells
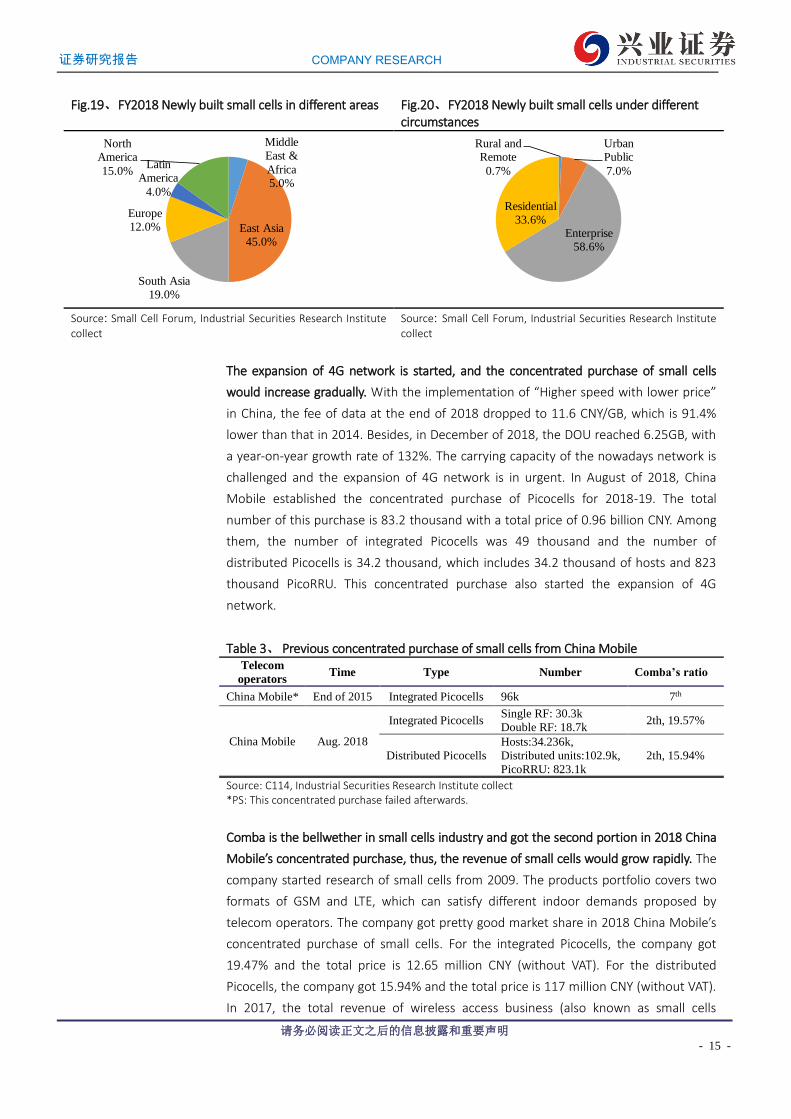
from 2009. According to the data provided by Small Cell Forum, the worldwide newly
built small cells in 2018 was 3.92 million with a year-on-year growth rate of 45%.
Classified by application scenarios, the newly built small cells working in enterprise
scenarios grows fastest and the number was 2.3 million with a year-on-year growth rate
of 79.7% and a proportion of 58.6%. Classified by region, the newly built small cells in
east-Asia accounts for 45%. China’s small cells took off a little late, and this is due to the
shorter construction period in China. The construction period of 3G in China is only 5
years, which is much shorter than Europe and America’s 7-10 years. The construction of
3G network in China did not experience expansion stage and the 4G network
construction was started. Thus, as an essential expansion method, small cells took off a
little late in China.
Fig.18、FY 2015-25 Worldwide newly built small cells under different circumstances and their total growth rate
3,068 3,795
2,712 3,924
5,534 6,315 6,675 7,230 7,786
8,878 10,253
24%
-29%
45% 41%
14%
6%8% 8% 14% 15%
-0.4
-0.2
0
0.2
0.4
0.6
0
2,000
4,000
6,000
8,000
10,000
12,000
2015 2016 2017 2018 2019E 2020E 2021E 2022E 2023E 2024E 2025E
Rural and Remote Urban Public Enterprise
Residential Total YoY(RHS)
Thousand
Source: Small Cell Forum, Industrial Securities Research Institute collect
20385125/36139/20190417 14:25
证券研究报告 COMPANY RESEARCH
请务必阅读正文之后的信息披露和重要声明
- 15 -
Fig.19、FY2018 Newly built small cells in different areas Fig.20、FY2018 Newly built small cells under different circumstances
Middle East &
Africa5.0%
East Asia45.0%
South Asia19.0%
Europe12.0%
Latin America
4.0%
North America
15.0%
Rural and Remote
0.7%
Urban Public
7.0%
Enterprise58.6%
Residential 33.6%
Source: Small Cell Forum, Industrial Securities Research Institute collect
Source: Small Cell Forum, Industrial Securities Research Institute collect
The expansion of 4G network is started, and the concentrated purchase of small cells
would increase gradually. With the implementation of “Higher speed with lower price”
in China, the fee of data at the end of 2018 dropped to 11.6 CNY/GB, which is 91.4%
lower than that in 2014. Besides, in December of 2018, the DOU reached 6.25GB, with
a year-on-year growth rate of 132%. The carrying capacity of the nowadays network is
challenged and the expansion of 4G network is in urgent. In August of 2018, China
Mobile established the concentrated purchase of Picocells for 2018-19. The total
number of this purchase is 83.2 thousand with a total price of 0.96 billion CNY. Among
them, the number of integrated Picocells was 49 thousand and the number of
distributed Picocells is 34.2 thousand, which includes 34.2 thousand of hosts and 823
thousand PicoRRU. This concentrated purchase also started the expansion of 4G
network.
Table 3、 Previous concentrated purchase of small cells from China Mobile Telecom
operators Time Type Number Comba’s ratio
China Mobile* End of 2015 Integrated Picocells 96k 7th
China Mobile Aug. 2018
Integrated Picocells Single RF: 30.3k
Double RF: 18.7k 2th, 19.57%
Distributed Picocells
Hosts:34.236k,
Distributed units:102.9k,
PicoRRU: 823.1k
2th, 15.94%
Source: C114, Industrial Securities Research Institute collect *PS: This concentrated purchase failed afterwards.
Comba is the bellwether in small cells industry and got the second portion in 2018 China
Mobile’s concentrated purchase, thus, the revenue of small cells would grow rapidly. The
company started research of small cells from 2009. The products portfolio covers two
formats of GSM and LTE, which can satisfy different indoor demands proposed by
telecom operators. The company got pretty good market share in 2018 China Mobile’s
concentrated purchase of small cells. For the integrated Picocells, the company got
19.47% and the total price is 12.65 million CNY (without VAT). For the distributed
Picocells, the company got 15.94% and the total price is 117 million CNY (without VAT).
In 2017, the total revenue of wireless access business (also known as small cells
20385125/36139/20190417 14:25
证券研究报告 COMPANY RESEARCH
请务必阅读正文之后的信息披露和重要声明
- 16 -
business) was 0.29 billion HKD (0.25 billion CNY). Motivated by the telecom operators’
concentrated purchase of small cells, the revenue of wireless access business may grow
rapidly.
The company has plenty large gymnasium wireless enhancement experience, and the
wireless enhancement business will cooperate with small cells business to realize the fast
coverage of the network. Since over 70% usage of data and voice services occurs indoor,
however the transmission loss of the electromagnetic signal from outdoor to indoor is
quite large. The wireless enhancement is quite essential. Comba has provided multiple
DAS solutions, including MDAS and DAS. The company has plentiful experience in large
gymnasium wireless enhancement. They have attended Brazil World Cup, Sochi Winter
Olympic Games, Peking Olympic Games and many other worldwide famous stadiums
and gymnasiums. Besides, the wireless enhancement business will cooperate with the
small cells business.
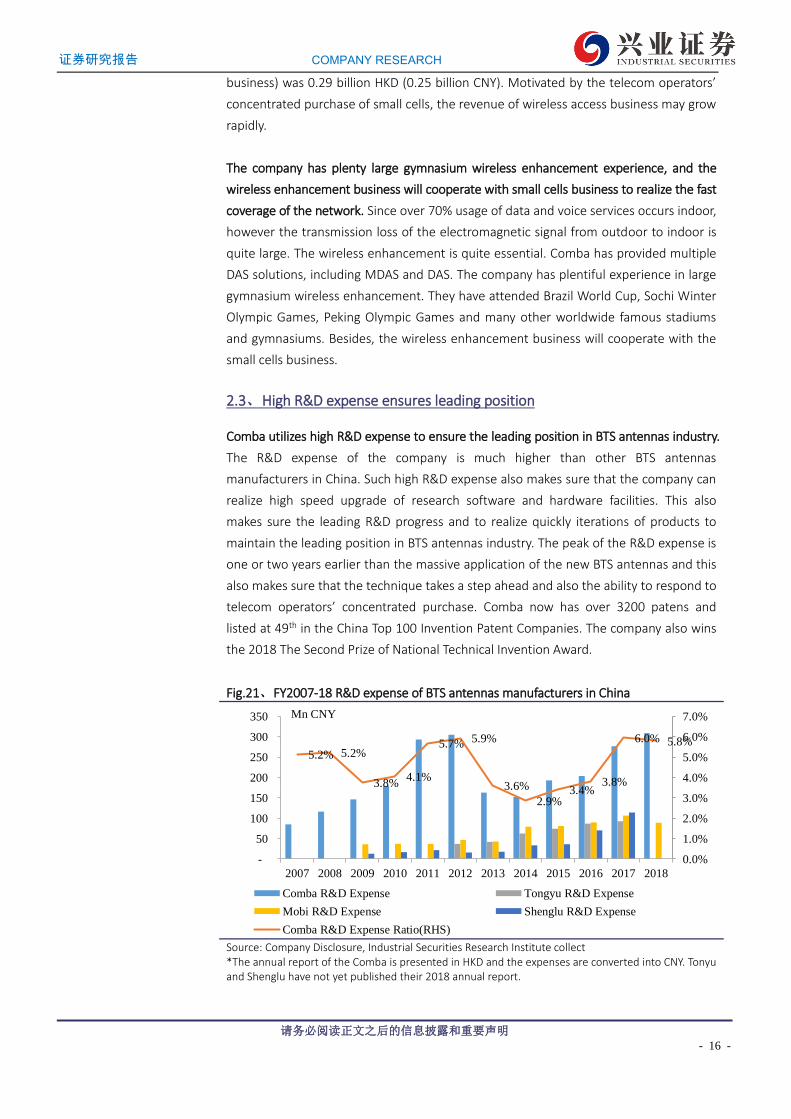
2.3、High R&D expense ensures leading position
Comba utilizes high R&D expense to ensure the leading position in BTS antennas industry.
The R&D expense of the company is much higher than other BTS antennas
manufacturers in China. Such high R&D expense also makes sure that the company can
realize high speed upgrade of research software and hardware facilities. This also
makes sure the leading R&D progress and to realize quickly iterations of products to
maintain the leading position in BTS antennas industry. The peak of the R&D expense is
one or two years earlier than the massive application of the new BTS antennas and this
also makes sure that the technique takes a step ahead and also the ability to respond to
telecom operators’ concentrated purchase. Comba now has over 3200 patens and
listed at 49th in the China Top 100 Invention Patent Companies. The company also wins
the 2018 The Second Prize of National Technical Invention Award.
Fig.21、FY2007-18 R&D expense of BTS antennas manufacturers in China
5.2% 5.2%
3.8%4.1%
5.7% 5.9%
3.6%
2.9%3.4%
3.8%
6.0% 5.8%
0.0%
1.0%
2.0%
3.0%
4.0%
5.0%
6.0%
7.0%
-
50
100
150
200
250
300
350
2007 2008 2009 2010 2011 2012 2013 2014 2015 2016 2017 2018
Comba R&D Expense Tongyu R&D Expense
Mobi R&D Expense Shenglu R&D Expense
Comba R&D Expense Ratio(RHS)
Mn CNY
Source: Company Disclosure, Industrial Securities Research Institute collect *The annual report of the Comba is presented in HKD and the expenses are converted into CNY. Tonyu and Shenglu have not yet published their 2018 annual report.
20385125/36139/20190417 14:25

证券研究报告 COMPANY RESEARCH
请务必阅读正文之后的信息披露和重要声明
- 17 -
The R&D expense is raised since 2014 and Comba is well prepared for 5G. At the end of
2013, the 4G license is released. Afterwards, it enters into the massive construction of
4G network. The R&D expense decreased from 5.9% in 2012 to 2.9% in 2014. This is
due to the fact that the development of 4G technique is also finished and the
technique standard of 5G is not determined yet. On Sep. 17th 2014, 3GPP started to
discuss the R14 standard, which is to start the research on mainframe of 5G network
and key technique. Afterwards, the R&D expense increased gradually and starts
technique preparation of 5G network. In 2017/18, the R&D expense over revenue is
6.0%/5.8%.
3、In 5G era Comba’s Businesses May Experience Relaying Type Development
3.1、BTS antennas: Increase in both quantity and price, the market may increase rapidly
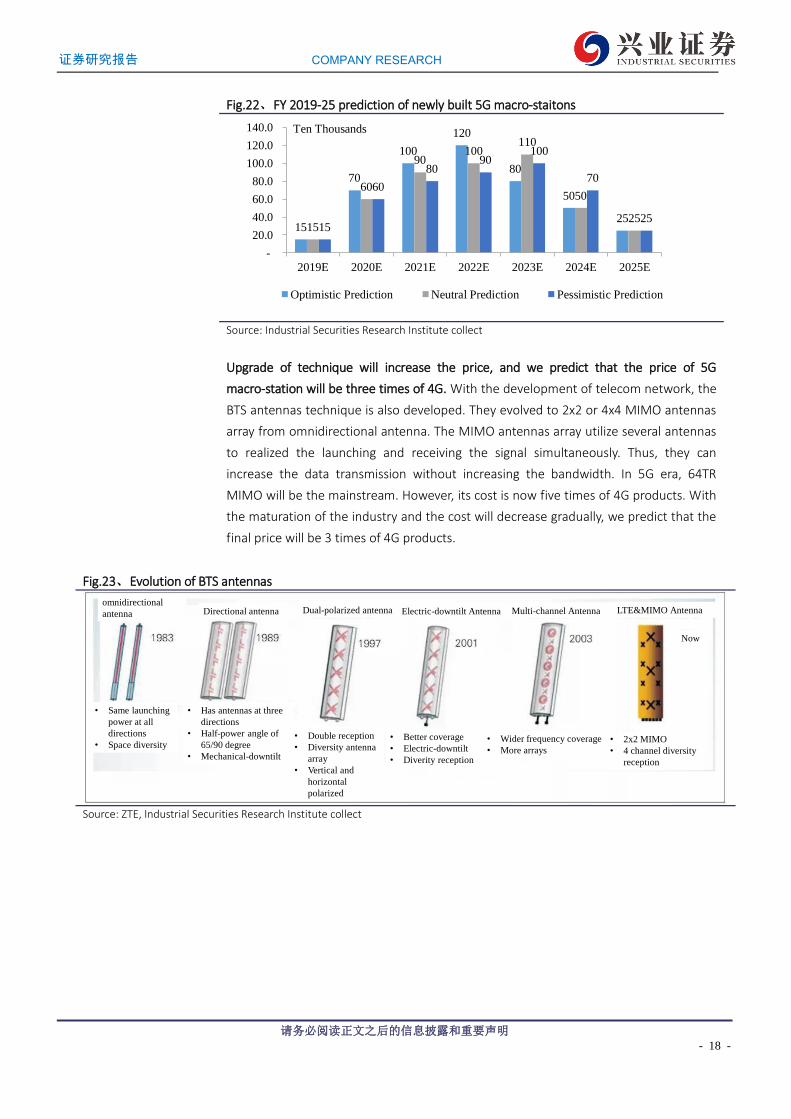
The number of 5G macro-stations may reach 4.5 million, which will also bring out high
speed growth in BTS antennas. In 5G early stage, the China Mobile will utilize the
2.6GHz which is close to the working frequency of TD-LTE. Thus, with the same
launching power, the coverage area of single macro-station is almost the same, thus we
predict that the number of macro-stations is similar to 4G. Considering 5G network will
not be launched in all area, thus, we predict the final number is 0.8 times of 4G stations.
For China Unicom and China Telecom, they utilize 3.5GHz as the working frequency. For
the same launching power, the coverage radius of single station 2/3 of FDD-LTE station,
thus, the coverage area is less than half of the FDD-LTE station. Considering 5G network
will not be launched in all area, we predict the number is 1.5 times of 4G stations.
Until the end of 2017, the number of 4G macro-station is 3.89 million and they are
constructed in 5 years, among them China Mobile’s is 1.87 million, China Unicom’s is
0.85 million and China Telecom’s is 1.17 million. We predict that in 5G era (2019-2025),
the number of macro-stations will be 4.5 million, among them China Mobile’s is 1.5
million and total number of China Unicom and China Telecom is 3 million.
20385125/36139/20190417 14:25
证券研究报告 COMPANY RESEARCH
请务必阅读正文之后的信息披露和重要声明
- 18 -
Fig.22、FY 2019-25 prediction of newly built 5G macro-staitons
15
70
100
120
80
50
2515
60
90100
110
50
2515
60
8090
100
70
25
-
20.0
40.0
60.0
80.0
100.0
120.0
140.0
2019E 2020E 2021E 2022E 2023E 2024E 2025E
Optimistic Prediction Neutral Prediction Pessimistic Prediction
Ten Thousands
Source: Industrial Securities Research Institute collect
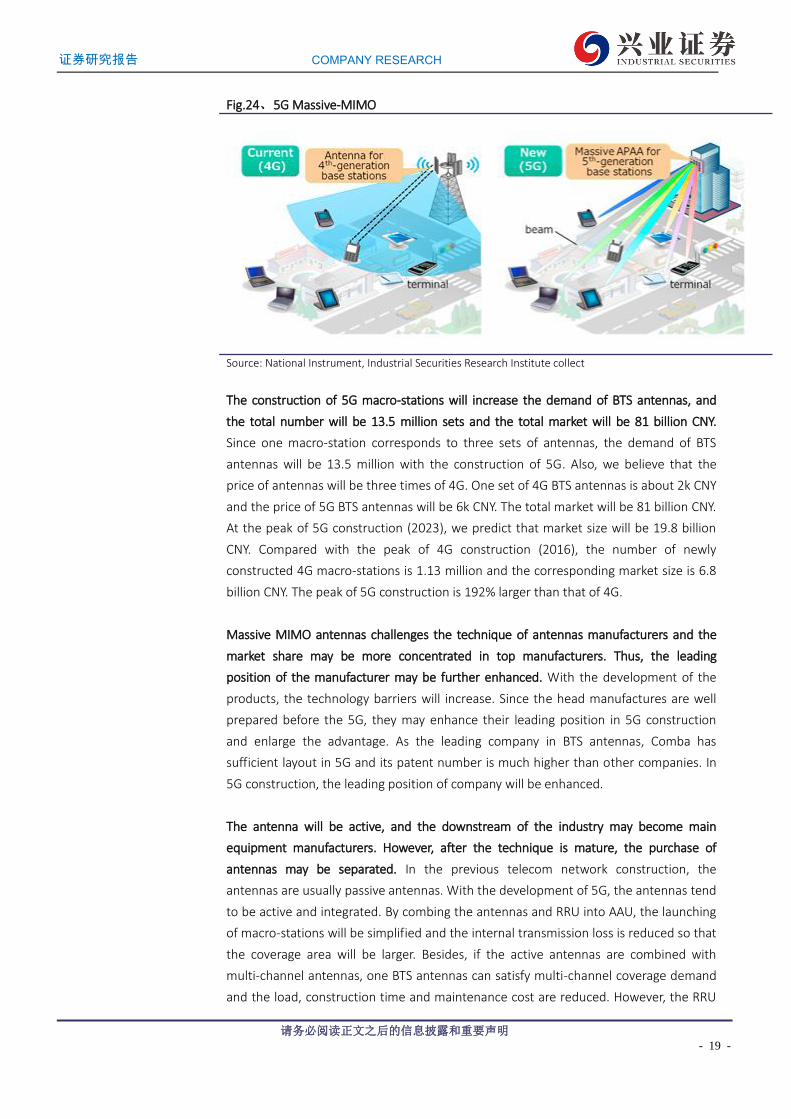
Upgrade of technique will increase the price, and we predict that the price of 5G
macro-station will be three times of 4G. With the development of telecom network, the
BTS antennas technique is also developed. They evolved to 2x2 or 4x4 MIMO antennas
array from omnidirectional antenna. The MIMO antennas array utilize several antennas
to realized the launching and receiving the signal simultaneously. Thus, they can
increase the data transmission without increasing the bandwidth. In 5G era, 64TR
MIMO will be the mainstream. However, its cost is now five times of 4G products. With
the maturation of the industry and the cost will decrease gradually, we predict that the
final price will be 3 times of 4G products.
Fig.23、Evolution of BTS antennas
omnidirectional
antenna
• Same launching
power at all
directions
• Space diversity
Directional antenna
• Has antennas at three
directions
• Half-power angle of
65/90 degree
• Mechanical-downtilt
Dual-polarized antenna
Now
• Double reception
• Diversity antenna
array
• Vertical and
horizontal
polarized
Electric-downtilt Antenna
• Better coverage
• Electric-downtilt
• Diverity reception
• Wider frequency coverage
• More arrays
Multi-channel Antenna LTE&MIMO Antenna
• 2x2 MIMO
• 4 channel diversity
reception
Source: ZTE, Industrial Securities Research Institute collect
20385125/36139/20190417 14:25
证券研究报告 COMPANY RESEARCH
请务必阅读正文之后的信息披露和重要声明
- 19 -
Fig.24、5G Massive-MIMO
Source: National Instrument, Industrial Securities Research Institute collect
The construction of 5G macro-stations will increase the demand of BTS antennas, and
the total number will be 13.5 million sets and the total market will be 81 billion CNY.
Since one macro-station corresponds to three sets of antennas, the demand of BTS
antennas will be 13.5 million with the construction of 5G. Also, we believe that the
price of antennas will be three times of 4G. One set of 4G BTS antennas is about 2k CNY
and the price of 5G BTS antennas will be 6k CNY. The total market will be 81 billion CNY.
At the peak of 5G construction (2023), we predict that market size will be 19.8 billion
CNY. Compared with the peak of 4G construction (2016), the number of newly
constructed 4G macro-stations is 1.13 million and the corresponding market size is 6.8
billion CNY. The peak of 5G construction is 192% larger than that of 4G.
Massive MIMO antennas challenges the technique of antennas manufacturers and the
market share may be more concentrated in top manufacturers. Thus, the leading
position of the manufacturer may be further enhanced. With the development of the
products, the technology barriers will increase. Since the head manufactures are well
prepared before the 5G, they may enhance their leading position in 5G construction
and enlarge the advantage. As the leading company in BTS antennas, Comba has
sufficient layout in 5G and its patent number is much higher than other companies. In
5G construction, the leading position of company will be enhanced.
The antenna will be active, and the downstream of the industry may become main
equipment manufacturers. However, after the technique is mature, the purchase of
antennas may be separated. In the previous telecom network construction, the
antennas are usually passive antennas. With the development of 5G, the antennas tend
to be active and integrated. By combing the antennas and RRU into AAU, the launching
of macro-stations will be simplified and the internal transmission loss is reduced so that
the coverage area will be larger. Besides, if the active antennas are combined with
multi-channel antennas, one BTS antennas can satisfy multi-channel coverage demand
and the load, construction time and maintenance cost are reduced. However, the RRU
20385125/36139/20190417 14:25

证券研究报告 COMPANY RESEARCH
请务必阅读正文之后的信息披露和重要声明
- 20 -
is usually designed and produced by main equipment manufacturers, the active
antennas should be developed by antennas manufacturers and main equipment
manufacturers. The main equipment manufacturers will be in charge of purchase of
antennas, and the downstream will be main equipment manufacturers.
Considering the cost of network construction, the telecom operators tend to separate
concentrated purchase of antennas and RRU after the technique is mature. In March of
2018, China Mobile and many other worldwide telecom operators set an ORAN union
to improve the openness of the telecom network.
Fig.25、Antennas and RRU will be combined as AAU Fig.26、The components that AAU includes
RRU
天线Antenna
RRU integrated with antenna
Original Antenna
Added Equipments
Source: C114, Industrial Securities Research Institute collect Source: C114, Industrial Securities Research Institute collect
3.2、Small cells: started from wireless enhancement and will relay the development in 5G
Small cells will help the macro-stations to realized further coverage of 5G network, and
the total market size will be 27.9 billion. Since the working frequency of 5G is relatively
higher and the transmission ability is worse, small cells will be the main approach to
realize the further coverage of 5G network. According to Shanghai Bell, each
macro-station needs at least 3-10 small cells as complimentary to realize the further
coverage. We assume that 70% of the 5G macro-stations are built in the population
dense area and they need 4 small cells as complimentary in average, and 30% of them
are built in open area and they need 1 small cell as complimentary in average. Thus, the
total number of small cells will be 13.95 million. We assume that the price of small cell
is 2000 CNY and the total market of small cells will be 27.9 billion CNY.
The massive construction of 5G small cells is later than macro-stations. The demand right
now is mainly due to the wireless enhancement of 4G network and the peak
construction size will be 7.2 billion CNY. The massive construction of small cells usually
starts from wireless enhancement and is later than the construction of macro-stations.
We are now at the wireless enhancement stage of 4G network, and the concentrated
20385125/36139/20190417 14:25

证券研究报告 COMPANY RESEARCH
请务必阅读正文之后的信息披露和重要声明
- 21 -
purchase of small cells is increased gradually. However, since the 5G signal is difficult to
transmit from outdoor to indoor, we predicted that the massive construction of 5G
small cells is faster than that in 4G. We predict that 5G small cells will start from 2021
and have a peak of 7.2 billion at 2024.
Fig.27、FY2021-28 market size of small cells and its growth rate
0.6
2.0
5.4
7.26.6
3.02.1
1.0
-100%
-50%
0%
50%
100%
150%
200%
250%
0.0
2.0
4.0
6.0
8.0
2021 2022 2023 2024 2025 2026 2027 2028
5G Small Cells Market Size YoY(RHS)
Bn CNY
Source: Industrial Securities Research Institute collect
4、Prediction and Valuation
We predict that the 5G temporal license will be issued at May to June of 2019 and the
5G network will be constructed in core areas in small scale. The formal license will be
issued at the end of 2019 or at the beginning of 2020. At that time, the construction
scale will be enlarged gradually. Benefit from the 5G network construction, we
predicted that 2019-2021, the revenue of antennas & subsystems business will be
3.01/3.41/4.04 billion HKD with a year-on-year growth rate of 6%/13%/18%.
After the wireless enhancement of 4G network, the concentrated purchase of small
cells will be enlarged. We predict that 2019-21 the revenue of network system will be
1.13/1.34/1.6 billion HKD, with a year-on-year growth rate of 48%/18%/19%. With the
increase of main business, the revenue of service will be 1.7/2.0/2.4 billion HKD, with a
year-on-year growth rate of 7%/18%/19%.
We predict that with the accomplishment of the 4G network in Laos core cities, the
customer number of ETL may increase rapidly and the revenue may increase. We
predict that 2019-21 the revenue of ETL will be 0.3/0.44/0.58 billion HKD, with a
year-on-year growth rate of 60%/50%/30%. The other revenue will be 0.29/0.29/0.3
billion HKD with a year-on-year growth rate of 2%/2%/2%.
Considering that the R&D expense may decrease after the massive construction of 5G,
we predict that 2019-21 the R&D expense ratio is 6.0%/5.0%/4.0%. In 2018 the
company simplifies the employees and the number of employees is reduced by 1200.
After the adjustment, the G&A expense ratio and selling expense ratio are reduced. We
predict that 2019-21 the G&A expense ratio is 9.5%/9.0%/8.5% and selling expense
ratio 7.5%/7.3%/7.0%.
20385125/36139/20190417 14:25
证券研究报告 COMPANY RESEARCH
请务必阅读正文之后的信息披露和重要声明
- 22 -
20385125/36139/20190417 14:25
证券研究报告 COMPANY RESEARCH
请务必阅读正文之后的信息披露和重要声明
- 23 -
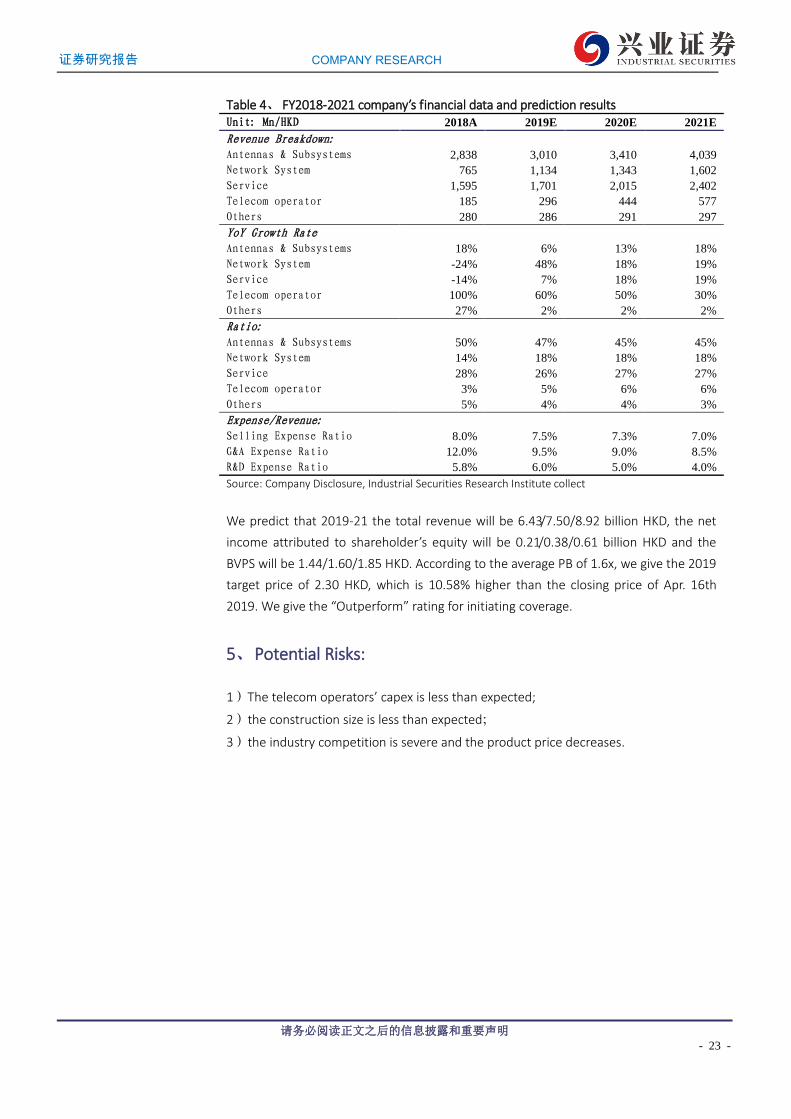
Table 4、 FY2018-2021 company’s financial data and prediction results Unit: Mn/HKD 2018A 2019E 2020E 2021E
Revenue Breakdown:
Antennas & Subsystems 2,838 3,010 3,410 4,039
Network System 765 1,134 1,343 1,602
Service 1,595 1,701 2,015 2,402
Telecom operator 185 296 444 577
Others 280 286 291 297
YoY Growth Rate
Antennas & Subsystems 18% 6% 13% 18%
Network System -24% 48% 18% 19%
Service -14% 7% 18% 19%
Telecom operator 100% 60% 50% 30%
Others 27% 2% 2% 2%
Ratio:
Antennas & Subsystems 50% 47% 45% 45%
Network System 14% 18% 18% 18%
Service 28% 26% 27% 27%
Telecom operator 3% 5% 6% 6%
Others 5% 4% 4% 3%
Expense/Revenue:
Selling Expense Ratio 8.0% 7.5% 7.3% 7.0%
G&A Expense Ratio 12.0% 9.5% 9.0% 8.5%
R&D Expense Ratio 5.8% 6.0% 5.0% 4.0%
Source: Company Disclosure, Industrial Securities Research Institute collect
We predict that 2019-21 the total revenue will be 6.43/7.50/8.92 billion HKD, the net
income attributed to shareholder’s equity will be 0.21/0.38/0.61 billion HKD and the
BVPS will be 1.44/1.60/1.85 HKD. According to the average PB of 1.6x, we give the 2019
target price of 2.30 HKD, which is 10.58% higher than the closing price of Apr. 16th
2019. We give the “Outperform” rating for initiating coverage.
5、Potential Risks:
1)The telecom operators’ capex is less than expected;
2)the construction size is less than expected;
3)the industry competition is severe and the product price decreases.
20385125/36139/20190417 14:25
证券研究报告 COMPANY RESEARCH
请务必阅读正文之后的信息披露和重要声明
- 24 -
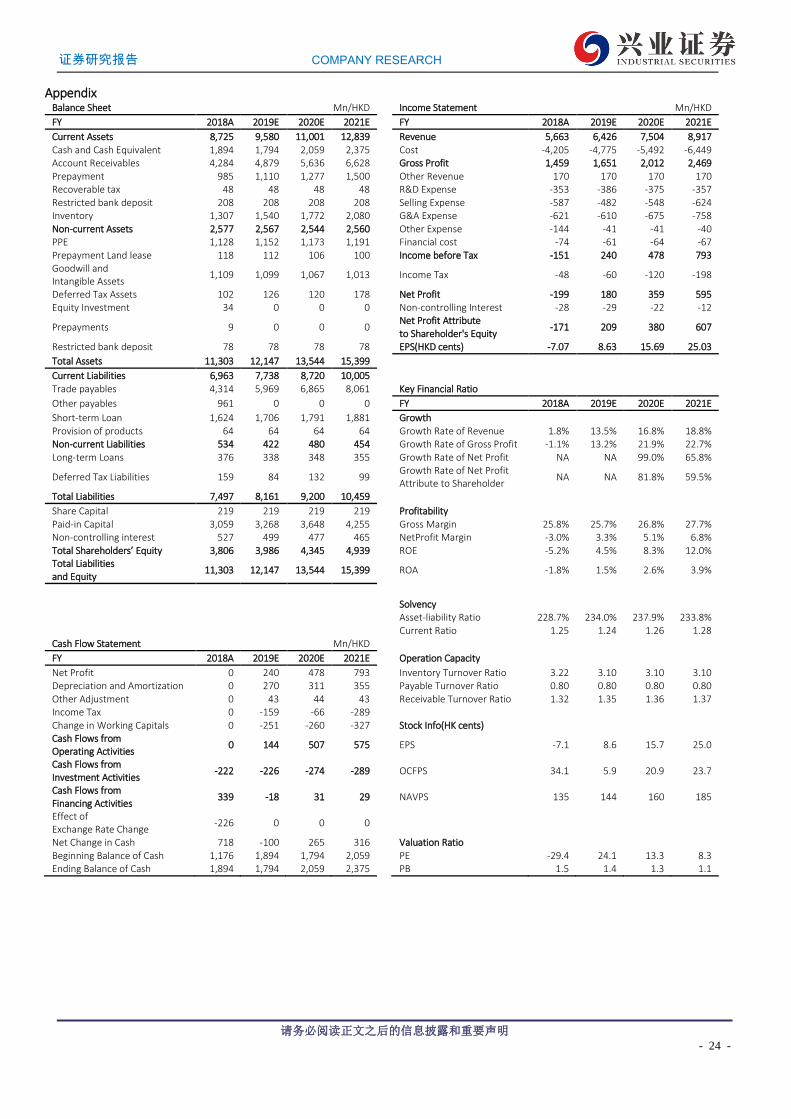
Appendix Balance Sheet Mn/HKD Income Statement Mn/HKD
FY 2018A 2019E 2020E 2021E FY 2018A 2019E 2020E 2021E
Current Assets 8,725 9,580 11,001 12,839 Revenue 5,663 6,426 7,504 8,917 Cash and Cash Equivalent 1,894 1,794 2,059 2,375 Cost -4,205 -4,775 -5,492 -6,449 Account Receivables 4,284 4,879 5,636 6,628 Gross Profit 1,459 1,651 2,012 2,469 Prepayment 985 1,110 1,277 1,500 Other Revenue 170 170 170 170 Recoverable tax 48 48 48 48 R&D Expense -353 -386 -375 -357 Restricted bank deposit 208 208 208 208 Selling Expense -587 -482 -548 -624 Inventory 1,307 1,540 1,772 2,080 G&A Expense -621 -610 -675 -758 Non-current Assets 2,577 2,567 2,544 2,560 Other Expense -144 -41 -41 -40 PPE 1,128 1,152 1,173 1,191 Financial cost -74 -61 -64 -67 Prepayment Land lease 118 112 106 100 Income before Tax -151 240 478 793 Goodwill and Intangible Assets
1,109 1,099 1,067 1,013 Income Tax -48 -60 -120 -198
Deferred Tax Assets 102 126 120 178 Net Profit -199 180 359 595 Equity Investment 34 0 0 0 Non-controlling Interest -28 -29 -22 -12
Prepayments 9 0 0 0 Net Profit Attribute to Shareholder's Equity
-171 209 380 607
Restricted bank deposit 78 78 78 78 EPS(HKD cents) -7.07 8.63 15.69 25.03
Total Assets 11,303 12,147 13,544 15,399
Current Liabilities 6,963 7,738 8,720 10,005
Trade payables 4,314 5,969 6,865 8,061 Key Financial Ratio
Other payables 961 0 0 0 FY 2018A 2019E 2020E 2021E
Short-term Loan 1,624 1,706 1,791 1,881 Growth
Provision of products 64 64 64 64 Growth Rate of Revenue 1.8% 13.5% 16.8% 18.8% Non-current Liabilities 534 422 480 454 Growth Rate of Gross Profit -1.1% 13.2% 21.9% 22.7% Long-term Loans 376 338 348 355 Growth Rate of Net Profit NA NA 99.0% 65.8%
Deferred Tax Liabilities 159 84 132 99 Growth Rate of Net Profit Attribute to Shareholder
NA NA 81.8% 59.5%
Total Liabilities 7,497 8,161 9,200 10,459
Share Capital 219 219 219 219 Profitability Paid-in Capital 3,059 3,268 3,648 4,255 Gross Margin 25.8% 25.7% 26.8% 27.7% Non-controlling interest 527 499 477 465 NetProfit Margin -3.0% 3.3% 5.1% 6.8% Total Shareholders’ Equity 3,806 3,986 4,345 4,939 ROE -5.2% 4.5% 8.3% 12.0% Total Liabilities and Equity
11,303 12,147 13,544 15,399 ROA -1.8% 1.5% 2.6% 3.9%
Solvency
Asset-liability Ratio 228.7% 234.0% 237.9% 233.8%
Current Ratio 1.25 1.24 1.26 1.28
Cash Flow Statement Mn/HKD
FY 2018A 2019E 2020E 2021E Operation Capacity
Net Profit 0 240 478 793 Inventory Turnover Ratio 3.22 3.10 3.10 3.10 Depreciation and Amortization 0 270 311 355 Payable Turnover Ratio 0.80 0.80 0.80 0.80 Other Adjustment 0 43 44 43 Receivable Turnover Ratio 1.32 1.35 1.36 1.37 Income Tax 0 -159 -66 -289
Change in Working Capitals 0 -251 -260 -327 Stock Info(HK cents)
Cash Flows from Operating Activities
0 144 507 575 EPS -7.1 8.6 15.7 25.0
Cash Flows from Investment Activities
-222 -226 -274 -289 OCFPS 34.1 5.9 20.9 23.7
Cash Flows from Financing Activities
339 -18 31 29 NAVPS 135 144 160 185
Effect of Exchange Rate Change
-226 0 0 0
Net Change in Cash 718 -100 265 316 Valuation Ratio Beginning Balance of Cash 1,176 1,894 1,794 2,059 PE -29.4 24.1 13.3 8.3 Ending Balance of Cash 1,894 1,794 2,059 2,375 PB 1.5 1.4 1.3 1.1
20385125/36139/20190417 14:25

证券研究报告 COMPANY RESEARCH
请务必阅读正文之后的信息披露和重要声明
- 25 -
Introduction of Share Investment Rating Industry Investment Rating
When measuring the difference between the markup of the industry index and that of the market’s benchmarks (Shanghai Composite Index/Shenzhen Component
Index) within twelve months after the release of the report, we define the terms as follows:
➢ Overweight:Industry performs better than that of the whole market;
➢ Neutral:Industry performs about the same as that of the whole market;
➢ Underweight:Industry performs worse than that of the whole market
Company Investment Rating
When measuring the difference between the markup of the company stock price and that of the market’s benchmarks (Shanghai Composite Index/Shenzhen
Component Index) within twelve months after the release of this report, we define the terms as follows:
➢ Buy: With a markup more than 15% better than that of the market;
➢ Outperform:With a markup 5% to 15% better than that of the market;
➢ Neutral: With a markup less than 5% better or worse than that of the market;
➢ Underperform: With a markup more than 5% worse than that of the market.
Information Disclosure
The Industrial Securities Co., Ltd. fulfills its duty of disclosure within its sphere of knowledge. The clients may visit the column of Insider Trading Prevention and
Control at www.xyzq.com.cn for the arrangement of the quiet period and the affiliates’ shareholdings.
Important statement
The information contained in this report is derived from public information. We do not warrant the accuracy and completeness of such information, nor do we
guarantee that the information and recommendations contained will never change. We have tried our best to be objective and fair about the content of this report.
The opinions, conclusions and recommendations in the article do not constitute any bid or offer price for the target securities. Our company and the author are not
responsible for any investment decision made by the investor.
Analyst Certification
We are conferred the Professional Quality of Securities Investment Consultant Industry by the Securities Association of China and have registered as the Securities
Analysts. We hereby issue this report independently and objectively with due diligence, professional and prudent research methods and only legitimate information
is used in this report. We hereby certify that the views expressed in this report accurately reflect our personal views about any or all of the subject securities or
issuers referred to herein. We have never been, are not, and will not be compensated directly or indirectly in any form for the specific recommendations or opinions
herein.
Disclaimer
Industrial Securities Co., Ltd. (hereinafter referred to as the ‘Company’) is a qualified securities investment consulting institute approved by the China Securities
Regulatory Commission.
The report is distributed in Hong Kong by China Industrial Securities International Brokerage Ltd., which is regulated by the Hong Kong Securities and Futures
Commission (HKSFC CE No. AYE823). Queries concerning the report from readers in Hong Kong should be directed to our Hong Kong sales managers.
The report is to be used solely by the clients of the Company. The Company will not treat unauthorized receivers of this report as its clients. The clients understand
that the text message reminder and telephone recommendation are no more than a brief communication of research opinions, which are subject to the complete
report released on the Company’s website (http://www.xyzq.com.cn). The clients may ask for follow-up explanations if they so wish.
Based on different assumptions or standards and with different analytical approaches, the Company’s salespersons, traders and other professionals may express
views, written or oral, towards market trend and securities trading which are inconsistent with opinions and recommendations contained herein. The views in this
report are subject to change, and the
Company has no obligation to update its information with all receivers of the report. The Company’s asset management department, proprietary business department and other investment-related departments may make independent investment
decisions based on investment that are inconsistent with opinions and recommendations contained herein.
The report is not delivered to investors, including but not limited to US residents, who may mislead the Company to violate local laws and regulations of any counties,
regions or jurisdictional areas (except for the “major U.S. institutional investors” specified in Rule 15a-6 under the Securities Exchange Act of 1934).
The report may contain hyperlinks to external websites. The Company has not referred to and will not be responsible for the contents on the external websites. The
hyperlinks are only provided for the convenience and reference for the receivers. The contents on the external websites do not constitute a component of the report
or implying any recommendation of securities. The receivers should treat them cautiously and solely at their own risk.
The report is based on public information; however, the authenticity, accuracy or completeness of such information is not warranted by the Company. The materials
contained herein are for the clients’ reference only, and are not to be regarded or deemed as an invitation for the sale or purchase of any securities. The clients
should make investment decisions independently and solely at their own risks.
Under the legal framework, the Company may take positions in and trade stocks of the companies referred to herein, which may receive investment banking
services from the Company. The clients shall consider the Company’s possible conflict of interests which may affect the objectivity of this report, and shall not base
their investment decisions solely on the report.
Independent investment consultant should be consulted before any investment decision is rendered based on this report or at any request of explanation for this
report where the receiver of this report is not a client of the Company.
The Company possesses all copyrights of this report and reserves all rights related to this report. Unless otherwise indicated in writing, all the copyrights of all the
materials herein belong to the Company. In the absence of any prior authorization by the Company in writing, no part of this report shall be copied, photocopied,
replicated or redistributed to any other person in any form by any means, or be used in any other ways which will infringe upon the copyrights of the Company. No
one shall have the right to redistribute the report at any circumstances without the prior consent of the Company.
20385125/36139/20190417 14:25