multi sensing grasper for minimally invasive surgery
TRANSCRIPT
Multi Sensing Grasper for Minimally Invasive Surgery
S.J. Fattahi, A. Zabihollah, and H. Adldoost
Sharif University of Technology, International Campus, School of Science and Engineering, Kish Island (Iran)
Abstract— In the present work, a multi sensing grasper has
been developed for minimally invasive surgery with embedded
ZnO piezoelectric and Fiber Bragg Grating sensors. In this
model, a sensing patch equipped with three FBG sensors to
sense the temperature in rage of 800 n.m and two separated
FBG in range of 1550 m.m to detect the displacement in x and
y directions. ZnO piezoelectric is highly sensitive to time and
provides a good resistance to temperature. Therefore, this
sensor is used for measuring the rate of strain and creep
coefficient. A finite element approach based on the viscous
material theory and plane displacement theory of anisotropic
materials has been utilized to obtain the compliance matrix of
muscles. The compliance matrix is then used to determine the
electromechanical coupling of ZnO piezoelectric sheet. The
optomechanical relations between strains and FBG reflected
wavelength shift have been utilized to study the static
behavior of a grasper’s jaw when grasping an object. The
interrogated reflected spectrum caused by strain displacement
in x and y directions, has been studied to find Cauchy-Green
tensor equation and Prony series coefficients. Numerical
illustrations have been presented to simulate the behavior of
three types of human muscles subject to applied grasping
load.
Index Terms—MIS, FBG, ZnO
I. INTRODUCTION
n recent years the use of piezoelectric elements are
commonly being used in smart minimally invasive
surgery (MIS) systems as both sensors and actuators. First
attempt in estimation of the contact force in MIS was
presented by Shikida et al. [4] who proposed an active
tactile sensor with capability to detect both contact force
and hardness of an object. Dragahi [5] showed the
possibility of using of polyvinylidene fluoride (PVDF)
sensors for tactile sensing system. Narayanan et al. [6]
presented the design and fabrication of a micro-machined
piezoelectric endoscopic tactile sensor to determine the
properties of tissues in minimally invasive surgery.
Determination of the compliance of sensed objects has
been designed by Sedaghati et al. [7] to determine the ratio
of force experienced by the rigid cylinder to the total force
applied to the sensor. Robotic grippers have been
investigated by Nakazawa et al. [8]. They modeled a
robotic griper to control the force based on human grasping
schemes. Recently, Seibold et al. [9] proposed an actuated
and sensitized instruments for minimally invasive robotic
surgery, which helped to increase the surgeon’s immersion
and dexterity. One of the first experimental works in this
area had been done by Dargahi et al. [10] who designed
and fabricated a tool to detect the strain and deformation of
the grasper’s tip for endoscopic tactile sensors. Bicchi et al.
[11] investigated the effects of compliance and viscoelastic
property of tissues to measure the force and angular
displacement of endoscopic graspers. Most recently, a
tactile sensor with capability to differentiate the various
complaint objects was constructed by Dario et al. [12, 13].
As it is observed the use of PVDF elements as sensors in
MIS system is quite extensive, however, using PVDF
sensors has a high influence of the electrochemical
behavior of human body and piezoelectric. The
piezoelectric materials produce a pulse voltage for any
applied force. Thus, in the present work the ZnO sheet has
been proposed to reduce the electrochemical noise. Most
importantly, in order to achieve a clear and close image of
the grasper force, the use of Fiber Bragg Grating (FBG)
sensors has been proposed to measure the normal stress
tensors and temperature. FBG sensors are quite immune to
any electromagnetic fields. Finally, to distinct different
muscles, a nonlinear optimization method based on
Cauchy-Green tensor equation and Prony series has been
utilized to determine the viscoelastic coefficients of three
different types of common human body muscles. Using
MATLAB® and ANSYS® numerical illustrations have
been presented to show the functionality and performance
of the proposed system.
II. ANALYSIS OF VISCOUS MATERIAL
Creep and stress relaxation are two characteristic behaviors of
viscoelastic materials. Creep occurs when a constant stress
applied to the material results in increasing strain. On the
other hand, stress relaxation occurs when a material is
under constant strain but the stress decreases until it
reaches some steady-state value. The one-dimensional
models of creep deformation and stress relaxation are given
as:
���� � ������
(1)
���� � ������ (2)
where J(t) is creep compliance for constant stress, ��, and
G(t) is the stress relaxation modulus for constant strain, ��.
The creep compliance and relaxation modulus are
empirically determined and describe the creep and stress
relaxation behavior of the viscoelastic material as a
I
2011 IEEE/ASME International Conference onAdvanced Intelligent Mechatronics (AIM2011)Budapest, Hungary, July 3-7, 2011
978-1-4577-0839-8/11/$26.00 ©2011 IEEE 344
function of time. The creep compliance and relaxation
modulus based on Zener [14] are given by
���� � � � �� � � ������ � (3)
���� � � � � � � ����������� � (4)
where , � are the spring constant and b is viscosity
coefficient.
III. FBG ANALYSIS
A. FBG Principal
The principle of a FBG sensor is based on the wavelength
shifting of the reflected spectrum when strain or
temperature change in the element. FBG sensors provide
advantages such as multi and continuous sensing using
only single fiber line, ease of placing and embedding in
composite, self-referencing capability independent of the
total power level of the source and the loss of coupler or
connection, electromagnetic interference immunity, high
sensitivity, and multiplexing capability.
Temperature and strain variations applied to the gratings
cause shifting in their Bragg wavelengths as:
���� � ����� � ����������� (5)
where i =1,2,…,n represent the grating written in the fiber
respectively. The thermal sensitivity,���� depends on the
thermal expansion of the fiber and, essentially, on the
thermo-optic coefficient. On the other hand, the strain
sensitivity,����, depends on the photo-elastic coefficient of
the fiber, mainly, determined by the variation of the grating
pitch due to the applied strain. The strain sensitivity
depends on the mechanical properties of the fiber. In
general, the maximum reflectivity occurs at the so-called
Bragg wavelength �� given by: ������� � � !""�� (6)
where !"" is the effective refractive index of the mode
propagating in the fiber and � is the FBG period.
B. Strain Sensing
Reflected wavelength �� is affected by any variation in the
physical or mechanical properties of the grating region.
Similarly, changes in temperature lead to change in !"" via
the thermo-optic effect and in an unconstrained fiber; � is
influenced by thermal expansion or contraction.
Stress state of a circular FBG in plane coordination [13] is
given as:
�## � �$��% (7)
�&& � '$��% (8)
where D is diameter of fiber, h is length of the FBG under
load. From Hook's law the in-plane strain can be expressed
as:
�## � � � ��( �)�##�� � �� � ��&&* (9)
���������&& � � � ��( �)�&&�� � �� � ��##*�������� (10)
Next, the wavelength shifting in x and y coordinates are
expressed as:
���# � � !""�� )�##�+ ��&&*��#��������� (11)
���& � � !""�� )�&&�+ ��##*��&��������� (12)
where, , �� is the change in Bragg wavelength �,- Pockel’s coefficient of the stress-optic tensor. The total
wavelength shifting is given by:
��� � ���# � ���&����������������� (13)
Substituting Eqs. (11) and (12) into Eq. (13), one may
achieve in Eq. (14), in which the first term gives the effect
of strain on wavelength and the second term describes the
effect of temperature.
�� �� ���� � ����� � ����� ������������������ (14)
where,���, � and � are respectively the photoelastic,
thermal expansion and thermo-optic coefficients of the
fiber, �� is the change of strain and �� is the temperature
change.
The photoelastic definition is expressed as:
� � !""�� )��+ ��.�+ ��/*�������������������� (15)
Substituting Eq. (15) into Eq. (14), the Bragg wavelength
shift with strain and temperature can be expressed as: ������ � 0� � !""�� )��+ ��.�+ ��/*1 ���
����� � ���������������� (16)
C. Temperature Sensing and Compensating
Temperature strongly affects FBG signals, thus, exact
measuring of strain can be achieved by temperature
compensating. The effects of temperature can be
compensated by using a separate FBG as a temperature
sensor in environment without any mechanical stress. The
wavelength change due to changing temperature can be
achieved by:
���������2���3��4� �� ������� ����������������� (17)
345
2��3��4� �� �� �������� �� (18)
where �� is wavelength of FBG temperature sensor and
����represents the change in wavelength due to
temperature change, thus, by subtracting ��, the
wavelength shifting due to strain is achieved.
������ � 0� � !""�� )��+ ��.�+ ��/*1 ��
������ � �� �������� ��
(19)
It can be observed that the �� changes linearity when the
applied strain changes axially.
D. Signal Interrogation using Wavelength-Division
Multiplexing
Knowing that many gratings combined on a single fiber
and addressed simultaneously, the FBG sensor has a
different Bragg wavelength. Therefore, it is possible to find
the reflected spectrum and place of related grating by using
the Wavelength Division Multiplexing (WDM) integration.
In this method a scan generator tunes the light source with
known instant wavelength and sweeping it back. When this
wavelength coincides with the Bragg wavelength of an
FBG, light is reflected back down the fiber to a photo
detector. The scan generator also supplies a timing signal,
and checks this with the spectrum. Further processing is
performed to identify the peaks in this spectrum, find their
peak positions and convert these to strain. The peak
reflected wavelength from the Bragg grating is determined
by:
�5�6� � �789�� ��:��8;�<=���>=� ?��
(20)
where � is basic wavelength, � is center of reflected
wavelength and 7��is width of the Gaussian curve. Where
the Gaussian kernel is stepped among the data set, thus, f
(�) is evaluated for varying values of 7�, and by using mean
squared error and examination between f (�) and the
received spectrum, the reflected spectrum’s peak � can be
determined, then the bragg signal is minimized.
IV. PIEZOELECTRIC ANALYZE
Under small field conditions, the constitutive relations for a
piezoelectric material are [15]:
%� � @�-�(- � A�BC �B (21)
�� � A-�D (- � E�BF �B (22)
which can be rewritten in compact form as:
G%�H � I@� ACAD EFJ�G(�H�� (23)
where vector D of size (3×1) is the electric displacement
(Coulomb/K�), � is the strain vector (6×1) (dimensionless),
E is the applied electric field vector (3 × 1) (Volt/m) and
�B is the stress vector (6 × 1) (N/K�). The piezoelectric
constants are the dielectric permittivity @�-� of size (3×3)
(Farad/m), the piezoelectric coefficients A�BC (3×6) and A-�D
(6×3) (Coulomb/N or m/Volt), and the elastic compliance LD�of size (6×6) (K�/N). The piezoelectric coefficient A-�D
(m/Volt) defines strain per unit field at constant stress and A�BC (Coulomb/N) defines electric displacement per unit
stress at constant electric field. The superscripts c and d
have been added to differentiate between the converse and
direct piezoelectric effects, though in practice, these
coefficients are numerically equal. The superscripts � and
E indicate that the quantity is measured at constant stress
and constant electric field respectively. For a sheet of
piezoelectric material, the d matrix can then be expressed
as:
A � M N N NN N NAO AO� AOON AP NA�Q N NN N NR
(24)
where the coefficients AO, AO� and AOO relate the normal
strain in the 1, 2 and 3 directions respectively to a field
along the poling direction, (O. The coefficients AP and A�Q
relate the shear strain in the 1-3 plane to the field ( and
shear strain in the 2-3 plane to the (� field, respectively. In
general, the compliance matrix of viscous material is of the
form
ESF �TUUUUVESES�ESOESQESPESWXYYYYZ �
TUUUUUV� �� �O�� ��� ��O�O �O� �OO�Q �Q� �QO�P �P� �PO�W �W� �WO
�Q �P �W��Q ��P ��W�OQ �OP �OW�QQ �QP �QW�PQ �PP �PW�WQ �WP �WWXY
YYYYZ
(25)
and the permittivity matrix is given by:
@ � [@� N NN @��� NN N @OO� \
(26)
The stress vector is written as:
� �TUUUUV����O�Q�P�WXYYYYZ�TUUUUV�����OO��O�O��XY
YYYZ
(27)
346
In the case of a sensor, where the applied external electric
field is zero, Equation (23) simplifies as:
M%%�%OR � M N N NN N NAO AO� AOO
N AP NA�Q N NN N NR TUUUUV����O�Q�P�WXYYYYZ
(28)
This equation summarizes the principle of operation of
piezoelectric sensors. A stress field causes an electric
displacement to be generated as a result of the direct
piezoelectric effect. Note that shear stress in the 1-2 plane,
�W is not capable of generating any electric response. The
electric displacement D is related to the generated charge
by the relation,
] �^_% %� %O`�MAaAa�AaOR�
(29)
where Aa, Aa� and AaO are the components of the
electrode area in the 2-3, 1-3 and 1-2 planes respectively. It
can be seen that the charge collected, q, depends only on
the component of the infinitesimal electrode area dA
normal to the displacement D. The charge q and the voltage
generated across the sensor electrodes bD are related by the
capacitance of the sensor, cd as:
bD � ]ecd (30)
Therefore, by measuring the charge generated by the
piezoelectric material, from Equations (28) and (29), it is
possible to calculate the stress in the material.
Considering only the effect of strain along the 1-direction,
from Equations (24-30) the voltage generated by the sensor
can be expressed as:
bD � AOfDgDcd h �S Ai (31)
where fD is the Young’s modulus of the piezoelectric
material.
The equation relating strain and voltage generated by the
sensor is given by:
�S � bDcdAOfDgDjD (32)
where typical piezoelectric sheet can be treated as a parallel
plate capacitor, whose capacitance is given by:
cd � �OO� jDgD�D (33)
where jD, gD and �D are length, width, and thickness of the
piezoelectric sensor respectively.
V. MUSCLE DETECTION AND EVALUATION
The muscle deformation is time-dependent, finite and
nonlinear phenomena. It can be determined by using the
constitutive equations based on the theory of hyper-
viscoelasticity. The nonlinear stress response was
characterized using a 2nd order polynomial hyperelastic
strain energy function as the following: k � c��l � m� � c��l� � m� �c�l � m��l� � m����
(34)
where l and l� are strain measured by FBG no. 2 and 3
and are invariants of Cauchy-Green tensor. Therefore, the
values of c�, c�, c can be measured by measuring
wavelength shifting by FBG no 2 and 3 the strain l and l�
can computed. These values then can be used to compute
the force applied and consequently, compared with muscle
databank to indentify the gasped object.
The data representing a time-dependent or viscoelastic
response of materials can be approximated by a Prony
series, based on a relaxation or creep. In large strain
viscoelasticity, the elastic strain energy or the stress is
expressed in terms of Prony series.
���� � � �no�O�4 �� � ���e�p� (35)
with constraints of �� > 0,�o� > 0 and G(0) = 1. A nonlinear
optimization rule was developed to curve-fit the
experimental data to extract material parameters�o, o� ,�oO
, �, ��, �O , hence by finding these parameters of muscle,
the surgeons grasper can makes a sense of tissue softness.
VI. NUMERICAL EXAMPLES
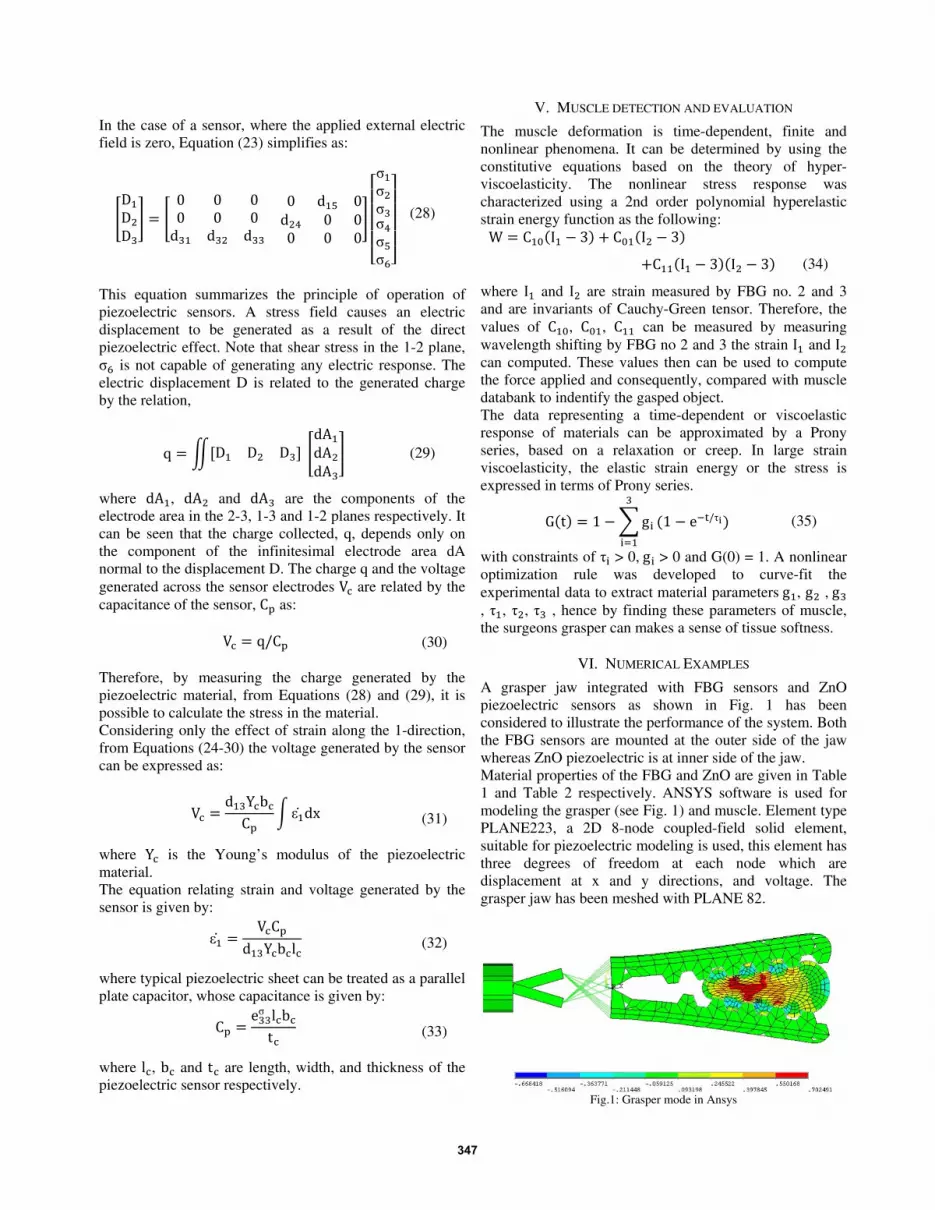
A grasper jaw integrated with FBG sensors and ZnO
piezoelectric sensors as shown in Fig. 1 has been
considered to illustrate the performance of the system. Both
the FBG sensors are mounted at the outer side of the jaw
whereas ZnO piezoelectric is at inner side of the jaw.
Material properties of the FBG and ZnO are given in Table
1 and Table 2 respectively. ANSYS software is used for
modeling the grasper (see Fig. 1) and muscle. Element type
PLANE223, a 2D 8-node coupled-field solid element,
suitable for piezoelectric modeling is used, this element has
three degrees of freedom at each node which are
displacement at x and y directions, and voltage. The
grasper jaw has been meshed with PLANE 82.
Fig.1: Grasper mode in Ansys
347
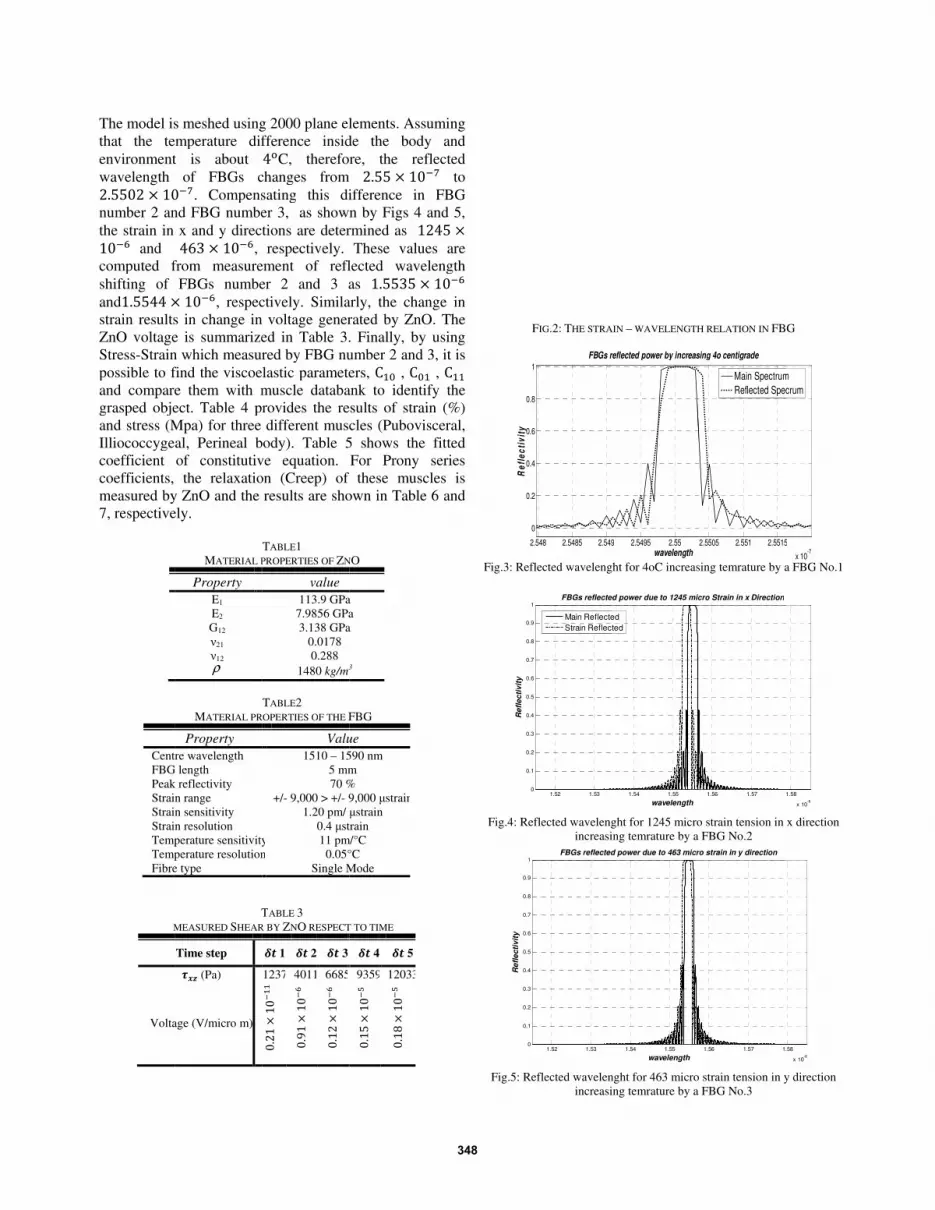
The model is meshed using
that the temperature
environment is about
wavelength �qrrN� s �Nnumber 2 and FBG
the strain in x and y direction�N�W and
computed from measur
shifting of FBGs number 2 and 3 as
and�qrrtt sstrain results in change in voltage generated by
ZnO voltage is
Stress-Strain which measured by FBG
possible to find
and compare
grasped object
and stress (Mpa) for three
Illiococcygeal, Perineal body)
coefficient of constitutive equation
coefficients,
measured by ZnO
7, respectively.
Centre wavelength
FBG length
Peak reflectivity
Strain range
Strain sensitivity
Strain resolution
Temperature sensitivity
Temperature resolution
Fibre type
MEASURED
Voltage (V/micro m)
The model is meshed using
temperature difference
environment is about
of FBGs change�N�u. Compensating this
2 and FBG number
the strain in x and y direction
and t'm s �N�W,
computed from measurement of reflected
shifting of FBGs number 2 and 3 as s �N�W, respectively
results in change in voltage generated by
voltage is summarized
Strain which measured by FBG
possible to find the viscoelastic parameters,
and compare them with muscle
grasped object. Table 4 provides
and stress (Mpa) for three
Illiococcygeal, Perineal body)
coefficient of constitutive equation
the relaxation (Creep) of these muscles is
measured by ZnO and the
respectively.
MATERIAL PROPERTIES O
Property
E1
E2
G12
�21
�12 ρ
MATERIAL PROPERTIES O
Property
Centre wavelength
FBG length
Peak reflectivity
Strain range
Strain sensitivity
Strain resolution
Temperature sensitivity
Temperature resolution
Fibre type
T
MEASURED SHEAR BY
Time step vwx (Pa)
Voltage (V/micro m)
Nq��s�N
�
The model is meshed using 2000 plane elements.
difference inside
environment is about tyC, therefore,
changes from
ompensating this difference
number 3, as shown by
the strain in x and y directions are determined as
respectively.
ement of reflected
shifting of FBGs number 2 and 3 as
respectively. Similarly, the change in
results in change in voltage generated by
summarized in Table 3.
Strain which measured by FBG number
the viscoelastic parameters,
with muscle databank
provides the result
and stress (Mpa) for three different muscles
Illiococcygeal, Perineal body). Table 5 shows the fitted
coefficient of constitutive equation.
relaxation (Creep) of these muscles is
results are shown in Table 6 and
TABLE1
ATERIAL PROPERTIES OF ZN
value
113.9 GPa
7.9856 GPa
3.138 GPa
0.0178
0.288
1480 kg/m3
TABLE2
ATERIAL PROPERTIES OF THE FBG
Value
1510 – 1590 nm
5 mm
70 %
+/- 9,000 > +/- 9,000
1.20 pm/
0.4 strain
Temperature sensitivity 11 pm/°C
Temperature resolution 0.05°C
Single Mode
TABLE 3
HEAR BY ZNO RESPECT TO TIME
z{�1 z{�2 z{ 31237 4011 6685
Nq��s�N
�
Nq|�s�N
�W Nq��
s�N�W
Nq�rs�N
�P
elements. Assum
inside the body
, therefore, the reflected
from �qrr s �N�udifference in FBG
as shown by Figs 4 and 5,
determined as ��tr These values are
ement of reflected wavelength
shifting of FBGs number 2 and 3 as �qrrmr s �NSimilarly, the change in
results in change in voltage generated by ZnO.
. Finally, by using
number 2 and 3,
the viscoelastic parameters, c� , c� ,
databank to identify the
the results of strain (
muscles (Pubovisceral
able 5 shows the fitted
For Prony series
relaxation (Creep) of these muscles is
shown in Table 6 and
NO
113.9 GPa
7.9856 GPa
3.138 GPa
3
FBG
Value
1590 nm
5 mm
70 %
9,000 strain
strain
strain
11 pm/°C
0.05°C
Single Mode
RESPECT TO TIME
z{ 4 z{ 5
9359 12033
Nq�rs�N
�P Nq�}
s�N�P
Assuming
body and
the reflected u to
in FBG
igs 4 and 5, ��tr svalues are
wavelength �N�W
Similarly, the change in
The
, by using
3, it is
, c
identify the
strain (%)
(Pubovisceral,
able 5 shows the fitted
Prony series
relaxation (Creep) of these muscles is
shown in Table 6 and
Fig.3: Reflected wavelenght for
Fig.4: Reflected wavelenght for
Fig.5: Reflected wavelenght for
Re
fle
cti
vit
yR
efl
ec
tiv
ity
0.1
0.2
0.3
0.4
0.5
0.6
0.7
0.8
0.9
Re
fle
cti
vit
y
FIG.2: THE STRAIN
Fig.3: Reflected wavelenght for
Fig.4: Reflected wavelenght for
increasing temrature by a FBG No.2
Fig.5: Reflected wavelenght for
increasing temrature by a FBG No.3
2.548 2.5485 2.549
0
0.2
0.4
0.6
0.8
1
FBGs reflected power by increasing 4o centigrade
Re
fle
cti
vit
y
1.52 1.530
0.1
0.2
0.3
0.4
0.5
0.6
0.7
0.8
0.9
1FBGs reflected power due to 1245 micro Strain in x Direction
Main Reflected
Strain Reflected
1.52 1.530
0.1
0.2
0.3
0.4
0.5
0.6
0.7
0.8
0.9
1FBGs reflected power due to 463 micro strain in y direction
HE STRAIN – WAVELENGTH RELATION
Fig.3: Reflected wavelenght for 4oC increasing temrature
Fig.4: Reflected wavelenght for 1245 micro
increasing temrature by a FBG No.2
Fig.5: Reflected wavelenght for 463 micro strain tension in y direction
increasing temrature by a FBG No.3
2.549 2.5495 2.55
FBGs reflected power by increasing 4o centigrade
wavelength
1.54 1.55
FBGs reflected power due to 1245 micro Strain in x Direction
wavelength
Main Reflected
Strain Reflected
1.54 1.55
FBGs reflected power due to 463 micro strain in y direction
wavelength
WAVELENGTH RELATION IN FBG
increasing temrature by a FBG
45 micro strain tension in x direction
increasing temrature by a FBG No.2
micro strain tension in y direction
increasing temrature by a FBG No.3
2.5505 2.551 2.5515
FBGs reflected power by increasing 4o centigrade
Main Spectrum
Reflected Specrum
1.56 1.57 1.58
FBGs reflected power due to 1245 micro Strain in x Direction
1.56 1.57 1.58
FBGs reflected power due to 463 micro strain in y direction
FBG
by a FBG No.1
strain tension in x direction
micro strain tension in y direction
2.5515
x 10-7
Main Spectrum
Reflected Specrum
1.58
x 10-6
1.58
x 10-6
348

TABLE 4
MEASURED STRAIN AND STRESS BY FBGS ON THREE DIFERENT MUSCLE
Stress (Mpa) Strain (%)
Pubovisceral Illiococcygeal Perineal body
0 0 0 0
0.1 0.007 0.009 0.014
0.2 0.008 0.009 0.015
0.3 0.017 0.011 0.02
0.4 0.022 0.016 0.028
0.5 0.039 0.022 0.043
0.6 0.041 0.031 0.061
0.7 0.043 0.044 0.094
TABLE 5
CALCULATED CONSTITUTIVE EQUATIONS COEFICIENT FOR THREE
DIFERENT MUSCLE
Muscle Type C10 C01 C11
Pubovisceral -0.106 0.129 0.038
Illiococcygeal -0.2 0.244 0.069
Perineal body -0.03 0.04 0.019
TABLE 6
MEASURED SHEAR BY ZNO AND RELATED GREEP FOR THREE DIFERENT
MUSCLE WITH RESPECT TO TIME
Relaxation
Time (Sec) Pubovisceral Illiococcygeal Perineal body
0 1 1 1
0.01 0.99 0.99 0.99
0.1 0.95 0.96 0.95
0.5 0.9 0.92 0.91
1 0.7 0.79 0.72
2 0.62 0.7 0.64
3 0.6 0.68 0.6
TABLE 7
PRONY SERIES COEFICIENT FOR THREE DIFERENT MUSCLE
Muscle Type ~� ~� ~� v� v� v�
Pubovisceral 0.325 0.308 0.179 11.39 0.708 297.99
Illiococcygeal 0.25 0.265 0.19 18.4 0.907 483.47
Perineal body 0.346 0.335 0.183 15.397 0.968 357.05
VII. CONCLUSION
The multi sensing of graspers for minimal invasive surgery
with embedded ZnO piezoelectric and Fiber Bragg Grating
sensors was studied. The feature of high sensitivity in time
and good resistance to temperature of ZnO, it is used for
measuring the rate of strain of muscles and using the
electromechanical coupling of ZnO, and Prony series
coefficients determined by measuring the rate of change of
muscle’s creep. The optomechanical relations between
strains and FBG reflected wavelength shifting caused by
strain displacement in x and y directions, has been studied
to determine the Cauchy-Green tensor equation for three
different types of common body muscles. By finding Prony
series coefficients and Cauchy-Green tensor equation, three
types of common body muscles diagnosed separately.
REFERENCES
[1] M. Shikida, T. Shimizu, K. Sato and K. Itoigawa, “Active tactile
sensor for detecting contact force and hardness of an object”, Sensors
Actuators, 2003, Vol. 103 213–8.
[2] J. Dargahi, “A piezoelectric tactile sensor with three sensing elements
for robotic, endoscopic, and prosthetic applications”, Sensors and
Actuators 80, 2000, pp 23–30.
[3] N. B.Narayanan, A. Bonakdar, J. Dargahi, M. Packirisamy and R.Bhat,
“Design and analysis of a micromachined piezoelectric sensor for
measuring the viscoelastic properties of tissues in minimally invasive
surgery,” Smart Mater. Struct. 15, 2006, pp.1684–1690.
[4] R. Sedaghati, J. Dargahi. and H. Singh, “Design and modeling of an
endoscopic piezoelectric tactile sensor”, Int. J. Solids Struct. 42, 2005,
pp.5872–86.
[5] N. Nakazawa, I. Kim, H.I nooka, R. Ikeura, “Force control of a robot
gripper based on human grasping schemes,” Elsevier Control Engineering
Practice vol.9, 2001, pp.735–742.
[6] J. Rosen, B. Hannaford, M. P. MacFarlane, and M. N. Sinanan, “Force
Controlled and Teleoperated Endoscopic Grasper for Minimally Invasive
Surgery Experimental Performance Evaluation”, IEEE Transactions On
Biomedical Engineering, vol. 46, NO. 10, October 1999.
[7] G. Tholey, T. Chanthasopeephan, T. Hu, J. P. Desai, and A. Lau,
“Measuring grasping and cutting forces for reality-based haptic
modeling”, Pro.17th Int. Congress and Exhibition Computer Assisted
Radiology and Surgery, London, U.K., 2003, vol. 1256, pp. 794-800.
[8] N. Zemiti, G. Morel, T. Ortmaier, and N. Bonnet, “Mechatronic design
of a new robot for force control in minimally invasive surgery,”
IEEE/ASME Trans. Mechatronics, vol. 12, no. 2, pp. 143-153, April 2007.
[9] David J. Cappelleri and Mary I. Frecker, “Optimal Design of Smart
Tools for Minimally Invasive Surgery,” Proceedings of Optimization in
Industry II, Banff, Canada, June 1999.
[10] U. Seibold, B. Kubler, and G. Hirzinger, “Prototype of Instrument
for Minimally Invasive Surgery with 6-Axis Force Sensing Capability”,
Proceedings of the 2005 IEEE International Conference on Robotics and
Automation Barcelona, Spain, April 2005.
[11] J. Dargahi, S.Najarian, “An endoscopic force-position sensor
grasper with minimum sensors”, Bio-Medical Materials and Engineering,
IOS Press, 2004, 151–166.
[12] G. Tholey, A. Pillarisetti, W. Green, and J. P.Desai, “Design,
Development, and Testing of an Automated Laparoscopic Grasper with 3-
D Force Measurement Capability”, Medical Simulation: International
Symposium, ISMS 2004: 38-48, ISMS 2004, Cambridge, MA, USA.
[13] G. Tholey, J. P. Desai, and A. E. Castellanos, “Force Feedback
plays a significant role in Minimally Invasive Surgery - Results and
Analysis”, Annals of Surgery, vol. 241:1, pp. 102, January 2005.
[14] Zener, C., Elasticity and Anelasticity of Metals, University of
Chicago Press, Chicago (1948)
[15] IEEE Standard on Piezoelectricity. 1987. ANSI/IEEE, Std. 176.
Morgan Matric Inc. Piezoceramic Databook. 1993. Morgan Matroc Inc.,
Electroceramics Division.
349