multi-region response to conservation buffers targeted for northern bobwhite
TRANSCRIPT

Management and Conservation
Multi-Region Response to ConservationBuffers Targeted for Northern Bobwhite
KRISTINE O. EVANS,1,2 Department of Wildlife, Fisheries & Aquaculture, Mississippi State University, Mississippi State, MS 39762, USA
L. WES BURGER, Jr., Department of Wildlife, Fisheries & Aquaculture, Mississippi State University, Mississippi State, MS 39762, USA
CORNELIA S. OEDEKOVEN, School of Mathematics and Statistics, University of St. Andrews, St. Andrews KY16 9LZ, UK
MARK D. SMITH,3 Department of Wildlife, Fisheries & Aquaculture, Mississippi State University, Mississippi State, MS 39762, USA
SAMUEL K. RIFFELL, Department of Wildlife, Fisheries & Aquaculture, Mississippi State University, Mississippi State, MS 39762, USA
JAMES A. MARTIN, Department of Wildlife, Fisheries & Aquaculture, Mississippi State University, Mississippi State, MS 39762, USA
STEPHEN T. BUCKLAND, School of Mathematics and Statistics, University of St. Andrews, St. Andrews KY16 9LZ, UK
ABSTRACT We coordinated a large-scale evaluation of northern bobwhite (Colinus virginianus) populationresponse to establishment of 9-m to 37-m linear patches (buffers) of native herbaceous vegetation along row-crop field margins as part of the Conservation Reserve Program practice Habitat Buffers for Upland Birds(CP33). We compared northern bobwhite covey densities on 1,088 paired row-crop fields with and withoutnative herbaceous buffers in 13 states during autumn, 2006–2008. We used a 2-stage random effectsmodeling approach that incorporates the effective area as an offset in generalized linear mixed models toassess regional relationships among autumn bobwhite covey densities and covariates of field type (i.e., fieldswith vs. without native herbaceous buffers), ecological region, year, survey week, and contracted vegetativecover (i.e., planting native grasses and forbs vs. establishing through natural regeneration). Covey density wascorrelated with year and interaction effects of field type and ecological region. The year effect suggestedannual variation in covey densities, whereas the field type by ecological region interaction suggested coveyresponse to buffers was dependent on spatial location, likely reflecting differences in buffer establishment,succession, and characteristics of the surrounding landscape among regions. Mean fitted covey density onfields across all survey sites was 0.047 (�0.008 bootstrap standard error [BSE]) and 0.031 coveys/ha (�0.003BSE) on row-crop fields with and without herbaceous buffers, respectively. Covey density was greater onfields with buffers relative to matched, comparison fields without buffers in the Mississippi Alluvial Valley(241%; P < 0.001) and both the eastern (123%; P < 0.001) and western (60%; P ¼ 0.01) portions of theSoutheastern Coastal Plain region. Covey density was an order of magnitude greater in the central Texasregion compared to other regions, but exhibited a small response to native herbaceous buffers, as did densityof coveys in the Eastern Tallgrass Prairie and Central Hardwoods regions. Disproportionate response tobuffers in the Mississippi Alluvial Valley and Southeastern Coastal Plain suggests native herbaceous habitatsmight be limiting during autumn in these regions, whereas lack of response in the Eastern Tallgrass Prairie,Central Hardwoods, and central Texas regions suggests that herbaceous habitat either was not limiting orbuffers failed to provide adequate requirements for bobwhites during autumn. Selection of other habitats tomeet security and thermoregulatory needs might have resulted in lack of response in these regions. Nativeherbaceous cover provided by buffers can provide critical habitat in row-crop agricultural systems in someregions, and can contribute to regional population recovery objectives of the Northern BobwhiteConservation Initiative (NBCI). However, range-wide NBCI recovery objectives will best be met throughmultiple conservation practices in row-crop agricultural systems. � 2013 The Wildlife Society.
KEY WORDS agricultural conservation, Colinus virginianus, conservation buffers, conservation reserve program,CP33, density estimation, multi-scale assessment, northern bobwhite, targeted conservation practices, 2-stage modeling.
Large-scale changes in land use, including expansionand intensification of agriculture and forestry, have causedhabitat loss and subsequent population declines in early-succession bird species (Peterjohn 2003, Green et al.2005). Northern bobwhite (Colinus virginianus; hereafter,bobwhite) have exhibited some of the greatest populationdeclines because of large-scale losses of habitat, and majorefforts like the National Bobwhite Conservation Initiative(NBCI; Dimmick et al. 2002, National Bobwhite Technical
Received: 5 March 2012; Accepted: 23 October 2012Published: 19 February 2013
Additional supporting information may be found in the online version ofthis article.1E-mail: [email protected] address: U.S. Fish and Wildlife Service, National WildlifeRefuge System Gulf Coastal Plains and Ozarks Inventory andMonitoring Network, Box 9627, Mississippi State, MS 39762, USA.3Present address: School of Forestry and Wildlife Sciences, 3301 ForestryandWildlife Sciences Building, Auburn University, Auburn, AL 36849,USA.
The Journal of Wildlife Management 77(4):716–725; 2013; DOI: 10.1002/jwmg.502
716 The Journal of Wildlife Management � 77(4)

Committee 2011) are underway to recover range-wide pop-ulations (Klimstra 1982, Brennan 1991). The NBCI ispredicated on the ecological assumption that relatively smallchanges in land use can elicit biologically significant increasesin autumn density. Specifically, the NBCI predicts an addi-tional 2.4–2.7 million coveys could be added to existingpopulations with only a 6–7% change in primary land use(e.g., establishing native herbaceous habitats along row-cropfield edges), which would contribute to large-scale habitatand population recovery goals of the NBCI plan (Dimmicket al. 2002, National Bobwhite Technical Committee 2011).Replacing biologically sterile row-crop field margins
with herbaceous cover (hereafter, field buffers) to increaseupland bird populations has been suggested since the 1930s(Stoddard 1931, Davison 1941). Field buffers benefitoverwintering upland passerine species (Marcus et al.2000, Smith et al. 2005, Conover et al. 2007, Blank et al.2011). Autumn bobwhite response to field buffers has typi-cally been positive, but varies in magnitude in different partsof the range (Palmer et al. 2005, Moorman and Riddle 2009,Smith and Burger 2009, Pitman and Sams 2010). A dispro-portionately large response in autumn covey density (relativeto percent of land use actually altered) might occur if buffersalter utility of both the field margin and the adjacent habitats(Smith 2004). However, limiting habitat factors (driven bydifferences in land use and available non-breeding seasonhabitat) and habitat selection strategy might vary amongregions, and drive differences in bobwhite response to fieldbuffers during autumn.Recent conservation practices have been established to
target specific objectives of national conservation initiatives(Burger et al. 2006a). We evaluated bobwhite covey densitieson row-crop fields with and without native herbaceous fieldbuffers that were enrolled in continuous Conservation
Reserve Program (CRP) practice Habitat Buffers forUpland Birds (CP33), which was developed to help meetbobwhite population recovery objectives of the NBCI (U.S.Department of Agriculture [USDA] 2004). The CP33 prac-tice offers row-crop producers incentives to establish 9-m to37-m linear patches of native herbaceous vegetation (i.e.,field buffers) along row-crop field margins to provide tem-porary habitat for bobwhite and other upland bird species(USDA 2004). Our objective was to estimate density ofbobwhite coveys in response to CP33 upland habitat buffersin row-crop production systems across 9 ecological regions(13 states). We used a 2-stage analytical approach to evaluaterelationships between bobwhite covey densities and charac-teristics of field type (i.e., fields with and without buffers),ecological region, and other covariates (Buckland et al. 2009).
STUDY AREA
Under our coordination, collaborating agencies (seeAcknowledgments Section) conducted annual bobwhitecovey surveys in 13 states (Burger et al. 2006b; Fig. 1)from 2006 to 2008. Using parameter estimates from a pilotstudy and a stochastic simulation, we determined a coeffi-cient of variation <15% on regional estimates could beachieved with 40–50 survey points per state if a mean of1 covey/point were detected (Smith et al. 2009). Our targetpopulation included bobwhite coveys on privately ownedrow-crop agricultural fields containing CP33 buffers.Conservation Reserve Program landowner contracts werethe unit of filing and enrollment for USDA conservationprograms and individual fields were not subject to directsampling in this study. We therefore used a multi-stageapproach to select randomly 40 sampling units (i.e., land-owner contracts to establish CP33 upland habitat buffersunder CRP) from the list of all available landowner CP33
Figure 1. Point transect survey locations in 10 Bird Conservation Regions (BCR) on row-crop fields with and without CP33 field buffers, categorized bylocation of point clusters within ecological region (Central Hardwoods [CH], Central Texas [CTX], Eastern Southeastern Coastal Plain [ESCP], EasternTallgrass Prairie [ETP], Mississippi Alluvial Valley [MAV], Western Southeastern Coastal Plain [WSCP]) in 13 states on which autumn northern bobwhitecovey surveys were conducted, 2006–2008. Parenthetic numbers represent BCR numerical codes.
Evans et al. � Bobwhite Response to Targeted Habitat Buffers 717

contracts (31 Dec 2005) within each state (Burger et al.2006b). From within each sampling unit (CRP contract),we selected randomly 1–3 sub-sampling units (i.e., row-cropfields with CP33 buffers along field margins) and locatedsurvey points on the linear mid-point of the field buffer. Weselected multiple fields within a single landowner CP33contract only if survey points were >500 m apart to avoiddouble counting. We then selected paired, row-crop fieldswithout buffers that were 1–3 km from row-crop fields withbuffers, but that had a similar cropping system and landscape.Survey points were located on 546 row-crop fields withbuffers and 542 fields without buffers (Fig. 1).We sampled survey points in 10 Bird Conservation
Regions (BCR; i.e., ecological regions with similar birdcommunities, habitats, and land use; North AmericanBird Conservation Initiative 2000; Fig. 1). However, becauselocations of survey points depended on locations of CP33contracts (i.e., non-random locations with respect tolandscape), survey points may not have been representativeof every BCR. Therefore, we sub-grouped survey pointsbased on natural groupings within or adjacent to BCRs(Fig. 1). Most natural groupings were contained within asingle BCR (e.g., Eastern Tallgrass Prairie) or a subdivisionof a BCR (e.g., Eastern Southeastern Coastal Plain,WesternSoutheastern Coastal Plain). We classified points in Texasas a Central Texas grouping because they represented acontiguous sub-group of points overlapping both CentralMixed-grass Prairie and Oaks and Prairies BCRs (Fig. 1).
METHODS
We coordinated annual point transect surveys for bobwhitecoveys (min. of 1 survey per autumn per point) from the lastweek of September to the second week of November, 2006–2008 based on calling rates observed in Wellendorf et al.(2004). Observers visited paired survey points (i.e., row-cropfields with and without herbaceous buffers) simultaneouslyto reduce weather-related variation. Observers conductedcovey surveys during favorable weather conditions (i.e.,winds <6.5 km/hr, <75% cloud cover, no precipitation,and <0.05 in./Hg change in barometric pressure [0100–0700 hr]; Burger et al. 2006b). We defined coveys as singleor grouped series of ‘‘koi-lee’’ vocalizations coming from afixed location. Observers recorded uniquely identifiable cov-eys and time of calling once at their initial estimated locationfrom 45 minutes before sunrise to 5 minutes before sunrise(Burger et al. 2006b). Observers marked each estimatedcovey location onto National Agricultural ImageryProgram aerial imagery (USDA 2007) and classified andmeasured radial distance from survey point to covey locationsin ArcGIS (Environmental Systems Research Institute,Redlands, CA).
Two-Stage Analytic ApproachAbility to detect calling bobwhite coveys within survey plotsmay vary (Rusk et al. 2009), and thus the NBCI recommendssurvey and analytical methods account for detection proba-bility (i.e., detectability; Evans et al. 2011). We assumeddetectability decreased as a function of distance between
observers and calling bobwhite coveys and therefore useddistance sampling to model a covey detection function(Buckland et al. 2001). We assumed survey points weredistributed randomly relative to covey distribution, distanceswere measured accurately, coveys did not move in response toobservers, and probability of detecting a covey at the surveypoint was 100% (Buckland et al. 2001).Our interest was the influence of covariates on densities at
survey points. However, to adjust the observed counts forimperfect detection, we adopted a 2-stage modeling strategy(Buckland et al. 2009). In the first stage, we estimated adetection function, which models the decay in detectionprobabilities with increasing distance from the point. Thedetection function also included covariates to account forheterogeneity in detection probabilities. In the second stage,we related adjusted counts to covariates we believed mightinfluence covey densities. To quantify the precision ofparameter estimates, we used a non-parametric bootstraproutine. Our specific steps were as follows.Stage 1: assessing detection probability.—We excluded all
survey points from Arkansas and Ohio (because of smallsample size), those points not surveyed at least once each year(2006–2008), and those points not paired spatially (with andwithout buffers) prior to analysis, which left 369 pairedsurvey points (2,214 point surveys) from 11 states. Wepooled covey data at each point across years (2006–2008).We inspected detection function plots within DISTANCE6.0 (Thomas et al. 2010) and removed radial distancesbeyond distance w (500 m) where detection probabilityfell to, at most, 0.1 (Buckland et al. 2001). We evaluatedfits of half-normal (HN) and hazard rate (HR) key functionmodels with series adjustments (cosine [HN, HR], hermitepolynomial [HN]) within the multiple covariate distancesampling engine of DISTANCE 6.0 (Thomas et al.2010). We assessed model fit with and without covariates,and with and without post-stratification (i.e., accounting forheterogeneous detection probabilities by fitting separatedetection functions for each specified stratum) by state,physiographic region, and field type (i.e., fields with vs.without buffers; Buckland et al. 2001; Table 1). Multiplecovariate distance sampling models included factor-levelcovariates state, region, field type, year, state þ year, andstate þ field type, and continuous covariates Julian day,cloud cover (%), 6-hour change in barometric pressure(in./Hg; 0100–0700 hr), wind speed (km/hr), and numberof adjacent calling coveys (Table 1). We included region toaccount for potential variation in detectability from differingland use, land form, and vegetation structure among regions.We included state to reflect variable state-level implementa-tion of the buffer practice (planting schema and dates,recommended species mixes, etc.). We included year toreflect changing vegetative structure within herbaceous buf-fers due to succession, and outside of buffers due to croppingregime or land use. We used Akaike’s Information Criterion(AIC; Akaike 1973), visual inspection of quantile–quantileplots, and Kolmogorov–Smirnov and Cramer–von Misesgoodness-of-fit tests to determine the best fitted model ofthe detection function (Buckland et al. 2001, 2004). For
718 The Journal of Wildlife Management � 77(4)

post-stratified analysis, we summed AIC values across stratafor comparison to other models (Buckland et al. 2001).Using the best approximating model in program R, we
fitted a probability density function to the observed distancedata (Buckland et al. 2004). We then used the probabilitydensity function to estimate the effective area v, defined asthe area beyond which as many coveys are presumed to havebeen observed as were missed (Buckland et al. 2001).Effective area per point is the circular area out to the radialtruncation distance w times the probability of detection.Using the best covariate model, we then implementeda non-parametric bootstrap (B ¼ 999) routine in R (RFoundation for Statistical Computing, Vienna, Austria),which calls the multiple covariate distance sampling engineof DISTANCE 6.0, to account for uncertainty in parameterestimation and estimate precision of detection functionparameters using bootstrap replicates (Buckland et al.
2009). The bootstrap is a simulation mechanism that usesB random resamples with replacement from the original dataset (Efron 1979). We used sample variance of parameterestimates from B total resamples and estimated bootstrapstandard error (BSE) as the square root of sample variance.Thus with each bootstrap resample, we re-estimated alldetection function parameter estimates and re-calculatedeffective area (Buckland et al. 2009).Stage 2: Poisson regression incorporating effective area offset.—
Because we could not assume perfect detectability out totruncation distance w, we incorporated the estimate ofeffective area as an offset into a Poisson-distributed general-ized linear mixed model with spatial structure of pairedpoints representing sites j as a random effect (Bucklandet al. 2004, C. S. Oedekoven, University of St. Andrews,unpublished data). If analysis in stage 1 suggested heteroge-neity in detectability, we used the log of effective area njkl asan offset in equation (1) and with a log-link function wewould consider expected count l at visit l to point k of pairedsite j, a Poisson random variable to be
ljkl ¼ exp b0 þ bj þX1i¼1
xijklbi þ lnðnjkl Þ !
(1)
thus, modeling density where ljkl/njkl represented the densityat visit l to point k of paired site j, and where b0 is the fixedeffect intercept, bj is the random effect for paired sites withand without buffers j where bj � N 0; s2
b
� �, xi is the ith fixed
effect, xijkl are measured fixed effect values, and bi are asso-ciated coefficients for each fixed effect (Buckland et al. 2009).We fitted 31 Poisson generalized linear mixed models
(log-link function) with a log effective area offset with theglmer function of the lme4 package in R (Bates 2010;Table 2). Potential fixed effects included field type (fieldswith vs. without buffers), state-recommended cover types(i.e., state-specific practice standards related to establishingcover in buffers (native warm-season grass only, naturalregeneration only, landowner choice), region, year, andweekly period. Because of the broad geographic range ofsurvey points, we anticipated interactions among region �field type, region � year, region � weekly period, fieldtype � year, and contract cover � year. We included fieldtype because we presumed additional herbaceous habitatprovided by field buffers may influence bobwhite coveydensity in the immediate and surrounding landscape. Asignificant field type term in the model would provide evi-dence that densities on fields with buffers were different fromthose without buffers, with a positive coefficient for thefactor level, with buffer, indicating greater covey densitieson buffered fields compared to non-buffered fields. Weincluded state-recommended cover types to assess variationin autumn covey density related to differences in plant speciescomposition of buffers. We included region as a covariateand in subsequent interactions involving region becausebobwhite densities may have varied among regions, reflectingdifferences in land form, land use, and climate. We includedyear to account for annual variation in covey density andchanges in buffer vegetation structure related to succession or
Table 1. Differences in Akaike’s Information Criterion scores (DAIC)and number of parameters (K) for candidate models of the detectionfunction for northern bobwhite covey data truncated at 500 m on row-cropfields with and without CP33 field buffers (type) in 11 states (7 regions;2006–2008). Continuous covariates Julian day (day), wind speed (wind;km/hr), cloud cover (cloud; %), 6-hour change in barometric pressure(bp; in./Hg; 0100–0700 hr), and number of adjacent coveys (adj) have beenshown to influence calling rate of bobwhite coveys (Wellendorf et al. 2004).Covariates were not evaluated in post-stratified models to minimize thecandidate model set.
Key functiona Post-stratified Covariates K DAIC
HR Stateb þ yearb 14 0.00HR Stateb þ typeb 13 9.91HR State 22 21.43HR Stateb 12 22.40HN Stateb þ yearb 13 24.51HN Stateb þ typeb 12 48.35HN Stateb 11 56.66HN State 11 57.56HR Regionb 8 75.12HR Region 14 76.35HN Regionb 7 107.13HN Region 7 108.03HR Day 3 158.56HR Wind 3 180.23HR Yearb 4 185.51HR Type 4 185.69HR Coverc 4 195.11HR 2 196.12HR Typeb 3 197.51HN Wind 2 199.51HR Cloud 3 200.83HN Day 2 201.42HR adj 3 202.48HR bp 3 203.43HN Coverc 3 210.79HN Yearb 3 211.05HN Typeb 2 212.48HN Type 2 213.36HN Cloud 2 224.03HN 1 227.85HN adj 2 228.69HN bp 2 228.97
a Key function models – hazard rate (HR), half-normal (HN).b Factor-level covariate.c Contracted cover (natural regeneration, planted to native grass, land-owner choice).
Evans et al. � Bobwhite Response to Targeted Habitat Buffers 719
crop rotation. We did not include buffer width on our studysites as a covariate in analysis because width data was notcollected in some states, and was measured inconsistently inother states. Because calling activity may have fluctuatedduring the survey period (Seiler et al. 2002, Wellendorfet al. 2004), we modeled linear and quadratic effects ofweekly period. For all candidate models fitted with glmer,we manually set the number of quadrature points [nAGQ]for the Gauss–Hermite approximation to 10 (Lasaffre andSpiessens 2001).We evaluated the global model for overdispersion by
assessing the x2 variance inflation factor prior to implement-ing the remaining candidate model set (Burnham andAnderson 2002). Provided data were not overdispersed;therefore, we used an automated selection routine in R tocompare candidate models and selected the best approximat-ing model based on minimum AIC (Buckland et al. 1997,Burnham and Anderson 2002). We used a non-parametricbootstrap (B ¼ 999) in R to estimate precision of modelparameters of the best approximating model using surveypoint pairs as the resampling unit (Buckland et al. 2009).Because measures of precision from Poisson count modelparameters do not account for uncertainty in the offset, weused the bootstrap to propagate uncertainty from fitting the
detection function into the count model (Buckland et al.2009). We determined significance of model parametersusing 95% confidence intervals generated from the bootstrapin combination with Z-tests from analytical point estimates(Buckland et al. 2009).Estimating density.—We could not access lands under
private ownership adjacent to survey points and many land-owners did not allow the flushing of detected coveys, so wewere limited to estimating covey densities and not individualbird densities. We estimated covey density based on fittedvalues from the best count model by dividing estimatedexpected count ljkl at each point visit by effective area njkl.We estimated density at the field type level and by field typewithin region level by subsetting densities from overall fittedvalues. We estimated analytical variances and standard errors(ASE) by field type within region each year. However,analytical variances do not incorporate variance in effectivearea and are thus non-representative of full variability ofdensity estimates. Variance estimates must account foruncertainty in fitted counts n, derived from the model,and effective area v (Buckland et al. 2004). We used com-bined bootstrap variances of fitted counts and effective area(above; Buckland et al. 2004) to incorporate multiplevariance components into density estimates. This assumesindependence among variance components (Buckland et al.2004).
RESULTS
Stage 1: Detection ProbabilityThe multiple covariate distance sampling hazard rate modelwith no adjustment terms and state and year as covariateswas the best approximating model (Table 1), with aKolmogorov–Smirnov fit of 0.016 (P ¼ 0.597), Cramer–vonMises uniform weighted fit of 0.079 (0.600 < P < 0.700),and Cramer–von Mises cosine weighted fit of 0.044(0.700 < P < 0.800). Differences in vegetation structureamong fields with and without buffers did not influencecovey detectability. Effective area, effective detection radii,and probability of detection within a 500-m radius from thepoint varied among states and years (Table S1, availableonline at www.onlinelibrary.wiley.com).
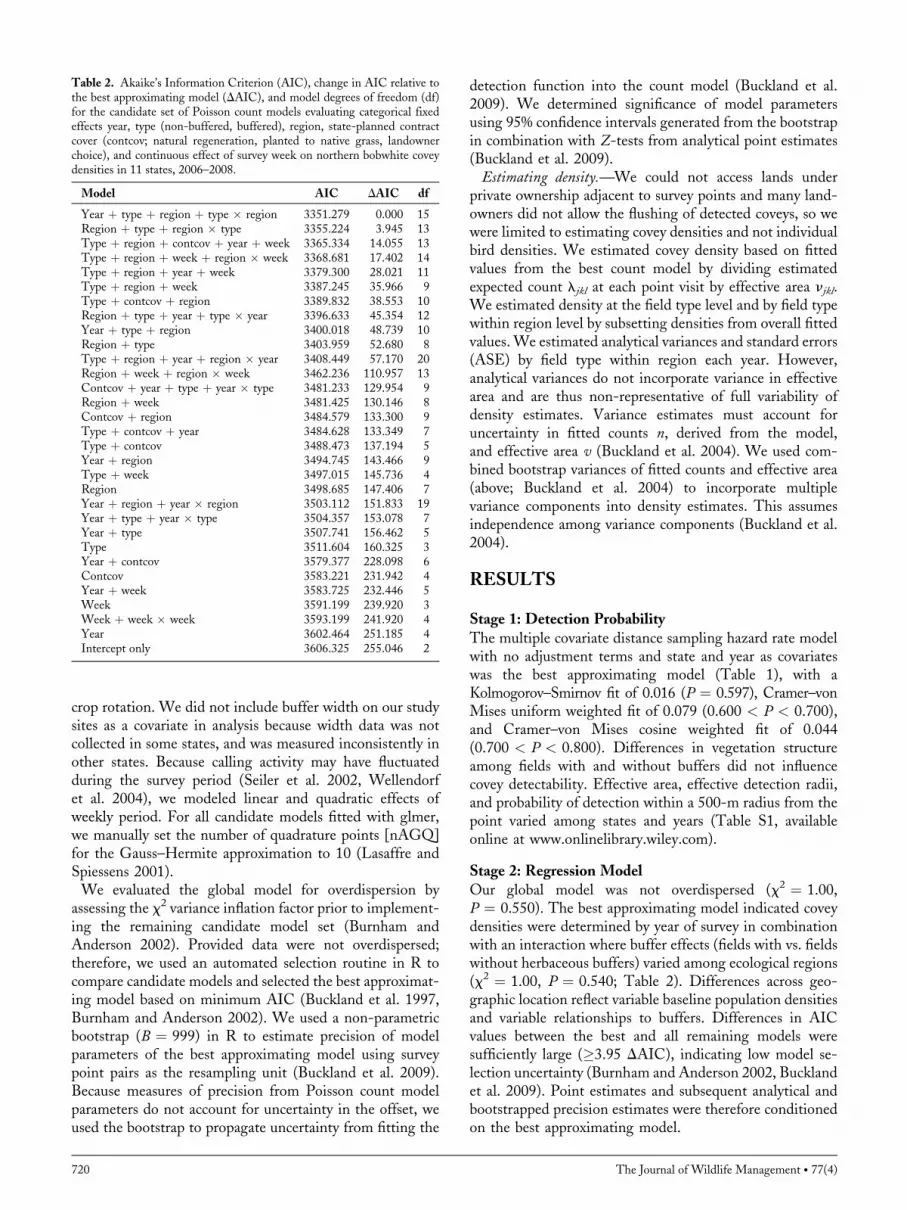
Stage 2: Regression ModelOur global model was not overdispersed (x2 ¼ 1.00,P ¼ 0.550). The best approximating model indicated coveydensities were determined by year of survey in combinationwith an interaction where buffer effects (fields with vs. fieldswithout herbaceous buffers) varied among ecological regions(x2 ¼ 1.00, P ¼ 0.540; Table 2). Differences across geo-graphic location reflect variable baseline population densitiesand variable relationships to buffers. Differences in AICvalues between the best and all remaining models weresufficiently large (�3.95 DAIC), indicating low model se-lection uncertainty (Burnham and Anderson 2002, Bucklandet al. 2009). Point estimates and subsequent analytical andbootstrapped precision estimates were therefore conditionedon the best approximating model.
Table 2. Akaike’s Information Criterion (AIC), change in AIC relative tothe best approximating model (DAIC), and model degrees of freedom (df)for the candidate set of Poisson count models evaluating categorical fixedeffects year, type (non-buffered, buffered), region, state-planned contractcover (contcov; natural regeneration, planted to native grass, landownerchoice), and continuous effect of survey week on northern bobwhite coveydensities in 11 states, 2006–2008.
Model AIC DAIC df
Year þ type þ region þ type � region 3351.279 0.000 15Region þ type þ region � type 3355.224 3.945 13Type þ region þ contcov þ year þ week 3365.334 14.055 13Type þ region þ week þ region � week 3368.681 17.402 14Type þ region þ year þ week 3379.300 28.021 11Type þ region þ week 3387.245 35.966 9Type þ contcov þ region 3389.832 38.553 10Region þ type þ year þ type � year 3396.633 45.354 12Year þ type þ region 3400.018 48.739 10Region þ type 3403.959 52.680 8Type þ region þ year þ region � year 3408.449 57.170 20Region þ week þ region � week 3462.236 110.957 13Contcov þ year þ type þ year � type 3481.233 129.954 9Region þ week 3481.425 130.146 8Contcov þ region 3484.579 133.300 9Type þ contcov þ year 3484.628 133.349 7Type þ contcov 3488.473 137.194 5Year þ region 3494.745 143.466 9Type þ week 3497.015 145.736 4Region 3498.685 147.406 7Year þ region þ year � region 3503.112 151.833 19Year þ type þ year � type 3504.357 153.078 7Year þ type 3507.741 156.462 5Type 3511.604 160.325 3Year þ contcov 3579.377 228.098 6Contcov 3583.221 231.942 4Year þ week 3583.725 232.446 5Week 3591.199 239.920 3Week þ week � week 3593.199 241.920 4Year 3602.464 251.185 4Intercept only 3606.325 255.046 2
720 The Journal of Wildlife Management � 77(4)
Relationship Between Herbaceous Buffers and CoveyDensity
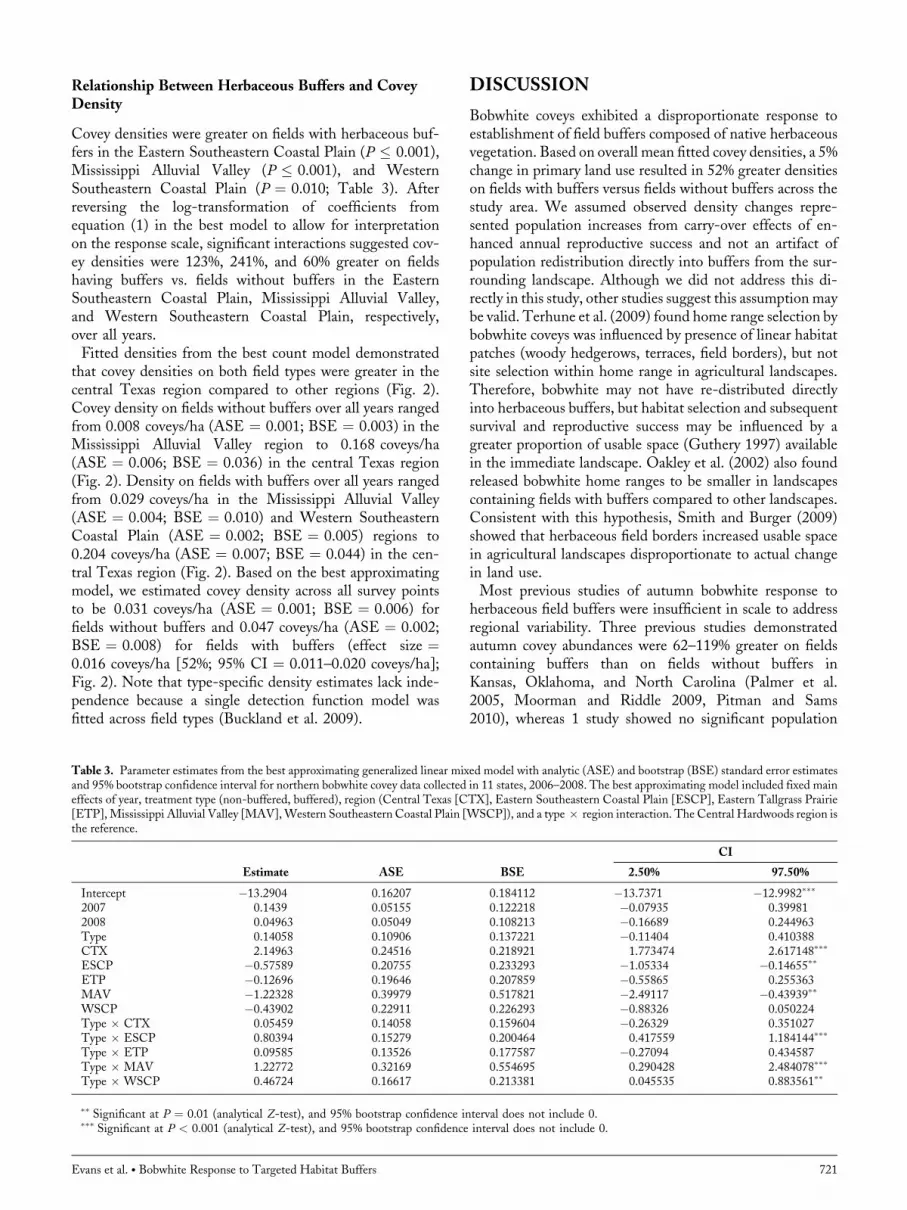
Covey densities were greater on fields with herbaceous buf-fers in the Eastern Southeastern Coastal Plain (P � 0.001),Mississippi Alluvial Valley (P � 0.001), and WesternSoutheastern Coastal Plain (P ¼ 0.010; Table 3). Afterreversing the log-transformation of coefficients fromequation (1) in the best model to allow for interpretationon the response scale, significant interactions suggested cov-ey densities were 123%, 241%, and 60% greater on fieldshaving buffers vs. fields without buffers in the EasternSoutheastern Coastal Plain, Mississippi Alluvial Valley,and Western Southeastern Coastal Plain, respectively,over all years.Fitted densities from the best count model demonstrated
that covey densities on both field types were greater in thecentral Texas region compared to other regions (Fig. 2).Covey density on fields without buffers over all years rangedfrom 0.008 coveys/ha (ASE ¼ 0.001; BSE ¼ 0.003) in theMississippi Alluvial Valley region to 0.168 coveys/ha(ASE ¼ 0.006; BSE ¼ 0.036) in the central Texas region(Fig. 2). Density on fields with buffers over all years rangedfrom 0.029 coveys/ha in the Mississippi Alluvial Valley(ASE ¼ 0.004; BSE ¼ 0.010) and Western SoutheasternCoastal Plain (ASE ¼ 0.002; BSE ¼ 0.005) regions to0.204 coveys/ha (ASE ¼ 0.007; BSE ¼ 0.044) in the cen-tral Texas region (Fig. 2). Based on the best approximatingmodel, we estimated covey density across all survey pointsto be 0.031 coveys/ha (ASE ¼ 0.001; BSE ¼ 0.006) forfields without buffers and 0.047 coveys/ha (ASE ¼ 0.002;BSE ¼ 0.008) for fields with buffers (effect size ¼0.016 coveys/ha [52%; 95% CI ¼ 0.011–0.020 coveys/ha];Fig. 2). Note that type-specific density estimates lack inde-pendence because a single detection function model wasfitted across field types (Buckland et al. 2009).
DISCUSSION
Bobwhite coveys exhibited a disproportionate response toestablishment of field buffers composed of native herbaceousvegetation. Based on overall mean fitted covey densities, a 5%change in primary land use resulted in 52% greater densitieson fields with buffers versus fields without buffers across thestudy area. We assumed observed density changes repre-sented population increases from carry-over effects of en-hanced annual reproductive success and not an artifact ofpopulation redistribution directly into buffers from the sur-rounding landscape. Although we did not address this di-rectly in this study, other studies suggest this assumption maybe valid. Terhune et al. (2009) found home range selection bybobwhite coveys was influenced by presence of linear habitatpatches (woody hedgerows, terraces, field borders), but notsite selection within home range in agricultural landscapes.Therefore, bobwhite may not have re-distributed directlyinto herbaceous buffers, but habitat selection and subsequentsurvival and reproductive success may be influenced by agreater proportion of usable space (Guthery 1997) availablein the immediate landscape. Oakley et al. (2002) also foundreleased bobwhite home ranges to be smaller in landscapescontaining fields with buffers compared to other landscapes.Consistent with this hypothesis, Smith and Burger (2009)showed that herbaceous field borders increased usable spacein agricultural landscapes disproportionate to actual changein land use.Most previous studies of autumn bobwhite response to
herbaceous field buffers were insufficient in scale to addressregional variability. Three previous studies demonstratedautumn covey abundances were 62–119% greater on fieldscontaining buffers than on fields without buffers inKansas, Oklahoma, and North Carolina (Palmer et al.2005, Moorman and Riddle 2009, Pitman and Sams2010), whereas 1 study showed no significant population
Table 3. Parameter estimates from the best approximating generalized linear mixed model with analytic (ASE) and bootstrap (BSE) standard error estimatesand 95% bootstrap confidence interval for northern bobwhite covey data collected in 11 states, 2006–2008. The best approximating model included fixed maineffects of year, treatment type (non-buffered, buffered), region (Central Texas [CTX], Eastern Southeastern Coastal Plain [ESCP], Eastern Tallgrass Prairie[ETP],Mississippi Alluvial Valley [MAV],Western Southeastern Coastal Plain [WSCP]), and a type � region interaction. The Central Hardwoods region isthe reference.
Estimate ASE BSE
CI
2.50% 97.50%
Intercept �13.2904 0.16207 0.184112 �13.7371 �12.9982���
2007 0.1439 0.05155 0.122218 �0.07935 0.399812008 0.04963 0.05049 0.108213 �0.16689 0.244963Type 0.14058 0.10906 0.137221 �0.11404 0.410388CTX 2.14963 0.24516 0.218921 1.773474 2.617148���
ESCP �0.57589 0.20755 0.233293 �1.05334 �0.14655��
ETP �0.12696 0.19646 0.207859 �0.55865 0.255363MAV �1.22328 0.39979 0.517821 �2.49117 �0.43939��
WSCP �0.43902 0.22911 0.226293 �0.88326 0.050224Type � CTX 0.05459 0.14058 0.159604 �0.26329 0.351027Type � ESCP 0.80394 0.15279 0.200464 0.417559 1.184144���
Type � ETP 0.09585 0.13526 0.177587 �0.27094 0.434587Type � MAV 1.22772 0.32169 0.554695 0.290428 2.484078���
Type � WSCP 0.46724 0.16617 0.213381 0.045535 0.883561��
�� Significant at P ¼ 0.01 (analytical Z-test), and 95% bootstrap confidence interval does not include 0.��� Significant at P < 0.001 (analytical Z-test), and 95% bootstrap confidence interval does not include 0.
Evans et al. � Bobwhite Response to Targeted Habitat Buffers 721

response to narrow native herbaceous buffers in Mississippi,but a comparable mean relative effect size (64%) to ourresults (Smith and Burger 2009). Observed differences inresponse among studies may be related to differences inbuffer width, planting strategy, seed mix, surroundinglandscapes, or cropping regimes. However, inferencesregarding quality of buffer habitats based on density orabundance alone should be drawn with caution, as increasedcovey densities in buffered habitats may not reflect habitatquality (Van Horne 1983, Vickery et al. 2002).Regional variation in our study supports NBCI recommen-
dations that prescriptions for bobwhite conservation andpopulation recovery be developed by region (NationalBobwhite Technical Committee 2011) because land use,agricultural systems, climate, baseline population densities,and requirements for vegetation structure vary amongregions. Composition of patch types (e.g., row-crop, woodycover, grass cover) in the landscape surrounding surveypoints also differs among regions, with some dominatedby row-crop agriculture and others with a more even distri-bution of patch types. Observed regional variation in ourstudy suggests scale of inference is an important factor forstudies of bobwhite response to conservation and habitatmanagement practices. However, coveys in all regions inour study exhibited either positive or null relationshipswith native herbaceous buffers; we found no negativerelationships.The greatest positive relationship between autumn
bobwhite densities and native herbaceous field buffers was
observed in the Mississippi Alluvial Valley, EasternSoutheastern Coastal Plain, and Western SoutheasternCoastal Plain. The region with the greatest relationship(Mississippi Alluvial Valley) is dominated by row-crop agri-culture and exhibited the lowest covey densities compared toother regions. On average, covey densities in the MississippiAlluvial Valley increased from 1 covey/132 ha on fieldswithout buffers to 1 covey/34 ha on fields with buffers.Populations having lower density in intensively croppedlandscapes with little grass cover may have benefittedfrom linear patches of native herbaceous vegetation alongrow-crop field margins. However, covey densities were alsogreater on fields with buffers in the Eastern and WesternSoutheastern Coastal Plain regions, which typically havegreater proportions of woody cover than the MississippiAlluvial Valley. Increased density on fields with bufferssuggested coveys responded to increased availability ofnative herbaceous habitat provided by field buffers regardlessof variation in composition of other landscape features inthese regions. Increased grassland amount relative to existingcover may be driving observed responses in these differentregions. Given response was greater in the intensivelycropped Mississippi Alluvial Valley region, our resultssupport the conclusion of Riddle et al. (2008) that bobwhitewill respond more positively to field buffers in agriculture-dominated landscapes than in forest-dominated landscapes.In contrast, we observed small responses (approx. 10%
increase) of autumn covey density to native herbaceousbuffers in the Eastern Tallgrass Prairie region even though
Figure 2. Regional and overall fitted northern bobwhite covey densities (coveys/ha � 95% bootstrap confidence intervals) in 13 states, 2006–2008, derivedfrom the best Poisson count model (year þ region þ type þ region � type) on row-crop fields with and without CP33 field buffers. Regions were categorizedbased on spatial clustering of survey points within Bird Conservation Regions (Central Hardwoods [CH], Central Texas [CTX], Eastern Southeastern CoastalPlain [ESCP], Eastern Tallgrass Prairie [ETP], Mississippi Alluvial Valley [MAV], Western Southeastern Coastal Plain [WSCP]).
722 The Journal of Wildlife Management � 77(4)

the prairie is row-crop dominated like the MississippiAlluvial Valley. Latitudinal differences in rate of successionmay explain this contrast. Surveying covey densities 1–3 yearsafter establishment may not have been enough time fordevelopment of vegetation structure in field buffers necessaryto provide adequate autumn cover in the more northernEastern Tallgrass Prairie. Bobwhite may also require greatercomposition of woody cover to meet thermoregulatoryrequirements and enhance predator avoidance in thenorthern portion of their range (i.e., in the EasternTallgrass Prairie) during autumn. Bobwhite in Kansas andOhio selected woody and herbaceous CRP cover during thenon-breeding season (Flock 2006, Janke 2011), and selectionfor woody cover in row-crop landscapes may have decreasedpredation risk (Williams et al. 2000, Janke 2011) andprovided foraging and thermoregulatory opportunities forautumn bobwhite coveys during snow events (Roseberry andKlimstra 1984).Differences in covey density between fields with buffers and
fields without buffers were negligible in the central Texasregion although covey density in general was an order ofmagnitude greater in central Texas compared to the otherregions. Texas typically has greater bobwhite densities thanother parts of the range (Brennan 1999). However, abundantTexas bobwhite populations showed little response to fieldbuffers in autumn, suggesting that rangeland and othergrassland habitats in the surrounding landscape might haveprovided sufficient herbaceous and woody cover to reduce thepotential effect of field buffers on bobwhite density.We assumed survey points were distributed randomly in
relation to the distribution of bobwhite coveys (Bucklandet al. 2001), and density estimates may be biased if thisassumption was violated and survey points were not distrib-uted randomly with respect to covey distribution. The largeextent of our study precluded us from empirically testing thisassumption. However, Smith (2004) and Terhune et al.(2009) suggested autumn bobwhite coveys demonstrateda non-random distribution, and selected landscapes withgreater proportions of herbaceous cover, but were not directlyinfluenced by presence of linear field buffer habitats.Therefore, our sampling points should have been randomrelative to covey distribution. Another assumption includedno bias in distance estimation by observers detecting coveys.Covey locations marked on aerial imagery were approxima-tions by skilled observers. However, potential for bias existedif approximate locations were incorrect, and could haveresulted in density estimates biased low (if approximatedcovey locations were further than actual covey locations)or high (if approximated covey locations were closerthan actual covey locations). The extent of this study alsoprecluded using multiple observers to triangulate coveylocations, and flushing coveys was prohibited. Because weestimated covey densities in our study, estimates of birddensities could be more variable than covey densities, asnumber of birds in coveys might vary across regions. Werecommend future studies incorporate number of birds percovey detected when possible to gain a better estimate of birddensity.
Assuming coveys are being added to extant populationsinstead of redistributed from the surrounding landscape, weestimated number of coveys added to the population basedon observed effect size in our study. We estimated averageamount of CP33 field buffers at 5.41% and 0.27% in the78.54-ha (500-m radius) landscape surrounding surveypoints for fields with and fields without buffers, respectively,representing an increase of 5.14% grassland cover in land-scapes surrounding fields with buffers compared to land-scapes surrounding fields without buffers. On average, 5.14%of 78.54 ha was 4.04 ha of buffer area in the survey radius.Overall, effect size (0.016 coveys/ha) observed across thestudy region translated to 1.26 additional coveys in the78.54-ha survey region around fields with versus fields with-out buffers. Given observed effect size, 44,090 coveys couldbe added to the fall population if CP33 buffer enrollment wasmaximized to the 2010 acreage cap (141,640 ha; USDA2010). However, 7.71 million ha of CP33 buffers wouldbe necessary to meet the target population recovery goalof 2.4 million added coveys described in the NBCI(National Bobwhite Technical Committee 2011). Similarto NBCI predictions based from general knowledge of bob-white ecology, such a change would constitute a 5% differ-ence from current land use practices on approximately145 million ha of cropland in the contiguous UnitedStates (USDA 2009). Although our projection served toillustrate inference from our study to the range of establishedCP33 field buffer acres, we did not account for expectedregional differences. However, it did support the NBCIprediction that minimal change in primary land use at largespatial scales has potential to restore bobwhite to sustainablelevels.Addition of 7.71 million ha of CP33 field buffers is an
unrealistic objective in agricultural landscapes in the UnitedStates. To meet the NBCI recovery goals based on herba-ceous field buffers alone would require a transformative shiftin the current agricultural management paradigm. Yet a 5%change in land use is plausible. Managers are advocatingavoiding diffuse ‘‘piecemeal conservation’’ at the farm-levelin exchange for strategic use of conservation practices tar-geted intentionally for the greatest wildlife and ecosystembenefits across the landscape (Sotherton 1998,Williams et al.2004, Clark and Reeder 2007). Conservation systems thatemploy a variety of conservation practices hold tremendouspotential to establish wildlife habitat (Kostyack et al. 2011),and provide opportunities for landowners to promote re-source stewardship while offsetting income losses from en-rolling productive fields into conservation programs (Burgeret al. 2006a).We found variable correlations between covey density and
the presence of field buffers among regions. Therefore, wefeel these differences warrant further study. This includesevaluation of effects of surrounding landscape compositionon bobwhite population response (e.g., Riddle et al. 2008),effects of successional management to maintain habitat qual-ity throughout the contract period (Best 2000, Gray andTeels 2006, Harper 2007), and development of strategiesthat encompass other declining species that make use of
Evans et al. � Bobwhite Response to Targeted Habitat Buffers 723

similar habitat structure and composition (Giocomo et al.2009).
MANAGEMENT IMPLICATIONS
Our results suggest that management practices be developedthat are specific to regions.Managers and policy makers mustaddress regional variability in population response toconservation practices prior to practice development andinitiation. Native herbaceous buffer habitats are not a pana-cea for bobwhite conservation (Williams et al. 2004), but canbe an important conservation mechanism in regions wherepopulation gains can be anticipated because they representsmall-scale management that has a relatively large positiveimpact. Habitat and population goals embodied within theNBCI may not be attainable across the entire range, but ourresults support many of their predictions, assuming manage-ment is focused at the regional scale.
ACKNOWLEDGMENTS
The national CP33 monitoring program was funded by theMultistate Conservation Grant Program (MSCG; GrantsMS M-1-T), a program supported with funds from theWildlife and Sport Fish Restoration Program and jointlymanaged by the Association of Fish and Wildlife Agenciesand the U.S. Fish andWildlife Service, USDA-Farm ServiceAgency, and USDA-Natural Resources Conservation Service-Conservation Effects Assessment Project. Collaborators forthe National CP-33 Monitoring Program includedthe Arkansas Game and Fish Commission, GeorgiaDepartment of Natural Resources, Illinois Department ofNatural Resources/Ballard Nature Center, IndianaDepartment of Natural Resources, Iowa Department ofNatural Resources, Kentucky Department of Fish andWildlife Resources/Kentucky Chapter of The WildlifeSociety, Mississippi Department of Wildlife, Fisheries andParks, Missouri Department of Conservation, NebraskaGame and Parks Commission, North Carolina WildlifeResources Commission, Ohio Department of NaturalResources, South Carolina Department of NaturalResources, Tennessee Wildlife Resources Agency, TexasParks and Wildlife Department, the Southeast QuailStudyGroup, and Southeast Partners In Flight.We sincerelyappreciate the contribution of logistic and financial resourcesprovided by all state-level collaborators, which were farbeyond the support that was provided through theMSCG grant. We also thank the Department of Wildlife,Fisheries & Aquaculture and Forest and Wildlife ResearchCenter at Mississippi State University, and the MississippiAgriculture and Forestry Experiment Station. We thank G.Wang for analytical assistance during the 2-stage analysis.We also thank R. J. Gutierrez and 2 anonymous reviewers fortheir thorough editorial revision of this manuscript.
LITERATURE CITEDAkaike, H. 1973. Information theory and an extension of the maximumlikelihood principle. Pages 267–281 in B. N. Petrov and F. Csaki, editors.Second International Symposium on Information Theory. AkademiaiKiado, Budapest, Hungary.
Bates, D. 2010. Lme4: an R package for fitting and analyzing linear,nonlinear and generalized linear mixed models. R package version0999375-65. http://lme4.r-forge.r-project.org/. Accessed 1 Sep 2010.
Best, L. B. 2000. Continuous Enrollment Conservation Reserve Program:the value of buffer habitats for birds in agricultural landscapes. Pages75–94 in W. L. Hohman and D. J. Halloum, editors. A comprehensivereview of Farm Bill contributions to wildlife conservation, 1985–2000.U.S. Department of Agriculture, Natural Resources Conservation Service,Wildlife Habitat Management Institute, Technical Report USDA/NRCS/WHMI-2000, Washington, DC, USA.
Blank, P. J., G. P. Dively, D. E. Gill, and C. A. Rewa. 2011. Birdcommunity response to filter strips in Maryland. Journal of WildlifeManagement 75:116–125.
Brennan, L. A. 1991. How can we reverse the northern bobwhite populationdecline? Wildlife Society Bulletin 19:544–555.
Brennan, L. A. 1999. Northern bobwhite (Colinus virginianus). Account397 in A. Poole, editor. The birds of North America online. Cornell Labof Ornithology, Ithaca, New York, USA: http://bna.birds.cornell.edu.bnaproxy.birds.cornell.edu/bna/species/397doi:10.2173/bna.397. Accessed2 May 2011.
Buckland, S. T., D. R. Anderson, K. P. Burnham, J. L. Laake, D. L.Borchers, and L. Thomas. 2001. Introduction to distance sampling.Oxford University Press, Oxford, United Kingdom.
Buckland, S. T., D. R. Anderson, K. P. Burhnam, J. L. Laake, D. L.Borchers, and L. Thomas. 2004. Advanced distance sampling: estimatingthe abundance of biological populations. Oxford University Press, Oxford,United Kingdom.
Buckland, S. T., K. P. Burnham, and N. H. Augustin. 1997. Modelselection: an integral part of inference. Biometrics 53:603–618.
Buckland, S. T., R. E. Russell, B. G. Dickson, V. A. Saab, D. N. Gorman,and W. M. Block. 2009. Analyzing designed experiments in distancesampling. Journal of Agricultural, Biological, and EnvironmentalStatistics 14:432–442.
Burger, L. W., Jr., D. McKenzie, R. Thackston, and S. J. DeMaso. 2006a.The role of farm policy in achieving large-scale conservation: bobwhite andbuffers. Wildlife Society Bulletin 34:986–993.
Burger, L. W., M. D. Smith, R. Hamrick, B. Palmer, and S. Wellendorf.2006b. CP33—habitat buffers for upland birds monitoring protocol.Mississippi State University Miscellaneous Publication, MississippiState, USA.
Burnham, K. P., and D. R. Anderson. 2002. Model selection and multi-model inference: a practical information-theoretic approach. Secondedition. Springer-Verlag, New York, New York, USA.
Clark, W. R., and K. F. Reeder. 2007. Agricultural buffers and wildlifeconservation: a summary about linear practices. Pages 45–56 in J. B.Haufler, editor. Fish andwildlife response to FarmBill conservation practices.Technical Review 07-1. The Wildlife Society, Bethesda, Maryland, USA.
Conover, R. R., L. W. Burger, Jr., and E. T. Linder. 2007. Winter aviancommunity and sparrow response to field border width. Journal ofWildlifeManagement 7:1917–1923.
Davison, V. E. 1941.Wildlife borders—an innovation in farmmanagement.Journal of Wildlife Management 5:390–394.
Dimmick, R. W., M. J. Gudlin, and D. F. McKenzie. 2002. The NorthernBobwhite Conservation Initiative. Miscellaneous publication of theSoutheastern. Association of Fish and Wildlife Agencies, Columbia,South Carolina, USA.
Efron, B. 1979. Bootstrap methods: another look at the jackknife. Annals ofStatistics 7:1–26.
Evans, K. O., J. A. Martin, and T. Terhune. 2011. Incorporating effectivemonitoring into the National Bobwhite Conservation Initiative. Pages190–203 in W. E. Palmer, T. M. Terhune, and D. F. McKenzie, editors.The National Bobwhite Conservation Initiative: a range-wide plan forrecovering bobwhites. National Bobwhite Technical CommitteeTechnical Publication, ver. 2.0, Knoxville, Tennessee, USA.
Flock, B. E. 2006. Effects of landscape configuration on northern bobwhitein southeastern Kansas. Dissertation, Kansas State University,Manhattan,USA.
Giocomo, J. J., D. A. Buehler, and J. Fitzgerald. 2009. Integrating grasslandand shrubland bird conservationwith theNorthern Bobwhite conservationInitiative for the Central Hardwoods Bird Conservation Region.Proceedings of the International Partners in Flight Conference: Tundrato Tropics 4:545–556.
724 The Journal of Wildlife Management � 77(4)
Gray, R. L., and B. M. Teels. 2006. Wildlife and fish conservation throughthe Farm Bill. Wildlife Society Bulletin 34:906–913.
Green, R. E., S. J. Cornell, J. P. W. Scharlemann, and A. Balmford. 2005.Farming and the fate of wild nature. Science 307:550–555.
Guthery, F. S. 1997. A philosophy of habitat management for northernbobwhite. Journal of Wildlife Management 61:291–301.
Harper, C. A. 2007. Strategies for managing early succession habitat forwildlife. Weed Technology 21:932–937.
Janke, A. K. 2011. Survival and habitat use of non-breeding northernbobwhite on private lands in Ohio. Thesis, The Ohio State University,Columbus, USA.
Klimstra, W. D. 1982. Bobwhite quail and changing land use. Proceedingsof the National Quail Symposium 2:1–5.
Kostyack, J., J. J. Lawler, D. D. Goble, J. D. Olden, and J. M. Scott. 2011.Beyond reserves and corridors: policy solutions to facilitate the movementof plants and animals in a changing climate. Bioscience 61:713–719.
Lasaffre, E., and B. Spiessens. 2001. On the effect of the number ofquadrature points in a logistic random-effects model: an example.Applied Statistics 50:325–335.
Marcus, J. F., W. E. Palmer, and P. T. Bromley. 2000. The effects of farmfield borders on overwintering sparrow densities. Wilson Bulletin 112:517–523.
Moorman, C. E., and J. D. Riddle. 2009. Maximizing the impact of fieldborders for bobwhite and early-succession songbirds: what’s the bestdesign for implementation? Pages 17–27 in L. W. Burger, Jr. andK. O. Evans, editors. Managing working lands for northern bobwhite:the USDA-NRCS Bobwhite Restoration Project. U.S. Department ofAgriculture, Natural Resources Conservation Service, Washington, DC,USA.
National Bobwhite Technical Committee. 2011. W. E. Palmer, T. M.Terhune, and D. F. McKenzie, editors. The National BobwhiteConservation Initiative: a range-wide plan for recovering bobwhites.National Bobwhite Technical Committee Technical Publication, ver.2.0, Knoxville, Tennessee, USA.
North American Bird Conservation Initiative. 2000. Bird conservationregion descriptions: a supplement to the North American BirdConservation Initiative Bird Conservation Region map. U.S. Fish andWildlife Service, Arlington, Virginia, USA.
Oakley, M. J., D. L. Bounds, T. A. Mollett, and E. C. Soutiere. 2002.Survival and home range estimates of pen-raised northern bobwhites inbuffer strip and non-buffer strip habitats. Pages 74–80 in S. J. Demaso,W. P. Kuvlesky, Jr., F. Hernandez, and M. E. Berger, editors. Quail V:Proceedings of the Fifth National Quail Symposium. Texas Parks andWildlife Department, Austin, USA.
Palmer, W. E., S. D. Wellendorf, J. R. Gillis, and P. T. Bromley. 2005.Effects of field borders and nest-predator reduction on abundance ofnorthern bobwhites. Wildlife Society Bulletin 33:1398–1405.
Peterjohn, B. G. 2003. Agricultural landscapes: can they support healthybird populations as well as farm products? Auk 120:14–19.
Pitman, J., and M. Sams. 2010. Population response of northern bobwhiteand ring-necked pheasant to practice 33 of the continuous conservationreserve program in Kansas and Oklahoma, 2005–2008. KansasDepartment of Wildlife and Parks and Oklahoma Department of,Wildlife, Conservation Miscellaneous Publication, Wichita, USA.
Riddle, J. D., C. E. Moorman, and K. H. Pollock. 2008. The importance ofhabitat shape and landscape context to northern bobwhite populations.Journal of Wildlife Management 72:1376–1382.
Roseberry, J. L., and W. D. Klimstra. 1984. Population ecology of thebobwhite. Southern Illinois University Press, Carbondale, USA.
Rusk, J. P., J. L. Scott, F. Hernandez, and F. C. Bryant. 2009. Refining themorning covey-call survey to estimate northern bobwhite abundance.Pages 38–45 in S. B. Cederbaum, B. C. Faircloth, T. M. Terhune,J. J. Thompson, and J. P. Carroll, editors. Gamebird 2006: Quail VIand Perdix XII. Warnell School of Forestry and Natural Resources,Athens, Georgia, USA.
Seiler, T. P., R. D. Drobney, and T. V. Dailey. 2002. Use of weathervariables for predicting fall covey calling rates of northern bobwhites.
Pages 91–98 in S. J. DeMaso, W. P. Kuvlesky, Jr., F. Hernandez, andM. E. Berger, editors. Quail V: Proceedings of the Fifth National QuailSymposium. Texas Parks and Wildlife Department, Austin, USA.
Smith, M. D. 2004. Wildlife habitat benefits of field border managementpractices in Mississippi. Dissertation, Mississippi State University,Mississippi State, USA.
Smith, M. D., P. J. Barbour, L. W. Burger, Jr., and S. J. Dinsmore. 2005.Density and diversity of overwintering birds in managed field borders inMississippi. Wilson Bulletin 117:258–269.
Smith, M. D., and L. W. Burger, Jr. 2009. Population response of northernbobwhite to field border management practices in Mississippi. Pages 220–231 in S. B. Cederbaum, B. C. Faircloth, T. M. Terhune, J. J. Thompson,and J. P. Carroll, editors. Gamebird 2006: Quail VI and Perdix XII.Warnell School of Forestry and Natural Resources, Athens, Georgia,USA.
Smith, M. D., R. G. Hamrick, L. W. Burger, Jr., and J. P. Carroll. 2009.Estimating sample sizes for distance sampling of autumn northernbobwhite calling coveys. Pages 46–53 in S. B. Cederbaum, B. C.Faircloth, T. M. Terhune, J. J. Thompson, and J. P. Carroll, editors.Gamebird 2006: Quail VI and Perdix XII. Warnell School of Forestry andNatural Resources, Athens, Georgia, USA.
Sotherton, N. W. 1998. Land use changes and the decline of farmlandwildlife: an appraisal of the set-aside approach. Biological Conservation83:259–268.
Stoddard, H. L. 1931. The bobwhite quail: its habits, preservation, andincrease. Charles Scribner’s Sons, New York, New York, USA.
Terhune, T. M., D. C. Sisson, S. Mitchell, and H. L. Stribling. 2009.Northern bobwhite demographic and population response following anintensive habitat modification to an agricultural landscape. Pages 232–249in S. B. Cederbaum, B. C. Faircloth, T.M. Therhune, J. J. Thompson, andJ. P. Carroll, editors. Gamebird 2006: Quail VI and Perdix XII. WarnellSchool of Forestry and Natural Resources, Athens, Georgia, USA.
Thomas, L., S. T. Buckland, E. A. Rexstad, J. L. Laake, S. Strindberg, S. L.Hedley, J. R. B. Bishop, T. A. Marques, and K. P. Burnham. 2010.Distance software: design and analysis of distance sampling surveys forestimating population size. Journal of Applied Ecology 47:5–14.
U.S. Department of Agriculture [USDA]. 2004. Practice CP33 habitatbuffers for upland wildlife. Farm Service Agency, Notice CRP-479,Washington, DC, USA.
U.S. Department of Agriculture [USDA]. 2007. Farm Service AgencyNational Agriculture Imagery Program. Washington, DC, USA:http://datagateway.nrcs.usda.gov/. Accessed 1 Aug 2006.
U.S. Department of Agriculture [USDA]. 2009. Summary Report: 2007National Resources Inventory. Natural Resources Conservation Service,Washington, D.C., and Center for, Survey Statistics and Methodology,Iowa State University, Ames, USA.
U.S. Department of Agriculture [USDA]. 2010. FY2010 AcreageAllocations for CP33, CP37, and CP38. Farm Service Agency, NoticeCRP-654, Washington, DC, USA.
Van Horne, B. 1983. Density as a misleading indicator of habitat quality.Journal of Wildlife Management 47:893–901.
Vickery, J., N. Carter, and R. J. Fuller. 2002. The potential value of managedcereal field margins as foraging habitats for farmland birds in the UK.Agriculture, Ecosystems and Environment 89:41–52.
Wellendorf, S. D., W. E. Palmer, and P. T. Bromley. 2004. Estimatingcalling rates of northern bobwhite coveys and measuring abundance.Journal of Wildlife Management 68:672–682.
Williams, C. K., F. S. Guthery, R. D. Applegate, and M. J. Peterson. 2004.The northern bobwhite decline: scaling our management for the twenty-first century. Wildlife Society Bulletin 32:861–869.
Williams, C. K., R. S. Lutz, R. D. Applegate, and D. H. Rusch. 2000.Habitat use and survival of northern bobwhite (Colinus virginianus) incropland and rangeland ecosystems during the hunting season. CanadianJournal of Zoology 78:1562–1566.
Associate Editor: R. J. Gutierrez.
Evans et al. � Bobwhite Response to Targeted Habitat Buffers 725