msm – industry update and the road ahead - wikileaks
TRANSCRIPT
0- Confidential -
MSM – Industry Update and the Road aheadMan Jit Singh
10 June 2013
1- Confidential -
� Multi-Screen Media – 5 year outlook 2
― Advertising Market Overview 4
― Update on Distribution & Digitization 9
� Market developments
― Impact of New Media 16
― Market landscape and Competition Update 19
― Regulatory Update 29
� The Road Ahead 33
� Strategic New Initiatives 39
� Recap – Putting it all together 95
Agenda
2- Confidential -
Multi-Screen Media – 5 year outlook
3- Confidential -
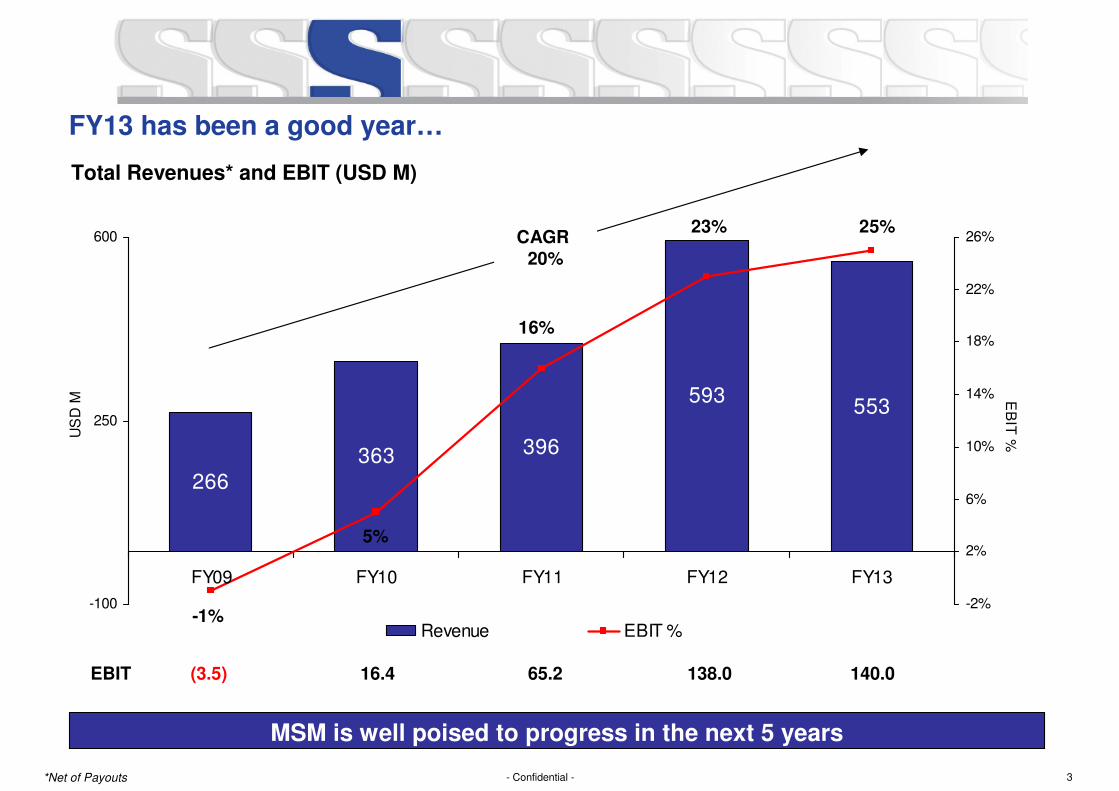
FY13 has been a good year…
MSM is well poised to progress in the next 5 years
*Net of Payouts
Total Revenues* and EBIT (USD M)
266
396
553
363
593
25%
5%
23%
16%
-1%-100
250
600
FY09 FY10 FY11 FY12 FY13
US
D M
-2%
2%
6%
10%
14%
18%
22%
26%
EB
IT %
Revenue EBIT %
EBIT (3.5) 65.216.4 138.0
CAGR
20%
140.0
4- Confidential -
Advertising Market Overview
5- Confidential -
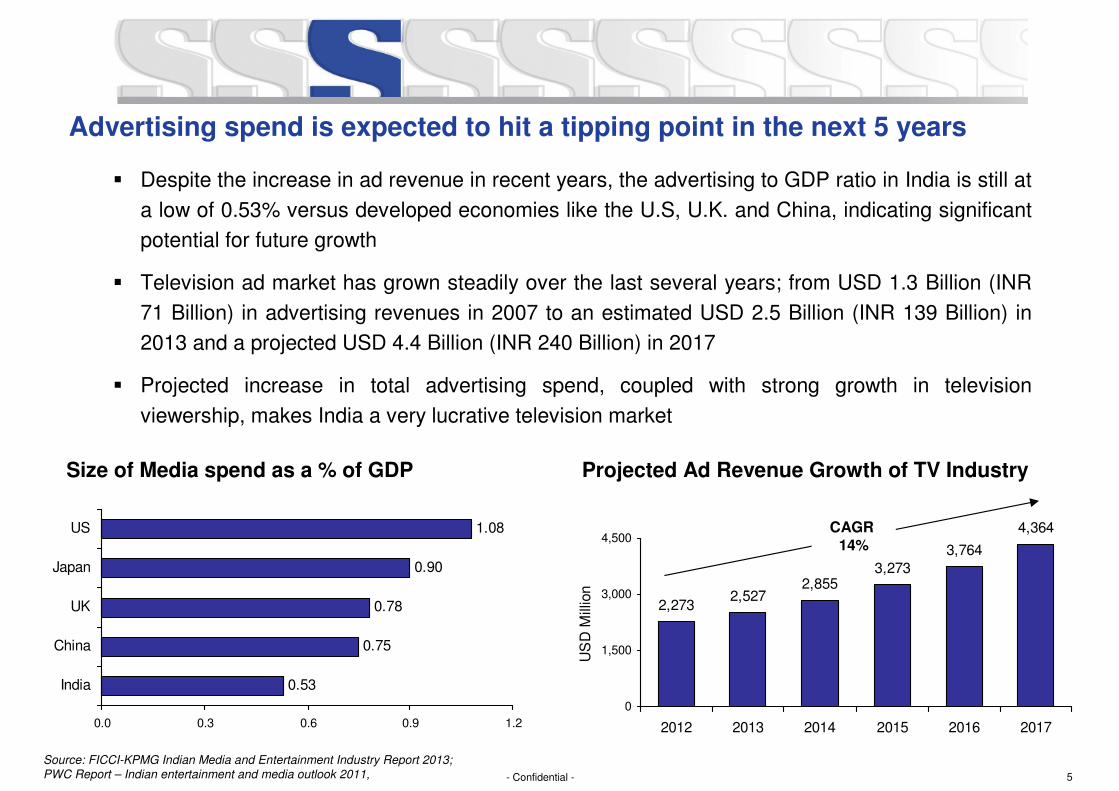
Advertising spend is expected to hit a tipping point in the next 5 years
� Despite the increase in ad revenue in recent years, the advertising to GDP ratio in India is still at
a low of 0.53% versus developed economies like the U.S, U.K. and China, indicating significant
potential for future growth
� Television ad market has grown steadily over the last several years; from USD 1.3 Billion (INR
71 Billion) in advertising revenues in 2007 to an estimated USD 2.5 Billion (INR 139 Billion) in
2013 and a projected USD 4.4 Billion (INR 240 Billion) in 2017
� Projected increase in total advertising spend, coupled with strong growth in television
viewership, makes India a very lucrative television market
2,2732,527
2,8553,273
3,764
4,364
0
1,500
3,000
4,500
2012 2013 2014 2015 2016 2017
US
D M
illio
n
Projected Ad Revenue Growth of TV IndustrySize of Media spend as a % of GDP
CAGR 14%
Source: FICCI-KPMG Indian Media and Entertainment Industry Report 2013;
PWC Report – Indian entertainment and media outlook 2011,
0.53
0.75
0.78
0.90
1.08
0.0 0.3 0.6 0.9 1.2
India
China
UK
Japan
US
6- Confidential -
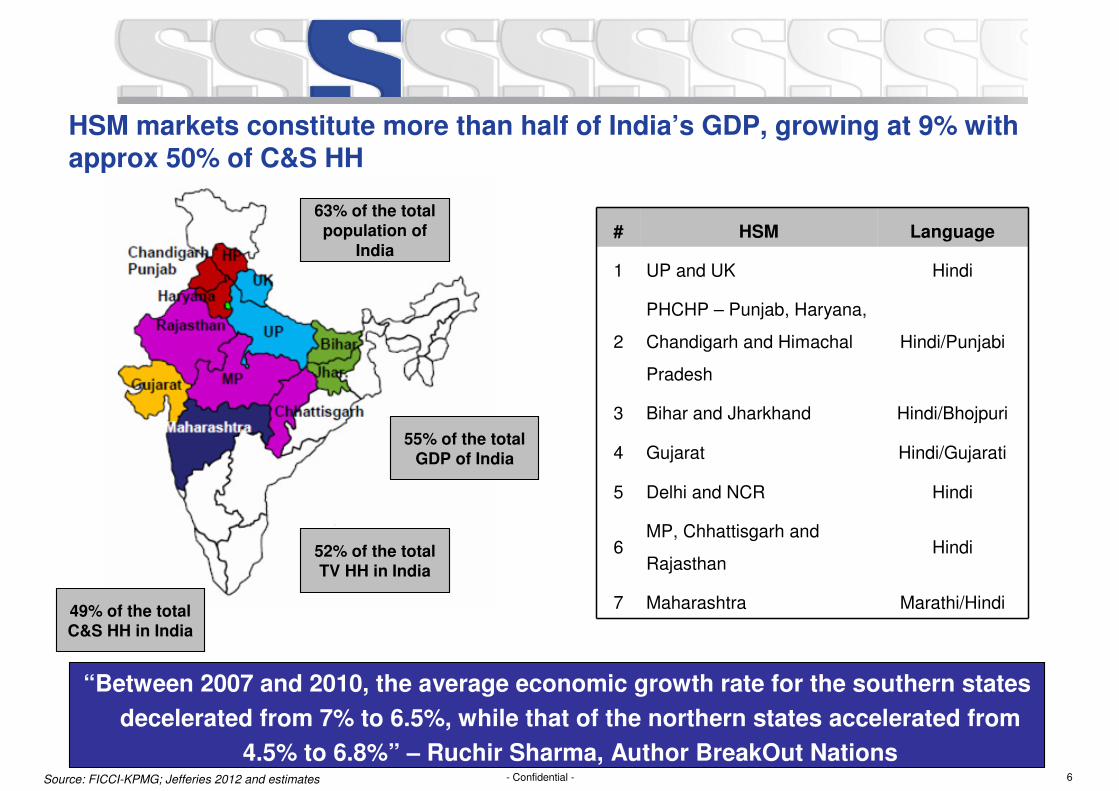
HSM markets constitute more than half of India’s GDP, growing at 9% with approx 50% of C&S HH
“Between 2007 and 2010, the average economic growth rate for the southern states
decelerated from 7% to 6.5%, while that of the northern states accelerated from
4.5% to 6.8%” – Ruchir Sharma, Author BreakOut Nations
HindiDelhi and NCR5
Hindi/GujaratiGujarat4
Maharashtra
MP, Chhattisgarh and
Rajasthan
Bihar and Jharkhand
PHCHP – Punjab, Haryana,
Chandigarh and Himachal
Pradesh
UP and UK
HSM
7
6
3
2
1
# Language
Hindi
Hindi/Punjabi
Hindi/Bhojpuri
Hindi
Marathi/Hindi
63% of the total
population of
India
55% of the total
GDP of India
52% of the total
TV HH in India
49% of the total
C&S HH in India
Source: FICCI-KPMG; Jefferies 2012 and estimates
7- Confidential -
2,6121,709
468
1,788
3969
2334
7104
3,342
2,154
726
2,688
5596
3083
9973
0
4,000
8,000
12,000
UP and UK PHCHP Bihar and
Jharkhand
Gujarat Delhi NCR MP, Chhattisgarh
and Rajasthan
Maharashtra
INR
Crs
Adex 2012 Adex 2015
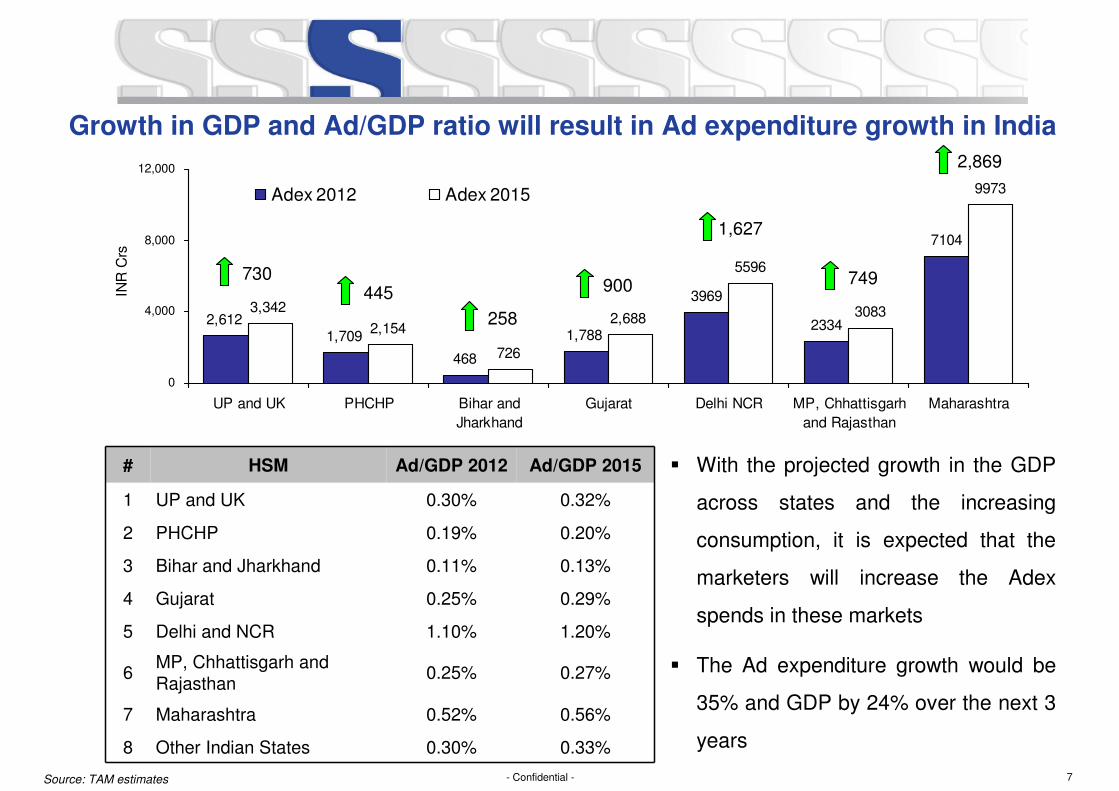
Growth in GDP and Ad/GDP ratio will result in Ad expenditure growth in India
0.30%
0.52%
0.25%
1.10%
0.25%
0.11%
0.19%
0.30%
Ad/GDP 2012
0.56%Maharashtra7
0.33%Other Indian States8
1.20%Delhi and NCR5
0.29%Gujarat4
MP, Chhattisgarh and Rajasthan
Bihar and Jharkhand
PHCHP
UP and UK
HSM
6
3
2
1
# Ad/GDP 2015
0.32%
0.20%
0.13%
0.27%
� With the projected growth in the GDP
across states and the increasing
consumption, it is expected that the
marketers will increase the Adex
spends in these markets
� The Ad expenditure growth would be
35% and GDP by 24% over the next 3
years
730445
258
900
1,627
749
2,869
Source: TAM estimates
8- Confidential -
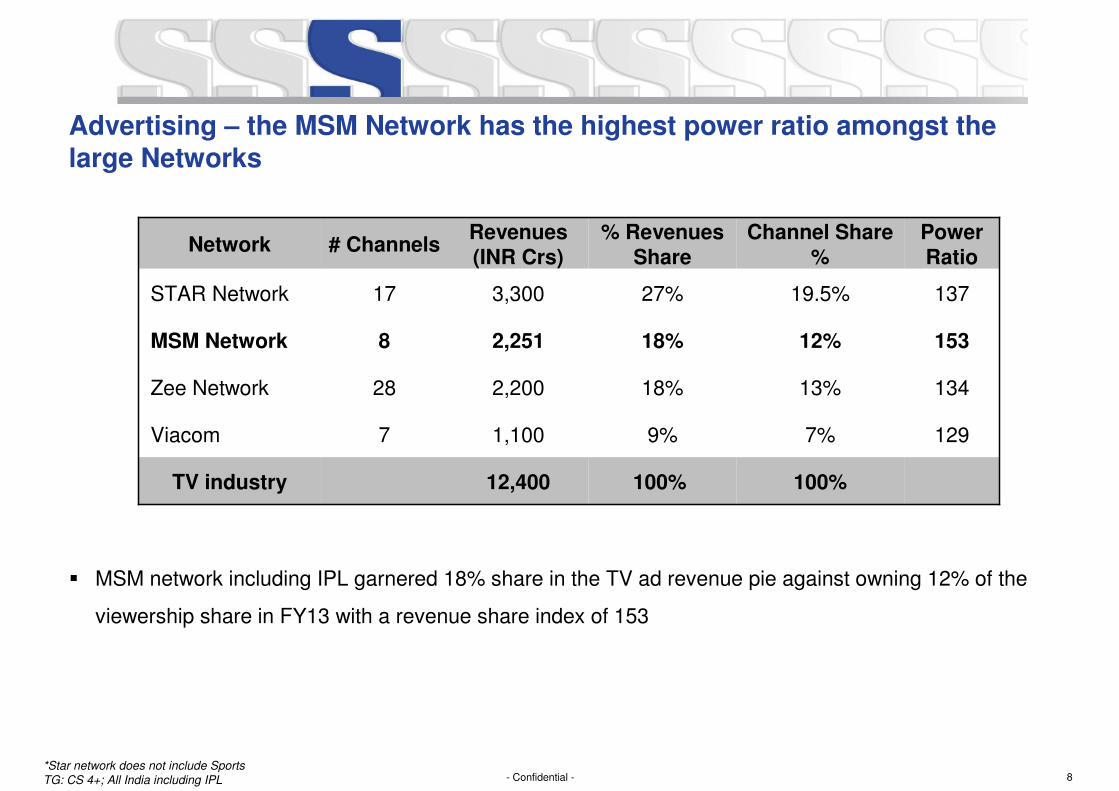
Advertising – the MSM Network has the highest power ratio amongst the large Networks
� MSM network including IPL garnered 18% share in the TV ad revenue pie against owning 12% of the
viewership share in FY13 with a revenue share index of 153
15312%18%2,2518MSM Network
Network # ChannelsRevenues (INR Crs)
% Revenues Share
Channel Share %
Power Ratio
STAR Network 17 3,300 27% 19.5% 137
Zee Network 28 2,200 18% 13% 134
Viacom 7 1,100 9% 7% 129
TV industry 12,400 100% 100%
*Star network does not include Sports
TG: CS 4+; All India including IPL
9- Confidential -
Update on Distribution & Digitization
10- Confidential -
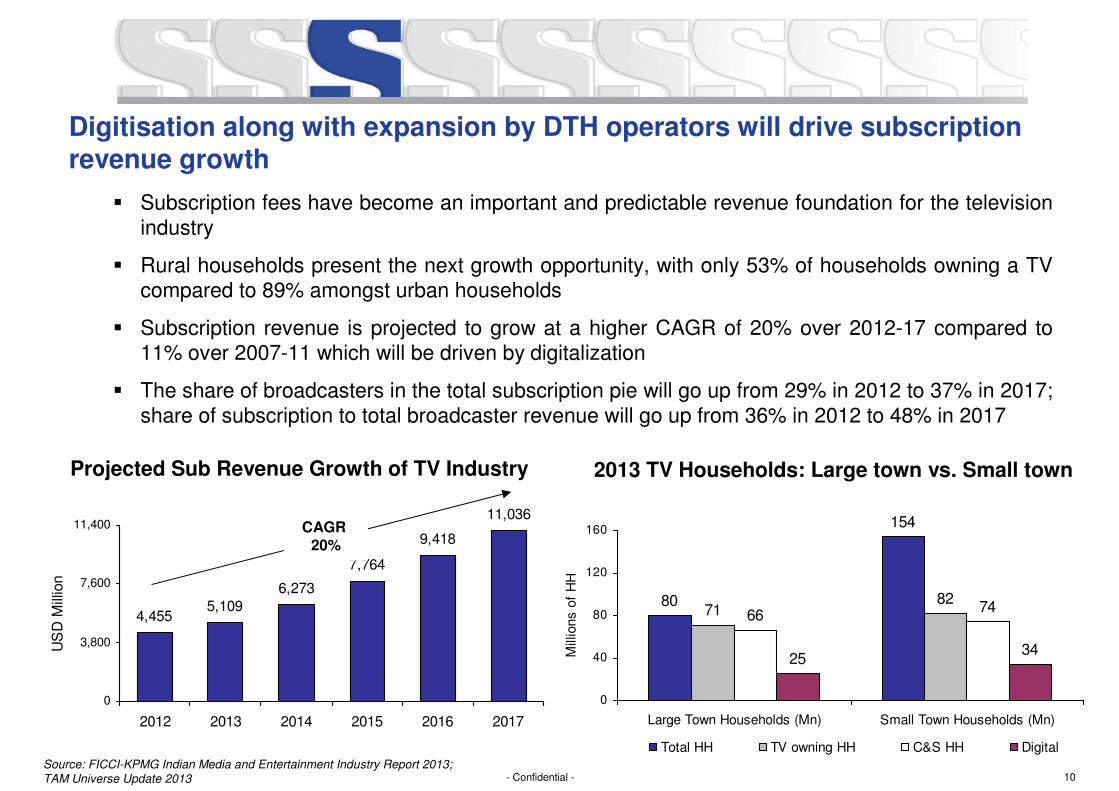
Digitisation along with expansion by DTH operators will drive subscription revenue growth
� Subscription fees have become an important and predictable revenue foundation for the television industry
� Rural households present the next growth opportunity, with only 53% of households owning a TV compared to 89% amongst urban households
� Subscription revenue is projected to grow at a higher CAGR of 20% over 2012-17 compared to 11% over 2007-11 which will be driven by digitalization
� The share of broadcasters in the total subscription pie will go up from 29% in 2012 to 37% in 2017; share of subscription to total broadcaster revenue will go up from 36% in 2012 to 48% in 2017
Source: FICCI-KPMG Indian Media and Entertainment Industry Report 2013;
TAM Universe Update 2013
80
154
7182
6674
3425
0
40
80
120
160
Large Town Households (Mn) Small Town Households (Mn)
Mill
ions o
f H
H
Total HH TV owning HH C&S HH Digital
Projected Sub Revenue Growth of TV Industry 2013 TV Households: Large town vs. Small town
4,4555,109
6,273
7,764
9,418
11,036
0
3,800
7,600
11,400
2012 2013 2014 2015 2016 2017
US
D M
illio
n
CAGR 20%
11- Confidential -
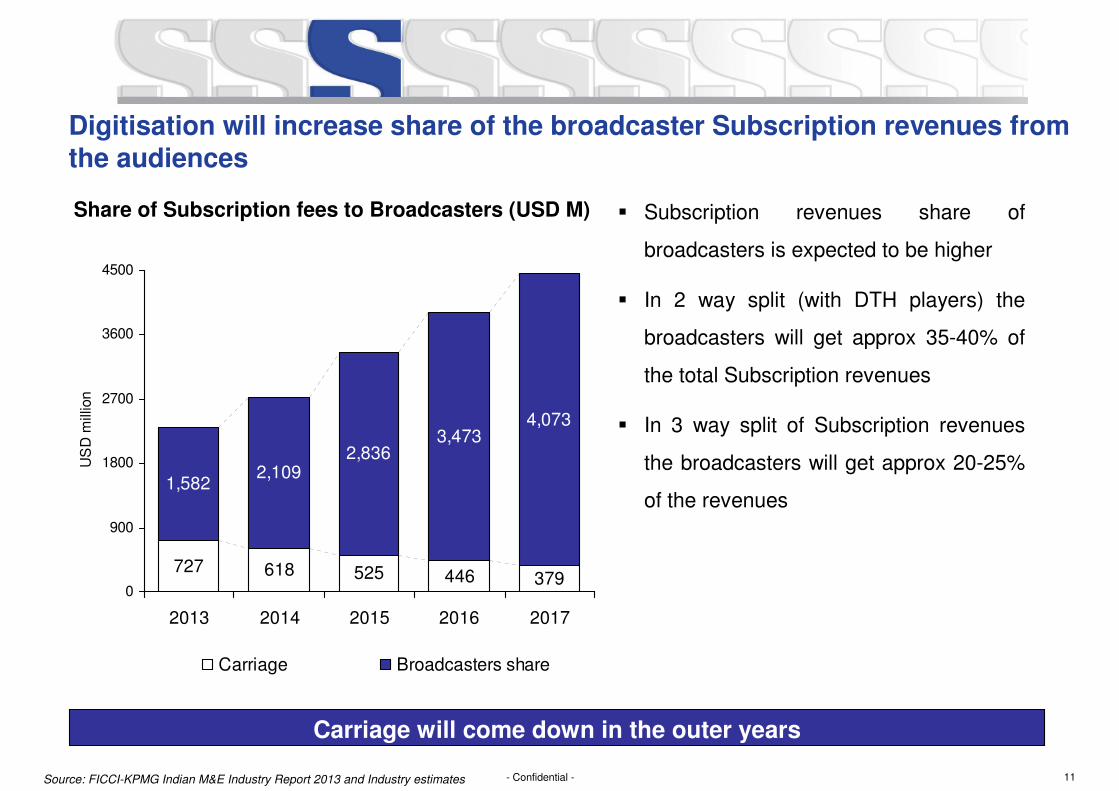
Digitisation will increase share of the broadcaster Subscription revenues from the audiences
Share of Subscription fees to Broadcasters (USD M) � Subscription revenues share of
broadcasters is expected to be higher
� In 2 way split (with DTH players) the
broadcasters will get approx 35-40% of
the total Subscription revenues
� In 3 way split of Subscription revenues
the broadcasters will get approx 20-25%
of the revenues
618 525 446 379
1,5822,109
2,8363,473
4,073
727
0
900
1800
2700
3600
4500
2013 2014 2015 2016 2017
US
D m
illio
n
Carriage Broadcasters share
Carriage will come down in the outer years
Source: FICCI-KPMG Indian M&E Industry Report 2013 and Industry estimates
12- Confidential -
Digital Addressable System (DAS) - Current On Ground Reality
� There are still a few gaps for seeding boxes -
― Phase 1 - 90-92% of Delhi/Mumbai and Kolkata are covered, while only 25-30% of Chennai
has been covered
― Phase 2 - 60-65% of the 38 cities have been seeded
� Unencrypted Analog signals are still accessible – Addressability of subscribers continues to be a
concern area, hence actual numbers are not yet reported and leading to piracy
� Only 35% of the Customer Relationship Forms (CRF) received from the end households, hence
complete clarity on actual subscriber numbers is still pending
� MSOs are still not ready with packages / backend infrastructure
� ARPUs have not increased – lack of packages, CRFs. The on ground customer not willing to pay
extra
� Unavailability of institutional finance to MSOs
� Court stay orders have hindered the roll out in certain states AP, MP where the order has now been
lifted
� MIB / TRAI pressure tactics to force operator deals - under threat of 6 months status quo
13- Confidential -
Digital Addressable System (DAS) – the Ideal Scenario for LC1 and FTA Channels
� No more constraint of Bandwidth with the MSO
� FTA and Niche channels will be greatest benefactor
� MSOs can offer higher number of channels at no extra cost
� MSO entering these markets will improve the quality and variety in the customer offering
� With LC1 falling in Phase 4 of digitization, the MSO focus has already started shifting towards these
towns in terms of acquisition
14- Confidential -
What is Competition doing in LC1 markets?
� Competition (Star) entered the LC1 markets 2-3 years ago for first mover advantage
� Have on ground presence – 300-400 resources (on rolls/contract) in these market to monitor
competition and crack new deals
� Star is willing to spend on carriage. Focus on channel placement within the EPG
� Star Utsav presence on DD Direct ensured reach within the LC1 market. Currently delivers more reach
than Star Plus in LC1
15- Confidential -
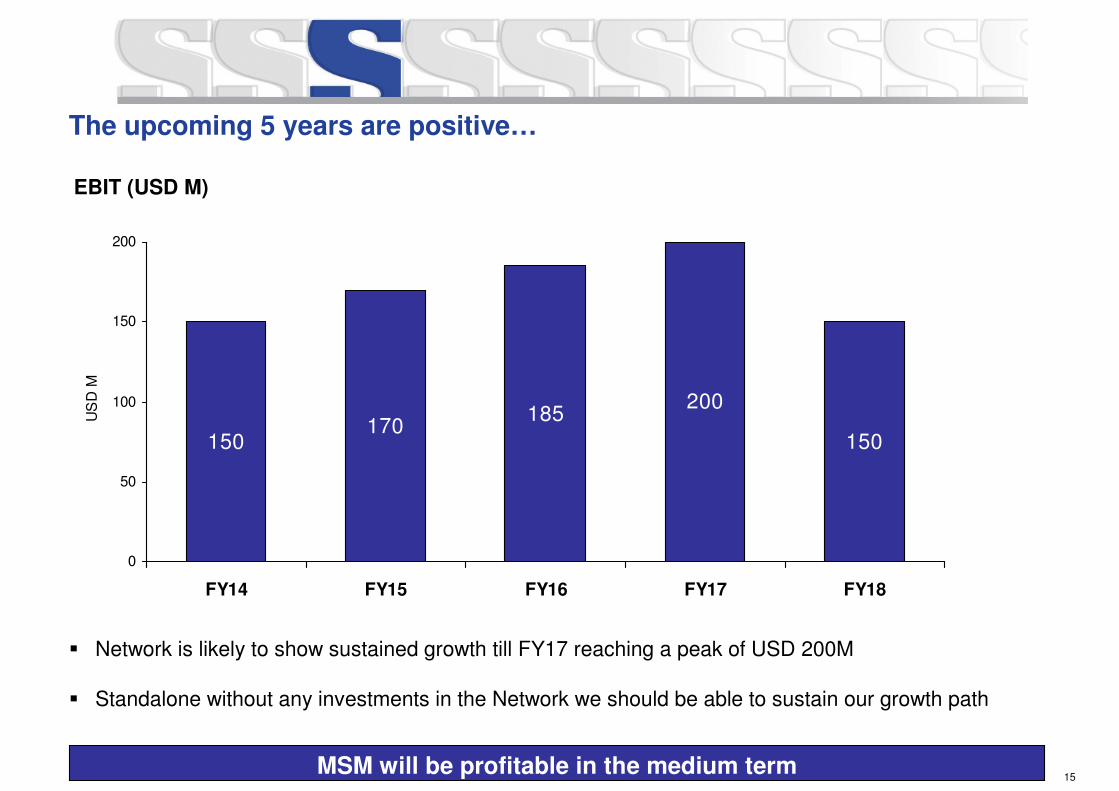
The upcoming 5 years are positive…
� Network is likely to show sustained growth till FY17 reaching a peak of USD 200M
� Standalone without any investments in the Network we should be able to sustain our growth path
150170
185200
150
0
50
100
150
200
FY14 FY15 FY16 FY17 FY18
US
D M
EBIT (USD M)
MSM will be profitable in the medium term
16- Confidential -
Impact of New Media
17- Confidential -
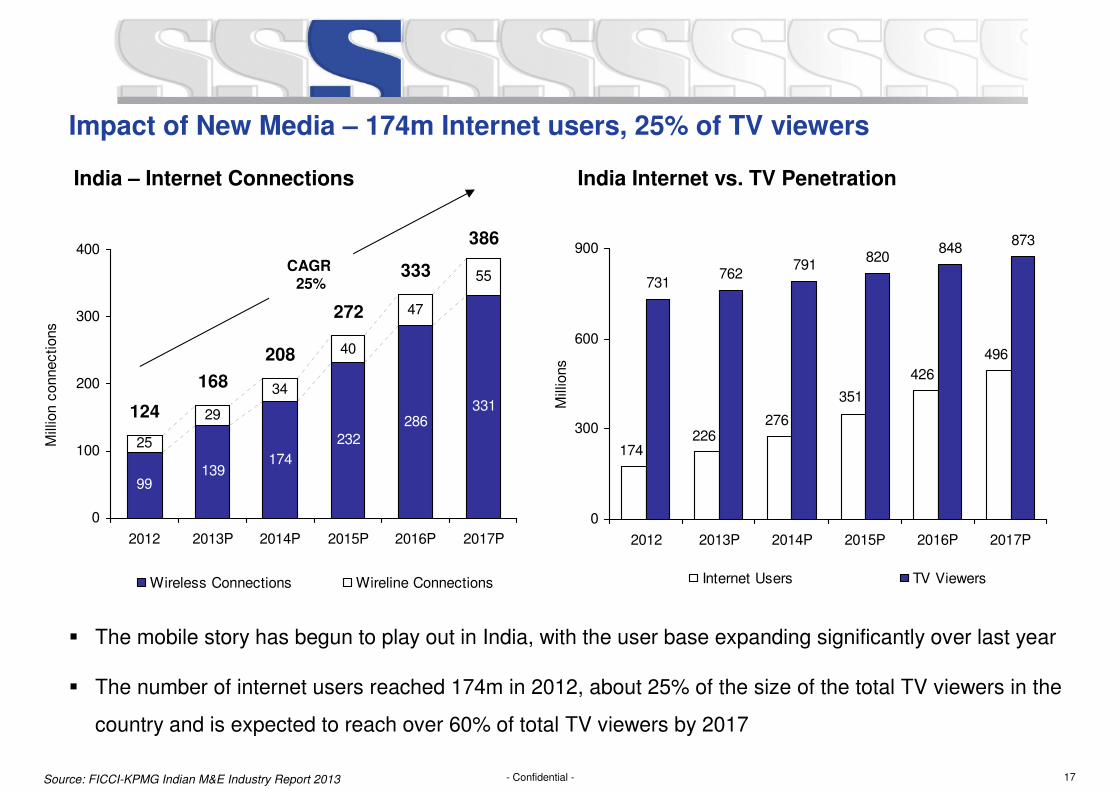
Impact of New Media – 174m Internet users, 25% of TV viewers
� The mobile story has begun to play out in India, with the user base expanding significantly over last year
� The number of internet users reached 174m in 2012, about 25% of the size of the total TV viewers in the
country and is expected to reach over 60% of total TV viewers by 2017
India – Internet Connections India Internet vs. TV Penetration
139174
232286
331
25
29
34
40
47
55
99
272
333
386
168
124
208
0
100
200
300
400
2012 2013P 2014P 2015P 2016P 2017P
Mill
ion c
onnections
Wireless Connections Wireline Connections
CAGR 25% 731
762791
820848
873
496
426
351
276226
174
0
300
600
900
2012 2013P 2014P 2015P 2016P 2017P
Mill
ions
Internet Users TV Viewers
Source: FICCI-KPMG Indian M&E Industry Report 2013
18- Confidential -
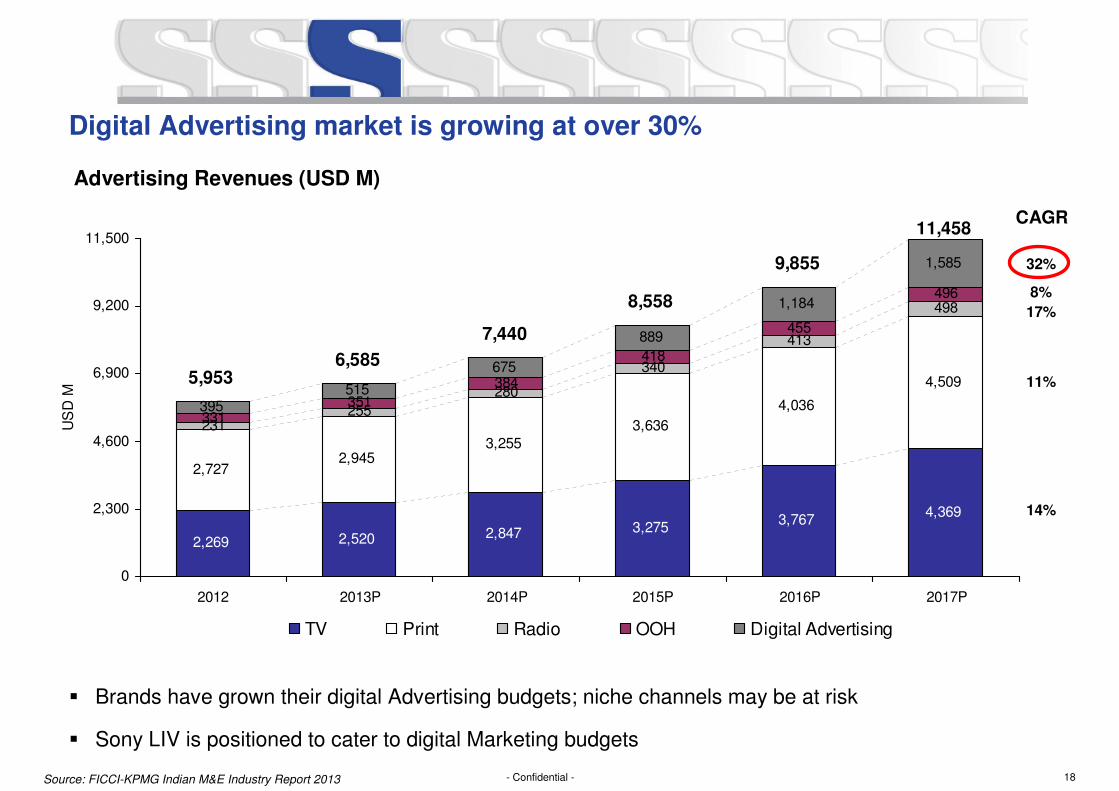
Digital Advertising market is growing at over 30%
� Brands have grown their digital Advertising budgets; niche channels may be at risk
� Sony LIV is positioned to cater to digital Marketing budgets
Advertising Revenues (USD M)
2,520 2,847 3,2753,767
4,369
2,7272,945
3,2553,636
4,036
4,509
231255
280
340
498
331351
384
418
496
395515
675
1,184
2,269
413455
889
1,585
8,558
9,855
11,458
6,5855,953
7,440
0
2,300
4,600
6,900
9,200
11,500
2012 2013P 2014P 2015P 2016P 2017P
US
D M
TV Print Radio OOH Digital Advertising
17%
32%
CAGR
11%
14%
8%
Source: FICCI-KPMG Indian M&E Industry Report 2013
19- Confidential -
Market landscape and Competition Update
20- Confidential -
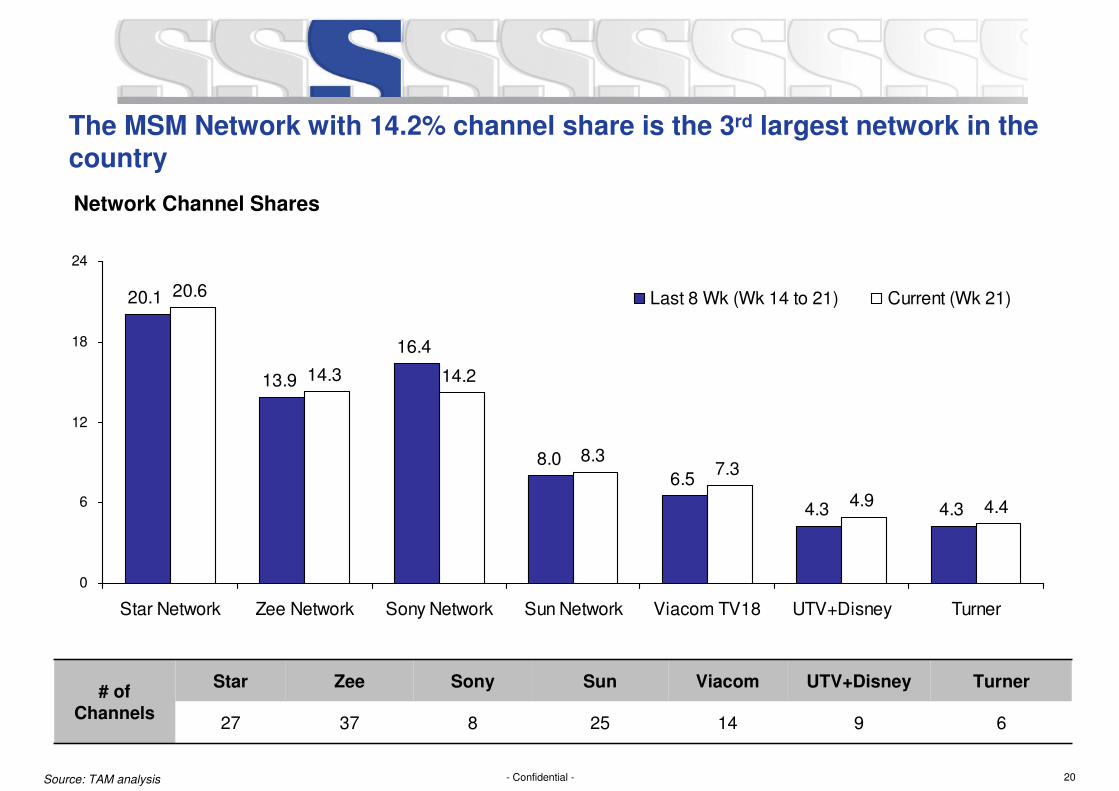
The MSM Network with 14.2% channel share is the 3rd largest network in the country
Network Channel Shares
20.1
13.9
16.4
8.06.5
4.3 4.3
20.6
14.3 14.2
8.37.3
4.9 4.4
0
6
12
18
24
Star Network Zee Network Sony Network Sun Network Viacom TV18 UTV+Disney Turner
Last 8 Wk (Wk 14 to 21) Current (Wk 21)
# of
Channels
Star Zee Sony Sun Viacom UTV+Disney Turner
27 37 8 25 14 9 6
Source: TAM analysis
21- Confidential -
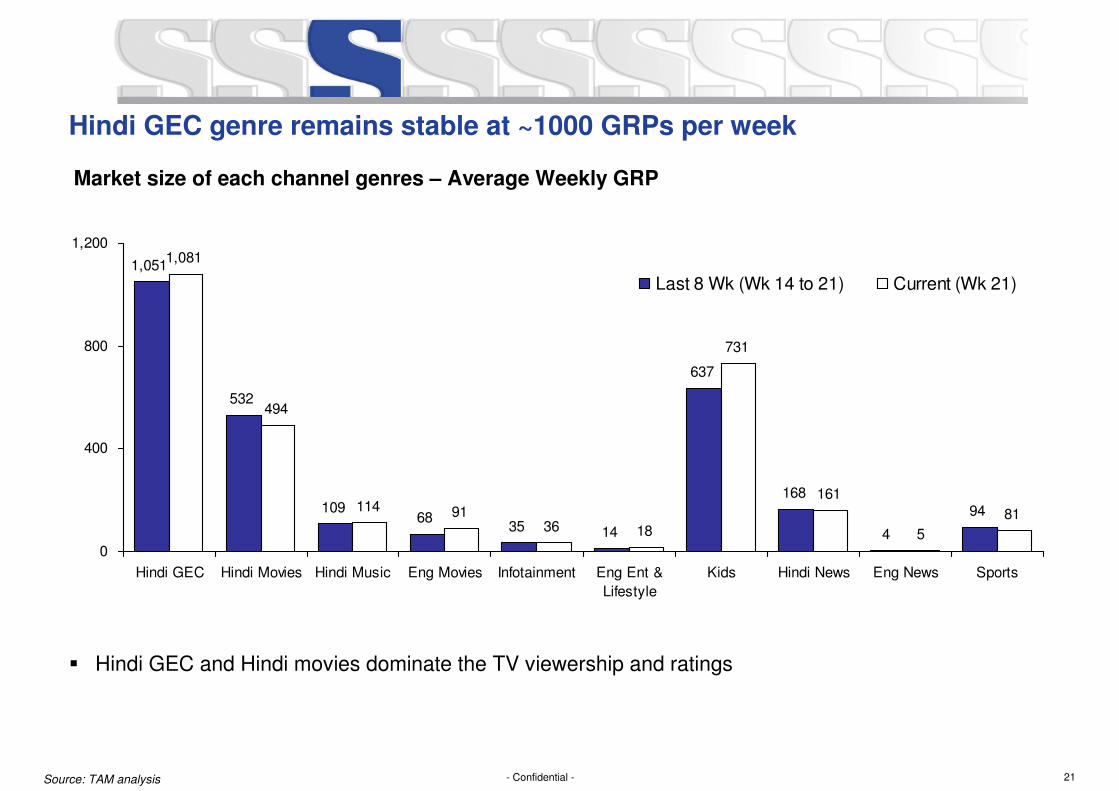
Hindi GEC genre remains stable at ~1000 GRPs per week
1,051
532
10968
35 14
637
168
4
94
1,081
494
114 9136 18
731
161
5
81
0
400
800
1,200
Hindi GEC Hindi Movies Hindi Music Eng Movies Infotainment Eng Ent &
Lifestyle
Kids Hindi News Eng News Sports
Last 8 Wk (Wk 14 to 21) Current (Wk 21)
Market size of each channel genres – Average Weekly GRP
� Hindi GEC and Hindi movies dominate the TV viewership and ratings
Source: TAM analysis
22- Confidential -
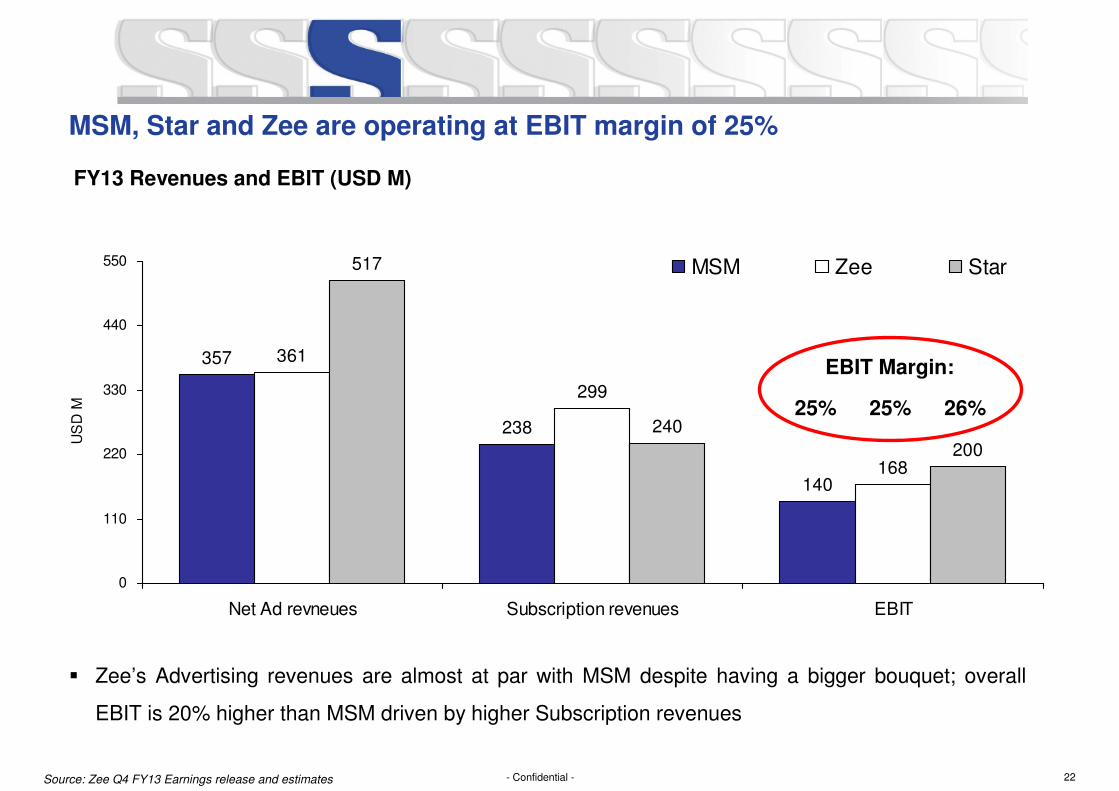
MSM, Star and Zee are operating at EBIT margin of 25%
357
238
140
361
299
168
517
240
200
0
110
220
330
440
550
Net Ad revneues Subscription revenues EBIT
US
D M
MSM Zee Star
FY13 Revenues and EBIT (USD M)
Source: Zee Q4 FY13 Earnings release and estimates
� Zee’s Advertising revenues are almost at par with MSM despite having a bigger bouquet; overall
EBIT is 20% higher than MSM driven by higher Subscription revenues
25% 25% 26%
EBIT Margin:
23- Confidential -
Updates from General Entertainment (GEC) Genre (1 of 2)
Colors
Programming:
� Has launched a number of fiction shows with limited
success
� Channel’s viewership dependant on old shows like
‘Balika Vadhu’ and ‘Uttaran’
� Has invested heavily in big ticket non-fiction properties
� Large number of events and blockbuster movie
premieres, which the channel regularly airs
� Upcoming highlights include a new comedy reality
show ‘Comedy Nights with Kapil’ as well as a new
fiction ‘Mrs Pammi Pyarelal’
Marketing:
� Aggressive player in promoting their properties,
especially their non-fiction ones
� Targets a similar audience profile to Sony and typically
uses its celebrities to push for recall like Madhuri Dixit,
Salman Khan etc
Star Plus
Programming:
� Only GEC to start primetime as early as 6:30pm
� Offering a key non-fiction property ‘Master Chef India’
on weekdays (8pm)
� Hasn’t seen much success with weekend properties
� Upcoming mythological ‘Mahabharat’ as well as ‘Junior
Master Chef’
Marketing:
� Road shows using TV stars across 4-5 key states once
the LC1 markets opened
� Associate on-ground sponsorship on IPL this season
with extensive branding in the stadiums
� Continue to use Bollywood stars on their channel in the
form of movie integrations and/or award events
� Big ticket fiction launches like Mahabharat will probably
see huge spends in promotion
24- Confidential -
Updates from General Entertainment (GEC) Genre (2 of 2)
Life OK
Programming:
� Largely dependent on a single show ‘Mahadev’ for its
growth. Periodic special episodes of the show on
Sundays have helped the channel add to ratings spurts
� Number of fiction launches at frequent intervals but
with only a few being successful
� Has launched a number of alternative genre shows
similar to Sony’s popular space of crime and detective
series; ‘Savdhan India’ and ‘Shapath’ have added to
additional sampling of the channel
� Non-fiction shows has seen limited success, but still
experimenting with format shows including ‘Welcome’
(based on the format ‘Come Dine with Me’)
� Upcoming Shows: Another International format show
‘Bachelorette India’ and ‘Police Dial 100’
Marketing:
� Marginal promotions centred around new show
launches or on Mahadev (flagship show)
� Planning to use Bollywood star Mallika Sherawat to
propel new show “The Bachelorette” and the channel
Zee
Programming:
� Continues to keep weekday fiction programming as its
backbone
� Weekend non-fiction properties have been well
established over many seasons including ‘Saregama’,
‘Dance India Dance’
� Launched new non-fiction format this year - ‘India’s
Best Dramebaaz’
� Has experimented with other alternative fiction
properties like ‘Fear Files’ and recently launched
‘Connected Hum Tum’
� Upcoming highlights for the channel include a epic
show ‘Jodha Akbar’
Marketing:
� Loyal base among lower SEC audiences and smaller
towns in North India
� Communicates effectively with its audiences using low
cost media outreach vehicles
� Extensive promotion for movie premieres across
platforms
25- Confidential -
Update on Hindi Movies genre
� Digitisation is building a level playing field for all Movie channels, increasing dependency on
compelling content for GRPs
� The bulk of viewership comes from Non-Metros and smaller towns
� Marquee titles are being distributed across Networks
� Competition is spending large budgets to lock big stars in long-term deals
26- Confidential -
Update on English Entertainment genre
� Launch of Genre focussed channels
― Star has launched a Genre focused channel – Star Movies Action. Strategy is to defray
content costs across 2 channels
� Launch of Premium services
― HBO is evaluating a Subscription based channel, after launching HBO Defined and HBO Hits
� Times has output deal with Fox and could launch a channel
� There are talks of another Eng GEC/Movie channel entering the space
� PIX is evaluating a SVOD platform, with increasing competition from VOD
27- Confidential -
Update on Music genre
� Genre stands to gain both reach and time spent (TS) from complete digitization roll out, similar to
DAS 1 wherein Music genre’s quantum viewership growth was the highest among all genres
� While TRAI’s mandate of phasing out all commercial inventory in excess of 12 minutes from October
does challenge Advertising revenue, the genre’s viewership stands to benefit considering present
FCT levels are anywhere between 19 to 28 minutes in a clock-hour
� The proposed copyright law may challenge MIX’s proposition of offering the widest spectrum of
music as retro songs in particular face uncertainty over content ownership
� Considering the amendments in the new copyright law, wherein content authors stand to benefit
from revenue share, music labels offering contemporary music are expecting increase in valuation of
libraries
28- Confidential -
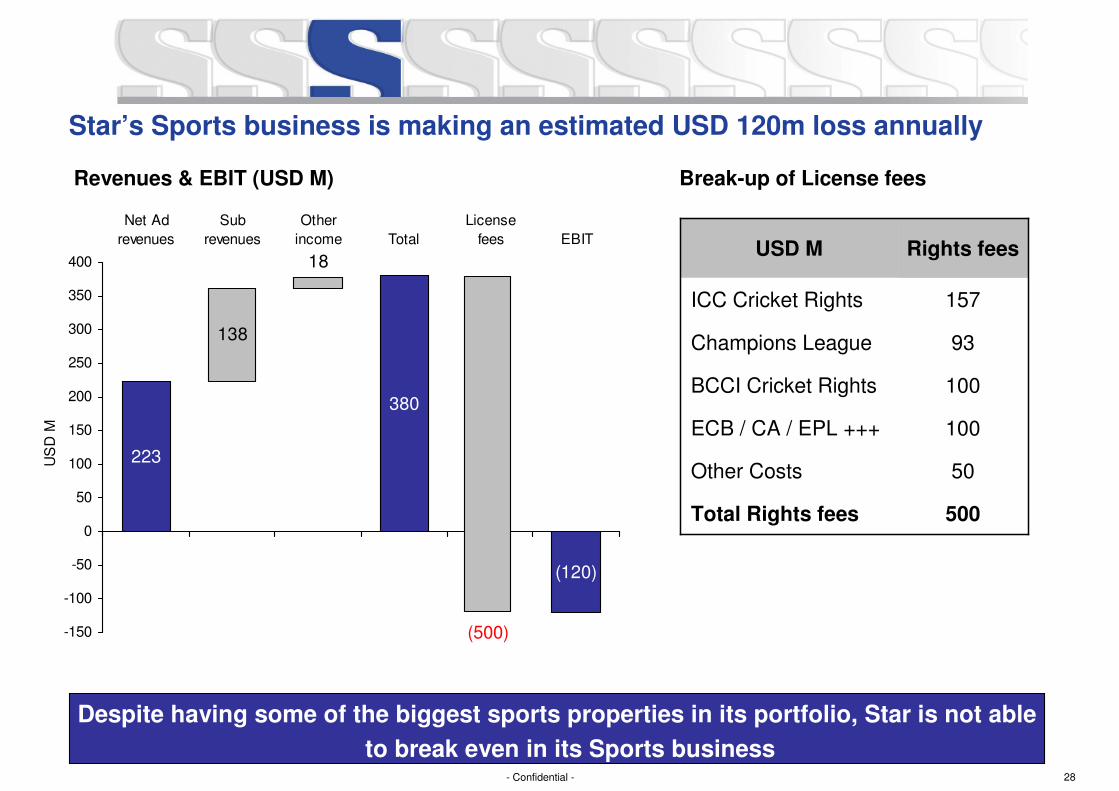
138
18
(120)
380
223
-150
-100
-50
0
50
100
150
200
250
300
350
400
Net Ad
revenues
Sub
revenues
Other
income Total
License
fees EBIT
US
D M
Star’s Sports business is making an estimated USD 120m loss annually
Revenues & EBIT (USD M) Break-up of License fees
500
50
100
100
93
157
Rights feesUSD M
ICC Cricket Rights
Champions League
BCCI Cricket Rights
ECB / CA / EPL +++
Other Costs
Total Rights fees
Despite having some of the biggest sports properties in its portfolio, Star is not able
to break even in its Sports business
(500)
29- Confidential -
Regulatory Update
30- Confidential -
Emerging Regulatory Landscape (1 of 3)
� TRAI: New Regulator and an “aggressive” position on Broadcasting. Proposals by TRAI include:
― Containing “monopolies” in Cable Distribution
― Establishing a national level “independent” rating agency across platforms: digital and
terrestrial
― Restricting ad-sales to 12 minutes per “clock” hour across all genres
― Making “Must carry” mandatory for all digital headends/MSO’s
� Competition Commission of India (CCI)
― Becoming more active
― Investigates “restrictive” trade practices
― An investigation by CCI has found no cartelization in the case related to MediaPro, a 50:50
content distribution JV between Star Den Media Services Pvt. Ltd and Zee Turner Ltd
― CCI has also given green signal to Reliance Industries' acquisition of stake in the Raghav Bahl
promoted media firms Network 18 and TV18 Broadcast
� Order against BCCI
― BCCI held to be “dominant” in cricket
― Fined for monopolistic practice. Tenor of licences for Media Rights not > 5 years
31- Confidential -
Emerging Regulatory Landscape (2 of 3)
� Content Regulation
― “Self Regulation” for GEC working well – points of friction remain
― New Certification process proposed for Films – could impact satellite rights exploitation
� New Media
― New copyrights law introduced, making content costs remain high for film/song based content
― Liability of intermediaries limited
― Safe harbour provisions strengthened
― Enforcing anti-piracy law remains a big issue
� Implementation of Companies Bill
― Constitute a CSR committee and make a CSR policy. Spend 2% of average Net Profits of
preceding three years on CSR activities
― Develop and implement a risk management policy including identification of elements of risks
that threaten existence of the company
― Ensure a resident Director is appointed while reconstituting the Board
32- Confidential -
Emerging Regulatory Landscape (3 of 3)
� FDI in Broadcasting
― Sectoral limit in distribution excluding analogue raised to 74% (up to 49% “automatic”)
― Majority control for foreigners in Cable Distribution now permissible as part of Digitalisation
― Upto 49% in analogue (“automatic”); 100% in Uplinking/Downlinking (non-news)
33- Confidential -
The Road ahead…
34- Confidential -
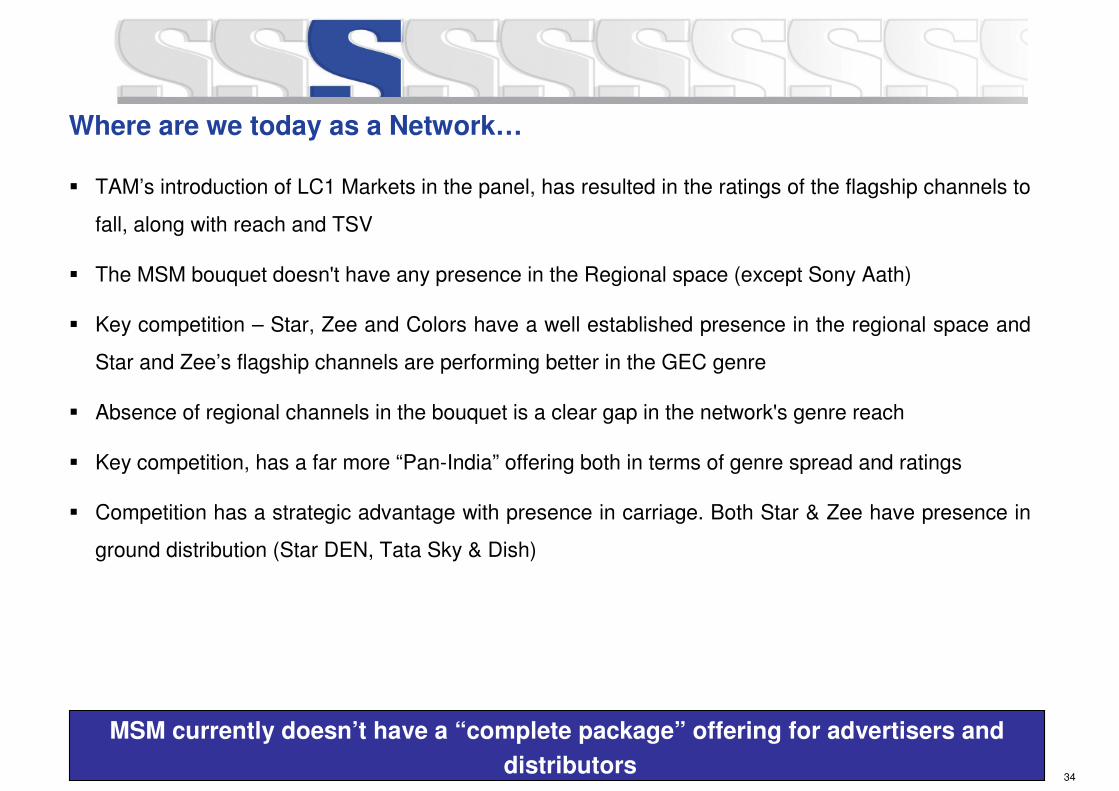
Where are we today as a Network…
� TAM’s introduction of LC1 Markets in the panel, has resulted in the ratings of the flagship channels to
fall, along with reach and TSV
� The MSM bouquet doesn't have any presence in the Regional space (except Sony Aath)
� Key competition – Star, Zee and Colors have a well established presence in the regional space and
Star and Zee’s flagship channels are performing better in the GEC genre
� Absence of regional channels in the bouquet is a clear gap in the network's genre reach
� Key competition, has a far more “Pan-India” offering both in terms of genre spread and ratings
� Competition has a strategic advantage with presence in carriage. Both Star & Zee have presence in
ground distribution (Star DEN, Tata Sky & Dish)
MSM currently doesn’t have a “complete package” offering for advertisers and
distributors
35- Confidential -
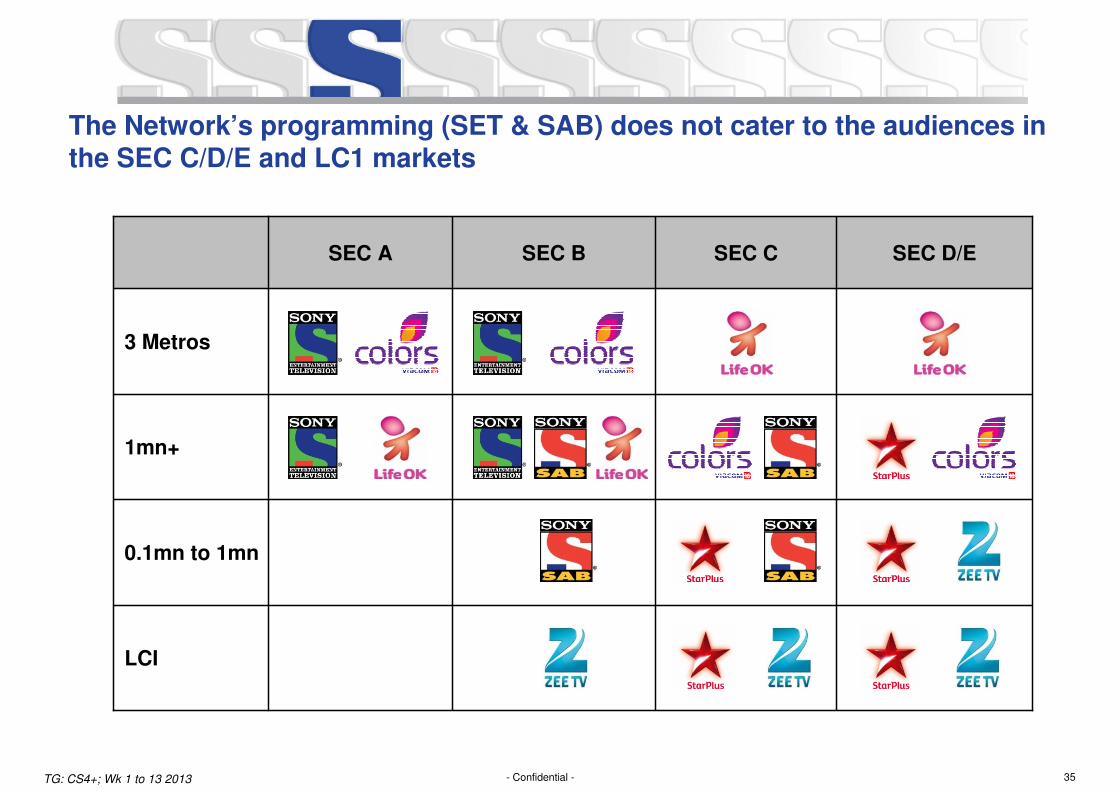
The Network’s programming (SET & SAB) does not cater to the audiences in the SEC C/D/E and LC1 markets
TG: CS4+; Wk 1 to 13 2013
SEC A SEC B SEC C SEC D/E
3 Metros
1mn+
0.1mn to 1mn
LCI
36- Confidential -
The Potential implications…
� With programming not targeted to female audiences in small towns, the introduction of TAM meters
and further expansion, in Rural markets may result in further drop in ratings
� We also run the risk of being dropped by operators due to gaps in our bouquet offering and also for
strategic reasons, which may further fuel a decline in reach and ratings
� Flagship channel’s falling Reach and TSV, may result in Advertisers reducing the premium on the
channel
� The Network is over reliant on SET for driving revenues and EBIT. Falling ratings of the channel is a
risk to Network profitability
The network should aim to target all SECs, markets, across both genres to reduce
the risk of being ignored by media planners and also potentially losing presence
on ground

37- Confidential -
With Business-as-Usual, there is a potential loss of USD 1,045m (INR 5,670 Crs) to USD 1,353m (INR 7,344 Crs) between Years 5 and 10
� The MSO/DTH operator drops our channel from the base tier due to a gap in the portfolio:
― If 30% of operators drop SET and SAB from their bouquet then the loss can be USD 524m
(INR 2,842 Crs) in Subscription revenues and USD 830m (INR 4,502 Crs) in Ad revenues due
to subsequent impact on ratings
― There is a potential risk since 35% of our Distribution revenues comes from Competition
controlled MSO/DTH (DEN – 6%, Dish TV – 11%, Tata Sky – 14%, WWIL – 4%)
� TRAI Regulation of 10 minutes (currently our GEC channels are running 14 minutes average per
hour)
― Reduction will be approx 29% in Ad revenues i.e. USD 1,045m (INR 5,670 Crs)
� Drop in ratings due to Programming and LC1 market changes
― If drop in revenue is pro-rata to reduction in ratings then reduction in Ad revenues will be
approx. USD 859m (INR 4,664 Crs) and Subscription revenues will be USD 189m (INR 1,023
Crs)
FX rate: USD 1= INR 54.265
38- Confidential -
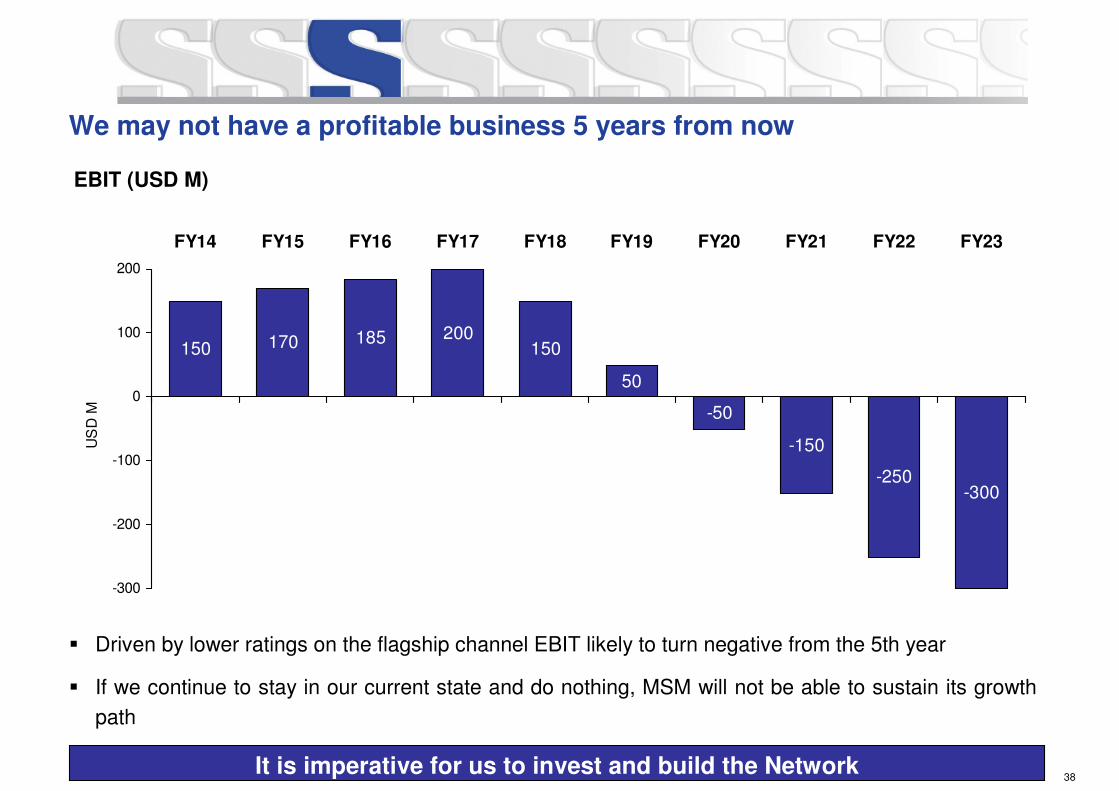
We may not have a profitable business 5 years from now
� Driven by lower ratings on the flagship channel EBIT likely to turn negative from the 5th year
� If we continue to stay in our current state and do nothing, MSM will not be able to sustain its growth
path
150 170 185 200150
50
-50
-150
-250-300
-300
-200
-100
0
100
200
FY14 FY15 FY16 FY17 FY18 FY19 FY20 FY21 FY22 FY23
US
D M
EBIT (USD M)
It is imperative for us to invest and build the Network
39- Confidential -
Strategic New Initiatives
40- Confidential -
Opportunity 1 – Female-skewed, lower SEC GEC Plan
Strategic New Initiatives
41- Confidential -
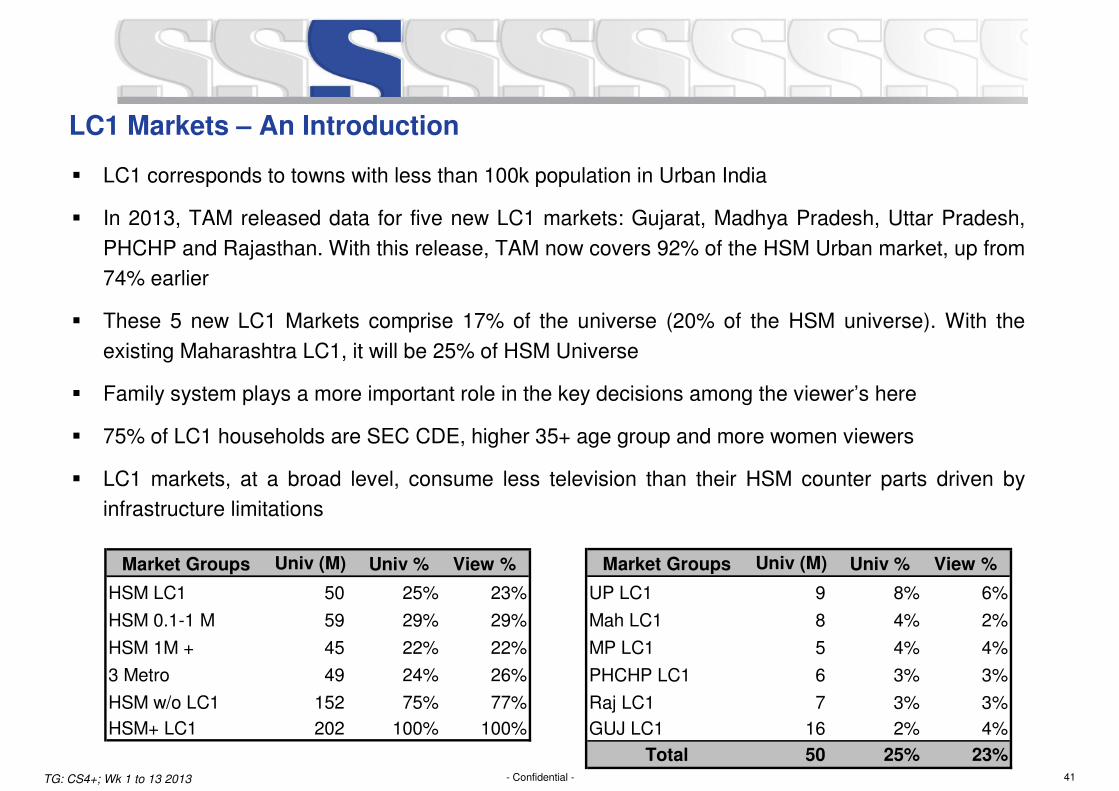
LC1 Markets – An Introduction
� LC1 corresponds to towns with less than 100k population in Urban India
� In 2013, TAM released data for five new LC1 markets: Gujarat, Madhya Pradesh, Uttar Pradesh,
PHCHP and Rajasthan. With this release, TAM now covers 92% of the HSM Urban market, up from
74% earlier
� These 5 new LC1 Markets comprise 17% of the universe (20% of the HSM universe). With the
existing Maharashtra LC1, it will be 25% of HSM Universe
� Family system plays a more important role in the key decisions among the viewer’s here
� 75% of LC1 households are SEC CDE, higher 35+ age group and more women viewers
� LC1 markets, at a broad level, consume less television than their HSM counter parts driven by
infrastructure limitations
TG: CS4+; Wk 1 to 13 2013
Market Groups Univ (M) Univ % View %
HSM LC1 50 25% 23%
HSM 0.1-1 M 59 29% 29%
HSM 1M + 45 22% 22%
3 Metro 49 24% 26%
HSM w/o LC1 152 75% 77%
HSM+ LC1 202 100% 100%
Market Groups Univ (M) Univ % View %
UP LC1 9 8% 6%
Mah LC1 8 4% 2%
MP LC1 5 4% 4%
PHCHP LC1 6 3% 3%
Raj LC1 7 3% 3%
GUJ LC1 16 2% 4%
Total 50 25% 23%
42- Confidential -
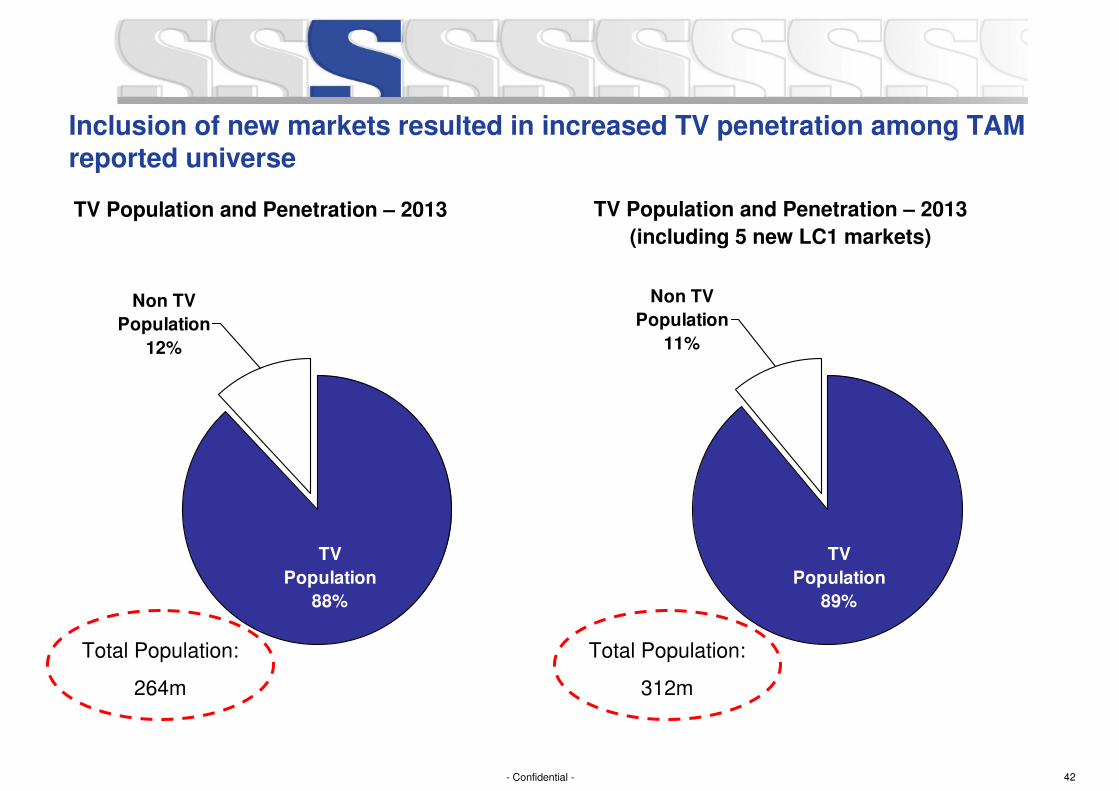
Inclusion of new markets resulted in increased TV penetration among TAM reported universe
Non TV
Population
12%
TV
Population
88%
TV Population and Penetration – 2013 TV Population and Penetration – 2013
(including 5 new LC1 markets)
Non TV
Population
11%
TV
Population
89%
Total Population:
264m
Total Population:
312m
43- Confidential -
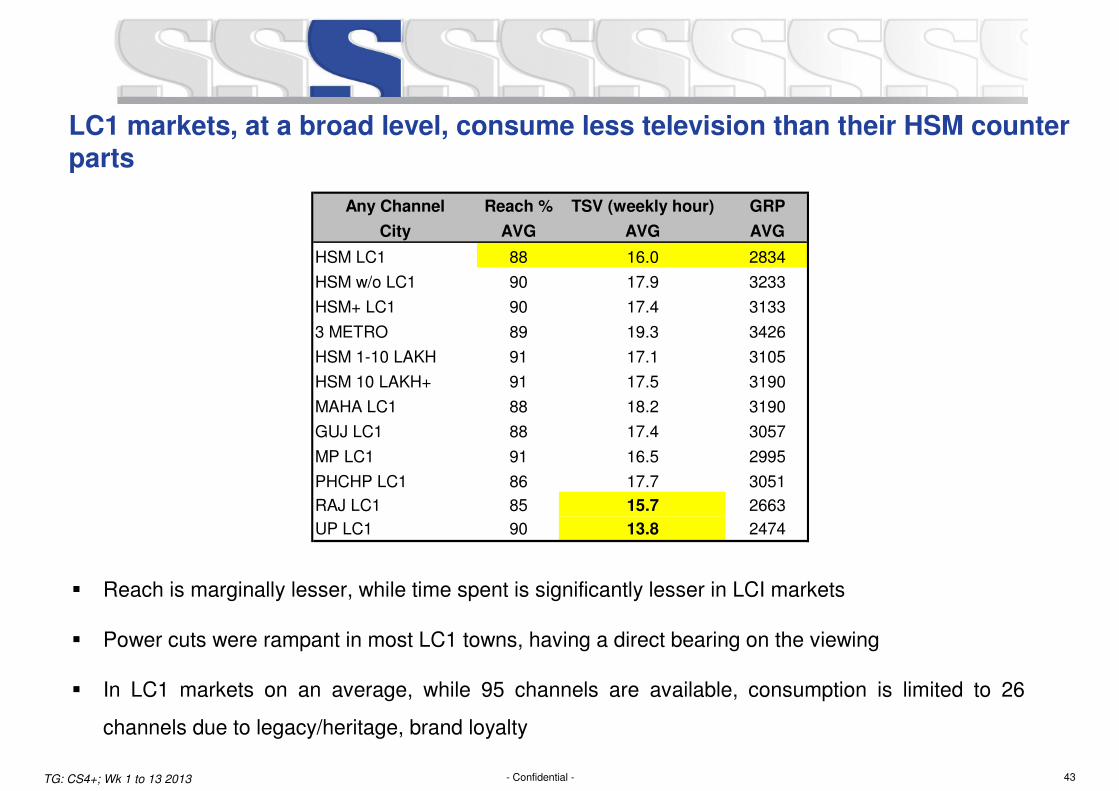
LC1 markets, at a broad level, consume less television than their HSM counter parts
� Reach is marginally lesser, while time spent is significantly lesser in LCI markets
� Power cuts were rampant in most LC1 towns, having a direct bearing on the viewing
� In LC1 markets on an average, while 95 channels are available, consumption is limited to 26
channels due to legacy/heritage, brand loyalty
TG: CS4+; Wk 1 to 13 2013
Any Channel Reach % TSV (weekly hour) GRP
City AVG AVG AVG
HSM LC1 88 16.0 2834
HSM w/o LC1 90 17.9 3233
HSM+ LC1 90 17.4 3133
3 METRO 89 19.3 3426
HSM 1-10 LAKH 91 17.1 3105
HSM 10 LAKH+ 91 17.5 3190
MAHA LC1 88 18.2 3190
GUJ LC1 88 17.4 3057
MP LC1 91 16.5 2995
PHCHP LC1 86 17.7 3051
RAJ LC1 85 15.7 2663
UP LC1 90 13.8 2474
44- Confidential -
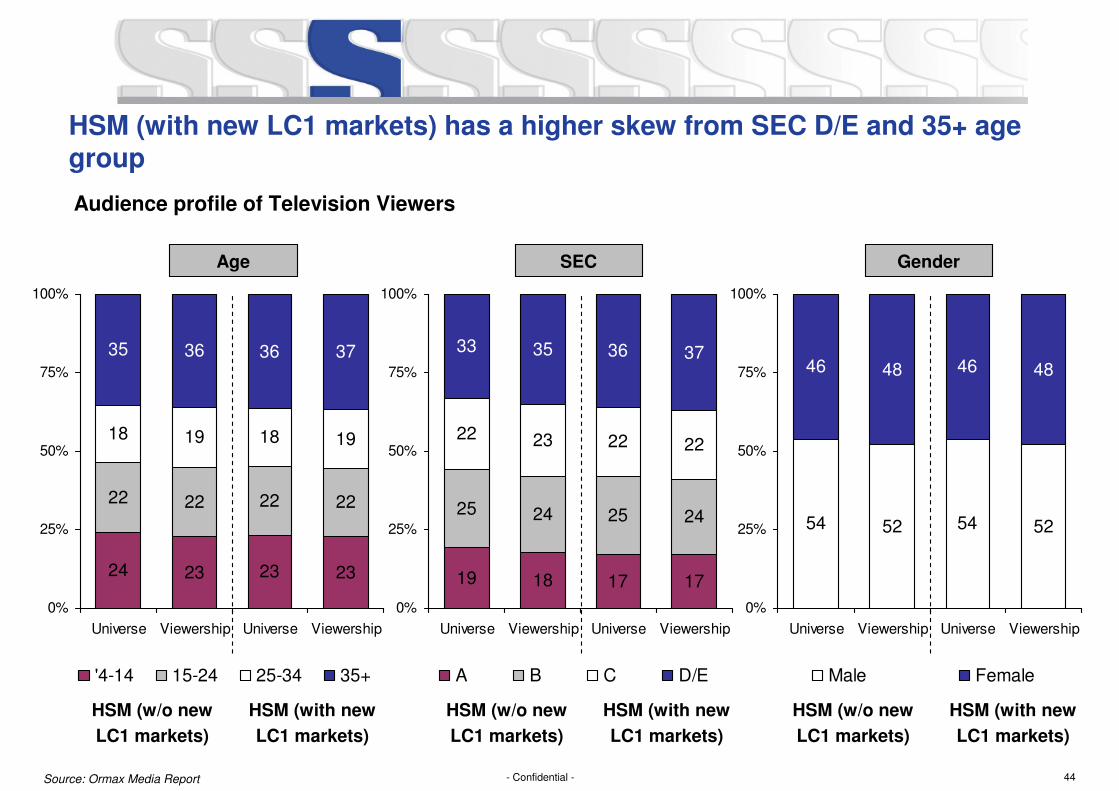
HSM (with new LC1 markets) has a higher skew from SEC D/E and 35+ age group
Audience profile of Television Viewers
23 23 23
22 22 22 22
18 19 18 19
35 36 36 37
24
0%
25%
50%
75%
100%
Universe Viewership Universe Viewership
'4-14 15-24 25-34 35+
18 17 17
25 24 25 24
22 23 22 22
33 35 36 37
19
0%
25%
50%
75%
100%
Universe Viewership Universe Viewership
A B C D/E
54 52 54 52
46 48 46 48
0%
25%
50%
75%
100%
Universe Viewership Universe Viewership
Male Female
Age GenderSEC
HSM (with new
LC1 markets)
HSM (w/o new
LC1 markets)
HSM (with new
LC1 markets)
HSM (w/o new
LC1 markets)
HSM (with new
LC1 markets)
HSM (w/o new
LC1 markets)
Source: Ormax Media Report
45- Confidential -
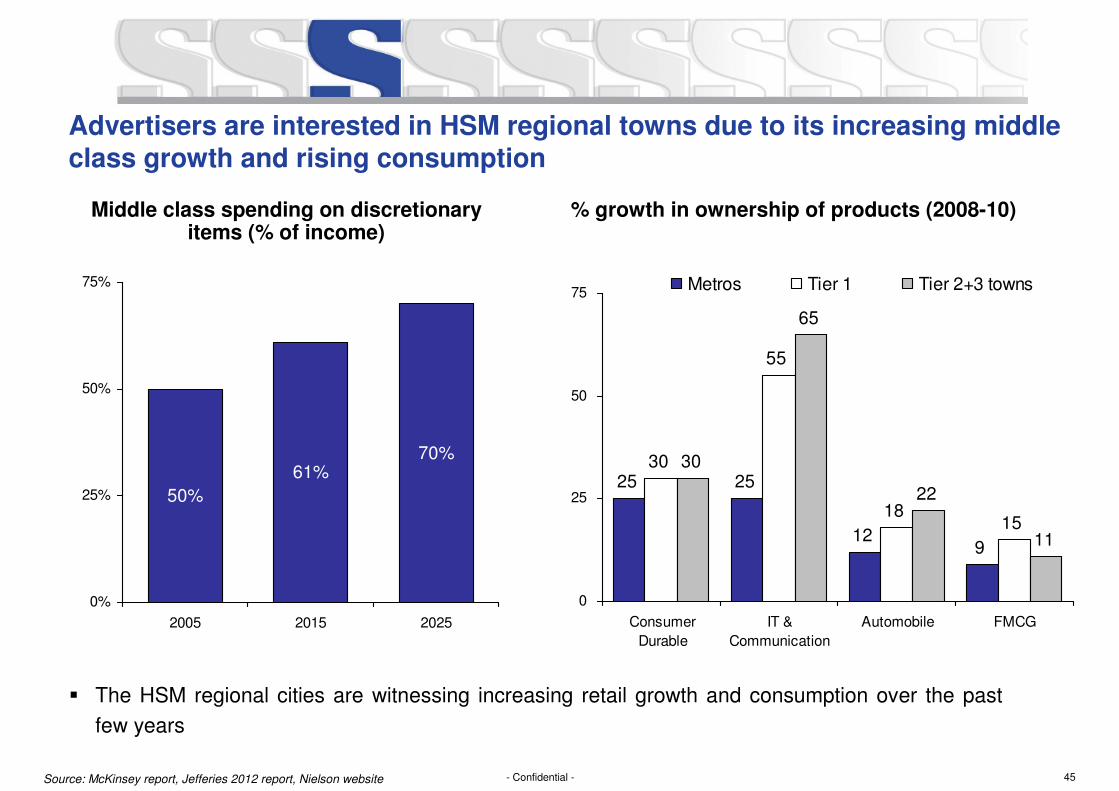
Advertisers are interested in HSM regional towns due to its increasing middle class growth and rising consumption
Middle class spending on discretionary items (% of income)
50%
61%70%
0%
25%
50%
75%
2005 2015 2025
� The HSM regional cities are witnessing increasing retail growth and consumption over the past
few years
% growth in ownership of products (2008-10)
25 25
129
30
55
1815
30
65
22
11
0
25
50
75
Consumer
Durable
IT &
Communication
Automobile FMCG
Metros Tier 1 Tier 2+3 towns
Source: McKinsey report, Jefferies 2012 report, Nielson website
46- Confidential -
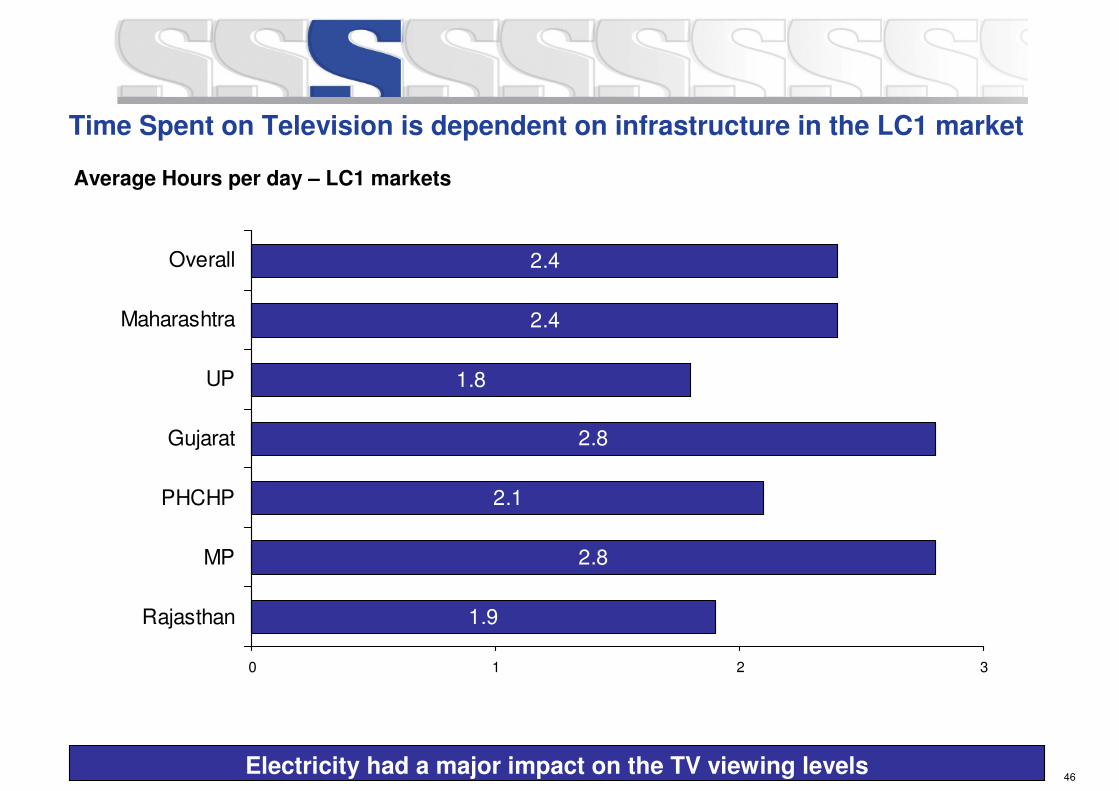
Time Spent on Television is dependent on infrastructure in the LC1 market
Electricity had a major impact on the TV viewing levels
Average Hours per day – LC1 markets
1.9
2.8
2.1
2.8
1.8
2.4
2.4
0 1 2 3
Rajasthan
MP
PHCHP
Gujarat
UP
Maharashtra
Overall
47- Confidential -
187
147
256227
213
121
38
174142
258
213 220
116
53
0
55
110
165
220
275
SET SAB STAR Plus Colors Zee TV Life OK Star Utsav
GR
Ps
W/o LC1 With LC1
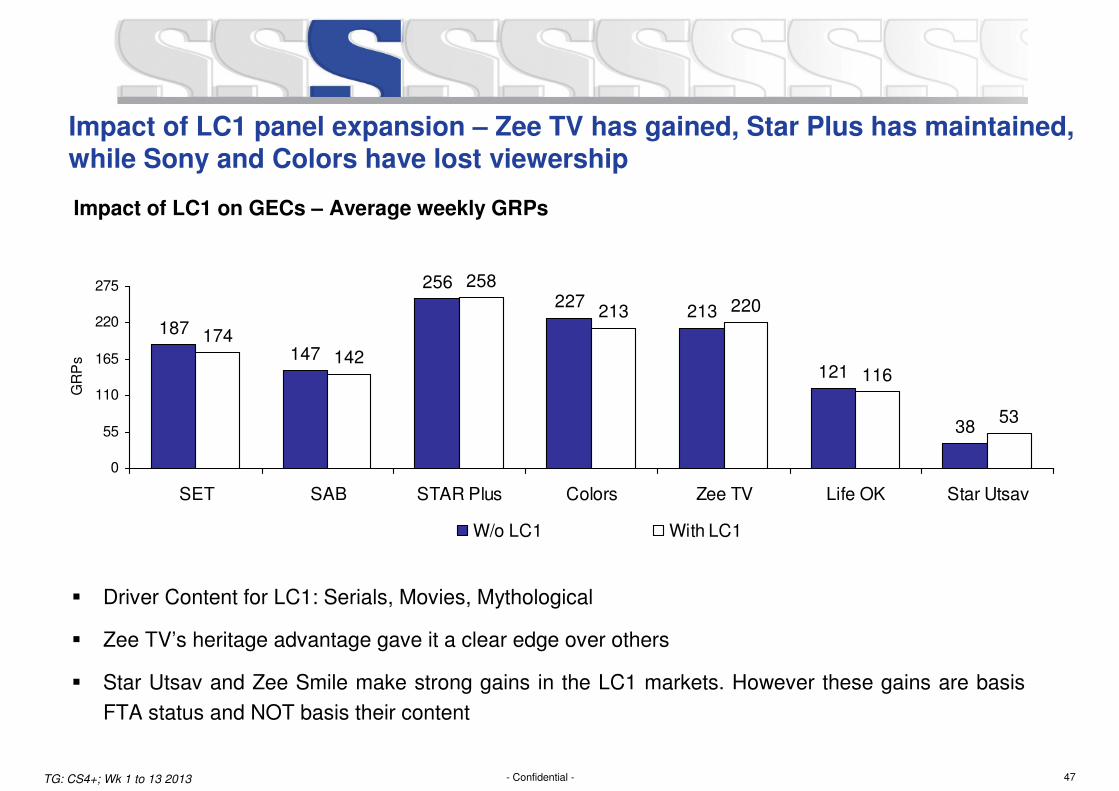
� Driver Content for LC1: Serials, Movies, Mythological
� Zee TV’s heritage advantage gave it a clear edge over others
� Star Utsav and Zee Smile make strong gains in the LC1 markets. However these gains are basis
FTA status and NOT basis their content
TG: CS4+; Wk 1 to 13 2013
Impact of LC1 panel expansion – Zee TV has gained, Star Plus has maintained, while Sony and Colors have lost viewership
Impact of LC1 on GECs – Average weekly GRPs
48- Confidential -
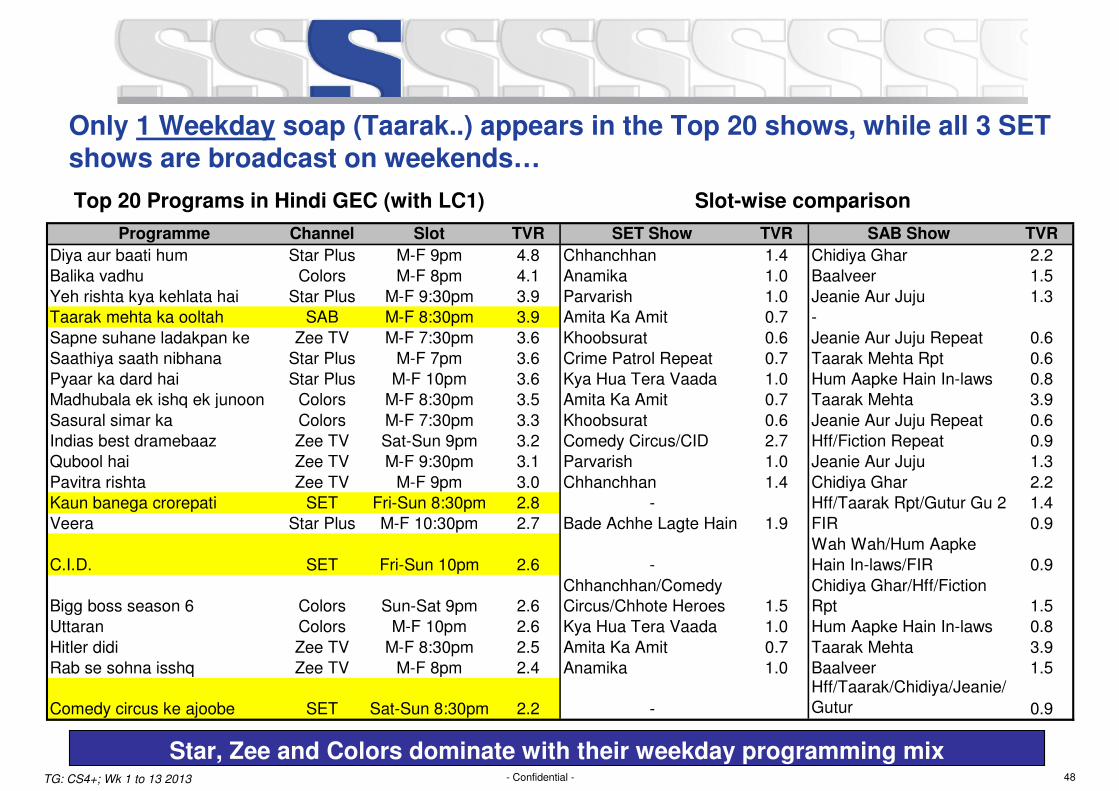
Only 1 Weekday soap (Taarak..) appears in the Top 20 shows, while all 3 SET shows are broadcast on weekends…
Star, Zee and Colors dominate with their weekday programming mixTG: CS4+; Wk 1 to 13 2013
Top 20 Programs in Hindi GEC (with LC1) Slot-wise comparison
Programme Channel Slot TVR SET Show TVR SAB Show TVR
Diya aur baati hum Star Plus M-F 9pm 4.8 Chhanchhan 1.4 Chidiya Ghar 2.2
Balika vadhu Colors M-F 8pm 4.1 Anamika 1.0 Baalveer 1.5
Yeh rishta kya kehlata hai Star Plus M-F 9:30pm 3.9 Parvarish 1.0 Jeanie Aur Juju 1.3
Taarak mehta ka ooltah SAB M-F 8:30pm 3.9 Amita Ka Amit 0.7 -
Sapne suhane ladakpan ke Zee TV M-F 7:30pm 3.6 Khoobsurat 0.6 Jeanie Aur Juju Repeat 0.6
Saathiya saath nibhana Star Plus M-F 7pm 3.6 Crime Patrol Repeat 0.7 Taarak Mehta Rpt 0.6
Pyaar ka dard hai Star Plus M-F 10pm 3.6 Kya Hua Tera Vaada 1.0 Hum Aapke Hain In-laws 0.8
Madhubala ek ishq ek junoon Colors M-F 8:30pm 3.5 Amita Ka Amit 0.7 Taarak Mehta 3.9
Sasural simar ka Colors M-F 7:30pm 3.3 Khoobsurat 0.6 Jeanie Aur Juju Repeat 0.6
Indias best dramebaaz Zee TV Sat-Sun 9pm 3.2 Comedy Circus/CID 2.7 Hff/Fiction Repeat 0.9
Qubool hai Zee TV M-F 9:30pm 3.1 Parvarish 1.0 Jeanie Aur Juju 1.3
Pavitra rishta Zee TV M-F 9pm 3.0 Chhanchhan 1.4 Chidiya Ghar 2.2
Kaun banega crorepati SET Fri-Sun 8:30pm 2.8 - Hff/Taarak Rpt/Gutur Gu 2 1.4
Veera Star Plus M-F 10:30pm 2.7 Bade Achhe Lagte Hain 1.9 FIR 0.9
C.I.D. SET Fri-Sun 10pm 2.6 -
Wah Wah/Hum Aapke
Hain In-laws/FIR 0.9
Bigg boss season 6 Colors Sun-Sat 9pm 2.6
Chhanchhan/Comedy
Circus/Chhote Heroes 1.5
Chidiya Ghar/Hff/Fiction
Rpt 1.5
Uttaran Colors M-F 10pm 2.6 Kya Hua Tera Vaada 1.0 Hum Aapke Hain In-laws 0.8
Hitler didi Zee TV M-F 8:30pm 2.5 Amita Ka Amit 0.7 Taarak Mehta 3.9
Rab se sohna isshq Zee TV M-F 8pm 2.4 Anamika 1.0 Baalveer 1.5
Comedy circus ke ajoobe SET Sat-Sun 8:30pm 2.2 -
Hff/Taarak/Chidiya/Jeanie/
Gutur 0.9
49- Confidential -
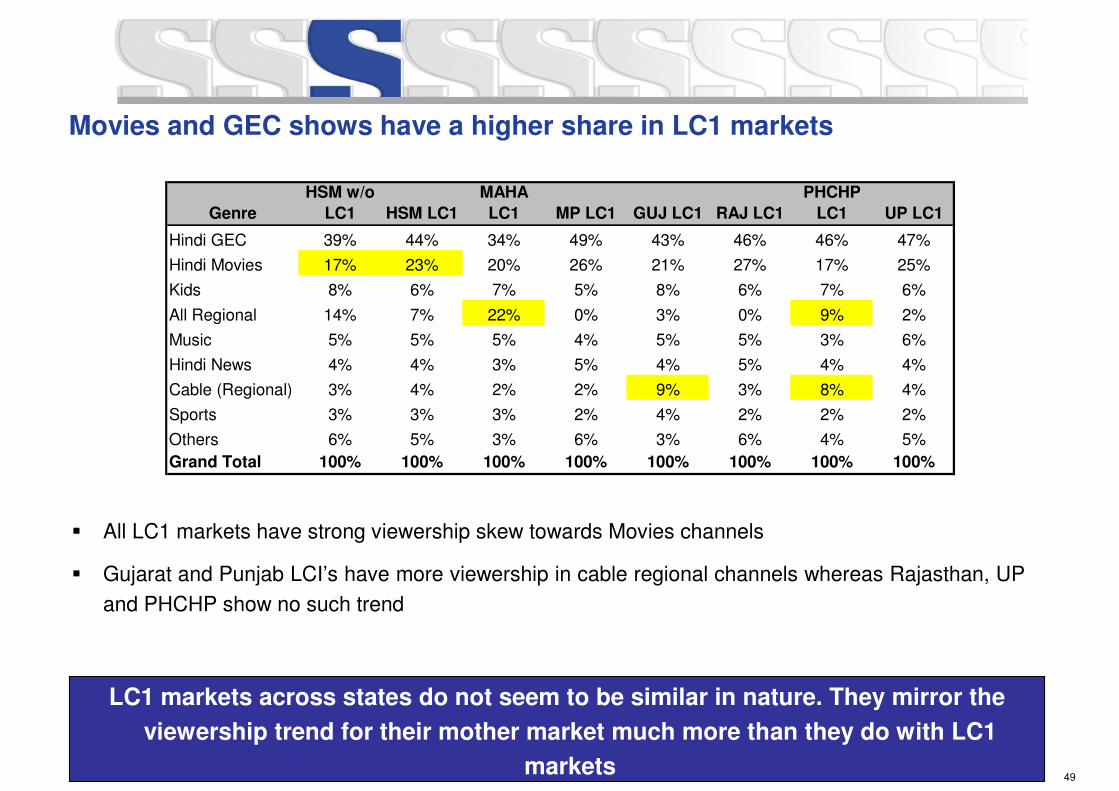
Movies and GEC shows have a higher share in LC1 markets
*CS4+. Wk 1 to 13 2013
LC1 markets across states do not seem to be similar in nature. They mirror the
viewership trend for their mother market much more than they do with LC1
markets
� All LC1 markets have strong viewership skew towards Movies channels
� Gujarat and Punjab LCI’s have more viewership in cable regional channels whereas Rajasthan, UP
and PHCHP show no such trend
Genre
HSM w/o
LC1 HSM LC1
MAHA
LC1 MP LC1 GUJ LC1 RAJ LC1
PHCHP
LC1 UP LC1
Hindi GEC 39% 44% 34% 49% 43% 46% 46% 47%
Hindi Movies 17% 23% 20% 26% 21% 27% 17% 25%
Kids 8% 6% 7% 5% 8% 6% 7% 6%
All Regional 14% 7% 22% 0% 3% 0% 9% 2%
Music 5% 5% 5% 4% 5% 5% 3% 6%
Hindi News 4% 4% 3% 5% 4% 5% 4% 4%
Cable (Regional) 3% 4% 2% 2% 9% 3% 8% 4%
Sports 3% 3% 3% 2% 4% 2% 2% 2%
Others 6% 5% 3% 6% 3% 6% 4% 5%
Grand Total 100% 100% 100% 100% 100% 100% 100% 100%
50- Confidential -
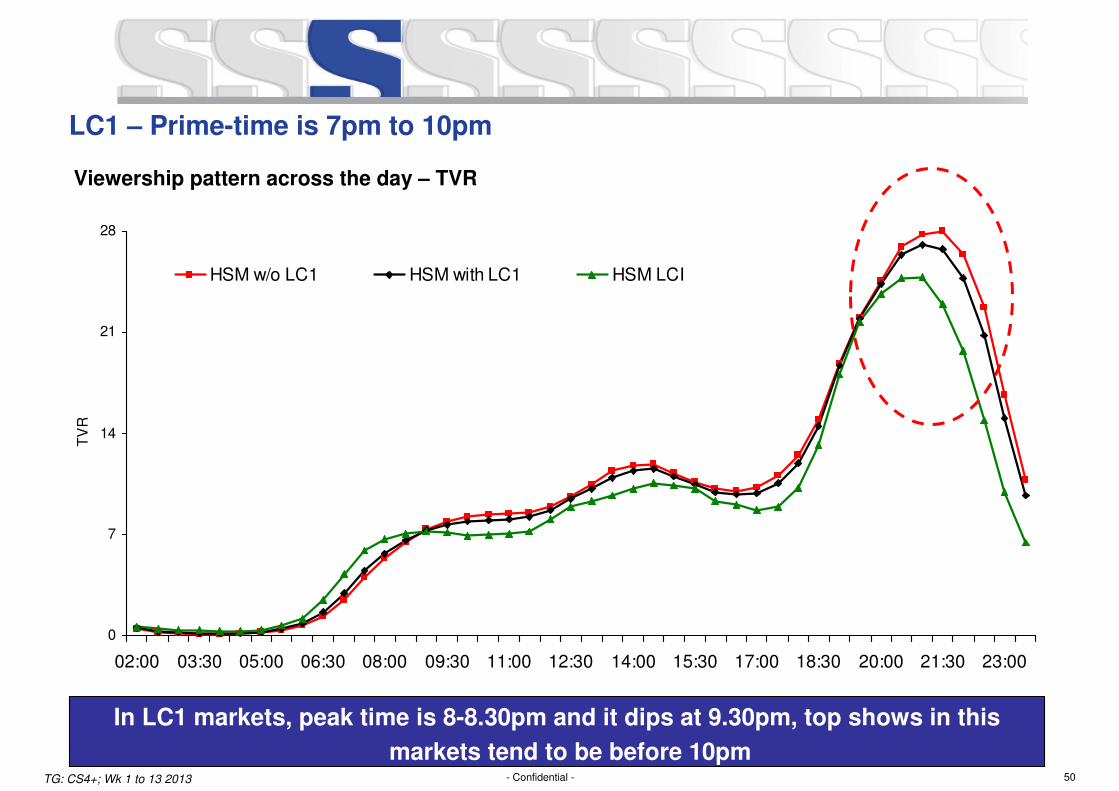
LC1 – Prime-time is 7pm to 10pm
In LC1 markets, peak time is 8-8.30pm and it dips at 9.30pm, top shows in this
markets tend to be before 10pmTG: CS4+; Wk 1 to 13 2013
Viewership pattern across the day – TVR
0
7
14
21
28
02:00 03:30 05:00 06:30 08:00 09:30 11:00 12:30 14:00 15:30 17:00 18:30 20:00 21:30 23:00
TV
R
HSM w/o LC1 HSM with LC1 HSM LCI
51- Confidential -
Key insights from on-ground research in LC1 markets (1 of 2)
Channel Imagery
� Inertia in brand preference
― Heritage brands that are being watched over time, continued to enjoy high equity in these
markets e.g. Zee TV
� Less Variety Seeking Behavior
― While about 50 channels were available, the daily routine included only 4-5 channels at best
� Besides Star Plus and SAB, most other channels were seen as an aggregation of programs or movies
� Given the high weight-age these markets carry, it is prudent to shift the language of all on-air and off-
air communication to Hindi
Viewership Behavior and Lifestyle
� In single TV households, television is watched along with the family so the programme ought to cater
to entire family at a time, also “Parivaarik” movies will be watched rather than romantic movies
� Besides television, only three other touch points emerge for these markets:
― Print (primary off-air medium)
― Mobiles
― Local grocery shops (visited regularly by 60%+)
52- Confidential -
� There were three key influencers of viewing behaviour:
― Viewing companion (whom are they watching TV with?)
― Control over the remote
― Power cuts
� Even at a claimed level, only 1 out of 3 were comfortable with English
Source: Ormax Media Report
Key insights from on-ground research in LC1 markets (2 of 2)
53- Confidential -
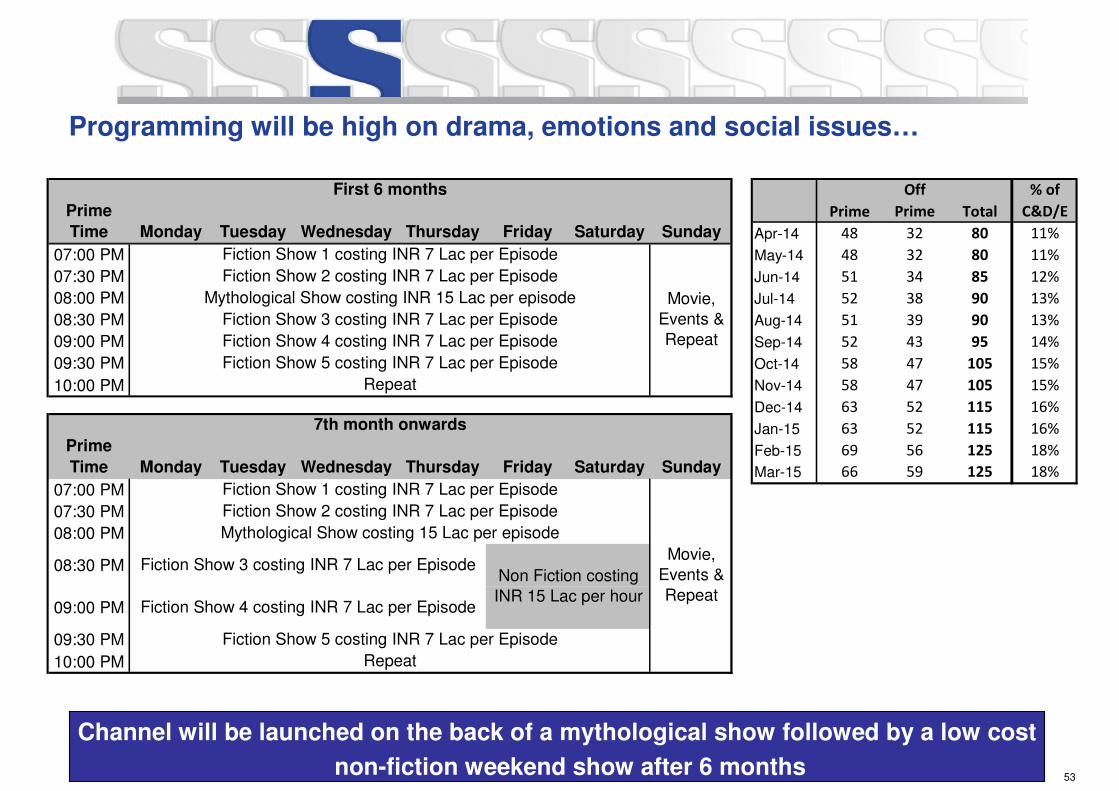
Programming will be high on drama, emotions and social issues…
Channel will be launched on the back of a mythological show followed by a low cost
non-fiction weekend show after 6 months
Prime
Off
Prime Total
% of
C&D/E
Apr-14 48 32 80 11%
May-14 48 32 80 11%
Jun-14 51 34 85 12%
Jul-14 52 38 90 13%
Aug-14 51 39 90 13%
Sep-14 52 43 95 14%
Oct-14 58 47 105 15%
Nov-14 58 47 105 15%
Dec-14 63 52 115 16%
Jan-15 63 52 115 16%
Feb-15 69 56 125 18%
Mar-15 66 59 125 18%
Prime
Time Monday Tuesday Wednesday Thursday Friday Saturday Sunday
07:00 PM
07:30 PM
08:00 PM
08:30 PM
09:00 PM
09:30 PM
10:00 PM
First 6 months
Fiction Show 1 costing INR 7 Lac per Episode
Movie,
Events &
Repeat
Fiction Show 2 costing INR 7 Lac per Episode
Mythological Show costing INR 15 Lac per episode
Fiction Show 3 costing INR 7 Lac per Episode
Fiction Show 4 costing INR 7 Lac per Episode
Fiction Show 5 costing INR 7 Lac per Episode
Repeat
Prime
Time Monday Tuesday Wednesday Thursday Friday Saturday Sunday
07:00 PM
07:30 PM
08:00 PM
08:30 PM
09:00 PM
09:30 PM
10:00 PM
7th month onwards
Fiction Show 1 costing INR 7 Lac per Episode
Movie,
Events &
Repeat
Fiction Show 2 costing INR 7 Lac per Episode
Mythological Show costing 15 Lac per episode
Fiction Show 3 costing INR 7 Lac per EpisodeNon Fiction costing
INR 15 Lac per hourFiction Show 4 costing INR 7 Lac per Episode
Fiction Show 5 costing INR 7 Lac per Episode
Repeat
54- Confidential -
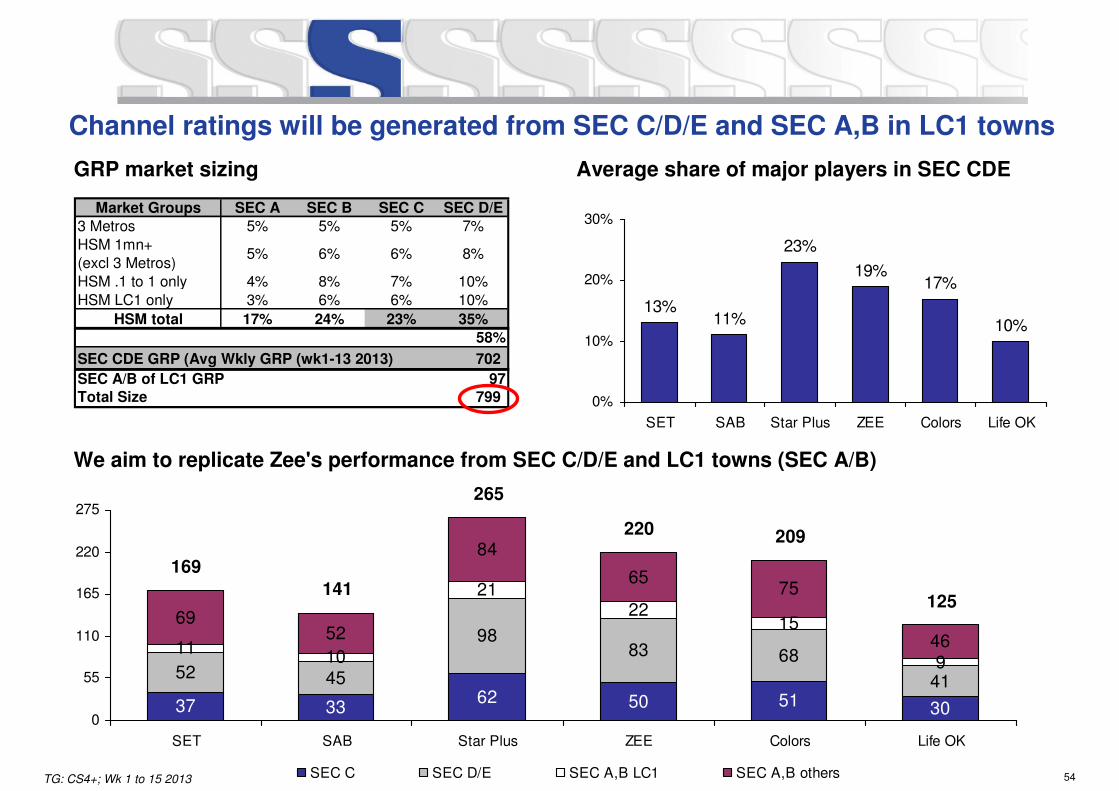
Channel ratings will be generated from SEC C/D/E and SEC A,B in LC1 towns
TG: CS4+; Wk 1 to 15 2013
GRP market sizing Average share of major players in SEC CDE
We aim to replicate Zee's performance from SEC C/D/E and LC1 towns (SEC A/B)
Market Groups SEC A SEC B SEC C SEC D/E
3 Metros 5% 5% 5% 7%
HSM 1mn+ (excl 3 Metros)
5% 6% 6% 8%
HSM .1 to 1 only 4% 8% 7% 10%
HSM LC1 only 3% 6% 6% 10%
HSM total 17% 24% 23% 35%
SEC CDE GRP (Avg Wkly GRP (wk1-13 2013) 702
SEC A/B of LC1 GRP 97
Total Size 799
58%
13%11%
23%
19%17%
10%
0%
10%
20%
30%
SET SAB Star Plus ZEE Colors Life OK
62 50 51 30
45
9883 68
41
10
2122
15
9
6952
84
6575
46
37 33
52
11
265
220 209
125
169
141
0
55
110
165
220
275
SET SAB Star Plus ZEE Colors Life OK
SEC C SEC D/E SEC A,B LC1 SEC A,B others
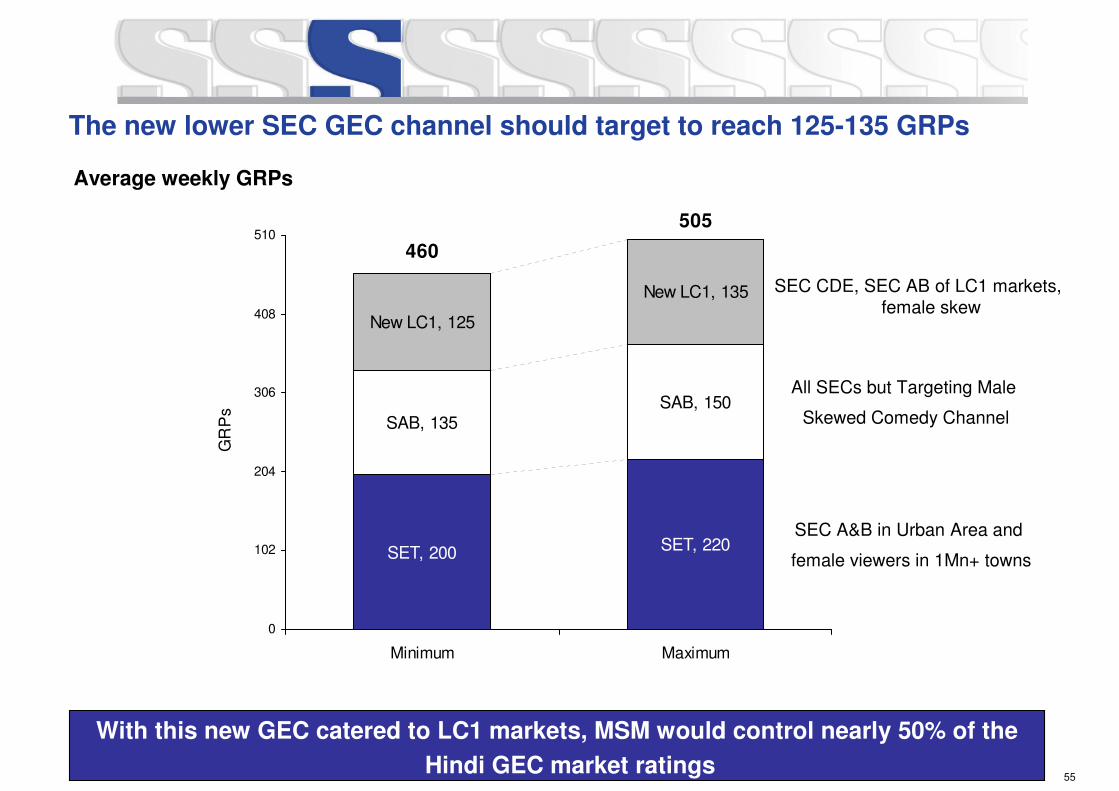
55- Confidential -
SAB, 150
New LC1, 135
SET, 220 SET, 200
SAB, 135
New LC1, 125
505
460
0
102
204
306
408
510
Minimum Maximum
GR
Ps
SEC A&B in Urban Area and
female viewers in 1Mn+ towns
All SECs but Targeting Male
Skewed Comedy Channel
SEC CDE, SEC AB of LC1 markets, female skew
The new lower SEC GEC channel should target to reach 125-135 GRPs
With this new GEC catered to LC1 markets, MSM would control nearly 50% of the
Hindi GEC market ratings
Average weekly GRPs
56- Confidential -
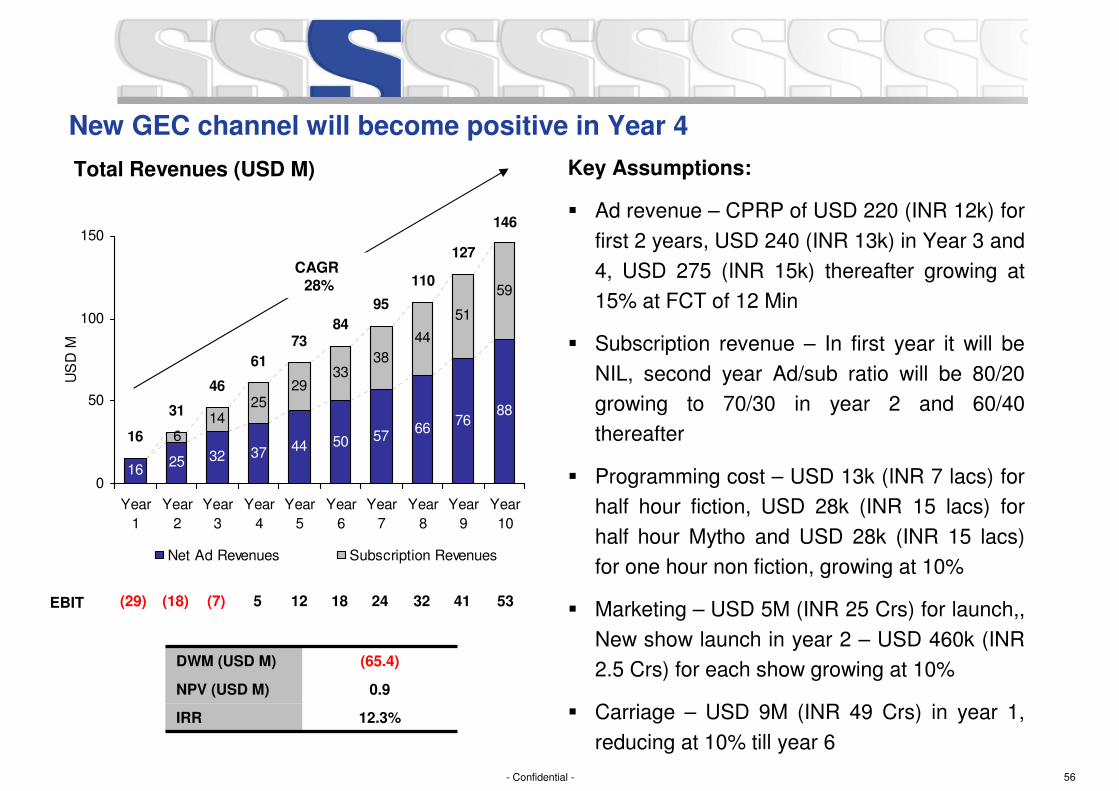
44 50 5766
7688
614
2933
38
44
51
59
2516
3732
25
110
127
146
95
84
31
16
61
73
46
0
50
100
150
Year
1
Year
2
Year
3
Year
4
Year
5
Year
6
Year
7
Year
8
Year
9
Year
10
US
D M
Net Ad Revenues Subscription Revenues
DWM (USD M) (65.4)
NPV (USD M) 0.9
IRR 12.3%
EBIT (29) (18) 53
CAGR 28%
(7) 5 12 18 24 32 41
Total Revenues (USD M)
New GEC channel will become positive in Year 4
Key Assumptions:
� Ad revenue – CPRP of USD 220 (INR 12k) for
first 2 years, USD 240 (INR 13k) in Year 3 and
4, USD 275 (INR 15k) thereafter growing at
15% at FCT of 12 Min
� Subscription revenue – In first year it will be
NIL, second year Ad/sub ratio will be 80/20
growing to 70/30 in year 2 and 60/40
thereafter
� Programming cost – USD 13k (INR 7 lacs) for
half hour fiction, USD 28k (INR 15 lacs) for
half hour Mytho and USD 28k (INR 15 lacs)
for one hour non fiction, growing at 10%
� Marketing – USD 5M (INR 25 Crs) for launch,,
New show launch in year 2 – USD 460k (INR
2.5 Crs) for each show growing at 10%
� Carriage – USD 9M (INR 49 Crs) in year 1,
reducing at 10% till year 6
57- Confidential -
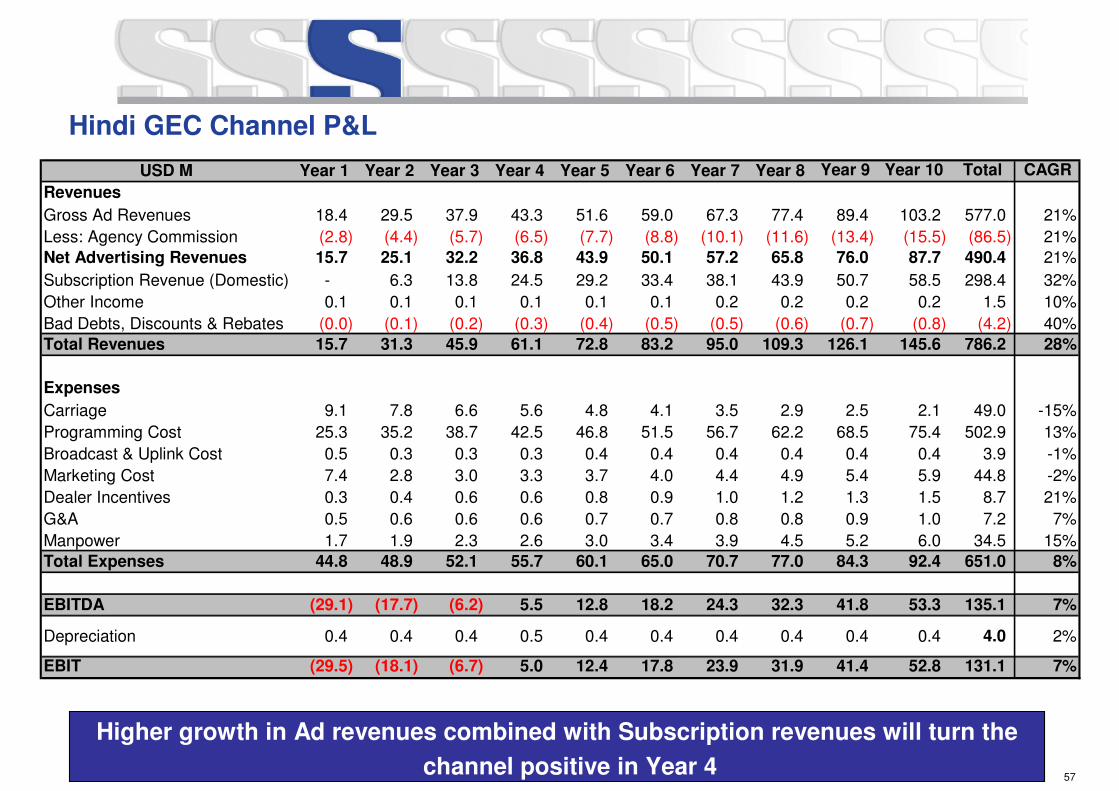
Hindi GEC Channel P&L
Higher growth in Ad revenues combined with Subscription revenues will turn the
channel positive in Year 4
USD M Year 1 Year 2 Year 3 Year 4 Year 5 Year 6 Year 7 Year 8 Year 9 Year 10 Total CAGR
Revenues
Gross Ad Revenues 18.4 29.5 37.9 43.3 51.6 59.0 67.3 77.4 89.4 103.2 577.0 21%
Less: Agency Commission (2.8) (4.4) (5.7) (6.5) (7.7) (8.8) (10.1) (11.6) (13.4) (15.5) (86.5) 21%
Net Advertising Revenues 15.7 25.1 32.2 36.8 43.9 50.1 57.2 65.8 76.0 87.7 490.4 21%
Subscription Revenue (Domestic) - 6.3 13.8 24.5 29.2 33.4 38.1 43.9 50.7 58.5 298.4 32%
Other Income 0.1 0.1 0.1 0.1 0.1 0.1 0.2 0.2 0.2 0.2 1.5 10%
Bad Debts, Discounts & Rebates (0.0) (0.1) (0.2) (0.3) (0.4) (0.5) (0.5) (0.6) (0.7) (0.8) (4.2) 40%
Total Revenues 15.7 31.3 45.9 61.1 72.8 83.2 95.0 109.3 126.1 145.6 786.2 28%
Expenses
Carriage 9.1 7.8 6.6 5.6 4.8 4.1 3.5 2.9 2.5 2.1 49.0 -15%
Programming Cost 25.3 35.2 38.7 42.5 46.8 51.5 56.7 62.2 68.5 75.4 502.9 13%
Broadcast & Uplink Cost 0.5 0.3 0.3 0.3 0.4 0.4 0.4 0.4 0.4 0.4 3.9 -1%
Marketing Cost 7.4 2.8 3.0 3.3 3.7 4.0 4.4 4.9 5.4 5.9 44.8 -2%
Dealer Incentives 0.3 0.4 0.6 0.6 0.8 0.9 1.0 1.2 1.3 1.5 8.7 21%
G&A 0.5 0.6 0.6 0.6 0.7 0.7 0.8 0.8 0.9 1.0 7.2 7%
Manpower 1.7 1.9 2.3 2.6 3.0 3.4 3.9 4.5 5.2 6.0 34.5 15%
Total Expenses 44.8 48.9 52.1 55.7 60.1 65.0 70.7 77.0 84.3 92.4 651.0 8%
EBITDA (29.1) (17.7) (6.2) 5.5 12.8 18.2 24.3 32.3 41.8 53.3 135.1 7%
Depreciation 0.4 0.4 0.4 0.5 0.4 0.4 0.4 0.4 0.4 0.4 4.0 2%
EBIT (29.5) (18.1) (6.7) 5.0 12.4 17.8 23.9 31.9 41.4 52.8 131.1 7%
58- Confidential -
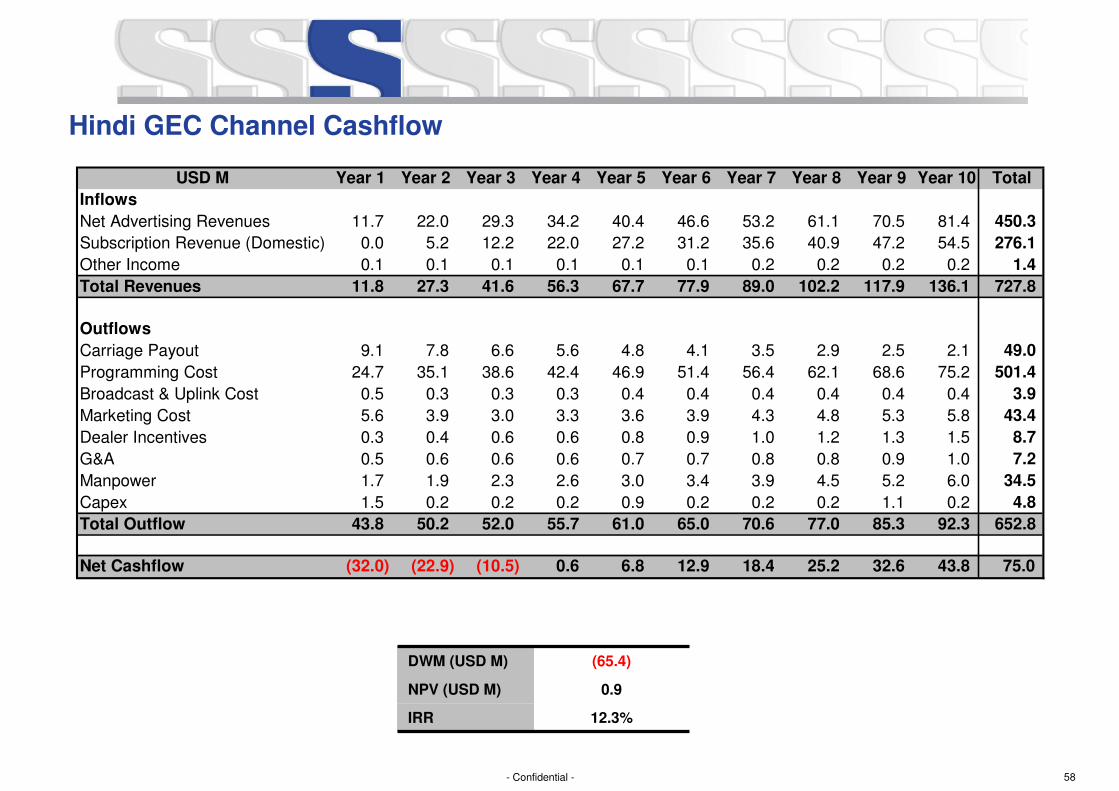
Hindi GEC Channel Cashflow
USD M Year 1 Year 2 Year 3 Year 4 Year 5 Year 6 Year 7 Year 8 Year 9 Year 10 Total
Inflows
Net Advertising Revenues 11.7 22.0 29.3 34.2 40.4 46.6 53.2 61.1 70.5 81.4 450.3
Subscription Revenue (Domestic) 0.0 5.2 12.2 22.0 27.2 31.2 35.6 40.9 47.2 54.5 276.1
Other Income 0.1 0.1 0.1 0.1 0.1 0.1 0.2 0.2 0.2 0.2 1.4
Total Revenues 11.8 27.3 41.6 56.3 67.7 77.9 89.0 102.2 117.9 136.1 727.8
Outflows
Carriage Payout 9.1 7.8 6.6 5.6 4.8 4.1 3.5 2.9 2.5 2.1 49.0
Programming Cost 24.7 35.1 38.6 42.4 46.9 51.4 56.4 62.1 68.6 75.2 501.4
Broadcast & Uplink Cost 0.5 0.3 0.3 0.3 0.4 0.4 0.4 0.4 0.4 0.4 3.9
Marketing Cost 5.6 3.9 3.0 3.3 3.6 3.9 4.3 4.8 5.3 5.8 43.4
Dealer Incentives 0.3 0.4 0.6 0.6 0.8 0.9 1.0 1.2 1.3 1.5 8.7
G&A 0.5 0.6 0.6 0.6 0.7 0.7 0.8 0.8 0.9 1.0 7.2
Manpower 1.7 1.9 2.3 2.6 3.0 3.4 3.9 4.5 5.2 6.0 34.5
Capex 1.5 0.2 0.2 0.2 0.9 0.2 0.2 0.2 1.1 0.2 4.8
Total Outflow 43.8 50.2 52.0 55.7 61.0 65.0 70.6 77.0 85.3 92.3 652.8
Net Cashflow (32.0) (22.9) (10.5) 0.6 6.8 12.9 18.4 25.2 32.6 43.8 75.0
DWM (USD M) (65.4)
NPV (USD M) 0.9
IRR 12.3%
59- Confidential -
Opportunity 2 – Free to Air GEC Plan
Strategic New Initiatives
60- Confidential -
Introduction to Free to Air channels (FTA)
FX rate: USD 1= INR 54.265
� There are over 300 Free-to-Air Channels in India, ranging from News to GECs
� FTA Channels are carried by a majority of cable operators in the Base Pack and by the DTH operators
DD Direct Plus – FTA platform
� DD Direct Plus from Doordarshan reaches out to 7m subscribers, at a one time cost of USD 28 (INR
1,500). All channels are FTA on the platform
� Offers 23 DD channels, 30 private channels, 20 All India Radio stations and 3 private FM stations
� Broadcasters were charged a minimum reserve price for e-auction of USD 276k (INR 1.5 Crs),
increased to USD 399k (INR 2.17 Crs) in 2012. The highest price offered was approx USD 645k (INR
3.5 Crs)
� Star Utsav, Sahara One and Zee Smile are the only major GEC channels available on DD Direct
� Dish TV is targeting the DD Subscribers by launching product “Dish Freedom Card” that allows users
of DD Direct to enjoy all DD Direct Plus channels and an additional 16 Dish Channels by paying USD
18 (INR 990) for card and free connection for year
― Further annual renewals are for USD 8 (INR 450) for 12 months
61- Confidential -
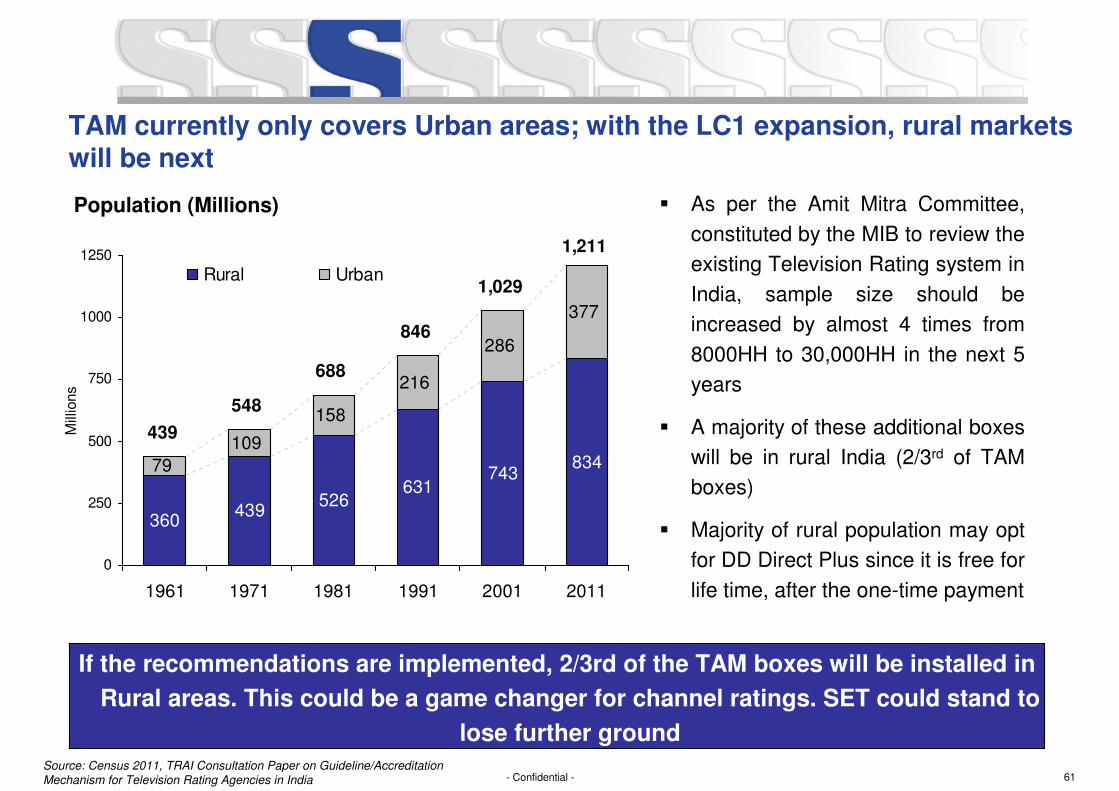
TAM currently only covers Urban areas; with the LC1 expansion, rural markets will be next
If the recommendations are implemented, 2/3rd of the TAM boxes will be installed in
Rural areas. This could be a game changer for channel ratings. SET could stand to
lose further ground
� As per the Amit Mitra Committee,
constituted by the MIB to review the
existing Television Rating system in
India, sample size should be
increased by almost 4 times from
8000HH to 30,000HH in the next 5
years
� A majority of these additional boxes
will be in rural India (2/3rd of TAM
boxes)
� Majority of rural population may opt
for DD Direct Plus since it is free for
life time, after the one-time payment
Source: Census 2011, TRAI Consultation Paper on Guideline/Accreditation
Mechanism for Television Rating Agencies in India
743834
109
158
286
377
439360
631526
216
79
1,211
548
439
846
1,029
688
0
250
500
750
1000
1250
1961 1971 1981 1991 2001 2011
Mill
ions
Rural Urban
Population (Millions)
62- Confidential -
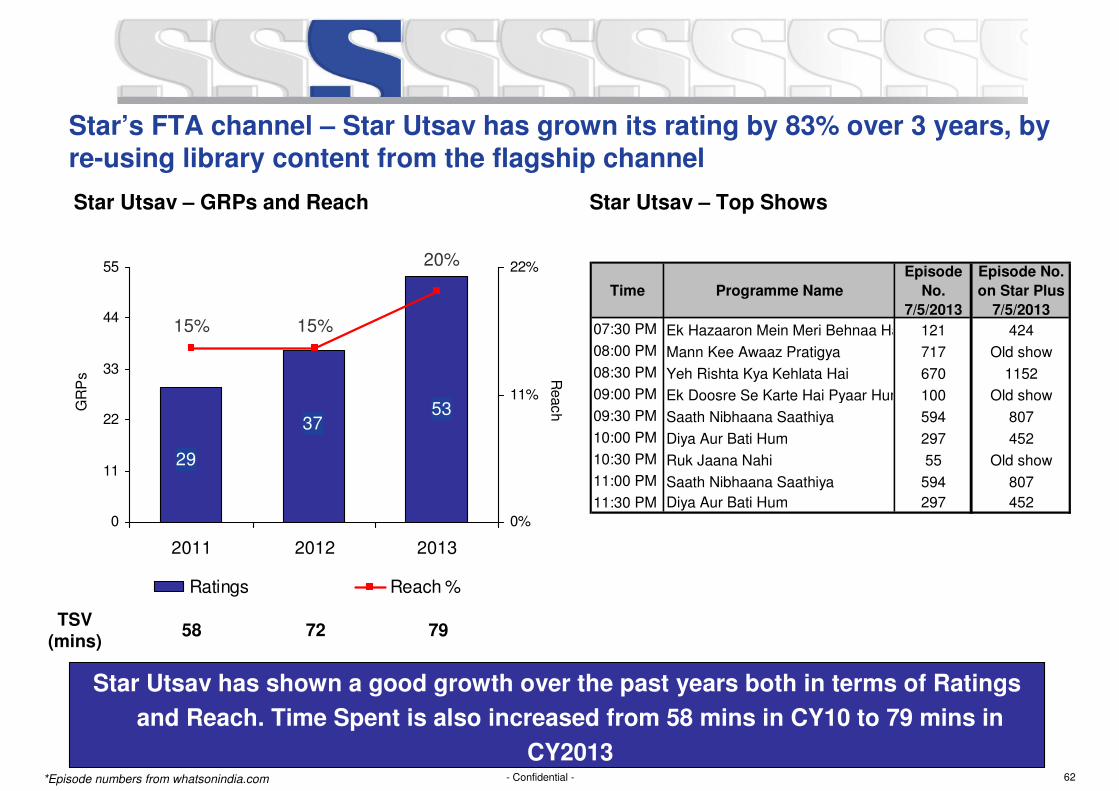
Star’s FTA channel – Star Utsav has grown its rating by 83% over 3 years, by re-using library content from the flagship channel
5337
29
15%
20%
15%
0
11
22
33
44
55
2011 2012 2013
GR
Ps
0%
11%
22%
Reach
Ratings Reach %
Time Programme Name
Episode
No.
7/5/2013
Episode No.
on Star Plus
7/5/2013
07:30 PM Ek Hazaaron Mein Meri Behnaa Hai 121 424
08:00 PM Mann Kee Awaaz Pratigya 717 Old show
08:30 PM Yeh Rishta Kya Kehlata Hai 670 1152
09:00 PM Ek Doosre Se Karte Hai Pyaar Hum 100 Old show
09:30 PM Saath Nibhaana Saathiya 594 807
10:00 PM Diya Aur Bati Hum 297 452
10:30 PM Ruk Jaana Nahi 55 Old show
11:00 PM Saath Nibhaana Saathiya 594 807
11:30 PM Diya Aur Bati Hum 297 452
*Episode numbers from whatsonindia.com
Star Utsav has shown a good growth over the past years both in terms of Ratings
and Reach. Time Spent is also increased from 58 mins in CY10 to 79 mins in
CY2013
Star Utsav – GRPs and Reach Star Utsav – Top Shows
TSV
(mins)58 72 79
63- Confidential -
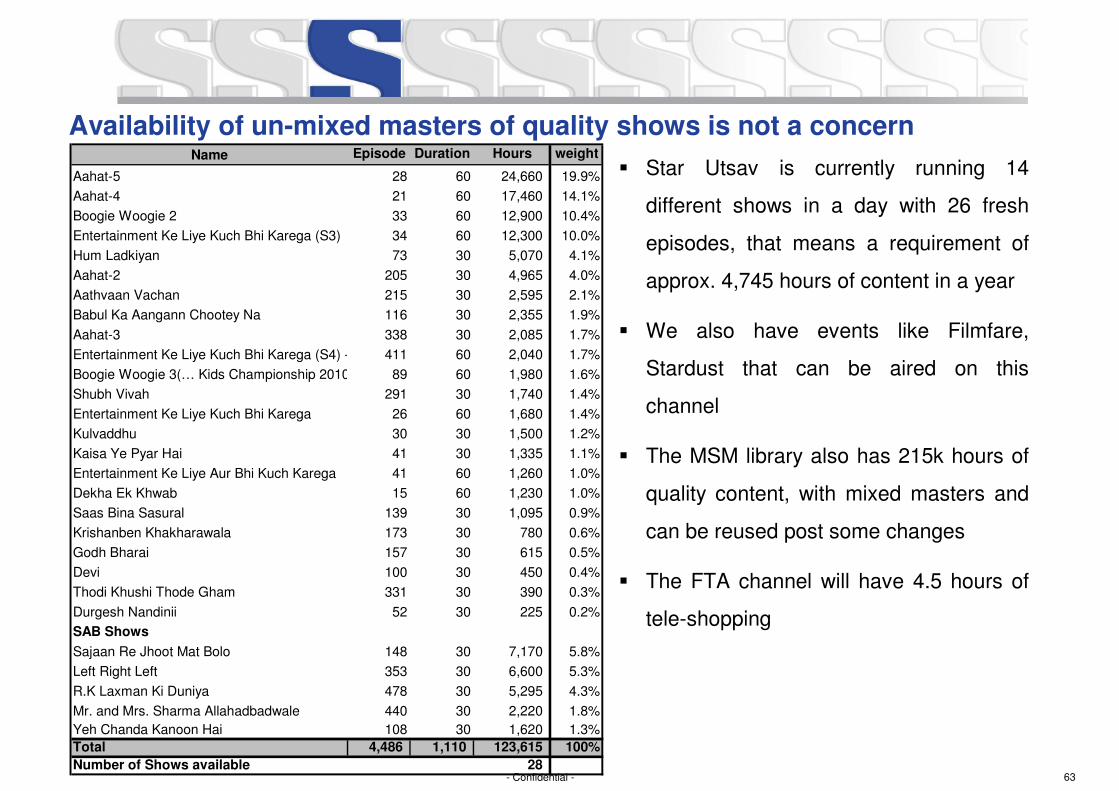
� Star Utsav is currently running 14
different shows in a day with 26 fresh
episodes, that means a requirement of
approx. 4,745 hours of content in a year
� We also have events like Filmfare,
Stardust that can be aired on this
channel
� The MSM library also has 215k hours of
quality content, with mixed masters and
can be reused post some changes
� The FTA channel will have 4.5 hours of
tele-shopping
Name Episode Duration Hours weight
Aahat-5 28 60 24,660 19.9%
Aahat-4 21 60 17,460 14.1%
Boogie Woogie 2 33 60 12,900 10.4%
Entertainment Ke Liye Kuch Bhi Karega (S3) 34 60 12,300 10.0%
Hum Ladkiyan 73 30 5,070 4.1%
Aahat-2 205 30 4,965 4.0%
Aathvaan Vachan 215 30 2,595 2.1%
Babul Ka Aangann Chootey Na 116 30 2,355 1.9%
Aahat-3 338 30 2,085 1.7%
Entertainment Ke Liye Kuch Bhi Karega (S4) - Eps 40 & 41 - 2 hrs each411 60 2,040 1.7%
Boogie Woogie 3(… Kids Championship 2010) 89 60 1,980 1.6%
Shubh Vivah 291 30 1,740 1.4%
Entertainment Ke Liye Kuch Bhi Karega 26 60 1,680 1.4%
Kulvaddhu 30 30 1,500 1.2%
Kaisa Ye Pyar Hai 41 30 1,335 1.1%
Entertainment Ke Liye Aur Bhi Kuch Karega 41 60 1,260 1.0%
Dekha Ek Khwab 15 60 1,230 1.0%
Saas Bina Sasural 139 30 1,095 0.9%
Krishanben Khakharawala 173 30 780 0.6%
Godh Bharai 157 30 615 0.5%
Devi 100 30 450 0.4%
Thodi Khushi Thode Gham 331 30 390 0.3%
Durgesh Nandinii 52 30 225 0.2%
SAB Shows
Sajaan Re Jhoot Mat Bolo 148 30 7,170 5.8%
Left Right Left 353 30 6,600 5.3%
R.K Laxman Ki Duniya 478 30 5,295 4.3%
Mr. and Mrs. Sharma Allahadbadwale 440 30 2,220 1.8%
Yeh Chanda Kanoon Hai 108 30 1,620 1.3%
Total 4,486 1,110 123,615 100%
Number of Shows available 28
Availability of un-mixed masters of quality shows is not a concern
64- Confidential -
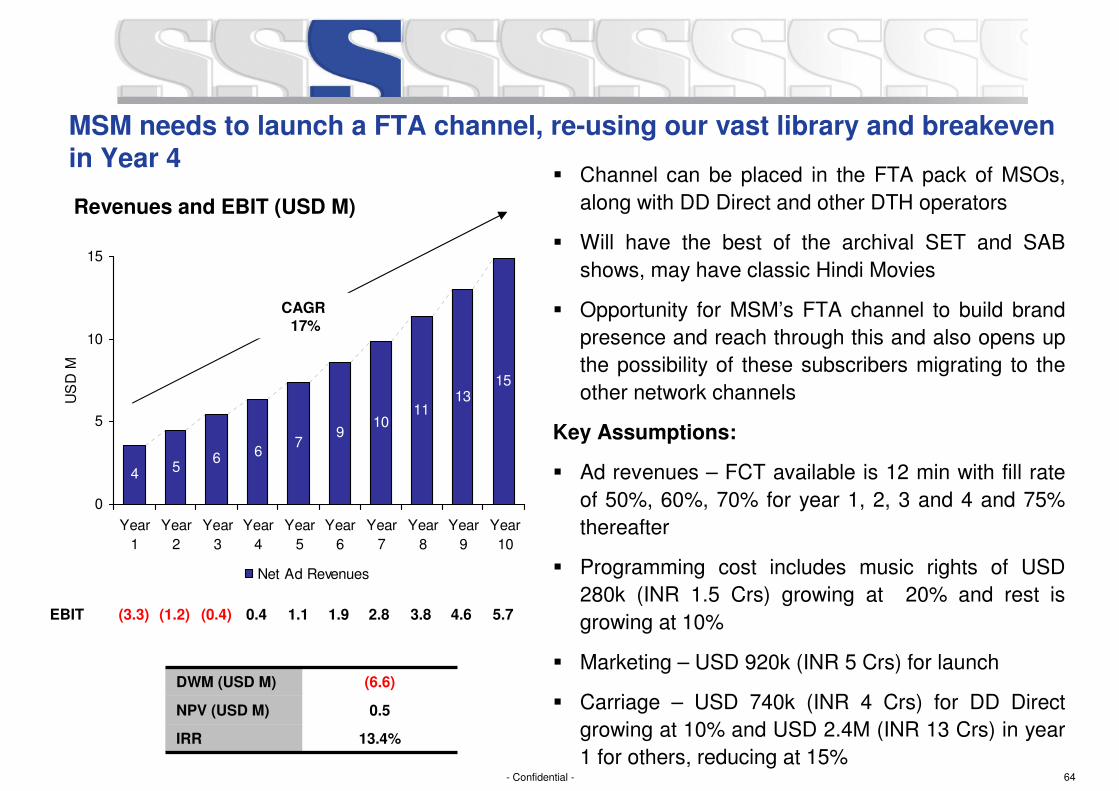
MSM needs to launch a FTA channel, re-using our vast library and breakeven in Year 4
79
1011
1315
54
66
0
5
10
15
Year
1
Year
2
Year
3
Year
4
Year
5
Year
6
Year
7
Year
8
Year
9
Year
10
US
D M
Net Ad Revenues
DWM (USD M) (6.6)
NPV (USD M) 0.5
IRR 13.4%
EBIT (3.3) (1.2) 5.7
CAGR 17%
(0.4) 0.4 1.1 1.9 2.8 3.8 4.6
Revenues and EBIT (USD M)
� Channel can be placed in the FTA pack of MSOs,
along with DD Direct and other DTH operators
� Will have the best of the archival SET and SAB
shows, may have classic Hindi Movies
� Opportunity for MSM’s FTA channel to build brand
presence and reach through this and also opens up
the possibility of these subscribers migrating to the
other network channels
Key Assumptions:
� Ad revenues – FCT available is 12 min with fill rate
of 50%, 60%, 70% for year 1, 2, 3 and 4 and 75%
thereafter
� Programming cost includes music rights of USD
280k (INR 1.5 Crs) growing at 20% and rest is
growing at 10%
� Marketing – USD 920k (INR 5 Crs) for launch
� Carriage – USD 740k (INR 4 Crs) for DD Direct
growing at 10% and USD 2.4M (INR 13 Crs) in year
1 for others, reducing at 15%
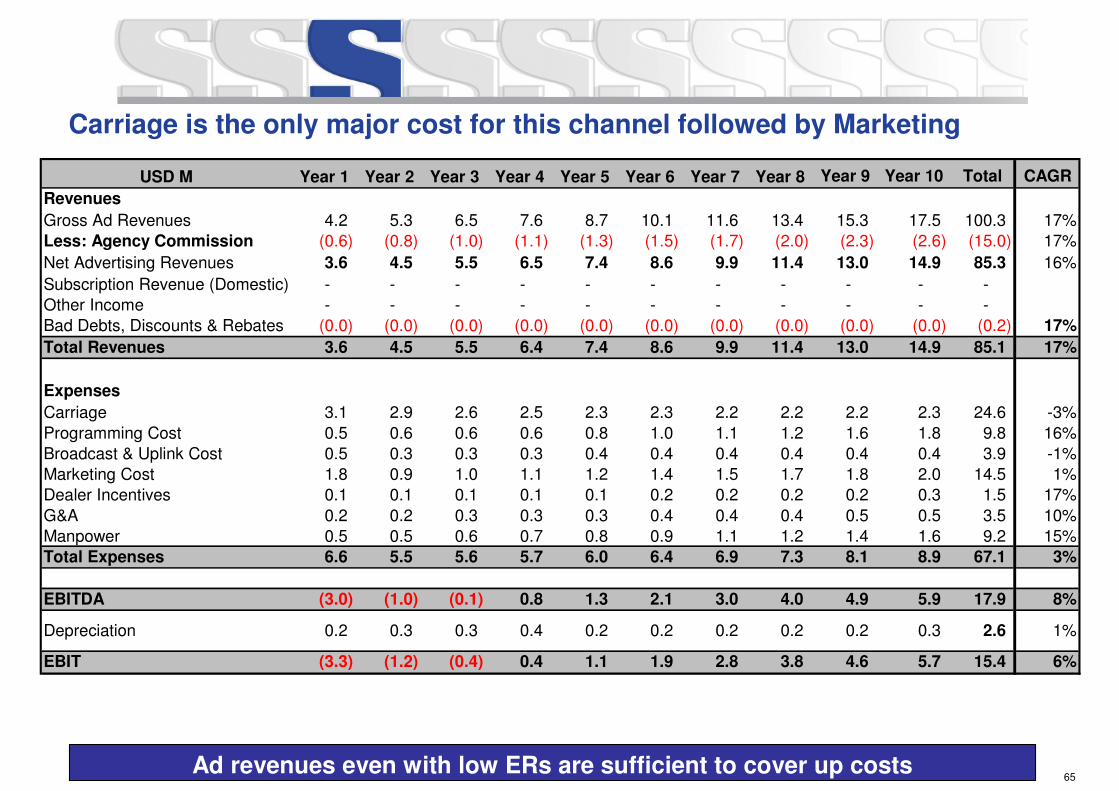
65- Confidential -Ad revenues even with low ERs are sufficient to cover up costs
Carriage is the only major cost for this channel followed by Marketing
USD M Year 1 Year 2 Year 3 Year 4 Year 5 Year 6 Year 7 Year 8 Year 9 Year 10 Total CAGR
Revenues
Gross Ad Revenues 4.2 5.3 6.5 7.6 8.7 10.1 11.6 13.4 15.3 17.5 100.3 17%
Less: Agency Commission (0.6) (0.8) (1.0) (1.1) (1.3) (1.5) (1.7) (2.0) (2.3) (2.6) (15.0) 17%
Net Advertising Revenues 3.6 4.5 5.5 6.5 7.4 8.6 9.9 11.4 13.0 14.9 85.3 16%
Subscription Revenue (Domestic) - - - - - - - - - - -
Other Income - - - - - - - - - - -
Bad Debts, Discounts & Rebates (0.0) (0.0) (0.0) (0.0) (0.0) (0.0) (0.0) (0.0) (0.0) (0.0) (0.2) 17%
Total Revenues 3.6 4.5 5.5 6.4 7.4 8.6 9.9 11.4 13.0 14.9 85.1 17%
Expenses
Carriage 3.1 2.9 2.6 2.5 2.3 2.3 2.2 2.2 2.2 2.3 24.6 -3%
Programming Cost 0.5 0.6 0.6 0.6 0.8 1.0 1.1 1.2 1.6 1.8 9.8 16%
Broadcast & Uplink Cost 0.5 0.3 0.3 0.3 0.4 0.4 0.4 0.4 0.4 0.4 3.9 -1%
Marketing Cost 1.8 0.9 1.0 1.1 1.2 1.4 1.5 1.7 1.8 2.0 14.5 1%
Dealer Incentives 0.1 0.1 0.1 0.1 0.1 0.2 0.2 0.2 0.2 0.3 1.5 17%
G&A 0.2 0.2 0.3 0.3 0.3 0.4 0.4 0.4 0.5 0.5 3.5 10%
Manpower 0.5 0.5 0.6 0.7 0.8 0.9 1.1 1.2 1.4 1.6 9.2 15%
Total Expenses 6.6 5.5 5.6 5.7 6.0 6.4 6.9 7.3 8.1 8.9 67.1 3%
EBITDA (3.0) (1.0) (0.1) 0.8 1.3 2.1 3.0 4.0 4.9 5.9 17.9 8%
Depreciation 0.2 0.3 0.3 0.4 0.2 0.2 0.2 0.2 0.2 0.3 2.6 1%
EBIT (3.3) (1.2) (0.4) 0.4 1.1 1.9 2.8 3.8 4.6 5.7 15.4 6%
66- Confidential -
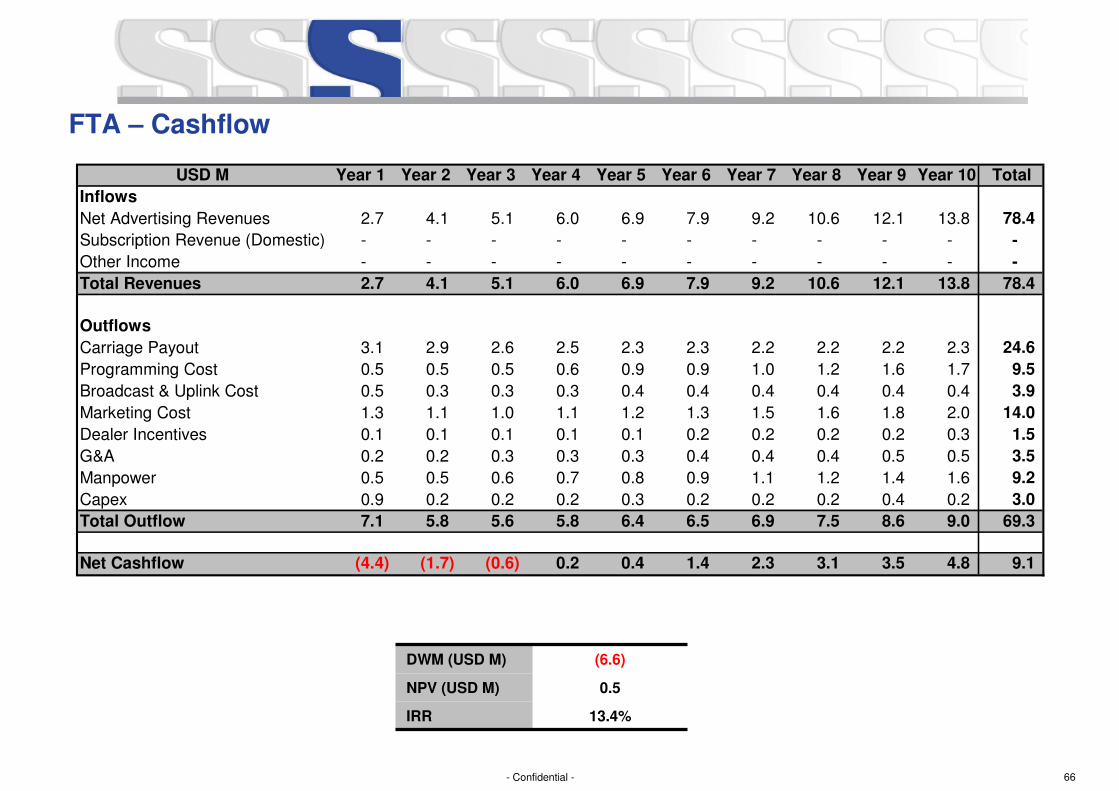
FTA – Cashflow
USD M Year 1 Year 2 Year 3 Year 4 Year 5 Year 6 Year 7 Year 8 Year 9 Year 10 Total
Inflows
Net Advertising Revenues 2.7 4.1 5.1 6.0 6.9 7.9 9.2 10.6 12.1 13.8 78.4
Subscription Revenue (Domestic) - - - - - - - - - - -
Other Income - - - - - - - - - - -
Total Revenues 2.7 4.1 5.1 6.0 6.9 7.9 9.2 10.6 12.1 13.8 78.4
Outflows
Carriage Payout 3.1 2.9 2.6 2.5 2.3 2.3 2.2 2.2 2.2 2.3 24.6
Programming Cost 0.5 0.5 0.5 0.6 0.9 0.9 1.0 1.2 1.6 1.7 9.5
Broadcast & Uplink Cost 0.5 0.3 0.3 0.3 0.4 0.4 0.4 0.4 0.4 0.4 3.9
Marketing Cost 1.3 1.1 1.0 1.1 1.2 1.3 1.5 1.6 1.8 2.0 14.0
Dealer Incentives 0.1 0.1 0.1 0.1 0.1 0.2 0.2 0.2 0.2 0.3 1.5
G&A 0.2 0.2 0.3 0.3 0.3 0.4 0.4 0.4 0.5 0.5 3.5
Manpower 0.5 0.5 0.6 0.7 0.8 0.9 1.1 1.2 1.4 1.6 9.2
Capex 0.9 0.2 0.2 0.2 0.3 0.2 0.2 0.2 0.4 0.2 3.0
Total Outflow 7.1 5.8 5.6 5.8 6.4 6.5 6.9 7.5 8.6 9.0 69.3
Net Cashflow (4.4) (1.7) (0.6) 0.2 0.4 1.4 2.3 3.1 3.5 4.8 9.1
DWM (USD M) (6.6)
NPV (USD M) 0.5
IRR 13.4%
67- Confidential -
Opportunity 3 – Male focused Hindi Entertainment Channel
Strategic New Initiatives
68- Confidential -
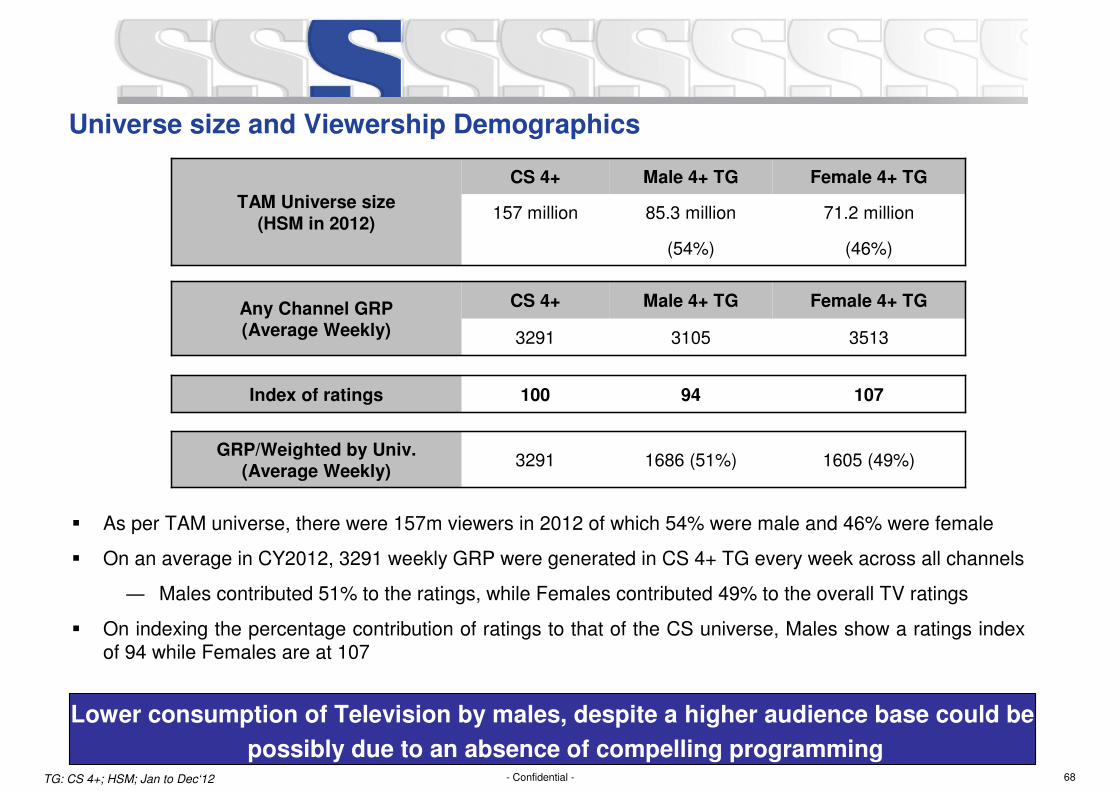
Universe size and Viewership Demographics
� As per TAM universe, there were 157m viewers in 2012 of which 54% were male and 46% were female
� On an average in CY2012, 3291 weekly GRP were generated in CS 4+ TG every week across all channels
― Males contributed 51% to the ratings, while Females contributed 49% to the overall TV ratings
� On indexing the percentage contribution of ratings to that of the CS universe, Males show a ratings index of 94 while Females are at 107
TG: CS 4+; HSM; Jan to Dec‘12
TAM Universe size
(HSM in 2012)
CS 4+ Male 4+ TG Female 4+ TG
157 million 85.3 million 71.2 million
(54%) (46%)
Any Channel GRP (Average Weekly)
CS 4+ Male 4+ TG Female 4+ TG
3291 3105 3513
Index of ratings 100 94 107
GRP/Weighted by Univ.(Average Weekly)
3291 1686 (51%) 1605 (49%)
Lower consumption of Television by males, despite a higher audience base could be
possibly due to an absence of compelling programming
69- Confidential -
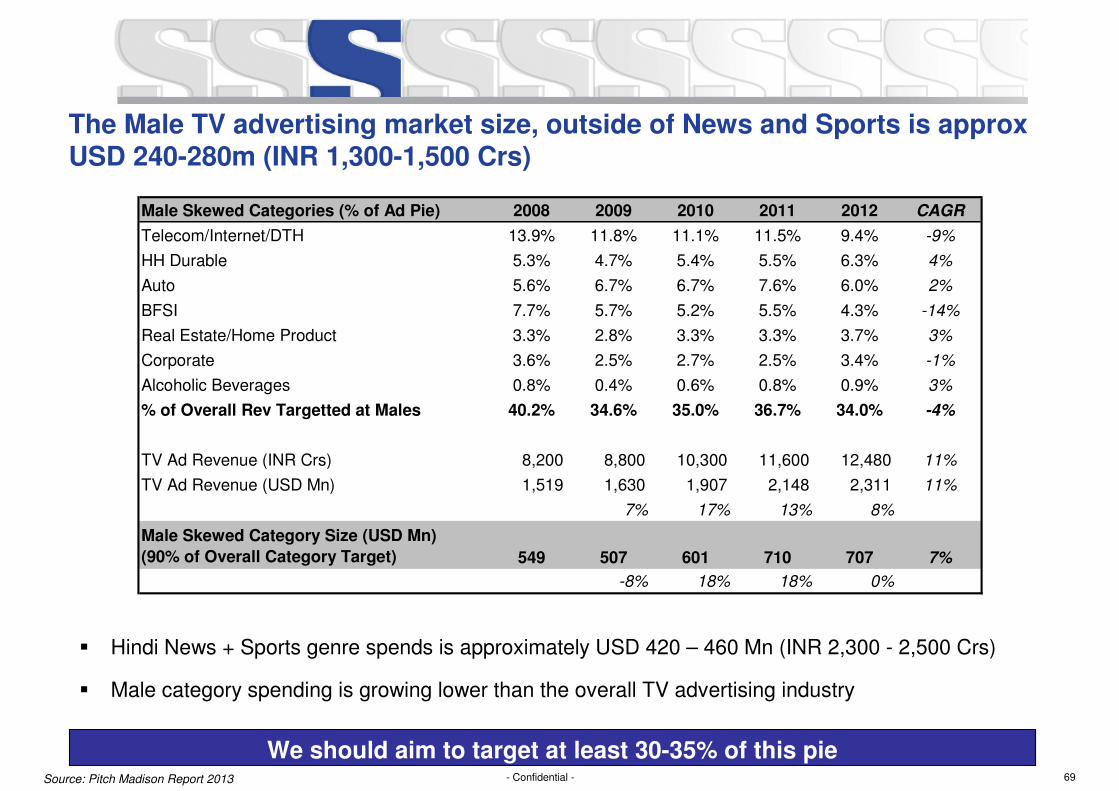
� Hindi News + Sports genre spends is approximately USD 420 – 460 Mn (INR 2,300 - 2,500 Crs)
� Male category spending is growing lower than the overall TV advertising industry
The Male TV advertising market size, outside of News and Sports is approx USD 240-280m (INR 1,300-1,500 Crs)
Source: Pitch Madison Report 2013
We should aim to target at least 30-35% of this pie
Male Skewed Categories (% of Ad Pie) 2008 2009 2010 2011 2012 CAGR
Telecom/Internet/DTH 13.9% 11.8% 11.1% 11.5% 9.4% -9%
HH Durable 5.3% 4.7% 5.4% 5.5% 6.3% 4%
Auto 5.6% 6.7% 6.7% 7.6% 6.0% 2%
BFSI 7.7% 5.7% 5.2% 5.5% 4.3% -14%
Real Estate/Home Product 3.3% 2.8% 3.3% 3.3% 3.7% 3%
Corporate 3.6% 2.5% 2.7% 2.5% 3.4% -1%
Alcoholic Beverages 0.8% 0.4% 0.6% 0.8% 0.9% 3%
% of Overall Rev Targetted at Males 40.2% 34.6% 35.0% 36.7% 34.0% -4%
TV Ad Revenue (INR Crs) 8,200 8,800 10,300 11,600 12,480 11%
TV Ad Revenue (USD Mn) 1,519 1,630 1,907 2,148 2,311 11%
7% 17% 13% 8%
Male Skewed Category Size (USD Mn)
(90% of Overall Category Target) 549 507 601 710 707 7%
-8% 18% 18% 0%
70- Confidential -
Others
8%Z Classic
4%
UTV Action
7%
Star Gold
18%
Z Action
3%
Movies OK
10%
Z Cinema
20%
MAX
20%
UTV Movies
8%
FILMY
2%
Youth and
Music
5%
Sports
4%
Hindi GEC
37%
Hindi Movies
21%
Hindi News
6%
Others
11%
Maharashtra
Regional
6%
Bangla
Regional
4%
Infotainment
2%Kids
4%
Sahara
One
3%
Others
2%DD
National
2%
SET
16%
SAB
12%
Zee
15%
Colors
16%
Star Plus
19%Star Utsav
4%
Life OK
11%
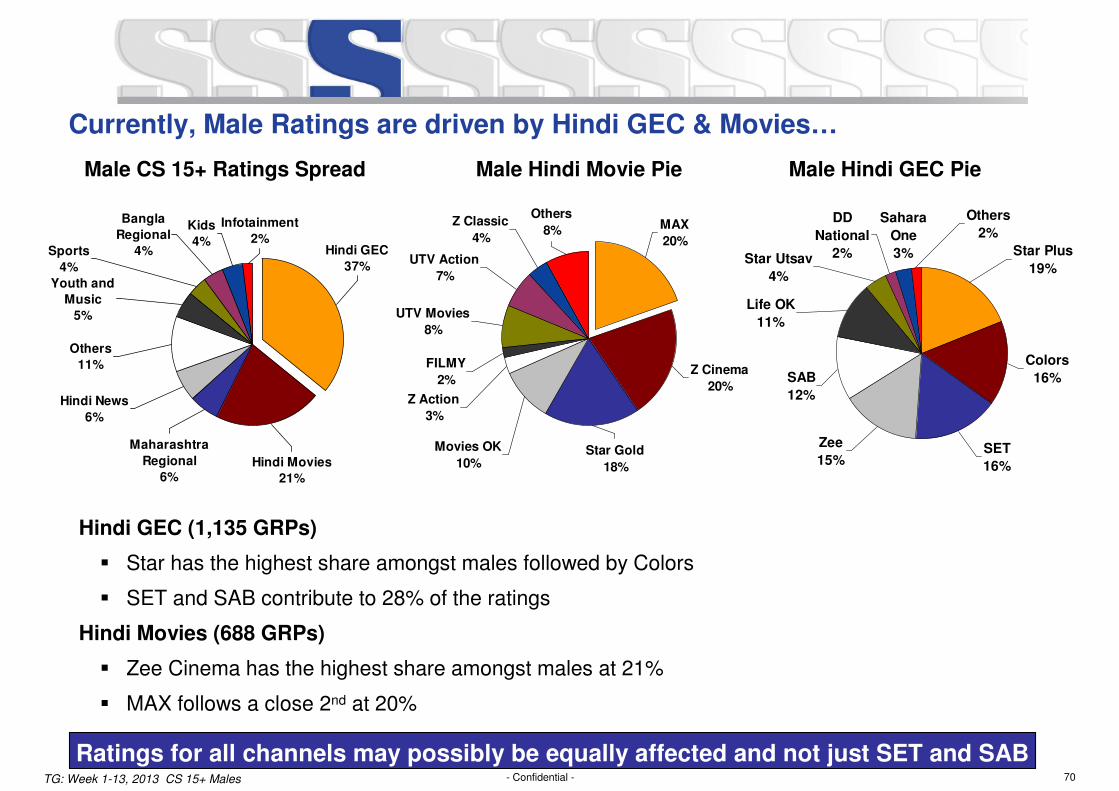
Hindi GEC (1,135 GRPs)
� Star has the highest share amongst males followed by Colors
� SET and SAB contribute to 28% of the ratings
Hindi Movies (688 GRPs)
� Zee Cinema has the highest share amongst males at 21%
� MAX follows a close 2nd at 20%
Currently, Male Ratings are driven by Hindi GEC & Movies…
Male CS 15+ Ratings Spread Male Hindi Movie Pie Male Hindi GEC Pie
TG: Week 1-13, 2013 CS 15+ Males
Ratings for all channels may possibly be equally affected and not just SET and SAB
71- Confidential -
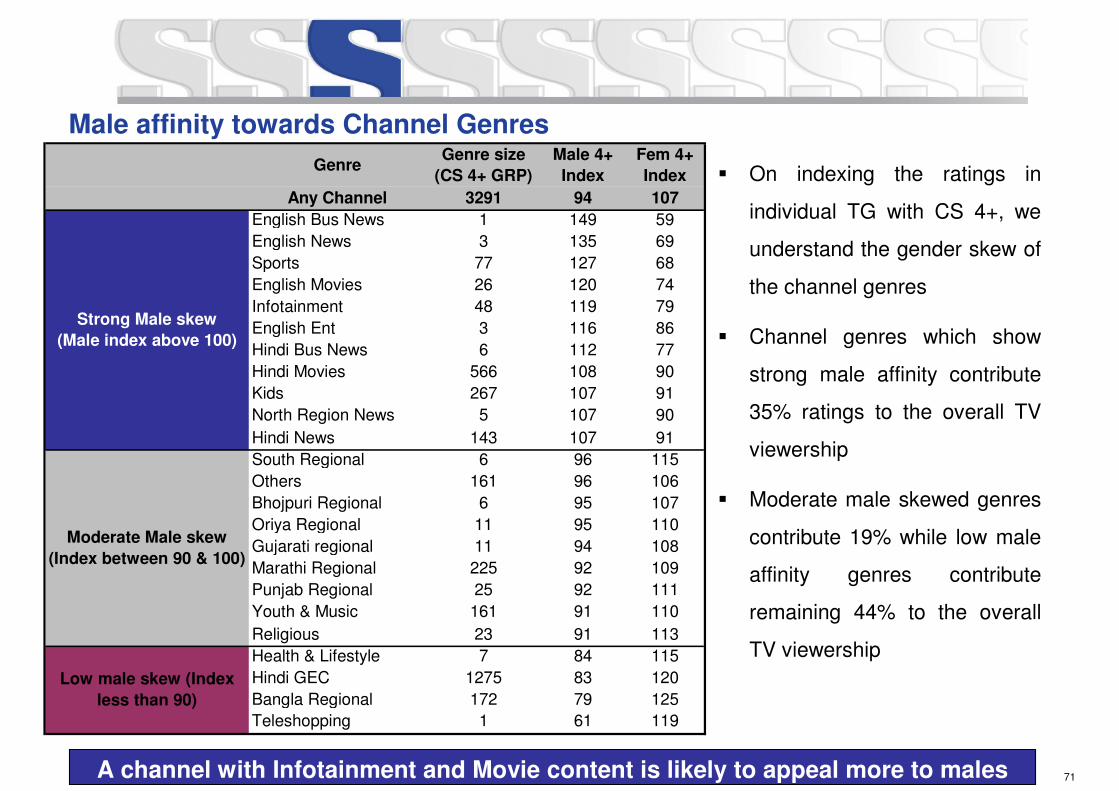
Male affinity towards Channel Genres
� On indexing the ratings in
individual TG with CS 4+, we
understand the gender skew of
the channel genres
� Channel genres which show
strong male affinity contribute
35% ratings to the overall TV
viewership
� Moderate male skewed genres
contribute 19% while low male
affinity genres contribute
remaining 44% to the overall
TV viewership
GenreGenre size
(CS 4+ GRP)
Male 4+
Index
Fem 4+
Index
Any Channel 3291 94 107
English Bus News 1 149 59
English News 3 135 69
Sports 77 127 68
English Movies 26 120 74
Infotainment 48 119 79
English Ent 3 116 86
Hindi Bus News 6 112 77
Hindi Movies 566 108 90
Kids 267 107 91
North Region News 5 107 90
Hindi News 143 107 91
South Regional 6 96 115
Others 161 96 106
Bhojpuri Regional 6 95 107
Oriya Regional 11 95 110
Gujarati regional 11 94 108
Marathi Regional 225 92 109
Punjab Regional 25 92 111
Youth & Music 161 91 110
Religious 23 91 113
Health & Lifestyle 7 84 115
Hindi GEC 1275 83 120
Bangla Regional 172 79 125
Teleshopping 1 61 119
Strong Male skew
(Male index above 100)
Moderate Male skew
(Index between 90 & 100)
Low male skew (Index
less than 90)
A channel with Infotainment and Movie content is likely to appeal more to males
72- Confidential -
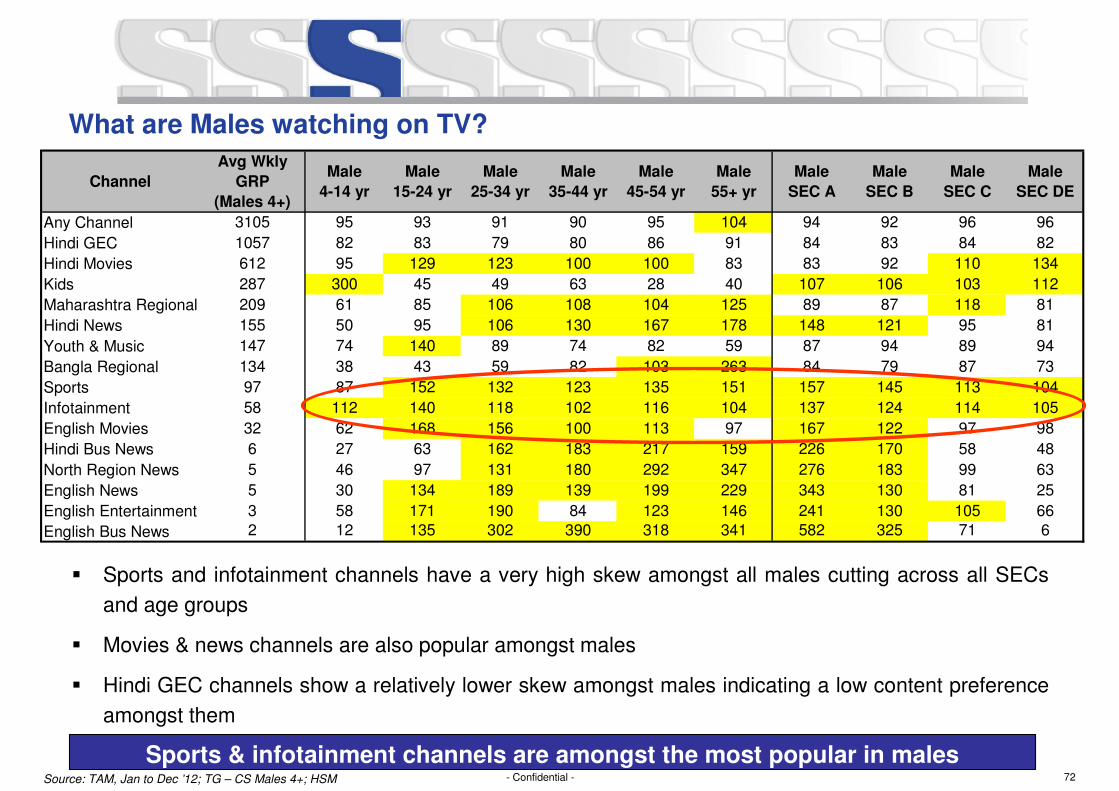
What are Males watching on TV?
� Sports and infotainment channels have a very high skew amongst all males cutting across all SECs
and age groups
� Movies & news channels are also popular amongst males
� Hindi GEC channels show a relatively lower skew amongst males indicating a low content preference
amongst them
Source: TAM, Jan to Dec ’12; TG – CS Males 4+; HSM
Channel
Avg Wkly
GRP
(Males 4+)
Male
4-14 yr
Male
15-24 yr
Male
25-34 yr
Male
35-44 yr
Male
45-54 yr
Male
55+ yr
Male
SEC A
Male
SEC B
Male
SEC C
Male
SEC DE
Any Channel 3105 95 93 91 90 95 104 94 92 96 96
Hindi GEC 1057 82 83 79 80 86 91 84 83 84 82
Hindi Movies 612 95 129 123 100 100 83 83 92 110 134
Kids 287 300 45 49 63 28 40 107 106 103 112
Maharashtra Regional 209 61 85 106 108 104 125 89 87 118 81
Hindi News 155 50 95 106 130 167 178 148 121 95 81
Youth & Music 147 74 140 89 74 82 59 87 94 89 94
Bangla Regional 134 38 43 59 82 103 263 84 79 87 73
Sports 97 87 152 132 123 135 151 157 145 113 104
Infotainment 58 112 140 118 102 116 104 137 124 114 105
English Movies 32 62 168 156 100 113 97 167 122 97 98
Hindi Bus News 6 27 63 162 183 217 159 226 170 58 48
North Region News 5 46 97 131 180 292 347 276 183 99 63
English News 5 30 134 189 139 199 229 343 130 81 25
English Entertainment 3 58 171 190 84 123 146 241 130 105 66
English Bus News 2 12 135 302 390 318 341 582 325 71 6
Sports & infotainment channels are amongst the most popular in males
73- Confidential -
Language-GenresWkly
GRP
Male
4-14 yr
Male
15-24 yr
Male
25-34 yr
Male
35-44 yr
Male
45-54 yr
Male
55+ yr
Male
SEC A
Male
SEC B
Male
SEC C
Male
SEC DE
Hindi-Serials 534 72 73 69 71 79 89 75 72 75 74
Hindi-Feature Films 479 95 124 115 94 95 80 82 89 107 125
Hindi-Comedies 131 131 102 82 92 96 81 104 112 104 89
Hindi-Action/Thriller 126 82 97 107 99 94 95 90 95 97 96
Dubbed Hindi-Feature Films 120 97 142 133 96 97 78 82 94 115 141
English-Cricket Match 109 87 140 133 129 129 140 147 139 112 104
Marathi-Serials 79 56 77 97 92 95 132 86 80 109 73
Hindi-Film Songs 72 71 123 93 79 87 65 76 89 85 101
Bengali-Serials 61 35 36 45 69 80 241 67 68 74 65
Hindi-Mythos/Costume Dramas 46 80 87 85 86 101 132 90 91 96 89
Hindi-Talent Search/Feats 46 83 100 84 80 94 78 97 89 88 80
Marathi-Feature Films 37 78 97 116 114 86 92 75 88 131 94
Hindi-Reality Shows 29 63 111 83 68 95 86 116 93 83 60
Marathi-News Bulletin 20 51 98 127 139 143 150 112 106 129 91
Hindi-Events/Concerts/Awards 18 79 89 79 79 90 85 95 87 82 73
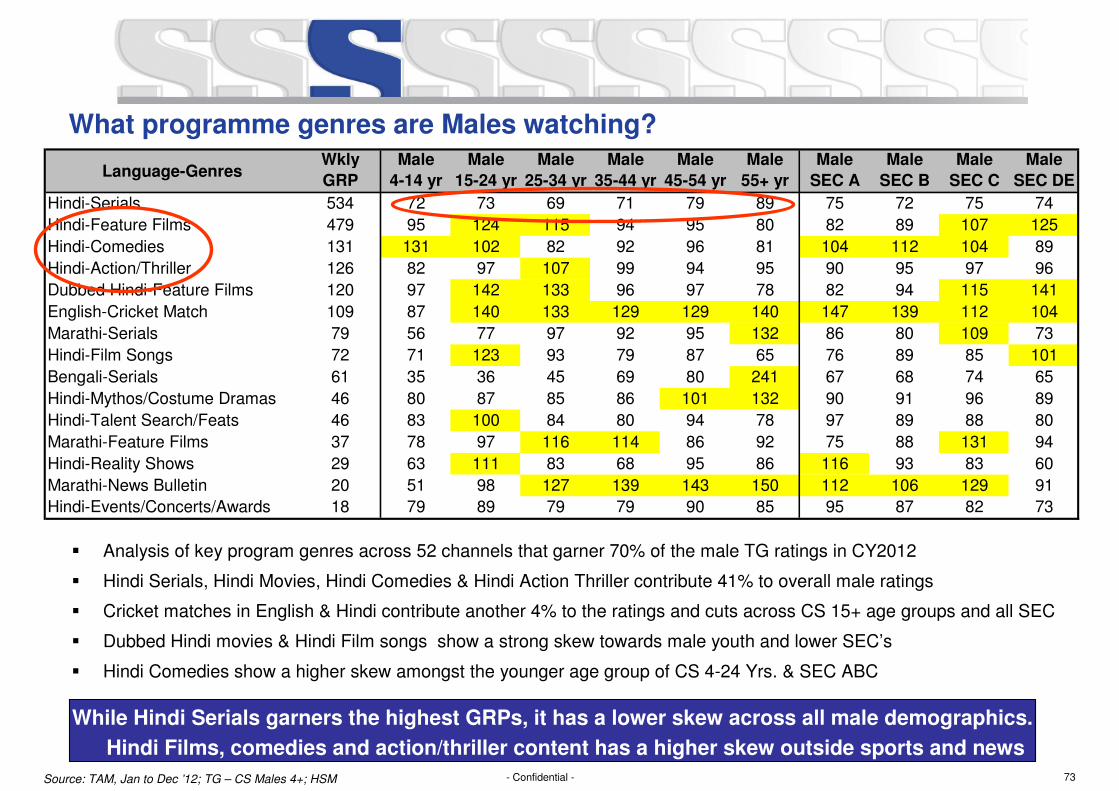
What programme genres are Males watching?
� Analysis of key program genres across 52 channels that garner 70% of the male TG ratings in CY2012
� Hindi Serials, Hindi Movies, Hindi Comedies & Hindi Action Thriller contribute 41% to overall male ratings
� Cricket matches in English & Hindi contribute another 4% to the ratings and cuts across CS 15+ age groups and all SEC
� Dubbed Hindi movies & Hindi Film songs show a strong skew towards male youth and lower SEC’s
� Hindi Comedies show a higher skew amongst the younger age group of CS 4-24 Yrs. & SEC ABC
Source: TAM, Jan to Dec ’12; TG – CS Males 4+; HSM
While Hindi Serials garners the highest GRPs, it has a lower skew across all male demographics.
Hindi Films, comedies and action/thriller content has a higher skew outside sports and news
74- Confidential -
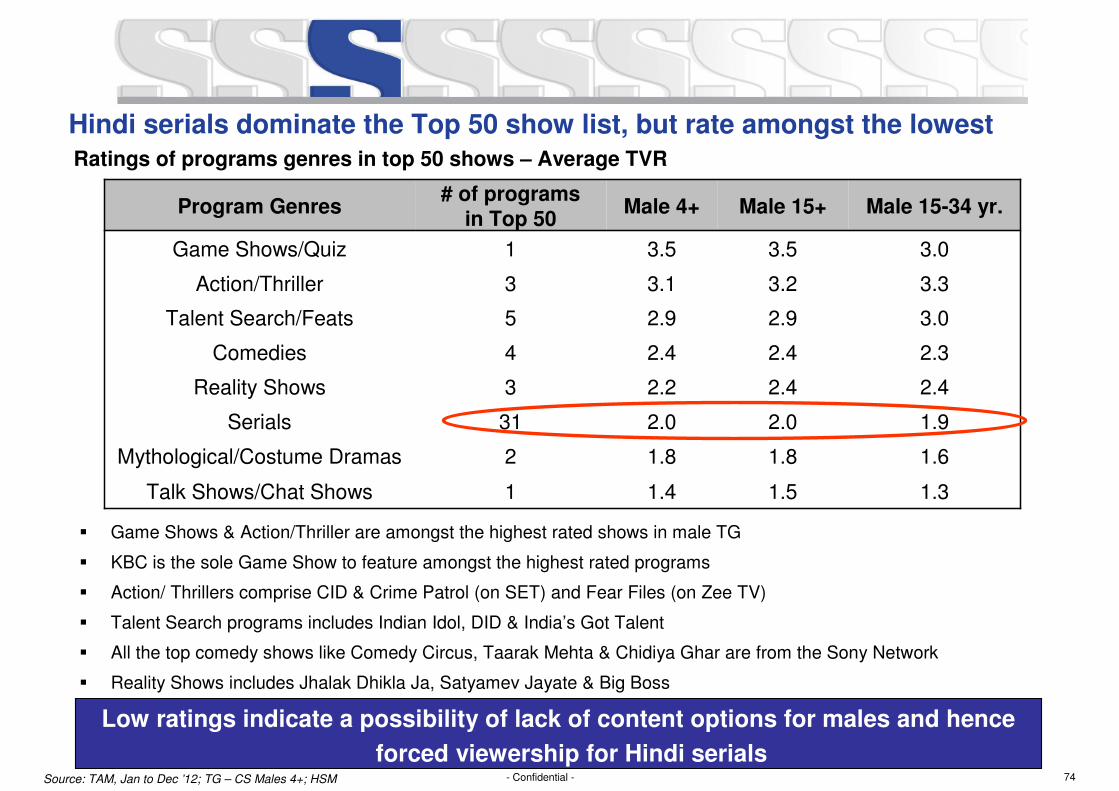
Hindi serials dominate the Top 50 show list, but rate amongst the lowest
Source: TAM, Jan to Dec ’12; TG – CS Males 4+; HSM
Ratings of programs genres in top 50 shows – Average TVR
Program Genres# of programs
in Top 50Male 4+ Male 15+ Male 15-34 yr.
Game Shows/Quiz 1 3.5 3.5 3.0
Action/Thriller 3 3.1 3.2 3.3
Talent Search/Feats 5 2.9 2.9 3.0
Comedies 4 2.4 2.4 2.3
Reality Shows 3 2.2 2.4 2.4
Serials 31 2.0 2.0 1.9
Mythological/Costume Dramas 2 1.8 1.8 1.6
Talk Shows/Chat Shows 1 1.4 1.5 1.3
� Game Shows & Action/Thriller are amongst the highest rated shows in male TG
� KBC is the sole Game Show to feature amongst the highest rated programs
� Action/ Thrillers comprise CID & Crime Patrol (on SET) and Fear Files (on Zee TV)
� Talent Search programs includes Indian Idol, DID & India’s Got Talent
� All the top comedy shows like Comedy Circus, Taarak Mehta & Chidiya Ghar are from the Sony Network
� Reality Shows includes Jhalak Dhikla Ja, Satyamev Jayate & Big Boss
Low ratings indicate a possibility of lack of content options for males and hence
forced viewership for Hindi serials
75- Confidential -
The Average male doesn’t have one dedicated Entertainment channel catered to his needs…
� Channel for the 15+ Males in the HSM Markets
� Content would be a mix of Original Programming (Action, Thriller, Infotainment) and Movies
� Male audiences don’t have content focused towards them. This would be a channel for them to
have their daily dose of entertainment
� Sports & News command higher ERs for reaching out to this audience
� Create a platform for Advertisers to reach out to the Male audience outside the traditional News/
Sports genre and charge a premium for this
Create a new GEC channel targeted to the Hindi speaking males
76- Confidential -
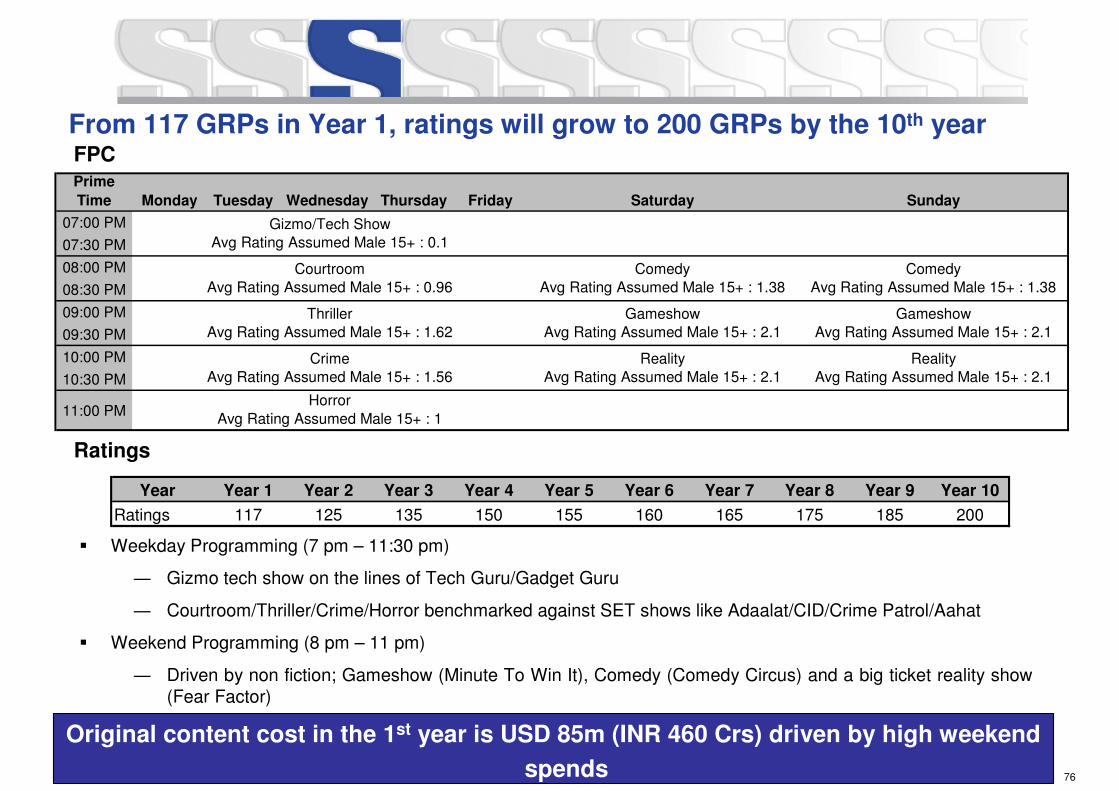
� Weekday Programming (7 pm – 11:30 pm)
― Gizmo tech show on the lines of Tech Guru/Gadget Guru
― Courtroom/Thriller/Crime/Horror benchmarked against SET shows like Adaalat/CID/Crime Patrol/Aahat
� Weekend Programming (8 pm – 11 pm)
― Driven by non fiction; Gameshow (Minute To Win It), Comedy (Comedy Circus) and a big ticket reality show (Fear Factor)
From 117 GRPs in Year 1, ratings will grow to 200 GRPs by the 10th yearFPC
Original content cost in the 1st year is USD 85m (INR 460 Crs) driven by high weekend
spends
Year Year 1 Year 2 Year 3 Year 4 Year 5 Year 6 Year 7 Year 8 Year 9 Year 10
Ratings 117 125 135 150 155 160 165 175 185 200
Ratings
Prime
Time Monday Tuesday Wednesday Thursday Friday Saturday Sunday
07:00 PM
07:30 PM
08:00 PM
08:30 PM
09:00 PM
09:30 PM
10:00 PM
10:30 PM
11:00 PMHorror
Avg Rating Assumed Male 15+ : 1
Thriller
Avg Rating Assumed Male 15+ : 1.62
Gameshow
Avg Rating Assumed Male 15+ : 2.1
Gameshow
Avg Rating Assumed Male 15+ : 2.1
Crime
Avg Rating Assumed Male 15+ : 1.56
Reality
Avg Rating Assumed Male 15+ : 2.1
Reality
Avg Rating Assumed Male 15+ : 2.1
Gizmo/Tech Show
Avg Rating Assumed Male 15+ : 0.1
Courtroom
Avg Rating Assumed Male 15+ : 0.96
Comedy
Avg Rating Assumed Male 15+ : 1.38
Comedy
Avg Rating Assumed Male 15+ : 1.38
77- Confidential -
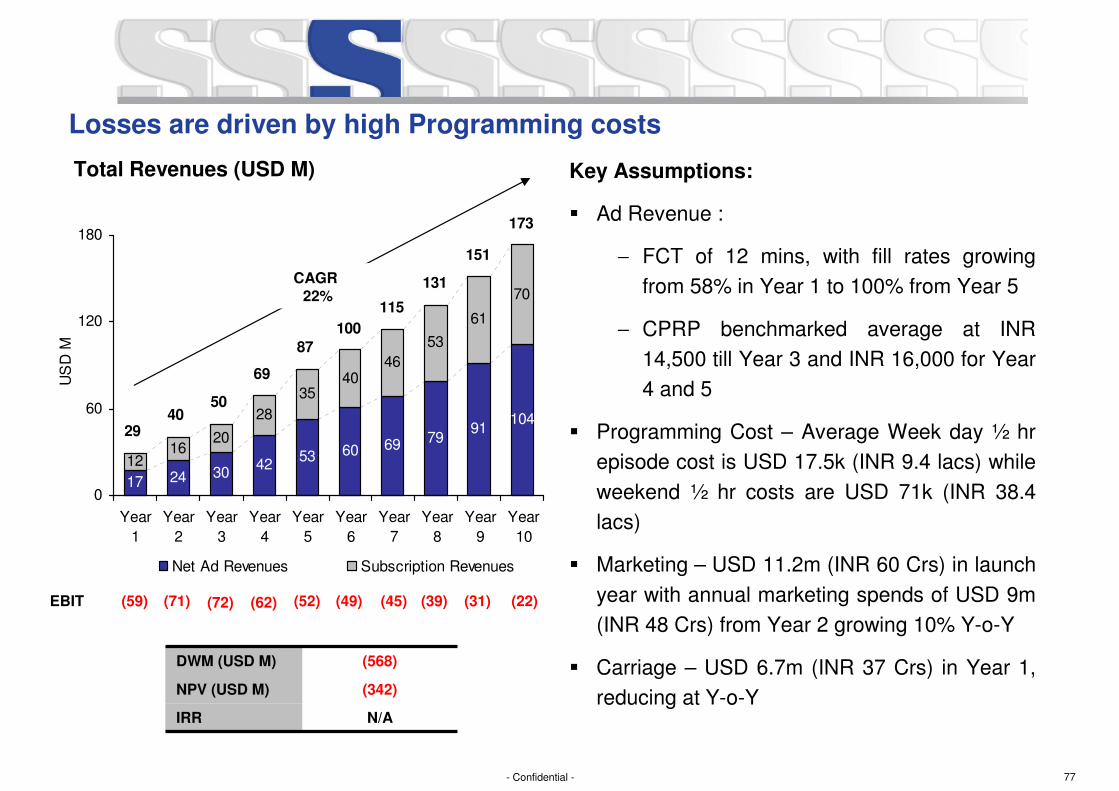
Losses are driven by high Programming costs
53 60 69 7991
104
1620
3540
46
53
61
70
241742
30
28
12
173
151
131
115
100
4029
69
87
50
0
60
120
180
Year
1
Year
2
Year
3
Year
4
Year
5
Year
6
Year
7
Year
8
Year
9
Year
10
US
D M
Net Ad Revenues Subscription Revenues
DWM (USD M) (568)
NPV (USD M) (342)
IRR N/A
EBIT (59) (71)
CAGR 22%
(72) (62) (52) (49) (45) (39) (31)
Key Assumptions:
� Ad Revenue :
− FCT of 12 mins, with fill rates growing
from 58% in Year 1 to 100% from Year 5
− CPRP benchmarked average at INR
14,500 till Year 3 and INR 16,000 for Year
4 and 5
� Programming Cost – Average Week day ½ hr
episode cost is USD 17.5k (INR 9.4 lacs) while
weekend ½ hr costs are USD 71k (INR 38.4
lacs)
� Marketing – USD 11.2m (INR 60 Crs) in launch
year with annual marketing spends of USD 9m
(INR 48 Crs) from Year 2 growing 10% Y-o-Y
� Carriage – USD 6.7m (INR 37 Crs) in Year 1,
reducing at Y-o-Y
(22)
Total Revenues (USD M)
78- Confidential -
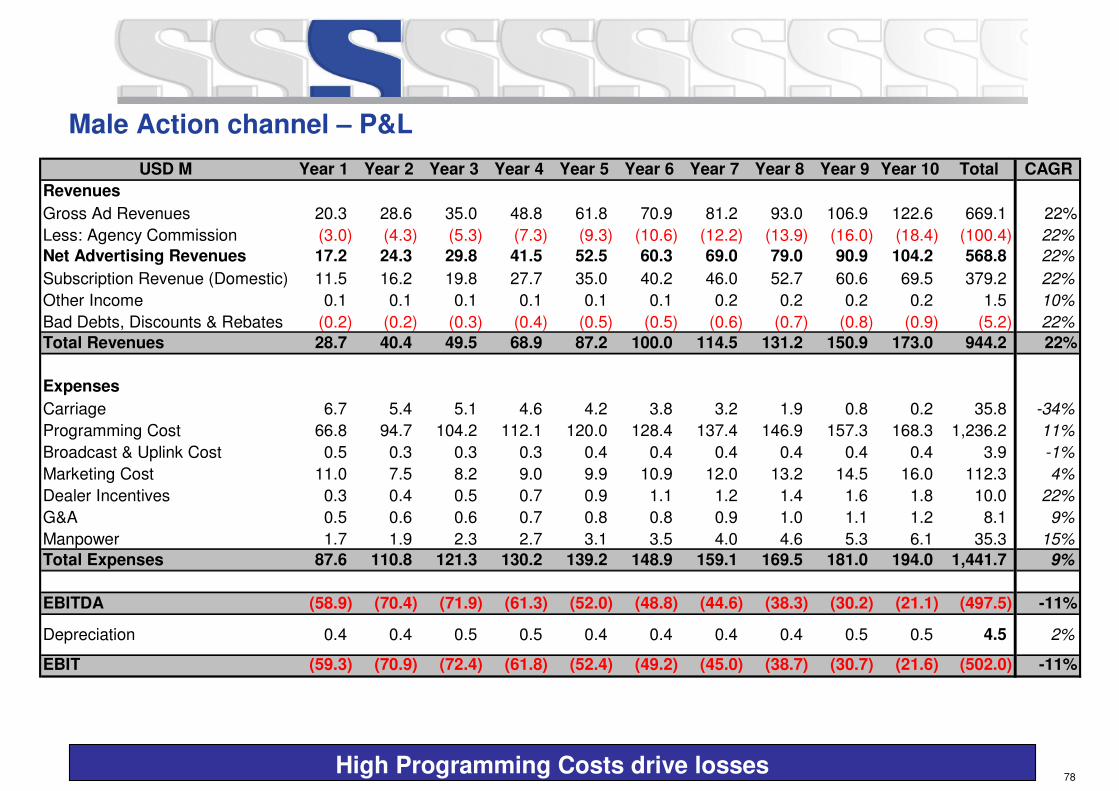
Male Action channel – P&L
High Programming Costs drive losses
USD M Year 1 Year 2 Year 3 Year 4 Year 5 Year 6 Year 7 Year 8 Year 9 Year 10 Total CAGR
Revenues
Gross Ad Revenues 20.3 28.6 35.0 48.8 61.8 70.9 81.2 93.0 106.9 122.6 669.1 22%
Less: Agency Commission (3.0) (4.3) (5.3) (7.3) (9.3) (10.6) (12.2) (13.9) (16.0) (18.4) (100.4) 22%
Net Advertising Revenues 17.2 24.3 29.8 41.5 52.5 60.3 69.0 79.0 90.9 104.2 568.8 22%
Subscription Revenue (Domestic) 11.5 16.2 19.8 27.7 35.0 40.2 46.0 52.7 60.6 69.5 379.2 22%
Other Income 0.1 0.1 0.1 0.1 0.1 0.1 0.2 0.2 0.2 0.2 1.5 10%
Bad Debts, Discounts & Rebates (0.2) (0.2) (0.3) (0.4) (0.5) (0.5) (0.6) (0.7) (0.8) (0.9) (5.2) 22%
Total Revenues 28.7 40.4 49.5 68.9 87.2 100.0 114.5 131.2 150.9 173.0 944.2 22%
Expenses
Carriage 6.7 5.4 5.1 4.6 4.2 3.8 3.2 1.9 0.8 0.2 35.8 -34%
Programming Cost 66.8 94.7 104.2 112.1 120.0 128.4 137.4 146.9 157.3 168.3 1,236.2 11%
Broadcast & Uplink Cost 0.5 0.3 0.3 0.3 0.4 0.4 0.4 0.4 0.4 0.4 3.9 -1%
Marketing Cost 11.0 7.5 8.2 9.0 9.9 10.9 12.0 13.2 14.5 16.0 112.3 4%
Dealer Incentives 0.3 0.4 0.5 0.7 0.9 1.1 1.2 1.4 1.6 1.8 10.0 22%
G&A 0.5 0.6 0.6 0.7 0.8 0.8 0.9 1.0 1.1 1.2 8.1 9%
Manpower 1.7 1.9 2.3 2.7 3.1 3.5 4.0 4.6 5.3 6.1 35.3 15%
Total Expenses 87.6 110.8 121.3 130.2 139.2 148.9 159.1 169.5 181.0 194.0 1,441.7 9%
EBITDA (58.9) (70.4) (71.9) (61.3) (52.0) (48.8) (44.6) (38.3) (30.2) (21.1) (497.5) -11%
Depreciation 0.4 0.4 0.5 0.5 0.4 0.4 0.4 0.4 0.5 0.5 4.5 2%
EBIT (59.3) (70.9) (72.4) (61.8) (52.4) (49.2) (45.0) (38.7) (30.7) (21.6) (502.0) -11%
79- Confidential -
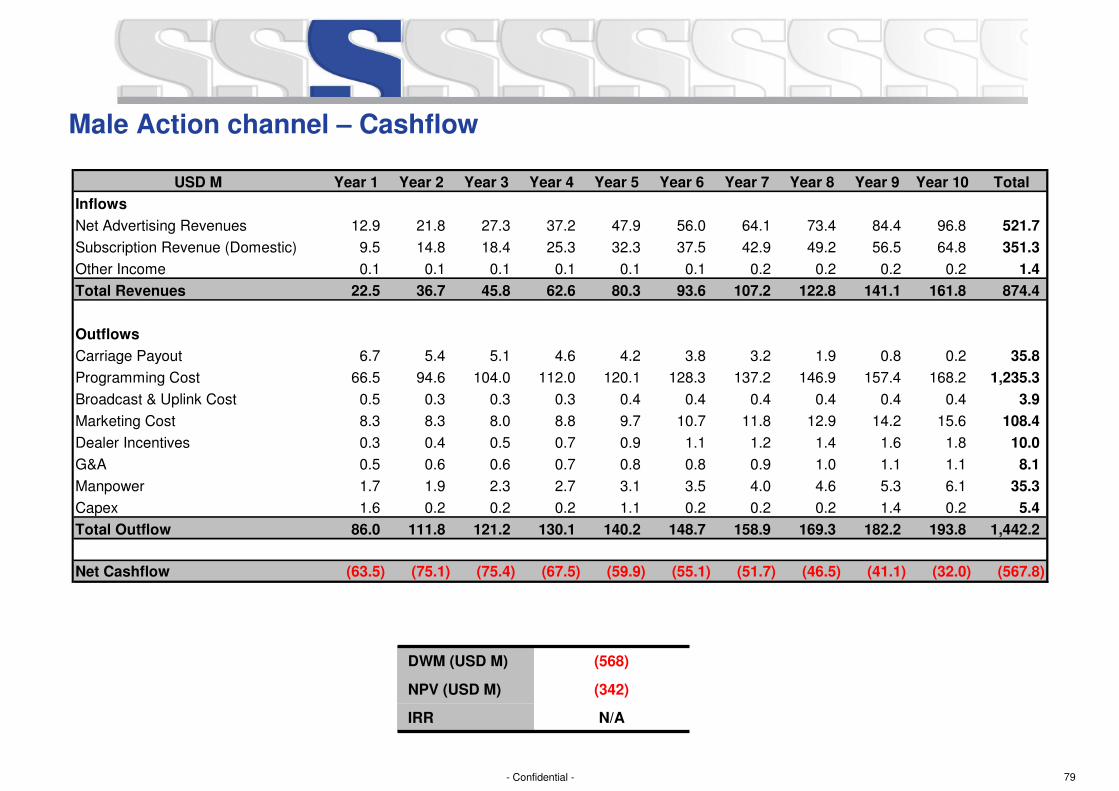
Male Action channel – Cashflow
USD M Year 1 Year 2 Year 3 Year 4 Year 5 Year 6 Year 7 Year 8 Year 9 Year 10 Total
Inflows
Net Advertising Revenues 12.9 21.8 27.3 37.2 47.9 56.0 64.1 73.4 84.4 96.8 521.7
Subscription Revenue (Domestic) 9.5 14.8 18.4 25.3 32.3 37.5 42.9 49.2 56.5 64.8 351.3
Other Income 0.1 0.1 0.1 0.1 0.1 0.1 0.2 0.2 0.2 0.2 1.4
Total Revenues 22.5 36.7 45.8 62.6 80.3 93.6 107.2 122.8 141.1 161.8 874.4
Outflows
Carriage Payout 6.7 5.4 5.1 4.6 4.2 3.8 3.2 1.9 0.8 0.2 35.8
Programming Cost 66.5 94.6 104.0 112.0 120.1 128.3 137.2 146.9 157.4 168.2 1,235.3
Broadcast & Uplink Cost 0.5 0.3 0.3 0.3 0.4 0.4 0.4 0.4 0.4 0.4 3.9
Marketing Cost 8.3 8.3 8.0 8.8 9.7 10.7 11.8 12.9 14.2 15.6 108.4
Dealer Incentives 0.3 0.4 0.5 0.7 0.9 1.1 1.2 1.4 1.6 1.8 10.0
G&A 0.5 0.6 0.6 0.7 0.8 0.8 0.9 1.0 1.1 1.1 8.1
Manpower 1.7 1.9 2.3 2.7 3.1 3.5 4.0 4.6 5.3 6.1 35.3
Capex 1.6 0.2 0.2 0.2 1.1 0.2 0.2 0.2 1.4 0.2 5.4
Total Outflow 86.0 111.8 121.2 130.1 140.2 148.7 158.9 169.3 182.2 193.8 1,442.2
Net Cashflow (63.5) (75.1) (75.4) (67.5) (59.9) (55.1) (51.7) (46.5) (41.1) (32.0) (567.8)
DWM (USD M) (568)
NPV (USD M) (342)
IRR N/A
80- Confidential -
Opportunity 4 – Digitally distributed TV Channel
Strategic New Initiatives
81- Confidential -
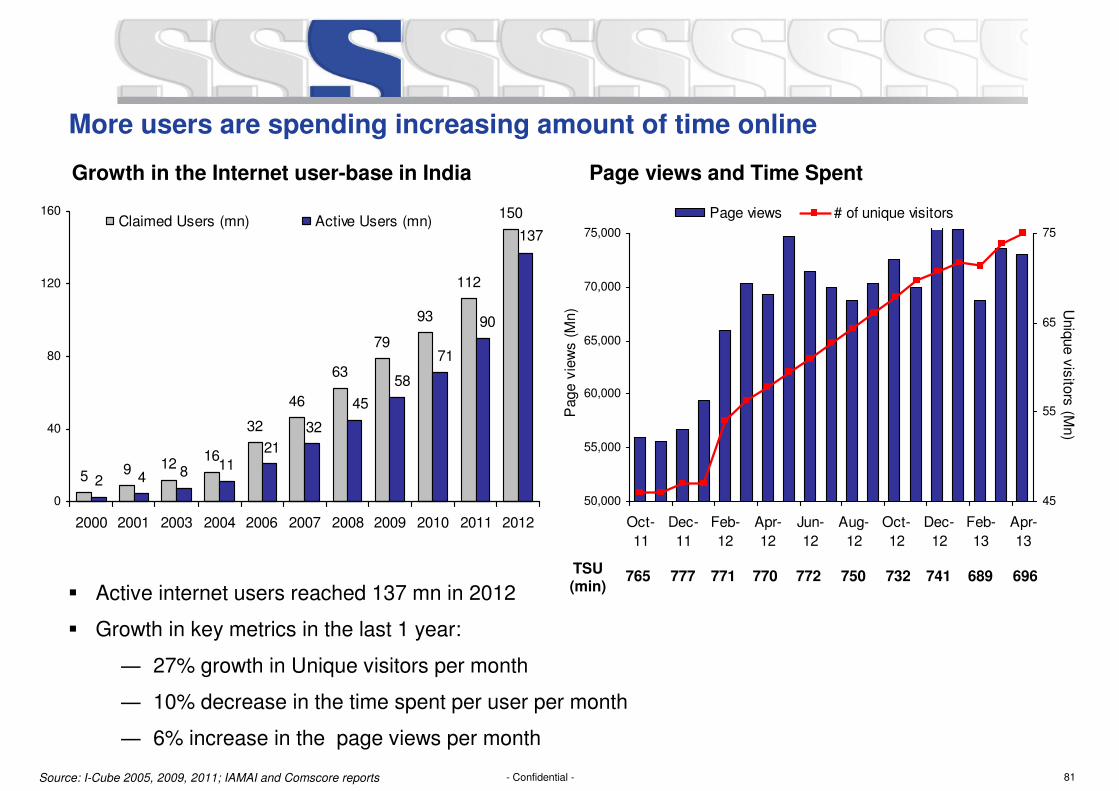
More users are spending increasing amount of time online
Growth in the Internet user-base in India
� Active internet users reached 137 mn in 2012
� Growth in key metrics in the last 1 year:
― 27% growth in Unique visitors per month
― 10% decrease in the time spent per user per month
― 6% increase in the page views per month
Source: I-Cube 2005, 2009, 2011; IAMAI and Comscore reports
5 9 1216
32
46
63
79
93
112
150
2 4 8 11
137
21
32
45
58
71
90
0
40
80
120
160
2000 2001 2003 2004 2006 2007 2008 2009 2010 2011 2012
Claimed Users (mn) Active Users (mn)
50,000
55,000
60,000
65,000
70,000
75,000
Oct-
11
Dec-
11
Feb-
12
Apr-
12
Jun-
12
Aug-
12
Oct-
12
Dec-
12
Feb-
13
Apr-
13
Page v
iew
s (
Mn)
45
55
65
75
Uniq
ue v
isito
rs (M
n)
Page views # of unique visitors
765TSU (min)
777 771 770 772 750
Page views and Time Spent
741 696732 689
82- Confidential -Source: FICCI KPMG 2013
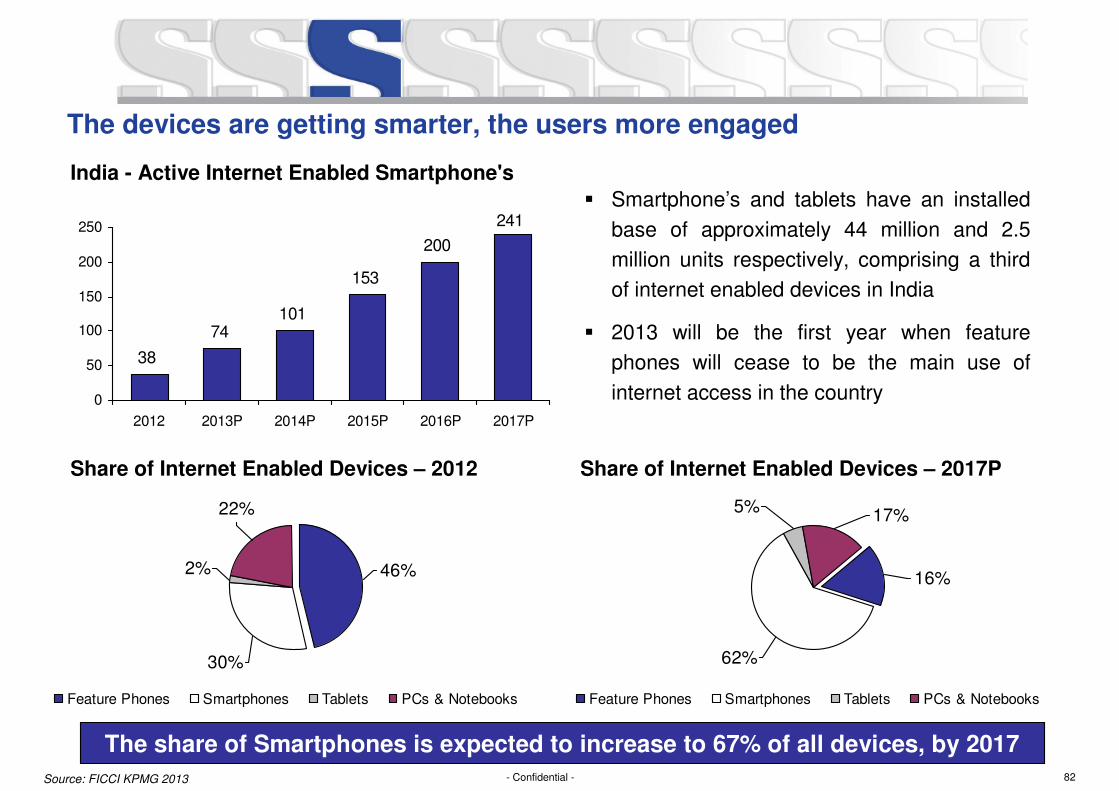
The devices are getting smarter, the users more engaged
� Smartphone’s and tablets have an installed
base of approximately 44 million and 2.5
million units respectively, comprising a third
of internet enabled devices in India
� 2013 will be the first year when feature
phones will cease to be the main use of
internet access in the country
2%
22%
30%
46%
Feature Phones Smartphones Tablets PCs & Notebooks
38
74101
153
200
241
0
50
100
150
200
250
2012 2013P 2014P 2015P 2016P 2017P
India - Active Internet Enabled Smartphone's
Share of Internet Enabled Devices – 2012 Share of Internet Enabled Devices – 2017P
5%17%
62%
16%
Feature Phones Smartphones Tablets PCs & Notebooks
The share of Smartphones is expected to increase to 67% of all devices, by 2017
83- Confidential -
10
24
35
60
2
12
26
48
0
35
70
2009 2010 2011 2012
Mill
iions
Claimed Users (mn) Active Users (mn)
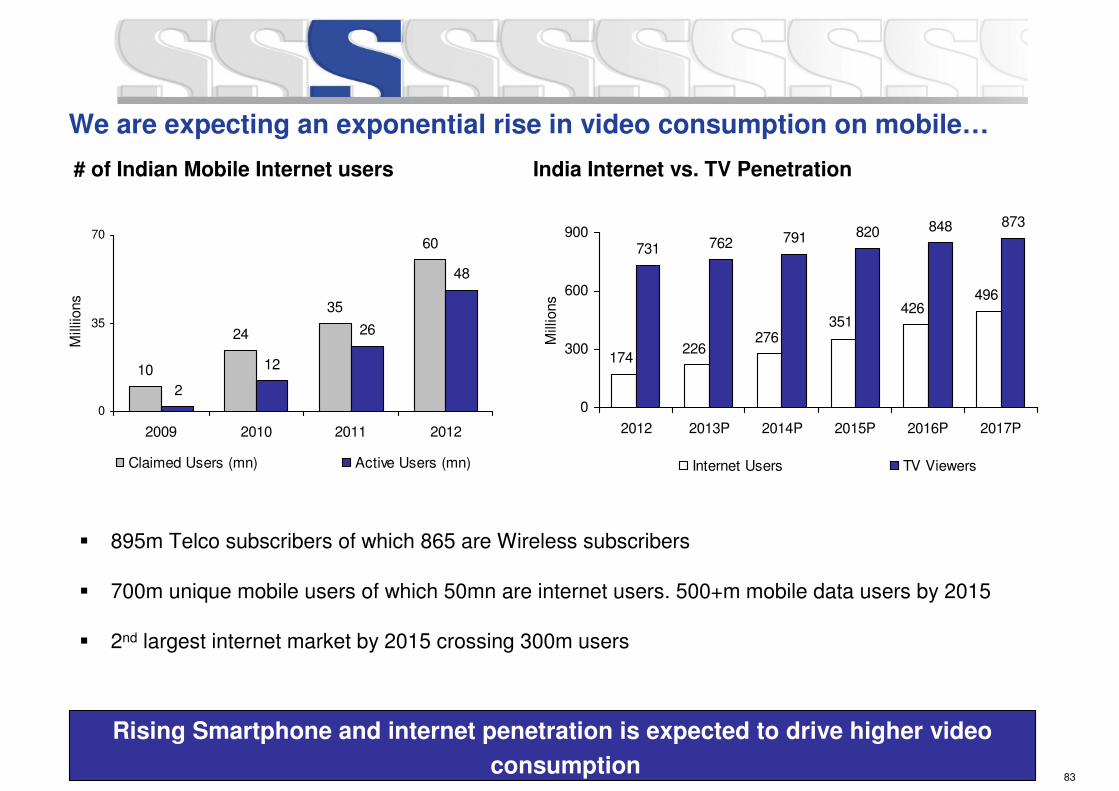
We are expecting an exponential rise in video consumption on mobile…
Rising Smartphone and internet penetration is expected to drive higher video
consumption
� 895m Telco subscribers of which 865 are Wireless subscribers
� 700m unique mobile users of which 50mn are internet users. 500+m mobile data users by 2015
� 2nd largest internet market by 2015 crossing 300m users
# of Indian Mobile Internet users India Internet vs. TV Penetration
731 762 791 820 848 873
496426
351276
226174
0
300
600
900
2012 2013P 2014P 2015P 2016P 2017P
Mill
ions
Internet Users TV Viewers
84- Confidential -
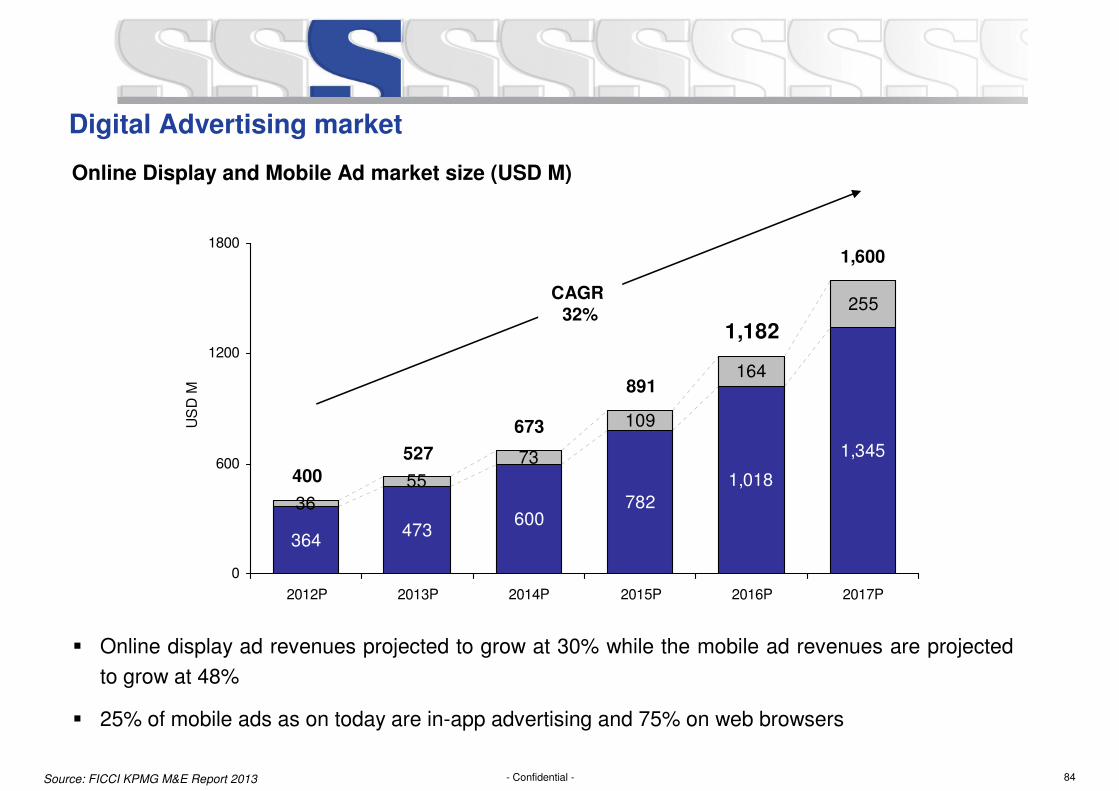
Digital Advertising market
Online Display and Mobile Ad market size (USD M)
782
1,018
1,345
55
73
109
164
255
600473
364
36
1,600
673
527
400
891
1,182
0
600
1200
1800
2012P 2013P 2014P 2015P 2016P 2017P
US
D M
� Online display ad revenues projected to grow at 30% while the mobile ad revenues are projected
to grow at 48%
� 25% of mobile ads as on today are in-app advertising and 75% on web browsers
CAGR
32%
Source: FICCI KPMG M&E Report 2013
85- Confidential -
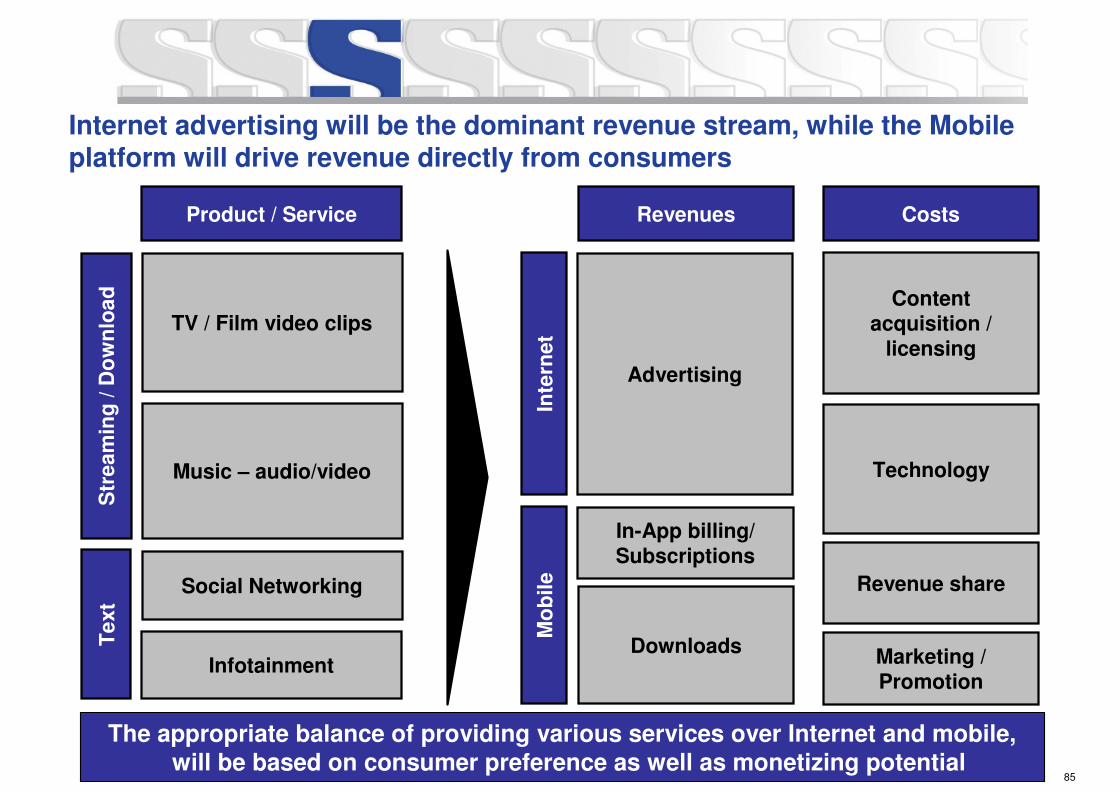
Internet advertising will be the dominant revenue stream, while the Mobile platform will drive revenue directly from consumers
The appropriate balance of providing various services over Internet and mobile, will be based on consumer preference as well as monetizing potential
Revenues Costs
Advertising
In-App billing/ Subscriptions
Downloads
Inte
rnet
Mo
bile
Content acquisition /
licensing
Technology
Revenue share
Marketing / Promotion
Product / Service
TV / Film video clips
Music – audio/video
Social Networking
Str
ea
min
g / D
ow
nlo
ad
Te
xt
Infotainment
86- Confidential -
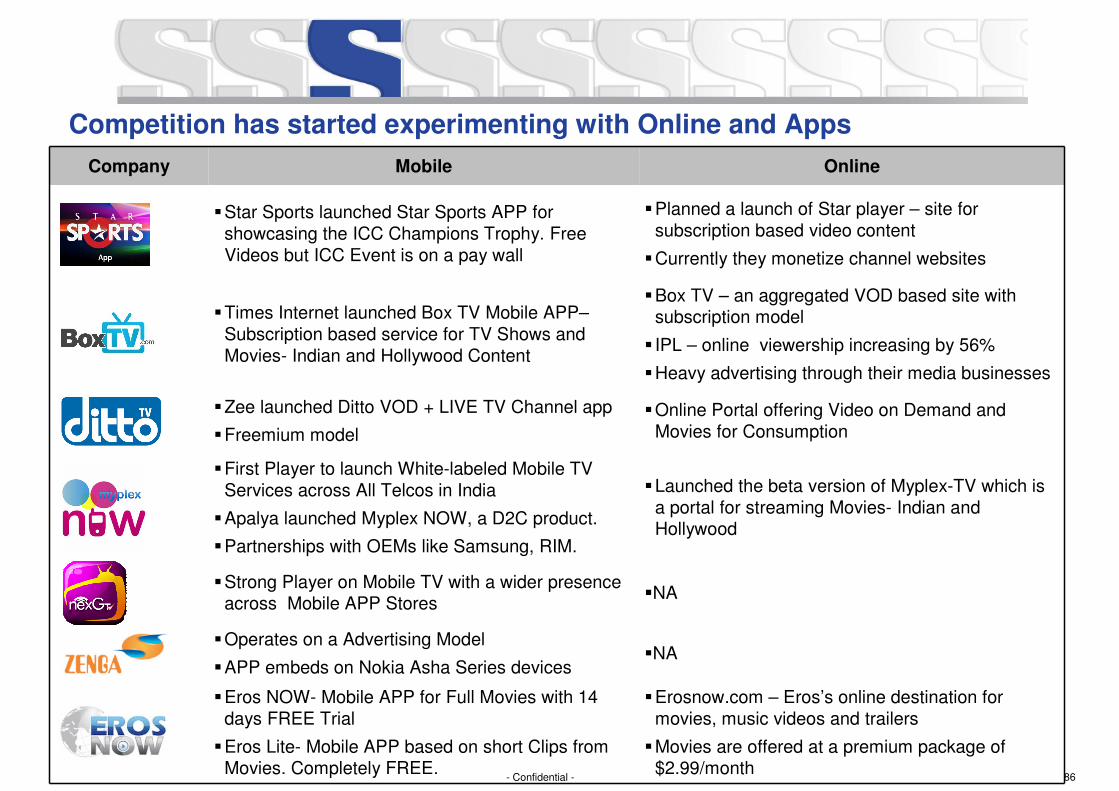
Competition has started experimenting with Online and Apps
Company Mobile Online
�Star Sports launched Star Sports APP for showcasing the ICC Champions Trophy. Free Videos but ICC Event is on a pay wall
�Planned a launch of Star player – site for subscription based video content
�Currently they monetize channel websites
�Times Internet launched Box TV Mobile APP–Subscription based service for TV Shows and Movies- Indian and Hollywood Content
�Box TV – an aggregated VOD based site with subscription model
� IPL – online viewership increasing by 56%
�Heavy advertising through their media businesses
�Zee launched Ditto VOD + LIVE TV Channel app
�Freemium model
�Online Portal offering Video on Demand and Movies for Consumption
�First Player to launch White-labeled Mobile TV Services across All Telcos in India
�Apalya launched Myplex NOW, a D2C product.
�Partnerships with OEMs like Samsung, RIM.
�Launched the beta version of Myplex-TV which is a portal for streaming Movies- Indian and Hollywood
�Strong Player on Mobile TV with a wider presence across Mobile APP Stores
�NA
�Operates on a Advertising Model
�APP embeds on Nokia Asha Series devices�NA
�Eros NOW- Mobile APP for Full Movies with 14 days FREE Trial
�Eros Lite- Mobile APP based on short Clips from Movies. Completely FREE.
�Erosnow.com – Eros’s online destination for movies, music videos and trailers
�Movies are offered at a premium package of $2.99/month
87- Confidential -
A linear channel exclusively for “People on the Go”
� MSM to launch a linear Streaming Channel available exclusively on the digital platforms
� A channel targeted to the youth of today
� A mix of original and existing programming:
― Short Form Content (15 Mins)
― Comedy
― Bollywood Gossip
― Entertainment
― Game shows/Trivia
� SET and SAB are already available on the following Mobile TV platforms:
― Apalya (SET)
― Ditto (SET, SAB and MIX)
― NexG TV (SET, SAB and MIX)
― Zenga (SET, SAB and MIX) - to be signed
88- Confidential -
Short form content which is not in the “daily soap” format would consumers to sample
on the go
� Home / Lifestyle – For Urban / semi-urban audiences. Shows on home décor, furnishing, party-
ideas, health & fitness, etc.
� HHC videos – Similar to the website High Heel Confidential – mirrors fashion trends followed by
the rich & famous women - fashion faux-pas and the general happenings in the fashion industry
� Biopics – Biographical episodes that dramatizes the lives of Superstars from Bollywood, Sport,
Fashion etc.
� Food / Drink – Along with Traditional house recipes include clips on international cuisines, desert
making, etc.
� Eating Out / Travel – Adventure and exotic travel destinations and food fancies alongside
� Comedy
− Stand up – Famous Comedy stars from the Television and Theatre circle
− Sketch – Shorter webisodes of older famous TV shows like Sarabhai, Dekh Bhai Dekh,
Taarak Mehta Ka Ooltah Chashma
Original Programming – Quick snacking content for the Youth of today
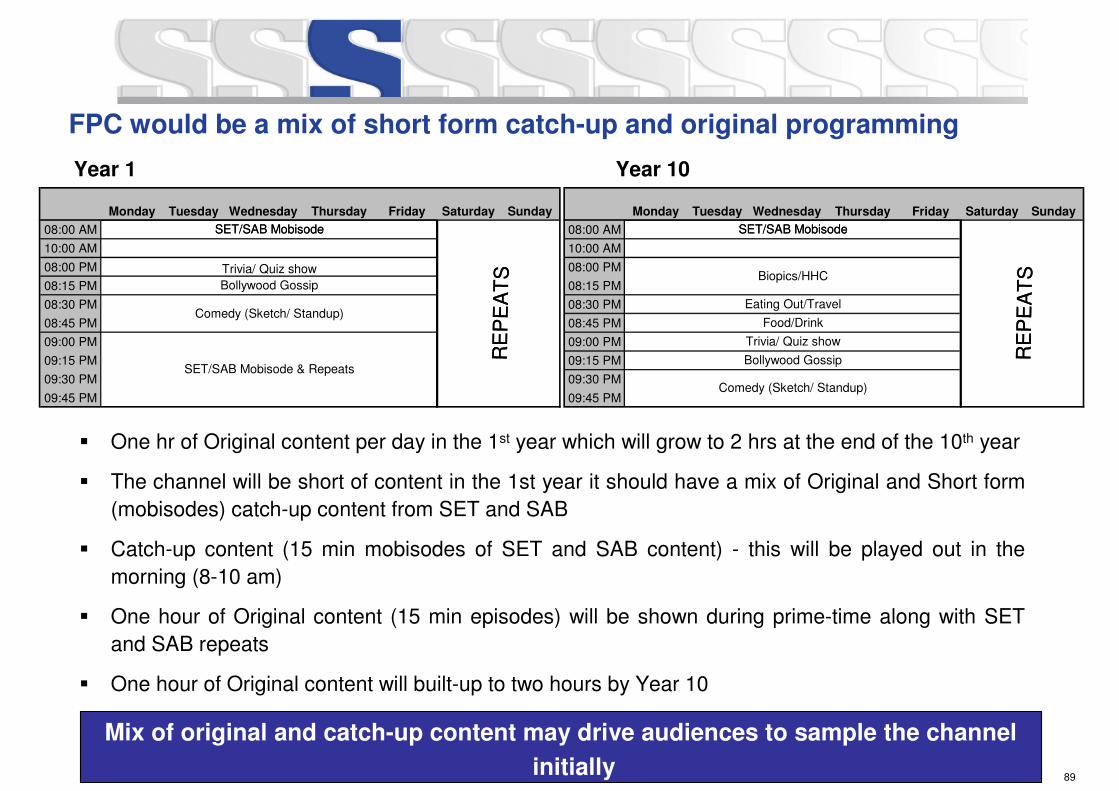
89- Confidential -
Mix of original and catch-up content may drive audiences to sample the channel
initially
FPC would be a mix of short form catch-up and original programming
� One hr of Original content per day in the 1st year which will grow to 2 hrs at the end of the 10th year
� The channel will be short of content in the 1st year it should have a mix of Original and Short form
(mobisodes) catch-up content from SET and SAB
� Catch-up content (15 min mobisodes of SET and SAB content) - this will be played out in the
morning (8-10 am)
� One hour of Original content (15 min episodes) will be shown during prime-time along with SET
and SAB repeats
� One hour of Original content will built-up to two hours by Year 10
Monday Tuesday Wednesday Thursday Friday Saturday Sunday
RE
PE
AT
S
SET/SAB Mobisode08:00 AM
10:00 AM
08:00 PM
08:15 PM
08:30 PM
08:45 PM
09:00 PM
09:15 PM
09:30 PM
09:45 PM
Bollywood Gossip
Comedy (Sketch/ Standup)
SET/SAB Mobisode & Repeats
RE
PE
AT
S
SET/SAB Mobisode
Trivia/ Quiz show
Monday Tuesday Wednesday Thursday Friday Saturday Sunday
RE
PE
AT
S
SET/SAB Mobisode08:00 AM
10:00 AM
08:00 PM
08:15 PM
08:30 PM
08:45 PM
09:00 PM
09:15 PM
09:30 PM
09:45 PM
RE
PE
AT
SBiopics/HHC
Eating Out/Travel
Bollywood Gossip
Comedy (Sketch/ Standup)
SET/SAB Mobisode
Food/Drink
Trivia/ Quiz show
Year 1 Year 10
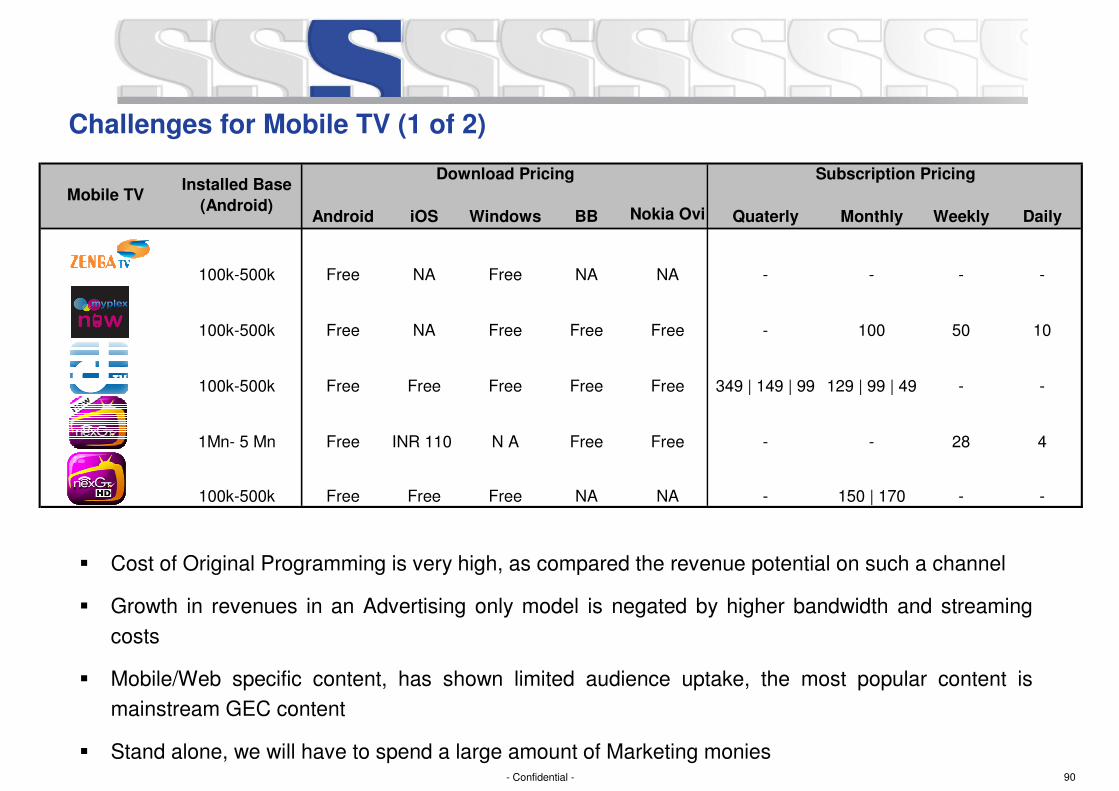
90- Confidential -
Challenges for Mobile TV (1 of 2)
� Cost of Original Programming is very high, as compared the revenue potential on such a channel
� Growth in revenues in an Advertising only model is negated by higher bandwidth and streaming
costs
� Mobile/Web specific content, has shown limited audience uptake, the most popular content is
mainstream GEC content
� Stand alone, we will have to spend a large amount of Marketing monies
Android iOS Windows BB Nokia Ovi Quaterly Monthly Weekly Daily
100k-500k Free NA Free NA NA - - - -
100k-500k Free NA Free Free Free - 100 50 10
100k-500k Free Free Free Free Free 349 | 149 | 99 129 | 99 | 49 - -
1Mn- 5 Mn Free INR 110 N A Free Free - - 28 4
100k-500k Free Free Free NA NA - 150 | 170 - -
Download Pricing Subscription Pricing
Mobile TVInstalled Base
(Android)
91- Confidential -
Challenges for Mobile TV (2 of 2)
� The Consumer mindset does not favor paying for both content & data
� Data charges is currently a big deterrent for consumers. Bundling of data with content access will
be critical.
� 3G services have not seen the uptake that was anticipated
� People know SET, SAB, MIX, etc. i.e. there is power in the brand, which is why people are
consuming it on mobile
� Key learning’s from existing partnerships:
― Individual Channel subscriptions have seen limited subscriptions
― Choice of multiple channels packaged into one pack may work better
FX rate USD 1= INR 54.265
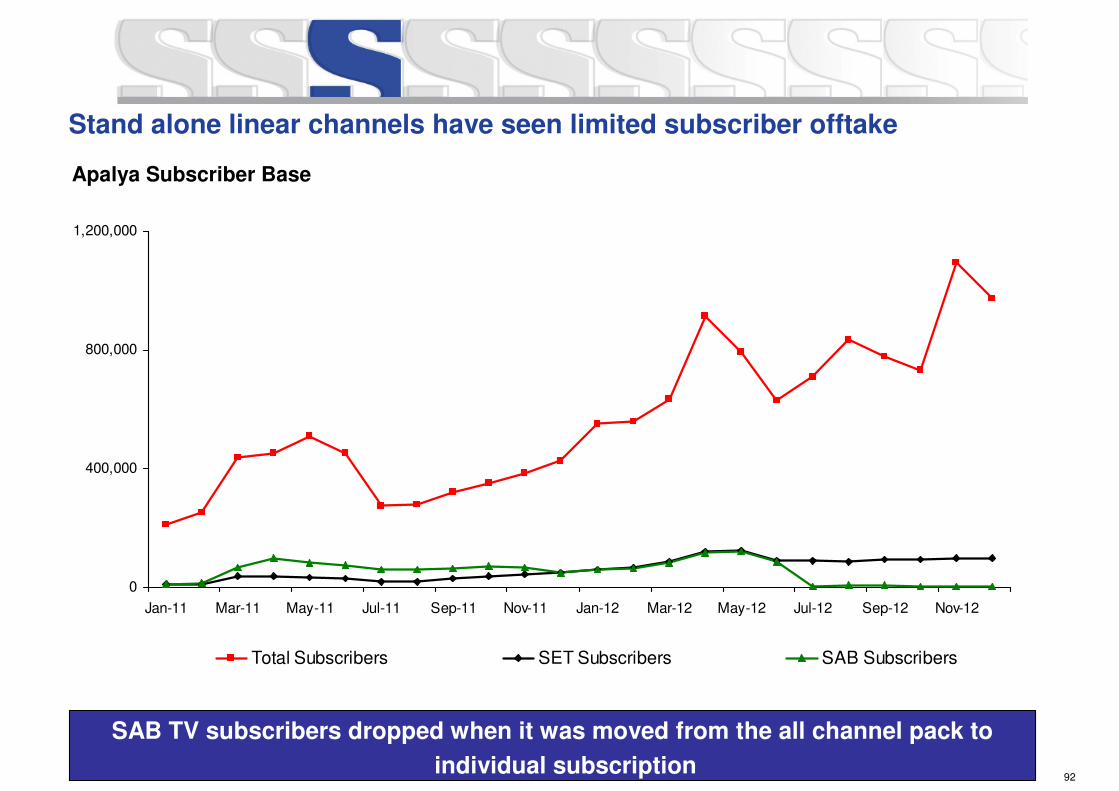
92- Confidential -
Stand alone linear channels have seen limited subscriber offtake
SAB TV subscribers dropped when it was moved from the all channel pack to
individual subscription
0
400,000
800,000
1,200,000
Jan-11 Mar-11 May-11 Jul-11 Sep-11 Nov-11 Jan-12 Mar-12 May-12 Jul-12 Sep-12 Nov-12
Total Subscribers SET Subscribers SAB Subscribers
Apalya Subscriber Base
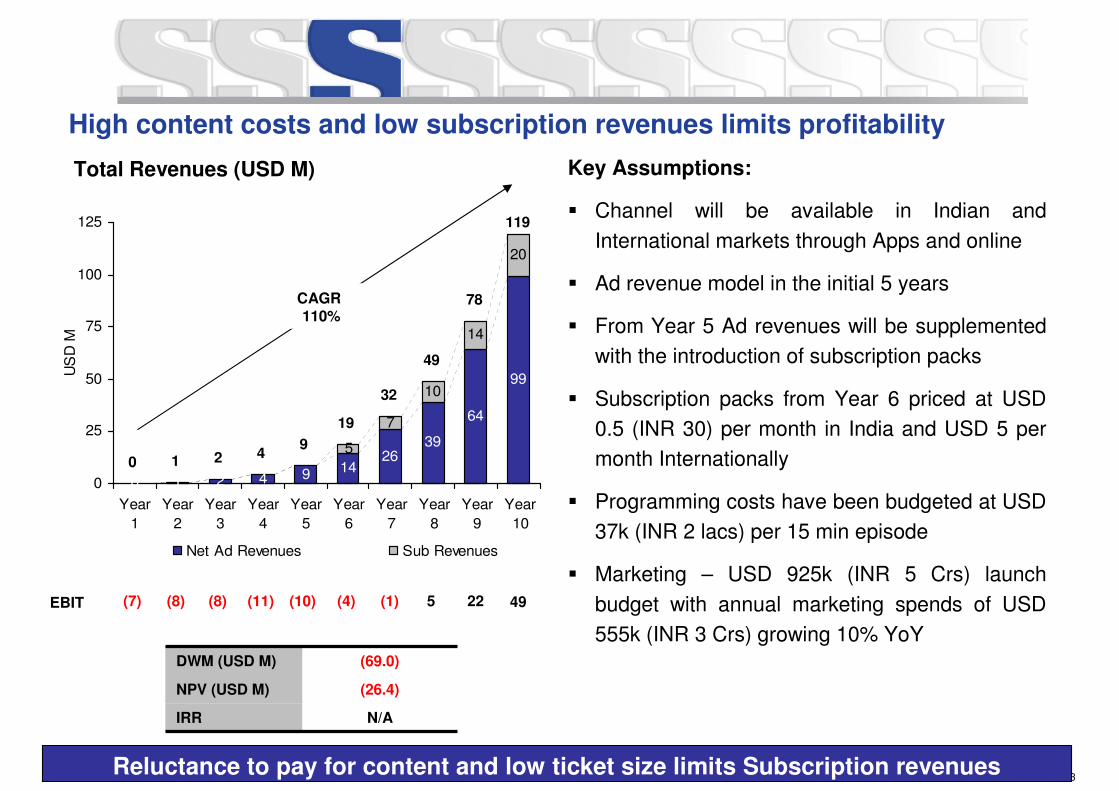
93- Confidential -
High content costs and low subscription revenues limits profitability
9 1426
39
64
99
5
7
10
14
20
2 40 1
29
40 1
19
32
49
78
119
0
25
50
75
100
125
Year
1
Year
2
Year
3
Year
4
Year
5
Year
6
Year
7
Year
8
Year
9
Year
10
US
D M
Net Ad Revenues Sub Revenues
DWM (USD M) (69.0)
NPV (USD M) (26.4)
IRR N/A
EBIT (7) (8)
CAGR 110%
(8) (11) (10) (4) (1) 5 22
Key Assumptions:
� Channel will be available in Indian and
International markets through Apps and online
� Ad revenue model in the initial 5 years
� From Year 5 Ad revenues will be supplemented
with the introduction of subscription packs
� Subscription packs from Year 6 priced at USD
0.5 (INR 30) per month in India and USD 5 per
month Internationally
� Programming costs have been budgeted at USD
37k (INR 2 lacs) per 15 min episode
� Marketing – USD 925k (INR 5 Crs) launch
budget with annual marketing spends of USD
555k (INR 3 Crs) growing 10% YoY
49
Total Revenues (USD M)
Reluctance to pay for content and low ticket size limits Subscription revenues
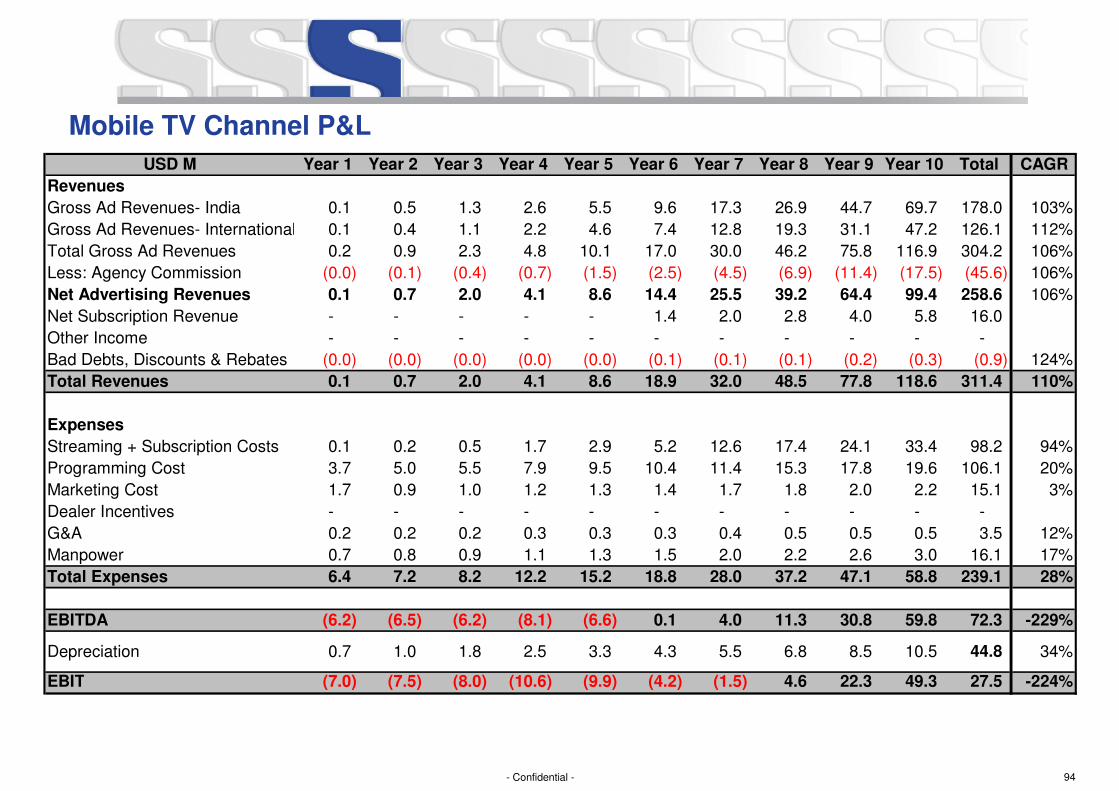
94- Confidential -
Mobile TV Channel P&L
USD M Year 1 Year 2 Year 3 Year 4 Year 5 Year 6 Year 7 Year 8 Year 9 Year 10 Total CAGR
Revenues
Gross Ad Revenues- India 0.1 0.5 1.3 2.6 5.5 9.6 17.3 26.9 44.7 69.7 178.0 103%
Gross Ad Revenues- International 0.1 0.4 1.1 2.2 4.6 7.4 12.8 19.3 31.1 47.2 126.1 112%
Total Gross Ad Revenues 0.2 0.9 2.3 4.8 10.1 17.0 30.0 46.2 75.8 116.9 304.2 106%
Less: Agency Commission (0.0) (0.1) (0.4) (0.7) (1.5) (2.5) (4.5) (6.9) (11.4) (17.5) (45.6) 106%
Net Advertising Revenues 0.1 0.7 2.0 4.1 8.6 14.4 25.5 39.2 64.4 99.4 258.6 106%
Net Subscription Revenue - - - - - 1.4 2.0 2.8 4.0 5.8 16.0
Other Income - - - - - - - - - - -
Bad Debts, Discounts & Rebates (0.0) (0.0) (0.0) (0.0) (0.0) (0.1) (0.1) (0.1) (0.2) (0.3) (0.9) 124%
Total Revenues 0.1 0.7 2.0 4.1 8.6 18.9 32.0 48.5 77.8 118.6 311.4 110%
Expenses
Streaming + Subscription Costs 0.1 0.2 0.5 1.7 2.9 5.2 12.6 17.4 24.1 33.4 98.2 94%
Programming Cost 3.7 5.0 5.5 7.9 9.5 10.4 11.4 15.3 17.8 19.6 106.1 20%
Marketing Cost 1.7 0.9 1.0 1.2 1.3 1.4 1.7 1.8 2.0 2.2 15.1 3%
Dealer Incentives - - - - - - - - - - -
G&A 0.2 0.2 0.2 0.3 0.3 0.3 0.4 0.5 0.5 0.5 3.5 12%
Manpower 0.7 0.8 0.9 1.1 1.3 1.5 2.0 2.2 2.6 3.0 16.1 17%
Total Expenses 6.4 7.2 8.2 12.2 15.2 18.8 28.0 37.2 47.1 58.8 239.1 28%
EBITDA (6.2) (6.5) (6.2) (8.1) (6.6) 0.1 4.0 11.3 30.8 59.8 72.3 -229%
Depreciation 0.7 1.0 1.8 2.5 3.3 4.3 5.5 6.8 8.5 10.5 44.8 34%
EBIT (7.0) (7.5) (8.0) (10.6) (9.9) (4.2) (1.5) 4.6 22.3 49.3 27.5 -224%
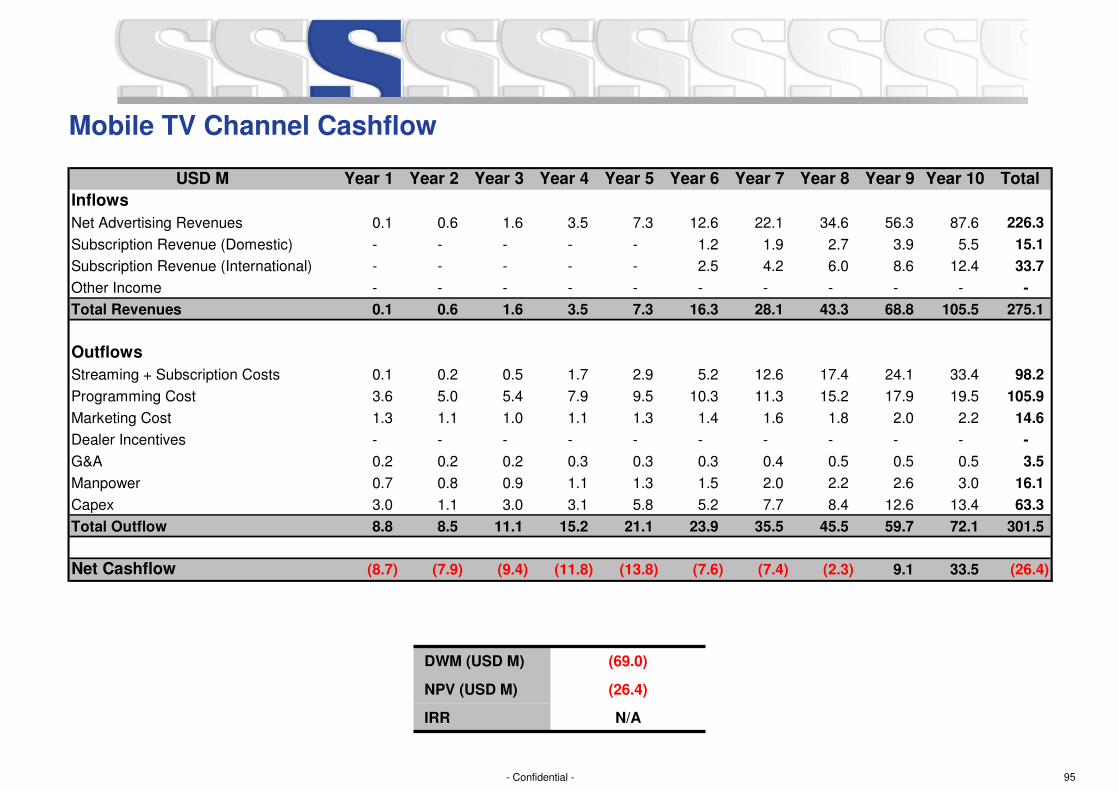
95- Confidential -
Mobile TV Channel Cashflow
USD M Year 1 Year 2 Year 3 Year 4 Year 5 Year 6 Year 7 Year 8 Year 9 Year 10 Total
Inflows
Net Advertising Revenues 0.1 0.6 1.6 3.5 7.3 12.6 22.1 34.6 56.3 87.6 226.3
Subscription Revenue (Domestic) - - - - - 1.2 1.9 2.7 3.9 5.5 15.1
Subscription Revenue (International) - - - - - 2.5 4.2 6.0 8.6 12.4 33.7
Other Income - - - - - - - - - - -
Total Revenues 0.1 0.6 1.6 3.5 7.3 16.3 28.1 43.3 68.8 105.5 275.1
Outflows
Streaming + Subscription Costs 0.1 0.2 0.5 1.7 2.9 5.2 12.6 17.4 24.1 33.4 98.2
Programming Cost 3.6 5.0 5.4 7.9 9.5 10.3 11.3 15.2 17.9 19.5 105.9
Marketing Cost 1.3 1.1 1.0 1.1 1.3 1.4 1.6 1.8 2.0 2.2 14.6
Dealer Incentives - - - - - - - - - - -
G&A 0.2 0.2 0.2 0.3 0.3 0.3 0.4 0.5 0.5 0.5 3.5
Manpower 0.7 0.8 0.9 1.1 1.3 1.5 2.0 2.2 2.6 3.0 16.1
Capex 3.0 1.1 3.0 3.1 5.8 5.2 7.7 8.4 12.6 13.4 63.3
Total Outflow 8.8 8.5 11.1 15.2 21.1 23.9 35.5 45.5 59.7 72.1 301.5
Net Cashflow (8.7) (7.9) (9.4) (11.8) (13.8) (7.6) (7.4) (2.3) 9.1 33.5 (26.4)
DWM (USD M) (69.0)
NPV (USD M) (26.4)
IRR N/A
96- Confidential -
Recap – Putting it all together
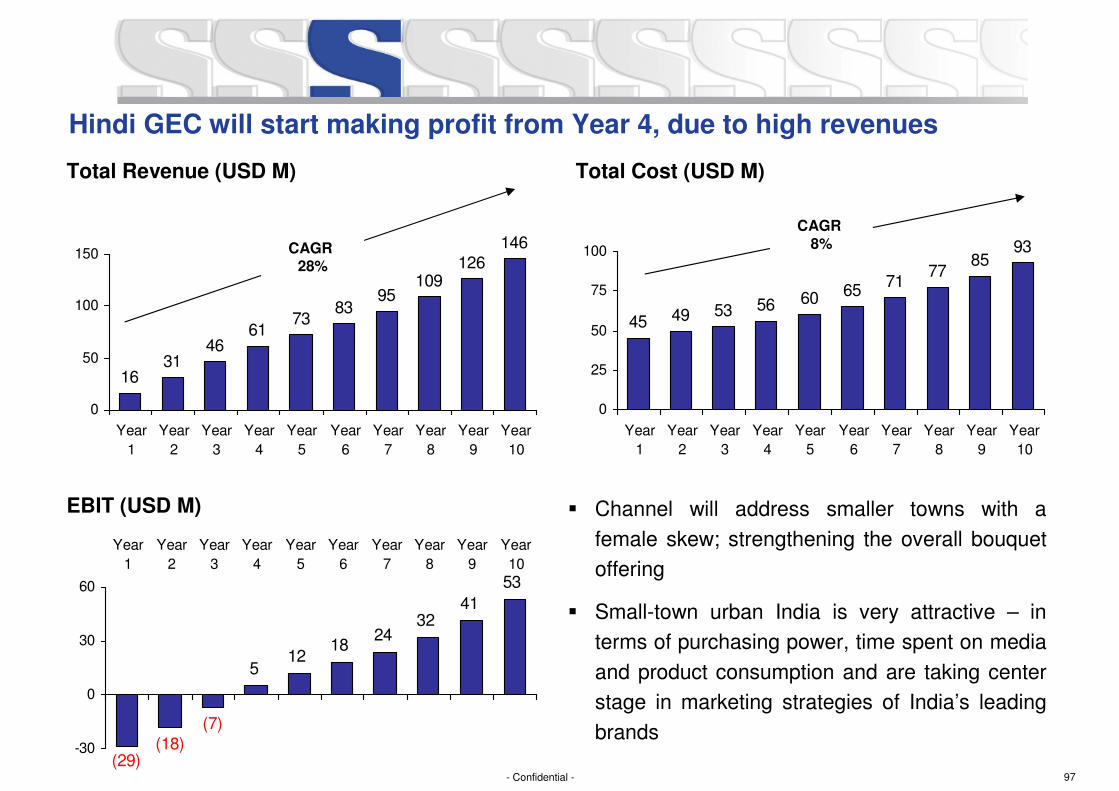
97- Confidential -
45 49 53 56 60 6571
7785
93
0
25
50
75
100
Year
1
Year
2
Year
3
Year
4
Year
5
Year
6
Year
7
Year
8
Year
9
Year
10
3241
53
125
(7)(18)
(29)
1824
-30
0
30
60
Year
1
Year
2
Year
3
Year
4
Year
5
Year
6
Year
7
Year
8
Year
9
Year
10
1631
4661
7383
95109
126146
0
50
100
150
Year
1
Year
2
Year
3
Year
4
Year
5
Year
6
Year
7
Year
8
Year
9
Year
10
Total Revenue (USD M) Total Cost (USD M)
EBIT (USD M)
CAGR 28%
CAGR 8%
Hindi GEC will start making profit from Year 4, due to high revenues
� Channel will address smaller towns with a
female skew; strengthening the overall bouquet
offering
� Small-town urban India is very attractive – in
terms of purchasing power, time spent on media
and product consumption and are taking center
stage in marketing strategies of India’s leading
brands
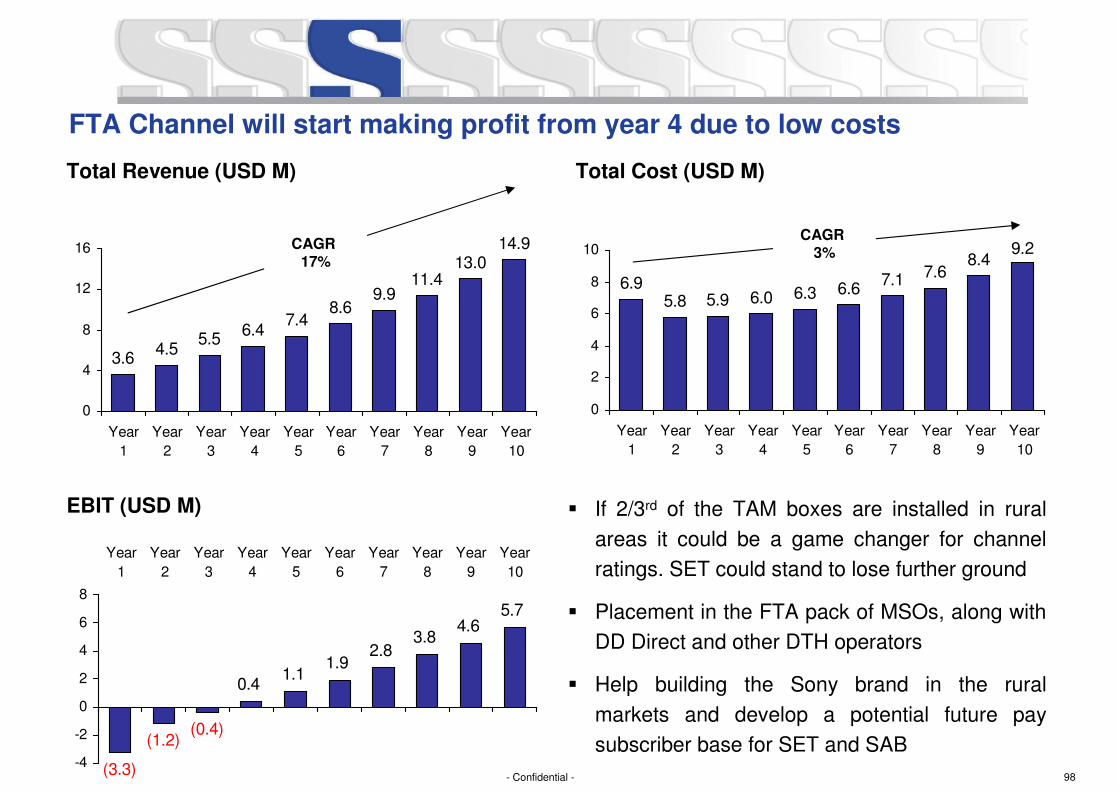
98- Confidential -
6.95.8 5.9 6.0 6.3 6.6
7.1 7.68.4
9.2
0
2
4
6
8
10
Year
1
Year
2
Year
3
Year
4
Year
5
Year
6
Year
7
Year
8
Year
9
Year
10
0.41.1
3.84.6
5.7
2.81.9
(1.2)(0.4)
(3.3)-4
-2
0
2
4
6
8
Year
1
Year
2
Year
3
Year
4
Year
5
Year
6
Year
7
Year
8
Year
9
Year
10
3.64.5
5.56.4
7.48.6
9.911.4
13.014.9
0
4
8
12
16
Year
1
Year
2
Year
3
Year
4
Year
5
Year
6
Year
7
Year
8
Year
9
Year
10
Total Revenue (USD M) Total Cost (USD M)
EBIT (USD M)
CAGR 17%
CAGR 3%
FTA Channel will start making profit from year 4 due to low costs
� If 2/3rd of the TAM boxes are installed in rural
areas it could be a game changer for channel
ratings. SET could stand to lose further ground
� Placement in the FTA pack of MSOs, along with
DD Direct and other DTH operators
� Help building the Sony brand in the rural
markets and develop a potential future pay
subscriber base for SET and SAB
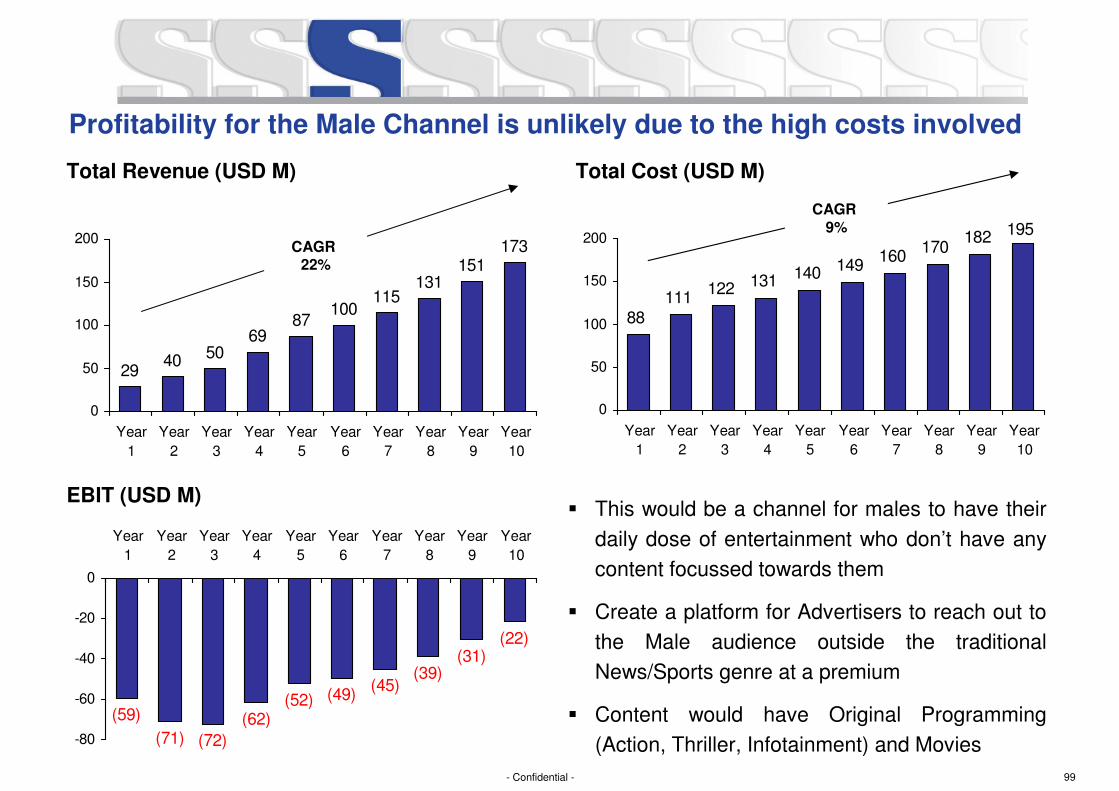
99- Confidential -
88111
122 131 140 149160
170182 195
0
50
100
150
200
Year
1
Year
2
Year
3
Year
4
Year
5
Year
6
Year
7
Year
8
Year
9
Year
10
(45)(49)
(71) (72)
(59) (62)(52)
(39)(31)
(22)
-80
-60
-40
-20
0
Year
1
Year
2
Year
3
Year
4
Year
5
Year
6
Year
7
Year
8
Year
9
Year
10
2940 50
6987
100115
131151
173
0
50
100
150
200
Year
1
Year
2
Year
3
Year
4
Year
5
Year
6
Year
7
Year
8
Year
9
Year
10
Total Revenue (USD M) Total Cost (USD M)
EBIT (USD M)
CAGR 22%
CAGR 9%
Profitability for the Male Channel is unlikely due to the high costs involved
� This would be a channel for males to have their
daily dose of entertainment who don’t have any
content focussed towards them
� Create a platform for Advertisers to reach out to
the Male audience outside the traditional
News/Sports genre at a premium
� Content would have Original Programming
(Action, Thriller, Infotainment) and Movies
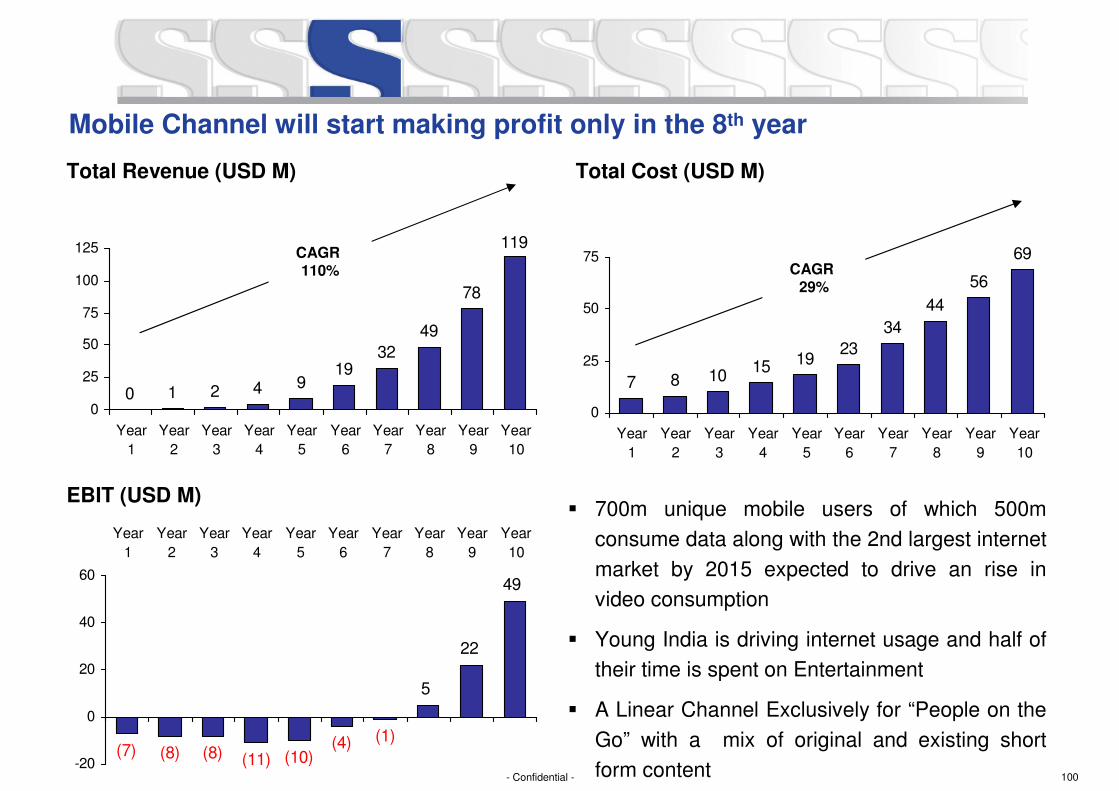
100- Confidential -
7 8 1015 19
23
34
44
56
69
0
25
50
75
Year
1
Year
2
Year
3
Year
4
Year
5
Year
6
Year
7
Year
8
Year
9
Year
10
(1)(4)(8) (8)(7)
(11) (10)
5
22
49
-20
0
20
40
60
Year
1
Year
2
Year
3
Year
4
Year
5
Year
6
Year
7
Year
8
Year
9
Year
10
0 1 2 4 919
32
49
78
119
0
25
50
75
100
125
Year
1
Year
2
Year
3
Year
4
Year
5
Year
6
Year
7
Year
8
Year
9
Year
10
Total Revenue (USD M) Total Cost (USD M)
EBIT (USD M)
CAGR 110% CAGR
29%
Mobile Channel will start making profit only in the 8th year
� 700m unique mobile users of which 500m
consume data along with the 2nd largest internet
market by 2015 expected to drive an rise in
video consumption
� Young India is driving internet usage and half of
their time is spent on Entertainment
� A Linear Channel Exclusively for “People on the
Go” with a mix of original and existing short
form content
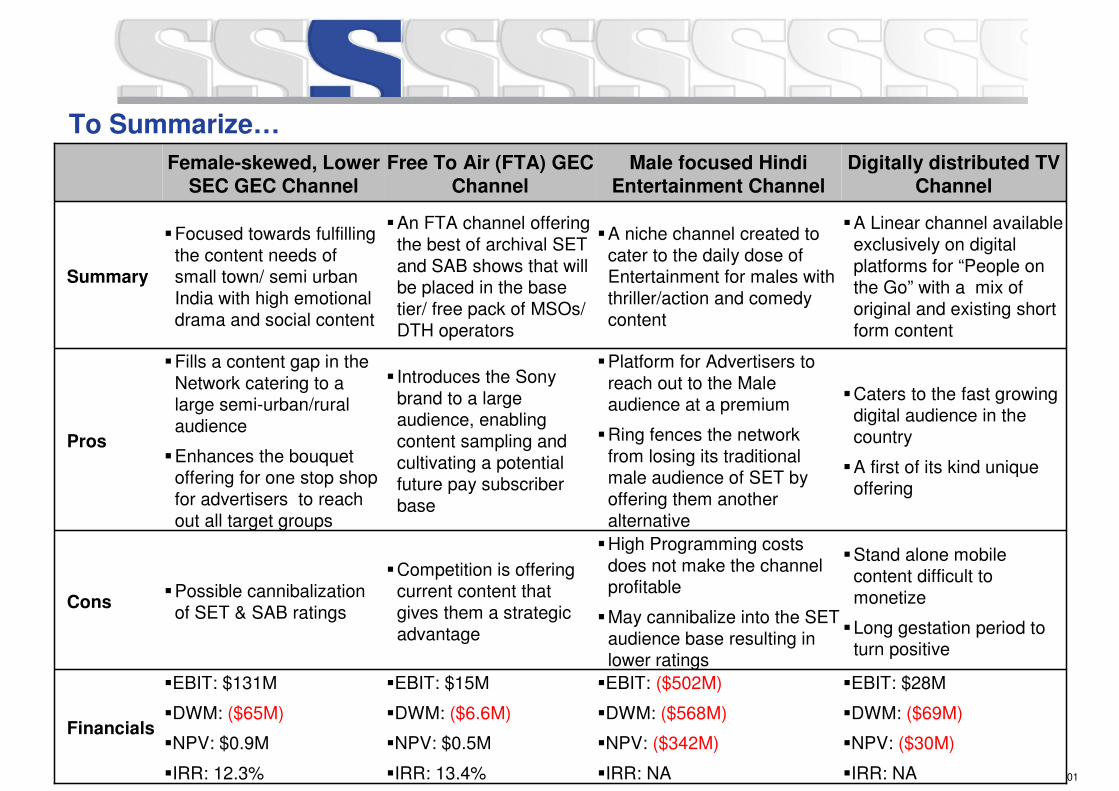
101- Confidential -
To Summarize…
Female-skewed, Lower SEC GEC Channel
Free To Air (FTA) GEC Channel
Male focused Hindi Entertainment Channel
Digitally distributed TV Channel
Summary
�Focused towards fulfilling the content needs of small town/ semi urban India with high emotional drama and social content
�An FTA channel offering the best of archival SET and SAB shows that will be placed in the base tier/ free pack of MSOs/ DTH operators
�A niche channel created to cater to the daily dose of Entertainment for males with thriller/action and comedy content
�A Linear channel available exclusively on digital platforms for “People on the Go” with a mix of original and existing short form content
Pros
�Fills a content gap in the Network catering to a large semi-urban/rural audience
�Enhances the bouquet offering for one stop shop for advertisers to reach out all target groups
� Introduces the Sony brand to a large audience, enabling content sampling and cultivating a potential future pay subscriber base
�Platform for Advertisers to reach out to the Male audience at a premium
�Ring fences the network from losing its traditional male audience of SET by offering them another alternative
�Caters to the fast growing digital audience in the country
�A first of its kind unique offering
Cons�Possible cannibalization
of SET & SAB ratings
�Competition is offering current content that gives them a strategic advantage
�High Programming costs does not make the channel profitable
�May cannibalize into the SET audience base resulting in lower ratings
�Stand alone mobile content difficult to monetize
�Long gestation period to turn positive
Financials
�EBIT: $131M
�DWM: ($65M)
�NPV: $0.9M
�IRR: 12.3%
�EBIT: $15M
�DWM: ($6.6M)
�NPV: $0.5M
�IRR: 13.4%
�EBIT: ($502M)
�DWM: ($568M)
�NPV: ($342M)
�IRR: NA
�EBIT: $28M
�DWM: ($69M)
�NPV: ($30M)
�IRR: NA

102- Confidential -
MSM – Industry Update and the Road aheadMan Jit Singh
10 June 2013