morning insight - kotak securities
TRANSCRIPT

MAY 11, 2018
Kotak Securities Limited has two independent equity research groups: Institutional Equities and Private Client Group. This report has been prepared by the Private Client Group. The views and opinions expressed in this document may or may not match or may be contrary with the views, estimates, rating, target price of the Institutional Equities Research Group of Kotak Securities Limited.
Morning Insight
News Highlights SC Asks Centre to Decide About Banning Petroleum Coke Import
by June 30.It also asked the government to consider implementing the National Clean Air Programme (NCAP) first in Delhi. (BS)
India rejects US charge on price support steps breaching WTO rules. The US specifically targeted the minimum support prices provided by India which enable states and the central government to sustain/undergird its public distribution programmes.(Mint)
SEBI has asked listed companies to split the post of Chairman and Managing Director by April 2020. It has also made it compulsory for them to have six independent directors on board, including a women director. (BL)
Reliance may set up 4 new subsidiaries. The new Reliance subsidiaries could be in refining and marketing, exploration and production (E&P), petrochemicals, textiles, hydrocarbons and real estate.(Mint)
The board of Fortis Healthcare Ltd approved a binding offer from Sunil Munjal’s Hero Enterprise and Dabur chairman Anand Burman’s family office. As per the current offer, the Hero-Burman consortium will infuse Rs8bn through a preferential allotment of equity shares at Rs167 a share. The group will put in another Rs10bn through warrants at Rs176 per share.(Mint)
HDFC Bank Ltd, India’s top lender by market value, is looking for a successor to managing director and chief executive officer Aditya Puri who will retire in 2020.(Mint)
Siemens Ltd, the Indian arm of global engineering giant Siemens AG, is keen on tapping the business opportunity created by stressed assets in the country’s banking system.(Mint)
Jaypee group has offered 2,000 equity shares of Jaypee Infratech for free to each home buyer as part of its Rs 100 billion proposal to revive the bankruptcy-hit real estate firm.(BS)
PC Jeweller approved buyback of up to 12.1 mn shares at Rs 350. The company said the aggregate amount will not exceed Rs 4.24bn.(EAT)
What’s Inside Result Update: Kajaria Ceramics, Voltamp, Asian Paints & Zee
Entertainment Enterprises
Source: ET = Economic Times, BS = Business Standard, FE = Financial Express, IE = Indian Express, BL = Business Line, ToI: Times of India, BSE = Bombay Stock Exchange
Equity10-May 1 Day 1 Mth 3 Mths
Indian Indices SENSEX Index 35,246 (0.2) 4.0 3.6 NIFTY Index 10,717 (0.2) 3.0 2.5 NSEBANK Index 26,131 (0.1) 3.6 2.6 NIFTY 500 Index 9,361 (0.6) 1.5 1.2 CNXMcap Index 19,424 (1.6) (1.1) (2.3) BSESMCAP Index 17,840 (1.4) (0.6) (1.8)
World IndicesDow Jones 24,740 0.8 2.3 2.3 Nasdaq 7,405 0.9 4.8 7.7 FTSE 7,701 0.5 6.1 8.6 NIKKEI 22,497 0.4 4.6 6.1 Hangseng 22,497 0.4 4.6 6.1 Shanghai 30,809 0.9 0.7 5.4
Value traded (Rs cr)Cash BSE (9.1) Cash NSE (0.6) Derivatives 76.1
Net inflows (Rs cr) 9-May MTD YTDFII (690) (2,943) 4,454Mutual Fund 727 2,762 48,515
Nifty Gainers & Losers Price Chg Vol10-May (Rs) (%) (mn)
GainersONGC 188 3.0 10.3 Bharti Airtel 412 2.4 8.1 Tech Mahindra 664 1.5 3.9
LosersDr. Reddy's 1,990 (3.6) 0.7 Tata Motors 334 (2.4) 11.2 Indiabulls Housing 1,209 (2.2) 0.9
Advances / Declines (BSE)10-May A B T Total % totalAdvances 71 252 38 361 100 Declines 319 814 93 1,226 340 Unchanged 2 17 5 24 7
Commodity10-May 1 Day 1 Mth 3 Mths
Crude (US$/BBL) 77.4 (0.1) 7.4 23.2 Gold (US$/OZ) 1,322 0.7 (2.5) 0.3 Silver (US$/OZ) 16.7 1.4 0.1 2.0
Debt / forex market 10-May 1 Day 1 Mth 3 Mths10 yr G-Sec yield % 7.7 7.7 7.4 7.5 Re/US$ 67.3 67.3 65.0 64.3
Nifty
Source: Bloomberg
% Chg
1,146,074
% Chg
% Chg Day10-May2,727
28,773
9,000
9,550
10,100
10,650
11,200
May-17 Aug-17 Nov-17 Feb-18 May-18

Kotak Securities – Private Client Research Please see the Disclosure/Disclaimer on the last page For Private Circulation 2
MAY 11, 2018
KAJARIA CERAMICS LTD PRICE RS.527 TARGET RS.648 BUY Kajaria Ceramics results were marginally lower than our estimates due to rise in power and fuel cost and pressure on realizations. Management has reduced the guidance for margins going forward owing to higher gas prices but expects to grow volumes by 12-15% going forward. Loss making JVs have now achieved break-even and are now expected to make profits going forward.
Key highlights
Revenue growth of 4.2% YoY was led largely by volume growth as realization growth remained largely subdued. Operating margins were under pressure due to higher gas prices and higher proportion of outsourced tiles. Net profit performance on YoY basis was impacted by fall in margins.
Valuation and outlook
Stock is currently trading at valuations of 27.2x and 24.5x on FY19 and FY20 estimates respectively. We revise our estimates to factor in slightly lower realizations and higher costs while keeping the volume growth intact. We arrive at a revised price target of Rs 648 based on 30x FY20 estimated earnings (Rs 694 earlier). We believe that though the shift from unorganized to organized players post GST implementation has not happened to a large extent so far, but with e-way bill implementation, organized players like Kajaria Ceramics are likely to benefit with market leading position and wide offering of products. This is likely to be reflected in 1-2 quarters. We remain positive on the company and upgrade the stock to BUY from ACCUMULATE earlier.
Consolidated financial highlights
(Rs mn) Q4FY18 Q4FY17 YoY (%) Q3FY18 QoQ (%)
Net Sales 7500 7197 4.2 6612 13.4
Total Expenditure 6300 5899 6.8 5512 14.3
EBITDA 1201 1298 (7.5) 1100 9.2
EBITDA (%) 16.0 18.0 16.6
Depreciation 229 205 223
EBIT 972 1093 (11.0) 877 10.8
Interest 47.0 78.2 52.2
EBT(exc other income) 925 1015 (8.8) 825 12.2
Other Income 51 88 18
PBT 977 1102 (11.4) 843 15.9
Tax 280 381 311
Tax (%) 28.7 34.5 37.0
PAT 696 722 (3.5) 531 31.1
Minority Interest 36.6 14.7 (12.0)
Consolidated Net Profit 660 707 (6.7) 543 21.5
NPM (%) 8.8 9.8 8.2
Equity Capital 159 159 159
Face Value (In Rs) 1.0 1.0 1.0
Basic EPS before Extraordinary Items 4.2 4.5 (6.7) 3.4 21.5
Source: Company
Financial Summary
Y/E Mar (Rs mn) FY18 FY19E FY20E
Sales 27,106 31,915 35,064
Growth (%) 6.3 17.7 9.9
EBITDA 4,564 5,649 6,206
EBITDA margin (%) 16.8 17.7 17.7
Net profit 2,344 3,090 3,432
EPS(Rs) 14.7 19.4 21.6
Growth (%) 9.0 31.8 11.1
BVPS (Rs) 85.0 100.8 118.8
DPS (Rs) 3.0 3.0 3.0
ROE (%) 18.6 20.9 19.7
ROCE (%) 22.0 25.5 25.5
P/E (x) 35.8 27.2 24.5
EV/EBITDA (x) 18.8 15.0 13.5
P/BV (x) 6.2 5.2 4.4
Source: Kotak Securities - PCG; Company
Market cap (Rs mn) : 83989
52-wk Hi/Lo (Rs) : 790 / 501
Face Value (Rs) : 2
3M Avg. daily vol : 444,852
Shares o/s (m) : 159
Source: Bloomberg
Result Update
Stock Details
(%) Mar-18 Dec-17 Sep-17
Promoters 47.6 47.6 47.6
FII 28.1 28.7 27.6
DII 9.2 7.4 6.1
Others 15.1 16.3 18.7
Source: Company
(%) 1M 3M 6M
Kajaria Ceramics (5.1) (14.2) (25.5)
Nifty 3.0 2.5 3.8
Source: Bloomberg
Source: Bloomberg
Price chart
Shareholding Pattern (%)
Price Performance (%)
500
600
700
800
May-17 Sep-17 Jan-18 May-18
Teena [email protected]+91 22 6218 6432

Kotak Securities – Private Client Research Please see the Disclosure/Disclaimer on the last page For Private Circulation 3
MAY 11, 2018
Revenue growth boosted by volume gains while realization growth remained subdued
Revenue for Q4FY18 were marginally lower than our estimates owing to lower than expected realizations. Growth was largely led by 4.8% YoY volume improvement. Average realization for Q4FY18 declined on YoY basis by 0.5% due to pressure on GVT realizations as well as higher proportion of outsourced tiles having lower realizations. With implementation of e-way bill, company expects the differential between unorganized and organized to come down. Going ahead, we also expect company to improve its market share by capturing the market share of unorganized players as well as with improvement in product mix.
For Q4FY18, consolidated revenues reported a growth of 4.2% YoY. Sequentially sales have improved by 13.4% led by 15.3% volume growth. Average realizations for Q4FY18 were down by 0.5% YoY and 1.6% QoQ and stood at Rs 371 per sq m
Realizations improved by 2.6% YoY from own manufacturing plants on yearly basis but declined sharply by 8.5% YoY from JV plants due to increased competition. Realizations from own production stood at Rs 375 per sq m;
Realizations from JV plants stood at Rs 321 per sq m, down by 8.5% YoY;
Realizations from imported products stood at Rs 292 per sq m, down by 7.1% YoY.
Volumes were up by 4.8% YoY largely led by volume improvement from owned plants and outsourced segment.
Revenues from own production improved by 10.3% YoY and was led by both volume improvement of 7.4% YoY and pricing improvement of 2.6% YoY.
Revenues from JVs declined by 18.3% YoY due to 10.7% YoY decline in JV volumes and 8.5% decline in JV realizations. This was impacted by poor utilization levels at its JV plant and increased competition.
Sales from imports has gone up by 19.6% YoY led by 28.8% YoY jump in volumes.
Sanitaryware and faucets division has reported 35.5% YoY improvement in revenues. Volumes are likely to improve going forward with improved demand.
Sales volume break up (mn sq mtr) Revenues (Rs mn)
Source: Company Source: Company
11.3 10.52
5.41 6.06
3.53 2.74
0
5
10
15
20
25
Q4FY18 Q4FY17
Own mfg JV Imports / outsourced
4241 3846
1738 2127
1031 862
491 362
0
2000
4000
6000
8000
Q4FY18 Q4FY17
Own mfg JV

Kotak Securities – Private Client Research Please see the Disclosure/Disclaimer on the last page For Private Circulation 4
MAY 11, 2018
We tweak our estimates and expect revenues to grow at a CAGR of 13.7% between FY18-20 led by a volume growth at a CAGR of 12.5% between FY18-20.
Kajaria analyst meet key takeaways
Company management expects volume to start growing in one-to-two quarters once E-way bill gets implemented fully. Share of organized players is likely to move up to 60 percent once E-way Bill gets fully implemented.
Sanitaryware division revenues are likely to grow by more than 40 percent in FY19
Gas prices are continuously moving up and likely to move up further in line with crude prices. Company intends to pass on the cost pressures to end user but pricing pressure still exists in some segments like GVT.
Company has started a plywood division and in first two years will focus only on trading. Out of their dealer network of 1400 dealers, 5 percent will add to plywood trading. It believes that Huge opportunity is available in organized plywood.
Housing for All to benefit Kajaria Ceramics too as Kajaria will have some presence in some low priced tiles which can be used for this project
Players like Varmora, Simpolo are getting aggressive but pricing pressure is not there. They are just situated at one location ie Morbi but Kajaria is catering to other regions too so it's difficult for them to become a national player too soon unless they diversify.
West bridge investment in sanitaryware was mainly to enhance the relationship and build a stronger brand.
Net addition of 130 dealers in FY18 and same pace will be maintained in future
JV problems are largely sorted out and expecting Rs 200 mn profit in FY19
Capacity addition - It can be through brown field or green field expansion of they plan addition in North while in south and western region, they can have a JV. It expects a capex of. Rs 1.5 bn in FY19. Branding spend Rs 1.1-1.15 bn in fy19. It plans to reach 100 mn sq m by 2021 through incremental additions and outsourcing.
Operating margins impacted by higher gas prices
Operating margins for the quarter stood at 16% vs 18% for Q4FY18. Margins were impacted due to higher power cost as well as higher proportion of outsourced tiles which have lower margins. We revise our estimates downwards to factor in higher gas prices, though we have witnessed minor correction in gas prices since beginning of FY19. We expect margins of 17.7% going forward (18%/19% estimated earlier for FY19/20 respectively) taking into account higher costs. Improved product mix is likely to aid margins from current levels.
Net profit performance impacted by fall in margins but boosted by decline in interest expense
Net profit performance on YoY basis was impacted by fall in margins but boosted by lower interest expense. Loss making JVs have achieved break-even and are now expected to make profits going forward. We revise our profit estimates downwards by 7.6%/6.7% for FY19/20 respectively and expect net profits to grow at a CAGR of 21% between FY18-20.

Kotak Securities – Private Client Research Please see the Disclosure/Disclaimer on the last page For Private Circulation 5
MAY 11, 2018
Valuation and recommendation
Stock is currently trading at valuations of 27.2x and 24.5x P/E on FY19 and FY20 estimates respectively. We revise our estimates to factor in slightly lower realizations and higher costs while keeping the volume growth intact. We arrive at a revised price target of Rs 648 based on 30x FY20 estimated earnings (Rs 694 earlier). We believe that though the shift from unorganized to organized players post GST implementation has not happened to a large extent so far, but with e-way bill implementation, organized players like Kajaria Ceramics are likely to benefit with market leading position and wide offering of products. We remain positive on the company and upgrade the stock to BUY from ACCUMULATE earlier.
Company background
Kajaria Ceramics is the largest manufacturer of ceramic/vitrified tiles in India and the 9th largest in the world. It has an annual capacity of 68.37 mn. sq. meters presently, distributed across eight plants - one in Sikandrabad (UP), one in Gailpur (Rajasthan), One in Malutana (Rajasthan), four in Morbi (Gujarat) and one in Vijaywada (AP).

Kotak Securities – Private Client Research Please see the Disclosure/Disclaimer on the last page For Private Circulation 6
MAY 11, 2018
Financials: Consolidated
Profit and Loss Statement (Rs mn)
(Year-end March) FY17 FY18 FY19E FY20E
Revenues 25,496 27,106 31,915 35,064 % change YoY 6.0 6.3 17.7 9.9
EBITDA 4,963 4,564 5,649 6,206 % change YoY 8.0 (8.1) 23.8 9.9
Other Income 154 116 100 100 Depreciation 814 885 964 1,088
EBIT 4,303 3,794 4,785 5,218 % change YoY 9.0 (11.8) 26.1 9.1 Net interest 340 241 191 105
Profit before tax 3,963 3,553 4,594 5,113 % change YoY 10.0 (10.3) 29.3 11.3
Tax 1,425 1,267 1,562 1,738 as % of PBT 36.0 35.7 34.0 34.0
Profit after tax 2,538 2,286 3,032 3,375 Minority interest and other CI 17 (58) (58) (58)
Net income 2,521 2,344 3,090 3,432 % change YoY 9.0 (7.0) 31.8 11.1
Shares outstanding (m) 158.9 159.0 159.0 159.0 EPS (reported) (Rs) 15.9 14.7 19.4 21.6 CEPS (Rs) 21.0 20.3 25.5 28.4 DPS (Rs) 3.00 3.00 3.00 3.00
Source: Company, Kotak Securities – Private Client Research Cash Flow Statement (Rs mn)
(Year-end March) FY17 FY18 FY19E FY20E
EBIT 4,286 3,852 4,843 5,276 Depreciation 814 885 964 1,088
Change in working capital (303) (1,305) (176) (610) Changs in other net current assets 39 (207) 325 -
Operating cash flow 4,836 3,226 5,955 5,754 Interest (340) (241) (191) (105)
Tax (1,425) (1,267) (1,562) (1,738) Cash flow from operations 3,071 1,718 4,202 3,911 Capex (1,386) (657) (2,500) (2,500) (Increase)/decrease in investments - - - -
Cash flow from investments (1,386) (657) (2,500) (2,500) Proceeds from issue of equity - 0 - -
Increase/(decrease) in debt (991) (173) (1,000) (1,000) Proceeds from share premium - (12) - -
Dividends (381.4) (572.0) (572.4) (572.4) Cash flow from financing (1,372) (757) (1,572) (1,572) Opening cash 199 520 824 954 Closing cash 512 824 954 792
Source: Company, Kotak Securities – Private Client Research
Balance sheet (Rs mn)
(Year-end March) FY17 FY18 FY19E FY20E
Cash and cash equivalents 520 824 954 792
Accounts receivable 3,389 4,507 4,648 5,107 Inventories 3,720 3,785 4,418 4,854
Loans and Adv & Others 795 574 635 669 Current assets 8,424 9,689 10,655 11,422
Other non-current assets 121 82 82 82 LT investments 1 4 4 4
Net fixed assets 11,856 11,627 13,163 14,575 Total assets 20,401 21,403 23,905 26,084 Payables 2,921 2,578 3,237 3,556
Others 655 580 580 580 Current liabilities 3,576 3,158 3,817 4,137
Provisions 308 248 572 572 LT debt 2,900 2,728 1,728 728
Min. int and def tax liabilities 1,866 1,759 1,759 1,759 Equity 159 159 159 159
Reserves 11,592 13,351 15,869 18,728 Total liabilities 20,401 21,403 23,905 26,084 BVPS (Rs) 74 85 101 119
Source: Company, Kotak Securities – Private Client Research Ratio Analysis
(Year-end March) FY17 FY18 FY19E FY20E
EBITDA margin (%) 19.5 16.8 17.7 17.7
EBIT margin (%) 16.9 14.0 15.0 14.9 Net profit margin (%) 9.9 8.6 9.7 9.8
Receivables (days) 43.9 53.2 53.2 53.2
Inventory (days) 54.1 50.5 50.5 50.5 Sales/assets (x) 2.2 2.3 2.4 2.4
Interest coverage (x) 12.7 15.7 25.1 49.6
Debt/equity ratio(x) 0.3 0.2 0.2 0.1 ROE (%) 23.6 18.6 20.9 19.7
ROCE (%) 27.0 22.0 25.5 25.5
EV/ Sales (x) 3.4 3.2 2.7 2.4 EV/EBITDA (x) 17.4 18.8 15.0 13.5
Price to earnings (x) 33.3 35.8 27.2 24.5 Price to book value (x) 7.1 6.2 5.2 4.4
Price to Cash Earnings (x) 25.2 26.0 20.7 18.6
Source: Company, Kotak Securities – Private Client Research

Kotak Securities – Private Client Research Please see the Disclosure/Disclaimer on the last page For Private Circulation 7
MAY 11, 2018
VOLTAMP LTD PRICE RS.1189 TARGET RS.1349 BUY Voltamp reported mixed set of numbers for the quarter as though the revenue missed our estimates, this was offset by higher than expected EBITDA margins. Lower than expected other income led to profit miss.
Key Highlights
The demand scenario for capital goods makers in general remains weak. In this scenario, the company’s focus remains on taking good quality orders that are fairly priced and have reasonably good credit profile. This is manifested in the company’s balance sheet which has shown further improvement in working capital turns and cash generation.
Valuation and Outlook
Voltamp is currently trading at 12.7x and 11.7x FY19E and FY20E earnings respectively. Valuations are attractive compared to peers and more so considering that management remains prudent and has been able to preserve quality of balance sheet even through years of industry distress. Voltamp remains one of the best stocks to play future upturn in industrial demand. Maintain BUY with unchanged price target of Rs 1350, valuing the stock at 13x FY20E earnings.
Q4FY18 Results
(Rs mn) Q4 FY18 Q4 FY17* YoY (%) Q3 FY18 QoQ (%)
Net Sales 2,196 2,297 (4.4) 1,601 37.1
Consumption of Raw Materials 1,752 1,852 (5.4) 1,183 48.1
Staff Cost 68 62 10.2 63 7.0
Other Expenditure 86 68 25.9 168 (48.6)
Operating Expenditures 1,905 1,982 (3.9) 1,413 34.8
PBDIT 290 315 (7.9) 188 54.7
Depreciation 16 16 1.3 16 1.3
Other Income 37 77 (51.9) 123 (70.0)
EBIT 311 377 (17.3) 295 5.5
Interest & Finance Charges 2.7 1.9 42.1 0.8 237.5
Profit / (Loss) before tax 309 375 (17.6) 294 4.9
Tax provision 108 123 (12.8) 58 84.1
Profit / (Loss) after tax 201 251 (19.9) 236 (14.8)
EPS (Rs) 19.9 24.9 (19.9) 23.4 (14.8)
Ratios
EBITDA (%) 11.6 13.7 11.7
Raw material cost to sales (%) 79.8 80.6 73.9
Other exp to sales (%) 3.9 3.0 10.5
Tax rate (%) 34.9 32.9 19.9
Source: Company, * restated
Reported Vs Estimated performance
(Rs mn) Reported Estimated
Revenue 4862 4200
EBITDA (%) 14.4% 15.1%
PAT 434 453
Source: Kotak Securities – Private Client Research
Financial Summary
Y/E Mar (Rs mn) FY18 FY19E FY20E
Revenue 6,390 7,029 7,732
Growth (%) 4.6 10.0 10.0
EBITDA 660 753 840
EBITDA margin (%) 10.3 10.7 10.9
PAT 735 944 1,025
EPS 72.7 93.5 101.4
EPS Growth (%) 4.3 28.5 8.5
BV (Rs/share) 614 690 774
Dividend/share (Rs) 15.0 15.0 15.0
ROE (%) 12.7 14.3 13.9
ROCE (%) 12.7 14.2 13.8
P/E (x) 16.3 12.7 11.7
EV/EBITDA (x) 12.5 10.0 8.3
P/BV (x) 2.0 1.7 1.6
Source: Kotak Securities - PCG; Company
Market cap (Rs mn) : 11997
52-wk Hi/Lo (Rs) : 1426 / 932
Face Value (Rs) : 10
3M Avg. daily volume : 18,854
Shares o/s (m) : 10
Source: Bloomberg
Result Update
Stock Details
(%) Mar-18 Dec-17 Sep-17
Promoters 47.5 47.5 47.5
FII 15.6 16.3 16.3
DII 20.1 18.9 18.9
Others 16.8 17.4 17.3
Source: Company
Shareholding Pattern (%)
(%) 1M 3M 6M
Voltamp Ltd 1.5 14.3 2.8
Nifty 3.0 2.5 3.8
Source: Bloomberg
Source: Bloomberg
Price chart
Price Performance (%)
950
1,050
1,150
1,250
1,350
May-17 Sep-17 Jan-18 May-18
Sanjeev Zarbade
+91 22 6218 6424
Kotak Securities – Private Client Research Please see the Disclosure/Disclaimer on the last page For Private Circulation 8
MAY 11, 2018
Result Highlights
Net sales declined 4% y-o-y during the quarter to Rs 2.2 bn. While revenue booking has been weak in Q4FY18, we need to highlight that the decline in revenue has come off a high base of Q4FY17.
Note that the revenues of Q4FY17 were aided by spillover of some portion of sales pertaining to Q3FY17. This was mainly caused by labour related disruption in Q3FY17 which lasted for sixteen days.
Having said that, there is no denying that the demand environment for industrial transformers has remained weak. Moreover, emerging demand drivers like the Solar and Wind power sectors saw a setback during the year due to uncertainty on duty structure (Solar) and transition from feed-in tariffs to competitively-bid power (Wind).
Gross margins expanded to 20.2% in the quarter, a gain of 85 bps on a y-o-y basis, aided by richer product mix and improved pricing of orders.
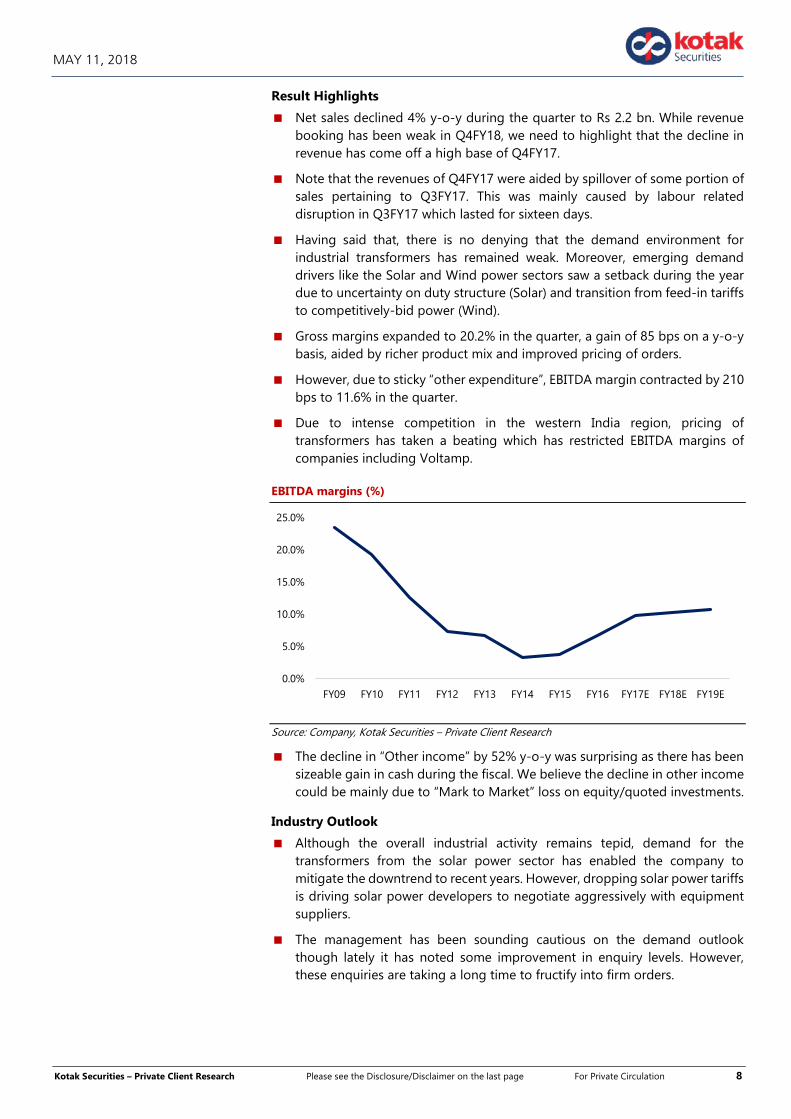
However, due to sticky “other expenditure”, EBITDA margin contracted by 210 bps to 11.6% in the quarter.
Due to intense competition in the western India region, pricing of transformers has taken a beating which has restricted EBITDA margins of companies including Voltamp.
EBITDA margins (%)
Source: Company, Kotak Securities – Private Client Research
The decline in “Other income” by 52% y-o-y was surprising as there has been sizeable gain in cash during the fiscal. We believe the decline in other income could be mainly due to “Mark to Market” loss on equity/quoted investments.
Industry Outlook
Although the overall industrial activity remains tepid, demand for the transformers from the solar power sector has enabled the company to mitigate the downtrend to recent years. However, dropping solar power tariffs is driving solar power developers to negotiate aggressively with equipment suppliers.
The management has been sounding cautious on the demand outlook though lately it has noted some improvement in enquiry levels. However, these enquiries are taking a long time to fructify into firm orders.
0.0%
5.0%
10.0%
15.0%
20.0%
25.0%
FY09 FY10 FY11 FY12 FY13 FY14 FY15 FY16 FY17E FY18E FY19E

Kotak Securities – Private Client Research Please see the Disclosure/Disclaimer on the last page For Private Circulation 9
MAY 11, 2018
The outlook for transformer demand from the Wind power sector has improved going into FY19 as the “Solar Energy Corporation of India” and distribution utilities in Gujarat, Maharashtra and Tamil Nadu have issued bids for wind-power capacity of 7.5 GW over the past 14 months.
On the Solar Energy front, the government is ready with tenders for an addition of 20 gigawatt (20,000 mega watt) solar power, with the successful bidder mandated to have production facility to manufacture nearly half the equipment requirement.
These developments will support demand for transformers and offset the slack in traditional market like Power and Core sectors.
However, despite the positives, the overall demand scenario is expected to be modestly better than FY18, given the weak demand from industrial sector.
Balance Sheet Highlights
Receivables in terms of DSO stands at 83 days in FY18, down from 92 days in FY17.
Cash and Investment stands at ~ Rs 3.7 bn, 31% of the company’s market cap.
Voltamp remains one of the best managed companies in the transformer space.
Minor change in earnings - FY19E
Earlier Revised
Revenue 7144 7029
EBITDA (%) 10.2 10.7
EPS 92 93.5
Source: Kotak Securities – Private Client Research
Valuation and Outlook
Voltamp is currently trading at 12.7x and 11.7x FY19E and FY20E earnings respectively. Valuations are attractive compared to peers and more so considering that management remains prudent and has been able to preserve quality of balance sheet even through years of industry distress. Voltamp remains one of the best stocks to play future upturn in industrial demand.
Company Background
Voltamp Transformers Ltd was established in the year 1963 by Mr. Lalitkumar H. Patel along with Mr. Babubhai H. Patel and Mr. Navinchandra R. Patel to manufacture transformers in Baroda city. The main promoter is, Mr Kunjalbhai Patel (VC and MD) and is a technocrat. Voltamp has a manufacturing capacity of 13000 MVA capable of making transformers upto 160 MVA, 220 KV, class for many applications covering most segments of users including industrial, utility and buildings. The company caters to a wide spectrum of transformer users in various industries like: petrochemical, oil refining, cement, paper and pulp, pharmaceuticals, automobiles, steel, power plant, building, metro rail applications, mining and minerals and many others.

Kotak Securities – Private Client Research Please see the Disclosure/Disclaimer on the last page For Private Circulation 10
MAY 11, 2018
Financials: Consolidated
Profit and Loss Statement (Rs mn)
(Year-end March) FY17 FY18 FY19E FY20E
Revenues 6,109 6,390 7,029 7,732 % change yoy 8.5 4.6 10.0 10.0
EBITDA 602 660 753 840 % change yoy 60.8 9.6 14.1 11.5
Depreciation 58.1 59.9 70.0 78.0 EBIT 944 1,007 1,193 1,302 % change yoy 58.0 6.7 18.5 9.1
Net Interest 5.1 5.6 5.0 5.0 Earnings Before Tax 939 1,001 1,188 1,297
% change yoy 58.3 6.6 18.7 9.2 Provisions and amortisations - - - -
Tax 235 267 244 273 as % of EBT 25.0 26.6 20.6 21.0
Net Income adj 704 735 944 1,025 % change yoy 60.1 4.3 28.5 8.5
Preference dividend 0.0 0.0 0.0 0.0 Adj Net income for equityholders 704 735 944 1,025
Shares outstanding (m) 10.1 10.1 10.1 10.1 EPS (Rs) 69.7 72.7 93.5 101.4 DPS (Rs) 15.0 15.0 15.0 15.0 CEPS 75.5 78.7 100.4 109.2
Source: Company, Kotak Securities – Private Client Research Cash Flow Statement (Rs mn)
(Year-end March) FY17 FY18 FY19E FY20E
PBDIT 602 660 753 840 Tax and adjustments (108) 33 (244) (273)
Cash flow from operations 494 694 509 568 Net Change in Working Capital 127 (125) (1) (229)
Net Cash from Operations 622 569 508 338 Capital Expenditure (58) (126) (100) (100)
Cash from investing (349) (296) 510 540 Net Cash from Investing (406) (422) 410 440
Interest paid (5) (6) (5) (5) Issue of Shares - - - -
Dividends Paid (152) (177) (177) (177) Debt Raised - - - -
Net cash from financing (157) (183) (182) (182) Net change in cash 58 (36) 736 596
Free cash flow 564 443 408 238 Cash at end 42 83 819 1,414
Source: Company, Kotak Securities – Private Client Research
Balance sheet (Rs mn)
(Year-end March) FY17 FY18 FY19E FY20E
Cash and cash equivalents 42 83 819 1,414
Accounts receivable 1,538 1,446 1,348 1,483 Stocks 825 970 1,021 1,123
Loans and Advances 85 97 114 135 Others - - - -
Current Assets 2,490 2,595 3,301 4,155 LT investments 2,945 3,647 3,647 3,647
Net fixed assets 372 422 452 474 Deferred tax assets 22 - - -
CWIP 23 38 38 38 Total Assets 5,851 6,703 7,439 8,314 Payables 330 349 312 333
Others 146 65 72 79 Current liabilities 476 414 384 412 LT debt - - - - Other liabilities (defd tax+minority int) - 84 84 84
Equity & reserves 5,375 6,201 6,968 7,815 Total Liabilities 5,851 6,703 7,439 8,314 BVPS (Rs) 532 614 690 774
Source: Company, Kotak Securities – Private Client Research Ratio Analysis
(Year-end March) FY17 FY18 FY19E FY20E
EBITDA margin (%) 9.9 10.3 10.7 10.9
EBIT margin (%) 15.5 15.8 17.0 16.8 Net profit margin (%) 11.5 11.5 13.4 13.3
Adjusted EPS growth (%) 60.1 4.3 28.5 8.5
Receivables (days) 91.9 82.6 70.0 70.0 Inventory (days) 49.3 55.4 53.0 53.0
Sales / Net Fixed Assets (x) 16.4 15.1 15.5 16.3 ROE (%) 14.0 12.7 14.3 13.9
ROCE (%) 14.0 12.7 14.2 13.8
EV/ Sales 1.5 1.3 1.1 0.9 EV/EBITDA 15.0 12.5 10.0 8.3
Price to earnings (P/E) 17.1 16.3 12.7 11.7 Price to book value (P/B) 2.3 2.0 1.7 1.6
Price to cash earnings 15.8 15.1 11.8 10.9
Source: Company, Kotak Securities – Private Client Research

Kotak Securities – Private Client Research Please see the Disclosure/Disclaimer on the last page For Private Circulation 11
MAY 11, 2018
ASIAN PAINTS LTD (APL) PRICE RS.1215 TARGET RS.1320 ACCUMULATE Double digit volume growth in the decorative segment, stable volumes in the industrial segment and raw material price inflation were the highlights of the results for APL during the quarter.
Key Highlights
As per management commentary, APL experienced double digit YoY growth in the decorative segment. Healthy automotive demand and improved demand in the industrial segment led to strong performance of the entire industrial segment.
Nepal, Oman and Bangladesh contributed to good performance of international operations.
Both the underperforming segments of Home improvement business including Kitchen (Sleek) and bathroom (EssEss), have reported strong financial performance which is healthy for the company.
Management also indicated that the raw material prices remained at higher levels for the company during the quarter which impacted operational performance. Management has taken a price hike of 2.9% in March 2018 to counter the increase in raw material prices (total price hike taken 7% in FY18).
Other expenditure was significantly high in the quarter (+8.8% YoY and +29.2% QoQ), which impacted the operational performance.
Revenue was reported at Rs 44.8 bn (+13.4% YoY) with EBIDTA margin of 18.7% and PAT of Rs 4.96 bn. We interpret the results as healthy. Company has announced a final dividend of Rs 6 per share (total dividend Rs 8.7 per share for FY18).
Quarterly consolidated Performance
(Rs mn) Q4FY17 Q3FY18 Q4FY18 YoY (%) QoQ (%)
Net Sales 39,524 42,605 44,836 13.4 5.2
QoQ (%) 0.4 -0.1 5.2
YoY (%) 7.7 8.2 13.4
Raw Material 22,194 24,611 25,447 14.7 3.4
Employee 2,652 2,710 2,761 4.1 1.9
Other expenses 7,560 6,373 8,229 8.8 29.1
Total operating expenses 32,406 33,694 36,437 12.4 8.1
EBIDTA 7,118 8,911 8,399 18.0 (5.7)
EBIDTA margin 18.0 20.9 18.7 4.0 (10.4)
Depreciation 835 896 914 9.5 2.0
EBIT 6,283 8,015 7,485 19.1 (6.6)
Interest 90 92 91 1.1 (1.1)
Other income 701 497 392 (44.1) (21.1)
Exceptional 0 0 0
PBT 6,894 8,420 7,786 12.9 (7.5)
Taxes 2,204 2,913 2,877 30.5 (1.2)
PAT 4,690 5,507 4,909 4.7 (10.9)
JV /Associate 106 165 50
Reported PAT 4,796 5,672 4,959 3.4 (12.6)
Equity 959 959 959
EPS 5.0 5.9 5.2 3.4 (12.6)
Source: Company
Financial Summary
Y/E Mar (Rs mn) FY18 FY19E FY20E
Revenue 1,68,244 1,87,598 2,10,250
Growth (%) 10.0 11.5 12.1
EBITDA 31,975 3,312 3,622
EBITDA margin (%) 19.0 19.2 19.4
PAT 20,271 24,732 28,099
EPS 21.1 25.8 29.3
EPS Growth (%) 0.5 22.0 13.6
BV (Rs/share) 99.5 115.0 133.5
Dividend/share (Rs) 8.7 9.5 10.0
ROE (%) 22.6 24.0 23.6
ROCE (%) 32.7 32.9 32.5
P/E (x) 57.5 47.1 41.5
EV/EBITDA (x) 33.0 29.3 25.9
P/BV (x) 12.2 10.6 9.1
Source: Kotak Securities - PCG; Company
Market cap (Rs mn) : 1165138
52-wk Hi/Lo (Rs) : 1262 / 1079
Face Value (Rs) : 1
3M Avg. daily volume : 826,002
Shares o/s (m) : 959
Source: Bloomberg
Result Update
Stock Details
(%) Mar-18 Dec-17 Sep-17
Promoters 52.8 52.8 52.8
FII 15.1 16.4 16.4
DII 11.8 9.8 9.3
Others 20.3 21.0 21.5
Source: Company
Shareholding Pattern (%)
(%) 1M 3M 6M
Asian Paints Ltd 5.0 7.4 3.1
Nifty 3.0 2.5 3.8
Source: Bloomberg
Source: Bloomberg
Price chart
Price Performance (%)
1,080
1,130
1,180
1,230
1,280
May-17 Sep-17 Jan-18 May-18
Amit Agarwal
+91 22 6218 6439

Kotak Securities – Private Client Research Please see the Disclosure/Disclaimer on the last page For Private Circulation 12
MAY 11, 2018
Valuation and Outlook
We estimate that branded paint demand will remain robust in a country like India where per capita consumption is very low and 30% paint market is still unorganised. Management of APL also indicated that the volume trends remain strong for the company and expect the trend to continue in medium term. We broadly maintain our estimates. For APL, we estimate 11% volume CAGR over FY18 – FY20E with stable margins and ROE of ~23.6% and ROCE of ~32.5% for FY20E. Maintain Accumulate with an increased TP of Rs 1320 (from Rs 1300) at 45x FY20E earnings. which is a small premium for the market leader to valuation commanded by peers.
Management indicated the sales performance of Q4FY18 could be attributed to:
Double digit volume growth in the decorative segment post the festive season
Strong automotive demand with large number of new launches
Improved capex cycle in the economy (primarily government projects) leading to healthy demand in the industrial segment
Healthy performance of the international business aided by contribution from the units in Middle East, Nepal and Bangladesh.
Improved quarterly performance of Home improvement business including Kitchen (Sleek) and bathroom (EssEss).
Inexhaustive list of growth drivers for APL
Decorative Industrial
Favorable demographics New auto launches
Rising disposable income Government infra capex
Shift from unorganized industry Thrust on real estate sector
Shortening repainting cycle Strong demand for consumer durables
Increased per capita consumption Improving transportation industry
40000 + dealer base Volume CAGR of 10% over FY18 to 20E
Huge product portfolio across segments
Expectation of normal monsoon
Volume CAGR of 11% over FY18to 20E
Source: Kotak Securities – Private Client Research
Raw Material and Pricing Power
Paint Industry uses two key raw material including crude derivatives and Titanium Dioxide. The Paint industry is experiencing increase in prices of raw material since the last 3 quarters. Almost ~60% of the raw material are crude derivatives and with crude at $75/barrel (+30% YoY), prices of crude derivatives have also increased. Even prices of pigments like Titanium Dioxide, Iron oxide and Zinc oxide have increased. To counter this, the management of paint companies including APL have resorted to price increase and cost optimization.
We are not worried about the raw material situation, as paint companies always pass on the increase in raw material prices to customers without hurting the volumes. It is important to note that paint cost about 20% of overall painting cost and hence doesn’t influence paint demand.
We estimate the margins of the company to remain stable with intermittent price increases (and even decreases) based on demand and market situation.

Kotak Securities – Private Client Research Please see the Disclosure/Disclaimer on the last page For Private Circulation 13
MAY 11, 2018
Typical cost-sheet in a painting job
Particulars Cost %
Two coats of paints 20
Cost of labour 60
Other expenditure 5
Profit of the contractor 15
Total cost of painting 100
Source: Industry, Kotak Securities – Private Client Research
Prices of crude (US$/barrel) Prices of Titanium dioxide ( US$/MT)
Source: Bloomberg Source: Bloomberg
Current capacities and capex APL is further planning to set up paint manufacturing facilities in Mysore and Vizag. The capacities at both these manufacturing facilities will be built in a phased manner by APL (over the next 4 to 5 years) starting FY18, to cater to the future demand. Plus, APL is also upgrading and expanding its capacity at Ankleshwar Gujarat involving an investment of Rs 6.5 bn over the next 4 years .Apart from these fixed capital investments we estimate the company to spend Rs 3 bn per annum towards maintenance capex, translating to an approximate total capex of Rs 10 bn per annum.
Investment in new facilities by APL (over FY18 to FY22E)
Area Vizag Mysore Ankleshwar
Capacity (lakh Kilo Litre) 400000 600000 200,000
Investment (Rs bn) 17.5 23.0 6.5
Source: Company
Company Background
Asian Paints has come a long way since its small beginnings in 1942. It was set up as a partnership firm by four friends who were willing to take on the world's biggest, most famous paint companies operating in India at that time. Over the course of 25 years, Asian Paints became a corporate force and India's leading paints company. Driven by its strong consumer-focus and innovative spirit, the company has been the market leader in paints since 1967. Today, it is double the size of any other paint company in India. Asian Paints manufactures a wide range of paints for decorative and industrial use.
20
30
40
50
60
70
80
100
125
150
175
200

Kotak Securities – Private Client Research Please see the Disclosure/Disclaimer on the last page For Private Circulation 14
MAY 11, 2018
Financials: Consolidated
Profit and Loss Statement (Rs mn)
(Year-end March) FY17 FY18 FY19E FY20E
Revenues 1,52,903 1,68,244 1,87,598 2,10,250 % change YoY (1.6) 10.0 11.5 12.1
RawMaterial 84,653 94,026 1,04,625 1,16,919 Employee cost 7,361 8,176 9,098 10,167
Other expenses 30,672 34,067 37,908 42,362 Total Operating expd 1,22,686 1,36,269 1,51,631 1,69,448
EBITDA 30,217 31,975 35,967 40,802 Depreciation 3,388 3,604 3,550 3,850 EBIT 26,829 28,371 32,417 36,952 Other income 2,625 2,206 2,500 2,800 Interest expense 306 351 300 325
Profit before tax 29,148 30,226 34,617 39,427 Tax 9,479 10,408 10,385 11,828
ETR (%) 32.5 34.4 30.0 30.0 Profit after tax 19,669 19,818 24,232 27,599 JV & Associates 500 453 500 500 Net income 20,169 20,271 24,732 28,099
% change YoY 7.0 0.5 22.0 13.6 Shares outstanding (m) 959 959 959 959
EPS (Rs) 21.0 21.1 25.8 29.3
Source: Company, Kotak Securities – Private Client Research Cash Flow Statement (Rs mn)
(Year-end March) FY17 FY18 FY19E FY20E
PAT 20,169 20,271 24,732 28,099
Depreciation +DTL 4,336 4,645 4,589 5,033 Change in working capital 207 (1,304) (1,645) (1,925)
Cash flow from operations 24,712 23,612 27,675 31,206
Capex (3,766) (10,000) (10,000) (10,000) Investments 788 (480) - -
Cash flow from investments (2,978) (10,480) (10,000) (10,000)
Equity issuance - - - - Debt raised 684 (385) (346) (312)
Dividend Paid (11,852) (10,012) (10,933) (11,508) Miscellanous items - - - -
Cash flow from financing (11,169) (10,397) (11,279) (11,820)
Net cash flow 10,565 2,735 6,396 9,387 Opening cash 4,242 14,807 17,542 23,939
Closing cash 14,807 17,542 23,939 33,325
Source: Company, Kotak Securities – Private Client Research
Balance sheet (Rs mn)
(Year-end March) FY17 FY18 FY19E FY20E
Cash 14,807 17,542 23,939 33,325
Debtors 13,761 15,142 16,884 18,923 Inventory 27,523 30,284 33,768 37,845
Loans & advances 5,352 5,889 6,566 7,359 Other current assets 3,058 3,365 3,752 4,205 Total current assets 49,693 54,679 60,969 68,331 LT investments 26,520 27,000 27,000 27,000
Net fixed assets 33,678 40,074 46,524 52,674 Total assets 1,24,699 1,39,297 1,58,434 1,81,331 Creditors 18,348 20,189 22,512 25,230
Provisions 7,645 8,412 9,380 10,513 Other current liabilities 10,703 11,777 13,132 14,718 Total current liabilities 36,697 40,379 45,024 50,460 LT debt 3,849 3,464 3,117 2,806
Minority Interest 0 0 0 0 Equity Capital 9,590 9,590 9,590 9,590
Reserves 74,564 85,864 1,00,702 1,18,475 Networth 84,154 95,454 1,10,292 1,28,065 Total liabilities 1,24,699 1,39,297 1,58,434 1,81,331
Source: Company, Kotak Securities – Private Client Research Ratio Analysis
(Year-end March) FY17 FY18 FY19E FY20E
EBITDA margin (%) 19.8 19.0 19.2 19.4 EBIT margin (%) 17.5 16.9 17.3 17.6
Net profit margin (%) 13.2 12.0 13.2 13.4 ROE (%) 25.4 22.6 24.0 23.6
ROCE (%) 35.5 32.7 32.9 32.5 DPS 10.3 8.7 9.5 10.0
Dividend payout (%) 58.8 25.1 27.0 24.9
Book Value (Rs/share) 87.8 99.5 115.0 133.5 Working capital turnover (days) 31.3 43.0 43.7 43.7
Debt Equity (x) 0.0 0.4 0.2 0.0
PER (x) 57.8 57.5 47.1 41.5 P/C (x) 47.5 46.8 39.7 35.2
Dividend yield (%) 0.8 0.7 0.8 0.8 P/B (x) 13.8 12.2 10.6 9.1
EV/Sales (x) 7.4 6.7 6.0 5.4 EV/ EBITDA (x) 34.3 33.0 29.3 25.9
Source: Company, Kotak Securities – Private Client Research

Kotak Securities – Private Client Research Please see the Disclosure/Disclaimer on the last page For Private Circulation 15
MAY 11, 2018
ZEE ENTERTAINMENT ENTERPRISES LTD (ZEEL) PRICE RS.588 TARGET RS.623 ACCUMULATE Zee Entertainment reported EBITDA ahead of estimates, while PAT missed estimates on higher than expected effective tax rate. While earnings of the company are in line, reported balance sheet shows greater capital intensity required than we had earlier expected. Viewership assets of the company are strong, and growing, and we expect the stock shall continue to draw premium valuations. We value Zee Entertainment at 31x PER FY20E, or Rs 623 (Rs.610 earlier). ACCUMULATE (REDUCE earlier) as Zee TV’s ratings performance reduces concerns relating with impending tariff order implementation.
Key Highlights
Zee Entertainment reported strong advertising revenues on expected lines, as advertising environment improved. The company reported weaker than expected subscription revenues, in an environment of uncertainty over tariff order and its rollout.
EBITDA margin was impacted by launch of Zee5 and additional programming hours. Reported EBITDA was ahead of our estimates, while PAT missed estimates on high effective tax rate.
The company reported a significant rise in working capital as ZEEL is investing aggressively in content. Working capital requirements are likely to remain elevated in the near future.
Results Summary
Rs mn, FY Ends Mar 4QFY18 4QFY17 % chg y/y 3QFY18 % chg q/q
Income from operations 17,253 15,280 12.9 18,381 (6.1)
Advertising Revenues 10,496 8,469 23.9 12,020 (12.7)
Subscription Revenues 5,465 5,580 (2.0) 5,017 8.9
Other Sales 1,292 1,231 5.0 1,344 -3.8%Expenses 12,191 10,593 15.1 12,437 (2.0)
Operating Cost 6,893 6,527 5.6 6,730 2.4
Employee Expenses 1,638 1,593 2.9 1,535 6.7
Advertising and Publicity 1,326 1,073 23.5 1,796 (26.2)
Other Expenses 2,334 1,400 66.7 2,375 (1.7)
EBITDA 5,062 4,687 8.0 5,944 (14.8)
Margin (%) 29.3 30.7 32.3 (9.3)
Depreciation and Amortzn. 594 316 87.9 505 17.8
EBIT 4,468 4,371 2.2 5,440 (17.9)
Other Income 881 549 60.4 480 83.4
Financial Expenses 1,274 1,122 13.6 24 5300.0
Fair Value through P&L 1,032 (470) (319.4) 419 146.1
PBT 5,106 4,269 19.6 5,477 (6.8)
Exceptional Item 0 12,234 (100.0) 0 NM
Share of Profit from JV/ associates 6 103 (1) NM
PBT after exceptional items 5,112 16,606 (69.2) 5,477 (6.7)
Tax 2,805 1,464 91.6 2,260 24.2
Net Profit for the period 2,306 15,142 (84.8) 3,217 (28.3)
Source: Company Reports
Financial Summary
Y/E Mar (Rs mn) FY18 FY19E FY20E
Revenue 66,857 77,585 90,067
Growth (%) 3.9 16.0 16.1
EBITDA 20,761 24,464 29,352
EBITDA margin (%) 31.1 31.5 32.6
PAT 14,764 16,435 19,297
EPS 15.4 17.1 20.1
EPS Growth (%) -2.8% 12.7% 24.8%
BV (Rs/share) 75 85 96
Dividend/share (Rs) 2.9 4.2 9.8
ROE (%) 23.7 21.6 20.2
ROCE (%) 17.5 18.3 20.3
P/E (x) 38.2 35.2 30.1
EV/EBITDA (x) 26.8 22.4 18.4
P/BV (x) 7.5 6.4 5.9
Source: Kotak Securities - PCG; Company
Market cap (Rs mn) : 565707
52-wk Hi/Lo (Rs) : 619 / 458
Face Value (Rs) : 1
3M Avg. daily volume : 1,420,889
Shares o/s (m) : 960
Source: Bloomberg
Result Update
Stock Details
(%) Mar-18 Dec-17 Sep-17
Promoters 41.6 43.1 43.1
FII 41.4 42.3 43.9
DII 10.6 8.1 6.5
Others 6.2 6.6 6.6
Source: Company
Shareholding Pattern (%)
(%) 1M 3M 6M
Zee Entertainment 2.7 1.4 8.5
Nifty 3.0 2.5 3.8
Source: Bloomberg
Source: Bloomberg
Price chart
Price Performance (%)
460
490
520
550
580
610
May-17 Sep-17 Jan-18 May-18
+91 22 6218 6426
Ritwik Rai

Kotak Securities – Private Client Research Please see the Disclosure/Disclaimer on the last page For Private Circulation 16
MAY 11, 2018
Valuation & outlook
The company’s broadcasting operations are performing extremely well. While Regional GECs have been very consistent, Zee TV, the company’s flagship Hindi GEC has also staged a consistent comeback, and has been the leader in recent weeks. This reduces our concern on subscription revenues of the company and their sustenance following the implementation of the tariff order.
We expect elevated valuations of ZEEL to sustain; however, we believe the likelihood of a significant re-rating or positive earnings surprise is low while ZEEL continues to be in investment mode and earnings growth remains subdued. We see ZEEL as a buy into decline opportunity, as we upgrade the stock to ACCUMULATE (REDUCE earlier). We set a price target of Rs 623 (31X FY20E PER).
Key risks to our investment view/ estimates include competitive risks, regulatory risks (notably the risks from tariff order rollout)
Zee Entertainment reported revenues Rs 17.25 Bn, aided by domestic ad revenue growth of 25% (adjusted for sports) and 18% y/y growth in subscription revenues (adjusted for sports).
Advertising revenue growth was strong on the back of higher advertising spends in the quarter, added to viewership gains of Zee Entertainment. Subscription revenue growth in the year was affected by the uncertainty surrounding the implementation of TRAI’s tariff order, as also certain disputes with platform owners. International advertising revenues were strong (+26% y/y); however, international subscription revenues declined 8% y/y, in line with expectations.
During the quarter, the company launched ZEE5, which is Zee Entertainment’s big push in the OTT space. Due to this, along with weak base in 4QFY17 (owing to demonetization), advertising and publicity expenses came in 23.5% higher; other expenses also registered high growth. Even so, reported expenses came in lower than estimates.
Reported EBITDA was 10% ahead of estimates. Reported PAT came in lower than estimates on high effective tax rate (effect of tax on dividends from subsidiary from sale proceeds of sports business).
Outlook and Investment View
On the conference call, the management has indicated that industry advertising revenue growth for FY19 is likely to be 12-13%, and ZEEL could be higher/ lower depending on the degree of outperformance relative to the industry. Subscription revenue growth for the coming year is likely to be in the early teens, given that there is still no resolution of the matter of tariff order. The company has indicated that costs relating to new ventures shall continue to be elevated in the coming year as the company invests aggressively in content and marketing. As a result, the management has guided for a 30%+ EBITDA margin in FY19.
We estimate 16%/16% revenue growth for Zee Entertainment in FY19/FY20. With EBITDA margins at 31.5%/32.6% in FY19/FY20, we expect the company to bring in EPS Rs 17.1/ Rs 20.1 for FY19/20.
Zee Entertainment has, over the past two years, significantly built back its flagship Hindi GEC (Zee TV), which reduces our concern on the subscription revenues of the company in the event of TRAI’s tariff order being implemented in the near/ medium-term. In most regional languages that Zee Entertainment is present in, the company has a strong position.

Kotak Securities – Private Client Research Please see the Disclosure/Disclaimer on the last page For Private Circulation 17
MAY 11, 2018
As a result, we see reason to believe that Zee Entertainment shall continue to be aggressively valued by the market. However, while the company is in investment mode, possibility of significant earnings upgrades seems contained. We believe ZEEL could offer slightly better entry points over the next one year and thus see it as a buy into declines opportunity. We assign 31x PER FY20E to Zee Entertainment, and recommend ACCUMULATE (REDUCE earlier).
Risks to our investment view/ estimates: Competitive risks, regulatory risks.
Company Background
Zee Entertainment Enterprises (ZEEL) is one of India’s leading media and entertainment companies. It is amongst the largest producers and aggregators of entertainment content in the world, with an extensive library housing over 250,000 hours of television content. With rights to more than 4,200 movie titles from foremost studios and of iconic film stars, ZEEL houses the world’s largest Hindi film library. Through its strong presence worldwide, ZEEL entertains over 1.3 billion viewers across more than 170 countries.

Kotak Securities – Private Client Research Please see the Disclosure/Disclaimer on the last page For Private Circulation 18
MAY 11, 2018
Financials: Consolidated
Profit and Loss Statement (Rs mn)
(Year-end March) FY17 FY18 FY19E FY20E
Revenues 64,341 66,857 77,585 90,067 % change YoY 10.7 3.9 16.0 16.1
EBITDA 19,268 20,761 24,464 29,352 % change YoY 27.3 7.8 17.8 20.0
Depreciation -1,118 -1,821 -2,125 -2,479 EBIT 18,150 18,941 22,339 26,872 % change YoY 26.3 4.4 17.9 20.3
Net interest income/ (expense) 868 4,246 2,377 2,104 Share of profit of JV/associate -4.5 0.0 0.0 0.0
Profit before tax 19,013 23,187 24,716 28,976 % change YoY 28.9 22.0 6.6 17.2
Tax -6,805 -8,409 -8,481 -9,939 Exceptional Items 10,030 0 0 0
PAT before minority interest 22,238 14,778 16,235 19,037 Minority interest 12 14 -200 -260
Net income 22,226 14,764 16,435 19,297
% change YoY 12.8 -2.8 12.7 24.8 Shares outstanding (m) 960 961 960 960
EPS (reported) (Rs) 23.2 15.4 17.1 20.1 CEPS (Rs) 24.3 17.3 19.3 22.7
DPS (Rs) 2.3 2.9 4.2 9.8
Source: Company, Kotak Securities – Private Client Research Cash Flow Statement (Rs mn)
(Year-end March) FY17 FY18 FY19E FY20E
Pre-Tax Profit 19,013 23,187 24,716 28,976
Depreciation 1,152 1,821 2,125 2,479 Change in working capital (5,670) (9,476) (8,080) (1,556)
Total Tax Paid (6,810) (8,888) (8,481) (9,939) Other/ Adjustments (995) (4,246) (284) (711)
Cash flow from operations 6,690 2,397 9,996 19,250 Capex (2,768) (4,174) (2,808) (2,246)
(Inc)/dec in investments 16,736 100 1,324 1,107 Other/ Adjustments (18) (143) - -
Cash flow from investments 13,950 (4,217) (1,484) (1,139) Proceeds from issue of equity 10 - - -
Increase/(decrease) in debt (10) - - - Changes in Minority - - - -
Dividends/ RPSchanges/ Other (4,138) (8,196) (10,392) (12,226) Cash flow from financing (4,138) (8,196) (10,392) (12,226) Changes in Cash 16,502 (10,016) (1,880) 5,884 Opening cash 9,631 26,133 16,117 14,238
Closing cash 26,133 16,117 14,238 20,121
Source: Company, Kotak Securities – Private Client Research
Balance sheet (Rs mn)
(Year-end March) FY17 FY18 FY19E FY20E
Cash and cash equivalents 26,133 16,117 14,238 20,121
Accounts receivable 13,059 15,365 17,241 18,764 Inventories 16,843 26,076 25,718 26,098
Loans and Adv & Others 24,906 34,341 34,462 34,590 Current assets 80,941 91,900 93,159 99,574
Net fixed assets 11,817 16,803 17,933 17,700 LT investments/ Other CA 1,321 1,703 5,005 3,005
Other non-current Assets 0 0 0 0 Total assets 94,079 1,10,405 1,16,098 1,20,279
Payables 17,661 23,111 20,170 23,144 Provisions 89 83 823 919
Total CL & Provisions 17,750 23,193 20,993 24,064
Deferred Tax Liabilities -5,521 0 0 0 LT Borrowings/ RPS 15,273 11,453 6,000 0
Minority Interest 10 142 342 602 Equity 960 961 960 960
Reserves 65,607 74,657 87,802 94,653 Total liabilities 94,079 1,10,405 1,16,098 1,20,279
Source: Company, Kotak Securities – Private Client Research Ratio Analysis
(Year-end March) FY17 FY18 FY19E FY20E
EBITDA margin (%) 29.9 31.1 31.5 32.6 EBIT margin (%) 28.2 28.3 28.8 29.8
Net profit margin (%) 19.0 22.1 20.7 20.8
Receivables (days) 166.0 214.6 168.8 168.7 Inventory (days) 95.5 142.4 121.0 105.8
Sales/gross assets(x) 0.7 0.6 0.7 0.7 Interest coverage (x) 14.0 131.8 81.5 97.8
LT Debt Debt/ Equity (%) 23.9 15.7 6.8 -
ROCE (%) 31.4 17.5 18.3 20.3
ROE (%) 23.7 21.6 20.2 21.0
EV/ Sales 8.6 8.3 7.0 6.0 EV/EBITDA 28.6 26.8 22.4 18.4
Price to earnings (P/E) 46.2 38.2 35.2 30.1 Price to book value (P/B) 8.5 7.5 6.4 5.9
Source: Company, Kotak Securities – Private Client Research

Kotak Securities – Private Client Research Please see the Disclosure/Disclaimer on the last page For Private Circulation 19
MAY 11, 2018
RATING SCALE
Definitions of ratings
BUY – We expect the stock to deliver more than 12% returns over the next 12 months
ACCUMULATE – We expect the stock to deliver 5% - 12% returns over the next 12 months
REDUCE – We expect the stock to deliver 0% - 5% returns over the next 12 months
SELL – We expect the stock to deliver negative returns over the next 12 months
NR – Not Rated. Kotak Securities is not assigning any rating or price target to the stock. The report has been prepared for information purposes only.
RS – Rating Suspended. Kotak Securities has suspended the investment rating and price target for this stock, either because there is not a Sufficient fundamental basis for determining, or there are legal, regulatory or policy constraints around publishing, an investment rating or target. The previous investment rating and price target, if any, are no longer in effect for this stock and should not be relied upon.
NA – Not Available or Not Applicable. The information is not available for display or is not applicable
NM – Not Meaningful. The information is not meaningful and is therefore excluded.
NOTE – Our target prices are with a 12-month perspective. Returns stated in the rating scale are our internal benchmark.
FUNDAMENTAL RESEARCH TEAM
Sanjeev Zarbade Ruchir Khare Amit Agarwal Nipun Gupta Capital Goods, Engineering Capital Goods, Engineering Logistics, Paints, Transportation Information Technology [email protected] [email protected] [email protected] [email protected] +91 22 6218 6424 +91 22 6218 6431 +91 22 6218 6439 +91 22 6218 6433
Teena Virmani Ritwik Rai Jatin Damania Jayesh Kumar Construction, Cement, Building Mat FMCG, Media Metals & Mining Economy [email protected] [email protected] [email protected] [email protected] +91 22 6218 6432 +91 22 6218 6426 +91 22 6218 6440 +91 22 6218 5373
Arun Agarwal Sumit Pokharna Pankaj Kumar K. Kathirvelu Auto & Auto Ancillary Oil and Gas Midcap Production [email protected] [email protected] [email protected] [email protected] +91 22 6218 6443 +91 22 6218 6438 +91 22 6218 6434 +91 22 6218 6427
TECHNICAL RESEARCH TEAM
Shrikant Chouhan Amol Athawale [email protected] [email protected] 91 22 6218 5408 +91 20 6620 3350
DERIVATIVES RESEARCH TEAM
Sahaj Agrawal Malay Gandhi Prashanth Lalu Prasenjit Biswas, CMT, CFTe [email protected] [email protected] [email protected] [email protected] +91 79 6607 2231 +91 22 6218 6420 +91 22 6218 5497 +91 33 6625 9810
Kotak Securities – Private Client Research Please see the Disclosure/Disclaimer on the last page For Private Circulation 20
MAY 11, 2018
Disclosure/Disclaimer Kotak Securities Limited established in 1994, is a subsidiary of Kotak Mahindra Bank Limited. Kotak Securities is one of India's largest brokerage and distribution house. Kotak Securities Limited is a corporate trading and clearing member of Bombay Stock Exchange Limited (BSE), National Stock Exchange of India Limited (NSE), Metropolitan Stock Exchange of India Limited (MSE). Our businesses include stock broking, services rendered in connection with distribution of primary market issues and financial products like mutual funds and fixed deposits, depository services and Portfolio Management. Kotak Securities Limited is also a depository participant with National Securities Depository Limited (NSDL) and Central Depository Services (India) Limited (CDSL). Kotak Securities Limited is also registered with Insurance Regulatory and Development Authority as Corporate Agent for Kotak Mahindra Old Mutual Life Insurance Limited and is also a Mutual Fund Advisor registered with Association of Mutual Funds in India (AMFI). We are registered as a Research Analyst under SEBI (Research Analyst) Regulations, 2014. We hereby declare that our activities were neither suspended nor we have defaulted with any stock exchange authority with whom we are registered in last five years. However SEBI, Exchanges and Depositories have conducted the routine inspection and based on their observations have issued advise/warning/deficiency letters/ or levied minor penalty on KSL for certain operational deviations. We have not been debarred from doing business by any Stock Exchange / SEBI or any other authorities; nor has our certificate of registration been cancelled by SEBI at any point of time. We offer our research services to clients as well as our prospects. This document is not for public distribution and has been furnished to you solely for your information and must not be reproduced or redistributed to any other person. Persons into whose possession this document may come are required to observe these restrictions. This material is for the personal information of the authorized recipient, and we are not soliciting any action based upon it. This report is not to be construed as an offer to sell or the solicitation of an offer to buy any security in any jurisdiction where such an offer or solicitation would be illegal. It is for the general information of clients of Kotak Securities Ltd. It does not constitute a personal recommendation or take into account the particular investment objectives, financial situations, or needs of individual clients. We have reviewed the report, and in so far as it includes current or historical information, it is believed to be reliable though its accuracy or completeness cannot be guaranteed. Neither Kotak Securities Limited, nor any person connected with it, accepts any liability arising from the use of this document. The recipients of this material should rely on their own investigations and take their own professional advice. Price and value of the investments referred to in this material may go up or down. Past performance is not a guide for future performance. Certain transactions -including those involving futures, options and other derivatives as well as non-investment grade securities - involve substantial risk and are not suitable for all investors. Reports based on technical analysis centers on studying charts of a stock's price movement and trading volume, as opposed to focusing on a company's fundamentals and as such, may not match with a report on a company's fundamentals. Opinions expressed are our current opinions as of the date appearing on this material only. While we endeavor to update on a reasonable basis the information discussed in this material, there may be regulatory, compliance or other reasons that prevent us from doing so. Prospective investors and others are cautioned that any forward-looking statements are not predictions and may be subject to change without notice. Our proprietary trading and investment businesses may make investment decisions that are inconsistent with the recommendations expressed herein. Kotak Securities Limited has two independent equity research groups: Institutional Equities and Private Client Group. This report has been prepared by the Private Client Group. The views and opinions expressed in this document may or may not match or may be contrary with the views, estimates, rating, target price of the Institutional Equities Research Group of Kotak Securities Limited. We and our affiliates/associates, officers, directors, and employees, Research Analyst(including relatives) worldwide may: (a) from time to time, have long or short positions in, and buy or sell the securities thereof, of company (ies) mentioned herein or (b) be engaged in any other transaction involving such securities and earn brokerage or other compensation or act as a market maker in the financial instruments of the subject company/company (ies) discussed herein or act as advisor or lender / borrower to such company (ies) or have other potential/material conflict of interest with respect to any recommendation and related information and opinions at the time of publication of Research Report or at the time of public appearance. Kotak Securities Limited (KSL) may have proprietary long/short position in the above mentioned scrip(s) and therefore may be considered as interested. The views provided herein are general in nature and does not consider risk appetite or investment objective of particular investor; readers are requested to take independent professional advice before investing. This should not be construed as invitation or solicitation to do business with KSL. Kotak Securities Limited is also a Portfolio Manager. Portfolio Management Team (PMS) takes its investment decisions independent of the PCG research and accordingly PMS may have positions contrary to the PCG research recommendation. Kotak Securities Limited does not provide any promise or assurance of favourable view for a particular industry or sector or business group in any manner. The investor is requested to take into consideration all the risk factors including their financial condition, suitability to risk return profile and take professional advice before investing. The analyst for this report certifies that all of the views expressed in this report accurately reflect his or her personal views about the subject company or companies and its or their securities, and no part of his or her compensation was, is or will be, directly or indirectly related to specific recommendations or views expressed in this report. No part of this material may be duplicated in any form and/or redistributed without Kotak Securities' prior written consent. Details of Associates are available on our website ie www.kotak.com Research Analyst has served as an officer, director or employee of subject company(ies): No We or our associates may have received compensation from the subject company(ies) in the past 12 months. We or our associates have managed or co-managed public offering of securities for the subject company(ies) in the past 12 months: No We or our associates may have received compensation for investment banking or merchant banking or brokerage services from the subject company(ies) in the past 12 months. We or our associates may have received any compensation for products or services other than investment banking or merchant banking or brokerage services from the subject company(ies) in the past 12 months. We or our associates may have received compensation or other benefits from the subject company(ies) or third party in connection with the research report. Our associates may have financial interest in the subject company(ies). Research Analyst or his/her relative's financial interest in the subject company(ies): No Kotak Securities Limited has financial interest in the subject company(ies) at the end of the month immediately preceding the date of publication of Research Report: Asian Paints, Voltamp - Yes Our associates may have actual/beneficial ownership of 1% or more securities of the subject company(ies) at the end of the month immediately preceding the date of publication of Research Report. Research Analyst or his/her relatives has actual/beneficial ownership of 1% or more securities of the subject company(ies) at the end of the month immediately preceding the date of publication of Research Report: No. Kotak Securities Limited has actual/beneficial ownership of 1% or more securities of the subject company(ies) at the end of the month immediately preceding the date of publication of Research Report: No Subject company(ies) may have been client during twelve months preceding the date of distribution of the research report. "A graph of daily closing prices of securities is available at www.nseindia.com and http://economictimes.indiatimes.com/markets/stocks/stock-quotes. (Choose a company from the list on the browser and select the "three years" icon in the price chart)." Kotak Securities Limited. Registered Office: 27 BKC, C 27, G Block, Bandra Kurla Complex, Bandra (E), Mumbai 400051. CIN: U99999MH1994PLC134051, Telephone No.: +22 43360000, Fax No.: +22 67132430. Website: www.kotak.com/www.kotaksecurities.com. Correspondence Address: Infinity IT Park, Bldg. No 21, Opp. Film City Road, A K Vaidya Marg, Malad (East), Mumbai 400097. Telephone No: 42856825. SEBI Registration No: NSE INB/INF/INE 230808130, BSE INB 010808153/INF 011133230, MSE INE 260808130/INB 260808135/INF 260808135, AMFI ARN 0164, PMS INP000000258 and Research Analyst INH000000586. NSDL/CDSL: IN-DP-NSDL-23-97. Our research should not be considered as an advertisement or advice, professional or otherwise. The investor is requested to take into consideration all the risk factors including their financial condition, suitability to risk return profile and the like and take professional advice before investing. Investments in securities market are subject to market risks, read all the related documents carefully before investing. Derivatives are a sophisticated investment device. The investor is requested to take into consideration all the risk factors before actually trading in derivative contracts. Compliance Officer Details: Mr. Manoj Agarwal. Call: 022 - 4285 8484, or Email: [email protected]. In case you require any clarification or have any concern, kindly write to us at below email ids: Level 1: For Trading related queries, contact our customer service at '[email protected]' and for demat account related queries contact us at
[email protected] or call us on: Online Customers - 30305757 (by using your city STD code as a prefix) or Toll free numbers 18002099191 / 1800222299, Offline Customers - 18002099292
Level 2: If you do not receive a satisfactory response at Level 1 within 3 working days, you may write to us at [email protected] or call us on 022-42858445 and if you feel you are still unheard, write to our customer service HOD at [email protected] or call us on 022-42858208.
Level 3: If you still have not received a satisfactory response at Level 2 within 3 working days, you may contact our Compliance Officer (Mr. Manoj Agarwal) at [email protected] or call on 91- (022) 4285 8484.
Level 4: If you have not received a satisfactory response at Level 3 within 7 working days, you may also approach CEO (Mr. Kamlesh Rao) at [email protected] or call on 91- (022) 4285 8301.