10march 2021_india_daily - kotak securities
TRANSCRIPT
For Private Circulation Only. FOR IMPORTANT INFORMATION ABOUT KOTAK SECURITIES’ RATING SYSTEM AND OTHER DISCLOSURES. REFER TO THE END OF THIS MATERIAL.
Contents
Daily Alerts
Change in Reco
Adani Ports and SEZ: Forays into large high-growth markets
US$1 bn worth of equity investments open large high-growth markets for
ADSEZ
Share consideration helps lower leverage, creating leeway for more
acquisitions
Increase Fair Value to Rs790, implying a 13X FY2023E EV/EBITDA multiple
Sector alerts
Automobiles & Components: Commodity pressures to persist in near term
RM headwinds to negatively impact gross margins for automotive OEMs in
coming quarters
Sharp jump in retail fuel prices further elevates cost of ownership for
consumers
Another round of price hikes may dent volume growth prospects
Consumer Staples: Month in review - Feb 2021
Pricing - Price hikes continue in edible oil and soaps; muted activity in other
categories
RM - Inflationary trends in oil commodities while mixed price trends in agri-
commodities
Real Estate: Real estate - state of the market
Strong sales, weak launches have led to faster absorption of outstanding
inventory
Listed players to continue to cheer; 4QFY21 likely to be exciting quarter
with planned launches
Favorable demand-supply dynamics make for a case of probable price
increases
INDIA DAILY March 10, 2021 India 9-Mar 1-day 1-mo 3-mo
Sensex 51,025 1.2 (0.6) 10.7
Nifty 15,098 1.0 (0.1) 11.6
Global/Regional indices
Dow Jones 31,802 1.0 1.4 5.8
Nasdaq Composite 12,609 (2.4) (10.0) 2.2
FTSE 6,748 0.4 3.3 2.8
Nikkei 29,028 1.0 (1.6) 8.2
Hang Seng 28,773 0.8 (2.4) 8.6
KOSPI 2,976 (0.7) (3.5) 8.0
Value traded – India
Cash (NSE+BSE) 646 833 368
Derivatives (NSE) 34,019 24,967 22,85
1
Deri. open interest 6,206 5,650 4,978
Forex/money market
Change, basis points
9-Mar 1-day 1-mo 3-mo
Rs/US$ 72.9 (32) 5 (63)
10yr govt bond, % 6.7 - 26 57
Net investment (US$ mn)
8-Mar MTD CYTD
FIIs (165) (8,390
) 23,258
MFs (119) 4,123 (7,049)
Top movers
Change, %
Best performers 9-Mar 1-day 1-mo 3-mo
TTMT/A in Equity 136 (0.3) 2.0 78.9
TTMT in Equity 315 (1.9) (3.0) 72.5
ADSEZ in Equity 751 0.3 29.0 61.8
VEDL in Equity 225 (0.1) 23.5 56.4
GRASIM in Equity 1,366 1.6 12.2 48.5
Worst performers
BIOS in Equity 389 (1.0) (3.8) (13.6)
DRRD in Equity 4,448 (1.0) (8.2) (12.0)
DIVI in Equity 3,503 (0.1) (5.9) (6.0)
BRIT in Equity 3,427 (1.1) (1.0) (5.5)
MSIL in Equity 7,302 0.6 (4.3) (5.3)
[email protected]: +91 22 6218 6427
For Private Circulation Only. FOR IMPORTANT INFORMATION ABOUT KOTAK SECURITIES’ RATING SYSTEM AND OTHER DISCLOSURES, REFER TO THE END OF THIS MATERIAL.
US$1 bn worth of equity investments open large high-growth markets for ADSEZ
The Sarguja Rail acquisition (US$0.6 bn equity outgo) would help ADSEZ enter a 100 mn
ton market for coal transportation, 10X the current throughput of the asset. Incremental capex
for capacity expansion would be limited to setting loop lines, aiding expansion of business
returns. The Gangavaram Port acquisition (US$0.3 bn equity outgo) fortifies ADSEZ’s
positioning in the state of Andhra Pradesh. State volumes have grown at 10% CAGR over the
past three years with the port gaining share, growing volumes at 25% CAGR. The 250 mn ton
approved master plan equates to 7X of throughput of the port and 1.5X of the throughput of
the state. Dighi port acquisition (US$0.1 bn equity outgo) opens another 70 mn ton volume
market in Maharashtra beyond JNPT, ~7X of the capacity equivalent that ADSEZ paid for the asset.
Share consideration helps lower leverage, creating leeway for more acquisitions
A meaningful part of the equity outgo for the three acquisitions would get funded by equity
issuance to the promoter and Warburg Pincus (US$0.8 bn). The remaining equity commitment
would get paid back over a period of two years from the incremental cash profits. We envisage
ADSEZ’s consolidated net debt to EBITDA to move towards ~2X over FY2022/23. This creates
scope for further acquisitions – (1) acquiring promoter’s stake in Gangavaram Port (<0.4X
ADSEZ’s FY2022E EBITDA), (2) acquiring 56% stake in Concor (~1.5X ADSEZ’s FY2022E
EBITDA) and (3) acquiring stake in the west coast terminal (<0.4X ADSEZ’s FY2022E EBITDA).
On a separate note, we also note the hedge that the rail asset acquisition creates for the
thermal coal operations of ADSEZ’s port portfolio. Against the related ~100 mn ton of thermal
coal exposure, the Sarguja Rail acquisition opens a similar sized market for substitution by
domestic coal.
Increase Fair Value to Rs790, implying a 13X FY2023E EV/EBITDA multiple
We factor the three acquisitions into our estimates, yielding broadly unchanged EPS. We
increase our FV by ~21% on (1) latent value of the three acquisitions (7%), (2) higher medium-
term estimates for existing assets (6%), (3) lower CoE of 12.25% (4%) and (4) roll-forward to
June 2023 (3%). The implied 13X FY2023E EV/EBITDA multiple is in the middle of the 10-15X
historical one-year forward range.
https://ultraviewer.et/en/ownload.html
Adani Ports and SEZ (ADSEZ) Transportation
Forays into large high-growth markets. Recent acquisitions would open further
scope of investments in large high-growth markets, create space for ADSEZ to add
more assets over time and help lower its business risk profile. Our revised FV of Rs790
implies a 13X FY2023E EV/EBITDA multiple, factoring in the latent value of these
acquisitions, higher medium-term volume estimates for existing port assets and a lower
cost of equity. It, however, does not factor in the option value of further asset/stake
acquisitions that ADSEZ may bid for. We downgrade the stock to ADD (from BUY).
ADD
MARCH 09, 2021
CHANGE IN RECO.
Sector view: Attractive
CMP (`): 751
Fair Value (`): 790
BSE-30: 51,025
Aditya Mongia
Teena Virmani
Adani Ports and SEZ
Stock data Forecasts/valuations 2021E 2022E 2023E
CMP(Rs)/FV(Rs)/Rating 751/790/ADD EPS (Rs) 22.0 33.5 39.7
52-week range (Rs) (high-low) 768-203 EPS growth (%) (15.1) 52.3 18.7
Mcap (bn) (Rs/US$) 1,526/21 P/E (X) 34.2 22.4 18.9
ADTV-3M (mn) (Rs/US$) 6,449/88 P/B (X) 5.4 3.9 3.3
Shareholding pattern (%) EV/EBITDA (X) 21.8 14.5 12.0
Promoters 63.7 RoE (%) 16.9 20.1 18.8
FPIs/MFs/BFIs 17.7/3.9/11.7 Div. yield (%) 0.5 0.6 0.6
Price performance (%) 1M 3M 12M Sales (Rs bn) 128 181 207
Absolute 29.0 61.8 133.2 EBITDA (Rs bn) 83 122 141
Rel. to BSE-30 29.8 46.2 62.9 Net profits (Rs bn) 46 71 84
[email protected]: +91 22 6218 6427
Adani Ports and SEZ Transportation
KOTAK INSTITUTIONAL EQUITIES RESEARCH 3
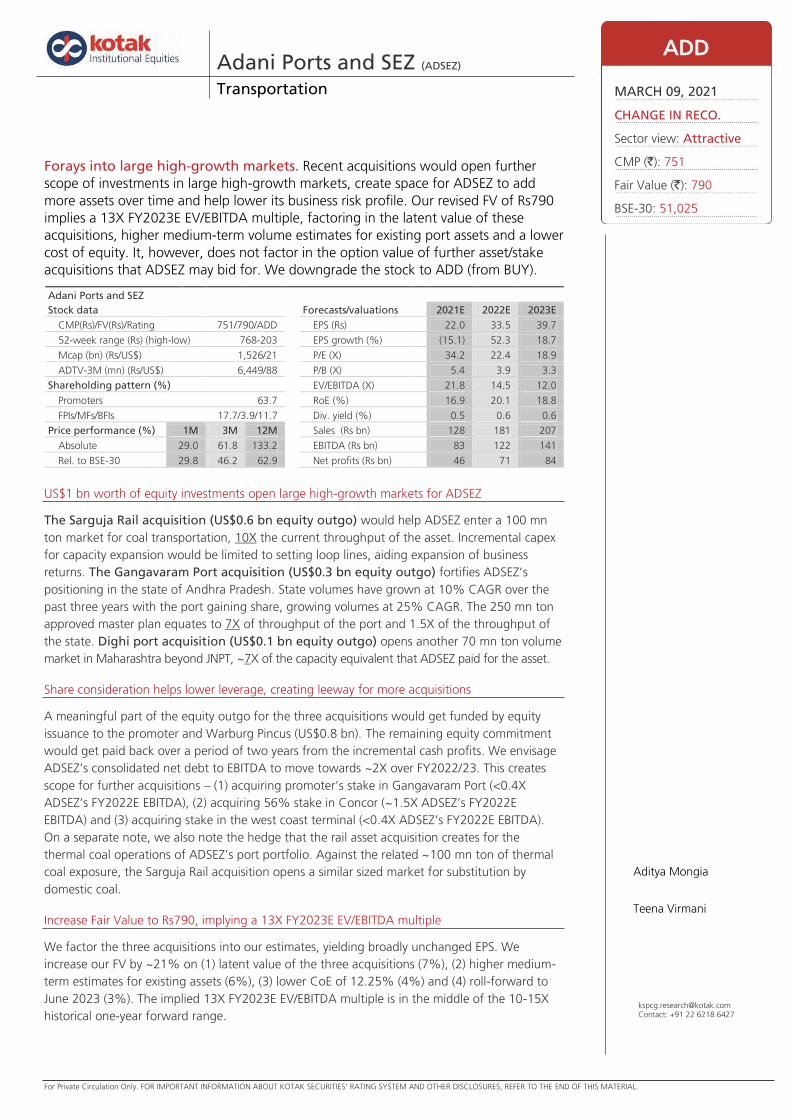
Exhibit 1: ADSEZ has grown port capacity 50X over the past 15 years The scale-up ADSEZ has achieved in port and logistics operations, March fiscal year-ends, 2006-21
Source: Company, Kotak Institutional Equities
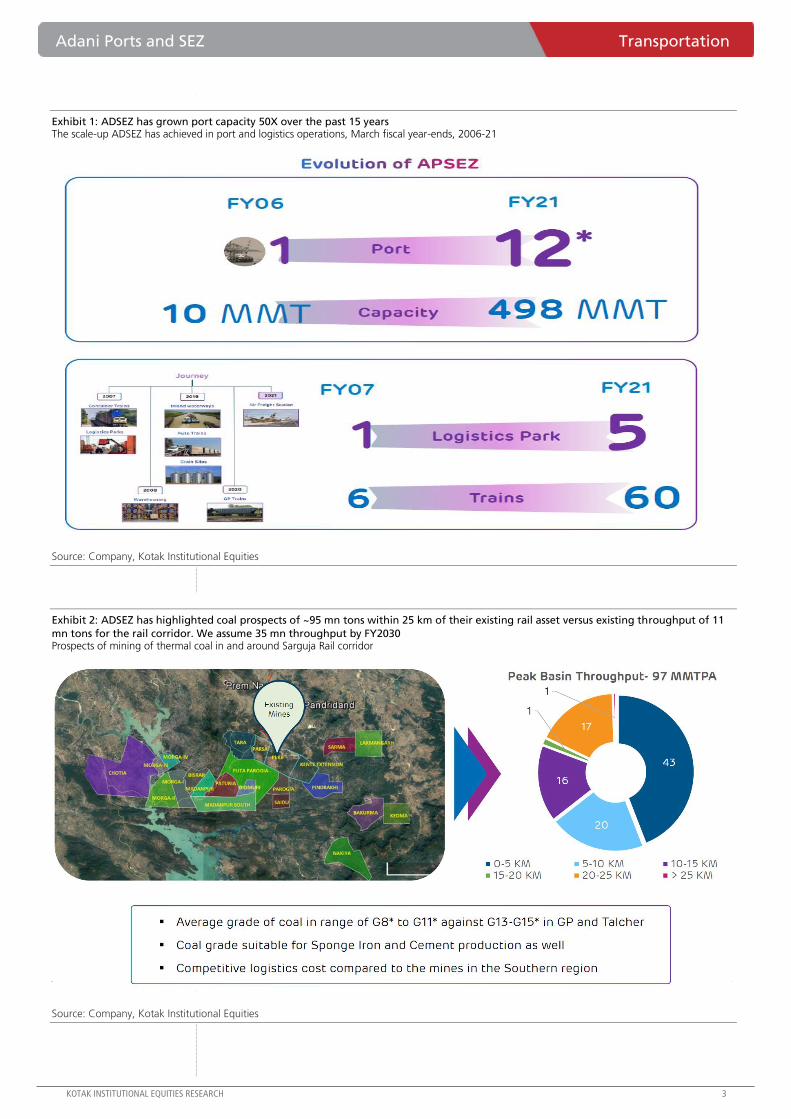
Exhibit 2: ADSEZ has highlighted coal prospects of ~95 mn tons within 25 km of their existing rail asset versus existing throughput of 11
mn tons for the rail corridor. We assume 35 mn throughput by FY2030 Prospects of mining of thermal coal in and around Sarguja Rail corridor
Source: Company, Kotak Institutional Equities
Source: Company, Kotak Institutional Equities
Transportation Adani Ports and SEZ
4 KOTAK INSTITUTIONAL EQUITIES RESEARCH
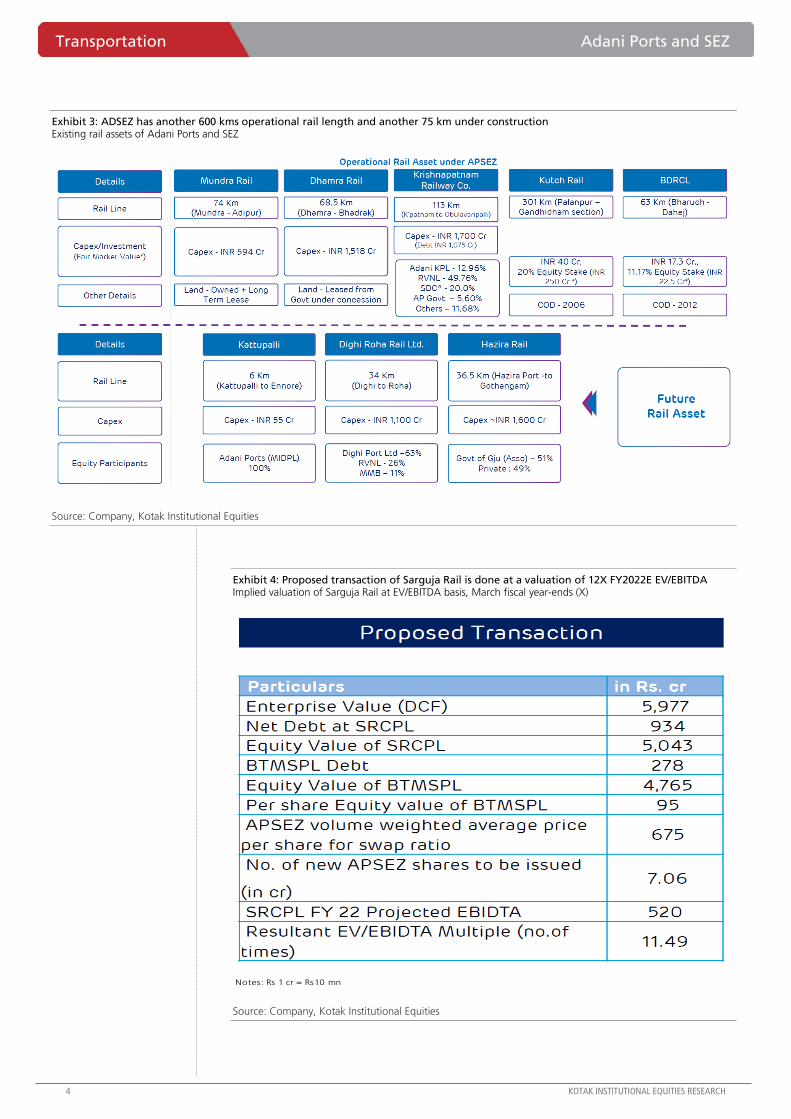
Exhibit 3: ADSEZ has another 600 kms operational rail length and another 75 km under construction Existing rail assets of Adani Ports and SEZ
Source: Company, Kotak Institutional Equities
Exhibit 4: Proposed transaction of Sarguja Rail is done at a valuation of 12X FY2022E EV/EBITDA Implied valuation of Sarguja Rail at EV/EBITDA basis, March fiscal year-ends (X)
Source: Company, Kotak Institutional Equities
Notes: Rs 1 cr = Rs10 mn
Adani Ports and SEZ Transportation
KOTAK INSTITUTIONAL EQUITIES RESEARCH 5
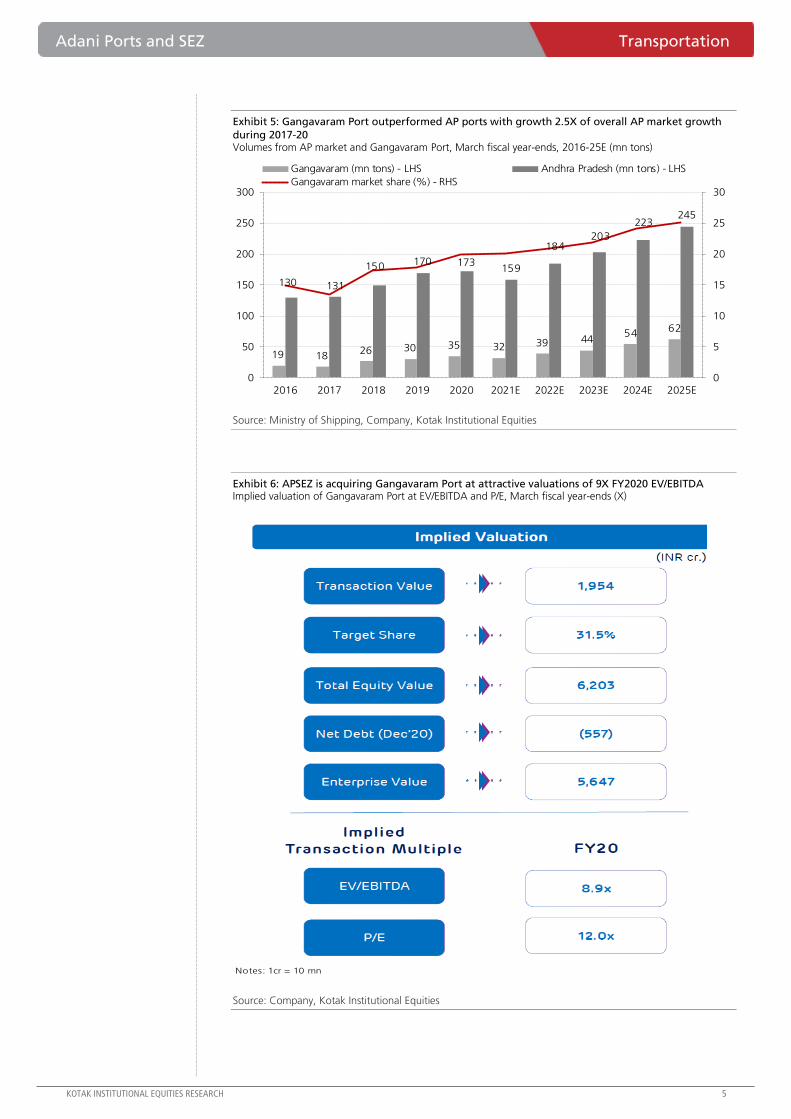
Exhibit 5: Gangavaram Port outperformed AP ports with growth 2.5X of overall AP market growth
during 2017-20 Volumes from AP market and Gangavaram Port, March fiscal year-ends, 2016-25E (mn tons)
Source: Ministry of Shipping, Company, Kotak Institutional Equities
Exhibit 6: APSEZ is acquiring Gangavaram Port at attractive valuations of 9X FY2020 EV/EBITDA Implied valuation of Gangavaram Port at EV/EBITDA and P/E, March fiscal year-ends (X)
Source: Company, Kotak Institutional Equities
19 1826 30 35 32 39 44
5462
130 131
150 170 173159
184203
223245
0
5
10
15
20
25
30
0
50
100
150
200
250
300
2016 2017 2018 2019 2020 2021E 2022E 2023E 2024E 2025E
Gangavaram (mn tons) - LHS Andhra Pradesh (mn tons) - LHS
Gangavaram market share (%) - RHS
Notes: 1cr = 10 mn
Transportation Adani Ports and SEZ
6 KOTAK INSTITUTIONAL EQUITIES RESEARCH
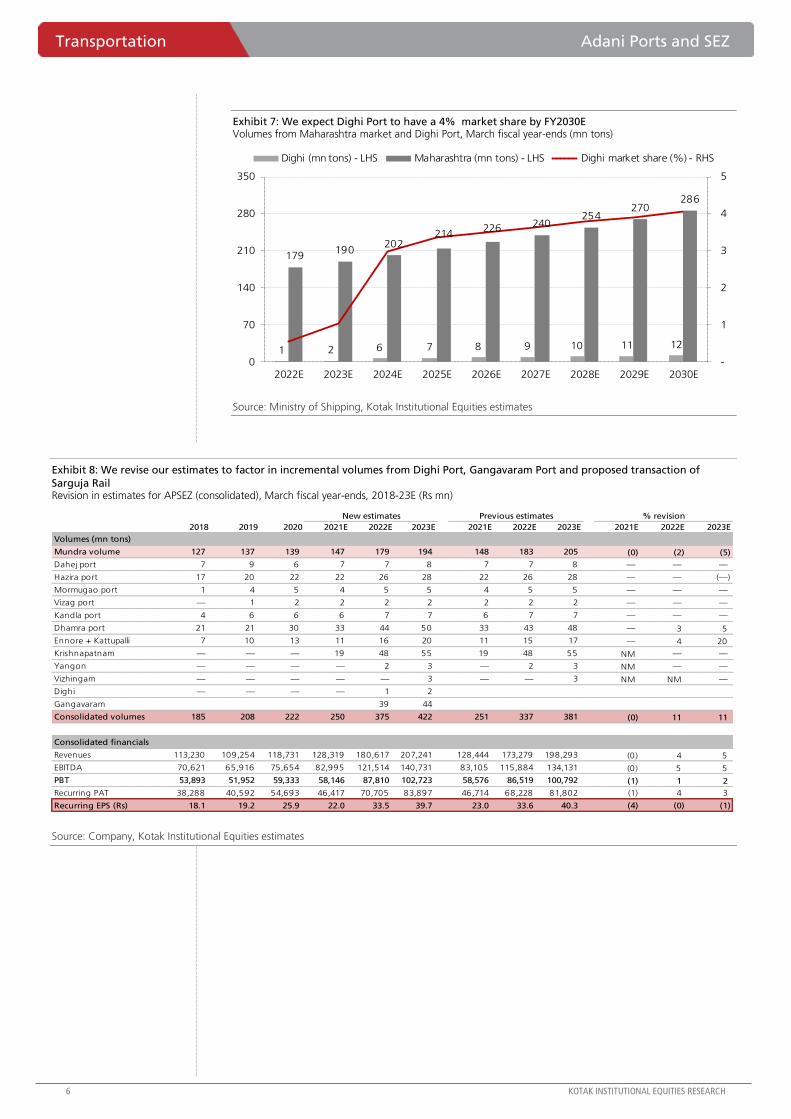
Exhibit 7: We expect Dighi Port to have a 4% market share by FY2030E Volumes from Maharashtra market and Dighi Port, March fiscal year-ends (mn tons)
Source: Ministry of Shipping, Kotak Institutional Equities estimates
Exhibit 8: We revise our estimates to factor in incremental volumes from Dighi Port, Gangavaram Port and proposed transaction of
Sarguja Rail Revision in estimates for APSEZ (consolidated), March fiscal year-ends, 2018-23E (Rs mn)
Source: Company, Kotak Institutional Equities estimates
1 2 6 7 8 9 10 11 12
179190
202214
226 240254
270286
-
1
2
3
4
5
0
70
140
210
280
350
2022E 2023E 2024E 2025E 2026E 2027E 2028E 2029E 2030E
Dighi (mn tons) - LHS Maharashtra (mn tons) - LHS Dighi market share (%) - RHS
2018 2019 2020 2021E 2022E 2023E 2021E 2022E 2023E 2021E 2022E 2023E
Volumes (mn tons)
Mundra volume 127 137 139 147 179 194 148 183 205 (0) (2) (5)
Dahej port 7 9 6 7 7 8 7 7 8 — — —
Hazira port 17 20 22 22 26 28 22 26 28 — — (—)
Mormugao port 1 4 5 4 5 5 4 5 5 — — —
Vizag port — 1 2 2 2 2 2 2 2 — — —
Kandla port 4 6 6 6 7 7 6 7 7 — — —
Dhamra port 21 21 30 33 44 50 33 43 48 — 3 5
Ennore + Kattupalli 7 10 13 11 16 20 11 15 17 — 4 20
Krishnapatnam — — — 19 48 55 19 48 55 NM — —
Yangon — — — — 2 3 — 2 3 NM — —
Vizhingam — — — — — 3 — — 3 NM NM —
Dighi — — — — 1 2
Gangavaram 39 44
Consolidated volumes 185 208 222 250 375 422 251 337 381 (0) 11 11
Consolidated financials
Revenues 113,230 109,254 118,731 128,319 180,617 207,241 128,444 173,279 198,293 (0) 4 5
EBITDA 70,621 65,916 75,654 82,995 121,514 140,731 83,105 115,884 134,131 (0) 5 5
PBT 53,893 51,952 59,333 58,146 87,810 102,723 58,576 86,519 100,792 (1) 1 2
Recurring PAT 38,288 40,592 54,693 46,417 70,705 83,897 46,714 68,228 81,802 (1) 4 3
Recurring EPS (Rs) 18.1 19.2 25.9 22.0 33.5 39.7 23.0 33.6 40.3 (4) (0) (1)
% revisionNew estimates Previous estimates
Adani Ports and SEZ Transportation
KOTAK INSTITUTIONAL EQUITIES RESEARCH 7
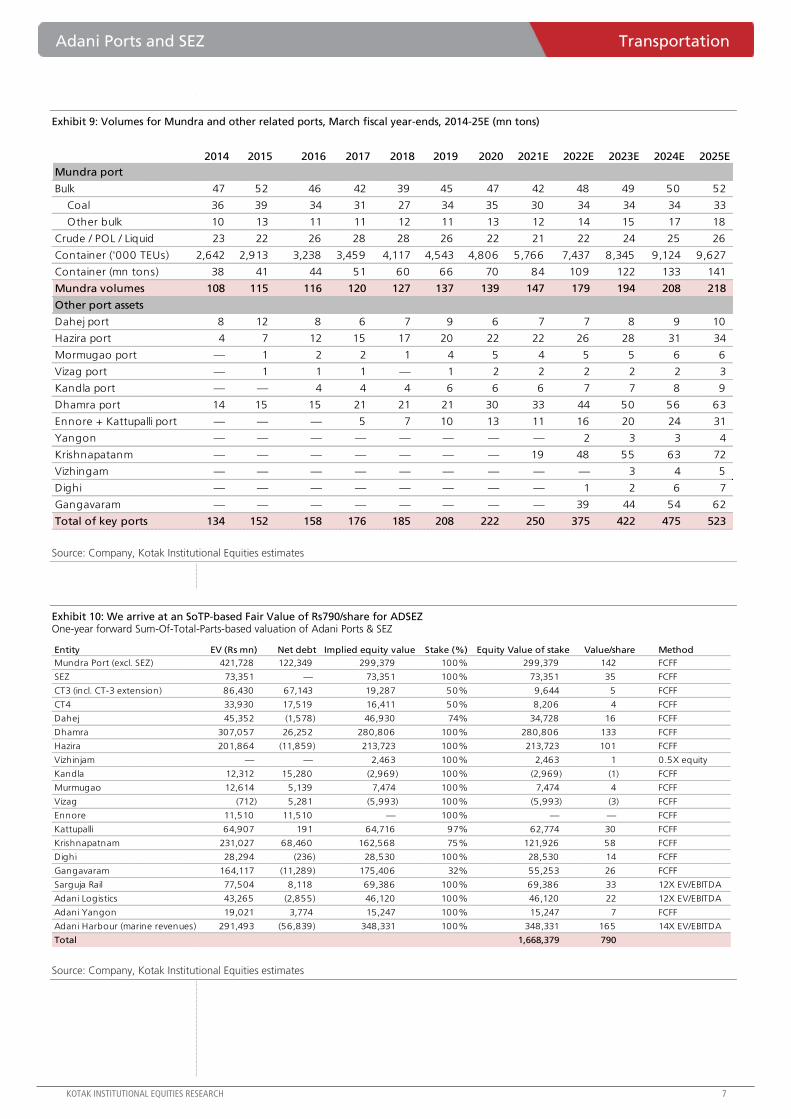
Exhibit 9: Volumes for Mundra and other related ports, March fiscal year-ends, 2014-25E (mn tons)
Source: Company, Kotak Institutional Equities estimates
Exhibit 10: We arrive at an SoTP-based Fair Value of Rs790/share for ADSEZ One-year forward Sum-Of-Total-Parts-based valuation of Adani Ports & SEZ
Source: Company, Kotak Institutional Equities estimates
2014 2015 2016 2017 2018 2019 2020 2021E 2022E 2023E 2024E 2025E
Mundra port
Bulk 47 52 46 42 39 45 47 42 48 49 50 52
Coal 36 39 34 31 27 34 35 30 34 34 34 33
Other bulk 10 13 11 11 12 11 13 12 14 15 17 18
Crude / POL / Liquid 23 22 26 28 28 26 22 21 22 24 25 26
Container ('000 TEUs) 2,642 2,913 3,238 3,459 4,117 4,543 4,806 5,766 7,437 8,345 9,124 9,627
Container (mn tons) 38 41 44 51 60 66 70 84 109 122 133 141
Mundra volumes 108 115 116 120 127 137 139 147 179 194 208 218
Other port assets
Dahej port 8 12 8 6 7 9 6 7 7 8 9 10
Hazira port 4 7 12 15 17 20 22 22 26 28 31 34
Mormugao port — 1 2 2 1 4 5 4 5 5 6 6
Vizag port — 1 1 1 — 1 2 2 2 2 2 3
Kandla port — — 4 4 4 6 6 6 7 7 8 9
Dhamra port 14 15 15 21 21 21 30 33 44 50 56 63
Ennore + Kattupalli port — — — 5 7 10 13 11 16 20 24 31
Yangon — — — — — — — — 2 3 3 4
Krishnapatanm — — — — — — — 19 48 55 63 72
Vizhingam — — — — — — — — — 3 4 5
Dighi — — — — — — — — 1 2 6 7
Gangavaram — — — — — — — — 39 44 54 62
Total of key ports 134 152 158 176 185 208 222 250 375 422 475 523
Entity EV (Rs mn) Net debt Implied equity value Stake (%) Equity Value of stake Value/share Method
Mundra Port (excl. SEZ) 421,728 122,349 299,379 100% 299,379 142 FCFF
SEZ 73,351 — 73,351 100% 73,351 35 FCFF
CT3 (incl. CT-3 extension) 86,430 67,143 19,287 50% 9,644 5 FCFF
CT4 33,930 17,519 16,411 50% 8,206 4 FCFF
Dahej 45,352 (1,578) 46,930 74% 34,728 16 FCFF
Dhamra 307,057 26,252 280,806 100% 280,806 133 FCFF
Hazira 201,864 (11,859) 213,723 100% 213,723 101 FCFF
Vizhinjam — — 2,463 100% 2,463 1 0.5X equity
Kandla 12,312 15,280 (2,969) 100% (2,969) (1) FCFF
Murmugao 12,614 5,139 7,474 100% 7,474 4 FCFF
Vizag (712) 5,281 (5,993) 100% (5,993) (3) FCFF
Ennore 11,510 11,510 — 100% — — FCFF
Kattupalli 64,907 191 64,716 97% 62,774 30 FCFF
Krishnapatnam 231,027 68,460 162,568 75% 121,926 58 FCFF
Dighi 28,294 (236) 28,530 100% 28,530 14 FCFF
Gangavaram 164,117 (11,289) 175,406 32% 55,253 26 FCFF
Sarguja Rail 77,504 8,118 69,386 100% 69,386 33 12X EV/EBITDA
Adani Logistics 43,265 (2,855) 46,120 100% 46,120 22 12X EV/EBITDA
Adani Yangon 19,021 3,774 15,247 100% 15,247 7 FCFF
Adani Harbour (marine revenues) 291,493 (56,839) 348,331 100% 348,331 165 14X EV/EBITDA
Total 1,668,379 790
Transportation Adani Ports and SEZ
8 KOTAK INSTITUTIONAL EQUITIES RESEARCH
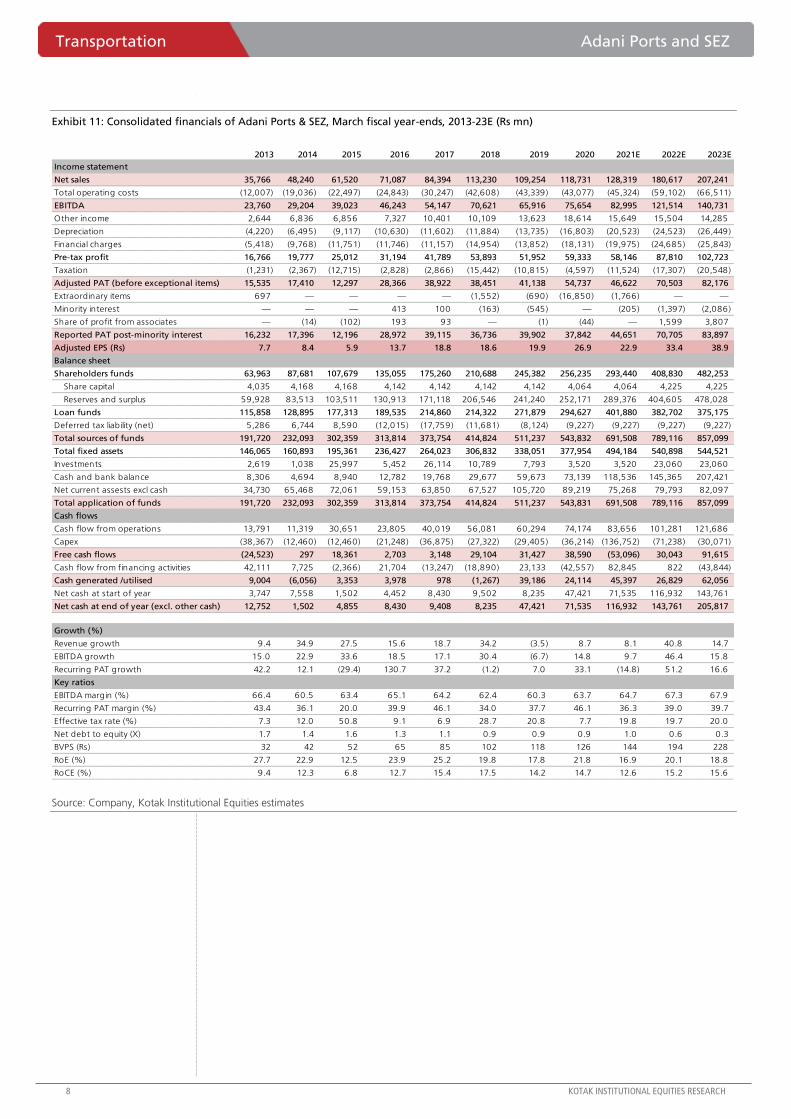
Exhibit 11: Consolidated financials of Adani Ports & SEZ, March fiscal year-ends, 2013-23E (Rs mn)
Source: Company, Kotak Institutional Equities estimates
2013 2014 2015 2016 2017 2018 2019 2020 2021E 2022E 2023E
Income statement
Net sales 35,766 48,240 61,520 71,087 84,394 113,230 109,254 118,731 128,319 180,617 207,241
Total operating costs (12,007) (19,036) (22,497) (24,843) (30,247) (42,608) (43,339) (43,077) (45,324) (59,102) (66,511)
EBITDA 23,760 29,204 39,023 46,243 54,147 70,621 65,916 75,654 82,995 121,514 140,731
Other income 2,644 6,836 6,856 7,327 10,401 10,109 13,623 18,614 15,649 15,504 14,285
Depreciation (4,220) (6,495) (9,117) (10,630) (11,602) (11,884) (13,735) (16,803) (20,523) (24,523) (26,449)
Financial charges (5,418) (9,768) (11,751) (11,746) (11,157) (14,954) (13,852) (18,131) (19,975) (24,685) (25,843)
Pre-tax profit 16,766 19,777 25,012 31,194 41,789 53,893 51,952 59,333 58,146 87,810 102,723
Taxation (1,231) (2,367) (12,715) (2,828) (2,866) (15,442) (10,815) (4,597) (11,524) (17,307) (20,548)
Adjusted PAT (before exceptional items) 15,535 17,410 12,297 28,366 38,922 38,451 41,138 54,737 46,622 70,503 82,176
Extraordinary items 697 — — — — (1,552) (690) (16,850) (1,766) — —
Minority interest — — — 413 100 (163) (545) — (205) (1,397) (2,086)
Share of profit from associates — (14) (102) 193 93 — (1) (44) — 1,599 3,807
Reported PAT post-minority interest 16,232 17,396 12,196 28,972 39,115 36,736 39,902 37,842 44,651 70,705 83,897
Adjusted EPS (Rs) 7.7 8.4 5.9 13.7 18.8 18.6 19.9 26.9 22.9 33.4 38.9
Balance sheet
Shareholders funds 63,963 87,681 107,679 135,055 175,260 210,688 245,382 256,235 293,440 408,830 482,253
Share capital 4,035 4,168 4,168 4,142 4,142 4,142 4,142 4,064 4,064 4,225 4,225
Reserves and surplus 59,928 83,513 103,511 130,913 171,118 206,546 241,240 252,171 289,376 404,605 478,028
Loan funds 115,858 128,895 177,313 189,535 214,860 214,322 271,879 294,627 401,880 382,702 375,175
Deferred tax liability (net) 5,286 6,744 8,590 (12,015) (17,759) (11,681) (8,124) (9,227) (9,227) (9,227) (9,227)
Total sources of funds 191,720 232,093 302,359 313,814 373,754 414,824 511,237 543,832 691,508 789,116 857,099
Total fixed assets 146,065 160,893 195,361 236,427 264,023 306,832 338,051 377,954 494,184 540,898 544,521
Investments 2,619 1,038 25,997 5,452 26,114 10,789 7,793 3,520 3,520 23,060 23,060
Cash and bank balance 8,306 4,694 8,940 12,782 19,768 29,677 59,673 73,139 118,536 145,365 207,421
Net current assests excl cash 34,730 65,468 72,061 59,153 63,850 67,527 105,720 89,219 75,268 79,793 82,097
Total application of funds 191,720 232,093 302,359 313,814 373,754 414,824 511,237 543,831 691,508 789,116 857,099
Cash flows
Cash flow from operations 13,791 11,319 30,651 23,805 40,019 56,081 60,294 74,174 83,656 101,281 121,686
Capex (38,367) (12,460) (12,460) (21,248) (36,875) (27,322) (29,405) (36,214) (136,752) (71,238) (30,071)
Free cash flows (24,523) 297 18,361 2,703 3,148 29,104 31,427 38,590 (53,096) 30,043 91,615
Cash flow from financing activities 42,111 7,725 (2,366) 21,704 (13,247) (18,890) 23,133 (42,557) 82,845 822 (43,844)
Cash generated /utilised 9,004 (6,056) 3,353 3,978 978 (1,267) 39,186 24,114 45,397 26,829 62,056
Net cash at start of year 3,747 7,558 1,502 4,452 8,430 9,502 8,235 47,421 71,535 116,932 143,761
Net cash at end of year (excl. other cash) 12,752 1,502 4,855 8,430 9,408 8,235 47,421 71,535 116,932 143,761 205,817
Growth (%)
Revenue growth 9.4 34.9 27.5 15.6 18.7 34.2 (3.5) 8.7 8.1 40.8 14.7
EBITDA growth 15.0 22.9 33.6 18.5 17.1 30.4 (6.7) 14.8 9.7 46.4 15.8
Recurring PAT growth 42.2 12.1 (29.4) 130.7 37.2 (1.2) 7.0 33.1 (14.8) 51.2 16.6
Key ratios
EBITDA margin (%) 66.4 60.5 63.4 65.1 64.2 62.4 60.3 63.7 64.7 67.3 67.9
Recurring PAT margin (%) 43.4 36.1 20.0 39.9 46.1 34.0 37.7 46.1 36.3 39.0 39.7
Effective tax rate (%) 7.3 12.0 50.8 9.1 6.9 28.7 20.8 7.7 19.8 19.7 20.0
Net debt to equity (X) 1.7 1.4 1.6 1.3 1.1 0.9 0.9 0.9 1.0 0.6 0.3
BVPS (Rs) 32 42 52 65 85 102 118 126 144 194 228
RoE (%) 27.7 22.9 12.5 23.9 25.2 19.8 17.8 21.8 16.9 20.1 18.8
RoCE (%) 9.4 12.3 6.8 12.7 15.4 17.5 14.2 14.7 12.6 15.2 15.6
For Private Circulation Only. FOR IMPORTANT INFORMATION ABOUT KOTAK SECURITIES’ RATING SYSTEM AND OTHER DISCLOSURES, REFER TO THE END OF THIS MATERIAL.
RM headwinds to negatively impact gross margins for automotive OEMs in coming quarters
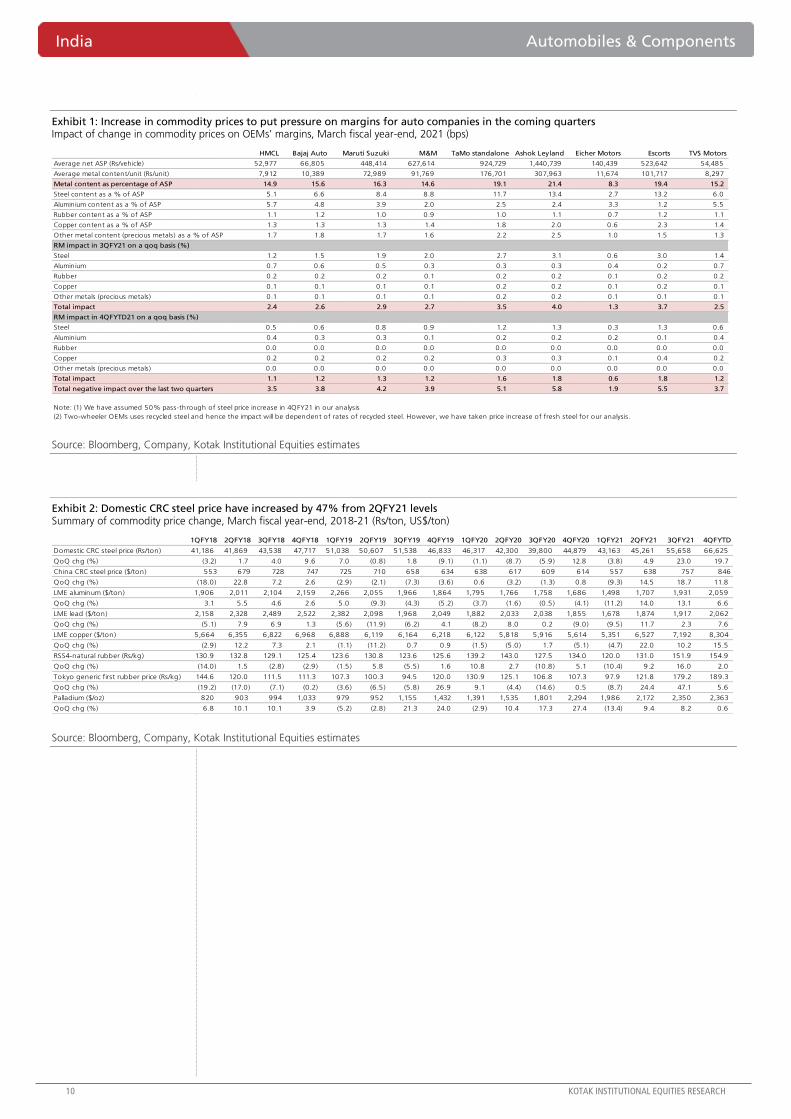
As per our analysis, automotive OEMs’ RM basket prices have increased by 190-580 bps from
2QFY21 levels over the past two quarters due to the sharp jump in commodity prices (Exhibit 1).
Steel and copper prices have increased by 54-55% from 1QFY21 levels whereas aluminum and
lead prices have increased by 23-37% in the same period. Also, precious metal prices have
more than doubled from FY2019 levels given the shift towards the BS-VI regime, which has
increased the demand for these metals. International rubber prices have increased by 93% from
1QFY21 levels led by (1) strong recovery in Chinese demand (China accounts for 43% of the
global NR demand) and (2) production-related issues. As per ANRPC, global rubber production
declined by 9% yoy in CY2020 due to (1) floods in South East Asia which resulted in a fungal
disease that causes abnormal fall in leaves and (2) production in Thailand has been affected due
to Covid-related travel restrictions, which has prevented tappers from Laos and Myanmar going
to Thailand’s rubber plantations (Exhibit 2). As a result, we expect RM basket prices to go up by
190-380 bps for two-wheeler OEMs (HMCL, Bajaj Auto, Eicher Motors and TVS Motor) from
2QFY21 levels.
We expect 390-430 bps price increase in the RM basket for M&M and Maruti Suzuki (assuming
only 50% of the steel price increase will get passed through during 4QFY21). Also, we expect
Tata Motors, Ashok Leyland and Escorts RM basket prices to go up by 510-580 bps from
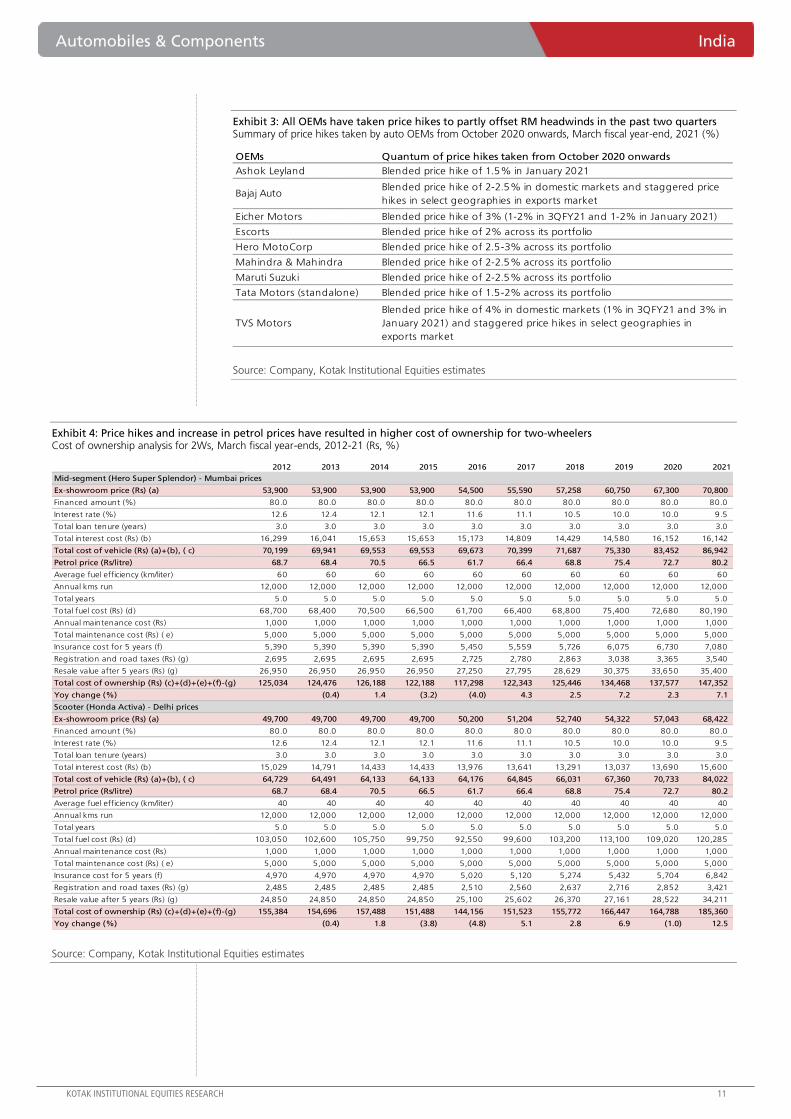
2QFY21 levels. In order to mitigate this impact, OEMs have taken price hikes in the range of
1.5-4% over the past two quarters (Exhibit 3). However, we believe this will not completely
offset the impact of commodity inflation and expect gross margins of automotive
OEMs (except Royal Enfield) to get negatively impacted during 4QFY21 by 50-400 bps.
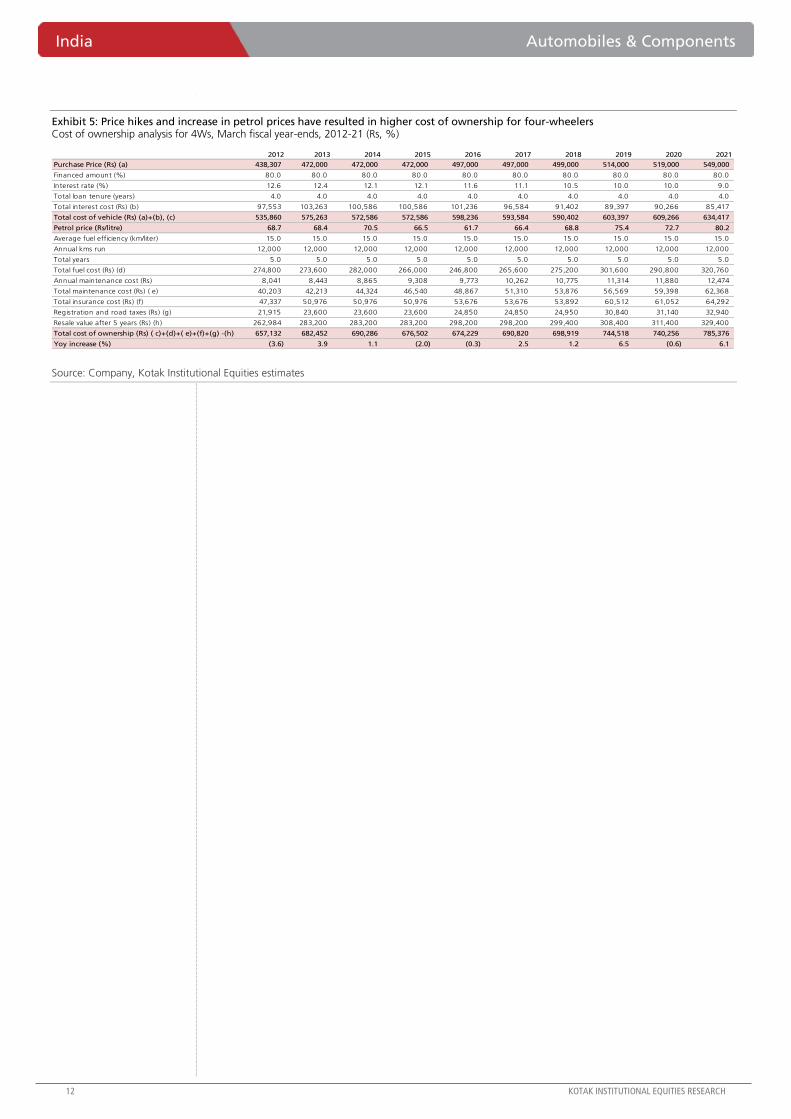
Sharp jump in retail fuel prices further elevates cost of ownership for consumers
The cost of ownership for consumers has sharply increased over the past two years led by (1) 8-
15% price increase due to the BS-VI transition, (2) price hikes taken by OEMs to offset RM
headwinds during FY2021E and (3) the recent surge in retail fuel prices. As a result, total cost of
ownership for two-wheeler consumers has increased by 7-13% on a yoy basis whereas total
cost of ownership for PV consumers has increased by 6% on a yoy basis in FY2021 (Exhibits 4-
5) assuming average petrol price of Rs80.2/liter in FY2021. If we assume current retail price of
petrol at around ~Rs90-91/liter, total cost of ownership for two-wheeler consumers will increase
by 14-21% yoy whereas total cost of ownership for PV consumers will increase by 11% yoy.
Another round of price hikes may dent volume growth prospects
Overall, we expect automotive OEMs’ (except Royal Enfield) gross margins to decline by 50-400
bps on a qoq basis in 4QFY21 mainly due to increase in commodity prices, partly offset by price
hikes taken by the OEMs. OEMs will have to take further price increase to completely offset RM
headwinds. However, we are already witnessing signs of slowdown in domestic 2W demand
due to sharp increase in cost of ownership.
Automobiles & Components India
Commodity pressures to persist in near term. We expect gross margins of
automotive OEMs to remain under pressure in the coming quarters given sharp increase
in commodity prices. Automotive OEMs have taken price hikes to partly offset the
impact of RM headwinds. We except gross margins of TVS Motor and Royal Enfield to
get least impacted sequentially whereas gross margins of CV players (Tata Motors and
Ashok Leyland) and Escorts may decline by 300-400 bps on a qoq basis in 4QFY21.
CAUTIOUS
MARCH 09, 2021
UPDATE
BSE-30: 51,025
Hitesh Goel
Rishi Vora
[email protected]: +91 22 6218 6427
India Automobiles & Components
10 KOTAK INSTITUTIONAL EQUITIES RESEARCH
Exhibit 1: Increase in commodity prices to put pressure on margins for auto companies in the coming quarters Impact of change in commodity prices on OEMs’ margins, March fiscal year-end, 2021 (bps)
Source: Bloomberg, Company, Kotak Institutional Equities estimates
Exhibit 2: Domestic CRC steel price have increased by 47% from 2QFY21 levels Summary of commodity price change, March fiscal year-end, 2018-21 (Rs/ton, US$/ton)
Source: Bloomberg, Company, Kotak Institutional Equities estimates
HMCL Bajaj Auto Maruti Suzuki M&M TaMo standalone Ashok Leyland Eicher Motors Escorts TVS Motors
Average net ASP (Rs/vehicle) 52,977 66,805 448,414 627,614 924,729 1,440,739 140,439 523,642 54,485
Average metal content/unit (Rs/unit) 7,912 10,389 72,989 91,769 176,701 307,963 11,674 101,717 8,297
Metal content as percentage of ASP 14.9 15.6 16.3 14.6 19.1 21.4 8.3 19.4 15.2
Steel content as a % of ASP 5.1 6.6 8.4 8.8 11.7 13.4 2.7 13.2 6.0
Aluminium content as a % of ASP 5.7 4.8 3.9 2.0 2.5 2.4 3.3 1.2 5.5
Rubber content as a % of ASP 1.1 1.2 1.0 0.9 1.0 1.1 0.7 1.2 1.1
Copper content as a % of ASP 1.3 1.3 1.3 1.4 1.8 2.0 0.6 2.3 1.4
Other metal content (precious metals) as a % of ASP 1.7 1.8 1.7 1.6 2.2 2.5 1.0 1.5 1.3
RM impact in 3QFY21 on a qoq basis (%)
Steel 1.2 1.5 1.9 2.0 2.7 3.1 0.6 3.0 1.4
Aluminium 0.7 0.6 0.5 0.3 0.3 0.3 0.4 0.2 0.7
Rubber 0.2 0.2 0.2 0.1 0.2 0.2 0.1 0.2 0.2
Copper 0.1 0.1 0.1 0.1 0.2 0.2 0.1 0.2 0.1
Other metals (precious metals) 0.1 0.1 0.1 0.1 0.2 0.2 0.1 0.1 0.1
Total impact 2.4 2.6 2.9 2.7 3.5 4.0 1.3 3.7 2.5
RM impact in 4QFYTD21 on a qoq basis (%)
Steel 0.5 0.6 0.8 0.9 1.2 1.3 0.3 1.3 0.6
Aluminium 0.4 0.3 0.3 0.1 0.2 0.2 0.2 0.1 0.4
Rubber 0.0 0.0 0.0 0.0 0.0 0.0 0.0 0.0 0.0
Copper 0.2 0.2 0.2 0.2 0.3 0.3 0.1 0.4 0.2
Other metals (precious metals) 0.0 0.0 0.0 0.0 0.0 0.0 0.0 0.0 0.0
Total impact 1.1 1.2 1.3 1.2 1.6 1.8 0.6 1.8 1.2
Total negative impact over the last two quarters 3.5 3.8 4.2 3.9 5.1 5.8 1.9 5.5 3.7
Note: (1) We have assumed 50% pass-through of steel price increase in 4QFY21 in our analysis
(2) Two-wheeler OEMs uses recycled steel and hence the impact will be dependent of rates of recycled steel. However, we have taken price increase of fresh steel for our analysis.
1QFY18 2QFY18 3QFY18 4QFY18 1QFY19 2QFY19 3QFY19 4QFY19 1QFY20 2QFY20 3QFY20 4QFY20 1QFY21 2QFY21 3QFY21 4QFYTD
Domestic CRC steel price (Rs/ton) 41,186 41,869 43,538 47,717 51,038 50,607 51,538 46,833 46,317 42,300 39,800 44,879 43,163 45,261 55,658 66,625
QoQ chg (%) (3.2) 1.7 4.0 9.6 7.0 (0.8) 1.8 (9.1) (1.1) (8.7) (5.9) 12.8 (3.8) 4.9 23.0 19.7
China CRC steel price ($/ton) 553 679 728 747 725 710 658 634 638 617 609 614 557 638 757 846
QoQ chg (%) (18.0) 22.8 7.2 2.6 (2.9) (2.1) (7.3) (3.6) 0.6 (3.2) (1.3) 0.8 (9.3) 14.5 18.7 11.8
LME aluminum ($/ton) 1,906 2,011 2,104 2,159 2,266 2,055 1,966 1,864 1,795 1,766 1,758 1,686 1,498 1,707 1,931 2,059
QoQ chg (%) 3.1 5.5 4.6 2.6 5.0 (9.3) (4.3) (5.2) (3.7) (1.6) (0.5) (4.1) (11.2) 14.0 13.1 6.6
LME lead ($/ton) 2,158 2,328 2,489 2,522 2,382 2,098 1,968 2,049 1,882 2,033 2,038 1,855 1,678 1,874 1,917 2,062
QoQ chg (%) (5.1) 7.9 6.9 1.3 (5.6) (11.9) (6.2) 4.1 (8.2) 8.0 0.2 (9.0) (9.5) 11.7 2.3 7.6
LME copper ($/ton) 5,664 6,355 6,822 6,968 6,888 6,119 6,164 6,218 6,122 5,818 5,916 5,614 5,351 6,527 7,192 8,304
QoQ chg (%) (2.9) 12.2 7.3 2.1 (1.1) (11.2) 0.7 0.9 (1.5) (5.0) 1.7 (5.1) (4.7) 22.0 10.2 15.5
RSS4-natural rubber (Rs/kg) 130.9 132.8 129.1 125.4 123.6 130.8 123.6 125.6 139.2 143.0 127.5 134.0 120.0 131.0 151.9 154.9
QoQ chg (%) (14.0) 1.5 (2.8) (2.9) (1.5) 5.8 (5.5) 1.6 10.8 2.7 (10.8) 5.1 (10.4) 9.2 16.0 2.0
Tokyo generic first rubber price (Rs/kg) 144.6 120.0 111.5 111.3 107.3 100.3 94.5 120.0 130.9 125.1 106.8 107.3 97.9 121.8 179.2 189.3
QoQ chg (%) (19.2) (17.0) (7.1) (0.2) (3.6) (6.5) (5.8) 26.9 9.1 (4.4) (14.6) 0.5 (8.7) 24.4 47.1 5.6
Palladium ($/oz) 820 903 994 1,033 979 952 1,155 1,432 1,391 1,535 1,801 2,294 1,986 2,172 2,350 2,363
QoQ chg (%) 6.8 10.1 10.1 3.9 (5.2) (2.8) 21.3 24.0 (2.9) 10.4 17.3 27.4 (13.4) 9.4 8.2 0.6
Automobiles & Components India
KOTAK INSTITUTIONAL EQUITIES RESEARCH 11
Exhibit 3: All OEMs have taken price hikes to partly offset RM headwinds in the past two quarters Summary of price hikes taken by auto OEMs from October 2020 onwards, March fiscal year-end, 2021 (%)
Source: Company, Kotak Institutional Equities estimates
Exhibit 4: Price hikes and increase in petrol prices have resulted in higher cost of ownership for two-wheelers Cost of ownership analysis for 2Ws, March fiscal year-ends, 2012-21 (Rs, %)
Source: Company, Kotak Institutional Equities estimates
OEMs Quantum of price hikes taken from October 2020 onwards
Ashok Leyland Blended price hike of 1.5% in January 2021
Bajaj AutoBlended price hike of 2-2.5% in domestic markets and staggered price
hikes in select geographies in exports market
Eicher Motors Blended price hike of 3% (1-2% in 3QFY21 and 1-2% in January 2021)
Escorts Blended price hike of 2% across its portfolio
Hero MotoCorp Blended price hike of 2.5-3% across its portfolio
Mahindra & Mahindra Blended price hike of 2-2.5% across its portfolio
Maruti Suzuki Blended price hike of 2-2.5% across its portfolio
Tata Motors (standalone) Blended price hike of 1.5-2% across its portfolio
TVS Motors
Blended price hike of 4% in domestic markets (1% in 3QFY21 and 3% in
January 2021) and staggered price hikes in select geographies in
exports market
2012 2013 2014 2015 2016 2017 2018 2019 2020 2021
Mid-segment (Hero Super Splendor) - Mumbai prices
Ex-showroom price (Rs) (a) 53,900 53,900 53,900 53,900 54,500 55,590 57,258 60,750 67,300 70,800
Financed amount (%) 80.0 80.0 80.0 80.0 80.0 80.0 80.0 80.0 80.0 80.0
Interest rate (%) 12.6 12.4 12.1 12.1 11.6 11.1 10.5 10.0 10.0 9.5
Total loan tenure (years) 3.0 3.0 3.0 3.0 3.0 3.0 3.0 3.0 3.0 3.0
Total interest cost (Rs) (b) 16,299 16,041 15,653 15,653 15,173 14,809 14,429 14,580 16,152 16,142
Total cost of vehicle (Rs) (a)+(b), ( c) 70,199 69,941 69,553 69,553 69,673 70,399 71,687 75,330 83,452 86,942
Petrol price (Rs/litre) 68.7 68.4 70.5 66.5 61.7 66.4 68.8 75.4 72.7 80.2
Average fuel efficiency (km/liter) 60 60 60 60 60 60 60 60 60 60
Annual kms run 12,000 12,000 12,000 12,000 12,000 12,000 12,000 12,000 12,000 12,000
Total years 5.0 5.0 5.0 5.0 5.0 5.0 5.0 5.0 5.0 5.0
Total fuel cost (Rs) (d) 68,700 68,400 70,500 66,500 61,700 66,400 68,800 75,400 72,680 80,190
Annual maintenance cost (Rs) 1,000 1,000 1,000 1,000 1,000 1,000 1,000 1,000 1,000 1,000
Total maintenance cost (Rs) ( e) 5,000 5,000 5,000 5,000 5,000 5,000 5,000 5,000 5,000 5,000
Insurance cost for 5 years (f) 5,390 5,390 5,390 5,390 5,450 5,559 5,726 6,075 6,730 7,080
Registration and road taxes (Rs) (g) 2,695 2,695 2,695 2,695 2,725 2,780 2,863 3,038 3,365 3,540
Resale value after 5 years (Rs) (g) 26,950 26,950 26,950 26,950 27,250 27,795 28,629 30,375 33,650 35,400
Total cost of ownership (Rs) (c)+(d)+(e)+(f)-(g) 125,034 124,476 126,188 122,188 117,298 122,343 125,446 134,468 137,577 147,352
Yoy change (%) (0.4) 1.4 (3.2) (4.0) 4.3 2.5 7.2 2.3 7.1
Scooter (Honda Activa) - Delhi prices
Ex-showroom price (Rs) (a) 49,700 49,700 49,700 49,700 50,200 51,204 52,740 54,322 57,043 68,422
Financed amount (%) 80.0 80.0 80.0 80.0 80.0 80.0 80.0 80.0 80.0 80.0
Interest rate (%) 12.6 12.4 12.1 12.1 11.6 11.1 10.5 10.0 10.0 9.5
Total loan tenure (years) 3.0 3.0 3.0 3.0 3.0 3.0 3.0 3.0 3.0 3.0
Total interest cost (Rs) (b) 15,029 14,791 14,433 14,433 13,976 13,641 13,291 13,037 13,690 15,600
Total cost of vehicle (Rs) (a)+(b), ( c) 64,729 64,491 64,133 64,133 64,176 64,845 66,031 67,360 70,733 84,022
Petrol price (Rs/litre) 68.7 68.4 70.5 66.5 61.7 66.4 68.8 75.4 72.7 80.2
Average fuel efficiency (km/liter) 40 40 40 40 40 40 40 40 40 40
Annual kms run 12,000 12,000 12,000 12,000 12,000 12,000 12,000 12,000 12,000 12,000
Total years 5.0 5.0 5.0 5.0 5.0 5.0 5.0 5.0 5.0 5.0
Total fuel cost (Rs) (d) 103,050 102,600 105,750 99,750 92,550 99,600 103,200 113,100 109,020 120,285
Annual maintenance cost (Rs) 1,000 1,000 1,000 1,000 1,000 1,000 1,000 1,000 1,000 1,000
Total maintenance cost (Rs) ( e) 5,000 5,000 5,000 5,000 5,000 5,000 5,000 5,000 5,000 5,000
Insurance cost for 5 years (f) 4,970 4,970 4,970 4,970 5,020 5,120 5,274 5,432 5,704 6,842
Registration and road taxes (Rs) (g) 2,485 2,485 2,485 2,485 2,510 2,560 2,637 2,716 2,852 3,421
Resale value after 5 years (Rs) (g) 24,850 24,850 24,850 24,850 25,100 25,602 26,370 27,161 28,522 34,211
Total cost of ownership (Rs) (c)+(d)+(e)+(f)-(g) 155,384 154,696 157,488 151,488 144,156 151,523 155,772 166,447 164,788 185,360
Yoy change (%) (0.4) 1.8 (3.8) (4.8) 5.1 2.8 6.9 (1.0) 12.5
India Automobiles & Components
12 KOTAK INSTITUTIONAL EQUITIES RESEARCH
Exhibit 5: Price hikes and increase in petrol prices have resulted in higher cost of ownership for four-wheelers Cost of ownership analysis for 4Ws, March fiscal year-ends, 2012-21 (Rs, %)
Source: Company, Kotak Institutional Equities estimates
2012 2013 2014 2015 2016 2017 2018 2019 2020 2021
Purchase Price (Rs) (a) 438,307 472,000 472,000 472,000 497,000 497,000 499,000 514,000 519,000 549,000
Financed amount (%) 80.0 80.0 80.0 80.0 80.0 80.0 80.0 80.0 80.0 80.0
Interest rate (%) 12.6 12.4 12.1 12.1 11.6 11.1 10.5 10.0 10.0 9.0
Total loan tenure (years) 4.0 4.0 4.0 4.0 4.0 4.0 4.0 4.0 4.0 4.0
Total interest cost (Rs) (b) 97,553 103,263 100,586 100,586 101,236 96,584 91,402 89,397 90,266 85,417
Total cost of vehicle (Rs) (a)+(b), (c) 535,860 575,263 572,586 572,586 598,236 593,584 590,402 603,397 609,266 634,417
Petrol price (Rs/litre) 68.7 68.4 70.5 66.5 61.7 66.4 68.8 75.4 72.7 80.2
Average fuel efficiency (km/liter) 15.0 15.0 15.0 15.0 15.0 15.0 15.0 15.0 15.0 15.0
Annual kms run 12,000 12,000 12,000 12,000 12,000 12,000 12,000 12,000 12,000 12,000
Total years 5.0 5.0 5.0 5.0 5.0 5.0 5.0 5.0 5.0 5.0
Total fuel cost (Rs) (d) 274,800 273,600 282,000 266,000 246,800 265,600 275,200 301,600 290,800 320,760
Annual maintenance cost (Rs) 8,041 8,443 8,865 9,308 9,773 10,262 10,775 11,314 11,880 12,474
Total maintenance cost (Rs) ( e) 40,203 42,213 44,324 46,540 48,867 51,310 53,876 56,569 59,398 62,368
Total insurance cost (Rs) (f) 47,337 50,976 50,976 50,976 53,676 53,676 53,892 60,512 61,052 64,292
Registration and road taxes (Rs) (g) 21,915 23,600 23,600 23,600 24,850 24,850 24,950 30,840 31,140 32,940
Resale value after 5 years (Rs) (h) 262,984 283,200 283,200 283,200 298,200 298,200 299,400 308,400 311,400 329,400
Total cost of ownership (Rs) ( c)+(d)+( e)+(f)+(g) -(h) 657,132 682,452 690,286 676,502 674,229 690,820 698,919 744,518 740,256 785,376
Yoy increase (%) (3.6) 3.9 1.1 (2.0) (0.3) 2.5 1.2 6.5 (0.6) 6.1
For Private Circulation Only. FOR IMPORTANT INFORMATION ABOUT KOTAK SECURITIES’ RATING SYSTEM AND OTHER DISCLOSURES, REFER TO THE END OF THIS MATERIAL.
Pricing – Price hikes continue in edible oil and soaps; muted activity in other categories
Home and personal care: We witness further price increase in soaps with the rise in palm
oil/PFAD prices. HUL has raised the price of select SKUs of Lux and Lifebuoy soap by 9%
while GCPL has raised price of select SKUs of Cinthol Original soap by 2%. In detergent
powders, HUL has raised price of 1 Kg SKU of Rin Advance by 4%. In HI, Jyothy Labs has
raised price of Maxo LV refill by about 3%. In shampoos, Patanjali has raised the price of
select SKUs of Kesh Kanti shampoo by 7%. P&G has increased the price of Olay Total Effects
face cleanser by 11%.
Foods and beverages: We have seen minimal pricing actions in foods/beverages with the
exception of edible oils. Marico has raised the price of multiple SKUs of Saffola edible oils
with 3% price increase in Saffola Tasty Blend, Gold and Active variants. ITC has raised the
price of 150 gm pack of Sunfeast Bourbon biscuit by 7%. Lactalis (Prabhat brand) has hiked
milk procurement price by Re1 to Rs30 per liter in Maharashtra. Nestle India has raised the
price of 400 gm pouch pack of Nestea Iced tea by 9%. Mondelez has lowered the effective
price of Cadbury 5 Star chocolate by 7% through grammage increase.
RM– Inflationary trends in oil commodities while mixed price trends in agri-commodities
See Exhibit 3 for detailed RM inflation impact.
Agri-inputs. Agri-commodities showed mixed trends in February. Domestic tea prices
continued to moderate in February (down 7% mom). Tea prices are down 40% from its
recent peak (August 2020) but is still up 57% on yoy basis. International coffee prices saw
some inflationary pressure (up 3-5% mom). Milk prices rose sharply (up 10% mom). The
price increase is due to (1) higher freight costs and (2) increase in the price of animal feed.
Prices are expected to remain firm in the near term; we note that milk prices have seen a
steady increase post the Covid-led slump in April. SMP prices were up 3% mom. Wheat,
sugar and barley prices were broadly stable. Maize continued to see inflationary pressure (up
5% mom).
Oil commodities basket. Crude prices were up 14% mom for the month; on a yoy basis
crude is up 13%. Most of the agri-oils continued to see inflationary pressure for the month.
Palm oil and PFAD prices continued to rise (up 5-6% mom) and are now up 37-40% on a
yoy basis. Copra and coconut oil saw 2-5% mom rise. Marico’s management expects copra
prices to start easing from 1Q on the back of a healthy crop outlook. Sunflower and
groundnut oil also saw a sharp increase of 5-6% mom. Sunflower oil is up 73% on a yoy
basis due to lower production in some of the international markets. Mentha and LLP were
stable for the month while rice bran oil saw moderate inflation of 2% mom.
Other commodities. Sharp inflationary pressure was seen for select commodities. VAM
(China) prices continued to remain hard – hovering close to US$1,400/MT level in February
(post the sharp increase in December). Styrene monomer too saw a sharp price increase of
7% mom. Gold prices continued to ease (down 5% mom); it is down 11% mom in the past
six months.
Consumer Staples India
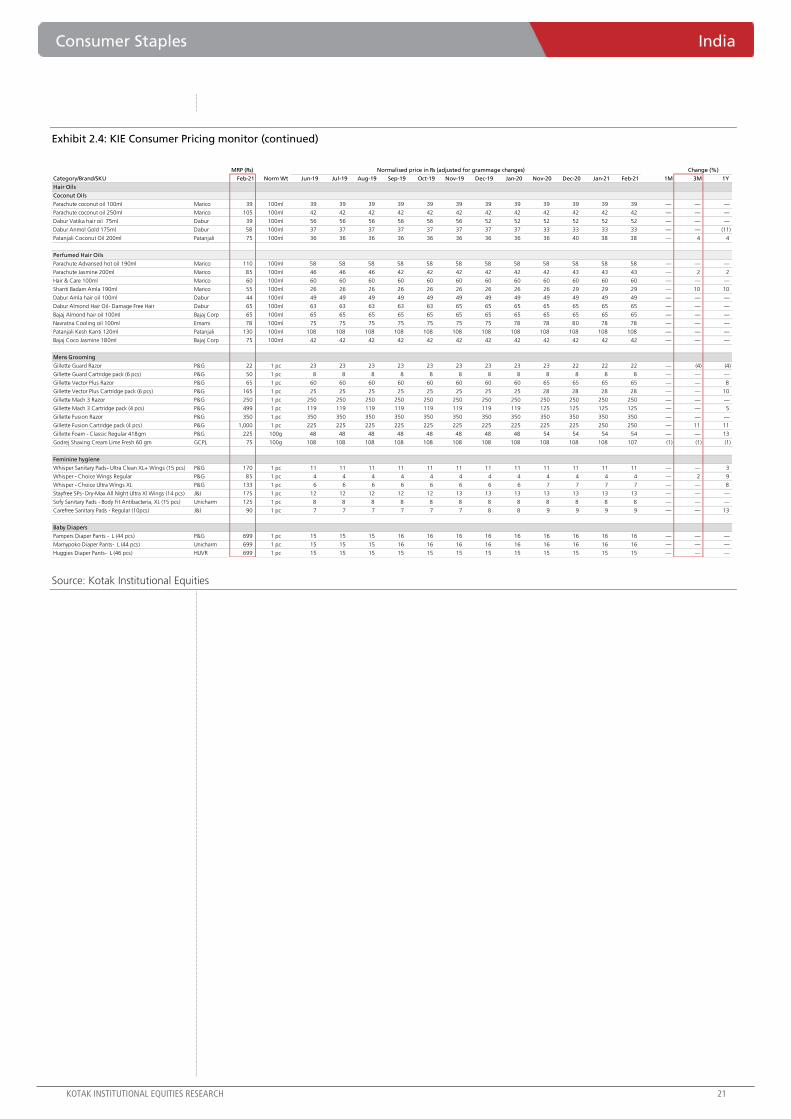
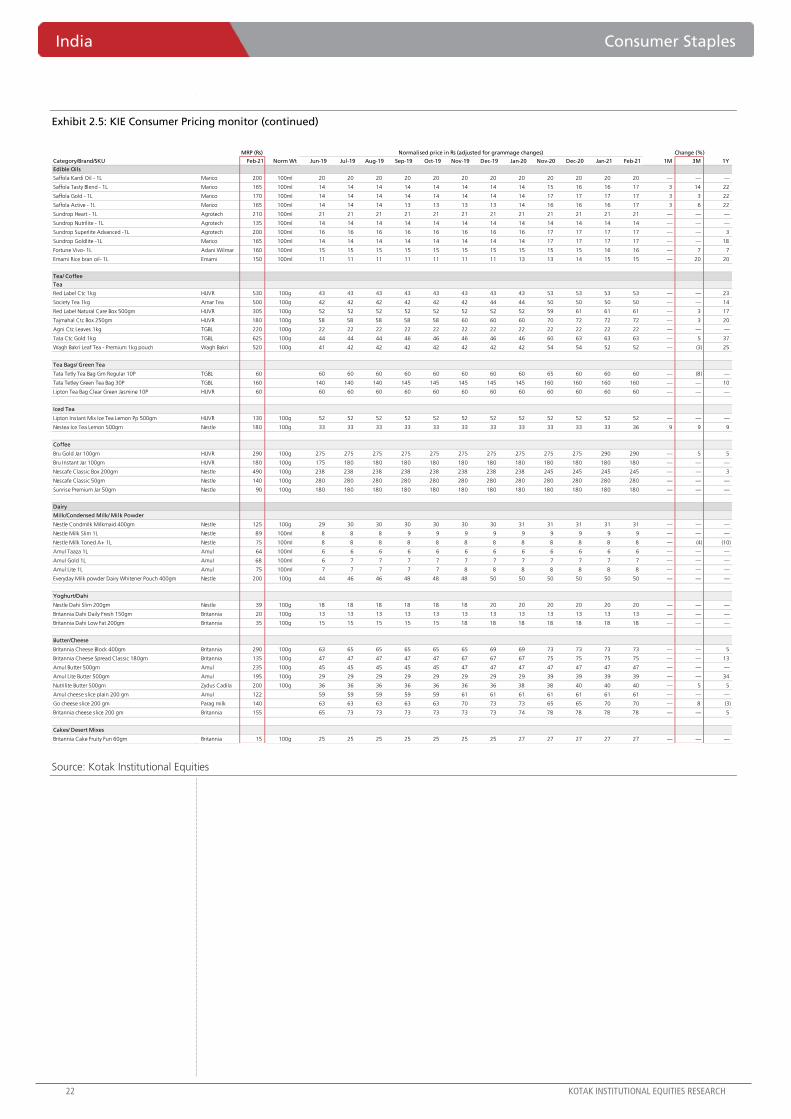
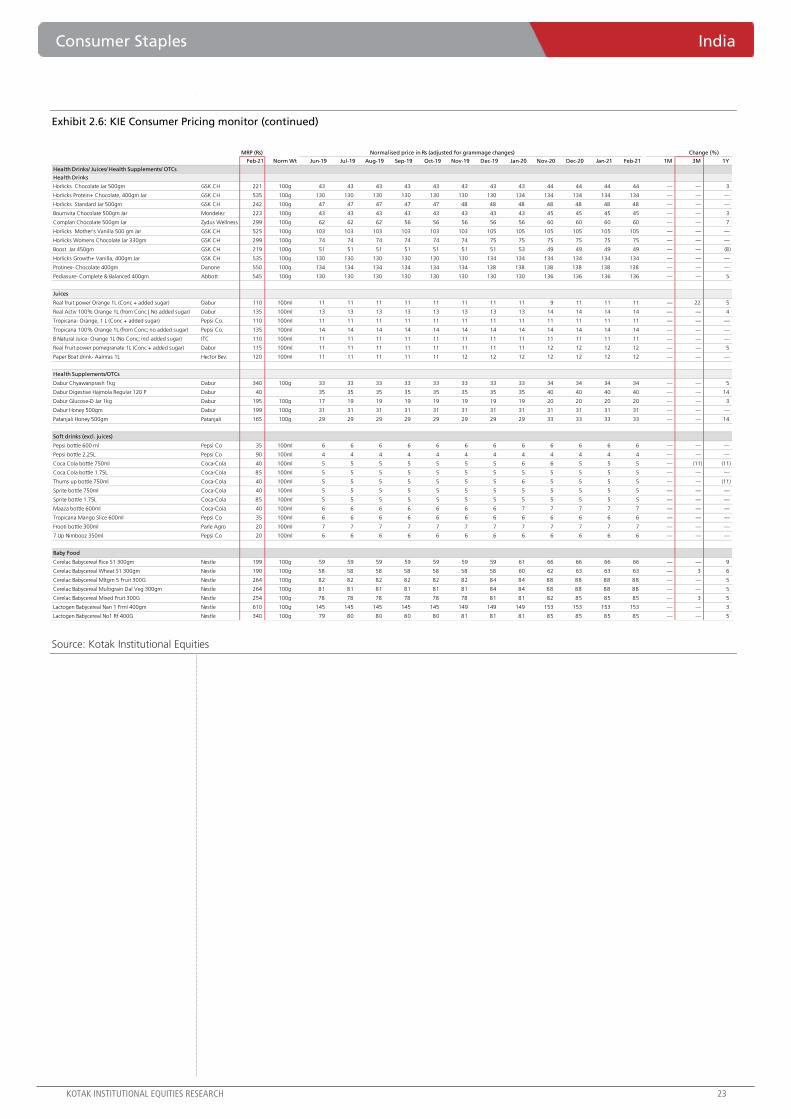
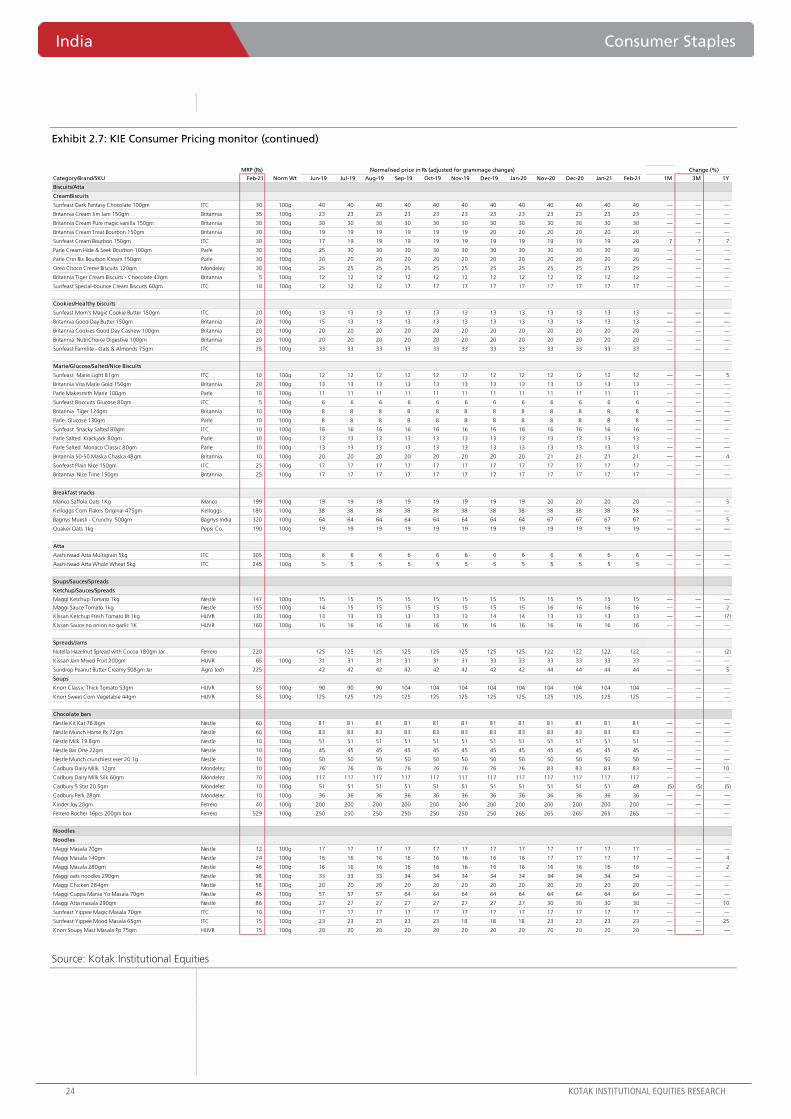
Month in review – Feb 2021. The KIE consumer universe was down 3% over the past
one month, underperforming the broader markets by 200 bps. On the in-market activity
front, further price increases were seen in soaps and select edible oils. On RM front, we
witnessed (1) a sharp price increase in milk, (2) further increase in prices of most oil
commodities, and (3) further inflationary pressure in VAM and monomers. Broad-based
inflation would weigh on gross margins of most consumer companies in the near term.
ATTRACTIVE
MARCH 10, 2021
UPDATE
BSE-30: 51,025
Jaykumar Doshi
Aniket Sethi
Sushruta Mishra
[email protected]: +91 22 6218 6427
India Consumer Staples
14 KOTAK INSTITUTIONAL EQUITIES RESEARCH
Who benefits? (1) Easing tea prices should provide some relief to HUVR and TATACONS,
(2) continued benign intensity for wheat benefits ITC, NEST and BRIT.
Who gets impacted? (1) Higher prices for monomers and VAM are negative for paint
companies and PIDI. (2) PFAD inflation to hurt HUVR, GCPL and JYL. (3) Inflation in
Copra, and LLP would weigh on edible oil and hair oil categories (Marico). (4) Increase in
milk prices hurts NEST and BRIT.
Sector (KIE consumer universe) underperformed the broader markets
Our overall consumer coverage universe underperformed the broader markets over the past
month, down 3% (down 4% ex-ITC) while the broader market was down 1%.
Key stocks that outperformed were – VBL (+11% mom), JUBI (+7% mom), CLGT (+3%
mom) and TATACONS (+2% mom). Key under-performers were GCPL (-9% mom), PAG (-
8% mom), TTAN (-7% mom) and BRGR (-6% mom).
On a 12-month basis, the sector is now underperforming the broader markets posting 17%
absolute gain (15% ex-ITC). Our preferred picks – HUVR, TATACONS, DABUR, ITC, JUBI,
TTAN, NEST, MRCO, GCPL and VBL.
New launches and re-launches
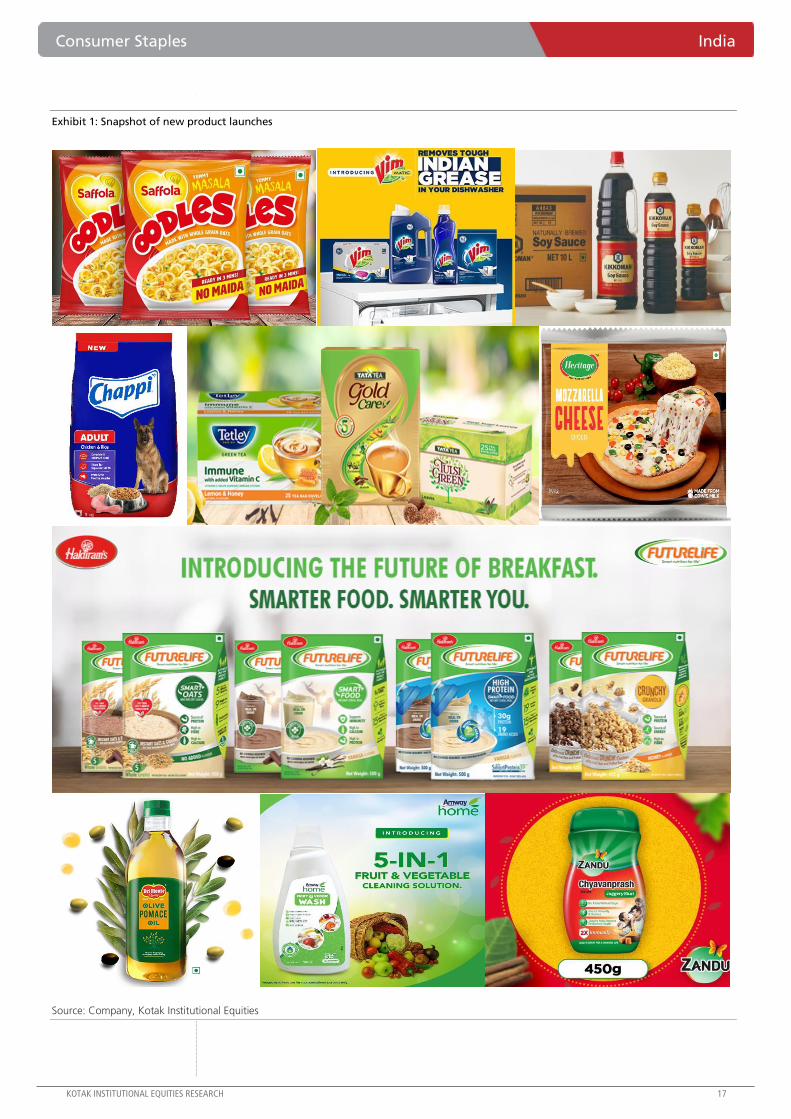
Marico has forayed into the instant noodles category with the launch of ‘Saffola Oodles’
brand. The product, based on multi-grain oats and vegetables, is positioned as a healthy
ready-to-eat snack alternative. Saffola Oodles is available in two SKUs – single pack of 46
gm for Rs20 and pack-of-four of 184 gm for Rs80.
HUL has forayed into the machine dishwash segment with the launch of Vim Matic range
of products. Vim Matic machine dishwash range consists of Detergent Powder, Rinse Aid
(Rs375 for 500ml), Dishwash Salt (Rs200 for 1kg) and an All-In-One Tablet. Vim Matic All-
In-One tablets are priced at Rs1,200 for 30 tablets.
ITC has expanded its instant noodles portfolio under the Sunfeast YiPPee! brand with the
launch of a new Saucy Masala variant. The product is available in two SKUs – 65 gm
single pack for Rs15 and a four-in-one pack of 260 gm for Rs58.
Kikkoman (leading Japanese sauce brand) has entered the Indian market and has set up
a wholly-owned subsidiary for import and distribution of products. The brand, well
known globally for its ‘Honjozo’ soy sauce aims to be the market leader in Asian sauces
category in India.
Mars Petcare has launched its dog food brand Chappi in India. Chappi offers
Chicken/Milk for puppies and Chicken/Rice for adult dogs, along with necessary nutrients
and fibers. The product is available in 3kg/8kg SKUs for puppies and 3/8/20kg SKUs for
adult dogs.
Haldiram has forayed into health foods space through a distribution tie-up with Africa’s
Futurelife to introduce its nutritional foods range in India. Futurelife will sell its products
under Smart Foods brand which includes steel cut oats, packaged granola, and a range of
high-protein offerings.
Tata Consumer has strengthened its wellness portfolio with the launch of two new
variants of Tata Tea (Tata Tulsi Green Tea and Tata Tea Gold Care). Tata Tea Gold Care is
priced at Rs140 (for 250gm) and Rs265 (for 500gm) while Tata Tulsi Green tea is available
at Rs174 for 100gm pack.
Consumer Staples India
KOTAK INSTITUTIONAL EQUITIES RESEARCH 15
Emami has expanded its health and wellness portfolio with the launch of a new variant
of Zandu Chyavanprash with the added-benefits of natural jaggery. The product has no-
added refined sugar and is claimed to have 2X immunity.
Heritage Foods has forayed into cheese and fresh cream category with the launch of
mozzarella cheese, processed cheese, and fresh cream. The cheese variants are available
in 500 gm for mozzarella and 200/400/1000 gm SKUs for processed cheese. Heritage
fresh cream is available in 200gm Tetra packs.
Heritage Foods has also expanded its milk-based drinks portfolio with the launch of Cool
Café – an on-the-go coffee drink available in 180 ml packs.
Amway has expanded its home care portfolio with the launch of fruit and veggie wash.
The product is priced at Rs249 for a 500 ml pack and is sold through direct sellers and
online channel. Amway has recently stepped up investments in the homecare space and
expects to register Rs2.5 bn revenue by 2025.
Del Monte has launched Olive oil priced at Rs250 for 1litre pouch pack – at a significant
discount (~60-70%) to alternative brands available in the market. The product is available
in e-commerce channels and offline outlets in select markets.
Chai Point has launched instant chai taking into account increased consumer preference
for in-home food consumption. The product is available on e-commerce channel in three
variants (masala, ginger, and cardamom) in sachet format priced at Rs180 (for pack of
10).
William Lawson has forayed into premium Scotch whisky with the launch of William
Lawson’s 13 in Telangana. The product is available in premium retail and on-trade
outlets. With this launch, William Lawson now has 13 variants in the whisky segment in
India.
Consumer Sector Newsflow
Indian FMCG industry grew 7.3% yoy in Dec-2020 quarter on the back of robust 14.2%
yoy growth in rural sales, per Nielsen. The growth was led by recovery in consumption
and continued rural growth post the festive period.
FMCG companies dial-up rural distribution expansion. With strong rural demand,
FMCG companies have accelerated distributor addition in rural markets. As per Bizom, a
sales automation firm that transacts with 7.5 mn retail stores, the number of distributors
in Indian FMCG industry increased by 42% yoy to 12,192 as of Jan-2021. The increase
was driven entirely by rural markets while distributor count shrank in cities.
Mondelez has move court against Parle Products claiming trademark infringement with
‘deceptively similar’ design of Parle’s Fabio Biscuits compared to Oreo Biscuits. Parle
launched Fabio biscuits in Jan-2020.
Grupo Bimbo has acquired Modern Foods from Everstone PE. With a topline of ~Rs4
bn, Modern Foods has ~35-40% market share in the Indian bread market. Grupo Bimbo
is the largest baking company globally, operating in 33 countries with a portfolio of 100+
brands. The company currently operates bakery brand Harvest Gold in India.
Hindustan Unilever plans to be plastic-neutral in CY2021, and will collect and
process more plastic than it uses. The company plans to enable processing of 0.1 mn
tonnes of plastic waste during the year. Among other FMCG companies, Nestle India has
achieved plastic neutrality while Dabur is expected to by March-2022.
India Consumer Staples
16 KOTAK INSTITUTIONAL EQUITIES RESEARCH
Emami is planning for acquisition of digital-first brands in India and International
markets, to tap into opportunities arising out of Covid-19 pandemic. The company plans
to increase e-commerce salience to 6-7% in the next two years from 2.5-3% currently.
Coca-Cola’s key strategic focus areas – Addressing at Cola-Cola’s first all-India bottling
partners meet, Mr Sanket Ray highlighted deeper distribution in smaller markets,
increased focus on profitability, and investments in healthier beverages are key strategies
that the company will focus on this year.
Cosmo Films is foraying into consumer-facing businesses such as laundry sanitizers,
household accessories, and pet care products, leveraging synergies on packaging. The
company currently makes specialty films for packaging and lamination.
Leading jewelry retailers have stepped up gold jewelry hallmarking, which is
expected to become mandatory from 1st Jun-2021, for gold jewelry of 14, 18 and 22
carat. Per guidelines, failure to comply can attract penalty of up to five times the cost of
jewelry and one year imprisonment.
Rising online trade in jewelry space. Indian gems and jewelry exporters are increasing
e-commerce presence, targeting 35-40% export shipments through this channel in
FY2022. Gem and Jewelry Export Promotion Council (GJEPC) has entered into an MoU
with eBay group company (ES Online Service) to export products to the U.S market.
Consumer Staples India
KOTAK INSTITUTIONAL EQUITIES RESEARCH 17
Exhibit 1: Snapshot of new product launches
Source: Company, Kotak Institutional Equities
India Consumer Staples
18 KOTAK INSTITUTIONAL EQUITIES RESEARCH
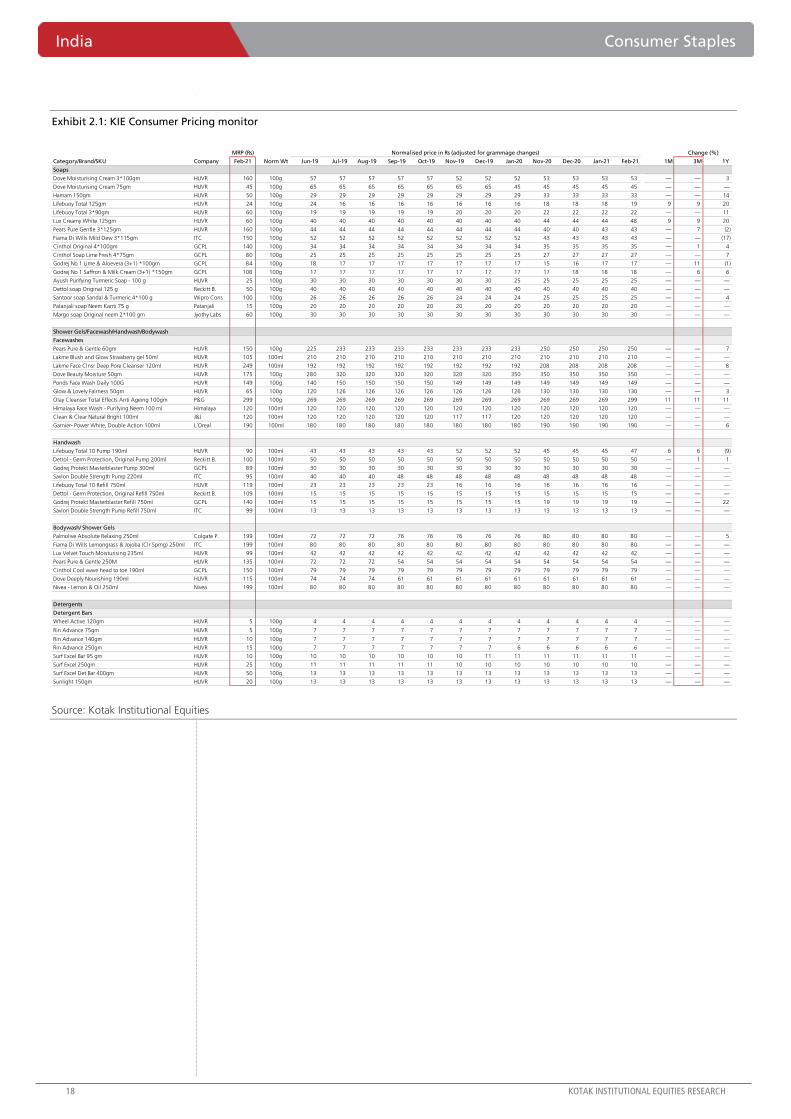
Exhibit 2.1: KIE Consumer Pricing monitor
Source: Kotak Institutional Equities
MRP (Rs)
Category/Brand/SKU Company Feb-21 Norm Wt Jun-19 Jul-19 Aug-19 Sep-19 Oct-19 Nov-19 Dec-19 Jan-20 Nov-20 Dec-20 Jan-21 Feb-21 1M 3M 1Y
Soaps
Dove Moisturising Cream 3*100gm HUVR 160 100g 57 57 57 57 57 52 52 52 53 53 53 53 — — 3
Dove Moisturising Cream 75gm HUVR 45 100g 65 65 65 65 65 65 65 45 45 45 45 45 — — —
Hamam 150gm HUVR 50 100g 29 29 29 29 29 29 29 29 33 33 33 33 — — 14
Lifebuoy Total 125gm HUVR 24 100g 24 16 16 16 16 16 16 16 18 18 18 19 9 9 20
Lifebuoy Total 3*90gm HUVR 60 100g 19 19 19 19 19 20 20 20 22 22 22 22 — — 11
Lux Creamy White 125gm HUVR 60 100g 40 40 40 40 40 40 40 40 44 44 44 48 9 9 20
Pears Pure Gentle 3*125gm HUVR 160 100g 44 44 44 44 44 44 44 44 40 40 43 43 — 7 (2)
Fiama Di Wills Mild Dew 3*115gm ITC 150 100g 52 52 52 52 52 52 52 52 43 43 43 43 — — (17)
Cinthol Original 4*100gm GCPL 140 100g 34 34 34 34 34 34 34 34 35 35 35 35 — 1 4
Cinthol Soap Lime Fresh 4*75gm GCPL 80 100g 25 25 25 25 25 25 25 25 27 27 27 27 — — 7
Godrej No 1 Lime & Aloevera (3+1) *100gm GCPL 84 100g 18 17 17 17 17 17 17 17 15 16 17 17 — 11 (1)
Godrej No 1 Saffron & Milk Cream (3+1) *150gm GCPL 108 100g 17 17 17 17 17 17 17 17 17 18 18 18 — 6 6
Ayush Purifying Turmeric Soap - 100 g HUVR 25 100g 30 30 30 30 30 30 30 25 25 25 25 25 — — —
Dettol soap Original 125 g Reckitt B. 50 100g 40 40 40 40 40 40 40 40 40 40 40 40 — — —
Santoor soap Sandal & Turmeric 4*100 g Wipro Cons 100 100g 26 26 26 26 26 24 24 24 25 25 25 25 — — 4
Patanjali soap Neem Kanti 75 g Patanjali 15 100g 20 20 20 20 20 20 20 20 20 20 20 20 — — —
Margo soap Original neem 2*100 gm Jyothy Labs 60 100g 30 30 30 30 30 30 30 30 30 30 30 30 — — —
Shower Gels/Facewash/Handwash/Bodywash
Facewashes
Pears Pure & Gentle 60gm HUVR 150 100g 225 233 233 233 233 233 233 233 250 250 250 250 — — 7
Lakme Blush and Glow Strawberry gel 50ml HUVR 105 100ml 210 210 210 210 210 210 210 210 210 210 210 210 — — —
Lakme Face Clnsr Deep Pore Cleanser 120ml HUVR 249 100ml 192 192 192 192 192 192 192 192 208 208 208 208 — — 8
Dove Beauty Moisture 50gm HUVR 175 100g 280 320 320 320 320 320 320 350 350 350 350 350 — — —
Ponds Face Wash Daily 100G HUVR 149 100g 140 150 150 150 150 149 149 149 149 149 149 149 — — —
Glow & Lovely Fairness 50gm HUVR 65 100g 120 126 126 126 126 126 126 126 130 130 130 130 — — 3
Olay Cleanser Total Effects Anti Ageing 100gm P&G 299 100g 269 269 269 269 269 269 269 269 269 269 269 299 11 11 11
Himalaya Face Wash - Purifying Neem 100 ml Himalaya 120 100ml 120 120 120 120 120 120 120 120 120 120 120 120 — — —
Clean & Clear Natural Bright 100ml J&J 120 100ml 120 120 120 120 120 117 117 120 120 120 120 120 — — —
Garnier- Power White, Double Action 100ml L'Oreal 190 100ml 180 180 180 180 180 180 180 180 190 190 190 190 — — 6
Handwash
Lifebuoy Total 10 Pump 190ml HUVR 90 100ml 43 43 43 43 43 52 52 52 45 45 45 47 6 6 (9)
Dettol - Germ Protection, Original Pump 200ml Reckitt B. 100 100ml 50 50 50 50 50 50 50 50 50 50 50 50 — 1 1
Godrej Protekt Masterblaster Pump 300ml GCPL 89 100ml 30 30 30 30 30 30 30 30 30 30 30 30 — — —
Savlon Double Strength Pump 220ml ITC 95 100ml 40 40 40 48 48 48 48 48 48 48 48 48 — — —
Lifebuoy Total 10 Refill 750ml HUVR 119 100ml 23 23 23 23 23 16 16 16 16 16 16 16 — — —
Dettol - Germ Protection, Original Refill 750ml Reckitt B. 109 100ml 15 15 15 15 15 15 15 15 15 15 15 15 — — —
Godrej Protekt Masterblaster Refill 750ml GCPL 140 100ml 15 15 15 15 15 15 15 15 19 19 19 19 — — 22
Savlon Double Strength Pump Refill 750ml ITC 99 100ml 13 13 13 13 13 13 13 13 13 13 13 13 — — —
Bodywash/ Shower Gels
Palmolive Absolute Relaxing 250ml Colgate P. 199 100ml 72 72 72 76 76 76 76 76 80 80 80 80 — — 5
Fiama Di Wills Lemongrass & Jojoba (Clr Sprng) 250ml ITC 199 100ml 80 80 80 80 80 80 80 80 80 80 80 80 — — —
Lux Velvet Touch Moisturising 235ml HUVR 99 100ml 42 42 42 42 42 42 42 42 42 42 42 42 — — —
Pears Pure & Gentle 250M HUVR 135 100ml 72 72 72 54 54 54 54 54 54 54 54 54 — — —
Cinthol Cool wave head to toe 190ml GCPL 150 100ml 79 79 79 79 79 79 79 79 79 79 79 79 — — —
Dove Deeply Nourishing 190ml HUVR 115 100ml 74 74 74 61 61 61 61 61 61 61 61 61 — — —
Nivea - Lemon & Oil 250ml Nivea 199 100ml 80 80 80 80 80 80 80 80 80 80 80 80 — — —
Detergents
Detergent Bars
Wheel Active 120gm HUVR 5 100g 4 4 4 4 4 4 4 4 4 4 4 4 — — —
Rin Advance 75gm HUVR 5 100g 7 7 7 7 7 7 7 7 7 7 7 7 — — —
Rin Advance 140gm HUVR 10 100g 7 7 7 7 7 7 7 7 7 7 7 7 — — —
Rin Advance 250gm HUVR 15 100g 7 7 7 7 7 7 7 6 6 6 6 6 — — —
Surf Excel Bar 95 gm HUVR 10 100g 10 10 10 10 10 10 11 11 11 11 11 11 — — —
Surf Excel 250gm HUVR 25 100g 11 11 11 11 11 10 10 10 10 10 10 10 — — —
Surf Excel Det Bar 400gm HUVR 50 100g 13 13 13 13 13 13 13 13 13 13 13 13 — — —
Sunlight 150gm HUVR 20 100g 13 13 13 13 13 13 13 13 13 13 13 13 — — —
Change (%)Normalised price in Rs (adjusted for grammage changes)
Consumer Staples India
KOTAK INSTITUTIONAL EQUITIES RESEARCH 19
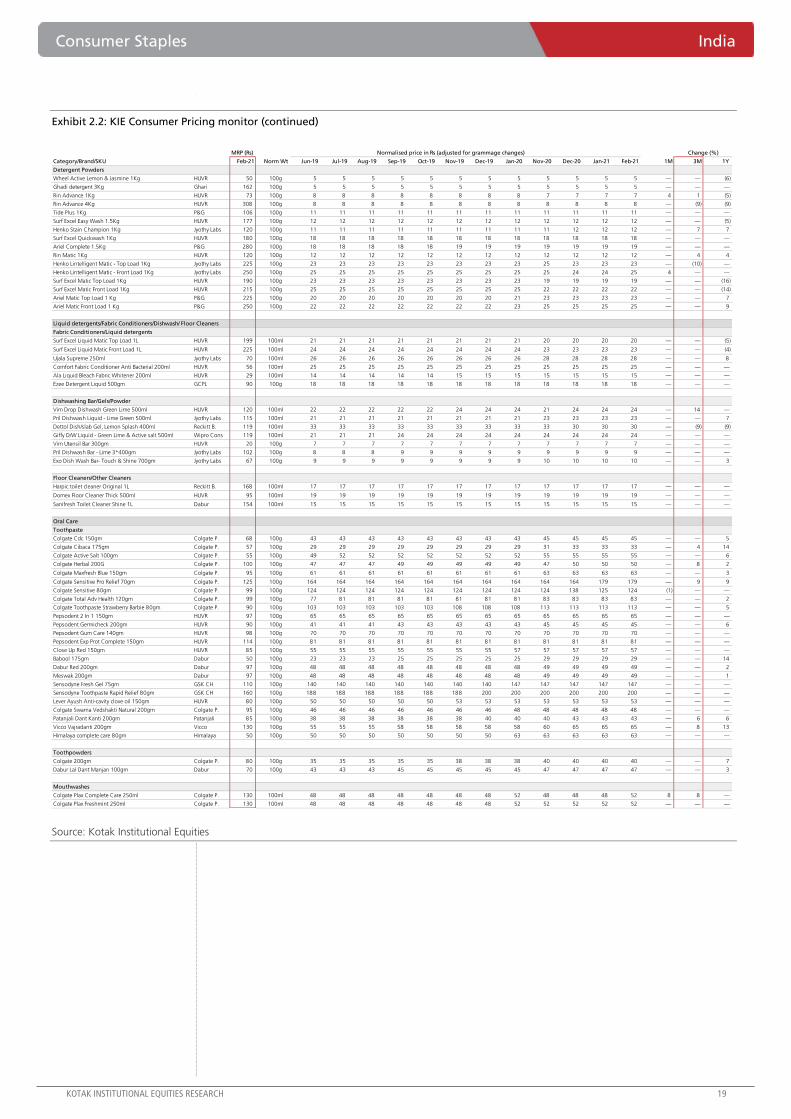
Exhibit 2.2: KIE Consumer Pricing monitor (continued)
Source: Kotak Institutional Equities
MRP (Rs)
Category/Brand/SKU Feb-21 Norm Wt Jun-19 Jul-19 Aug-19 Sep-19 Oct-19 Nov-19 Dec-19 Jan-20 Nov-20 Dec-20 Jan-21 Feb-21 1M 3M 1Y
Detergent Powders
Wheel Active Lemon & Jasmine 1Kg HUVR 50 100g 5 5 5 5 5 5 5 5 5 5 5 5 — — (6)
Ghadi detergent 3Kg Ghari 162 100g 5 5 5 5 5 5 5 5 5 5 5 5 — — —
Rin Advance 1Kg HUVR 73 100g 8 8 8 8 8 8 8 8 7 7 7 7 4 1 (5)
Rin Advance 4Kg HUVR 308 100g 8 8 8 8 8 8 8 8 8 8 8 8 — (9) (9)
Tide Plus 1Kg P&G 106 100g 11 11 11 11 11 11 11 11 11 11 11 11 — — —
Surf Excel Easy Wash 1.5Kg HUVR 177 100g 12 12 12 12 12 12 12 12 12 12 12 12 — — (5)
Henko Stain Champion 1Kg Jyothy Labs 120 100g 11 11 11 11 11 11 11 11 11 12 12 12 — 7 7
Surf Excel Quickwash 1Kg HUVR 180 100g 18 18 18 18 18 18 18 18 18 18 18 18 — — —
Ariel Complete 1.5Kg P&G 280 100g 18 18 18 18 18 19 19 19 19 19 19 19 — — —
Rin Matic 1Kg HUVR 120 100g 12 12 12 12 12 12 12 12 12 12 12 12 — 4 4
Henko Lintelligent Matic - Top Load 1Kg Jyothy Labs 225 100g 23 23 23 23 23 23 23 23 25 23 23 23 — (10) —
Henko Lintelligent Matic - Front Load 1Kg Jyothy Labs 250 100g 25 25 25 25 25 25 25 25 25 24 24 25 4 — —
Surf Excel Matic Top Load 1Kg HUVR 190 100g 23 23 23 23 23 23 23 23 19 19 19 19 — — (16)
Surf Excel Matic Front Load 1Kg HUVR 215 100g 25 25 25 25 25 25 25 25 22 22 22 22 — — (14)
Ariel Matic Top Load 1 Kg P&G 225 100g 20 20 20 20 20 20 20 21 23 23 23 23 — — 7
Ariel Matic Front Load 1 Kg P&G 250 100g 22 22 22 22 22 22 22 23 25 25 25 25 — — 9
Liquid detergents/Fabric Conditioners/Dishwash/ Floor Cleaners
Fabric Conditioners/Liquid detergents
Surf Excel Liquid Matic Top Load 1L HUVR 199 100ml 21 21 21 21 21 21 21 21 20 20 20 20 — — (5)
Surf Excel Liquid Matic Front Load 1L HUVR 225 100ml 24 24 24 24 24 24 24 24 23 23 23 23 — — (4)
Ujala Supreme 250ml Jyothy Labs 70 100ml 26 26 26 26 26 26 26 26 28 28 28 28 — — 8
Comfort Fabric Conditioner Anti Bacterial 200ml HUVR 56 100ml 25 25 25 25 25 25 25 25 25 25 25 25 — — —
Ala Liquid Bleach Fabric Whitener 200ml HUVR 29 100ml 14 14 14 14 14 15 15 15 15 15 15 15 — — —
Ezee Detergent Liquid 500gm GCPL 90 100g 18 18 18 18 18 18 18 18 18 18 18 18 — — —
Dishwashing Bar/Gels/Powder
Vim Drop Dishwash Green Lime 500ml HUVR 120 100ml 22 22 22 22 22 24 24 24 21 24 24 24 — 14 —
Pril Dishwash Liquid - Lime Green 500ml Jyothy Labs 115 100ml 21 21 21 21 21 21 21 21 23 23 23 23 — — 7
Dettol Dish/slab Gel, Lemon Splash 400ml Reckitt B. 119 100ml 33 33 33 33 33 33 33 33 33 30 30 30 — (9) (9)
Giffy D/W Liquid - Green Lime & Active salt 500ml Wipro Cons 119 100ml 21 21 21 24 24 24 24 24 24 24 24 24 — — —
Vim Utensil Bar 300gm HUVR 20 100g 7 7 7 7 7 7 7 7 7 7 7 7 — — —
Pril Dishwash Bar - Lime 3*400gm Jyothy Labs 102 100g 8 8 8 9 9 9 9 9 9 9 9 9 — — —
Exo Dish Wash Bar- Touch & Shine 700gm Jyothy Labs 67 100g 9 9 9 9 9 9 9 9 10 10 10 10 — — 3
Floor Cleaners/Other Cleaners
Harpic toilet cleaner Original 1L Reckitt B. 168 100ml 17 17 17 17 17 17 17 17 17 17 17 17 — — —
Domex Floor Cleaner Thick 500ml HUVR 95 100ml 19 19 19 19 19 19 19 19 19 19 19 19 — — —
Sanifresh Toilet Cleaner Shine 1L Dabur 154 100ml 15 15 15 15 15 15 15 15 15 15 15 15 — — —
Oral Care
Toothpaste
Colgate Cdc 150gm Colgate P. 68 100g 43 43 43 43 43 43 43 43 45 45 45 45 — — 5
Colgate Cibaca 175gm Colgate P. 57 100g 29 29 29 29 29 29 29 29 31 33 33 33 — 4 14
Colgate Active Salt 100gm Colgate P. 55 100g 49 52 52 52 52 52 52 52 55 55 55 55 — — 6
Colgate Herbal 200G Colgate P. 100 100g 47 47 47 49 49 49 49 49 47 50 50 50 — 8 2
Colgate Maxfresh Blue 150gm Colgate P. 95 100g 61 61 61 61 61 61 61 61 63 63 63 63 — — 3
Colgate Sensitive Pro Relief 70gm Colgate P. 125 100g 164 164 164 164 164 164 164 164 164 164 179 179 — 9 9
Colgate Sensitive 80gm Colgate P. 99 100g 124 124 124 124 124 124 124 124 124 138 125 124 (1) — —
Colgate Total Adv Health 120gm Colgate P. 99 100g 77 81 81 81 81 81 81 81 83 83 83 83 — — 2
Colgate Toothpaste Strawberry Barbie 80gm Colgate P. 90 100g 103 103 103 103 103 108 108 108 113 113 113 113 — — 5
Pepsodent 2 In 1 150gm HUVR 97 100g 65 65 65 65 65 65 65 65 65 65 65 65 — — —
Pepsodent Germicheck 200gm HUVR 90 100g 41 41 41 43 43 43 43 43 45 45 45 45 — — 6
Pepsodent Gum Care 140gm HUVR 98 100g 70 70 70 70 70 70 70 70 70 70 70 70 — — —
Pepsodent Exp Prot Complete 150gm HUVR 114 100g 81 81 81 81 81 81 81 81 81 81 81 81 — — —
Close Up Red 150gm HUVR 85 100g 55 55 55 55 55 55 55 57 57 57 57 57 — — —
Babool 175gm Dabur 50 100g 23 23 23 25 25 25 25 25 29 29 29 29 — — 14
Dabur Red 200gm Dabur 97 100g 48 48 48 48 48 48 48 48 49 49 49 49 — — 2
Meswak 200gm Dabur 97 100g 48 48 48 48 48 48 48 48 49 49 49 49 — — 1
Sensodyne Fresh Gel 75gm GSK CH 110 100g 140 140 140 140 140 140 140 147 147 147 147 147 — — —
Sensodyne Toothpaste Rapid Relief 80gm GSK CH 160 100g 188 188 188 188 188 188 200 200 200 200 200 200 — — —
Lever Ayush Anti-cavity clove oil 150gm HUVR 80 100g 50 50 50 50 50 53 53 53 53 53 53 53 — — —
Colgate Swarna Vedshakti Natural 200gm Colgate P. 95 100g 46 46 46 46 46 46 46 48 48 48 48 48 — — —
Patanjali Dant Kanti 200gm Patanjali 85 100g 38 38 38 38 38 38 40 40 40 43 43 43 — 6 6
Vicco Vajradanti 200gm Vicco 130 100g 55 55 55 58 58 58 58 58 60 65 65 65 — 8 13
Himalaya complete care 80gm Himalaya 50 100g 50 50 50 50 50 50 50 63 63 63 63 63 — — —
Toothpowders
Colgate 200gm Colgate P. 80 100g 35 35 35 35 35 38 38 38 40 40 40 40 — — 7
Dabur Lal Dant Manjan 100gm Dabur 70 100g 43 43 43 45 45 45 45 45 47 47 47 47 — — 3
Mouthwashes
Colgate Plax Complete Care 250ml Colgate P. 130 100ml 48 48 48 48 48 48 48 52 48 48 48 52 8 8 —
Colgate Plax Freshmint 250ml Colgate P. 130 100ml 48 48 48 48 48 48 48 52 52 52 52 52 — — —
Change (%)Normalised price in Rs (adjusted for grammage changes)
India Consumer Staples
20 KOTAK INSTITUTIONAL EQUITIES RESEARCH
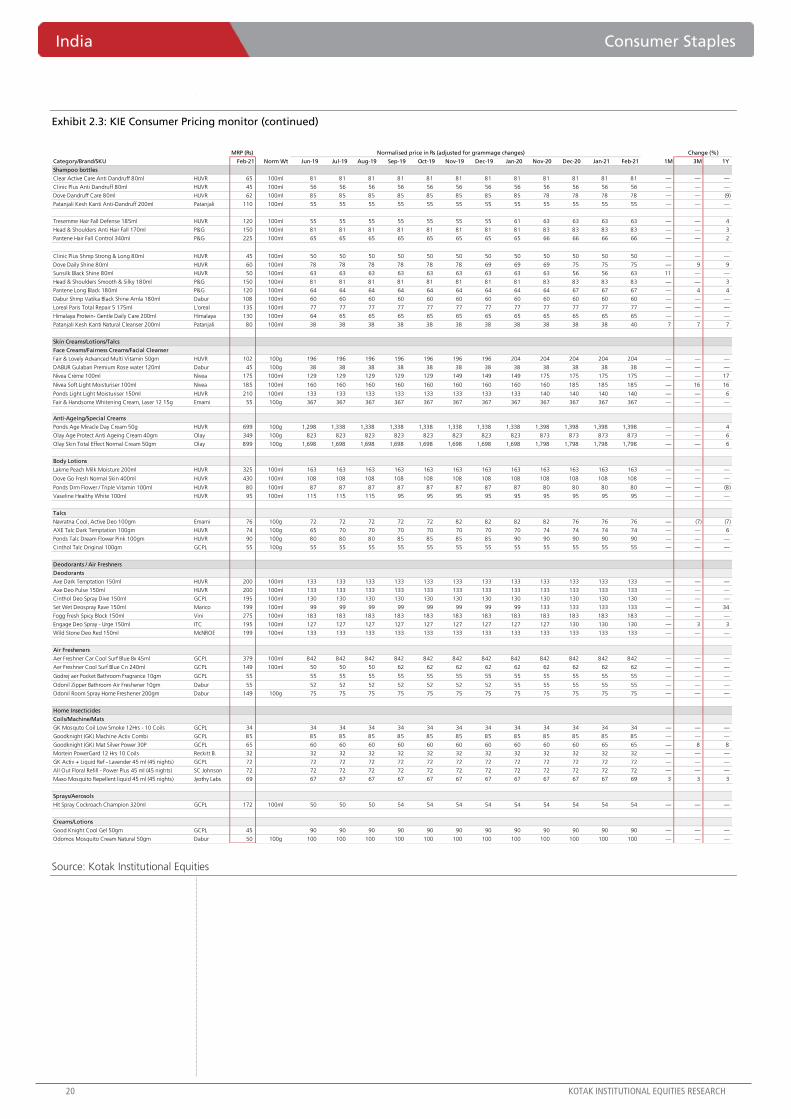
Exhibit 2.3: KIE Consumer Pricing monitor (continued)
Source: Kotak Institutional Equities
MRP (Rs)
Category/Brand/SKU Feb-21 Norm Wt Jun-19 Jul-19 Aug-19 Sep-19 Oct-19 Nov-19 Dec-19 Jan-20 Nov-20 Dec-20 Jan-21 Feb-21 1M 3M 1Y
Shampoo bottles
Clear Active Care Anti Dandruff 80ml HUVR 65 100ml 81 81 81 81 81 81 81 81 81 81 81 81 — — —
Clinic Plus Anti Dandruff 80ml HUVR 45 100ml 56 56 56 56 56 56 56 56 56 56 56 56 — — —
Dove Dandruff Care 80ml HUVR 62 100ml 85 85 85 85 85 85 85 85 78 78 78 78 — — (9)
Patanjali Kesh Kanti Anti-Dandruff 200ml Patanjali 110 100ml 55 55 55 55 55 55 55 55 55 55 55 55 — — —
Tresemme Hair Fall Defense 185ml HUVR 120 100ml 55 55 55 55 55 55 55 61 63 63 63 63 — — 4
Head & Shoulders Anti Hair Fall 170ml P&G 150 100ml 81 81 81 81 81 81 81 81 83 83 83 83 — — 3
Pantene Hair Fall Control 340ml P&G 225 100ml 65 65 65 65 65 65 65 65 66 66 66 66 — — 2
Clinic Plus Shmp Strong & Long 80ml HUVR 45 100ml 50 50 50 50 50 50 50 50 50 50 50 50 — — —
Dove Daily Shine 80ml HUVR 60 100ml 78 78 78 78 78 78 69 69 69 75 75 75 — 9 9
Sunsilk Black Shine 80ml HUVR 50 100ml 63 63 63 63 63 63 63 63 63 56 56 63 11 — —
Head & Shoulders Smooth & Silky 180ml P&G 150 100ml 81 81 81 81 81 81 81 81 83 83 83 83 — — 3
Pantene Long Black 180ml P&G 120 100ml 64 64 64 64 64 64 64 64 64 67 67 67 — 4 4
Dabur Shmp Vatika Black Shine Amla 180ml Dabur 108 100ml 60 60 60 60 60 60 60 60 60 60 60 60 — — —
Loreal Paris Total Repair 5 175ml L'oreal 135 100ml 77 77 77 77 77 77 77 77 77 77 77 77 — — —
Himalaya Protein- Gentle Daily Care 200ml Himalaya 130 100ml 64 65 65 65 65 65 65 65 65 65 65 65 — — —
Patanjali Kesh Kanti Natural Cleanser 200ml Patanjali 80 100ml 38 38 38 38 38 38 38 38 38 38 38 40 7 7 7
Skin Creams/Lotions/Talcs
Face Creams/Fairness Creams/Facial Cleanser
Fair & Lovely Advanced Multi Vitamin 50gm HUVR 102 100g 196 196 196 196 196 196 196 204 204 204 204 204 — — —
DABUR Gulabari Premium Rose water 120ml Dabur 45 100g 38 38 38 38 38 38 38 38 38 38 38 38 — — —
Nivea Crème 100ml Nivea 175 100ml 129 129 129 129 129 149 149 149 175 175 175 175 — — 17
Nivea Soft Light Moisturiser 100ml Nivea 185 100ml 160 160 160 160 160 160 160 160 160 185 185 185 — 16 16
Ponds Light Light Moisturiser 150ml HUVR 210 100ml 133 133 133 133 133 133 133 133 140 140 140 140 — — 6
Fair & Handsome Whitening Cream, Laser 12 15g Emami 55 100g 367 367 367 367 367 367 367 367 367 367 367 367 — — —
Anti-Ageing/Special Creams
Ponds Age Miracle Day Cream 50g HUVR 699 100g 1,298 1,338 1,338 1,338 1,338 1,338 1,338 1,338 1,398 1,398 1,398 1,398 — — 4
Olay Age Protect Anti Ageing Cream 40gm Olay 349 100g 823 823 823 823 823 823 823 823 873 873 873 873 — — 6
Olay Skin Total Effect Normal Cream 50gm Olay 899 100g 1,698 1,698 1,698 1,698 1,698 1,698 1,698 1,698 1,798 1,798 1,798 1,798 — — 6
Body Lotions
Lakme Peach Milk Moisture 200ml HUVR 325 100ml 163 163 163 163 163 163 163 163 163 163 163 163 — — —
Dove Go Fresh Normal Skin 400ml HUVR 430 100ml 108 108 108 108 108 108 108 108 108 108 108 108 — — —
Ponds Drm Flower / Triple Vitamin 100ml HUVR 80 100ml 87 87 87 87 87 87 87 87 80 80 80 80 — — (8)
Vaseline Healthy White 100ml HUVR 95 100ml 115 115 115 95 95 95 95 95 95 95 95 95 — — —
Talcs
Navratna Cool, Active Deo 100gm Emami 76 100g 72 72 72 72 72 82 82 82 82 76 76 76 — (7) (7)
AXE Talc Dark Temptation 100gm HUVR 74 100g 65 70 70 70 70 70 70 70 74 74 74 74 — — 6
Ponds Talc Dream Flower Pink 100gm HUVR 90 100g 80 80 80 85 85 85 85 90 90 90 90 90 — — —
Cinthol Talc Original 100gm GCPL 55 100g 55 55 55 55 55 55 55 55 55 55 55 55 — — —
Deodorants / Air Freshners
Deodorants
Axe Dark Temptation 150ml HUVR 200 100ml 133 133 133 133 133 133 133 133 133 133 133 133 — — —
Axe Deo Pulse 150ml HUVR 200 100ml 133 133 133 133 133 133 133 133 133 133 133 133 — — —
Cinthol Deo Spray Dive 150ml GCPL 195 100ml 130 130 130 130 130 130 130 130 130 130 130 130 — — —
Set Wet Deospray Rave 150ml Marico 199 100ml 99 99 99 99 99 99 99 99 133 133 133 133 — — 34
Fogg Fresh Spicy Block 150ml Vini 275 100ml 183 183 183 183 183 183 183 183 183 183 183 183 — — —
Engage Deo Spray - Urge 150ml ITC 195 100ml 127 127 127 127 127 127 127 127 127 130 130 130 — 3 3
Wild Stone Deo Red 150ml McNROE 199 100ml 133 133 133 133 133 133 133 133 133 133 133 133 — — —
Air Fresheners
Aer Freshner Car Cool Surf Blue Bx 45ml GCPL 379 100ml 842 842 842 842 842 842 842 842 842 842 842 842 — — —
Aer Freshner Cool Surf Blue Cn 240ml GCPL 149 100ml 50 50 50 62 62 62 62 62 62 62 62 62 — — —
Godrej aer Pocket Bathroom Fragrance 10gm GCPL 55 55 55 55 55 55 55 55 55 55 55 55 55 — — —
Odonil Zipper Bathroom Air Freshener 10gm Dabur 55 52 52 52 52 52 52 52 55 55 55 55 55 — — —
Odonil Room Spray Home Freshener 200gm Dabur 149 100g 75 75 75 75 75 75 75 75 75 75 75 75 — — —
Home Insecticides
Coils/Machine/Mats
GK Mosquto Coil Low Smoke 12Hrs - 10 Coils GCPL 34 34 34 34 34 34 34 34 34 34 34 34 34 — — —
Goodknight (GK) Machine Activ Combi GCPL 85 85 85 85 85 85 85 85 85 85 85 85 85 — — —
Goodknight (GK) Mat Silver Power 30P GCPL 65 60 60 60 60 60 60 60 60 60 60 65 65 — 8 8
Mortein PowerGard 12 Hrs 10 Coils Reckitt B. 32 32 32 32 32 32 32 32 32 32 32 32 32 — — —
GK Activ + Liquid Ref - Lavender 45 ml (45 nights) GCPL 72 72 72 72 72 72 72 72 72 72 72 72 72 — — —
All Out Floral Refill - Power Plus 45 ml (45 nights) SC Johnson 72 72 72 72 72 72 72 72 72 72 72 72 72 — — —
Maxo Mosquito Repellent liquid 45 ml (45 nights) Jyothy Labs 69 67 67 67 67 67 67 67 67 67 67 67 69 3 3 3
Sprays/Aerosols
Hit Spray Cockroach Champion 320ml GCPL 172 100ml 50 50 50 54 54 54 54 54 54 54 54 54 — — —
Creams/Lotions
Good Knight Cool Gel 50gm GCPL 45 90 90 90 90 90 90 90 90 90 90 90 90 — — —
Odomos Mosquito Cream Natural 50gm Dabur 50 100g 100 100 100 100 100 100 100 100 100 100 100 100 — — —
Change (%)Normalised price in Rs (adjusted for grammage changes)
Consumer Staples India
KOTAK INSTITUTIONAL EQUITIES RESEARCH 21
Exhibit 2.4: KIE Consumer Pricing monitor (continued)
Source: Kotak Institutional Equities
MRP (Rs)
Category/Brand/SKU Feb-21 Norm Wt Jun-19 Jul-19 Aug-19 Sep-19 Oct-19 Nov-19 Dec-19 Jan-20 Nov-20 Dec-20 Jan-21 Feb-21 1M 3M 1Y
Hair Oils
Coconut Oils
Parachute coconut oil 100ml Marico 39 100ml 39 39 39 39 39 39 39 39 39 39 39 39 — — —
Parachute coconut oil 250ml Marico 105 100ml 42 42 42 42 42 42 42 42 42 42 42 42 — — —
Dabur Vatika hair oil 75ml Dabur 39 100ml 56 56 56 56 56 56 52 52 52 52 52 52 — — —
Dabur Anmol Gold 175ml Dabur 58 100ml 37 37 37 37 37 37 37 37 33 33 33 33 — — (11)
Patanjali Coconut Oil 200ml Patanjali 75 100ml 36 36 36 36 36 36 36 36 36 40 38 38 — 4 4
Perfumed Hair Oils
Parachute Advansed hot oil 190ml Marico 110 100ml 58 58 58 58 58 58 58 58 58 58 58 58 — — —
Parachute Jasmine 200ml Marico 85 100ml 46 46 46 42 42 42 42 42 42 43 43 43 — 2 2
Hair & Care 100ml Marico 60 100ml 60 60 60 60 60 60 60 60 60 60 60 60 — — —
Shanti Badam Amla 190ml Marico 55 100ml 26 26 26 26 26 26 26 26 26 29 29 29 — 10 10
Dabur Amla hair oil 100ml Dabur 44 100ml 49 49 49 49 49 49 49 49 49 49 49 49 — — —
Dabur Almond Hair Oil- Damage Free Hair Dabur 65 100ml 63 63 63 63 63 65 65 65 65 65 65 65 — — —
Bajaj Almond hair oil 100ml Bajaj Corp 65 100ml 65 65 65 65 65 65 65 65 65 65 65 65 — — —
Navratna Cooling oil 100ml Emami 78 100ml 75 75 75 75 75 75 75 78 78 80 78 78 — — —
Patanjali Kesh Kanti 120ml Patanjali 130 100ml 108 108 108 108 108 108 108 108 108 108 108 108 — — —
Bajaj Coco Jasmine 180ml Bajaj Corp 75 100ml 42 42 42 42 42 42 42 42 42 42 42 42 — — —
Mens Grooming
Gillette Guard Razor P&G 22 1 pc 23 23 23 23 23 23 23 23 23 22 22 22 — (4) (4)
Gillette Guard Cartridge pack (6 pcs) P&G 50 1 pc 8 8 8 8 8 8 8 8 8 8 8 8 — — —
Gillette Vector Plus Razor P&G 65 1 pc 60 60 60 60 60 60 60 60 65 65 65 65 — — 8
Gillette Vector Plus Cartridge pack (6 pcs) P&G 165 1 pc 25 25 25 25 25 25 25 25 28 28 28 28 — — 10
Gillette Mach 3 Razor P&G 250 1 pc 250 250 250 250 250 250 250 250 250 250 250 250 — — —
Gillette Mach 3 Cartridge pack (4 pcs) P&G 499 1 pc 119 119 119 119 119 119 119 119 125 125 125 125 — — 5
Gillette Fusion Razor P&G 350 1 pc 350 350 350 350 350 350 350 350 350 350 350 350 — — —
Gillette Fusion Cartridge pack (4 pcs) P&G 1,000 1 pc 225 225 225 225 225 225 225 225 225 225 250 250 — 11 11
Gillette Foam - Classic Regular 418gm P&G 225 100g 48 48 48 48 48 48 48 48 54 54 54 54 — — 13
Godrej Shaving Cream Lime Fresh 60 gm GCPL 75 100g 108 108 108 108 108 108 108 108 108 108 108 107 (1) (1) (1)
Feminine hygiene
Whisper Sanitary Pads- Ultra Clean XL+ Wings (15 pcs) P&G 170 1 pc 11 11 11 11 11 11 11 11 11 11 11 11 — — 3
Whisper - Choice Wings Regular P&G 85 1 pc 4 4 4 4 4 4 4 4 4 4 4 4 — 2 9
Whisper - Choice Ultra Wings XL P&G 133 1 pc 6 6 6 6 6 6 6 6 7 7 7 7 — — 8
Stayfree SPs- Dry-Max All Night Ultra Xl Wings (14 pcs) J&J 175 1 pc 12 12 12 12 12 13 13 13 13 13 13 13 — — —
Sofy Sanitary Pads - Body Fit Antibacteria, XL (15 pcs) Unicharm 125 1 pc 8 8 8 8 8 8 8 8 8 8 8 8 — — —
Carefree Sanitary Pads - Regular (10pcs) J&J 90 1 pc 7 7 7 7 7 7 8 8 9 9 9 9 — — 13
Baby Diapers
Pampers Diaper Pants - L (44 pcs) P&G 699 1 pc 15 15 15 16 16 16 16 16 16 16 16 16 — — —
Mamypoko Diaper Pants- L (44 pcs) Unicharm 699 1 pc 15 15 15 16 16 16 16 16 16 16 16 16 — — —
Huggies Diaper Pants- L (46 pcs) HUVR 699 1 pc 15 15 15 15 15 15 15 15 15 15 15 15 — — —
Change (%)Normalised price in Rs (adjusted for grammage changes)
India Consumer Staples
22 KOTAK INSTITUTIONAL EQUITIES RESEARCH
Exhibit 2.5: KIE Consumer Pricing monitor (continued)
Source: Kotak Institutional Equities
MRP (Rs)
Category/Brand/SKU Feb-21 Norm Wt Jun-19 Jul-19 Aug-19 Sep-19 Oct-19 Nov-19 Dec-19 Jan-20 Nov-20 Dec-20 Jan-21 Feb-21 1M 3M 1Y
Edible Oils
Saffola Kardi Oil - 1L Marico 200 100ml 20 20 20 20 20 20 20 20 20 20 20 20 — — —
Saffola Tasty Blend - 1L Marico 165 100ml 14 14 14 14 14 14 14 14 15 16 16 17 3 14 22
Saffola Gold - 1L Marico 170 100ml 14 14 14 14 14 14 14 14 17 17 17 17 3 3 22
Saffola Active - 1L Marico 165 100ml 14 14 14 13 13 13 13 14 16 16 16 17 3 6 22
Sundrop Heart - 1L Agrotech 210 100ml 21 21 21 21 21 21 21 21 21 21 21 21 — — —
Sundrop Nutrilite - 1L Agrotech 135 100ml 14 14 14 14 14 14 14 14 14 14 14 14 — — —
Sundrop Superlite Advanced -1L Agrotech 200 100ml 16 16 16 16 16 16 16 16 17 17 17 17 — — 3
Sundrop Goldlite -1L Marico 165 100ml 14 14 14 14 14 14 14 14 17 17 17 17 — — 18
Fortune Vivo- 1L Adani Wilmar 160 100ml 15 15 15 15 15 15 15 15 15 15 16 16 — 7 7
Emami Rice bran oil- 1L Emami 150 100ml 11 11 11 11 11 11 11 13 13 14 15 15 — 20 20
Tea/ Coffee
Tea
Red Label Ctc 1kg HUVR 530 100g 43 43 43 43 43 43 43 43 53 53 53 53 — — 23
Society Tea 1kg Amar Tea 500 100g 42 42 42 42 42 42 44 44 50 50 50 50 — — 14
Red Label Natural Care Box 500gm HUVR 305 100g 52 52 52 52 52 52 52 52 59 61 61 61 — 3 17
Tajmahal Ctc Box 250gm HUVR 180 100g 58 58 58 58 58 60 60 60 70 72 72 72 — 3 20
Agni Ctc Leaves 1kg TGBL 220 100g 22 22 22 22 22 22 22 22 22 22 22 22 — — —
Tata Ctc Gold 1kg TGBL 625 100g 44 44 44 46 46 46 46 46 60 63 63 63 — 5 37
Wagh Bakri Leaf Tea - Premium 1kg pouch Wagh Bakri 520 100g 41 42 42 42 42 42 42 42 54 54 52 52 — (3) 25
Tea Bags/ Green Tea
Tata Tetly Tea Bag Grn Regular 10P TGBL 60 60 60 60 60 60 60 60 60 65 60 60 60 — (8) —
Tata Tetley Green Tea Bag 30P TGBL 160 140 140 140 145 145 145 145 145 160 160 160 160 — — 10
Lipton Tea Bag Clear Green Jasmine 10P HUVR 60 60 60 60 60 60 60 60 60 60 60 60 60 — — —
Iced Tea
Lipton Instant Mix Ice Tea Lemon Pp 500gm HUVR 130 100g 52 52 52 52 52 52 52 52 52 52 52 52 — — —
Nestea Ice Tea Lemon 500gm Nestle 180 100g 33 33 33 33 33 33 33 33 33 33 33 36 9 9 9
Coffee
Bru Gold Jar 100gm HUVR 290 100g 275 275 275 275 275 275 275 275 275 275 290 290 — 5 5
Bru Instant Jar 100gm HUVR 180 100g 175 180 180 180 180 180 180 180 180 180 180 180 — — —
Nescafe Classic Box 200gm Nestle 490 100g 238 238 238 238 238 238 238 238 245 245 245 245 — — 3
Nescafe Classic 50gm Nestle 140 100g 280 280 280 280 280 280 280 280 280 280 280 280 — — —
Sunrise Premium Jar 50gm Nestle 90 100g 180 180 180 180 180 180 180 180 180 180 180 180 — — —
Dairy
Milk/Condensed Milk/ Milk Powder
Nestle Condmilk Milkmaid 400gm Nestle 125 100g 29 30 30 30 30 30 30 31 31 31 31 31 — — —
Nestle Milk Slim 1L Nestle 89 100ml 8 8 8 9 9 9 9 9 9 9 9 9 — — —
Nestle Milk Toned A+ 1L Nestle 75 100ml 8 8 8 8 8 8 8 8 8 8 8 8 — (4) (10)
Amul Taaza 1L Amul 64 100ml 6 6 6 6 6 6 6 6 6 6 6 6 — — —
Amul Gold 1L Amul 68 100ml 6 7 7 7 7 7 7 7 7 7 7 7 — — —
Amul Lite 1L Amul 75 100ml 7 7 7 7 7 8 8 8 8 8 8 8 — — —
Everyday Milk powder Dairy Whitener Pouch 400gm Nestle 200 100g 44 46 46 48 48 48 50 50 50 50 50 50 — — —
Yoghurt/Dahi
Nestle Dahi Slim 200gm Nestle 39 100g 18 18 18 18 18 18 20 20 20 20 20 20 — — —
Britannia Dahi Daily Fresh 150gm Britannia 20 100g 13 13 13 13 13 13 13 13 13 13 13 13 — — —
Britannia Dahi Low Fat 200gm Britannia 35 100g 15 15 15 15 15 18 18 18 18 18 18 18 — — —
Butter/Cheese
Britannia Cheese Block 400gm Britannia 290 100g 63 65 65 65 65 65 69 69 73 73 73 73 — — 5
Britannia Cheese Spread Classic 180gm Britannia 135 100g 47 47 47 47 47 67 67 67 75 75 75 75 — — 13
Amul Butter 500gm Amul 235 100g 45 45 45 45 45 47 47 47 47 47 47 47 — — —
Amul Lite Butter 500gm Amul 195 100g 29 29 29 29 29 29 29 29 39 39 39 39 — — 34
Nutrilite Butter 500gm Zydus Cadila 200 100g 36 36 36 36 36 36 36 38 38 40 40 40 — 5 5
Amul cheese slice plain 200 gm Amul 122 59 59 59 59 59 61 61 61 61 61 61 61 — — —
Go cheese slice 200 gm Parag milk 140 63 63 63 63 63 70 73 73 65 65 70 70 — 8 (3)
Britannia cheese slice 200 gm Britannia 155 65 73 73 73 73 73 73 74 78 78 78 78 — — 5
Cakes/ Desert Mixes
Britannia Cake Fruity Fun 60gm Britannia 15 100g 25 25 25 25 25 25 25 27 27 27 27 27 — — —
Change (%)Normalised price in Rs (adjusted for grammage changes)
Consumer Staples India
KOTAK INSTITUTIONAL EQUITIES RESEARCH 23
Exhibit 2.6: KIE Consumer Pricing monitor (continued)
Source: Kotak Institutional Equities
MRP (Rs)
Feb-21 Norm Wt Jun-19 Jul-19 Aug-19 Sep-19 Oct-19 Nov-19 Dec-19 Jan-20 Nov-20 Dec-20 Jan-21 Feb-21 1M 3M 1Y
Health Drinks/ Juices/ Health Supplements/ OTCs
Health Drinks
Horlicks Chocolate Jar 500gm GSK CH 221 100g 43 43 43 43 43 43 43 43 44 44 44 44 — — 3
Horlicks Protein+ Chocolate, 400gm Jar GSK CH 535 100g 130 130 130 130 130 130 130 134 134 134 134 134 — — —
Horlicks Standard Jar 500gm GSK CH 242 100g 47 47 47 47 47 48 48 48 48 48 48 48 — — —
Bournvita Chocolate 500gm Jar Mondelez 223 100g 43 43 43 43 43 43 43 43 45 45 45 45 — — 3
Complan Chocolate 500gm Jar Zydus Wellness 299 100g 62 62 62 56 56 56 56 56 60 60 60 60 — — 7
Horlicks Mother's Vanilla 500 gm Jar GSK CH 525 100g 103 103 103 103 103 103 105 105 105 105 105 105 — — —
Horlicks Womens Chocolate Jar 330gm GSK CH 299 100g 74 74 74 74 74 74 75 75 75 75 75 75 — — —
Boost Jar 450gm GSK CH 219 100g 51 51 51 51 51 51 51 53 49 49 49 49 — — (8)
Horlicks Growth+ Vanilla, 400gm Jar GSK CH 535 100g 130 130 130 130 130 130 134 134 134 134 134 134 — — —
Protinex- Chocolate 400gm Danone 550 100g 134 134 134 134 134 134 138 138 138 138 138 138 — — —
Pediasure- Complete & Balanced 400gm Abbott 545 100g 130 130 130 130 130 130 130 130 136 136 136 136 — — 5
Juices
Real fruit power Orange 1L (Conc + added sugar) Dabur 110 100ml 11 11 11 11 11 11 11 11 9 11 11 11 — 22 5
Real Activ 100% Orange 1L (from Conc | No added sugar) Dabur 135 100ml 13 13 13 13 13 13 13 13 14 14 14 14 — — 4
Tropicana- Orange, 1 L (Conc + added sugar) Pepsi Co. 110 100ml 11 11 11 11 11 11 11 11 11 11 11 11 — — —
Tropicana 100% Orange 1L (from Conc; no added sugar) Pepsi Co. 135 100ml 14 14 14 14 14 14 14 14 14 14 14 14 — — —
B Natural Juice- Orange 1L (No Conc; incl added sugar) ITC 110 100ml 11 11 11 11 11 11 11 11 11 11 11 11 — — —
Real Fruit power pomegranate 1L (Conc + added sugar) Dabur 115 100ml 11 11 11 11 11 11 11 11 12 12 12 12 — — 5
Paper Boat drink- Aamras 1L Hector Bev. 120 100ml 11 11 11 11 11 12 12 12 12 12 12 12 — — —
Health Supplements/OTCs
Dabur Chyawanprash 1kg Dabur 340 100g 33 33 33 33 33 33 33 33 34 34 34 34 — — 5
Dabur Digestive Hajmola Regular 120 P Dabur 40 35 35 35 35 35 35 35 35 40 40 40 40 — — 14
Dabur Glucose-D Jar 1kg Dabur 195 100g 17 19 19 19 19 19 19 19 20 20 20 20 — — 3
Dabur Honey 500gm Dabur 199 100g 31 31 31 31 31 31 31 31 31 31 31 31 — — —
Patanjali Honey 500gm Patanjali 165 100g 29 29 29 29 29 29 29 29 33 33 33 33 — — 14
Soft drinks (excl. juices)
Pepsi bottle 600 ml Pepsi Co 35 100ml 6 6 6 6 6 6 6 6 6 6 6 6 — — —
Pepsi bottle 2.25L Pepsi Co 90 100ml 4 4 4 4 4 4 4 4 4 4 4 4 — — —
Coca Cola bottle 750ml Coca-Cola 40 100ml 5 5 5 5 5 5 5 6 6 5 5 5 — (11) (11)
Coca Cola bottle 1.75L Coca-Cola 85 100ml 5 5 5 5 5 5 5 5 5 5 5 5 — — —
Thums up bottle 750ml Coca-Cola 40 100ml 5 5 5 5 5 5 5 6 5 5 5 5 — — (11)
Sprite bottle 750ml Coca-Cola 40 100ml 5 5 5 5 5 5 5 5 5 5 5 5 — — —
Sprite bottle 1.75L Coca-Cola 85 100ml 5 5 5 5 5 5 5 5 5 5 5 5 — — —
Maaza bottle 600ml Coca-Cola 40 100ml 6 6 6 6 6 6 6 7 7 7 7 7 — — —
Tropicana Mango Slice 600ml Pepsi Co 35 100ml 6 6 6 6 6 6 6 6 6 6 6 6 — — —
Frooti bottle 300ml Parle Agro 20 100ml 7 7 7 7 7 7 7 7 7 7 7 7 — — —
7 Up Nimbooz 350ml Pepsi Co 20 100ml 6 6 6 6 6 6 6 6 6 6 6 6 — — —
Baby Food
Cerelac Babycereal Rice S1 300gm Nestle 199 100g 59 59 59 59 59 59 59 61 66 66 66 66 — — 9
Cerelac Babycereal Wheat S1 300gm Nestle 190 100g 58 58 58 58 58 58 58 60 62 63 63 63 — 3 6
Cerelac Babycereal Mltgrn 5 Fruit 300G Nestle 264 100g 82 82 82 82 82 82 84 84 88 88 88 88 — — 5
Cerelac Babycereal Multigrain Dal Veg 300gm Nestle 264 100g 81 81 81 81 81 81 84 84 88 88 88 88 — — 5
Cerelac Babycereal Mixed Fruit 300G Nestle 254 100g 78 78 78 78 78 78 81 81 82 85 85 85 — 3 5
Lactogen Babycereal Nan 1 Frml 400gm Nestle 610 100g 145 145 145 145 145 149 149 149 153 153 153 153 — — 3
Lactogen Babycereal No1 Rf 400G Nestle 340 100g 79 80 80 80 80 81 81 81 85 85 85 85 — — 5
Change (%)Normalised price in Rs (adjusted for grammage changes)
India Consumer Staples
24 KOTAK INSTITUTIONAL EQUITIES RESEARCH
Exhibit 2.7: KIE Consumer Pricing monitor (continued)
Source: Kotak Institutional Equities
MRP (Rs)
Category/Brand/SKU Feb-21 Norm Wt Jun-19 Jul-19 Aug-19 Sep-19 Oct-19 Nov-19 Dec-19 Jan-20 Nov-20 Dec-20 Jan-21 Feb-21 1M 3M 1Y
Biscuits/Atta
CreamBiscuits
Sunfeast Dark Fantasy Chocolate 100gm ITC 30 100g 40 40 40 40 40 40 40 40 40 40 40 40 — — —
Britannia Cream Jim Jam 150gm Britannia 35 100g 23 23 23 23 23 23 23 23 23 23 23 23 — — —
Britannia Cream Pure magic vanilla 150gm Britannia 30 100g 30 30 30 30 30 30 30 30 30 30 30 30 — — —
Britannia Cream Treat Bourbon 150gm Britannia 30 100g 19 19 19 19 19 19 20 20 20 20 20 20 — — —
Sunfeast Cream Bourbon 150gm ITC 30 100g 17 19 19 19 19 19 19 19 19 19 19 20 7 7 7
Parle Cream Hide & Seek Bourbon 100gm Parle 30 100g 25 30 30 30 30 30 30 30 30 30 30 30 — — —
Parle Crm Bis Bourbon Kream 150gm Parle 30 100g 20 20 20 20 20 20 20 20 20 20 20 20 — — —
Oreo Choco Creme Biscuits 120gm Mondelez 30 100g 25 25 25 25 25 25 25 25 25 25 25 25 — — —
Britannia Tiger Cream Biscuits - Chocolate 43gm Britannia 5 100g 12 12 12 12 12 12 12 12 12 12 12 12 — — —
Sunfeast Special-bounce Cream Biscuits 60gm ITC 10 100g 12 12 12 17 17 17 17 17 17 17 17 17 — — —
Cookies/Healthy biscuits
Sunfeast Mom's Magic Cookie Butter 150gm ITC 20 100g 13 13 13 13 13 13 13 13 13 13 13 13 — — —
Britannia Good Day Butter 150gm Britannia 20 100g 15 13 13 13 13 13 13 13 13 13 13 13 — — —
Britannia Cookies Good Day Cashew 100gm Britannia 20 100g 20 20 20 20 20 20 20 20 20 20 20 20 — — —
Britannia NutriChoice Digestive 100gm Britannia 20 100g 20 20 20 20 20 20 20 20 20 20 20 20 — — —
Sunfeast Farmlite - Oats & Almonds 75gm ITC 25 100g 33 33 33 33 33 33 33 33 33 33 33 33 — — —
Marie/Glucose/Salted/Nice Biscuits
Sunfeast Marie Light 81gm ITC 10 100g 12 12 12 12 12 12 12 12 12 12 12 12 — — 5
Britannia Vita Marie Gold 150gm Britannia 20 100g 13 13 13 13 13 13 13 13 13 13 13 13 — — —
Parle Makesmith Marie 100gm Parle 10 100g 11 11 11 11 11 11 11 11 11 11 11 11 — — —
Sunfeast Bisccuits Glucose 80gm ITC 5 100g 6 6 6 6 6 6 6 6 6 6 6 6 — — —
Britannia Tiger 124gm Britannia 10 100g 8 8 8 8 8 8 8 8 8 8 8 8 — — —
Parle Glucose 130gm Parle 10 100g 8 8 8 8 8 8 8 8 8 8 8 8 — — —
Sunfeast Snacky Salted 80gm ITC 10 100g 16 16 16 16 16 16 16 16 16 16 16 16 — — —
Parle Salted Krackjack 80gm Parle 10 100g 13 13 13 13 13 13 13 13 13 13 13 13 — — —
Parle Salted Monaco Classic 80gm Parle 10 100g 13 13 13 13 13 13 13 13 13 13 13 13 — — —
Britannia 50-50 Maska Chaska 48gm Britannia 10 100g 20 20 20 20 20 20 20 20 21 21 21 21 — — 4
Sunfeast Plain Nice 150gm ITC 25 100g 17 17 17 17 17 17 17 17 17 17 17 17 — — —
Britannia Nice Time 150gm Britannia 25 100g 17 17 17 17 17 17 17 17 17 17 17 17 — — —
Breakfast snacks
Marico Saffola Oats 1Kg Marico 199 100g 19 19 19 19 19 19 19 19 20 20 20 20 — — 5
Kelloggs Corn Flakes Original 475gm Kelloggs 180 100g 38 38 38 38 38 38 38 38 38 38 38 38 — — —
Bagrrys Muesli - Crunchy 500gm Bagrrys India 320 100g 64 64 64 64 64 64 64 64 67 67 67 67 — — 5
Quaker Oats 1kg Pepsi Co. 190 100g 19 19 19 19 19 19 19 19 19 19 19 19 — — —
Atta
Aashirvaad Atta Multigrain 5kg ITC 305 100g 6 6 6 6 6 6 6 6 6 6 6 6 — — —
Aashirvaad Atta Whole Wheat 5kg ITC 245 100g 5 5 5 5 5 5 5 5 5 5 5 5 — — —
Soups/Sauces/Spreads
Ketchup/Sauces/Spreads
Maggi Ketchup Tomato 1kg Nestle 147 100g 15 15 15 15 15 15 15 15 15 15 15 15 — — —
Maggi Sauce Tomato 1kg Nestle 155 100g 14 15 15 15 15 15 15 15 16 16 16 16 — — 2
Kissan Ketchup Fresh Tomato Bt 1kg HUVR 130 100g 13 13 13 13 13 13 14 14 13 13 13 13 — — (7)
Kissan Sauce no onion no garlic 1K HUVR 160 100g 15 16 16 16 16 16 16 16 16 16 16 16 — — —
Spreads/Jams
Nutella Hazelnut Spread with Cocoa 180gm Jar Ferrero 220 125 125 125 125 125 125 125 125 122 122 122 122 — — (2)
Kissan Jam Mixed Fruit 200gm HUVR 65 100g 31 31 31 31 31 31 33 33 33 33 33 33 — — —
Sundrop Peanut Butter Creamy 508gm Jar Agro tech 225 42 42 42 42 42 42 42 42 44 44 44 44 — — 5
Soups
Knorr Classic Thick Tomato 53gm HUVR 55 100g 90 90 90 104 104 104 104 104 104 104 104 104 — — —
Knorr Sweet Corn Vegetable 44gm HUVR 55 100g 125 125 125 125 125 125 125 125 125 125 125 125 — — —
Chocolate bars
Nestle Kit Kat 76.8gm Nestle 60 100g 81 81 81 81 81 81 81 81 81 81 81 81 — — —
Nestle Munch Home Pk 72gm Nestle 60 100g 83 83 83 83 83 83 83 83 83 83 83 83 — — —
Nestle Milk 19.8gm Nestle 10 100g 51 51 51 51 51 51 51 51 51 51 51 51 — — —
Nestle Bar One 22gm Nestle 10 100g 45 45 45 45 45 45 45 45 45 45 45 45 — — —
Nestle Munch crunchiest ever 20.1g Nestle 10 100g 50 50 50 50 50 50 50 50 50 50 50 50 — — —
Cadbury Dairy Milk 12gm Mondelez 10 100g 76 76 76 76 76 76 76 76 83 83 83 83 — — 10
Cadbury Dairy Milk Silk 60gm Mondelez 70 100g 117 117 117 117 117 117 117 117 117 117 117 117 — — —
Cadbury 5 Star 20.5gm Mondelez 10 100g 51 51 51 51 51 51 51 51 51 51 51 49 (5) (5) (5)
Cadbury Perk 28gm Mondelez 10 100g 36 36 36 36 36 36 36 36 36 36 36 36 — — —
Kinder Joy 20gm Ferrero 40 100g 200 200 200 200 200 200 200 200 200 200 200 200 — — —
Ferrero Rocher 16pcs 200gm box Ferrero 529 100g 250 250 250 250 250 250 250 265 265 265 265 265 — — —
Noodles
Noodles
Maggi Masala 70gm Nestle 12 100g 17 17 17 17 17 17 17 17 17 17 17 17 — — —
Maggi Masala 140gm Nestle 24 100g 16 16 16 16 16 16 16 16 17 17 17 17 — — 4
Maggi Masala 280gm Nestle 46 100g 16 16 16 16 16 16 16 16 16 16 16 16 — — 2
Maggi oats noodles 290gm Nestle 98 100g 33 33 33 34 34 34 34 34 34 34 34 34 — — —
Maggi Chicken 284gm Nestle 58 100g 20 20 20 20 20 20 20 20 20 20 20 20 — — —
Maggi Cuppa Mania Yo Masala 70gm Nestle 45 100g 57 57 57 64 64 64 64 64 64 64 64 64 — — —
Maggi Atta masala 290gm Nestle 86 100g 27 27 27 27 27 27 27 27 30 30 30 30 — — 10
Sunfeast Yippee Magic Masala 70gm ITC 10 100g 17 17 17 17 17 17 17 17 17 17 17 17 — — —
Sunfeast Yippee Mood Masala 65gm ITC 15 100g 23 23 23 23 23 18 18 18 23 23 23 23 — — 25
Knorr Soupy Mast Masala Pp 75gm HUVR 15 100g 20 20 20 20 20 20 20 20 20 20 20 20 — — —
Change (%)Normalised price in Rs (adjusted for grammage changes)
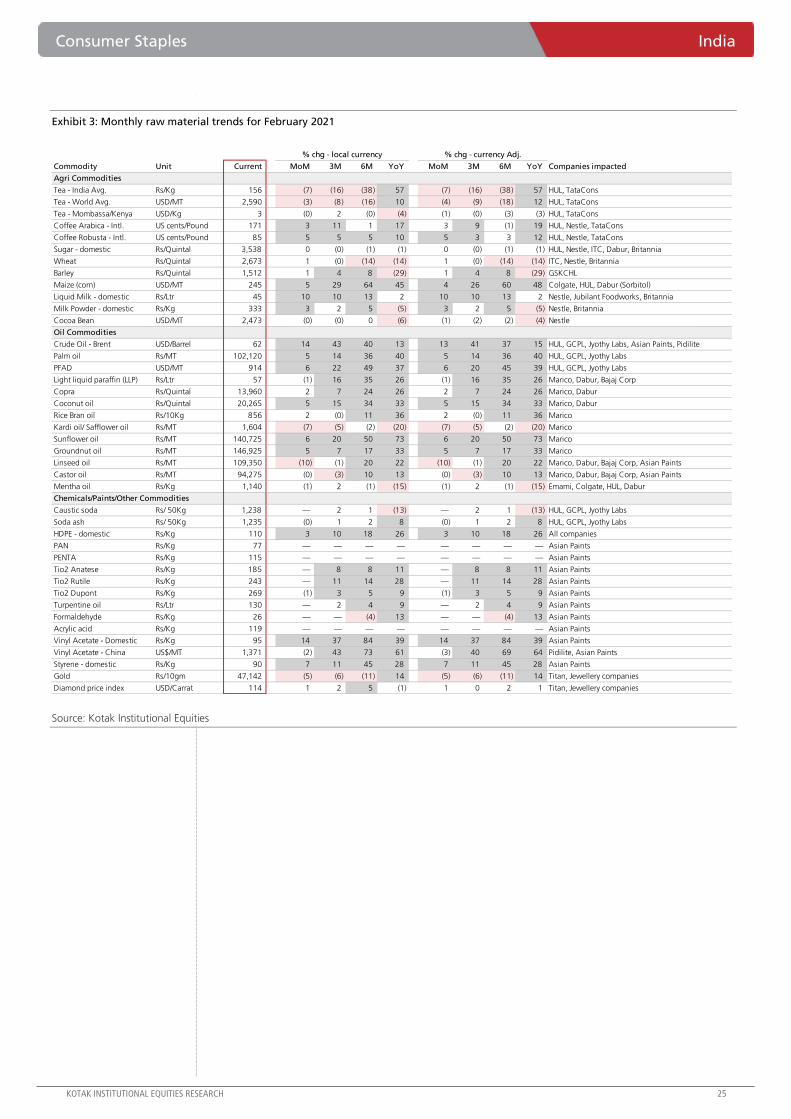
Consumer Staples India
KOTAK INSTITUTIONAL EQUITIES RESEARCH 25
Exhibit 3: Monthly raw material trends for February 2021
Source: Kotak Institutional Equities
Commodity Unit Current MoM 3M 6M YoY MoM 3M 6M YoY Companies impacted
Agri Commodities
Tea - India Avg. Rs/Kg 156 (7) (16) (38) 57 (7) (16) (38) 57 HUL, TataCons
Tea - World Avg. USD/MT 2,590 (3) (8) (16) 10 (4) (9) (18) 12 HUL, TataCons
Tea - Mombassa/Kenya USD/Kg 3 (0) 2 (0) (4) (1) (0) (3) (3) HUL, TataCons
Coffee Arabica - Intl. US cents/Pound 171 3 11 1 17 3 9 (1) 19 HUL, Nestle, TataCons
Coffee Robusta - Intl. US cents/Pound 85 5 5 5 10 5 3 3 12 HUL, Nestle, TataCons
Sugar - domestic Rs/Quintal 3,538 0 (0) (1) (1) 0 (0) (1) (1) HUL, Nestle, ITC, Dabur, Britannia
Wheat Rs/Quintal 2,673 1 (0) (14) (14) 1 (0) (14) (14) ITC, Nestle, Britannia
Barley Rs/Quintal 1,512 1 4 8 (29) 1 4 8 (29) GSKCHL
Maize (corn) USD/MT 245 5 29 64 45 4 26 60 48 Colgate, HUL, Dabur (Sorbitol)
Liquid Milk - domestic Rs/Ltr 45 10 10 13 2 10 10 13 2 Nestle, Jubilant Foodworks, Britannia
Milk Powder - domestic Rs/Kg 333 3 2 5 (5) 3 2 5 (5) Nestle, Britannia
Cocoa Bean USD/MT 2,473 (0) (0) 0 (6) (1) (2) (2) (4) Nestle
Oil Commodities
Crude Oil - Brent USD/Barrel 62 14 43 40 13 13 41 37 15 HUL, GCPL, Jyothy Labs, Asian Paints, Pidilite
Palm oil Rs/MT 102,120 5 14 36 40 5 14 36 40 HUL, GCPL, Jyothy Labs
PFAD USD/MT 914 6 22 49 37 6 20 45 39 HUL, GCPL, Jyothy Labs
Light liquid paraffin (LLP) Rs/Ltr 57 (1) 16 35 26 (1) 16 35 26 Marico, Dabur, Bajaj Corp
Copra Rs/Quintal 13,960 2 7 24 26 2 7 24 26 Marico, Dabur
Coconut oil Rs/Quintal 20,265 5 15 34 33 5 15 34 33 Marico, Dabur
Rice Bran oil Rs/10Kg 856 2 (0) 11 36 2 (0) 11 36 Marico
Kardi oil/ Safflower oil Rs/MT 1,604 (7) (5) (2) (20) (7) (5) (2) (20) Marico
Sunflower oil Rs/MT 140,725 6 20 50 73 6 20 50 73 Marico
Groundnut oil Rs/MT 146,925 5 7 17 33 5 7 17 33 Marico
Linseed oil Rs/MT 109,350 (10) (1) 20 22 (10) (1) 20 22 Marico, Dabur, Bajaj Corp, Asian Paints
Castor oil Rs/MT 94,275 (0) (3) 10 13 (0) (3) 10 13 Marico, Dabur, Bajaj Corp, Asian Paints
Mentha oil Rs/Kg 1,140 (1) 2 (1) (15) (1) 2 (1) (15) Emami, Colgate, HUL, Dabur
Chemicals/Paints/Other Commodities
Caustic soda Rs/ 50Kg 1,238 — 2 1 (13) — 2 1 (13) HUL, GCPL, Jyothy Labs
Soda ash Rs/ 50Kg 1,235 (0) 1 2 8 (0) 1 2 8 HUL, GCPL, Jyothy Labs
HDPE - domestic Rs/Kg 110 3 10 18 26 3 10 18 26 All companies
PAN Rs/Kg 77 — — — — — — — — Asian Paints
PENTA Rs/Kg 115 — — — — — — — — Asian Paints
Tio2 Anatese Rs/Kg 185 — 8 8 11 — 8 8 11 Asian Paints
Tio2 Rutile Rs/Kg 243 — 11 14 28 — 11 14 28 Asian Paints
Tio2 Dupont Rs/Kg 269 (1) 3 5 9 (1) 3 5 9 Asian Paints
Turpentine oil Rs/Ltr 130 — 2 4 9 — 2 4 9 Asian Paints
Formaldehyde Rs/Kg 26 — — (4) 13 — — (4) 13 Asian Paints
Acrylic acid Rs/Kg 119 — — — — — — — — Asian Paints
Vinyl Acetate - Domestic Rs/Kg 95 14 37 84 39 14 37 84 39 Asian Paints
Vinyl Acetate - China US$/MT 1,371 (2) 43 73 61 (3) 40 69 64 Pidilite, Asian Paints
Styrene - domestic Rs/Kg 90 7 11 45 28 7 11 45 28 Asian Paints
Gold Rs/10gm 47,142 (5) (6) (11) 14 (5) (6) (11) 14 Titan, Jewellery companies
Diamond price index USD/Carrat 114 1 2 5 (1) 1 0 2 1 Titan, Jewellery companies
% chg - local currency % chg - currency Adj.
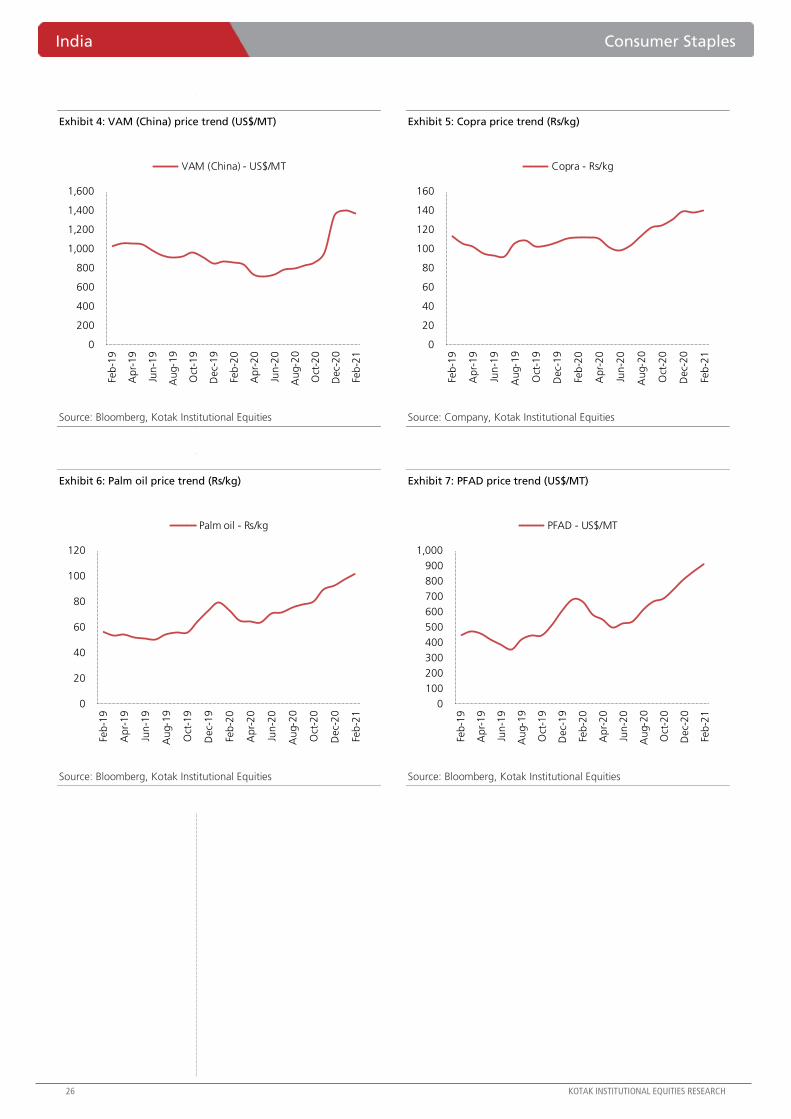
India Consumer Staples
26 KOTAK INSTITUTIONAL EQUITIES RESEARCH
Exhibit 4: VAM (China) price trend (US$/MT)
Source: Bloomberg, Kotak Institutional Equities
Exhibit 5: Copra price trend (Rs/kg)
Source: Company, Kotak Institutional Equities
Exhibit 6: Palm oil price trend (Rs/kg)
Source: Bloomberg, Kotak Institutional Equities
Exhibit 7: PFAD price trend (US$/MT)
Source: Bloomberg, Kotak Institutional Equities
0
200
400
600
800
1,000
1,200
1,400
1,600
Feb
-19
Ap
r-1
9
Jun
-19
Au
g-1
9
Oct
-19
Dec-
19
Feb
-20
Ap
r-2
0
Jun
-20
Au
g-2
0
Oct
-20
Dec-
20
Feb
-21
VAM (China) - US$/MT
0
20
40
60
80
100
120
140
160
Feb
-19
Ap
r-1
9
Jun
-19
Au
g-1
9
Oct
-19
Dec-
19
Feb
-20
Ap
r-2
0
Jun
-20
Au
g-2
0
Oct
-20
Dec-
20
Feb
-21
Copra - Rs/kg
0
20
40
60
80
100
120
Feb
-19
Ap
r-1
9
Jun
-19
Au
g-1
9
Oct
-19
Dec-
19
Feb
-20
Ap
r-2
0
Jun
-20
Au
g-2
0
Oct
-20
Dec-
20
Feb
-21
Palm oil - Rs/kg
0
100
200
300
400
500
600
700
800
900
1,000
Feb
-19
Ap
r-1
9
Jun
-19
Au
g-1
9
Oct
-19
Dec-
19
Feb
-20
Ap
r-2
0
Jun
-20
Au
g-2
0
Oct
-20
Dec-
20
Feb
-21
PFAD - US$/MT
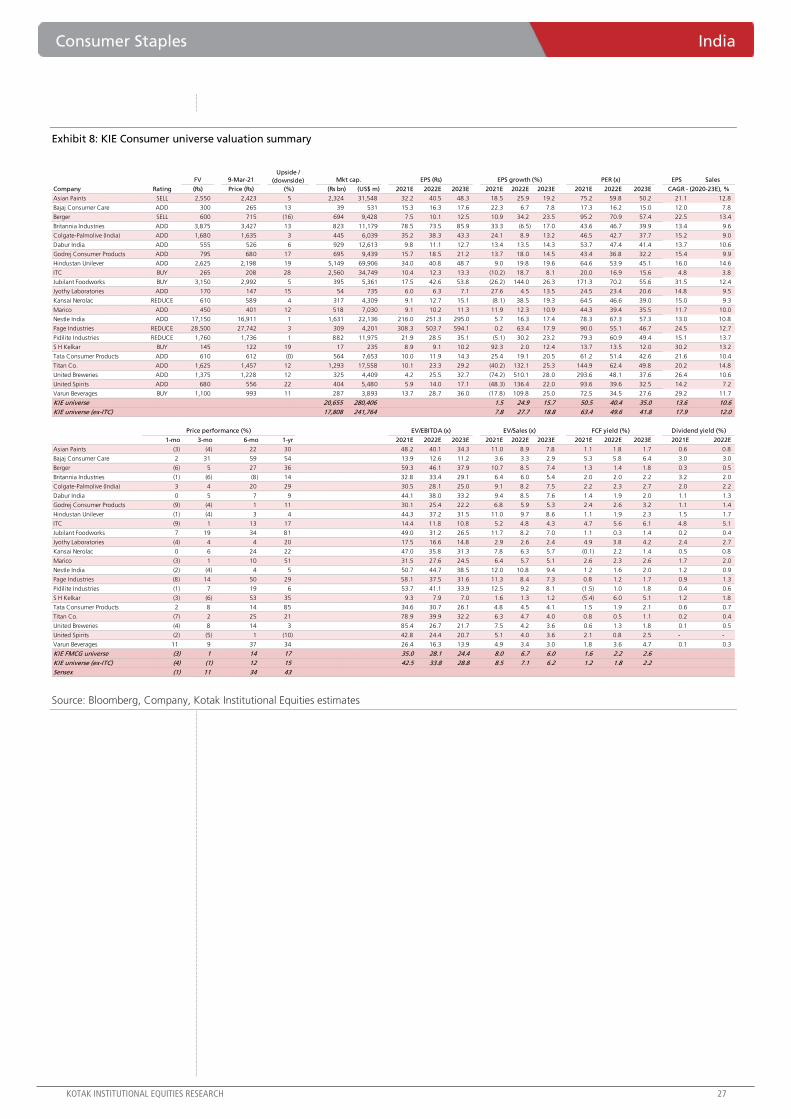
Consumer Staples India
KOTAK INSTITUTIONAL EQUITIES RESEARCH 27
Exhibit 8: KIE Consumer universe valuation summary
Source: Bloomberg, Company, Kotak Institutional Equities estimates
FV 9-Mar-21 EPS Sales
Company Rating (Rs) Price (Rs) (Rs bn) (US$ m) 2021E 2022E 2023E 2021E 2022E 2023E 2021E 2022E 2023E
Asian Paints SELL 2,550 2,423 5 2,324 31,548 32.2 40.5 48.3 18.5 25.9 19.2 75.2 59.8 50.2 21.1 12.8
Bajaj Consumer Care ADD 300 265 13 39 531 15.3 16.3 17.6 22.3 6.7 7.8 17.3 16.2 15.0 12.0 7.8
Berger SELL 600 715 (16) 694 9,428 7.5 10.1 12.5 10.9 34.2 23.5 95.2 70.9 57.4 22.5 13.4
Britannia Industries ADD 3,875 3,427 13 823 11,179 78.5 73.5 85.9 33.3 (6.5) 17.0 43.6 46.7 39.9 13.4 9.6
Colgate-Palmolive (India) ADD 1,680 1,635 3 445 6,039 35.2 38.3 43.3 24.1 8.9 13.2 46.5 42.7 37.7 15.2 9.0
Dabur India ADD 555 526 6 929 12,613 9.8 11.1 12.7 13.4 13.5 14.3 53.7 47.4 41.4 13.7 10.6
Godrej Consumer Products ADD 795 680 17 695 9,439 15.7 18.5 21.2 13.7 18.0 14.5 43.4 36.8 32.2 15.4 9.9
Hindustan Unilever ADD 2,625 2,198 19 5,149 69,906 34.0 40.8 48.7 9.0 19.8 19.6 64.6 53.9 45.1 16.0 14.6
ITC BUY 265 208 28 2,560 34,749 10.4 12.3 13.3 (10.2) 18.7 8.1 20.0 16.9 15.6 4.8 3.8
Jubilant Foodworks BUY 3,150 2,992 5 395 5,361 17.5 42.6 53.8 (26.2) 144.0 26.3 171.3 70.2 55.6 31.5 12.4
Jyothy Laboratories ADD 170 147 15 54 735 6.0 6.3 7.1 27.6 4.5 13.5 24.5 23.4 20.6 14.8 9.5
Kansai Nerolac REDUCE 610 589 4 317 4,309 9.1 12.7 15.1 (8.1) 38.5 19.3 64.5 46.6 39.0 15.0 9.3
Marico ADD 450 401 12 518 7,030 9.1 10.2 11.3 11.9 12.3 10.9 44.3 39.4 35.5 11.7 10.0
Nestle India ADD 17,150 16,911 1 1,631 22,136 216.0 251.3 295.0 5.7 16.3 17.4 78.3 67.3 57.3 13.0 10.8
Page Industries REDUCE 28,500 27,742 3 309 4,201 308.3 503.7 594.1 0.2 63.4 17.9 90.0 55.1 46.7 24.5 12.7
Pidilite Industries REDUCE 1,760 1,736 1 882 11,975 21.9 28.5 35.1 (5.1) 30.2 23.2 79.3 60.9 49.4 15.1 13.7
S H Kelkar BUY 145 122 19 17 235 8.9 9.1 10.2 92.3 2.0 12.4 13.7 13.5 12.0 30.2 13.2
Tata Consumer Products ADD 610 612 (0) 564 7,653 10.0 11.9 14.3 25.4 19.1 20.5 61.2 51.4 42.6 21.6 10.4
Titan Co. ADD 1,625 1,457 12 1,293 17,558 10.1 23.3 29.2 (40.2) 132.1 25.3 144.9 62.4 49.8 20.2 14.8
United Breweries ADD 1,375 1,228 12 325 4,409 4.2 25.5 32.7 (74.2) 510.1 28.0 293.6 48.1 37.6 26.4 10.6
United Spirits ADD 680 556 22 404 5,480 5.9 14.0 17.1 (48.3) 136.4 22.0 93.6 39.6 32.5 14.2 7.2
Varun Beverages BUY 1,100 993 11 287 3,893 13.7 28.7 36.0 (17.8) 109.8 25.0 72.5 34.5 27.6 29.2 11.7
KIE universe 20,655 280,406 1.5 24.9 15.7 50.5 40.4 35.0 13.6 10.6
KIE universe (ex-ITC) 17,808 241,764 7.8 27.7 18.8 63.4 49.6 41.8 17.9 12.0
1-mo 3-mo 6-mo 1-yr 2021E 2022E 2023E 2021E 2022E 2023E 2021E 2022E 2023E 2021E 2022E
Asian Paints (3) (4) 22 30 48.2 40.1 34.3 11.0 8.9 7.8 1.1 1.8 1.7 0.6 0.8
Bajaj Consumer Care 2 31 59 54 13.9 12.6 11.2 3.6 3.3 2.9 5.3 5.8 6.4 3.0 3.0
Berger (6) 5 27 36 59.3 46.1 37.9 10.7 8.5 7.4 1.3 1.4 1.8 0.3 0.5
Britannia Industries (1) (6) (8) 14 32.8 33.4 29.1 6.4 6.0 5.4 2.0 2.0 2.2 3.2 2.0
Colgate-Palmolive (India) 3 4 20 29 30.5 28.1 25.0 9.1 8.2 7.5 2.2 2.3 2.7 2.0 2.2
Dabur India 0 5 7 9 44.1 38.0 33.2 9.4 8.5 7.6 1.4 1.9 2.0 1.1 1.3
Godrej Consumer Products (9) (4) 1 11 30.1 25.4 22.2 6.8 5.9 5.3 2.4 2.6 3.2 1.1 1.4
Hindustan Unilever (1) (4) 3 4 44.3 37.2 31.5 11.0 9.7 8.6 1.1 1.9 2.3 1.5 1.7
ITC (9) 1 13 17 14.4 11.8 10.8 5.2 4.8 4.3 4.7 5.6 6.1 4.8 5.1
Jubilant Foodworks 7 19 34 81 49.0 31.2 26.5 11.7 8.2 7.0 1.1 0.3 1.4 0.2 0.4
Jyothy Laboratories (4) 4 4 20 17.5 16.6 14.8 2.9 2.6 2.4 4.9 3.8 4.2 2.4 2.7
Kansai Nerolac 0 6 24 22 47.0 35.8 31.3 7.8 6.3 5.7 (0.1) 2.2 1.4 0.5 0.8
Marico (3) 1 10 51 31.5 27.6 24.5 6.4 5.7 5.1 2.6 2.3 2.6 1.7 2.0
Nestle India (2) (4) 4 5 50.7 44.7 38.5 12.0 10.8 9.4 1.2 1.6 2.0 1.2 0.9
Page Industries (8) 14 50 29 58.1 37.5 31.6 11.3 8.4 7.3 0.8 1.2 1.7 0.9 1.3
Pidilite Industries (1) 7 19 6 53.7 41.1 33.9 12.5 9.2 8.1 (1.5) 1.0 1.8 0.4 0.6
S H Kelkar (3) (6) 53 35 9.3 7.9 7.0 1.6 1.3 1.2 (5.4) 6.0 5.1 1.2 1.8
Tata Consumer Products 2 8 14 85 34.6 30.7 26.1 4.8 4.5 4.1 1.5 1.9 2.1 0.6 0.7
Titan Co. (7) 2 25 21 78.9 39.9 32.2 6.3 4.7 4.0 0.8 0.5 1.1 0.2 0.4
United Breweries (4) 8 14 3 85.4 26.7 21.7 7.5 4.2 3.6 0.6 1.3 1.8 0.1 0.5
United Spirits (2) (5) 1 (10) 42.8 24.4 20.7 5.1 4.0 3.6 2.1 0.8 2.5 - -
Varun Beverages 11 9 37 34 26.4 16.3 13.9 4.9 3.4 3.0 1.8 3.6 4.7 0.1 0.3
KIE FMCG universe (3) 1 14 17 35.0 28.1 24.4 8.0 6.7 6.0 1.6 2.2 2.6
KIE universe (ex-ITC) (4) (1) 12 15 42.5 33.8 28.8 8.5 7.1 6.2 1.2 1.8 2.2
Sensex (1) 11 34 43
Mkt cap.
Price performance (%)
Upside /
(downside)
(%)
FCF yield (%)
EPS growth (%)
EV/EBITDA (x) EV/Sales (x)
CAGR - (2020-23E), %
Dividend yield (%)
EPS (Rs) PER (x)
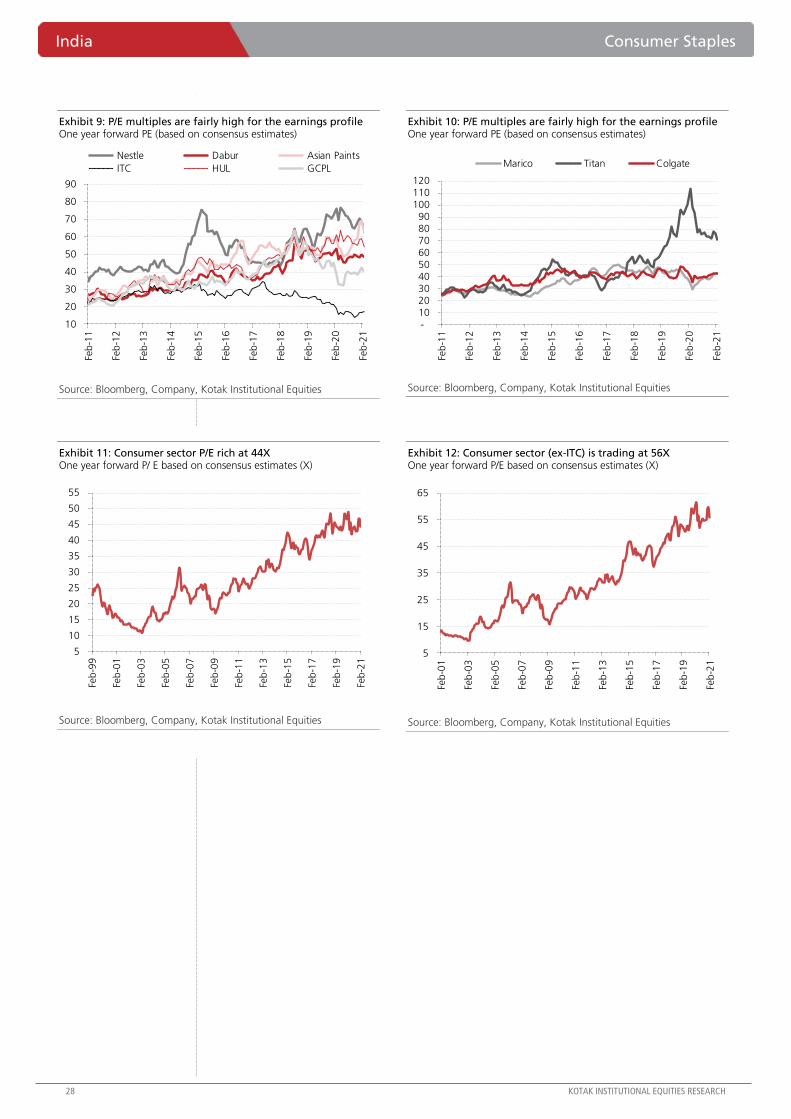
India Consumer Staples
28 KOTAK INSTITUTIONAL EQUITIES RESEARCH
Exhibit 9: P/E multiples are fairly high for the earnings profile One year forward PE (based on consensus estimates)
Source: Bloomberg, Company, Kotak Institutional Equities
Exhibit 10: P/E multiples are fairly high for the earnings profile One year forward PE (based on consensus estimates)
Source: Bloomberg, Company, Kotak Institutional Equities
Exhibit 11: Consumer sector P/E rich at 44X One year forward P/ E based on consensus estimates (X)
Source: Bloomberg, Company, Kotak Institutional Equities
Exhibit 12: Consumer sector (ex-ITC) is trading at 56X One year forward P/E based on consensus estimates (X)
Source: Bloomberg, Company, Kotak Institutional Equities
10
20
30
40
50
60
70
80
90
Feb
-11
Feb
-12
Feb
-13
Feb
-14
Feb
-15
Feb
-16
Feb
-17
Feb
-18
Feb
-19
Feb
-20
Feb
-21
Nestle Dabur Asian Paints
ITC HUL GCPL
- 10 20 30 40 50 60 70 80 90
100 110 120
Feb
-11
Feb
-12
Feb
-13
Feb
-14
Feb
-15
Feb
-16
Feb
-17
Feb
-18
Feb
-19
Feb
-20
Feb
-21
Marico Titan Colgate
5
10
15
20
25
30
35
40
45
50
55
Feb
-99
Feb
-01
Feb
-03
Feb
-05
Feb
-07
Feb
-09
Feb
-11
Feb
-13
Feb
-15
Feb
-17
Feb
-19
Feb
-21
5
15
25
35
45
55
65
Feb
-01
Feb
-03
Feb
-05
Feb
-07
Feb
-09
Feb
-11
Feb
-13
Feb
-15
Feb
-17
Feb
-19
Feb
-21
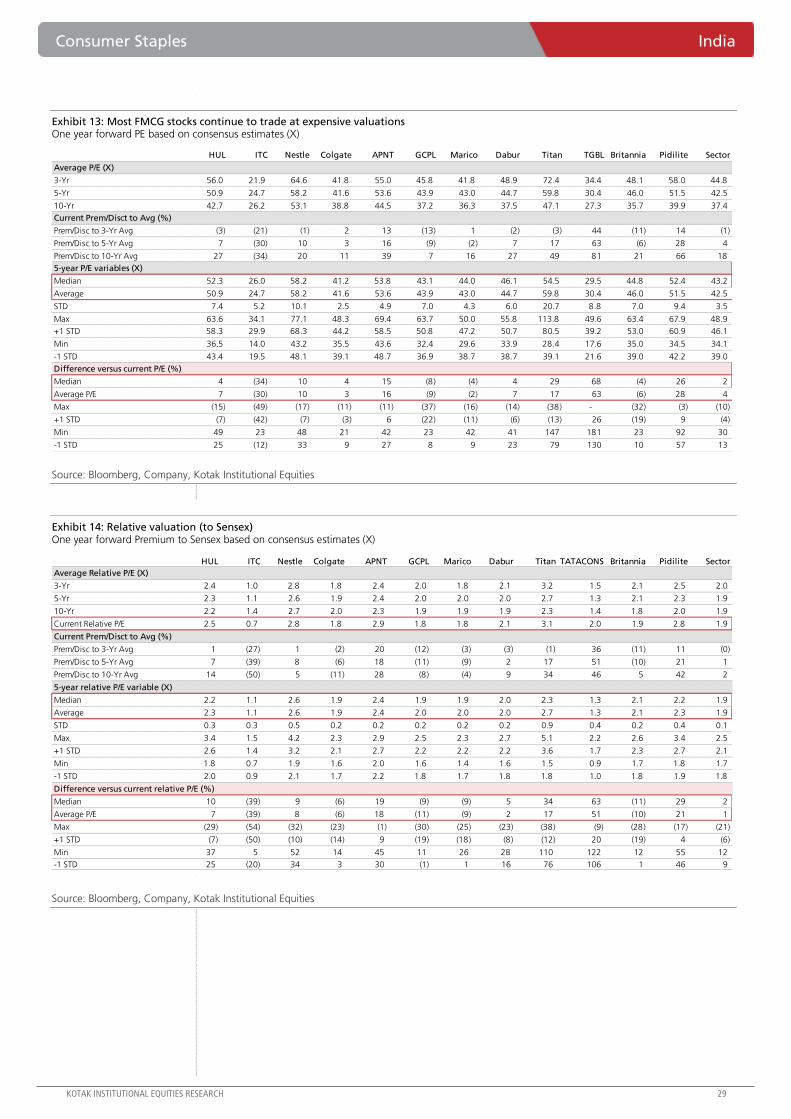
Consumer Staples India
KOTAK INSTITUTIONAL EQUITIES RESEARCH 29
Exhibit 13: Most FMCG stocks continue to trade at expensive valuations One year forward PE based on consensus estimates (X)
Source: Bloomberg, Company, Kotak Institutional Equities
Exhibit 14: Relative valuation (to Sensex) One year forward Premium to Sensex based on consensus estimates (X)
Source: Bloomberg, Company, Kotak Institutional Equities
HUL ITC Nestle Colgate APNT GCPL Marico Dabur Titan TGBL Britannia Pidilite Sector
Average P/E (X)
3-Yr 56.0 21.9 64.6 41.8 55.0 45.8 41.8 48.9 72.4 34.4 48.1 58.0 44.8
5-Yr 50.9 24.7 58.2 41.6 53.6 43.9 43.0 44.7 59.8 30.4 46.0 51.5 42.5
10-Yr 42.7 26.2 53.1 38.8 44.5 37.2 36.3 37.5 47.1 27.3 35.7 39.9 37.4
Current Prem/Disct to Avg (%)
Prem/Disc to 3-Yr Avg (3) (21) (1) 2 13 (13) 1 (2) (3) 44 (11) 14 (1)
Prem/Disc to 5-Yr Avg 7 (30) 10 3 16 (9) (2) 7 17 63 (6) 28 4
Prem/Disc to 10-Yr Avg 27 (34) 20 11 39 7 16 27 49 81 21 66 18
5-year P/E variables (X)
Median 52.3 26.0 58.2 41.2 53.8 43.1 44.0 46.1 54.5 29.5 44.8 52.4 43.2
Average 50.9 24.7 58.2 41.6 53.6 43.9 43.0 44.7 59.8 30.4 46.0 51.5 42.5
STD 7.4 5.2 10.1 2.5 4.9 7.0 4.3 6.0 20.7 8.8 7.0 9.4 3.5
Max 63.6 34.1 77.1 48.3 69.4 63.7 50.0 55.8 113.8 49.6 63.4 67.9 48.9
+1 STD 58.3 29.9 68.3 44.2 58.5 50.8 47.2 50.7 80.5 39.2 53.0 60.9 46.1
Min 36.5 14.0 43.2 35.5 43.6 32.4 29.6 33.9 28.4 17.6 35.0 34.5 34.1
-1 STD 43.4 19.5 48.1 39.1 48.7 36.9 38.7 38.7 39.1 21.6 39.0 42.2 39.0
Difference versus current P/E (%)
Median 4 (34) 10 4 15 (8) (4) 4 29 68 (4) 26 2
Average P/E 7 (30) 10 3 16 (9) (2) 7 17 63 (6) 28 4
Max (15) (49) (17) (11) (11) (37) (16) (14) (38) - (32) (3) (10)
+1 STD (7) (42) (7) (3) 6 (22) (11) (6) (13) 26 (19) 9 (4)
Min 49 23 48 21 42 23 42 41 147 181 23 92 30
-1 STD 25 (12) 33 9 27 8 9 23 79 130 10 57 13
HUL ITC Nestle Colgate APNT GCPL Marico Dabur Titan TATACONS Britannia Pidilite Sector
Average Relative P/E (X)
3-Yr 2.4 1.0 2.8 1.8 2.4 2.0 1.8 2.1 3.2 1.5 2.1 2.5 2.0
5-Yr 2.3 1.1 2.6 1.9 2.4 2.0 2.0 2.0 2.7 1.3 2.1 2.3 1.9
10-Yr 2.2 1.4 2.7 2.0 2.3 1.9 1.9 1.9 2.3 1.4 1.8 2.0 1.9
Current Relative P/E 2.5 0.7 2.8 1.8 2.9 1.8 1.8 2.1 3.1 2.0 1.9 2.8 1.9
Current Prem/Disct to Avg (%)
Prem/Disc to 3-Yr Avg 1 (27) 1 (2) 20 (12) (3) (3) (1) 36 (11) 11 (0)
Prem/Disc to 5-Yr Avg 7 (39) 8 (6) 18 (11) (9) 2 17 51 (10) 21 1
Prem/Disc to 10-Yr Avg 14 (50) 5 (11) 28 (8) (4) 9 34 46 5 42 2
5-year relative P/E variable (X)
Median 2.2 1.1 2.6 1.9 2.4 1.9 1.9 2.0 2.3 1.3 2.1 2.2 1.9
Average 2.3 1.1 2.6 1.9 2.4 2.0 2.0 2.0 2.7 1.3 2.1 2.3 1.9
STD 0.3 0.3 0.5 0.2 0.2 0.2 0.2 0.2 0.9 0.4 0.2 0.4 0.1
Max 3.4 1.5 4.2 2.3 2.9 2.5 2.3 2.7 5.1 2.2 2.6 3.4 2.5
+1 STD 2.6 1.4 3.2 2.1 2.7 2.2 2.2 2.2 3.6 1.7 2.3 2.7 2.1
Min 1.8 0.7 1.9 1.6 2.0 1.6 1.4 1.6 1.5 0.9 1.7 1.8 1.7
-1 STD 2.0 0.9 2.1 1.7 2.2 1.8 1.7 1.8 1.8 1.0 1.8 1.9 1.8
Difference versus current relative P/E (%)
Median 10 (39) 9 (6) 19 (9) (9) 5 34 63 (11) 29 2
Average P/E 7 (39) 8 (6) 18 (11) (9) 2 17 51 (10) 21 1
Max (29) (54) (32) (23) (1) (30) (25) (23) (38) (9) (28) (17) (21)
+1 STD (7) (50) (10) (14) 9 (19) (18) (8) (12) 20 (19) 4 (6)
Min 37 5 52 14 45 11 26 28 110 122 12 55 12
-1 STD 25 (20) 34 3 30 (1) 1 16 76 106 1 46 9
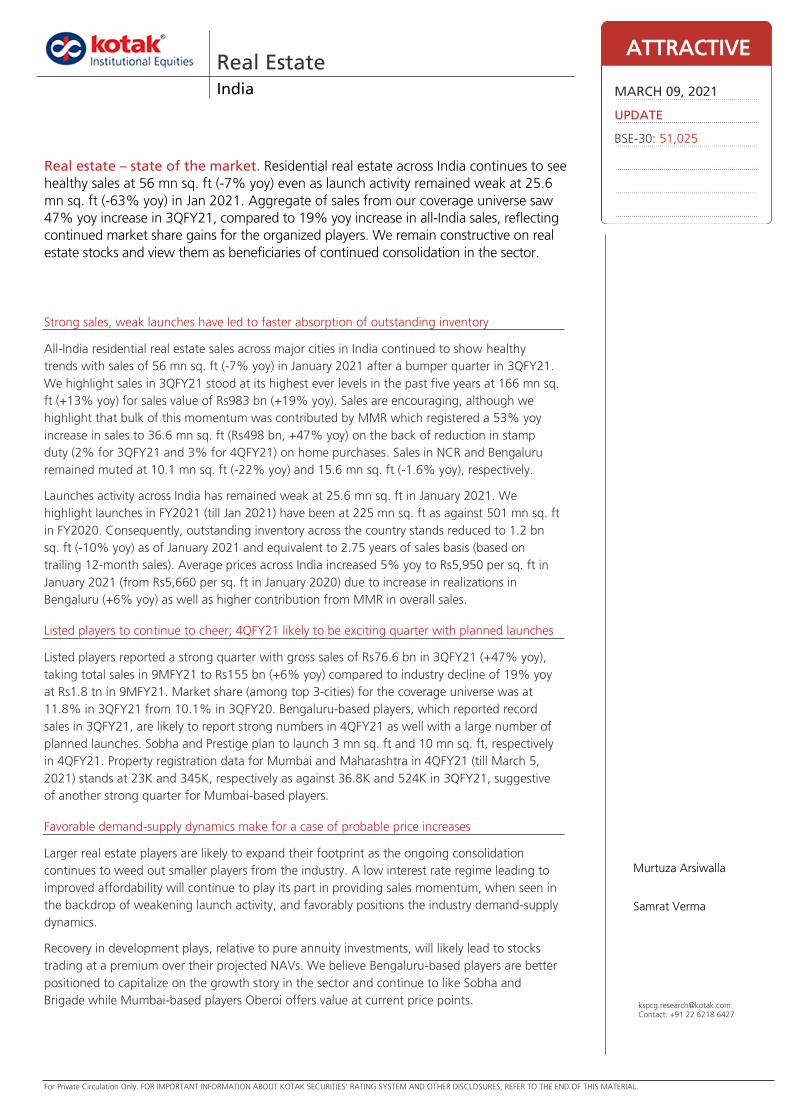
For Private Circulation Only. FOR IMPORTANT INFORMATION ABOUT KOTAK SECURITIES’ RATING SYSTEM AND OTHER DISCLOSURES, REFER TO THE END OF THIS MATERIAL.
Strong sales, weak launches have led to faster absorption of outstanding inventory
All-India residential real estate sales across major cities in India continued to show healthy
trends with sales of 56 mn sq. ft (-7% yoy) in January 2021 after a bumper quarter in 3QFY21.
We highlight sales in 3QFY21 stood at its highest ever levels in the past five years at 166 mn sq.
ft (+13% yoy) for sales value of Rs983 bn (+19% yoy). Sales are encouraging, although we
highlight that bulk of this momentum was contributed by MMR which registered a 53% yoy
increase in sales to 36.6 mn sq. ft (Rs498 bn, +47% yoy) on the back of reduction in stamp
duty (2% for 3QFY21 and 3% for 4QFY21) on home purchases. Sales in NCR and Bengaluru
remained muted at 10.1 mn sq. ft (-22% yoy) and 15.6 mn sq. ft (-1.6% yoy), respectively.
Launches activity across India has remained weak at 25.6 mn sq. ft in January 2021. We
highlight launches in FY2021 (till Jan 2021) have been at 225 mn sq. ft as against 501 mn sq. ft
in FY2020. Consequently, outstanding inventory across the country stands reduced to 1.2 bn
sq. ft (-10% yoy) as of January 2021 and equivalent to 2.75 years of sales basis (based on
trailing 12-month sales). Average prices across India increased 5% yoy to Rs5,950 per sq. ft in
January 2021 (from Rs5,660 per sq. ft in January 2020) due to increase in realizations in
Bengaluru (+6% yoy) as well as higher contribution from MMR in overall sales.
Listed players to continue to cheer; 4QFY21 likely to be exciting quarter with planned launches
Listed players reported a strong quarter with gross sales of Rs76.6 bn in 3QFY21 (+47% yoy),
taking total sales in 9MFY21 to Rs155 bn (+6% yoy) compared to industry decline of 19% yoy
at Rs1.8 tn in 9MFY21. Market share (among top 3-cities) for the coverage universe was at
11.8% in 3QFY21 from 10.1% in 3QFY20. Bengaluru-based players, which reported record
sales in 3QFY21, are likely to report strong numbers in 4QFY21 as well with a large number of
planned launches. Sobha and Prestige plan to launch 3 mn sq. ft and 10 mn sq. ft, respectively
in 4QFY21. Property registration data for Mumbai and Maharashtra in 4QFY21 (till March 5,
2021) stands at 23K and 345K, respectively as against 36.8K and 524K in 3QFY21, suggestive
of another strong quarter for Mumbai-based players.
Favorable demand-supply dynamics make for a case of probable price increases
Larger real estate players are likely to expand their footprint as the ongoing consolidation
continues to weed out smaller players from the industry. A low interest rate regime leading to
improved affordability will continue to play its part in providing sales momentum, when seen in
the backdrop of weakening launch activity, and favorably positions the industry demand-supply
dynamics.
Recovery in development plays, relative to pure annuity investments, will likely lead to stocks
trading at a premium over their projected NAVs. We believe Bengaluru-based players are better
positioned to capitalize on the growth story in the sector and continue to like Sobha and
Brigade while Mumbai-based players Oberoi offers value at current price points.
Real Estate India
Real estate – state of the market. Residential real estate across India continues to see
healthy sales at 56 mn sq. ft (-7% yoy) even as launch activity remained weak at 25.6
mn sq. ft (-63% yoy) in Jan 2021. Aggregate of sales from our coverage universe saw
47% yoy increase in 3QFY21, compared to 19% yoy increase in all-India sales, reflecting
continued market share gains for the organized players. We remain constructive on real
estate stocks and view them as beneficiaries of continued consolidation in the sector.
ATTRACTIVE
MARCH 09, 2021
UPDATE
BSE-30: 51,025
Murtuza Arsiwalla
Samrat Verma
[email protected]: +91 22 6218 6427
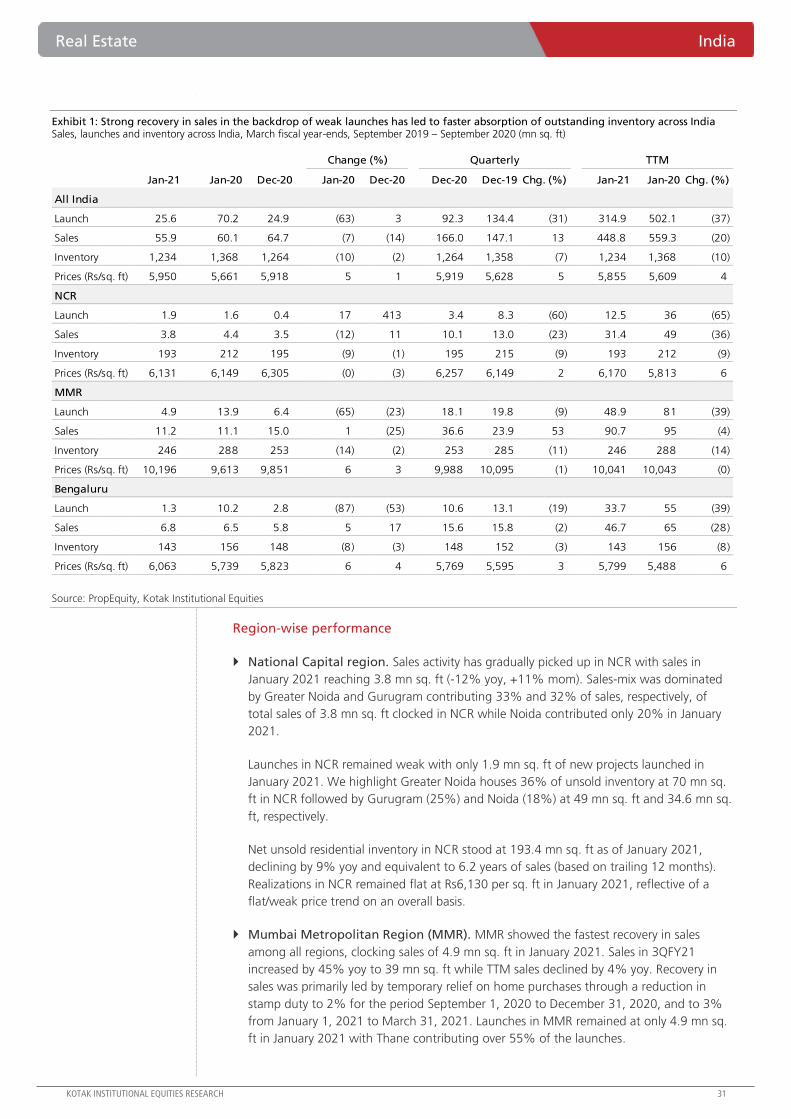
Real Estate India
KOTAK INSTITUTIONAL EQUITIES RESEARCH 31
Exhibit 1: Strong recovery in sales in the backdrop of weak launches has led to faster absorption of outstanding inventory across India Sales, launches and inventory across India, March fiscal year-ends, September 2019 – September 2020 (mn sq. ft)
Source: PropEquity, Kotak Institutional Equities
Region-wise performance
National Capital region. Sales activity has gradually picked up in NCR with sales in
January 2021 reaching 3.8 mn sq. ft (-12% yoy, +11% mom). Sales-mix was dominated
by Greater Noida and Gurugram contributing 33% and 32% of sales, respectively, of
total sales of 3.8 mn sq. ft clocked in NCR while Noida contributed only 20% in January
2021.
Launches in NCR remained weak with only 1.9 mn sq. ft of new projects launched in
January 2021. We highlight Greater Noida houses 36% of unsold inventory at 70 mn sq.
ft in NCR followed by Gurugram (25%) and Noida (18%) at 49 mn sq. ft and 34.6 mn sq.
ft, respectively.
Net unsold residential inventory in NCR stood at 193.4 mn sq. ft as of January 2021,
declining by 9% yoy and equivalent to 6.2 years of sales (based on trailing 12 months).
Realizations in NCR remained flat at Rs6,130 per sq. ft in January 2021, reflective of a
flat/weak price trend on an overall basis.
Mumbai Metropolitan Region (MMR). MMR showed the fastest recovery in sales
among all regions, clocking sales of 4.9 mn sq. ft in January 2021. Sales in 3QFY21
increased by 45% yoy to 39 mn sq. ft while TTM sales declined by 4% yoy. Recovery in
sales was primarily led by temporary relief on home purchases through a reduction in
stamp duty to 2% for the period September 1, 2020 to December 31, 2020, and to 3%
from January 1, 2021 to March 31, 2021. Launches in MMR remained at only 4.9 mn sq.
ft in January 2021 with Thane contributing over 55% of the launches.
Change (%) Quarterly TTM
Jan-21 Jan-20 Dec-20 Jan-20 Dec-20 Dec-20 Dec-19 Chg. (%) Jan-21 Jan-20 Chg. (%)
All India
Launch 25.6 70.2 24.9 (63) 3 92.3 134.4 (31) 314.9 502.1 (37)
Sales 55.9 60.1 64.7 (7) (14) 166.0 147.1 13 448.8 559.3 (20)
Inventory 1,234 1,368 1,264 (10) (2) 1,264 1,358 (7) 1,234 1,368 (10)
Prices (Rs/sq. ft) 5,950 5,661 5,918 5 1 5,919 5,628 5 5,855 5,609 4
NCR
Launch 1.9 1.6 0.4 17 413 3.4 8.3 (60) 12.5 36 (65)
Sales 3.8 4.4 3.5 (12) 11 10.1 13.0 (23) 31.4 49 (36)
Inventory 193 212 195 (9) (1) 195 215 (9) 193 212 (9)
Prices (Rs/sq. ft) 6,131 6,149 6,305 (0) (3) 6,257 6,149 2 6,170 5,813 6
MMR
Launch 4.9 13.9 6.4 (65) (23) 18.1 19.8 (9) 48.9 81 (39)
Sales 11.2 11.1 15.0 1 (25) 36.6 23.9 53 90.7 95 (4)
Inventory 246 288 253 (14) (2) 253 285 (11) 246 288 (14)
Prices (Rs/sq. ft) 10,196 9,613 9,851 6 3 9,988 10,095 (1) 10,041 10,043 (0)
Bengaluru
Launch 1.3 10.2 2.8 (87) (53) 10.6 13.1 (19) 33.7 55 (39)
Sales 6.8 6.5 5.8 5 17 15.6 15.8 (2) 46.7 65 (28)
Inventory 143 156 148 (8) (3) 148 152 (3) 143 156 (8)
Prices (Rs/sq. ft) 6,063 5,739 5,823 6 4 5,769 5,595 3 5,799 5,488 6
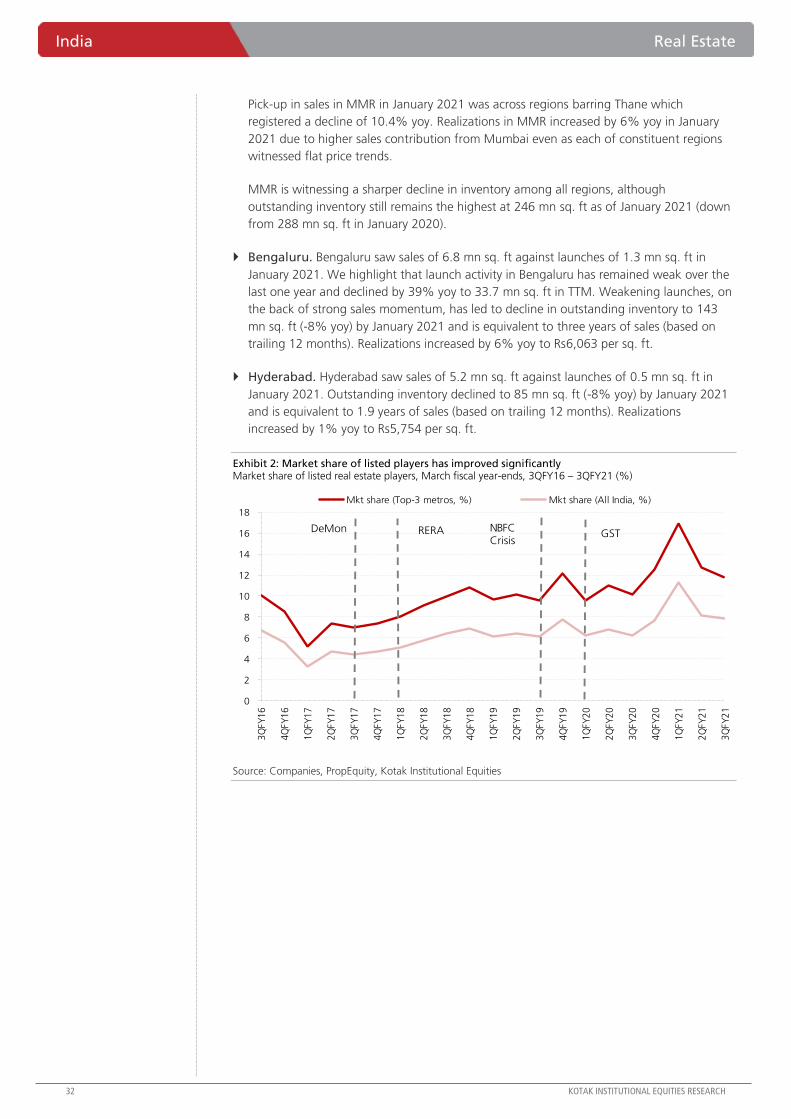
India Real Estate
32 KOTAK INSTITUTIONAL EQUITIES RESEARCH
Pick-up in sales in MMR in January 2021 was across regions barring Thane which
registered a decline of 10.4% yoy. Realizations in MMR increased by 6% yoy in January
2021 due to higher sales contribution from Mumbai even as each of constituent regions
witnessed flat price trends.
MMR is witnessing a sharper decline in inventory among all regions, although
outstanding inventory still remains the highest at 246 mn sq. ft as of January 2021 (down
from 288 mn sq. ft in January 2020).
Bengaluru. Bengaluru saw sales of 6.8 mn sq. ft against launches of 1.3 mn sq. ft in
January 2021. We highlight that launch activity in Bengaluru has remained weak over the
last one year and declined by 39% yoy to 33.7 mn sq. ft in TTM. Weakening launches, on
the back of strong sales momentum, has led to decline in outstanding inventory to 143
mn sq. ft (-8% yoy) by January 2021 and is equivalent to three years of sales (based on
trailing 12 months). Realizations increased by 6% yoy to Rs6,063 per sq. ft.
Hyderabad. Hyderabad saw sales of 5.2 mn sq. ft against launches of 0.5 mn sq. ft in
January 2021. Outstanding inventory declined to 85 mn sq. ft (-8% yoy) by January 2021
and is equivalent to 1.9 years of sales (based on trailing 12 months). Realizations
increased by 1% yoy to Rs5,754 per sq. ft.
Exhibit 2: Market share of listed players has improved significantly Market share of listed real estate players, March fiscal year-ends, 3QFY16 – 3QFY21 (%)
Source: Companies, PropEquity, Kotak Institutional Equities
0
2
4
6
8
10
12
14
16
18
3Q
FY1
6
4Q
FY1
6
1Q
FY1
7
2Q
FY1
7
3Q
FY1
7
4Q
FY1
7
1Q
FY1
8
2Q
FY1
8
3Q
FY1
8
4Q
FY1
8
1Q
FY1
9
2Q
FY1
9
3Q
FY1
9
4Q
FY1
9
1Q
FY2
0
2Q
FY2
0
3Q
FY2
0
4Q
FY2
0
1Q
FY2
1
2Q
FY2
1
3Q
FY2
1
Mkt share (Top-3 metros, %) Mkt share (All India, %)
RERADeMon NBFC Crisis
GST
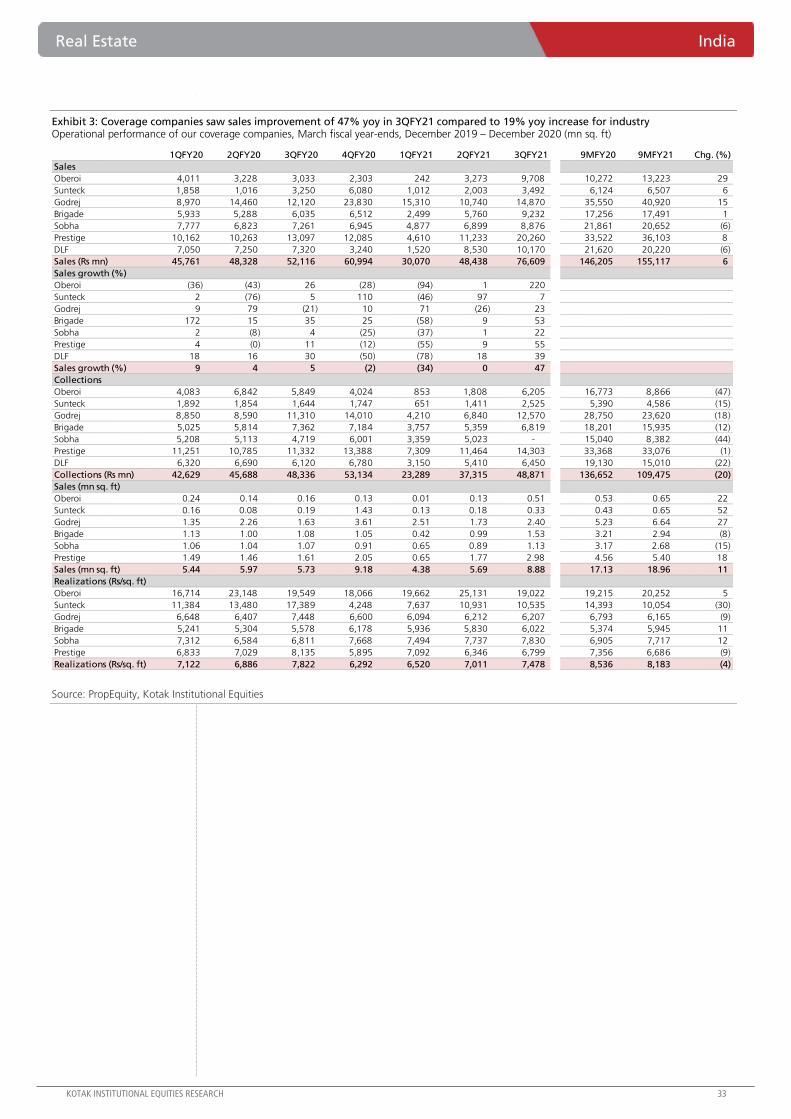
Real Estate India
KOTAK INSTITUTIONAL EQUITIES RESEARCH 33
Exhibit 3: Coverage companies saw sales improvement of 47% yoy in 3QFY21 compared to 19% yoy increase for industry Operational performance of our coverage companies, March fiscal year-ends, December 2019 – December 2020 (mn sq. ft)
Source: PropEquity, Kotak Institutional Equities
1QFY20 2QFY20 3QFY20 4QFY20 1QFY21 2QFY21 3QFY21 9MFY20 9MFY21 Chg. (%)
Sales
Oberoi 4,011 3,228 3,033 2,303 242 3,273 9,708 10,272 13,223 29
Sunteck 1,858 1,016 3,250 6,080 1,012 2,003 3,492 6,124 6,507 6
Godrej 8,970 14,460 12,120 23,830 15,310 10,740 14,870 35,550 40,920 15
Brigade 5,933 5,288 6,035 6,512 2,499 5,760 9,232 17,256 17,491 1
Sobha 7,777 6,823 7,261 6,945 4,877 6,899 8,876 21,861 20,652 (6)
Prestige 10,162 10,263 13,097 12,085 4,610 11,233 20,260 33,522 36,103 8
DLF 7,050 7,250 7,320 3,240 1,520 8,530 10,170 21,620 20,220 (6)
Sales (Rs mn) 45,761 48,328 52,116 60,994 30,070 48,438 76,609 146,205 155,117 6
Sales growth (%)
Oberoi (36) (43) 26 (28) (94) 1 220
Sunteck 2 (76) 5 110 (46) 97 7
Godrej 9 79 (21) 10 71 (26) 23
Brigade 172 15 35 25 (58) 9 53
Sobha 2 (8) 4 (25) (37) 1 22
Prestige 4 (0) 11 (12) (55) 9 55
DLF 18 16 30 (50) (78) 18 39
Sales growth (%) 9 4 5 (2) (34) 0 47
Collections
Oberoi 4,083 6,842 5,849 4,024 853 1,808 6,205 16,773 8,866 (47)
Sunteck 1,892 1,854 1,644 1,747 651 1,411 2,525 5,390 4,586 (15)
Godrej 8,850 8,590 11,310 14,010 4,210 6,840 12,570 28,750 23,620 (18)
Brigade 5,025 5,814 7,362 7,184 3,757 5,359 6,819 18,201 15,935 (12)
Sobha 5,208 5,113 4,719 6,001 3,359 5,023 - 15,040 8,382 (44)
Prestige 11,251 10,785 11,332 13,388 7,309 11,464 14,303 33,368 33,076 (1)
DLF 6,320 6,690 6,120 6,780 3,150 5,410 6,450 19,130 15,010 (22)
Collections (Rs mn) 42,629 45,688 48,336 53,134 23,289 37,315 48,871 136,652 109,475 (20)
Sales (mn sq. ft)
Oberoi 0.24 0.14 0.16 0.13 0.01 0.13 0.51 0.53 0.65 22
Sunteck 0.16 0.08 0.19 1.43 0.13 0.18 0.33 0.43 0.65 52
Godrej 1.35 2.26 1.63 3.61 2.51 1.73 2.40 5.23 6.64 27
Brigade 1.13 1.00 1.08 1.05 0.42 0.99 1.53 3.21 2.94 (8)
Sobha 1.06 1.04 1.07 0.91 0.65 0.89 1.13 3.17 2.68 (15)
Prestige 1.49 1.46 1.61 2.05 0.65 1.77 2.98 4.56 5.40 18
Sales (mn sq. ft) 5.44 5.97 5.73 9.18 4.38 5.69 8.88 17.13 18.96 11
Realizations (Rs/sq. ft)
Oberoi 16,714 23,148 19,549 18,066 19,662 25,131 19,022 19,215 20,252 5
Sunteck 11,384 13,480 17,389 4,248 7,637 10,931 10,535 14,393 10,054 (30)
Godrej 6,648 6,407 7,448 6,600 6,094 6,212 6,207 6,793 6,165 (9)
Brigade 5,241 5,304 5,578 6,178 5,936 5,830 6,022 5,374 5,945 11
Sobha 7,312 6,584 6,811 7,668 7,494 7,737 7,830 6,905 7,717 12
Prestige 6,833 7,029 8,135 5,895 7,092 6,346 6,799 7,356 6,686 (9)
Realizations (Rs/sq. ft) 7,122 6,886 7,822 6,292 6,520 7,011 7,478 8,536 8,183 (4)
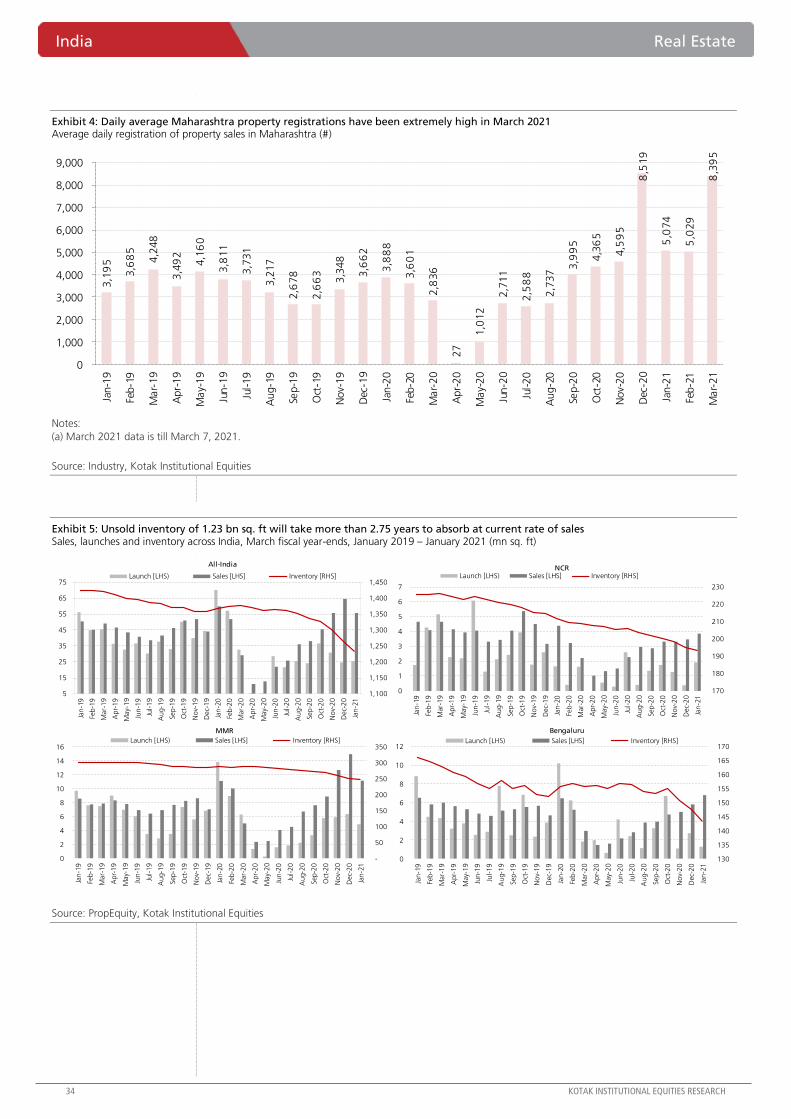
India Real Estate
34 KOTAK INSTITUTIONAL EQUITIES RESEARCH
Exhibit 4: Daily average Maharashtra property registrations have been extremely high in March 2021 Average daily registration of property sales in Maharashtra (#)
Notes: (a) March 2021 data is till March 7, 2021.
Source: Industry, Kotak Institutional Equities
Exhibit 5: Unsold inventory of 1.23 bn sq. ft will take more than 2.75 years to absorb at current rate of sales Sales, launches and inventory across India, March fiscal year-ends, January 2019 – January 2021 (mn sq. ft)
Source: PropEquity, Kotak Institutional Equities
3,1
95
3,6
85
4,2
48
3,4
92
4,1
60
3,8
11
3,7
31
3,2
17
2,6
78
2,6
63
3,3
48
3,6
62
3,8
88
3,6
01
2,8
36
27
1,0
12
2,7
11
2,5
88
2,7
37 3
,99
5
4,3
65
4,5
95
8,5
19
5,0
74
5,0
29
8,3
95
0
1,000
2,000
3,000
4,000
5,000
6,000
7,000
8,000
9,000
Jan-1
9
Feb-1
9
Mar-
19
Apr-
19
May-
19
Jun-1
9
Jul-19
Aug-1
9
Sep-1
9
Oct
-19
Nov-
19
Dec
-19
Jan-2
0
Feb-2
0
Mar-
20
Apr-
20
May-
20
Jun-2
0
Jul-20
Aug-2
0
Sep-2
0
Oct
-20
Nov-
20
Dec
-20
Jan-2
1
Feb-2
1
Mar-
21
1,100
1,150
1,200
1,250
1,300
1,350
1,400
1,450
5
15
25
35
45
55
65
75
Jan
-19
Feb
-19
Mar-
19
Ap
r-1
9
May-
19
Jun
-19
Jul-
19
Au
g-1
9
Sep
-19
Oct
-19
No
v-1
9
Dec-
19
Jan
-20
Feb
-20
Mar-
20
Ap
r-2
0
May-
20
Jun
-20
Jul-
20
Au
g-2
0
Sep
-20
Oct
-20
No
v-2
0
Dec-
20
Jan
-21
All-India
Launch [LHS) Sales [LHS] Inventory [RHS]
170
180
190
200
210
220
230
0
1
2
3
4
5
6
7
Jan
-19
Feb
-19
Mar-
19
Ap
r-1
9
May-
19
Jun
-19
Jul-
19
Au
g-1
9
Sep
-19
Oct
-19
No
v-1
9
Dec-
19
Jan
-20
Feb
-20
Mar-
20
Ap
r-2
0
May-
20
Jun
-20
Jul-
20
Au
g-2
0
Sep
-20
Oct
-20
No
v-2
0
Dec-
20
Jan
-21
NCRLaunch [LHS) Sales [LHS] Inventory [RHS]
-
50
100
150
200
250
300
350
0
2
4
6
8
10
12
14
16
Jan
-19
Feb
-19
Mar-
19
Ap
r-1
9
May-
19
Jun
-19
Jul-
19
Au
g-1
9
Sep
-19
Oct
-19
No
v-1
9
Dec-
19
Jan
-20
Feb
-20
Mar-
20
Ap
r-2
0
May-
20
Jun
-20
Jul-
20
Au
g-2
0
Sep
-20
Oct
-20
No
v-2
0
Dec-
20
Jan
-21
MMR
Launch [LHS) Sales [LHS] Inventory [RHS]
130
135
140
145
150
155
160
165
170
0
2
4
6
8
10
12
Jan
-19
Feb
-19
Mar-
19
Ap
r-1
9
May-
19
Jun
-19
Jul-
19
Au
g-1
9
Sep
-19
Oct
-19
No
v-1
9
Dec-
19
Jan
-20
Feb
-20
Mar-
20
Ap
r-2
0
May-
20
Jun
-20
Jul-
20
Au
g-2
0
Sep
-20
Oct
-20
No
v-2
0
Dec-
20
Jan
-21
Bengaluru
Launch [LHS) Sales [LHS] Inventory [RHS]
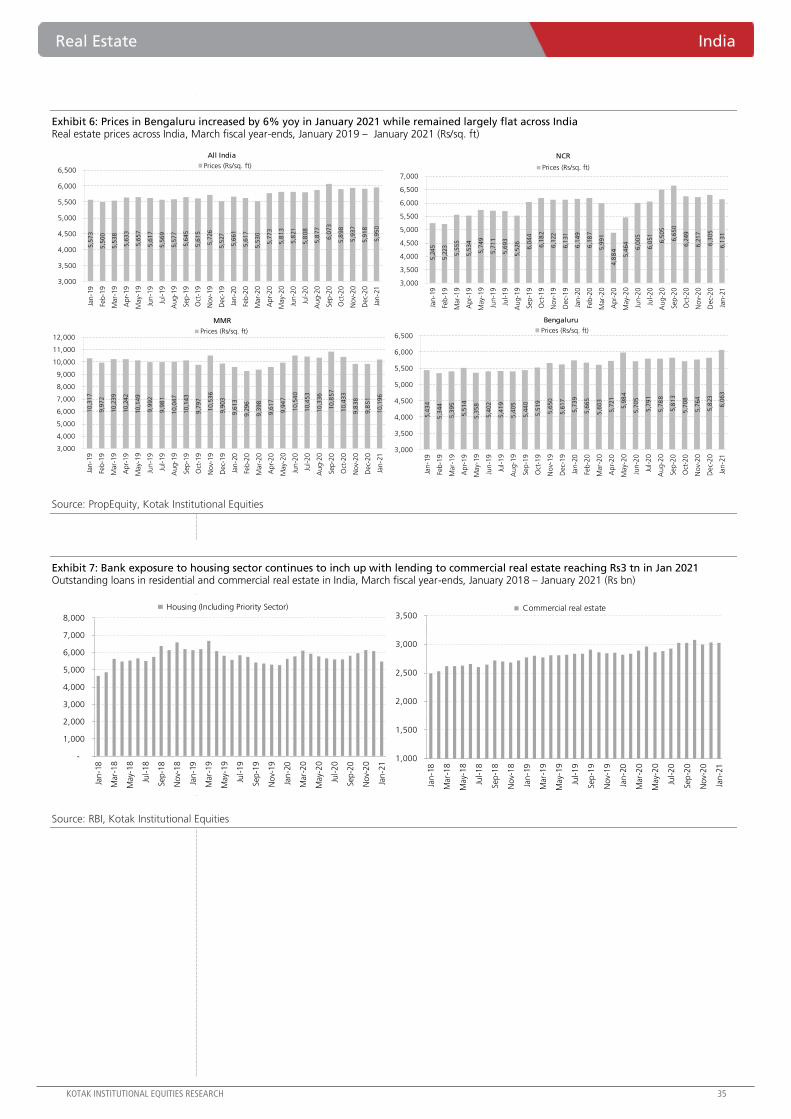
Real Estate India
KOTAK INSTITUTIONAL EQUITIES RESEARCH 35
Exhibit 6: Prices in Bengaluru increased by 6% yoy in January 2021 while remained largely flat across India Real estate prices across India, March fiscal year-ends, January 2019 – January 2021 (Rs/sq. ft)
Source: PropEquity, Kotak Institutional Equities
Exhibit 7: Bank exposure to housing sector continues to inch up with lending to commercial real estate reaching Rs3 tn in Jan 2021 Outstanding loans in residential and commercial real estate in India, March fiscal year-ends, January 2018 – January 2021 (Rs bn)
Source: RBI, Kotak Institutional Equities
5,5
73
5,5
00
5,5
38
5,6
33
5,6
57
5,6
17
5,5
69
5,5
77
5,6
45
5,6
15
5,7
26
5,5
27
5,6
61
5,6
17
5,5
30
5,7
73
5,8
13
5,8
21
5,8
08
5,8
77
6,0
73
5,8
98
5,9
37
5,9
18
5,9
50
3,000
3,500
4,000
4,500
5,000
5,500
6,000
6,500
Jan
-19
Feb
-19
Mar-
19
Ap
r-1
9
May-
19
Jun
-19
Jul-
19
Au
g-1
9
Sep
-19
Oct
-19
No
v-1
9
Dec-
19
Jan
-20
Feb
-20
Mar-
20
Ap
r-2
0
May-
20
Jun
-20
Jul-
20
Au
g-2
0
Sep
-20
Oct
-20
No
v-2
0
Dec-
20
Jan
-21
All India
Prices (Rs/sq. ft)
5,2
45
5,2
23
5,5
55
5,5
34
5,7
49
5,7
11
5,6
93
5,5
26
6,0
44
6,1
82
6,1
22
6,1
31
6,1
49
6,1
87
5,9
91
4,8
84
5,4
64
6,0
05
6,0
51
6,5
05
6,6
50
6,2
49
6,2
17
6,3
05
6,1
31
3,000
3,500
4,000
4,500
5,000
5,500
6,000
6,500
7,000
Jan
-19
Feb
-19
Mar-
19
Ap
r-1
9
May-
19
Jun
-19
Jul-
19
Au
g-1
9
Sep
-19
Oct
-19
No
v-1
9
Dec-
19
Jan
-20
Feb
-20
Mar-
20
Ap
r-2
0
May-
20
Jun
-20
Jul-
20
Au
g-2
0
Sep
-20
Oct
-20
No
v-2
0
Dec-
20
Jan
-21
NCR
Prices (Rs/sq. ft)
10
,31
7
9,9
72
10
,23
9
10
,24
2
10
,14
9
9,9
92
9,9
81
10
,04
7
10
,14
3
9,7
97
10
,53
6
9,9
03
9,6
13
9,2
96
9,3
98
9,6
17
9,9
47
10
,54
0
10
,45
3
10
,33
6
10
,85
7
10
,43
3
9,8
38
9,8
51
10
,19
6
3,000
4,000
5,000
6,000
7,000
8,000
9,000
10,000
11,000
12,000
Jan
-19
Feb
-19
Mar-
19
Ap
r-1
9
May-
19
Jun
-19
Jul-
19
Au
g-1
9
Sep
-19
Oct
-19
No
v-1
9
Dec-
19
Jan
-20
Feb
-20
Mar-
20
Ap
r-2
0
May-
20
Jun
-20
Jul-
20
Au
g-2
0
Sep
-20
Oct
-20
No
v-2
0
Dec-
20
Jan
-21
MMR
Prices (Rs/sq. ft)
5,4
34
5,3
44
5,3
95
5,5
14
5,3
58
5,4
02
5,4
19
5,4
05
5,4
40
5,5
19
5,6
50
5,6
17
5,7
39
5,6
65
5,6
03
5,7
21
5,9
84
5,7
05
5,7
91
5,7
88
5,8
13
5,7
08
5,7
64
5,8
23
6,0
63
3,000
3,500
4,000
4,500
5,000
5,500
6,000
6,500
Jan
-19
Feb
-19
Mar-
19
Ap
r-1
9
May-
19
Jun
-19
Jul-
19
Au
g-1
9
Sep
-19
Oct
-19
No
v-1
9
Dec-
19
Jan
-20
Feb
-20
Mar-
20
Ap
r-2
0
May-
20
Jun
-20
Jul-
20
Au
g-2
0
Sep
-20
Oct
-20
No
v-2
0
Dec-
20
Jan
-21
Bengaluru
Prices (Rs/sq. ft)
HDFC's new home-loan rates versus 10 year AAA bond yield, Aug 2010 - Aug 2020 (%)
-
1,000
2,000
3,000
4,000
5,000
6,000
7,000
8,000
Jan
-18
Mar-
18
May-
18
Jul-
18
Sep
-18
No
v-1
8
Jan
-19
Mar-
19
May-
19
Jul-
19
Sep
-19
No
v-1
9
Jan
-20
Mar-
20
May-
20
Jul-
20
Sep
-20
No
v-2
0
Jan
-21
Housing (Including Priority Sector)
1,000
1,500
2,000
2,500
3,000
3,500
Jan
-18
Mar-
18
May-
18
Jul-
18
Sep
-18
No
v-1
8
Jan
-19
Mar-
19
May-
19
Jul-
19
Sep
-19
No
v-1
9
Jan
-20
Mar-
20
May-
20
Jul-
20
Sep
-20
No
v-2
0
Jan
-21
Commercial real estate
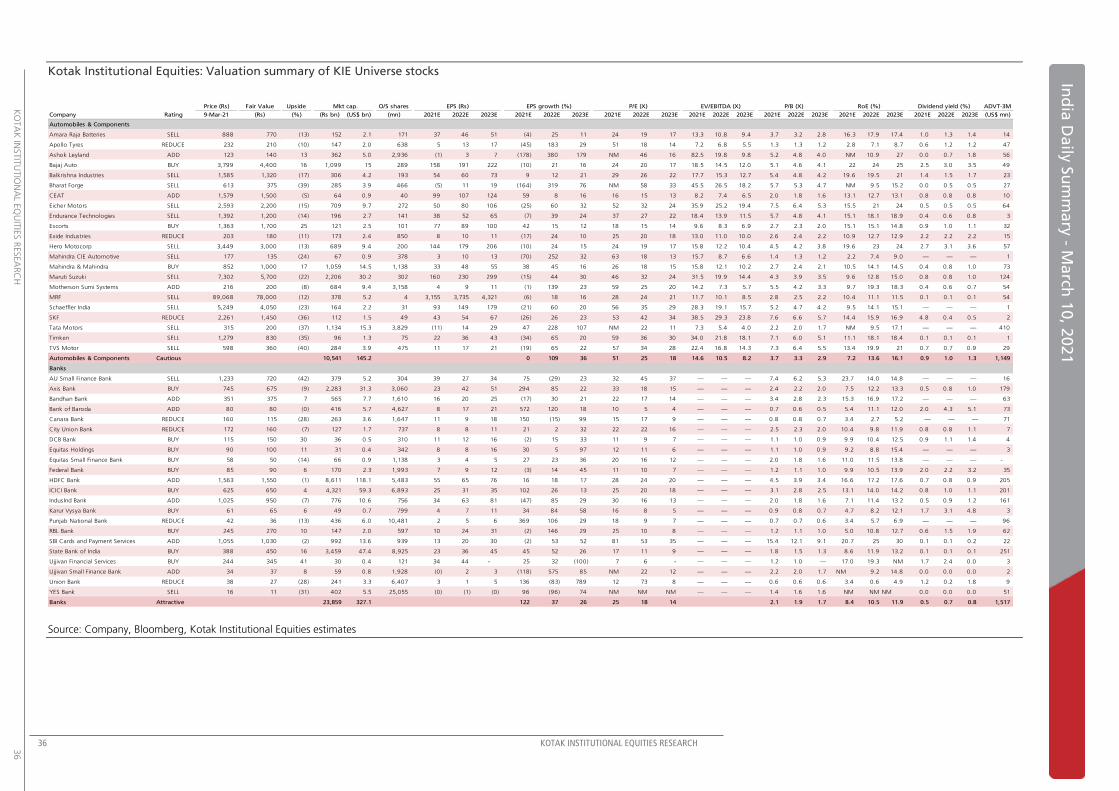
36 KOTAK INSTITUTIONAL EQUITIES RESEARCH
K
OTA
K IN
STIT
UTIO
NA
L EQ
UIT
IES R
ESEA
RC
H
36
Ind
ia D
aily
Su
mm
ary
- Ma
rch 1
0, 2
021
Kotak Institutional Equities: Valuation summary of KIE Universe stocks
Source: Company, Bloomberg, Kotak Institutional Equities estimates
Price (Rs) Fair Value Upside Mkt cap. O/S shares EPS (Rs) EPS growth (%) P/E (X) EV/EBITDA (X) ADVT-3M
Company Rating 9-Mar-21 (Rs) (%) (Rs bn) (US$ bn) (mn) 2021E 2022E 2023E 2021E 2022E 2023E 2021E 2022E 2023E 2021E 2022E 2023E 2021E 2022E 2023E 2021E 2022E 2023E 2021E 2022E 2023E (US$ mn)
Automobiles & Components
Amara Raja Batteries SELL 888 770 (13) 152 2.1 171 37 46 51 (4) 25 11 24 19 17 13.3 10.8 9.4 3.7 3.2 2.8 16.3 17.9 17.4 1.0 1.3 1.4 14
Apollo Tyres REDUCE 232 210 (10) 147 2.0 638 5 13 17 (45) 183 29 51 18 14 7.2 6.8 5.5 1.3 1.3 1.2 2.8 7.1 8.7 0.6 1.2 1.2 47
Ashok Leyland ADD 123 140 13 362 5.0 2,936 (1) 3 7 (178) 380 179 NM 46 16 82.5 19.8 9.8 5.2 4.8 4.0 NM 10.9 27 0.0 0.7 1.8 56
Bajaj Auto BUY 3,799 4,400 16 1,099 15 289 158 191 222 (10) 21 16 24 20 17 18.5 14.5 12.0 5.1 4.6 4.1 22 24 25 2.5 3.0 3.5 49
Balkrishna Industries SELL 1,585 1,320 (17) 306 4.2 193 54 60 73 9 12 21 29 26 22 17.7 15.3 12.7 5.4 4.8 4.2 19.6 19.5 21 1.4 1.5 1.7 23
Bharat Forge SELL 613 375 (39) 285 3.9 466 (5) 11 19 (164) 319 76 NM 58 33 45.5 26.5 18.2 5.7 5.3 4.7 NM 9.5 15.2 0.0 0.5 0.5 27
CEAT ADD 1,579 1,500 (5) 64 0.9 40 99 107 124 59 8 16 16 15 13 8.2 7.4 6.5 2.0 1.8 1.6 13.1 12.7 13.1 0.8 0.8 0.8 10
Eicher Motors SELL 2,593 2,200 (15) 709 9.7 272 50 80 106 (25) 60 32 52 32 24 35.9 25.2 19.4 7.5 6.4 5.3 15.5 21 24 0.5 0.5 0.5 64
Endurance Technologies SELL 1,392 1,200 (14) 196 2.7 141 38 52 65 (7) 39 24 37 27 22 18.4 13.9 11.5 5.7 4.8 4.1 15.1 18.1 18.9 0.4 0.6 0.8 3
Escorts BUY 1,363 1,700 25 121 2.5 101 77 89 100 42 15 12 18 15 14 9.6 8.3 6.9 2.7 2.3 2.0 15.1 15.1 14.8 0.9 1.0 1.1 32
Exide Industries REDUCE 203 180 (11) 173 2.4 850 8 10 11 (17) 24 10 25 20 18 13.0 11.0 10.0 2.6 2.4 2.2 10.9 12.7 12.9 2.2 2.2 2.2 15
Hero Motocorp SELL 3,449 3,000 (13) 689 9.4 200 144 179 206 (10) 24 15 24 19 17 15.8 12.2 10.4 4.5 4.2 3.8 19.6 23 24 2.7 3.1 3.6 57
Mahindra CIE Automotive SELL 177 135 (24) 67 0.9 378 3 10 13 (70) 252 32 63 18 13 15.7 8.7 6.6 1.4 1.3 1.2 2.2 7.4 9.0 — — — 1
Mahindra & Mahindra BUY 852 1,000 17 1,059 14.5 1,138 33 48 55 38 45 16 26 18 15 15.8 12.1 10.2 2.7 2.4 2.1 10.5 14.1 14.5 0.4 0.8 1.0 73
Maruti Suzuki SELL 7,302 5,700 (22) 2,206 30.2 302 160 230 299 (15) 44 30 46 32 24 31.5 19.9 14.4 4.3 3.9 3.5 9.6 12.8 15.0 0.8 0.8 1.0 124
Motherson Sumi Systems ADD 216 200 (8) 684 9.4 3,158 4 9 11 (1) 139 23 59 25 20 14.2 7.3 5.7 5.5 4.2 3.3 9.7 19.3 18.3 0.4 0.6 0.7 54
MRF SELL 89,068 78,000 (12) 378 5.2 4 3,155 3,735 4,321 (6) 18 16 28 24 21 11.7 10.1 8.5 2.8 2.5 2.2 10.4 11.1 11.5 0.1 0.1 0.1 54
Schaeffler India SELL 5,249 4,050 (23) 164 2.2 31 93 149 179 (21) 60 20 56 35 29 28.3 19.1 15.7 5.2 4.7 4.2 9.5 14.1 15.1 — — — 1
SKF REDUCE 2,261 1,450 (36) 112 1.5 49 43 54 67 (26) 26 23 53 42 34 38.5 29.3 23.8 7.6 6.6 5.7 14.4 15.9 16.9 4.8 0.4 0.5 2
Tata Motors SELL 315 200 (37) 1,134 15.3 3,829 (11) 14 29 47 228 107 NM 22 11 7.3 5.4 4.0 2.2 2.0 1.7 NM 9.5 17.1 — — — 410
Timken SELL 1,279 830 (35) 96 1.3 75 22 36 43 (34) 65 20 59 36 30 34.0 21.8 18.1 7.1 6.0 5.1 11.1 18.1 18.4 0.1 0.1 0.1 1
TVS Motor SELL 598 360 (40) 284 3.9 475 11 17 21 (19) 65 22 57 34 28 22.4 16.8 14.3 7.3 6.4 5.5 13.4 19.9 21 0.7 0.7 0.9 29
Automobiles & Components Cautious 10,541 145.2 0 109 36 51 25 18 14.6 10.5 8.2 3.7 3.3 2.9 7.2 13.6 16.1 0.9 1.0 1.3 1,149
Banks
AU Small Finance Bank SELL 1,233 720 (42) 379 5.2 304 39 27 34 75 (29) 23 32 45 37 — — — 7.4 6.2 5.3 23.7 14.0 14.8 — — — 16
Axis Bank BUY 745 675 (9) 2,283 31.3 3,060 23 42 51 294 85 22 33 18 15 — — — 2.4 2.2 2.0 7.5 12.2 13.3 0.5 0.8 1.0 179
Bandhan Bank ADD 351 375 7 565 7.7 1,610 16 20 25 (17) 30 21 22 17 14 — — — 3.4 2.8 2.3 15.3 16.9 17.2 — — — 63
Bank of Baroda ADD 80 80 (0) 416 5.7 4,627 8 17 21 572 120 18 10 5 4 — — — 0.7 0.6 0.5 5.4 11.1 12.0 2.0 4.3 5.1 73
Canara Bank REDUCE 160 115 (28) 263 3.6 1,647 11 9 18 150 (15) 99 15 17 9 — — — 0.8 0.8 0.7 3.4 2.7 5.2 — — — 71
City Union Bank REDUCE 172 160 (7) 127 1.7 737 8 8 11 21 2 32 22 22 16 — — — 2.5 2.3 2.0 10.4 9.8 11.9 0.8 0.8 1.1 7
DCB Bank BUY 115 150 30 36 0.5 310 11 12 16 (2) 15 33 11 9 7 — — — 1.1 1.0 0.9 9.9 10.4 12.5 0.9 1.1 1.4 4
Equitas Holdings BUY 90 100 11 31 0.4 342 8 8 16 30 5 97 12 11 6 — — — 1.1 1.0 0.9 9.2 8.8 15.4 — — — 3
Equitas Small Finance Bank BUY 58 50 (14) 66 0.9 1,138 3 4 5 27 23 36 20 16 12 — — — 2.0 1.8 1.6 11.0 11.5 13.8 — — — -
Federal Bank BUY 85 90 6 170 2.3 1,993 7 9 12 (3) 14 45 11 10 7 — — — 1.2 1.1 1.0 9.9 10.5 13.9 2.0 2.2 3.2 35
HDFC Bank ADD 1,563 1,550 (1) 8,611 118.1 5,483 55 65 76 16 18 17 28 24 20 — — — 4.5 3.9 3.4 16.6 17.2 17.6 0.7 0.8 0.9 205
ICICI Bank BUY 625 650 4 4,321 59.3 6,893 25 31 35 102 26 13 25 20 18 — — — 3.1 2.8 2.5 13.1 14.0 14.2 0.8 1.0 1.1 201
IndusInd Bank ADD 1,025 950 (7) 776 10.6 756 34 63 81 (47) 85 29 30 16 13 — — — 2.0 1.8 1.6 7.1 11.4 13.2 0.5 0.9 1.2 161
Karur Vysya Bank BUY 61 65 6 49 0.7 799 4 7 11 34 84 58 16 8 5 — — — 0.9 0.8 0.7 4.7 8.2 12.1 1.7 3.1 4.8 3
Punjab National Bank REDUCE 42 36 (13) 436 6.0 10,481 2 5 6 369 106 29 18 9 7 — — — 0.7 0.7 0.6 3.4 5.7 6.9 — — — 96
RBL Bank BUY 245 270 10 147 2.0 597 10 24 31 (2) 146 29 25 10 8 — — — 1.2 1.1 1.0 5.0 10.8 12.7 0.6 1.5 1.9 62
SBI Cards and Payment Services ADD 1,055 1,030 (2) 992 13.6 939 13 20 30 (2) 53 52 81 53 35 — — — 15.4 12.1 9.1 20.7 25 30 0.1 0.1 0.2 22
State Bank of India BUY 388 450 16 3,459 47.4 8,925 23 36 45 45 52 26 17 11 9 — — — 1.8 1.5 1.3 8.6 11.9 13.2 0.1 0.1 0.1 251
Ujjivan Financial Services BUY 244 345 41 30 0.4 121 34 44 - 25 32 (100) 7 6 - — — — 1.2 1.0 — 17.0 19.3 NM 1.7 2.4 0.0 3
Ujjivan Small Finance Bank ADD 34 37 8 59 0.8 1,928 (0) 2 3 (118) 575 85 NM 22 12 — — — 2.2 2.0 1.7 NM 9.2 14.8 0.0 0.0 0.0 2
Union Bank REDUCE 38 27 (28) 241 3.3 6,407 3 1 5 136 (83) 789 12 73 8 — — — 0.6 0.6 0.6 3.4 0.6 4.9 1.2 0.2 1.8 9
YES Bank SELL 16 11 (31) 402 5.5 25,055 (0) (1) (0) 96 (96) 74 NM NM NM — — — 1.4 1.6 1.6 NM NM NM 0.0 0.0 0.0 51
Banks Attractive 23,859 327.1 122 37 26 25 18 14 2.1 1.9 1.7 8.4 10.5 11.9 0.5 0.7 0.8 1,517
P/B (X) RoE (%) Dividend yield (%)
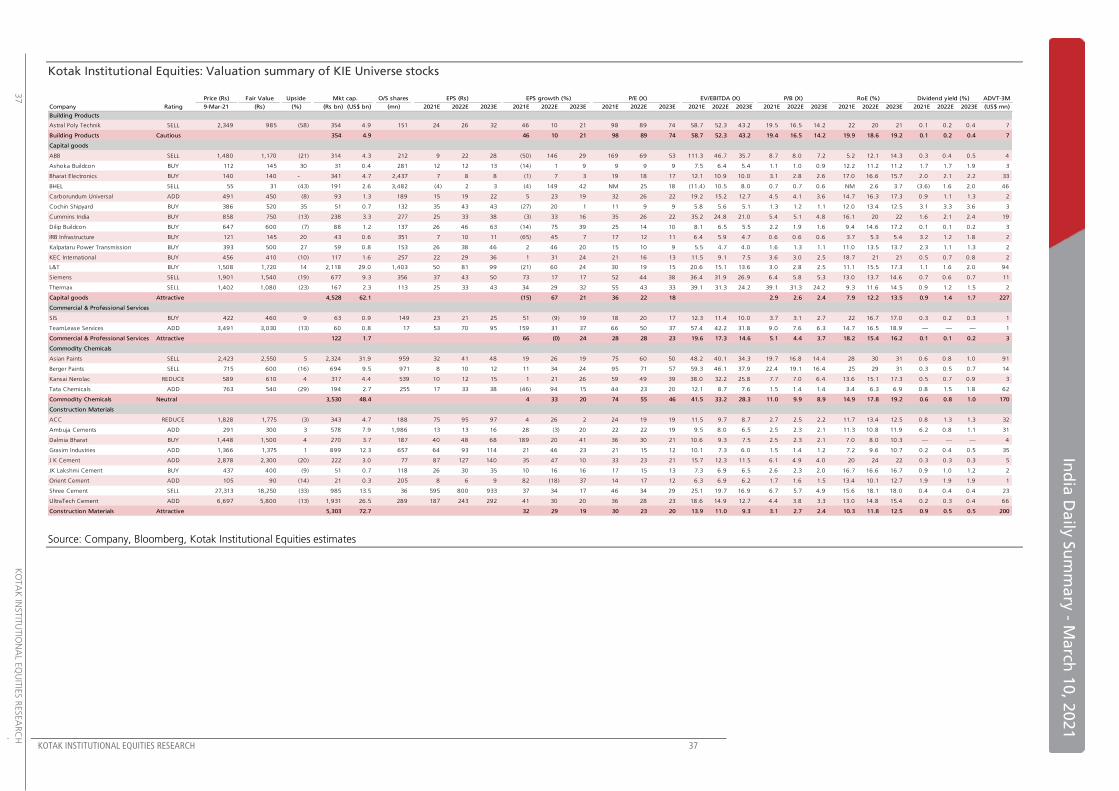
KOTAK INSTITUTIONAL EQUITIES RESEARCH 37
In
dia
Da
ily S
um
ma
ry - M
arch
10
, 20
21
37
K
OTA
K IN
STIT
UTIO
NA
L EQ
UIT
IES R
ESEA
RC
H
Kotak Institutional Equities: Valuation summary of KIE Universe stocks
Source: Company, Bloomberg, Kotak Institutional Equities estimates
Price (Rs) Fair Value Upside Mkt cap. O/S shares EPS (Rs) EPS growth (%) P/E (X) EV/EBITDA (X) ADVT-3M
Company Rating 9-Mar-21 (Rs) (%) (Rs bn) (US$ bn) (mn) 2021E 2022E 2023E 2021E 2022E 2023E 2021E 2022E 2023E 2021E 2022E 2023E 2021E 2022E 2023E 2021E 2022E 2023E 2021E 2022E 2023E (US$ mn)
Building Products
Astral Poly Technik SELL 2,349 985 (58) 354 4.9 151 24 26 32 46 10 21 98 89 74 58.7 52.3 43.2 19.5 16.5 14.2 22 20 21 0.1 0.2 0.4 7
Building Products Cautious 354 4.9 46 10 21 98 89 74 58.7 52.3 43.2 19.4 16.5 14.2 19.9 18.6 19.2 0.1 0.2 0.4 7
Capital goods
ABB SELL 1,480 1,170 (21) 314 4.3 212 9 22 28 (50) 146 29 169 69 53 111.3 46.7 35.7 8.7 8.0 7.2 5.2 12.1 14.3 0.3 0.4 0.5 4
Ashoka Buildcon BUY 112 145 30 31 0.4 281 12 12 13 (14) 1 9 9 9 9 7.5 6.4 5.4 1.1 1.0 0.9 12.2 11.2 11.2 1.7 1.7 1.9 3
Bharat Electronics BUY 140 140 - 341 4.7 2,437 7 8 8 (1) 7 3 19 18 17 12.1 10.9 10.0 3.1 2.8 2.6 17.0 16.6 15.7 2.0 2.1 2.2 33
BHEL SELL 55 31 (43) 191 2.6 3,482 (4) 2 3 (4) 149 42 NM 25 18 (11.4) 10.5 8.0 0.7 0.7 0.6 NM 2.6 3.7 (3.6) 1.6 2.0 46
Carborundum Universal ADD 491 450 (8) 93 1.3 189 15 19 22 5 23 19 32 26 22 19.2 15.2 12.7 4.5 4.1 3.6 14.7 16.3 17.3 0.9 1.1 1.3 2
Cochin Shipyard BUY 386 520 35 51 0.7 132 35 43 43 (27) 20 1 11 9 9 5.8 5.6 5.1 1.3 1.2 1.1 12.0 13.4 12.5 3.1 3.3 3.6 3
Cummins India BUY 858 750 (13) 238 3.3 277 25 33 38 (3) 33 16 35 26 22 35.2 24.8 21.0 5.4 5.1 4.8 16.1 20 22 1.6 2.1 2.4 19
Dilip Buildcon BUY 647 600 (7) 88 1.2 137 26 46 63 (14) 75 39 25 14 10 8.1 6.5 5.5 2.2 1.9 1.6 9.4 14.6 17.2 0.1 0.1 0.2 3
IRB Infrastructure BUY 121 145 20 43 0.6 351 7 10 11 (65) 45 7 17 12 11 6.4 5.9 4.7 0.6 0.6 0.6 3.7 5.3 5.4 3.2 1.2 1.8 2
Kalpataru Power Transmission BUY 393 500 27 59 0.8 153 26 38 46 2 46 20 15 10 9 5.5 4.7 4.0 1.6 1.3 1.1 11.0 13.5 13.7 2.3 1.1 1.3 2
KEC International BUY 456 410 (10) 117 1.6 257 22 29 36 1 31 24 21 16 13 11.5 9.1 7.5 3.6 3.0 2.5 18.7 21 21 0.5 0.7 0.8 2
L&T BUY 1,508 1,720 14 2,118 29.0 1,403 50 81 99 (21) 60 24 30 19 15 20.6 15.1 13.6 3.0 2.8 2.5 11.1 15.5 17.3 1.1 1.6 2.0 94
Siemens SELL 1,901 1,540 (19) 677 9.3 356 37 43 50 73 17 17 52 44 38 36.4 31.9 26.9 6.4 5.8 5.3 13.0 13.7 14.6 0.7 0.6 0.7 11
Thermax SELL 1,402 1,080 (23) 167 2.3 113 25 33 43 34 29 32 55 43 33 39.1 31.3 24.2 39.1 31.3 24.2 9.3 11.6 14.5 0.9 1.2 1.5 2
Capital goods Attractive 4,528 62.1 (15) 67 21 36 22 18 2.9 2.6 2.4 7.9 12.2 13.5 0.9 1.4 1.7 227
Commercial & Professional Services
SIS BUY 422 460 9 63 0.9 149 23 21 25 51 (9) 19 18 20 17 12.3 11.4 10.0 3.7 3.1 2.7 22 16.7 17.0 0.3 0.2 0.3 1
TeamLease Services ADD 3,491 3,030 (13) 60 0.8 17 53 70 95 159 31 37 66 50 37 57.4 42.2 31.8 9.0 7.6 6.3 14.7 16.5 18.9 — — — 1
Commercial & Professional Services Attractive 122 1.7 66 (0) 24 28 28 23 19.6 17.3 14.6 5.1 4.4 3.7 18.2 15.4 16.2 0.1 0.1 0.2 3
Commodity Chemicals
Asian Paints SELL 2,423 2,550 5 2,324 31.9 959 32 41 48 19 26 19 75 60 50 48.2 40.1 34.3 19.7 16.8 14.4 28 30 31 0.6 0.8 1.0 91
Berger Paints SELL 715 600 (16) 694 9.5 971 8 10 12 11 34 24 95 71 57 59.3 46.1 37.9 22.4 19.1 16.4 25 29 31 0.3 0.5 0.7 14
Kansai Nerolac REDUCE 589 610 4 317 4.4 539 10 12 15 1 21 26 59 49 39 38.0 32.2 25.8 7.7 7.0 6.4 13.6 15.1 17.3 0.5 0.7 0.9 3
Tata Chemicals ADD 763 540 (29) 194 2.7 255 17 33 38 (46) 94 15 44 23 20 12.1 8.7 7.6 1.5 1.4 1.4 3.4 6.3 6.9 0.8 1.5 1.8 62
Commodity Chemicals Neutral 3,530 48.4 4 33 20 74 55 46 41.5 33.2 28.3 11.0 9.9 8.9 14.9 17.8 19.2 0.6 0.8 1.0 170
Construction Materials
ACC REDUCE 1,828 1,775 (3) 343 4.7 188 75 95 97 4 26 2 24 19 19 11.5 9.7 8.7 2.7 2.5 2.2 11.7 13.4 12.5 0.8 1.3 1.3 32
Ambuja Cements ADD 291 300 3 578 7.9 1,986 13 13 16 28 (3) 20 22 22 19 9.5 8.0 6.5 2.5 2.3 2.1 11.3 10.8 11.9 6.2 0.8 1.1 31
Dalmia Bharat BUY 1,448 1,500 4 270 3.7 187 40 48 68 189 20 41 36 30 21 10.6 9.3 7.5 2.5 2.3 2.1 7.0 8.0 10.3 — — — 4
Grasim Industries ADD 1,366 1,375 1 899 12.3 657 64 93 114 21 46 23 21 15 12 10.1 7.3 6.0 1.5 1.4 1.2 7.2 9.6 10.7 0.2 0.4 0.5 35
J K Cement ADD 2,878 2,300 (20) 222 3.0 77 87 127 140 35 47 10 33 23 21 15.7 12.3 11.5 6.1 4.9 4.0 20 24 22 0.3 0.3 0.3 5
JK Lakshmi Cement BUY 437 400 (9) 51 0.7 118 26 30 35 10 16 16 17 15 13 7.3 6.9 6.5 2.6 2.3 2.0 16.7 16.6 16.7 0.9 1.0 1.2 2
Orient Cement ADD 105 90 (14) 21 0.3 205 8 6 9 82 (18) 37 14 17 12 6.3 6.9 6.2 1.7 1.6 1.5 13.4 10.1 12.7 1.9 1.9 1.9 1
Shree Cement SELL 27,313 18,250 (33) 985 13.5 36 595 800 933 37 34 17 46 34 29 25.1 19.7 16.9 6.7 5.7 4.9 15.6 18.1 18.0 0.4 0.4 0.4 23
UltraTech Cement ADD 6,697 5,800 (13) 1,931 26.5 289 187 243 292 41 30 20 36 28 23 18.6 14.9 12.7 4.4 3.8 3.3 13.0 14.8 15.4 0.2 0.3 0.4 66
Construction Materials Attractive 5,303 72.7 32 29 19 30 23 20 13.9 11.0 9.3 3.1 2.7 2.4 10.3 11.8 12.5 0.9 0.5 0.5 200
P/B (X) RoE (%) Dividend yield (%)
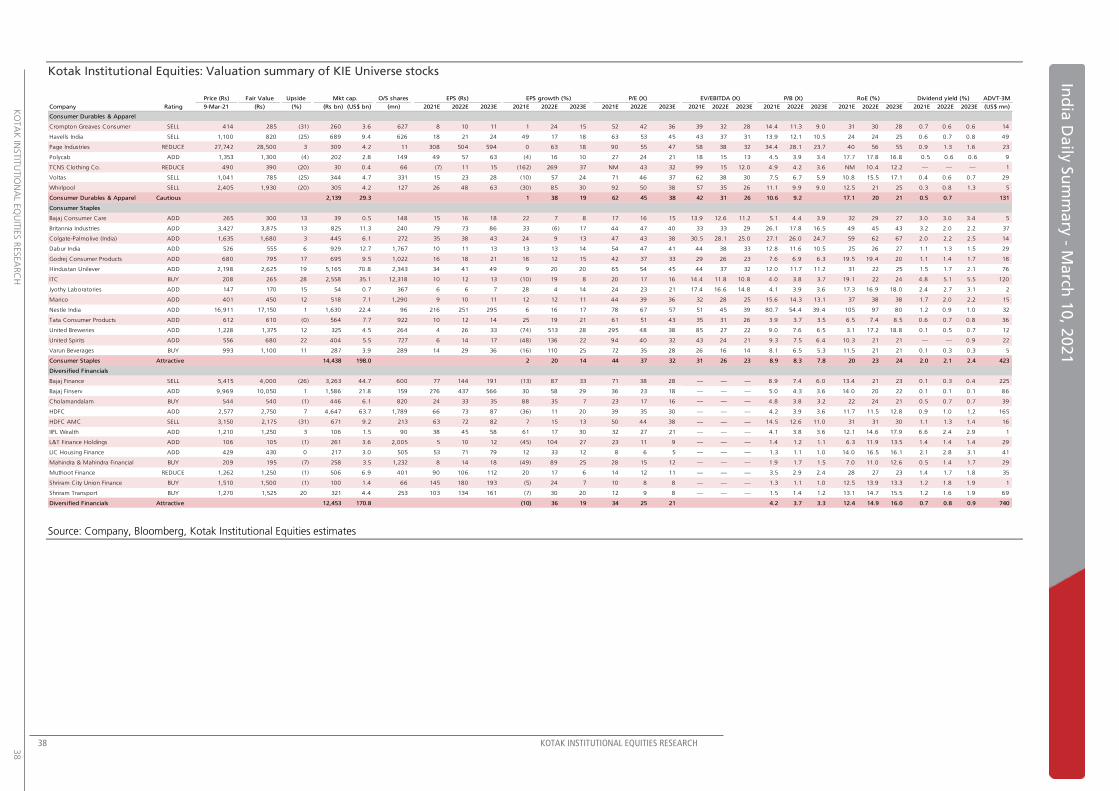
38 KOTAK INSTITUTIONAL EQUITIES RESEARCH
K
OTA
K IN
STIT
UTIO
NA
L EQ
UIT
IES R
ESEA
RC
H
38
Ind
ia D
aily
Su
mm
ary
- Ma
rch 1
0, 2
021
Kotak Institutional Equities: Valuation summary of KIE Universe stocks
Source: Company, Bloomberg, Kotak Institutional Equities estimates
Price (Rs) Fair Value Upside Mkt cap. O/S shares EPS (Rs) EPS growth (%) P/E (X) EV/EBITDA (X) ADVT-3M
Company Rating 9-Mar-21 (Rs) (%) (Rs bn) (US$ bn) (mn) 2021E 2022E 2023E 2021E 2022E 2023E 2021E 2022E 2023E 2021E 2022E 2023E 2021E 2022E 2023E 2021E 2022E 2023E 2021E 2022E 2023E (US$ mn)
Consumer Durables & Apparel
Crompton Greaves Consumer SELL 414 285 (31) 260 3.6 627 8 10 11 1 24 15 52 42 36 39 32 28 14.4 11.3 9.0 31 30 28 0.7 0.6 0.6 14
Havells India SELL 1,100 820 (25) 689 9.4 626 18 21 24 49 17 18 63 53 45 43 37 31 13.9 12.1 10.5 24 24 25 0.6 0.7 0.8 49
Page Industries REDUCE 27,742 28,500 3 309 4.2 11 308 504 594 0 63 18 90 55 47 58 38 32 34.4 28.1 23.7 40 56 55 0.9 1.3 1.6 23
Polycab ADD 1,353 1,300 (4) 202 2.8 149 49 57 63 (4) 16 10 27 24 21 18 15 13 4.5 3.9 3.4 17.7 17.8 16.8 0.5 0.6 0.6 9
TCNS Clothing Co. REDUCE 490 390 (20) 30 0.4 66 (7) 11 15 (162) 269 37 NM 43 32 99 15 12.0 4.9 4.2 3.6 NM 10.4 12.2 — — — 1
Voltas SELL 1,041 785 (25) 344 4.7 331 15 23 28 (10) 57 24 71 46 37 62 38 30 7.5 6.7 5.9 10.8 15.5 17.1 0.4 0.6 0.7 29
Whirlpool SELL 2,405 1,930 (20) 305 4.2 127 26 48 63 (30) 85 30 92 50 38 57 35 26 11.1 9.9 9.0 12.5 21 25 0.3 0.8 1.3 5
Consumer Durables & Apparel Cautious 2,139 29.3 1 38 19 62 45 38 42 31 26 10.6 9.2 17.1 20 21 0.5 0.7 131
Consumer Staples
Bajaj Consumer Care ADD 265 300 13 39 0.5 148 15 16 18 22 7 8 17 16 15 13.9 12.6 11.2 5.1 4.4 3.9 32 29 27 3.0 3.0 3.4 5
Britannia Industries ADD 3,427 3,875 13 825 11.3 240 79 73 86 33 (6) 17 44 47 40 33 33 29 26.1 17.8 16.5 49 45 43 3.2 2.0 2.2 37
Colgate-Palmolive (India) ADD 1,635 1,680 3 445 6.1 272 35 38 43 24 9 13 47 43 38 30.5 28.1 25.0 27.1 26.0 24.7 59 62 67 2.0 2.2 2.5 14
Dabur India ADD 526 555 6 929 12.7 1,767 10 11 13 13 13 14 54 47 41 44 38 33 12.8 11.6 10.5 25 26 27 1.1 1.3 1.5 29
Godrej Consumer Products ADD 680 795 17 695 9.5 1,022 16 18 21 18 12 15 42 37 33 29 26 23 7.6 6.9 6.3 19.5 19.4 20 1.1 1.4 1.7 18
Hindustan Unilever ADD 2,198 2,625 19 5,165 70.8 2,343 34 41 49 9 20 20 65 54 45 44 37 32 12.0 11.7 11.2 31 22 25 1.5 1.7 2.1 76
ITC BUY 208 265 28 2,558 35.1 12,318 10 12 13 (10) 19 8 20 17 16 14.4 11.8 10.8 4.0 3.8 3.7 19.1 22 24 4.8 5.1 5.5 120
Jyothy Laboratories ADD 147 170 15 54 0.7 367 6 6 7 28 4 14 24 23 21 17.4 16.6 14.8 4.1 3.9 3.6 17.3 16.9 18.0 2.4 2.7 3.1 2
Marico ADD 401 450 12 518 7.1 1,290 9 10 11 12 12 11 44 39 36 32 28 25 15.6 14.3 13.1 37 38 38 1.7 2.0 2.2 15
Nestle India ADD 16,911 17,150 1 1,630 22.4 96 216 251 295 6 16 17 78 67 57 51 45 39 80.7 54.4 39.4 105 97 80 1.2 0.9 1.0 32
Tata Consumer Products ADD 612 610 (0) 564 7.7 922 10 12 14 25 19 21 61 51 43 35 31 26 3.9 3.7 3.5 6.5 7.4 8.5 0.6 0.7 0.8 36
United Breweries ADD 1,228 1,375 12 325 4.5 264 4 26 33 (74) 513 28 295 48 38 85 27 22 9.0 7.6 6.5 3.1 17.2 18.8 0.1 0.5 0.7 12
United Spirits ADD 556 680 22 404 5.5 727 6 14 17 (48) 136 22 94 40 32 43 24 21 9.3 7.5 6.4 10.3 21 21 — — 0.9 22
Varun Beverages BUY 993 1,100 11 287 3.9 289 14 29 36 (16) 110 25 72 35 28 26 16 14 8.1 6.5 5.3 11.5 21 21 0.1 0.3 0.3 5
Consumer Staples Attractive 14,438 198.0 2 20 14 44 37 32 31 26 23 8.9 8.3 7.8 20 23 24 2.0 2.1 2.4 423
Diversified Financials
Bajaj Finance SELL 5,415 4,000 (26) 3,263 44.7 600 77 144 191 (13) 87 33 71 38 28 — — — 8.9 7.4 6.0 13.4 21 23 0.1 0.3 0.4 225
Bajaj Finserv ADD 9,969 10,050 1 1,586 21.8 159 276 437 566 30 58 29 36 23 18 — — — 5.0 4.3 3.6 14.0 20 22 0.1 0.1 0.1 86
Cholamandalam BUY 544 540 (1) 446 6.1 820 24 33 35 88 35 7 23 17 16 — — — 4.8 3.8 3.2 22 24 21 0.5 0.7 0.7 39
HDFC ADD 2,577 2,750 7 4,647 63.7 1,789 66 73 87 (36) 11 20 39 35 30 — — — 4.2 3.9 3.6 11.7 11.5 12.8 0.9 1.0 1.2 165
HDFC AMC SELL 3,150 2,175 (31) 671 9.2 213 63 72 82 7 15 13 50 44 38 — — — 14.5 12.6 11.0 31 31 30 1.1 1.3 1.4 16
IIFL Wealth ADD 1,210 1,250 3 106 1.5 90 38 45 58 61 17 30 32 27 21 — — — 4.1 3.8 3.6 12.1 14.6 17.9 6.6 2.4 2.9 1
L&T Finance Holdings ADD 106 105 (1) 261 3.6 2,005 5 10 12 (45) 104 27 23 11 9 — — — 1.4 1.2 1.1 6.3 11.9 13.5 1.4 1.4 1.4 29
LIC Housing Finance ADD 429 430 0 217 3.0 505 53 71 79 12 33 12 8 6 5 — — — 1.3 1.1 1.0 14.0 16.5 16.1 2.1 2.8 3.1 41
Mahindra & Mahindra Financial BUY 209 195 (7) 258 3.5 1,232 8 14 18 (49) 89 25 28 15 12 — — — 1.9 1.7 1.5 7.0 11.0 12.6 0.5 1.4 1.7 29
Muthoot Finance REDUCE 1,262 1,250 (1) 506 6.9 401 90 106 112 20 17 6 14 12 11 — — — 3.5 2.9 2.4 28 27 23 1.4 1.7 1.8 35
Shriram City Union Finance BUY 1,510 1,500 (1) 100 1.4 66 145 180 193 (5) 24 7 10 8 8 — — — 1.3 1.1 1.0 12.5 13.9 13.3 1.2 1.8 1.9 1
Shriram Transport BUY 1,270 1,525 20 321 4.4 253 103 134 161 (7) 30 20 12 9 8 — — — 1.5 1.4 1.2 13.1 14.7 15.5 1.2 1.6 1.9 69
Diversified Financials Attractive 12,453 170.8 (10) 36 19 34 25 21 4.2 3.7 3.3 12.4 14.9 16.0 0.7 0.8 0.9 740
P/B (X) RoE (%) Dividend yield (%)
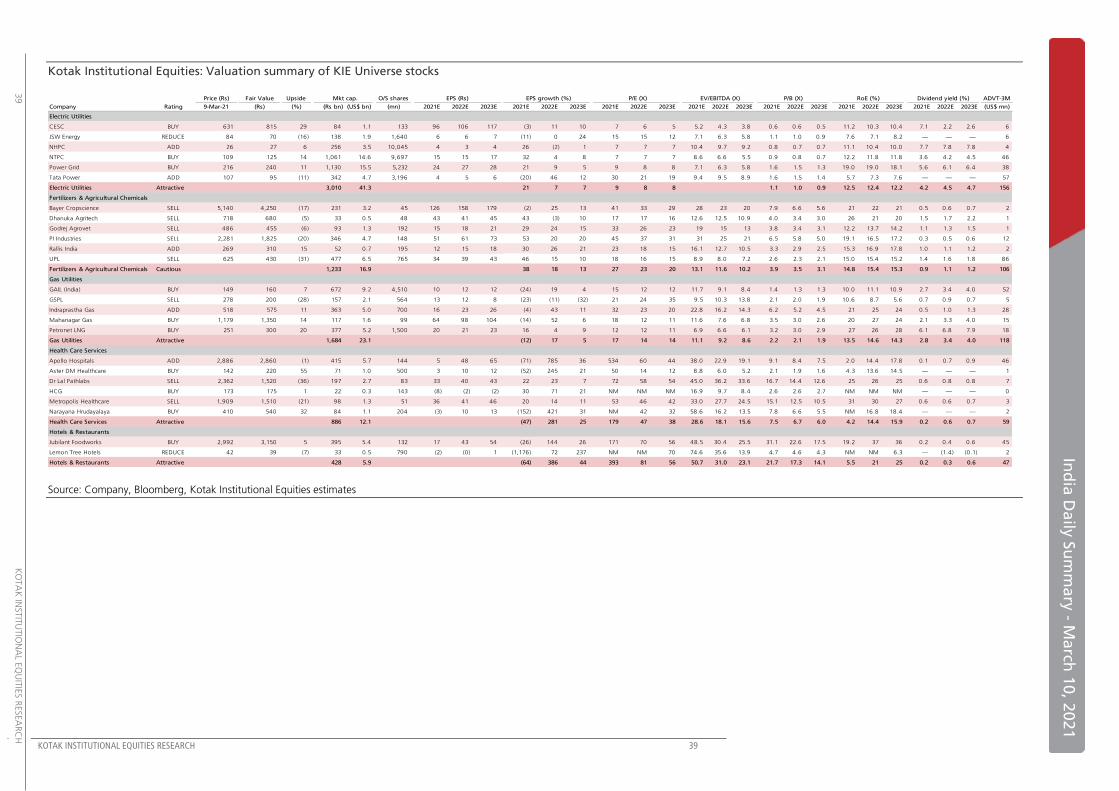
KOTAK INSTITUTIONAL EQUITIES RESEARCH 39
In
dia
Da
ily S
um
ma
ry - M
arch
10
, 20
21
39
K
OTA
K IN
STIT
UTIO
NA
L EQ
UIT
IES R
ESEA
RC
H
Kotak Institutional Equities: Valuation summary of KIE Universe stocks
Source: Company, Bloomberg, Kotak Institutional Equities estimates
Price (Rs) Fair Value Upside Mkt cap. O/S shares EPS (Rs) EPS growth (%) P/E (X) EV/EBITDA (X) ADVT-3M
Company Rating 9-Mar-21 (Rs) (%) (Rs bn) (US$ bn) (mn) 2021E 2022E 2023E 2021E 2022E 2023E 2021E 2022E 2023E 2021E 2022E 2023E 2021E 2022E 2023E 2021E 2022E 2023E 2021E 2022E 2023E (US$ mn)
Electric Utilities
CESC BUY 631 815 29 84 1.1 133 96 106 117 (3) 11 10 7 6 5 5.2 4.3 3.8 0.6 0.6 0.5 11.2 10.3 10.4 7.1 2.2 2.6 6
JSW Energy REDUCE 84 70 (16) 138 1.9 1,640 6 6 7 (11) 0 24 15 15 12 7.1 6.3 5.8 1.1 1.0 0.9 7.6 7.1 8.2 — — — 6
NHPC ADD 26 27 6 256 3.5 10,045 4 3 4 26 (2) 1 7 7 7 10.4 9.7 9.2 0.8 0.7 0.7 11.1 10.4 10.0 7.7 7.8 7.8 4
NTPC BUY 109 125 14 1,061 14.6 9,697 15 15 17 32 4 8 7 7 7 8.6 6.6 5.5 0.9 0.8 0.7 12.2 11.8 11.8 3.6 4.2 4.5 46
Power Grid BUY 216 240 11 1,130 15.5 5,232 24 27 28 21 9 5 9 8 8 7.1 6.3 5.8 1.6 1.5 1.3 19.0 19.0 18.1 5.6 6.1 6.4 38
Tata Power ADD 107 95 (11) 342 4.7 3,196 4 5 6 (20) 46 12 30 21 19 9.4 9.5 8.9 1.6 1.5 1.4 5.7 7.3 7.6 — — — 57
Electric Utilities Attractive 3,010 41.3 21 7 7 9 8 8 1.1 1.0 0.9 12.5 12.4 12.2 4.2 4.5 4.7 156
Fertilizers & Agricultural Chemicals
Bayer Cropscience SELL 5,140 4,250 (17) 231 3.2 45 126 158 179 (2) 25 13 41 33 29 28 23 20 7.9 6.6 5.6 21 22 21 0.5 0.6 0.7 2
Dhanuka Agritech SELL 718 680 (5) 33 0.5 48 43 41 45 43 (3) 10 17 17 16 12.6 12.5 10.9 4.0 3.4 3.0 26 21 20 1.5 1.7 2.2 1
Godrej Agrovet SELL 486 455 (6) 93 1.3 192 15 18 21 29 24 15 33 26 23 19 15 13 3.8 3.4 3.1 12.2 13.7 14.2 1.1 1.3 1.5 1
PI Industries SELL 2,281 1,825 (20) 346 4.7 148 51 61 73 53 20 20 45 37 31 31 25 21 6.5 5.8 5.0 19.1 16.5 17.2 0.3 0.5 0.6 12
Rallis India ADD 269 310 15 52 0.7 195 12 15 18 30 26 21 23 18 15 16.1 12.7 10.5 3.3 2.9 2.5 15.3 16.9 17.8 1.0 1.1 1.2 2
UPL SELL 625 430 (31) 477 6.5 765 34 39 43 46 15 10 18 16 15 8.9 8.0 7.2 2.6 2.3 2.1 15.0 15.4 15.2 1.4 1.6 1.8 86
Fertilizers & Agricultural Chemicals Cautious 1,233 16.9 38 18 13 27 23 20 13.1 11.6 10.2 3.9 3.5 3.1 14.8 15.4 15.3 0.9 1.1 1.2 106
Gas Utilities
GAIL (India) BUY 149 160 7 672 9.2 4,510 10 12 12 (24) 19 4 15 12 12 11.7 9.1 8.4 1.4 1.3 1.3 10.0 11.1 10.9 2.7 3.4 4.0 52
GSPL SELL 278 200 (28) 157 2.1 564 13 12 8 (23) (11) (32) 21 24 35 9.5 10.3 13.8 2.1 2.0 1.9 10.6 8.7 5.6 0.7 0.9 0.7 5
Indraprastha Gas ADD 518 575 11 363 5.0 700 16 23 26 (4) 43 11 32 23 20 22.8 16.2 14.3 6.2 5.2 4.5 21 25 24 0.5 1.0 1.3 28
Mahanagar Gas BUY 1,179 1,350 14 117 1.6 99 64 98 104 (14) 52 6 18 12 11 11.6 7.6 6.8 3.5 3.0 2.6 20 27 24 2.1 3.3 4.0 15
Petronet LNG BUY 251 300 20 377 5.2 1,500 20 21 23 16 4 9 12 12 11 6.9 6.6 6.1 3.2 3.0 2.9 27 26 28 6.1 6.8 7.9 18
Gas Utilities Attractive 1,684 23.1 (12) 17 5 17 14 14 11.1 9.2 8.6 2.2 2.1 1.9 13.5 14.6 14.3 2.8 3.4 4.0 118
Health Care Services
Apollo Hospitals ADD 2,886 2,860 (1) 415 5.7 144 5 48 65 (71) 785 36 534 60 44 38.0 22.9 19.1 9.1 8.4 7.5 2.0 14.4 17.8 0.1 0.7 0.9 46
Aster DM Healthcare BUY 142 220 55 71 1.0 500 3 10 12 (52) 245 21 50 14 12 8.8 6.0 5.2 2.1 1.9 1.6 4.3 13.6 14.5 — — — 1
Dr Lal Pathlabs SELL 2,362 1,520 (36) 197 2.7 83 33 40 43 22 23 7 72 58 54 45.0 36.2 33.6 16.7 14.4 12.6 25 26 25 0.6 0.8 0.8 7
HCG BUY 173 175 1 22 0.3 143 (8) (2) (2) 30 71 21 NM NM NM 16.9 9.7 8.4 2.6 2.6 2.7 NM NM NM — — — 0
Metropolis Healthcare SELL 1,909 1,510 (21) 98 1.3 51 36 41 46 20 14 11 53 46 42 33.0 27.7 24.5 15.1 12.5 10.5 31 30 27 0.6 0.6 0.7 3
Narayana Hrudayalaya BUY 410 540 32 84 1.1 204 (3) 10 13 (152) 421 31 NM 42 32 58.6 16.2 13.5 7.8 6.6 5.5 NM 16.8 18.4 — — — 2
Health Care Services Attractive 886 12.1 (47) 281 25 179 47 38 28.6 18.1 15.6 7.5 6.7 6.0 4.2 14.4 15.9 0.2 0.6 0.7 59
Hotels & Restaurants
Jubilant Foodworks BUY 2,992 3,150 5 395 5.4 132 17 43 54 (26) 144 26 171 70 56 48.5 30.4 25.5 31.1 22.6 17.5 19.2 37 36 0.2 0.4 0.6 45
Lemon Tree Hotels REDUCE 42 39 (7) 33 0.5 790 (2) (0) 1 (1,176) 72 237 NM NM 70 74.6 35.6 13.9 4.7 4.6 4.3 NM NM 6.3 — (1.4) (0.1) 2
Hotels & Restaurants Attractive 428 5.9 (64) 386 44 393 81 56 50.7 31.0 23.1 21.7 17.3 14.1 5.5 21 25 0.2 0.3 0.6 47
P/B (X) RoE (%) Dividend yield (%)
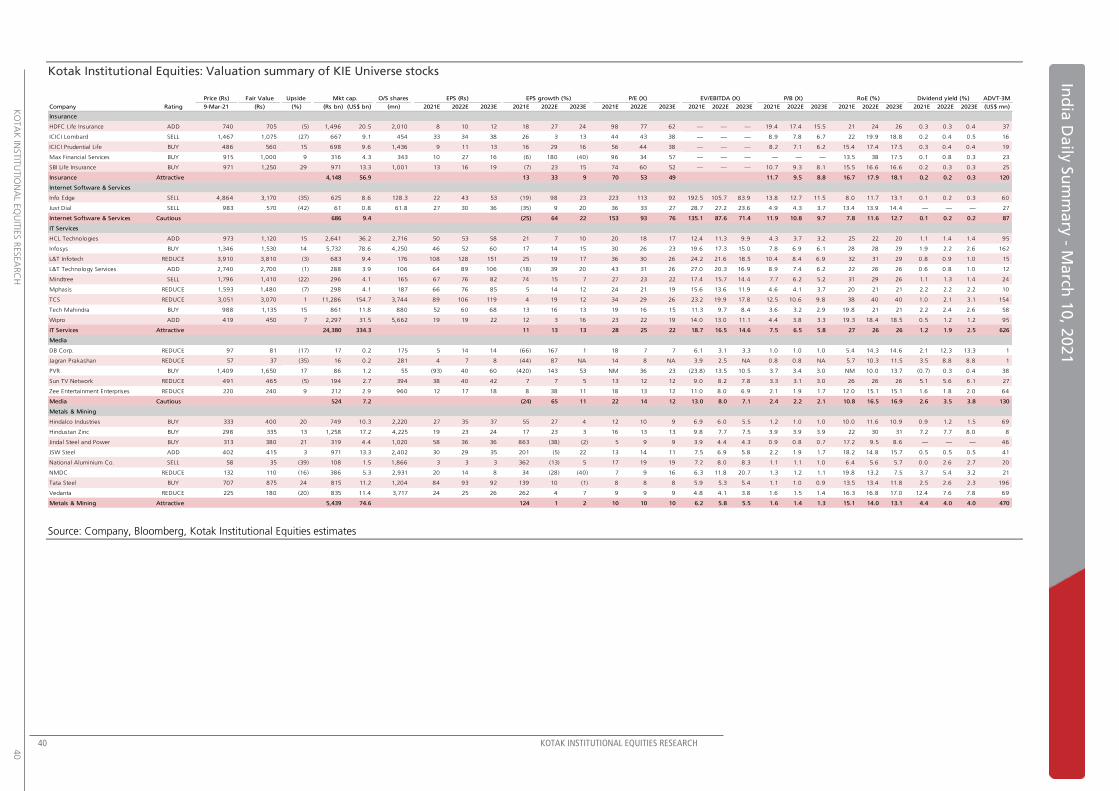
40 KOTAK INSTITUTIONAL EQUITIES RESEARCH
K
OTA
K IN
STIT
UTIO
NA
L EQ
UIT
IES R
ESEA
RC
H
40
Ind
ia D
aily
Su
mm
ary
- Ma
rch 1
0, 2
021
Kotak Institutional Equities: Valuation summary of KIE Universe stocks
Source: Company, Bloomberg, Kotak Institutional Equities estimates
Price (Rs) Fair Value Upside Mkt cap. O/S shares EPS (Rs) EPS growth (%) P/E (X) EV/EBITDA (X) ADVT-3M
Company Rating 9-Mar-21 (Rs) (%) (Rs bn) (US$ bn) (mn) 2021E 2022E 2023E 2021E 2022E 2023E 2021E 2022E 2023E 2021E 2022E 2023E 2021E 2022E 2023E 2021E 2022E 2023E 2021E 2022E 2023E (US$ mn)
Insurance
HDFC Life Insurance ADD 740 705 (5) 1,496 20.5 2,010 8 10 12 18 27 24 98 77 62 — — — 19.4 17.4 15.5 21 24 26 0.3 0.3 0.4 37
ICICI Lombard SELL 1,467 1,075 (27) 667 9.1 454 33 34 38 26 3 13 44 43 38 — — — 8.9 7.8 6.7 22 19.9 18.8 0.2 0.4 0.5 16
ICICI Prudential Life BUY 486 560 15 698 9.6 1,436 9 11 13 16 29 16 56 44 38 — — — 8.2 7.1 6.2 15.4 17.4 17.5 0.3 0.4 0.4 19
Max Financial Services BUY 915 1,000 9 316 4.3 343 10 27 16 (6) 180 (40) 96 34 57 — — — — — — 13.5 38 17.5 0.1 0.8 0.3 23
SBI Life Insurance BUY 971 1,250 29 971 13.3 1,001 13 16 19 (7) 23 15 74 60 52 — — — 10.7 9.3 8.1 15.5 16.6 16.6 0.2 0.3 0.3 25
Insurance Attractive 4,148 56.9 13 33 9 70 53 49 11.7 9.5 8.8 16.7 17.9 18.1 0.2 0.2 0.3 120
Internet Software & Services
Info Edge SELL 4,864 3,170 (35) 625 8.6 128.3 22 43 53 (19) 98 23 223 113 92 192.5 105.7 83.9 13.8 12.7 11.5 8.0 11.7 13.1 0.1 0.2 0.3 60
Just Dial SELL 983 570 (42) 61 0.8 61.8 27 30 36 (35) 9 20 36 33 27 28.7 27.2 23.6 4.9 4.3 3.7 13.4 13.9 14.4 — — — 27
Internet Software & Services Cautious 686 9.4 (25) 64 22 153 93 76 135.1 87.6 71.4 11.9 10.8 9.7 7.8 11.6 12.7 0.1 0.2 0.2 87
IT Services
HCL Technologies ADD 973 1,120 15 2,641 36.2 2,716 50 53 58 21 7 10 20 18 17 12.4 11.3 9.9 4.3 3.7 3.2 25 22 20 1.1 1.4 1.4 95
Infosys BUY 1,346 1,530 14 5,732 78.6 4,250 46 52 60 17 14 15 30 26 23 19.6 17.3 15.0 7.8 6.9 6.1 28 28 29 1.9 2.2 2.6 162
L&T Infotech REDUCE 3,910 3,810 (3) 683 9.4 176 108 128 151 25 19 17 36 30 26 24.2 21.6 18.5 10.4 8.4 6.9 32 31 29 0.8 0.9 1.0 15
L&T Technology Services ADD 2,740 2,700 (1) 288 3.9 106 64 89 106 (18) 39 20 43 31 26 27.0 20.3 16.9 8.9 7.4 6.2 22 26 26 0.6 0.8 1.0 12
Mindtree SELL 1,796 1,410 (22) 296 4.1 165 67 76 82 74 15 7 27 23 22 17.4 15.7 14.4 7.7 6.2 5.2 31 29 26 1.1 1.3 1.4 24
Mphasis REDUCE 1,593 1,480 (7) 298 4.1 187 66 76 85 5 14 12 24 21 19 15.6 13.6 11.9 4.6 4.1 3.7 20 21 21 2.2 2.2 2.2 10
TCS REDUCE 3,051 3,070 1 11,286 154.7 3,744 89 106 119 4 19 12 34 29 26 23.2 19.9 17.8 12.5 10.6 9.8 38 40 40 1.0 2.1 3.1 154
Tech Mahindra BUY 988 1,135 15 861 11.8 880 52 60 68 13 16 13 19 16 15 11.3 9.7 8.4 3.6 3.2 2.9 19.8 21 21 2.2 2.4 2.6 58
Wipro ADD 419 450 7 2,297 31.5 5,662 19 19 22 12 3 16 23 22 19 14.0 13.0 11.1 4.4 3.8 3.3 19.3 18.4 18.5 0.5 1.2 1.2 95
IT Services Attractive 24,380 334.3 11 13 13 28 25 22 18.7 16.5 14.6 7.5 6.5 5.8 27 26 26 1.2 1.9 2.5 626
Media
DB Corp. REDUCE 97 81 (17) 17 0.2 175 5 14 14 (66) 167 1 18 7 7 6.1 3.1 3.3 1.0 1.0 1.0 5.4 14.3 14.6 2.1 12.3 13.3 1
Jagran Prakashan REDUCE 57 37 (35) 16 0.2 281 4 7 8 (44) 87 NA 14 8 NA 3.9 2.5 NA 0.8 0.8 NA 5.7 10.3 11.5 3.5 8.8 8.8 1
PVR BUY 1,409 1,650 17 86 1.2 55 (93) 40 60 (420) 143 53 NM 36 23 (23.8) 13.5 10.5 3.7 3.4 3.0 NM 10.0 13.7 (0.7) 0.3 0.4 38
Sun TV Network REDUCE 491 465 (5) 194 2.7 394 38 40 42 7 7 5 13 12 12 9.0 8.2 7.8 3.3 3.1 3.0 26 26 26 5.1 5.6 6.1 27
Zee Entertainment Enterprises REDUCE 220 240 9 212 2.9 960 12 17 18 8 38 11 18 13 12 11.0 8.0 6.9 2.1 1.9 1.7 12.0 15.1 15.1 1.6 1.8 2.0 64
Media Cautious 524 7.2 (24) 65 11 22 14 12 13.0 8.0 7.1 2.4 2.2 2.1 10.8 16.5 16.9 2.6 3.5 3.8 130
Metals & Mining
Hindalco Industries BUY 333 400 20 749 10.3 2,220 27 35 37 55 27 4 12 10 9 6.9 6.0 5.5 1.2 1.0 1.0 10.0 11.6 10.9 0.9 1.2 1.5 69
Hindustan Zinc BUY 298 335 13 1,258 17.2 4,225 19 23 24 17 23 3 16 13 13 9.8 7.7 7.5 3.9 3.9 3.9 22 30 31 7.2 7.7 8.0 8
Jindal Steel and Power BUY 313 380 21 319 4.4 1,020 58 36 36 863 (38) (2) 5 9 9 3.9 4.4 4.3 0.9 0.8 0.7 17.2 9.5 8.6 — — — 46
JSW Steel ADD 402 415 3 971 13.3 2,402 30 29 35 201 (5) 22 13 14 11 7.5 6.9 5.8 2.2 1.9 1.7 18.2 14.8 15.7 0.5 0.5 0.5 41
National Aluminium Co. SELL 58 35 (39) 108 1.5 1,866 3 3 3 362 (13) 5 17 19 19 7.2 8.0 8.3 1.1 1.1 1.0 6.4 5.6 5.7 0.0 2.6 2.7 20
NMDC REDUCE 132 110 (16) 386 5.3 2,931 20 14 8 34 (28) (40) 7 9 16 6.3 11.8 20.7 1.3 1.2 1.1 19.8 13.2 7.5 3.7 5.4 3.2 21
Tata Steel BUY 707 875 24 815 11.2 1,204 84 93 92 139 10 (1) 8 8 8 5.9 5.3 5.4 1.1 1.0 0.9 13.5 13.4 11.8 2.5 2.6 2.3 196
Vedanta REDUCE 225 180 (20) 835 11.4 3,717 24 25 26 262 4 7 9 9 9 4.8 4.1 3.8 1.6 1.5 1.4 16.3 16.8 17.0 12.4 7.6 7.8 69
Metals & Mining Attractive 5,439 74.6 124 1 2 10 10 10 6.2 5.8 5.5 1.6 1.4 1.3 15.1 14.0 13.1 4.4 4.0 4.0 470
Dividend yield (%)P/B (X) RoE (%)
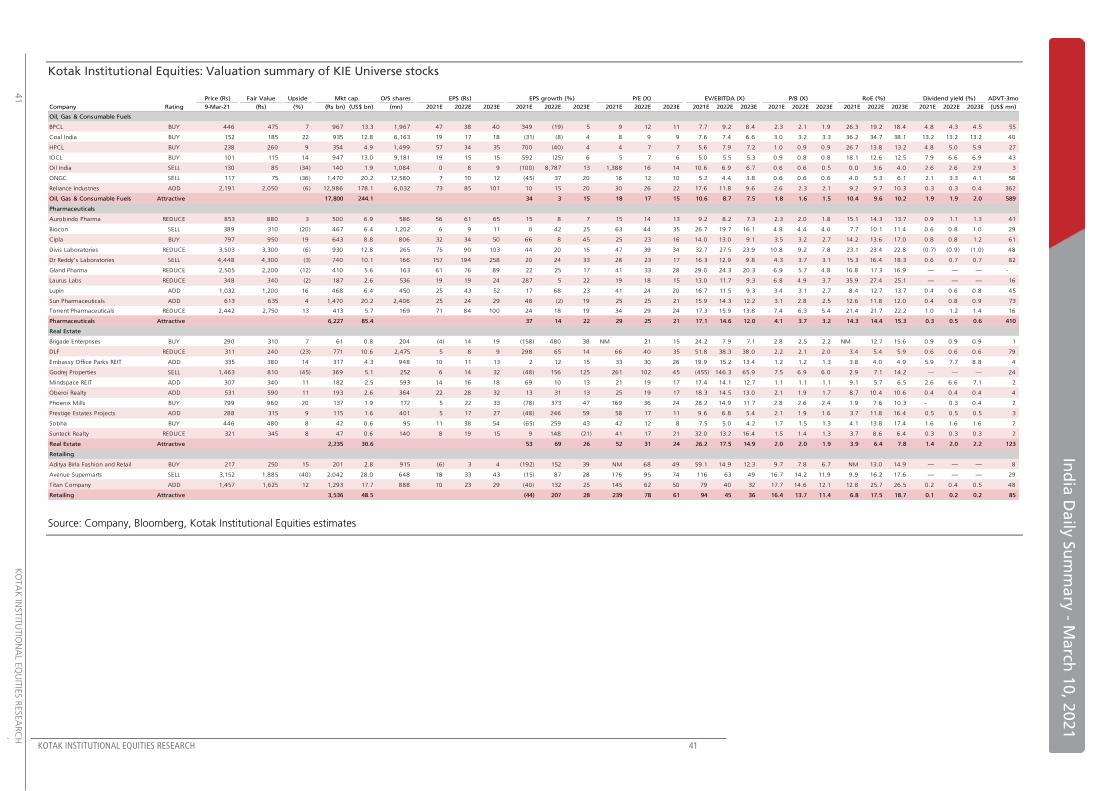
KOTAK INSTITUTIONAL EQUITIES RESEARCH 41
In
dia
Da
ily S
um
ma
ry - M
arch
10
, 20
21
41
K
OTA
K IN
STIT
UTIO
NA
L EQ
UIT
IES R
ESEA
RC
H
Kotak Institutional Equities: Valuation summary of KIE Universe stocks
Source: Company, Bloomberg, Kotak Institutional Equities estimates
Price (Rs) Fair Value Upside Mkt cap. O/S shares EPS (Rs) EPS growth (%) P/E (X) EV/EBITDA (X) ADVT-3mo
Company Rating 9-Mar-21 (Rs) (%) (Rs bn) (US$ bn) (mn) 2021E 2022E 2023E 2021E 2022E 2023E 2021E 2022E 2023E 2021E 2022E 2023E 2021E 2022E 2023E 2021E 2022E 2023E 2021E 2022E 2023E (US$ mn)
Oil, Gas & Consumable Fuels
BPCL BUY 446 475 7 967 13.3 1,967 47 38 40 349 (19) 5 9 12 11 7.7 9.2 8.4 2.3 2.1 1.9 26.3 19.2 18.4 4.8 4.3 4.5 55
Coal India BUY 152 185 22 935 12.8 6,163 19 17 18 (31) (8) 4 8 9 9 7.6 7.4 6.6 3.0 3.2 3.3 36.2 34.7 38.1 13.2 13.2 13.2 40
HPCL BUY 238 260 9 354 4.9 1,499 57 34 35 700 (40) 4 4 7 7 5.6 7.9 7.2 1.0 0.9 0.9 26.7 13.8 13.2 4.8 5.0 5.9 27
IOCL BUY 101 115 14 947 13.0 9,181 19 15 15 592 (25) 6 5 7 6 5.0 5.5 5.3 0.9 0.8 0.8 18.1 12.6 12.5 7.9 6.6 6.9 43
Oil India SELL 130 85 (34) 140 1.9 1,084 0 8 9 (100) 8,787 13 1,388 16 14 10.6 6.9 6.7 0.6 0.6 0.5 0.0 3.6 4.0 2.6 2.6 2.9 3
ONGC SELL 117 75 (36) 1,470 20.2 12,580 7 10 12 (45) 37 20 16 12 10 5.2 4.4 3.8 0.6 0.6 0.6 4.0 5.3 6.1 2.1 3.3 4.1 58
Reliance Industries ADD 2,191 2,050 (6) 12,986 178.1 6,032 73 85 101 10 15 20 30 26 22 17.6 11.8 9.6 2.6 2.3 2.1 9.2 9.7 10.3 0.3 0.3 0.4 362
Oil, Gas & Consumable Fuels Attractive 17,800 244.1 34 3 15 18 17 15 10.6 8.7 7.5 1.8 1.6 1.5 10.4 9.6 10.2 1.9 1.9 2.0 589
Pharmaceuticals
Aurobindo Pharma REDUCE 853 880 3 500 6.9 586 56 61 65 15 8 7 15 14 13 9.2 8.2 7.3 2.3 2.0 1.8 15.1 14.3 13.7 0.9 1.1 1.3 41
Biocon SELL 389 310 (20) 467 6.4 1,202 6 9 11 0 42 25 63 44 35 26.7 19.7 16.1 4.8 4.4 4.0 7.7 10.1 11.4 0.6 0.8 1.0 29
Cipla BUY 797 950 19 643 8.8 806 32 34 50 66 8 45 25 23 16 14.0 13.0 9.1 3.5 3.2 2.7 14.2 13.6 17.0 0.8 0.8 1.2 61
Divis Laboratories REDUCE 3,503 3,300 (6) 930 12.8 265 75 90 103 44 20 15 47 39 34 32.7 27.5 23.9 10.8 9.2 7.8 23.1 23.4 22.8 (0.7) (0.9) (1.0) 48
Dr Reddy's Laboratories SELL 4,448 4,300 (3) 740 10.1 166 157 194 258 20 24 33 28 23 17 16.3 12.9 9.8 4.3 3.7 3.1 15.3 16.4 18.3 0.6 0.7 0.7 82
Gland Pharma REDUCE 2,505 2,200 (12) 410 5.6 163 61 76 89 22 25 17 41 33 28 29.0 24.3 20.3 6.9 5.7 4.8 16.8 17.3 16.9 — — — -
Laurus Labs REDUCE 348 340 (2) 187 2.6 536 19 19 24 287 5 22 19 18 15 13.0 11.7 9.3 6.8 4.9 3.7 35.9 27.4 25.1 — — — 16
Lupin ADD 1,032 1,200 16 468 6.4 450 25 43 52 17 68 23 41 24 20 16.7 11.5 9.3 3.4 3.1 2.7 8.4 12.7 13.7 0.4 0.6 0.8 45
Sun Pharmaceuticals ADD 613 635 4 1,470 20.2 2,406 25 24 29 48 (2) 19 25 25 21 15.9 14.3 12.2 3.1 2.8 2.5 12.6 11.8 12.0 0.4 0.8 0.9 73
Torrent Pharmaceuticals REDUCE 2,442 2,750 13 413 5.7 169 71 84 100 24 18 19 34 29 24 17.3 15.9 13.8 7.4 6.3 5.4 21.4 21.7 22.2 1.0 1.2 1.4 16
Pharmaceuticals Attractive 6,227 85.4 37 14 22 29 25 21 17.1 14.6 12.0 4.1 3.7 3.2 14.3 14.4 15.3 0.3 0.5 0.6 410
Real Estate
Brigade Enterprises BUY 290 310 7 61 0.8 204 (4) 14 19 (158) 480 38 NM 21 15 24.2 7.9 7.1 2.8 2.5 2.2 NM 12.7 15.6 0.9 0.9 0.9 1
DLF REDUCE 311 240 (23) 771 10.6 2,475 5 8 9 298 65 14 66 40 35 51.8 38.3 38.0 2.2 2.1 2.0 3.4 5.4 5.9 0.6 0.6 0.6 79
Embassy Office Parks REIT ADD 335 380 14 317 4.3 948 10 11 13 2 12 15 33 30 26 19.9 15.2 13.4 1.2 1.2 1.3 3.8 4.0 4.9 5.9 7.7 8.8 4
Godrej Properties SELL 1,463 810 (45) 369 5.1 252 6 14 32 (48) 156 125 261 102 45 (455) 146.3 65.9 7.5 6.9 6.0 2.9 7.1 14.2 — — — 24
Mindspace REIT ADD 307 340 11 182 2.5 593 14 16 18 69 10 13 21 19 17 17.4 14.1 12.7 1.1 1.1 1.1 9.1 5.7 6.5 2.6 6.6 7.1 2
Oberoi Realty ADD 531 590 11 193 2.6 364 22 28 32 13 31 13 25 19 17 18.3 14.5 13.0 2.1 1.9 1.7 8.7 10.4 10.6 0.4 0.4 0.4 4
Phoenix Mills BUY 799 960 20 137 1.9 172 5 22 33 (78) 373 47 169 36 24 28.2 14.9 11.7 2.8 2.6 2.4 1.9 7.6 10.3 - 0.3 0.4 2
Prestige Estates Projects ADD 288 315 9 115 1.6 401 5 17 27 (48) 246 59 58 17 11 9.6 6.8 5.4 2.1 1.9 1.6 3.7 11.8 16.4 0.5 0.5 0.5 3
Sobha BUY 446 480 8 42 0.6 95 11 38 54 (65) 259 43 42 12 8 7.5 5.0 4.2 1.7 1.5 1.3 4.1 13.8 17.4 1.6 1.6 1.6 2
Sunteck Realty REDUCE 321 345 8 47 0.6 140 8 19 15 9 148 (21) 41 17 21 32.0 13.2 16.4 1.5 1.4 1.3 3.7 8.6 6.4 0.3 0.3 0.3 2
Real Estate Attractive 2,235 30.6 53 69 26 52 31 24 26.2 17.5 14.9 2.0 2.0 1.9 3.9 6.4 7.8 1.4 2.0 2.2 123
Retailing
Aditya Birla Fashion and Retail BUY 217 250 15 201 2.8 915 (6) 3 4 (192) 152 39 NM 68 49 59.1 14.9 12.3 9.7 7.8 6.7 NM 13.0 14.9 — — — 8
Avenue Supermarts SELL 3,152 1,885 (40) 2,042 28.0 648 18 33 43 (15) 87 28 176 95 74 116 63 49 16.7 14.2 11.9 9.9 16.2 17.6 — — — 29
Titan Company ADD 1,457 1,625 12 1,293 17.7 888 10 23 29 (40) 132 25 145 62 50 79 40 32 17.7 14.6 12.1 12.8 25.7 26.5 0.2 0.4 0.5 48
Retailing Attractive 3,536 48.5 (44) 207 28 239 78 61 94 45 36 16.4 13.7 11.4 6.8 17.5 18.7 0.1 0.2 0.2 85
P/B (X) RoE (%) Dividend yield (%)
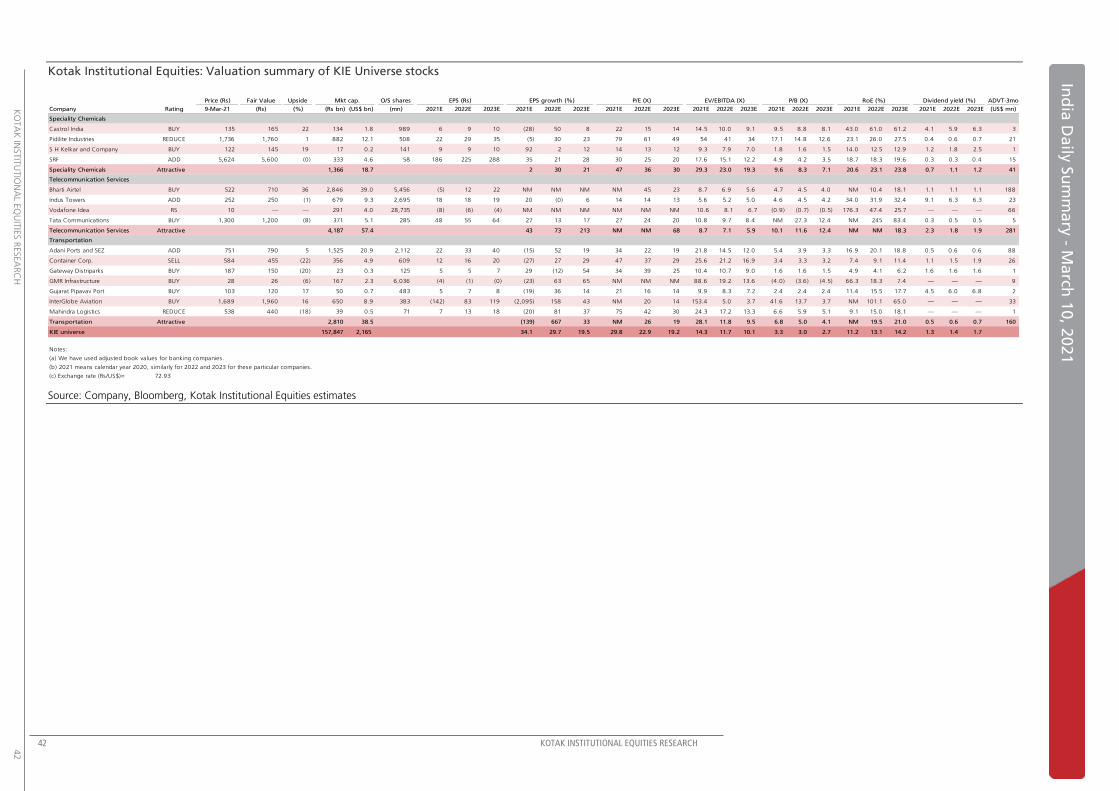
42 KOTAK INSTITUTIONAL EQUITIES RESEARCH
K
OTA
K IN
STIT
UTIO
NA
L EQ
UIT
IES R
ESEA
RC
H
42
Ind
ia D
aily
Su
mm
ary
- Ma
rch 1
0, 2
021
Kotak Institutional Equities: Valuation summary of KIE Universe stocks
Source: Company, Bloomberg, Kotak Institutional Equities estimates
Price (Rs) Fair Value Upside Mkt cap. O/S shares EPS (Rs) EPS growth (%) P/E (X) EV/EBITDA (X) ADVT-3mo
Company Rating 9-Mar-21 (Rs) (%) (Rs bn) (US$ bn) (mn) 2021E 2022E 2023E 2021E 2022E 2023E 2021E 2022E 2023E 2021E 2022E 2023E 2021E 2022E 2023E 2021E 2022E 2023E 2021E 2022E 2023E (US$ mn)
Speciality Chemicals
Castrol India BUY 135 165 22 134 1.8 989 6 9 10 (28) 50 8 22 15 14 14.5 10.0 9.1 9.5 8.8 8.1 43.0 61.0 61.2 4.1 5.9 6.3 3
Pidilite Industries REDUCE 1,736 1,760 1 882 12.1 508 22 29 35 (5) 30 23 79 61 49 54 41 34 17.1 14.8 12.6 23.1 26.0 27.5 0.4 0.6 0.7 21
S H Kelkar and Company BUY 122 145 19 17 0.2 141 9 9 10 92 2 12 14 13 12 9.3 7.9 7.0 1.8 1.6 1.5 14.0 12.5 12.9 1.2 1.8 2.5 1
SRF ADD 5,624 5,600 (0) 333 4.6 58 186 225 288 35 21 28 30 25 20 17.6 15.1 12.2 4.9 4.2 3.5 18.7 18.3 19.6 0.3 0.3 0.4 15
Speciality Chemicals Attractive 1,366 18.7 2 30 21 47 36 30 29.3 23.0 19.3 9.6 8.3 7.1 20.6 23.1 23.8 0.7 1.1 1.2 41
Telecommunication Services
Bharti Airtel BUY 522 710 36 2,846 39.0 5,456 (5) 12 22 NM NM NM NM 45 23 8.7 6.9 5.6 4.7 4.5 4.0 NM 10.4 18.1 1.1 1.1 1.1 188
Indus Towers ADD 252 250 (1) 679 9.3 2,695 18 18 19 20 (0) 6 14 14 13 5.6 5.2 5.0 4.6 4.5 4.2 34.0 31.9 32.4 9.1 6.3 6.3 23
Vodafone Idea RS 10 — — 291 4.0 28,735 (8) (6) (4) NM NM NM NM NM NM 10.6 8.1 6.7 (0.9) (0.7) (0.5) 176.3 47.4 25.7 — — — 66
Tata Communications BUY 1,300 1,200 (8) 371 5.1 285 48 55 64 27 13 17 27 24 20 10.8 9.7 8.4 NM 27.3 12.4 NM 245 83.4 0.3 0.5 0.5 5
Telecommunication Services Attractive 4,187 57.4 43 73 213 NM NM 68 8.7 7.1 5.9 10.1 11.6 12.4 NM NM 18.3 2.3 1.8 1.9 281
Transportation
Adani Ports and SEZ ADD 751 790 5 1,525 20.9 2,112 22 33 40 (15) 52 19 34 22 19 21.8 14.5 12.0 5.4 3.9 3.3 16.9 20.1 18.8 0.5 0.6 0.6 88
Container Corp. SELL 584 455 (22) 356 4.9 609 12 16 20 (27) 27 29 47 37 29 25.6 21.2 16.9 3.4 3.3 3.2 7.4 9.1 11.4 1.1 1.5 1.9 26
Gateway Distriparks BUY 187 150 (20) 23 0.3 125 5 5 7 29 (12) 54 34 39 25 10.4 10.7 9.0 1.6 1.6 1.5 4.9 4.1 6.2 1.6 1.6 1.6 1
GMR Infrastructure BUY 28 26 (6) 167 2.3 6,036 (4) (1) (0) (23) 63 65 NM NM NM 88.6 19.2 13.6 (4.0) (3.6) (4.5) 66.3 18.3 7.4 — — — 9
Gujarat Pipavav Port BUY 103 120 17 50 0.7 483 5 7 8 (19) 36 14 21 16 14 9.9 8.3 7.2 2.4 2.4 2.4 11.4 15.5 17.7 4.5 6.0 6.8 2
InterGlobe Aviation BUY 1,689 1,960 16 650 8.9 383 (142) 83 119 (2,095) 158 43 NM 20 14 153.4 5.0 3.7 41.6 13.7 3.7 NM 101.1 65.0 — — — 33
Mahindra Logistics REDUCE 538 440 (18) 39 0.5 71 7 13 18 (20) 81 37 75 42 30 24.3 17.2 13.3 6.6 5.9 5.1 9.1 15.0 18.1 — — — 1
Transportation Attractive 2,810 38.5 (139) 667 33 NM 26 19 28.1 11.8 9.5 6.8 5.0 4.1 NM 19.5 21.0 0.5 0.6 0.7 160
KIE universe 157,847 2,165 34.1 29.7 19.5 29.8 22.9 19.2 14.3 11.7 10.1 3.3 3.0 2.7 11.2 13.1 14.2 1.3 1.4 1.7
Notes:
(a) We have used adjusted book values for banking companies.
(b) 2021 means calendar year 2020, similarly for 2022 and 2023 for these particular companies.
(c) Exchange rate (Rs/US$)= 72.93
P/B (X) RoE (%) Dividend yield (%)
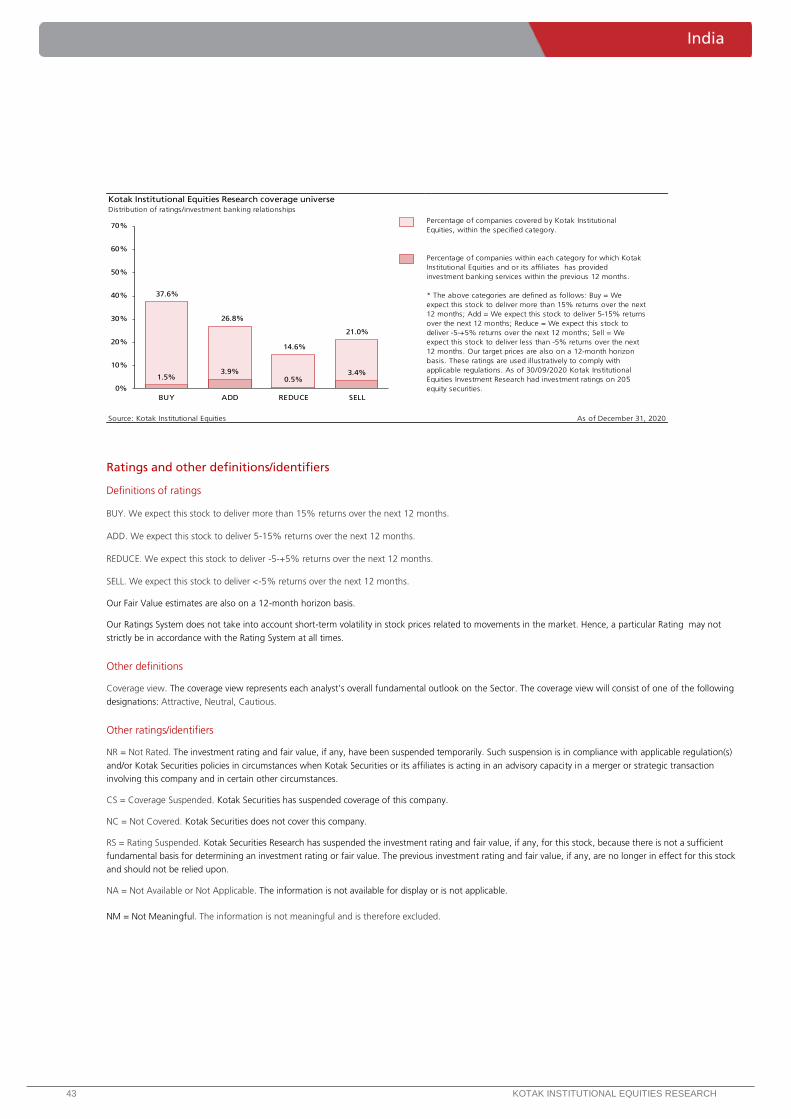
Ind
ia D
aily
Su
mm
ary
-M
arch
10
, 20
21
43 KOTAK INSTITUTIONAL EQUITIES RESEARCH
India
Ratings and other definitions/identifiers
Definitions of ratings
BUY. We expect this stock to deliver more than 15% returns over the next 12 months.
ADD. We expect this stock to deliver 5-15% returns over the next 12 months.
REDUCE. We expect this stock to deliver -5-+5% returns over the next 12 months.
SELL. We expect this stock to deliver <-5% returns over the next 12 months.
Our Fair Value estimates are also on a 12-month horizon basis.
Our Ratings System does not take into account short-term volatility in stock prices related to movements in the market. Hence, a particular Rating may not
strictly be in accordance with the Rating System at all times.
Other definitions
Coverage view. The coverage view represents each analyst’s overall fundamental outlook on the Sector. The coverage view will consist of one of the following
designations: Attractive, Neutral, Cautious.
Other ratings/identifiers
NR = Not Rated. The investment rating and fair value, if any, have been suspended temporarily. Such suspension is in compliance with applicable regulation(s)
and/or Kotak Securities policies in circumstances when Kotak Securities or its affiliates is acting in an advisory capacity in a merger or strategic transaction
involving this company and in certain other circumstances.
CS = Coverage Suspended. Kotak Securities has suspended coverage of this company.
NC = Not Covered. Kotak Securities does not cover this company.
RS = Rating Suspended. Kotak Securities Research has suspended the investment rating and fair value, if any, for this stock, because there is not a sufficient
fundamental basis for determining an investment rating or fair value. The previous investment rating and fair value, if any, are no longer in effect for this stock
and should not be relied upon.
NA = Not Available or Not Applicable. The information is not available for display or is not applicable.
NM = Not Meaningful. The information is not meaningful and is therefore excluded.
Kotak Institutional Equities Research coverage universeDistribution of ratings/investment banking relationships
Source: Kotak Institutional Equities As of December 31, 2020
Percentage of companies covered by Kotak Institutional
Equities, within the specified category.
* The above categories are defined as follows: Buy = We
expect this stock to deliver more than 15% returns over the next
12 months; Add = We expect this stock to deliver 5-15% returns
over the next 12 months; Reduce = We expect this stock to
deliver -5-+5% returns over the next 12 months; Sell = We
expect this stock to deliver less than -5% returns over the next
12 months. Our target prices are also on a 12-month horizon
basis. These ratings are used illustratively to comply with
applicable regulations. As of 30/09/2020 Kotak Institutional
Equities Investment Research had investment ratings on 205
equity securities.
Percentage of companies within each category for which Kotak
Institutional Equities and or its affiliates has provided
investment banking services within the previous 12 months.
37.6%
26.8%
14.6%
21.0%
1.5%3.9%
0.5%3.4%
0%
10%
20%
30%
40%
50%
60%
70%
BUY ADD REDUCE SELL
Corporate Office Overseas Affiliates
Kotak Securities Ltd.
27 BKC, Plot No. C-27, “G Block”
Bandra Kurla Complex, Bandra (E)
Mumbai 400 051, India
Tel: +91-22-43360000
Kotak Mahindra (UK) Ltd
8th Floor, Portsoken House
155-157 Minories
London EC3N 1LS
Tel: +44-20-7977-6900
Kotak Mahindra Inc
369 Lexington Avenue
28th Floor, New York
NY 10017, USA
Tel:+1 212 600 8856
Copyright 2021 Kotak Institutional Equities (Kotak Securities Limited). All rights reserved. 1. Note that the research analysts contributing to this report may not be registered/qualified as research analysts with FINRA; and
2. Such research analysts may not be associated persons of Kotak Mahindra Inc and therefore, may not be subject to NASD Rule 2711 restrictions on communications with a subject company, public appearances and trading securities held by a research analyst account.
3. Any U.S. recipients of the research who wish to effect transactions in any security covered by the report should do so with or through Kotak Mahindra Inc and (ii) any transactions in the securities covered by the research by U.S. recipients must be effected only through Kotak Mahindra Inc at [email protected].
This report is distributed in Singapore by Kotak Mahindra (UK) Limited (Singapore Branch) to institutional investors, accredited investors or expert investors only as defined under the Securities and Futures Act. Recipients of this analysis / report are to contact Kotak Mahindra (UK) Limited (Singapore Branch) (16 Raffles Quay, #35-02/03, Hong Leong Building, Singapore 048581) in respect of any matters arising from, or in connection with, this analysis / report. Kotak Mahindra (UK) Limited (Singapore Branch) is regulated by the Monetary Authority of Singapore. Kotak Securities Limited and its affiliates are a full-service, integrated investment banking, investment management, brokerage and financing group. We along with our affiliates are leading underwriter of securities and participants in virtually all securities trading markets in India. We and our affiliates have investment banking and other business relationships with a significant percentage of the companies covered by our Investment Research Department. Our research professionals provide important input into our investment banking and other business selection processes. Investors should assume that Kotak Securities Limited and/or its affiliates are seeking or will seek investment banking or other business from the company or companies that are the subject of this material and that the research professionals who were involved in preparing this material may participate in the solicitation of such business. Our research professionals are paid in part based on the profitability of Kotak Securities Limited, which include earnings from investment banking and other business. Kotak Securities Limited generally prohibits its analysts, persons reporting to analysts, and members of their households from maintaining a financial interest in the securities or derivatives of any companies that the analysts cover. Additionally, Kotak Securities Limited generally prohibits its analysts and persons reporting to analysts from serving as an officer, director, or advisory board member of any companies that the analysts cover. Our salespeople, traders, and other professionals may provide oral or written market commentary or trading strategies to our clients that reflect opinions that are contrary to the opinions expressed herein, and our proprietary trading and investing businesses may make investment decisions that are inconsistent with the recommendations expressed herein. In reviewing these materials, you should be aware that any or all of the foregoing, among other things, may give rise to real or potential conflicts of interest. Additionally, other important information regarding our relationships with the company or companies that are the subject of this material is provided herein. This material should not be construed as an offer to sell or the solicitation of an offer to buy any security in any jurisdiction where such an offer or solicitation would be illegal. We are not soliciting any action based on this material. It is for the general information of clients of Kotak Securities Limited. It does not constitute a personal recommendation or take into account the particular investment objectives, financial situations, or needs of individual clients. Before acting on any advice or recommendation in this material, clients should consider whether it is suitable for their particular circumstances and, if necessary, seek professional advice. The price and value of the investments referred to in this material and the income from them may go down as well as up, and investors may realize losses on any investments. Past performance is not a guide for future performance, future returns are not guaranteed and a loss of original capital may occur. Kotak Securities Limited does not provide tax advise to its clients, and all investors are strongly advised to consult with their tax advisers regarding any potential investment. Certain transactions -including those involving futures, options, and other derivatives as well as non-investment-grade securities - give rise to substantial risk and are not suitable for all investors. The material is based on information that we consider reliable, but we do not represent that it is accurate or complete, and it should not be relied on as such. Opinions expressed are our current opinions as of the date appearing on this material only. We endeavor to update on a reasonable basis the information discussed in this material, but regulatory, compliance, or other reasons may prevent us from doing so. We and our affiliates, officers, directors, and employees, including persons involved in the preparation or issuance of this material, may from time to time have "long" or "short" positions in, act as principal in, and buy or sell the securities or derivatives thereof of companies mentioned herein. Kotak Securities Limited and its non US affiliates may, to the extent permissible under applicable laws, have acted on or used this research to the extent that it relates to non US issuers, prior to or immediately following its publication. Foreign currency denominated securities are subject to fluctuations in exchange rates that could have an adverse effect on the value or price of or income derived from the investment. In addition, investors in securities such as ADRs, the value of which are influenced by foreign currencies affectively assume currency risk. In addition options involve risks and are not suitable for all investors. Please ensure that you have read and understood the current derivatives risk disclosure document before entering into any derivative transactions. Kotak Securities Limited established in 1994, is a subsidiary of Kotak Mahindra Bank Limited. Kotak Securities is one of India's largest brokerage and distribution house. Kotak Securities Limited is a corporate trading and clearing member of Bombay Stock Exchange Limited (BSE), National Stock Exchange of India Limited (NSE), Metropolitan Stock Exchange of India Limited (MSE), National Commodity and Derivatives Exchange (NCDEX) and Multi Commodity Exchange(MCX). Our businesses include stock broking, services rendered in connection with distribution of primary market issues and financial products like mutual funds and fixed deposits, depository services and Portfolio Management. Kotak Securities Limited is also a depository participant with National Securities Depository Limited (NSDL) and Central Depository Services (India) Limited (CDSL). Kotak Securities Limited is also registered with Insurance Regulatory and Development Authority as Corporate Agent for Kotak Mahindra Old Mutual Life Insurance Limited and is also a Mutual Fund Advisor registered with Association of Mutual Funds in India (AMFI). Kotak Securities Limited is registered as a Research Analyst under SEBI (Research Analyst) Regulations, 2014. We hereby declare that our activities were neither suspended nor we have defaulted with any stock exchange authority with whom we are registered in last five years. However SEBI, Exchanges and Depositories have conducted the routine inspection and based on their observations have issued advise letters or levied minor penalty on KSL for certain operational deviations. We have not been debarred from doing business by any Stock Exchange / SEBI or any other authorities; nor has our certificate of registration been cancelled by SEBI at any point of time. We offer our research services to primarily institutional investors and their employees, directors, fund managers, advisors who are registered with us Details of Associates are available on website i.e. www.kotak.com Research Analyst has served as an officer, director or employee of subject company(ies): No We or our associates may have received compensation from the subject company(ies) in the past 12 months. We or our associates have managed or co-managed public offering of securities for the subject company(ies) in the past 12 months. YES. Visit our website for more details We or our associates may have received compensation for investment banking or merchant banking or brokerage services from the subject company(ies) in the past 12 months. We or our associates may have received any compensation for products or services other than investment banking or merchant banking or brokerage services from the subject company(ies) in the past 12 months. We or our associates may have received compensation or other benefits from the subject company(ies) or third party in connection with the research report. Our associates may have financial interest in the subject company(ies). Research Analyst or his/her relative's financial interest in the subject company(ies): No Kotak Securities Limited has financial interest in the subject company(ies) at the end of the month immediately preceding the date of publication of Research Report: Adani Ports and SEZ - YES Nature of Financial interest: Holding equity shares or derivatives of the subject company. Our associates may have actual/beneficial ownership of 1% or more securities of the subject company(ies) at the end of the month immediately preceding the date of publication of Research Report. Research Analyst or his/her relatives has actual/beneficial ownership of 1% or more securities of the subject company(ies) at the end of the month immediately preceding the date of publication of Research Report: No Kotak Securities Limited has actual/beneficial ownership of 1% or more securities of the subject company(ies) at the end of the month immediately preceding the date of publication of Research Report: No Subject company(ies) may have been client during twelve months preceding the date of distribution of the research report. A graph of daily closing prices of securities is available at https://www.moneycontrol.com/india/stockpricequote/ and http://economictimes.indiatimes.com/markets/stocks/stock-quotes. (Choose a company from the list on the browser and select the"three years" icon in the price chart).
Kotak Securities Limited. Registered Office: 27 BKC, C 27, G Block, Bandra Kurla Complex, Bandra (E), Mumbai 400051. CIN: U99999MH1994PLC134051, Telephone No.: +22 43360000, Fax No.: +22 67132430. Website: www.kotak.com / www.kotaksecurities.com. Correspondence Address: Infinity IT Park, Bldg. No 21, Opp. Film City Road, A K Vaidya Marg, Malad (East), Mumbai 400097. Telephone No: 42856825. SEBI Registration No. INZ000200137(Member of NSE, BSE, MSE, MCX & NCDEX). Member Id: NSE-08081; BSE-673; MSE-1024; MCX-56285; NCDEX-1262. AMFI ARN 0164, PMS INP000000258 and Research Analyst INH000000586. NSDL/CDSL: IN-DP-NSDL-23-97. Compliance Officer Details: Mr. Manoj Agarwal. Call: 022 - 4285 8484, or Email: [email protected]. Investments in securities market are subject to market risks, read all the related documents carefully before investing. In case you require any clarification or have any concern, kindly write to us at below email ids: Level 1: For Trading related queries, contact our customer service at ‘[email protected]’ and for demat account related queries contact us at [email protected] or call us on: Toll free numbers 18002099191 / 1860 266 9191 Level 2: If you do not receive a satisfactory response at Level 1 within 3 working days, you may write to us at [email protected] or call us on 022-42858445 and if you feel you are still unheard, write to our customer service HOD at [email protected] or call us on 022-42858208. Level 3: If you still have not received a satisfactory response at Level 2 within 3 working days, you may contact our Compliance Officer (Name: Mr. Manoj Agarwal) at [email protected] or call on 91- (022) 4285 8484. Level 4 : If you have not received a satisfactory response at Level 3 within 7 working days, you may also approach Managing Director / CEO (Mr. Jaideep Hansraj) at [email protected] or call on 91-(022) 4285 8301. First Cut notes published on this site are for information purposes only. They represent early notations and responses by analysts to recent events. Data in the notes may not have been verified by us and investors should not act upon any data or views in these notes. Most First Cut notes, but not necessarily all, will be followed by final research reports on the subject. There could be variance between the First cut note and the final research note on any subject, in which case the contents of the final research note would prevail. We accept no liability for the contents of the First Cut Notes.