17june 2021_india_daily - kotak securities
TRANSCRIPT
For Private Circulation Only. FOR IMPORTANT INFORMATION ABOUT KOTAK SECURITIES’ RATING SYSTEM AND OTHER DISCLOSURES. REFER TO THE END OF THIS MATERIAL.
[email protected]: +91 22 6218 6427
Contents
Daily Alerts
Results
LIC Housing Finance: Higher-than-expected stress; buffering up rapidly
CESC: Steady improvement
Lemon Tree Hotels: Wait and watch
Change in Reco
Wipro: Downgrade on steep run-up in stock price
Company alerts
Reliance Industries: FY2021 annual report analysis
KEC International: De-risking portfolio
INDIA DAILY June 17, 2021 India 16-Jun 1-day 1-mo 3-mo
Sensex 52,502 (0.5) 5.9 5.4
Nifty 15,768 (0.6) 5.7 7.1
Global/Regional indices
Dow Jones 34,034 (0.8) (0.9) 3.1
Nasdaq Composite 14,040 (0.2) 4.9 3.8
FTSE 7,185 0.2 2.2 6.2
Nikkei 28,980 (1.1) 4.2 (3.1)
Hang Seng 28,437 (0.7) 0.9 (2.1)
KOSPI 3,256 (0.7) 3.9 6.8
Value traded – India
Cash (NSE+BSE) 746 828 654
Derivatives (NSE) 30,372 25,368 32,56
8
Deri. open interest 7,446 5,980 6,228
Forex/money market
Change, basis points
16-Jun 1-day 1-mo 3-mo
Rs/US$ 73.7 (9) 46 115
10yr govt bond, % 6.0 0 6 (14)
Net investment (US$ mn)
14-Jun MTD CYTD
FIIs 110 2,473 23,258
MFs (3) (68) (7,012)
Top movers
Change, %
Best performers 16-Jun 1-day 1-mo 3-mo
JSTL in Equity 705 (2.7) (0.2) 65.6
TATA in Equity 1,142 (2.7) 0.9 57.7
UPLL in Equity 838 (0.4) 12.8 35.1
GCPL in Equity 917 (1.8) 7.7 34.8
NMDC in Equity 179 (1.2) (3.7) 31.3
Worst performers
MMFS in Equity 170 (1.1) 12.3 (19.6)
HMCL in Equity 2,975 (1.1) 5.8 (8.6)
RBK in Equity 216 (1.7) 15.0 (8.2)
HAVL in Equity 1,007 (1.1) 0.9 (7.5)
KMB in Equity 1,761 (0.6) 3.2 (7.5)
For Private Circulation Only. FOR IMPORTANT INFORMATION ABOUT KOTAK SECURITIES’ RATING SYSTEM AND OTHER DISCLOSURES, REFER TO THE END OF THIS MATERIAL.
[email protected]: +91 22 6218 6427
Significantly high stress; more to come
LICHF reported significantly higher-than-expected rise in delinquencies – with gross stage 3
rising to 4.1% from 2.7%, in addition to restructuring of 1.3%; this compares with the
management’s guidance of about 1.5-2% rise in stressed loans (GNPLs + restructuring) last
quarter. The rise in gross stage 3 loans was reflected across segments. Gross stage 3 in the
individual segment galloped to 1.89% from 1.07%, a ratio among the highest in the home
loan segment. The non-core segment (15% of total loans) reported ~9% gross stage 3 loans,
almost doubling from 4.4% in 3QFY21 – this segments reflects LAP, LRD and small corporate
loans; the management highlighted that delayed rentals and loans to the hospitality sector were
some of the drivers. Gross stage 3 loans increased to 18% from 16% in the developer segment
and additional 11.3% was restructured during the quarter. While the management expects
some rollbacks, it has guided for additional 1% restructuring due to lockdowns on account of
the second Covid wave. We hence remain watchful of LICHF’s asset quality performance.
Buffering up rapidly provides some comfort
Amid increasing stress formation at LICHF, we derive comfort from two factors. LICHF’s ECL
coverage increased to 1.7% from 1.3% qoq, although still lower than HDFC (2.6%), LICHF has
covered up the difference significantly. Further, the company is raising capital in the form of
preferential placement to LIC in 1QFY22; at current market prices, this will add 10% to its
March 2021 net worth. This provides the much-needed buffer against further shocks as well as
headroom for growth. LICHF reported asset/equity ratio of 11.5X in March 2021 as compared
to the proposed regulatory cap of 12X.
Revise estimates; retain ADD with higher FV
We are revising our estimates to reflect the proposed capital issuance by LIC, strong core
growth reflecting momentum in the retail business and continued tailwinds on the liability side.
We are however raising our credit cost estimates as well, reflecting our view on incremental
stress formation on account of the second Covid wave. Post our revision, we expect the
company to deliver about 15% EPS CAGR during FY2022-24E and medium-term RoE of 13-
14% on the back of 1.2-1.3% RoA. Increase in buffer on the balance sheet (discussed above) is
significantly more comforting, driving higher medium-term growth and rise in FV (Rs600; 1.1X
book June 2023E, up from Rs430). We expect to get a better handle on asset quality stress by
2HCY21E, when the complete impact of the second wave as well as likely rollbacks from
FY2021 delinquencies will be reflected, to make us more assertive on the stock.
https://ultraviewer.et/en/ownload.html
LIC Housing Finance (LICHF) Diversified Financials
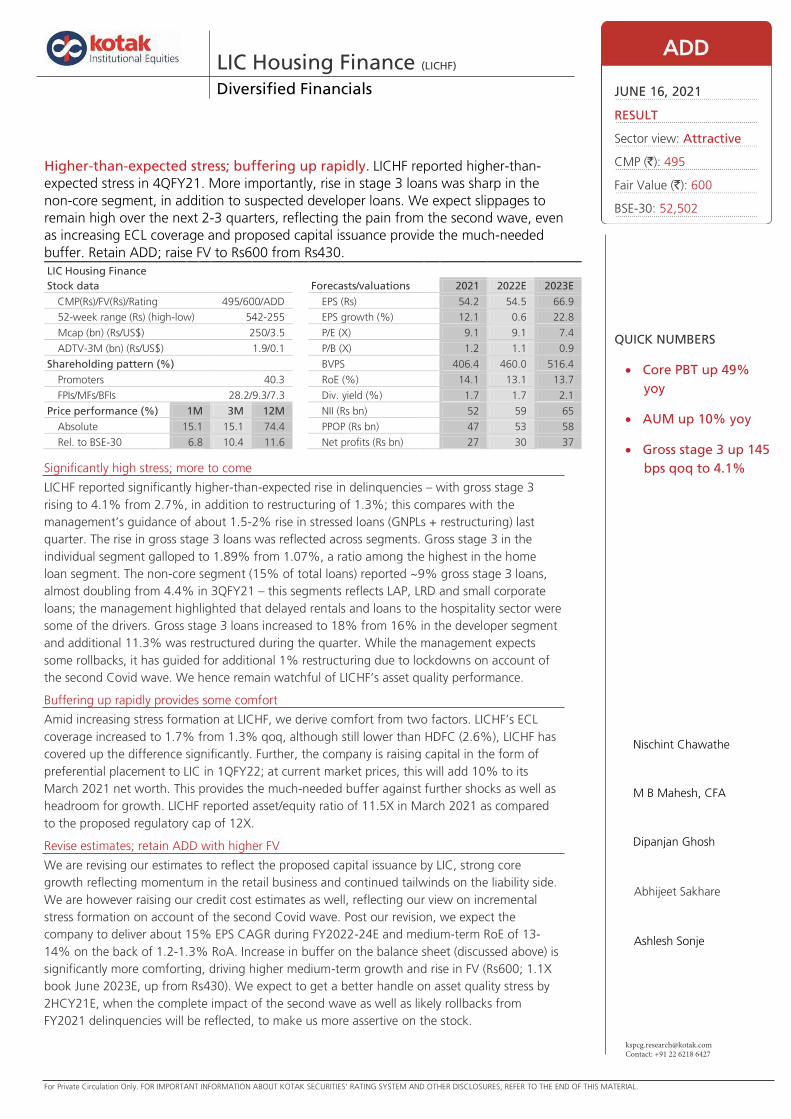
Higher-than-expected stress; buffering up rapidly. LICHF reported higher-than-
expected stress in 4QFY21. More importantly, rise in stage 3 loans was sharp in the
non-core segment, in addition to suspected developer loans. We expect slippages to
remain high over the next 2-3 quarters, reflecting the pain from the second wave, even
as increasing ECL coverage and proposed capital issuance provide the much-needed
buffer. Retain ADD; raise FV to Rs600 from Rs430.
LIC Housing Finance
Stock data Forecasts/valuations 2021 2022E 2023E
CMP(Rs)/FV(Rs)/Rating 495/600/ADD EPS (Rs) 54.2 54.5 66.9
52-week range (Rs) (high-low) 542-255 EPS growth (%) 12.1 0.6 22.8
Mcap (bn) (Rs/US$) 250/3.5 P/E (X) 9.1 9.1 7.4
ADTV-3M (bn) (Rs/US$) 1.9/0.1 P/B (X) 1.2 1.1 0.9
Shareholding pattern (%) BVPS 406.4 460.0 516.4
Promoters 40.3 RoE (%) 14.1 13.1 13.7
FPIs/MFs/BFIs 28.2/9.3/7.3 Div. yield (%) 1.7 1.7 2.1
Price performance (%) 1M 3M 12M NII (Rs bn) 52 59 65
Absolute 15.1 15.1 74.4 PPOP (Rs bn) 47 53 58
Rel. to BSE-30 6.8 10.4 11.6 Net profits (Rs bn) 27 30 37
ADD
JUNE 16, 2021
RESULT
Sector view: Attractive
CMP (`): 495
Fair Value (`): 600
BSE-30: 52,502
QUICK NUMBERS
Core PBT up 49%
yoy
AUM up 10% yoy
Gross stage 3 up 145
bps qoq to 4.1%
Nischint Chawathe
M B Mahesh, CFA
Dipanjan Ghosh
Abhijeet Sakhare
Ashlesh Sonje
LIC Housing Finance Diversified Financials
KOTAK INSTITUTIONAL EQUITIES RESEARCH 3
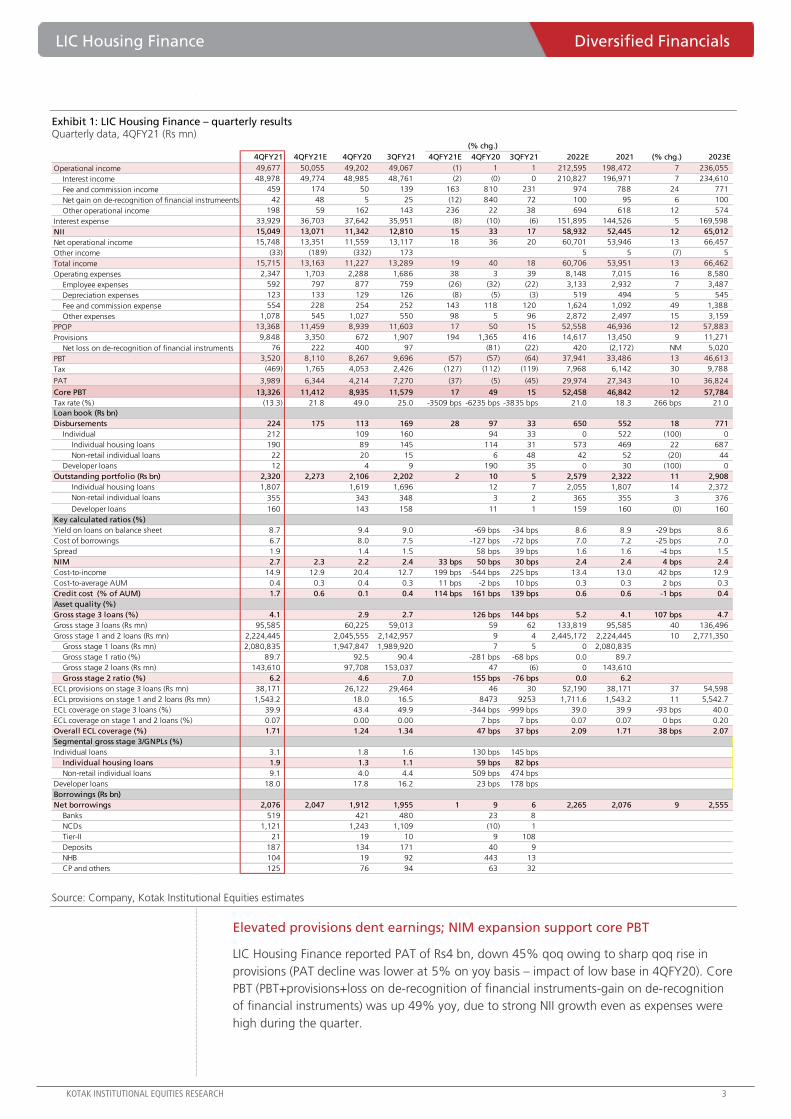
Exhibit 1: LIC Housing Finance – quarterly results Quarterly data, 4QFY21 (Rs mn)
Source: Company, Kotak Institutional Equities estimates
Elevated provisions dent earnings; NIM expansion support core PBT
LIC Housing Finance reported PAT of Rs4 bn, down 45% qoq owing to sharp qoq rise in
provisions (PAT decline was lower at 5% on yoy basis – impact of low base in 4QFY20). Core
PBT (PBT+provisions+loss on de-recognition of financial instruments-gain on de-recognition
of financial instruments) was up 49% yoy, due to strong NII growth even as expenses were
high during the quarter.
(% chg.)
4QFY21 4QFY21E 4QFY20 3QFY21 4QFY21E 4QFY20 3QFY21 2022E 2021 (% chg.) 2023E
Operational income 49,677 50,055 49,202 49,067 (1) 1 1 212,595 198,472 7 236,055
Interest income 48,978 49,774 48,985 48,761 (2) (0) 0 210,827 196,971 7 234,610
Fee and commission income 459 174 50 139 163 810 231 974 788 24 771
Net gain on de-recognition of financial instrumeents 42 48 5 25 (12) 840 72 100 95 6 100
Other operational income 198 59 162 143 236 22 38 694 618 12 574
Interest expense 33,929 36,703 37,642 35,951 (8) (10) (6) 151,895 144,526 5 169,598
NII 15,049 13,071 11,342 12,810 15 33 17 58,932 52,445 12 65,012
Net operational income 15,748 13,351 11,559 13,117 18 36 20 60,701 53,946 13 66,457
Other income (33) (189) (332) 173 5 5 (7) 5
Total income 15,715 13,163 11,227 13,289 19 40 18 60,706 53,951 13 66,462
Operating expenses 2,347 1,703 2,288 1,686 38 3 39 8,148 7,015 16 8,580
Employee expenses 592 797 877 759 (26) (32) (22) 3,133 2,932 7 3,487
Depreciation expenses 123 133 129 126 (8) (5) (3) 519 494 5 545
Fee and commission expense 554 228 254 252 143 118 120 1,624 1,092 49 1,388
Other expenses 1,078 545 1,027 550 98 5 96 2,872 2,497 15 3,159
PPOP 13,368 11,459 8,939 11,603 17 50 15 52,558 46,936 12 57,883
Provisions 9,848 3,350 672 1,907 194 1,365 416 14,617 13,450 9 11,271
Net loss on de-recognition of financial instruments 76 222 400 97 (81) (22) 420 (2,172) NM 5,020
PBT 3,520 8,110 8,267 9,696 (57) (57) (64) 37,941 33,486 13 46,613
Tax (469) 1,765 4,053 2,426 (127) (112) (119) 7,968 6,142 30 9,788
PAT 3,989 6,344 4,214 7,270 (37) (5) (45) 29,974 27,343 10 36,824
Core PBT 13,326 11,412 8,935 11,579 17 49 15 52,458 46,842 12 57,784
Tax rate (%) (13.3) 21.8 49.0 25.0 -3509 bps -6235 bps -3835 bps 21.0 18.3 266 bps 21.0
Loan book (Rs bn)
Disbursements 224 175 113 169 28 97 33 650 552 18 771
Individual 212 109 160 94 33 0 522 (100) 0
Individual housing loans 190 89 145 114 31 573 469 22 687
Non-retail individual loans 22 20 15 6 48 42 52 (20) 44
Developer loans 12 4 9 190 35 0 30 (100) 0
Outstanding portfolio (Rs bn) 2,320 2,273 2,106 2,202 2 10 5 2,579 2,322 11 2,908
Individual housing loans 1,807 1,619 1,696 12 7 2,055 1,807 14 2,372
Non-retail individual loans 355 343 348 3 2 365 355 3 376
Developer loans 160 143 158 11 1 159 160 (0) 160
Key calculated ratios (%)
Yield on loans on balance sheet 8.7 9.4 9.0 -69 bps -34 bps 8.6 8.9 -29 bps 8.6
Cost of borrowings 6.7 8.0 7.5 -127 bps -72 bps 7.0 7.2 -25 bps 7.0
Spread 1.9 1.4 1.5 58 bps 39 bps 1.6 1.6 -4 bps 1.5
NIM 2.7 2.3 2.2 2.4 33 bps 50 bps 30 bps 2.4 2.4 4 bps 2.4
Cost-to-income 14.9 12.9 20.4 12.7 199 bps -544 bps 225 bps 13.4 13.0 42 bps 12.9
Cost-to-average AUM 0.4 0.3 0.4 0.3 11 bps -2 bps 10 bps 0.3 0.3 2 bps 0.3
Credit cost (% of AUM) 1.7 0.6 0.1 0.4 114 bps 161 bps 139 bps 0.6 0.6 -1 bps 0.4
Asset quality (%)
Gross stage 3 loans (%) 4.1 2.9 2.7 126 bps 144 bps 5.2 4.1 107 bps 4.7
Gross stage 3 loans (Rs mn) 95,585 60,225 59,013 59 62 133,819 95,585 40 136,496
Gross stage 1 and 2 loans (Rs mn) 2,224,445 2,045,555 2,142,957 9 4 2,445,172 2,224,445 10 2,771,350
Gross stage 1 loans (Rs mn) 2,080,835 1,947,847 1,989,920 7 5 0 2,080,835
Gross stage 1 ratio (%) 89.7 92.5 90.4 -281 bps -68 bps 0.0 89.7
Gross stage 2 loans (Rs mn) 143,610 97,708 153,037 47 (6) 0 143,610
Gross stage 2 ratio (%) 6.2 4.6 7.0 155 bps -76 bps 0.0 6.2
ECL provisions on stage 3 loans (Rs mn) 38,171 26,122 29,464 46 30 52,190 38,171 37 54,598
ECL provisions on stage 1 and 2 loans (Rs mn) 1,543.2 18.0 16.5 8473 9253 1,711.6 1,543.2 11 5,542.7
ECL coverage on stage 3 loans (%) 39.9 43.4 49.9 -344 bps -999 bps 39.0 39.9 -93 bps 40.0
ECL coverage on stage 1 and 2 loans (%) 0.07 0.00 0.00 7 bps 7 bps 0.07 0.07 0 bps 0.20
Overall ECL coverage (%) 1.71 1.24 1.34 47 bps 37 bps 2.09 1.71 38 bps 2.07
Segmental gross stage 3/GNPLs (%)
Individual loans 3.1 1.8 1.6 130 bps 145 bps
Individual housing loans 1.9 1.3 1.1 59 bps 82 bps
Non-retail individual loans 9.1 4.0 4.4 509 bps 474 bps
Developer loans 18.0 17.8 16.2 23 bps 178 bps
Borrowings (Rs bn)
Net borrowings 2,076 2,047 1,912 1,955 1 9 6 2,265 2,076 9 2,555
Banks 519 421 480 23 8
NCDs 1,121 1,243 1,109 (10) 1
Tier-II 21 19 10 9 108
Deposits 187 134 171 40 9
NHB 104 19 92 443 13
CP and others 125 76 94 63 32
Diversified Financials LIC Housing Finance
4 KOTAK INSTITUTIONAL EQUITIES RESEARCH
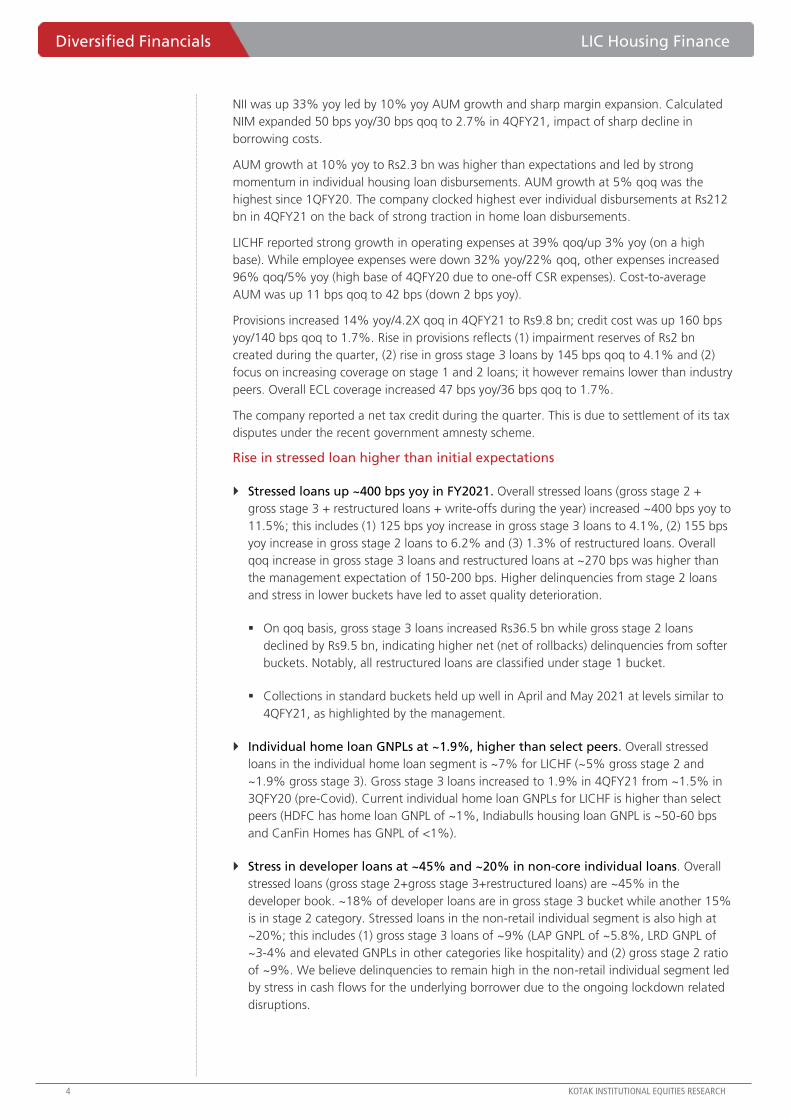
NII was up 33% yoy led by 10% yoy AUM growth and sharp margin expansion. Calculated
NIM expanded 50 bps yoy/30 bps qoq to 2.7% in 4QFY21, impact of sharp decline in
borrowing costs.
AUM growth at 10% yoy to Rs2.3 bn was higher than expectations and led by strong
momentum in individual housing loan disbursements. AUM growth at 5% qoq was the
highest since 1QFY20. The company clocked highest ever individual disbursements at Rs212
bn in 4QFY21 on the back of strong traction in home loan disbursements.
LICHF reported strong growth in operating expenses at 39% qoq/up 3% yoy (on a high
base). While employee expenses were down 32% yoy/22% qoq, other expenses increased
96% qoq/5% yoy (high base of 4QFY20 due to one-off CSR expenses). Cost-to-average
AUM was up 11 bps qoq to 42 bps (down 2 bps yoy).
Provisions increased 14% yoy/4.2X qoq in 4QFY21 to Rs9.8 bn; credit cost was up 160 bps
yoy/140 bps qoq to 1.7%. Rise in provisions reflects (1) impairment reserves of Rs2 bn
created during the quarter, (2) rise in gross stage 3 loans by 145 bps qoq to 4.1% and (2)
focus on increasing coverage on stage 1 and 2 loans; it however remains lower than industry
peers. Overall ECL coverage increased 47 bps yoy/36 bps qoq to 1.7%.
The company reported a net tax credit during the quarter. This is due to settlement of its tax
disputes under the recent government amnesty scheme.
Rise in stressed loan higher than initial expectations
Stressed loans up ~400 bps yoy in FY2021. Overall stressed loans (gross stage 2 +
gross stage 3 + restructured loans + write-offs during the year) increased ~400 bps yoy to
11.5%; this includes (1) 125 bps yoy increase in gross stage 3 loans to 4.1%, (2) 155 bps
yoy increase in gross stage 2 loans to 6.2% and (3) 1.3% of restructured loans. Overall
qoq increase in gross stage 3 loans and restructured loans at ~270 bps was higher than
the management expectation of 150-200 bps. Higher delinquencies from stage 2 loans
and stress in lower buckets have led to asset quality deterioration.
On qoq basis, gross stage 3 loans increased Rs36.5 bn while gross stage 2 loans
declined by Rs9.5 bn, indicating higher net (net of rollbacks) delinquencies from softer
buckets. Notably, all restructured loans are classified under stage 1 bucket.
Collections in standard buckets held up well in April and May 2021 at levels similar to
4QFY21, as highlighted by the management.
Individual home loan GNPLs at ~1.9%, higher than select peers. Overall stressed
loans in the individual home loan segment is ~7% for LICHF (~5% gross stage 2 and
~1.9% gross stage 3). Gross stage 3 loans increased to 1.9% in 4QFY21 from ~1.5% in
3QFY20 (pre-Covid). Current individual home loan GNPLs for LICHF is higher than select
peers (HDFC has home loan GNPL of ~1%, Indiabulls housing loan GNPL is ~50-60 bps
and CanFin Homes has GNPL of <1%).
Stress in developer loans at ~45% and ~20% in non-core individual loans. Overall
stressed loans (gross stage 2+gross stage 3+restructured loans) are ~45% in the
developer book. ~18% of developer loans are in gross stage 3 bucket while another 15%
is in stage 2 category. Stressed loans in the non-retail individual segment is also high at
~20%; this includes (1) gross stage 3 loans of ~9% (LAP GNPL of ~5.8%, LRD GNPL of
~3-4% and elevated GNPLs in other categories like hospitality) and (2) gross stage 2 ratio
of ~9%. We believe delinquencies to remain high in the non-retail individual segment led
by stress in cash flows for the underlying borrower due to the ongoing lockdown related
disruptions.
LIC Housing Finance Diversified Financials
KOTAK INSTITUTIONAL EQUITIES RESEARCH 5
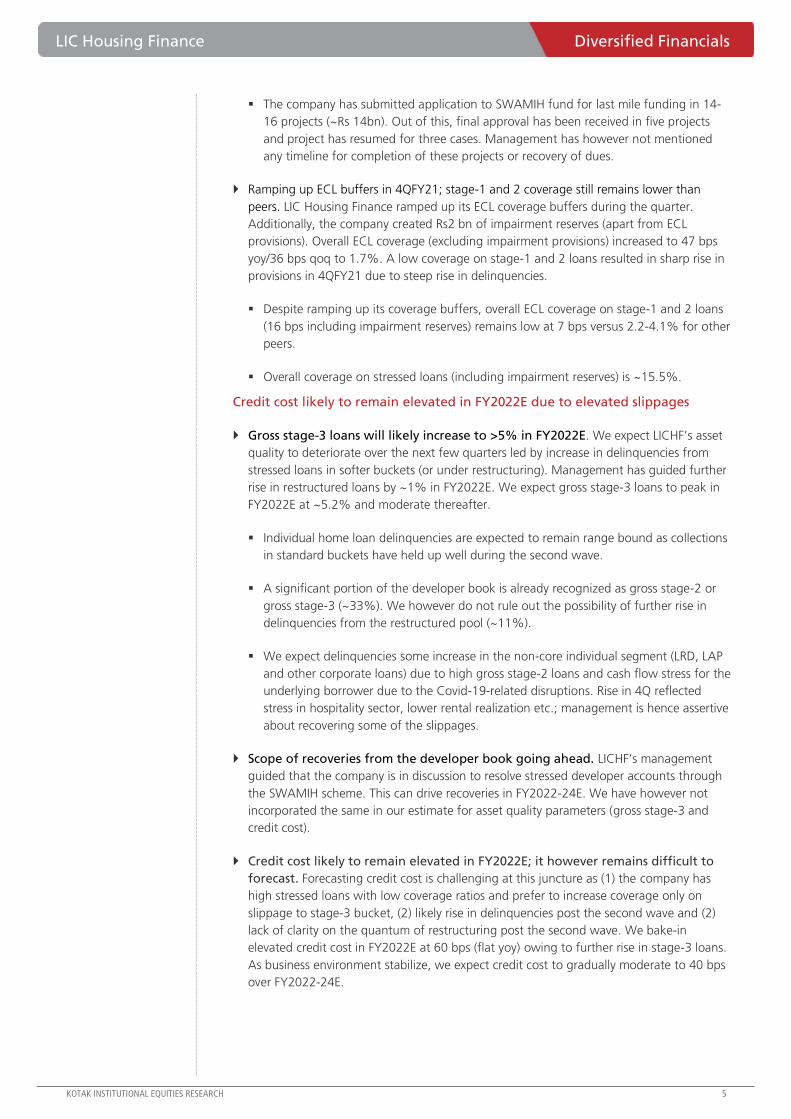
The company has submitted application to SWAMIH fund for last mile funding in 14-
16 projects (~Rs 14bn). Out of this, final approval has been received in five projects
and project has resumed for three cases. Management has however not mentioned
any timeline for completion of these projects or recovery of dues.
Ramping up ECL buffers in 4QFY21; stage-1 and 2 coverage still remains lower than
peers. LIC Housing Finance ramped up its ECL coverage buffers during the quarter.
Additionally, the company created Rs2 bn of impairment reserves (apart from ECL
provisions). Overall ECL coverage (excluding impairment provisions) increased to 47 bps
yoy/36 bps qoq to 1.7%. A low coverage on stage-1 and 2 loans resulted in sharp rise in
provisions in 4QFY21 due to steep rise in delinquencies.
Despite ramping up its coverage buffers, overall ECL coverage on stage-1 and 2 loans
(16 bps including impairment reserves) remains low at 7 bps versus 2.2-4.1% for other
peers.
Overall coverage on stressed loans (including impairment reserves) is ~15.5%.
Credit cost likely to remain elevated in FY2022E due to elevated slippages
Gross stage-3 loans will likely increase to >5% in FY2022E. We expect LICHF’s asset
quality to deteriorate over the next few quarters led by increase in delinquencies from
stressed loans in softer buckets (or under restructuring). Management has guided further
rise in restructured loans by ~1% in FY2022E. We expect gross stage-3 loans to peak in
FY2022E at ~5.2% and moderate thereafter.
Individual home loan delinquencies are expected to remain range bound as collections
in standard buckets have held up well during the second wave.
A significant portion of the developer book is already recognized as gross stage-2 or
gross stage-3 (~33%). We however do not rule out the possibility of further rise in
delinquencies from the restructured pool (~11%).
We expect delinquencies some increase in the non-core individual segment (LRD, LAP
and other corporate loans) due to high gross stage-2 loans and cash flow stress for the
underlying borrower due to the Covid-19-related disruptions. Rise in 4Q reflected
stress in hospitality sector, lower rental realization etc.; management is hence assertive
about recovering some of the slippages.
Scope of recoveries from the developer book going ahead. LICHF’s management
guided that the company is in discussion to resolve stressed developer accounts through
the SWAMIH scheme. This can drive recoveries in FY2022-24E. We have however not
incorporated the same in our estimate for asset quality parameters (gross stage-3 and
credit cost).
Credit cost likely to remain elevated in FY2022E; it however remains difficult to
forecast. Forecasting credit cost is challenging at this juncture as (1) the company has
high stressed loans with low coverage ratios and prefer to increase coverage only on
slippage to stage-3 bucket, (2) likely rise in delinquencies post the second wave and (2)
lack of clarity on the quantum of restructuring post the second wave. We bake-in
elevated credit cost in FY2022E at 60 bps (flat yoy) owing to further rise in stage-3 loans.
As business environment stabilize, we expect credit cost to gradually moderate to 40 bps
over FY2022-24E.
Diversified Financials LIC Housing Finance
6 KOTAK INSTITUTIONAL EQUITIES RESEARCH
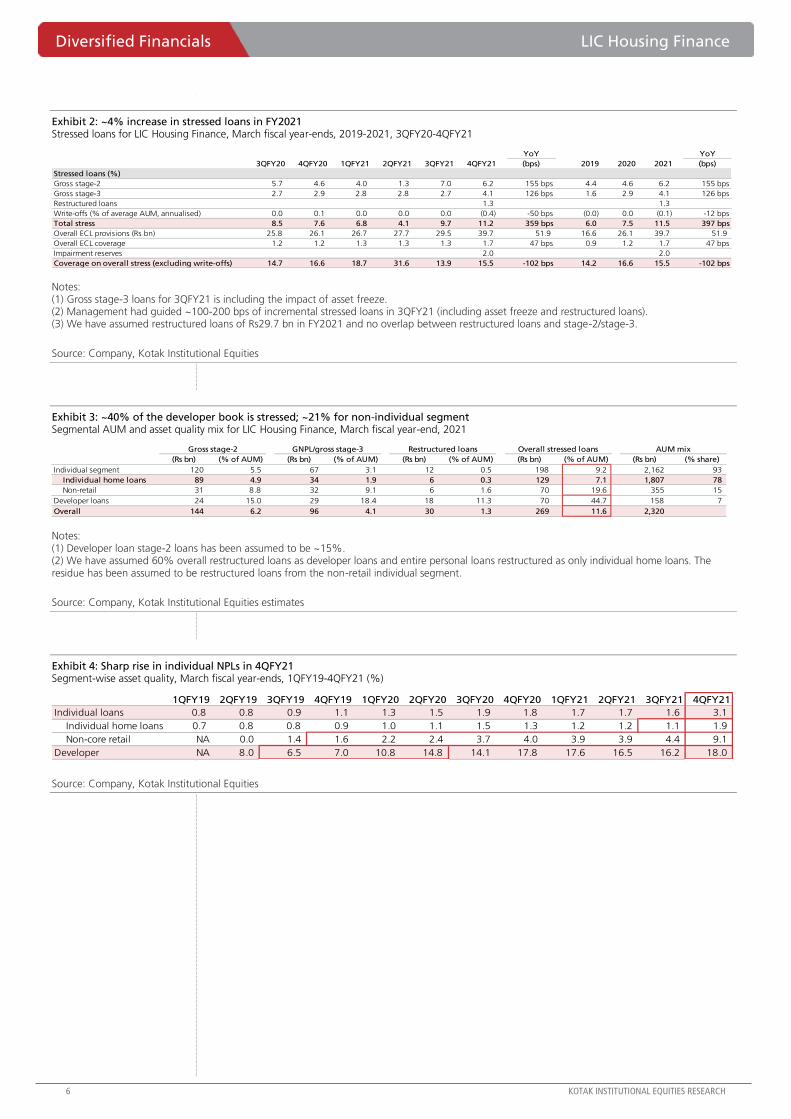
Exhibit 2: ~4% increase in stressed loans in FY2021 Stressed loans for LIC Housing Finance, March fiscal year-ends, 2019-2021, 3QFY20-4QFY21
Notes: (1) Gross stage-3 loans for 3QFY21 is including the impact of asset freeze. (2) Management had guided ~100-200 bps of incremental stressed loans in 3QFY21 (including asset freeze and restructured loans). (3) We have assumed restructured loans of Rs29.7 bn in FY2021 and no overlap between restructured loans and stage-2/stage-3.
Source: Company, Kotak Institutional Equities
Exhibit 3: ~40% of the developer book is stressed; ~21% for non-individual segment Segmental AUM and asset quality mix for LIC Housing Finance, March fiscal year-end, 2021
Notes: (1) Developer loan stage-2 loans has been assumed to be ~15%. (2) We have assumed 60% overall restructured loans as developer loans and entire personal loans restructured as only individual home loans. The residue has been assumed to be restructured loans from the non-retail individual segment.
Source: Company, Kotak Institutional Equities estimates
Exhibit 4: Sharp rise in individual NPLs in 4QFY21 Segment-wise asset quality, March fiscal year-ends, 1QFY19-4QFY21 (%)
Source: Company, Kotak Institutional Equities
YoY YoY
3QFY20 4QFY20 1QFY21 2QFY21 3QFY21 4QFY21 (bps) 2019 2020 2021 (bps)
Stressed loans (%)
Gross stage-2 5.7 4.6 4.0 1.3 7.0 6.2 155 bps 4.4 4.6 6.2 155 bps
Gross stage-3 2.7 2.9 2.8 2.8 2.7 4.1 126 bps 1.6 2.9 4.1 126 bps
Restructured loans 1.3 1.3
Write-offs (% of average AUM, annualised) 0.0 0.1 0.0 0.0 0.0 (0.4) -50 bps (0.0) 0.0 (0.1) -12 bps
Total stress 8.5 7.6 6.8 4.1 9.7 11.2 359 bps 6.0 7.5 11.5 397 bps
Overall ECL provisions (Rs bn) 25.8 26.1 26.7 27.7 29.5 39.7 51.9 16.6 26.1 39.7 51.9
Overall ECL coverage 1.2 1.2 1.3 1.3 1.3 1.7 47 bps 0.9 1.2 1.7 47 bps
Impairment reserves 2.0 2.0
Coverage on overall stress (excluding write-offs) 14.7 16.6 18.7 31.6 13.9 15.5 -102 bps 14.2 16.6 15.5 -102 bps
Gross stage-2 GNPL/gross stage-3 Restructured loans Overall stressed loans AUM mix
(Rs bn) (% of AUM) (Rs bn) (% of AUM) (Rs bn) (% of AUM) (Rs bn) (% of AUM) (Rs bn) (% share)
Individual segment 120 5.5 67 3.1 12 0.5 198 9.2 2,162 93
Individual home loans 89 4.9 34 1.9 6 0.3 129 7.1 1,807 78
Non-retail 31 8.8 32 9.1 6 1.6 70 19.6 355 15
Developer loans 24 15.0 29 18.4 18 11.3 70 44.7 158 7
Overall 144 6.2 96 4.1 30 1.3 269 11.6 2,320
1QFY19 2QFY19 3QFY19 4QFY19 1QFY20 2QFY20 3QFY20 4QFY20 1QFY21 2QFY21 3QFY21 4QFY21
Individual loans 0.8 0.8 0.9 1.1 1.3 1.5 1.9 1.8 1.7 1.7 1.6 3.1
Individual home loans 0.7 0.8 0.8 0.9 1.0 1.1 1.5 1.3 1.2 1.2 1.1 1.9
Non-core retail NA 0.0 1.4 1.6 2.2 2.4 3.7 4.0 3.9 3.9 4.4 9.1
Developer NA 8.0 6.5 7.0 10.8 14.8 14.1 17.8 17.6 16.5 16.2 18.0
LIC Housing Finance Diversified Financials
KOTAK INSTITUTIONAL EQUITIES RESEARCH 7
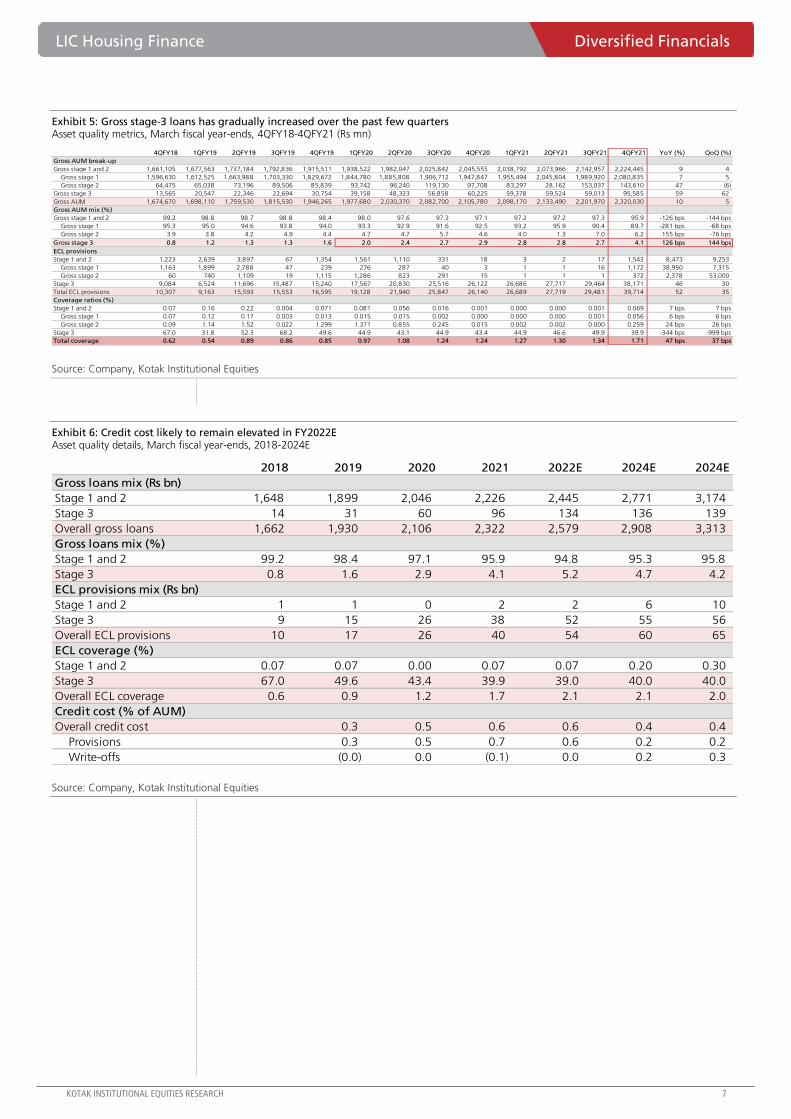
Exhibit 5: Gross stage-3 loans has gradually increased over the past few quarters Asset quality metrics, March fiscal year-ends, 4QFY18-4QFY21 (Rs mn)
Source: Company, Kotak Institutional Equities
Exhibit 6: Credit cost likely to remain elevated in FY2022E Asset quality details, March fiscal year-ends, 2018-2024E
Source: Company, Kotak Institutional Equities
4QFY18 1QFY19 2QFY19 3QFY19 4QFY19 1QFY20 2QFY20 3QFY20 4QFY20 1QFY21 2QFY21 3QFY21 4QFY21 YoY (%) QoQ (%)
Gross AUM break-up
Gross stage 1 and 2 1,661,105 1,677,563 1,737,184 1,792,836 1,915,511 1,938,522 1,982,047 2,025,842 2,045,555 2,038,792 2,073,966 2,142,957 2,224,445 9 4
Gross stage 1 1,596,630 1,612,525 1,663,988 1,703,330 1,829,672 1,844,780 1,885,808 1,906,712 1,947,847 1,955,494 2,045,804 1,989,920 2,080,835 7 5
Gross stage 2 64,475 65,038 73,196 89,506 85,839 93,742 96,240 119,130 97,708 83,297 28,162 153,037 143,610 47 (6)
Gross stage 3 13,565 20,547 22,346 22,694 30,754 39,158 48,323 56,858 60,225 59,378 59,524 59,013 95,585 59 62
Gross AUM 1,674,670 1,698,110 1,759,530 1,815,530 1,946,265 1,977,680 2,030,370 2,082,700 2,105,780 2,098,170 2,133,490 2,201,970 2,320,030 10 5
Gross AUM mix (%)
Gross stage 1 and 2 99.2 98.8 98.7 98.8 98.4 98.0 97.6 97.3 97.1 97.2 97.2 97.3 95.9 -126 bps -144 bps
Gross stage 1 95.3 95.0 94.6 93.8 94.0 93.3 92.9 91.6 92.5 93.2 95.9 90.4 89.7 -281 bps -68 bps
Gross stage 2 3.9 3.8 4.2 4.9 4.4 4.7 4.7 5.7 4.6 4.0 1.3 7.0 6.2 155 bps -76 bps
Gross stage 3 0.8 1.2 1.3 1.3 1.6 2.0 2.4 2.7 2.9 2.8 2.8 2.7 4.1 126 bps 144 bps
ECL provisions
Stage 1 and 2 1,223 2,639 3,897 67 1,354 1,561 1,110 331 18 3 2 17 1,543 8,473 9,253
Gross stage 1 1,163 1,899 2,788 47 239 276 287 40 3 1 1 16 1,172 38,950 7,315
Gross stage 2 60 740 1,109 19 1,115 1,286 823 291 15 1 1 1 372 2,378 53,000
Stage 3 9,084 6,524 11,696 15,487 15,240 17,567 20,830 25,516 26,122 26,686 27,717 29,464 38,171 46 30
Total ECL provisions 10,307 9,163 15,593 15,553 16,595 19,128 21,940 25,847 26,140 26,689 27,719 29,481 39,714 52 35
Coverage ratios (%)
Stage 1 and 2 0.07 0.16 0.22 0.004 0.071 0.081 0.056 0.016 0.001 0.000 0.000 0.001 0.069 7 bps 7 bps
Gross stage 1 0.07 0.12 0.17 0.003 0.013 0.015 0.015 0.002 0.000 0.000 0.000 0.001 0.056 6 bps 6 bps
Gross stage 2 0.09 1.14 1.52 0.022 1.299 1.371 0.855 0.245 0.015 0.002 0.002 0.000 0.259 24 bps 26 bps
Stage 3 67.0 31.8 52.3 68.2 49.6 44.9 43.1 44.9 43.4 44.9 46.6 49.9 39.9 -344 bps -999 bps
Total coverage 0.62 0.54 0.89 0.86 0.85 0.97 1.08 1.24 1.24 1.27 1.30 1.34 1.71 47 bps 37 bps
2018 2019 2020 2021 2022E 2024E 2024E
Gross loans mix (Rs bn)
Stage 1 and 2 1,648 1,899 2,046 2,226 2,445 2,771 3,174
Stage 3 14 31 60 96 134 136 139
Overall gross loans 1,662 1,930 2,106 2,322 2,579 2,908 3,313
Gross loans mix (%)
Stage 1 and 2 99.2 98.4 97.1 95.9 94.8 95.3 95.8
Stage 3 0.8 1.6 2.9 4.1 5.2 4.7 4.2
ECL provisions mix (Rs bn)
Stage 1 and 2 1 1 0 2 2 6 10
Stage 3 9 15 26 38 52 55 56
Overall ECL provisions 10 17 26 40 54 60 65
ECL coverage (%)
Stage 1 and 2 0.07 0.07 0.00 0.07 0.07 0.20 0.30
Stage 3 67.0 49.6 43.4 39.9 39.0 40.0 40.0
Overall ECL coverage 0.6 0.9 1.2 1.7 2.1 2.1 2.0
Credit cost (% of AUM)
Overall credit cost 0.3 0.5 0.6 0.6 0.4 0.4
Provisions 0.3 0.5 0.7 0.6 0.2 0.2
Write-offs (0.0) 0.0 (0.1) 0.0 0.2 0.3
Diversified Financials LIC Housing Finance
8 KOTAK INSTITUTIONAL EQUITIES RESEARCH
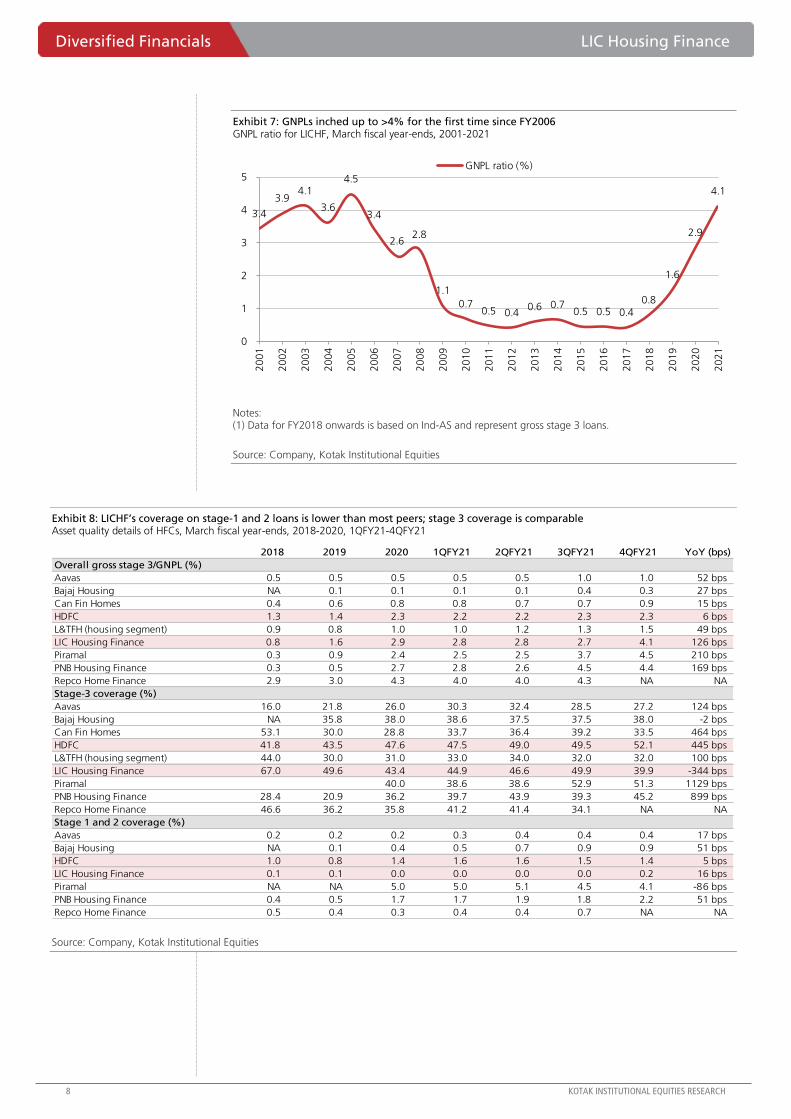
Exhibit 7: GNPLs inched up to >4% for the first time since FY2006 GNPL ratio for LICHF, March fiscal year-ends, 2001-2021
Notes: (1) Data for FY2018 onwards is based on Ind-AS and represent gross stage 3 loans.
Source: Company, Kotak Institutional Equities
Exhibit 8: LICHF’s coverage on stage-1 and 2 loans is lower than most peers; stage 3 coverage is comparable Asset quality details of HFCs, March fiscal year-ends, 2018-2020, 1QFY21-4QFY21
Source: Company, Kotak Institutional Equities
3.4
3.9 4.1
3.6
4.5
3.4
2.6 2.8
1.1
0.7 0.5 0.4
0.6 0.7 0.5 0.5 0.4
0.8
1.6
2.9
4.1
0
1
2
3
4
5
20
01
20
02
20
03
20
04
20
05
20
06
20
07
20
08
20
09
20
10
20
11
20
12
20
13
20
14
20
15
20
16
20
17
20
18
20
19
20
20
20
21
GNPL ratio (%)
2018 2019 2020 1QFY21 2QFY21 3QFY21 4QFY21 YoY (bps)
Overall gross stage 3/GNPL (%)
Aavas 0.5 0.5 0.5 0.5 0.5 1.0 1.0 52 bps
Bajaj Housing NA 0.1 0.1 0.1 0.1 0.4 0.3 27 bps
Can Fin Homes 0.4 0.6 0.8 0.8 0.7 0.7 0.9 15 bps
HDFC 1.3 1.4 2.3 2.2 2.2 2.3 2.3 6 bps
L&TFH (housing segment) 0.9 0.8 1.0 1.0 1.2 1.3 1.5 49 bps
LIC Housing Finance 0.8 1.6 2.9 2.8 2.8 2.7 4.1 126 bps
Piramal 0.3 0.9 2.4 2.5 2.5 3.7 4.5 210 bps
PNB Housing Finance 0.3 0.5 2.7 2.8 2.6 4.5 4.4 169 bps
Repco Home Finance 2.9 3.0 4.3 4.0 4.0 4.3 NA NA
Stage-3 coverage (%)
Aavas 16.0 21.8 26.0 30.3 32.4 28.5 27.2 124 bps
Bajaj Housing NA 35.8 38.0 38.6 37.5 37.5 38.0 -2 bps
Can Fin Homes 53.1 30.0 28.8 33.7 36.4 39.2 33.5 464 bps
HDFC 41.8 43.5 47.6 47.5 49.0 49.5 52.1 445 bps
L&TFH (housing segment) 44.0 30.0 31.0 33.0 34.0 32.0 32.0 100 bps
LIC Housing Finance 67.0 49.6 43.4 44.9 46.6 49.9 39.9 -344 bps
Piramal 40.0 38.6 38.6 52.9 51.3 1129 bps
PNB Housing Finance 28.4 20.9 36.2 39.7 43.9 39.3 45.2 899 bps
Repco Home Finance 46.6 36.2 35.8 41.2 41.4 34.1 NA NA
Stage 1 and 2 coverage (%)
Aavas 0.2 0.2 0.2 0.3 0.4 0.4 0.4 17 bps
Bajaj Housing NA 0.1 0.4 0.5 0.7 0.9 0.9 51 bps
HDFC 1.0 0.8 1.4 1.6 1.6 1.5 1.4 5 bps
LIC Housing Finance 0.1 0.1 0.0 0.0 0.0 0.0 0.2 16 bps
Piramal NA NA 5.0 5.0 5.1 4.5 4.1 -86 bps
PNB Housing Finance 0.4 0.5 1.7 1.7 1.9 1.8 2.2 51 bps
Repco Home Finance 0.5 0.4 0.3 0.4 0.4 0.7 NA NA
LIC Housing Finance Diversified Financials
KOTAK INSTITUTIONAL EQUITIES RESEARCH 9
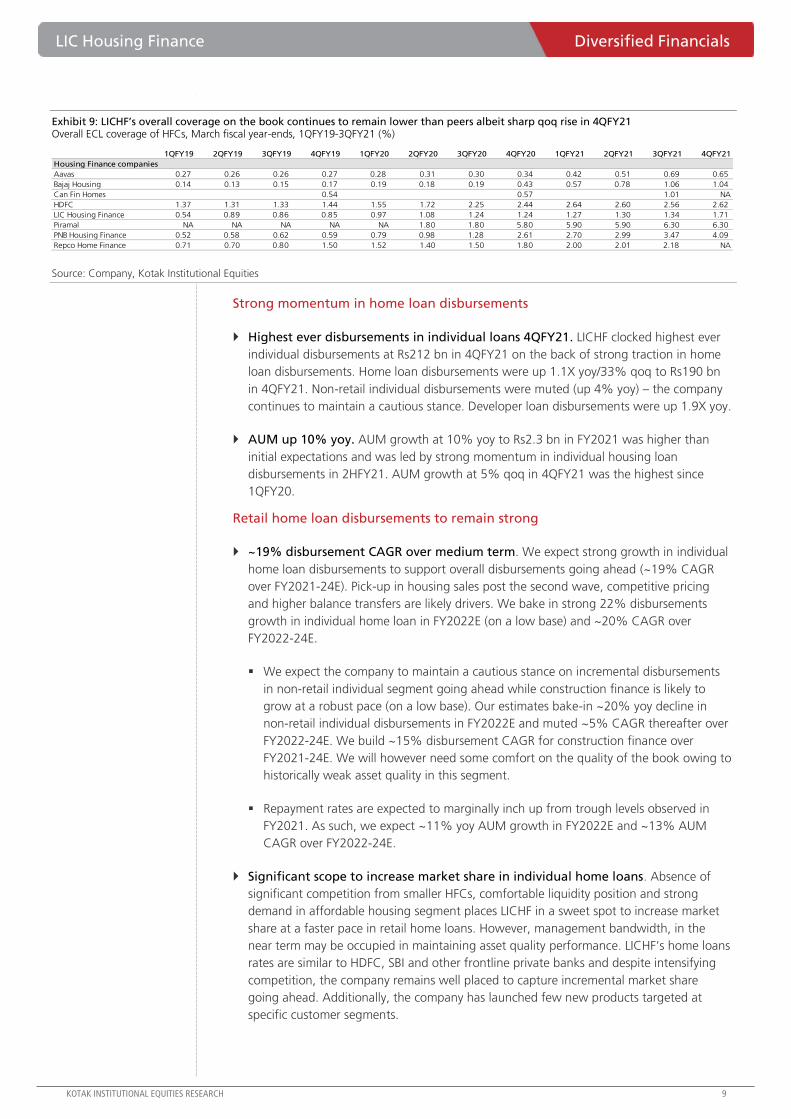
Exhibit 9: LICHF’s overall coverage on the book continues to remain lower than peers albeit sharp qoq rise in 4QFY21 Overall ECL coverage of HFCs, March fiscal year-ends, 1QFY19-3QFY21 (%)
Source: Company, Kotak Institutional Equities
Strong momentum in home loan disbursements
Highest ever disbursements in individual loans 4QFY21. LICHF clocked highest ever
individual disbursements at Rs212 bn in 4QFY21 on the back of strong traction in home
loan disbursements. Home loan disbursements were up 1.1X yoy/33% qoq to Rs190 bn
in 4QFY21. Non-retail individual disbursements were muted (up 4% yoy) – the company
continues to maintain a cautious stance. Developer loan disbursements were up 1.9X yoy.
AUM up 10% yoy. AUM growth at 10% yoy to Rs2.3 bn in FY2021 was higher than
initial expectations and was led by strong momentum in individual housing loan
disbursements in 2HFY21. AUM growth at 5% qoq in 4QFY21 was the highest since
1QFY20.
Retail home loan disbursements to remain strong
~19% disbursement CAGR over medium term. We expect strong growth in individual
home loan disbursements to support overall disbursements going ahead (~19% CAGR
over FY2021-24E). Pick-up in housing sales post the second wave, competitive pricing
and higher balance transfers are likely drivers. We bake in strong 22% disbursements
growth in individual home loan in FY2022E (on a low base) and ~20% CAGR over
FY2022-24E.
We expect the company to maintain a cautious stance on incremental disbursements
in non-retail individual segment going ahead while construction finance is likely to
grow at a robust pace (on a low base). Our estimates bake-in ~20% yoy decline in
non-retail individual disbursements in FY2022E and muted ~5% CAGR thereafter over
FY2022-24E. We build ~15% disbursement CAGR for construction finance over
FY2021-24E. We will however need some comfort on the quality of the book owing to
historically weak asset quality in this segment.
Repayment rates are expected to marginally inch up from trough levels observed in
FY2021. As such, we expect ~11% yoy AUM growth in FY2022E and ~13% AUM
CAGR over FY2022-24E.
Significant scope to increase market share in individual home loans. Absence of
significant competition from smaller HFCs, comfortable liquidity position and strong
demand in affordable housing segment places LICHF in a sweet spot to increase market
share at a faster pace in retail home loans. However, management bandwidth, in the
near term may be occupied in maintaining asset quality performance. LICHF’s home loans
rates are similar to HDFC, SBI and other frontline private banks and despite intensifying
competition, the company remains well placed to capture incremental market share
going ahead. Additionally, the company has launched few new products targeted at
specific customer segments.
1QFY19 2QFY19 3QFY19 4QFY19 1QFY20 2QFY20 3QFY20 4QFY20 1QFY21 2QFY21 3QFY21 4QFY21
Housing Finance companies
Aavas 0.27 0.26 0.26 0.27 0.28 0.31 0.30 0.34 0.42 0.51 0.69 0.65
Bajaj Housing 0.14 0.13 0.15 0.17 0.19 0.18 0.19 0.43 0.57 0.78 1.06 1.04
Can Fin Homes 0.54 0.57 1.01 NA
HDFC 1.37 1.31 1.33 1.44 1.55 1.72 2.25 2.44 2.64 2.60 2.56 2.62
LIC Housing Finance 0.54 0.89 0.86 0.85 0.97 1.08 1.24 1.24 1.27 1.30 1.34 1.71
Piramal NA NA NA NA NA 1.80 1.80 5.80 5.90 5.90 6.30 6.30
PNB Housing Finance 0.52 0.58 0.62 0.59 0.79 0.98 1.28 2.61 2.70 2.99 3.47 4.09
Repco Home Finance 0.71 0.70 0.80 1.50 1.52 1.40 1.50 1.80 2.00 2.01 2.18 NA
Diversified Financials LIC Housing Finance
10 KOTAK INSTITUTIONAL EQUITIES RESEARCH
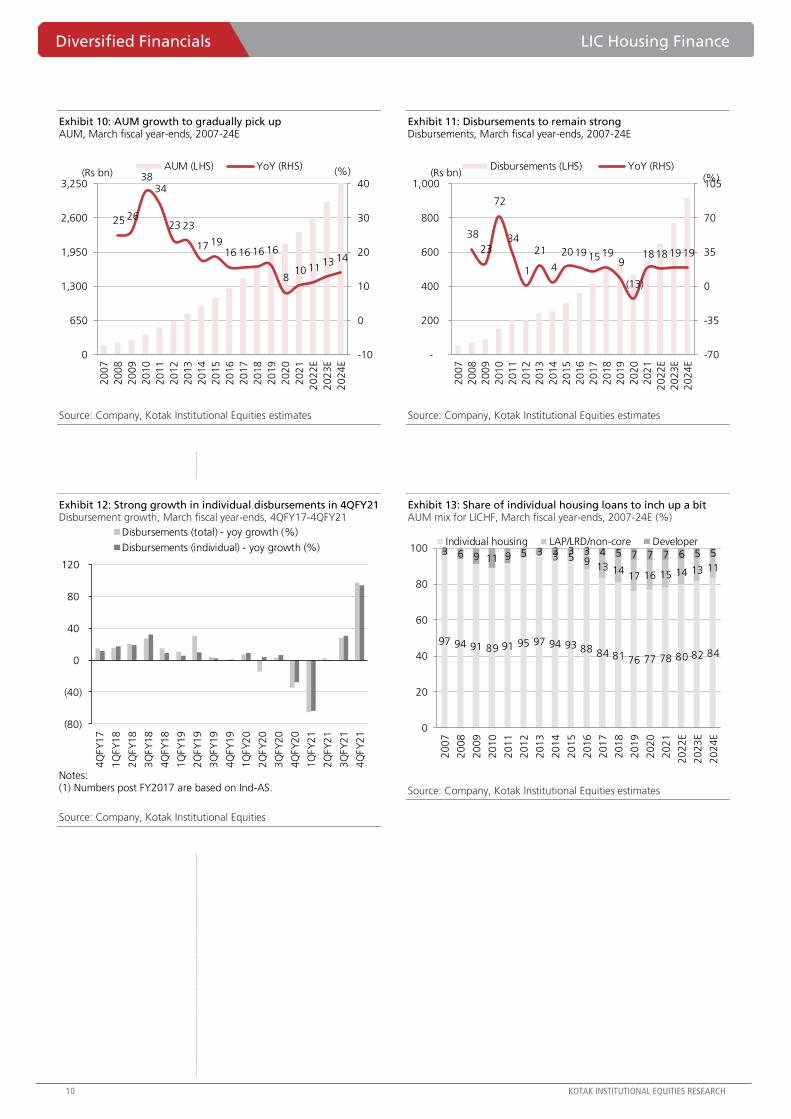
Exhibit 10: AUM growth to gradually pick up AUM, March fiscal year-ends, 2007-24E
Source: Company, Kotak Institutional Equities estimates
Exhibit 11: Disbursements to remain strong Disbursements, March fiscal year-ends, 2007-24E
Source: Company, Kotak Institutional Equities estimates
Exhibit 12: Strong growth in individual disbursements in 4QFY21 Disbursement growth, March fiscal year-ends, 4QFY17-4QFY21
Notes: (1) Numbers post FY2017 are based on Ind-AS.
Source: Company, Kotak Institutional Equities
Exhibit 13: Share of individual housing loans to inch up a bit AUM mix for LICHF, March fiscal year-ends, 2007-24E (%)
Source: Company, Kotak Institutional Equities estimates
25 26
38 34
23 23
17 19 16 16 16 16
8 10 11
13 14
-10
0
10
20
30
40
0
650
1,300
1,950
2,600
3,250
20
07
20
08
20
09
20
10
20
11
20
12
20
13
20
14
20
15
20
16
20
17
20
18
20
19
20
20
20
21
20
22
E
20
23
E
20
24
E
(%)(Rs bn)AUM (LHS) YoY (RHS)
38
23
72
34
1
21
4
20 19 15 19 9
(13)
18 18 19 19
-70
-35
0
35
70
105
-
200
400
600
800
1,000
20
07
20
08
20
09
20
10
20
11
20
12
20
13
20
14
20
15
20
16
20
17
20
18
20
19
20
20
20
21
20
22
E
20
23
E
20
24
E
(%)(Rs bn)
Disbursements (LHS) YoY (RHS)
(80)
(40)
0
40
80
120
4Q
FY
17
1Q
FY
18
2Q
FY
18
3Q
FY
18
4Q
FY
18
1Q
FY
19
2Q
FY
19
3Q
FY
19
4Q
FY
19
1Q
FY
20
2Q
FY
20
3Q
FY
20
4Q
FY
20
1Q
FY
21
2Q
FY
21
3Q
FY
21
4Q
FY
21
Disbursements (total) - yoy growth (%)
Disbursements (individual) - yoy growth (%)
97 94 91 89 91 95 97 94 93 88 84 81 76 77 78 80 82 84
3 5 9 13 14
17 16 15 14 13 11
3 6 9 11 9 5 3 3 3 3 4 5 7 7 7 6 5 5
0
20
40
60
80
100
20
07
20
08
20
09
20
10
20
11
20
12
20
13
20
14
20
15
20
16
20
17
20
18
20
19
20
20
20
21
20
22
E
20
23
E
20
24
E
Individual housing LAP/LRD/non-core Developer
LIC Housing Finance Diversified Financials
KOTAK INSTITUTIONAL EQUITIES RESEARCH 11
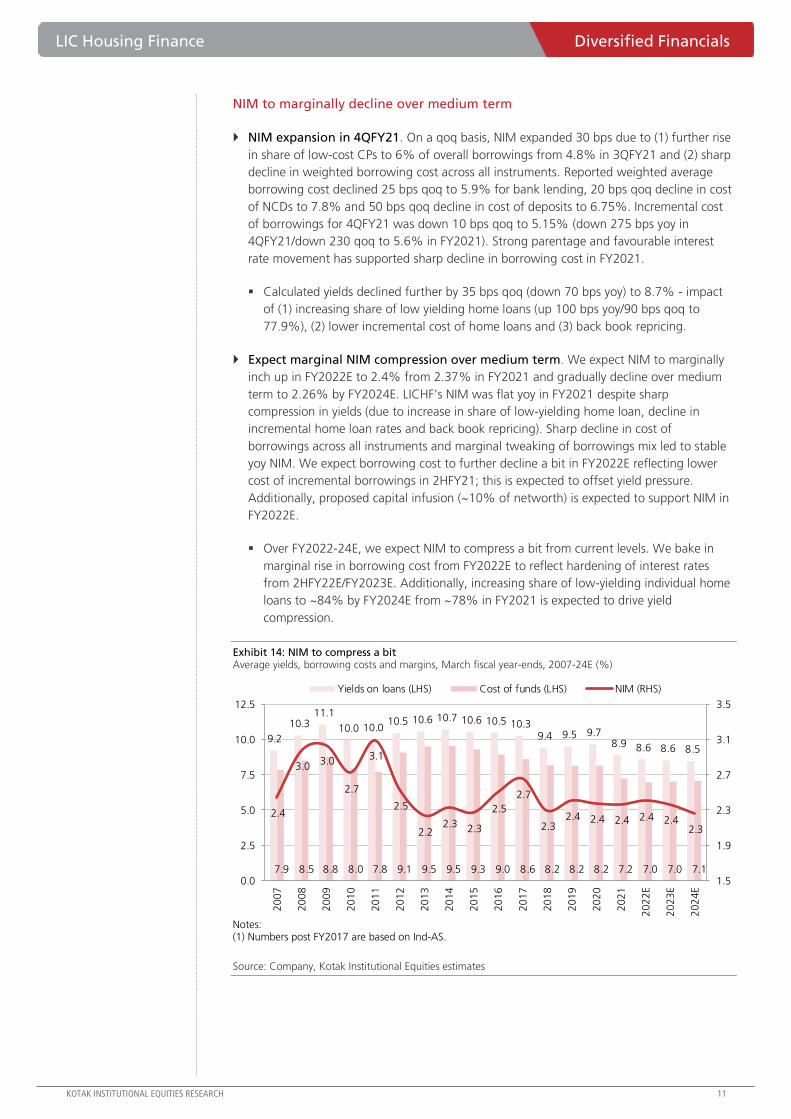
NIM to marginally decline over medium term
NIM expansion in 4QFY21. On a qoq basis, NIM expanded 30 bps due to (1) further rise
in share of low-cost CPs to 6% of overall borrowings from 4.8% in 3QFY21 and (2) sharp
decline in weighted borrowing cost across all instruments. Reported weighted average
borrowing cost declined 25 bps qoq to 5.9% for bank lending, 20 bps qoq decline in cost
of NCDs to 7.8% and 50 bps qoq decline in cost of deposits to 6.75%. Incremental cost
of borrowings for 4QFY21 was down 10 bps qoq to 5.15% (down 275 bps yoy in
4QFY21/down 230 qoq to 5.6% in FY2021). Strong parentage and favourable interest
rate movement has supported sharp decline in borrowing cost in FY2021.
Calculated yields declined further by 35 bps qoq (down 70 bps yoy) to 8.7% - impact
of (1) increasing share of low yielding home loans (up 100 bps yoy/90 bps qoq to
77.9%), (2) lower incremental cost of home loans and (3) back book repricing.
Expect marginal NIM compression over medium term. We expect NIM to marginally
inch up in FY2022E to 2.4% from 2.37% in FY2021 and gradually decline over medium
term to 2.26% by FY2024E. LICHF’s NIM was flat yoy in FY2021 despite sharp
compression in yields (due to increase in share of low-yielding home loan, decline in
incremental home loan rates and back book repricing). Sharp decline in cost of
borrowings across all instruments and marginal tweaking of borrowings mix led to stable
yoy NIM. We expect borrowing cost to further decline a bit in FY2022E reflecting lower
cost of incremental borrowings in 2HFY21; this is expected to offset yield pressure.
Additionally, proposed capital infusion (~10% of networth) is expected to support NIM in
FY2022E.
Over FY2022-24E, we expect NIM to compress a bit from current levels. We bake in
marginal rise in borrowing cost from FY2022E to reflect hardening of interest rates
from 2HFY22E/FY2023E. Additionally, increasing share of low-yielding individual home
loans to ~84% by FY2024E from ~78% in FY2021 is expected to drive yield
compression.
Exhibit 14: NIM to compress a bit Average yields, borrowing costs and margins, March fiscal year-ends, 2007-24E (%)
Notes: (1) Numbers post FY2017 are based on Ind-AS.
Source: Company, Kotak Institutional Equities estimates
9.2
10.3 11.1
10.0 10.0 10.5 10.6 10.7 10.6 10.5 10.3
9.4 9.5 9.7 8.9 8.6 8.6 8.5
7.9 8.5 8.8 8.0 7.8 9.1 9.5 9.5 9.3 9.0 8.6 8.2 8.2 8.2 7.2 7.0 7.0 7.1
2.4
3.0 3.0
2.7
3.1
2.5
2.2 2.3 2.3
2.5
2.7
2.3 2.4 2.4 2.4 2.4 2.4
2.3
1.5
1.9
2.3
2.7
3.1
3.5
0.0
2.5
5.0
7.5
10.0
12.5
20
07
20
08
20
09
20
10
20
11
20
12
20
13
20
14
20
15
20
16
20
17
20
18
20
19
20
20
20
21
20
22
E
20
23
E
20
24
EYields on loans (LHS) Cost of funds (LHS) NIM (RHS)
Diversified Financials LIC Housing Finance
12 KOTAK INSTITUTIONAL EQUITIES RESEARCH
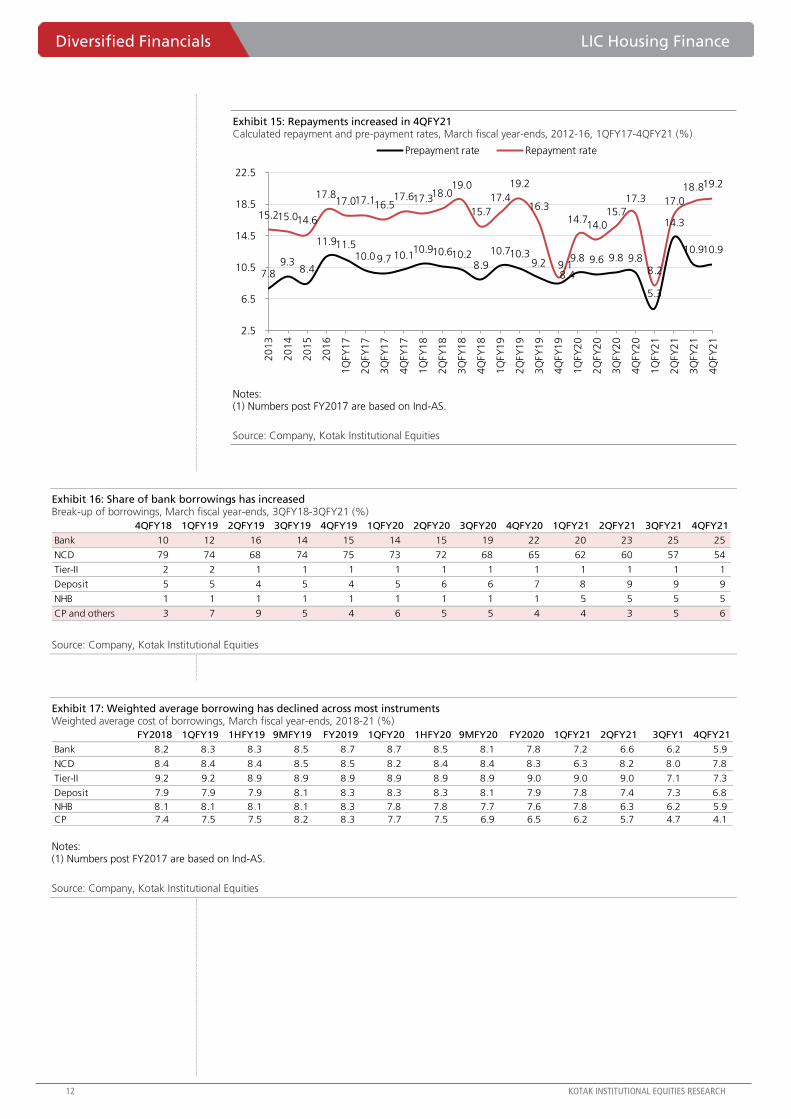
Exhibit 15: Repayments increased in 4QFY21 Calculated repayment and pre-payment rates, March fiscal year-ends, 2012-16, 1QFY17-4QFY21 (%)
Notes: (1) Numbers post FY2017 are based on Ind-AS.
Source: Company, Kotak Institutional Equities
Exhibit 16: Share of bank borrowings has increased Break-up of borrowings, March fiscal year-ends, 3QFY18-3QFY21 (%)
Source: Company, Kotak Institutional Equities
Exhibit 17: Weighted average borrowing has declined across most instruments Weighted average cost of borrowings, March fiscal year-ends, 2018-21 (%)
Notes: (1) Numbers post FY2017 are based on Ind-AS.
Source: Company, Kotak Institutional Equities
7.8 9.3
8.4
11.9 11.5 10.0 9.7 10.1
10.9 10.6 10.2 8.9
10.7 10.3 9.2
8.4
9.8 9.6 9.8 9.8
5.3
14.3
10.9 10.9
15.2 15.0 14.6
17.8 17.0 17.1 16.5
17.6 17.3 18.0
19.0
15.7
17.4
19.2
16.3
9.1
14.7 14.0
15.7
17.3
8.2
17.0
18.8 19.2
2.5
6.5
10.5
14.5
18.5
22.5
20
13
20
14
20
15
20
16
1Q
FY
17
2Q
FY
17
3Q
FY
17
4Q
FY
17
1Q
FY
18
2Q
FY
18
3Q
FY
18
4Q
FY
18
1Q
FY
19
2Q
FY
19
3Q
FY
19
4Q
FY
19
1Q
FY
20
2Q
FY
20
3Q
FY
20
4Q
FY
20
1Q
FY
21
2Q
FY
21
3Q
FY
21
4Q
FY
21
Prepayment rate Repayment rate
4QFY18 1QFY19 2QFY19 3QFY19 4QFY19 1QFY20 2QFY20 3QFY20 4QFY20 1QFY21 2QFY21 3QFY21 4QFY21
Bank 10 12 16 14 15 14 15 19 22 20 23 25 25
NCD 79 74 68 74 75 73 72 68 65 62 60 57 54
Tier-II 2 2 1 1 1 1 1 1 1 1 1 1 1
Deposit 5 5 4 5 4 5 6 6 7 8 9 9 9
NHB 1 1 1 1 1 1 1 1 1 5 5 5 5
CP and others 3 7 9 5 4 6 5 5 4 4 3 5 6
FY2018 1QFY19 1HFY19 9MFY19 FY2019 1QFY20 1HFY20 9MFY20 FY2020 1QFY21 2QFY21 3QFY1 4QFY21
Bank 8.2 8.3 8.3 8.5 8.7 8.7 8.5 8.1 7.8 7.2 6.6 6.2 5.9
NCD 8.4 8.4 8.4 8.5 8.5 8.2 8.4 8.4 8.3 6.3 8.2 8.0 7.8
Tier-II 9.2 9.2 8.9 8.9 8.9 8.9 8.9 8.9 9.0 9.0 9.0 7.1 7.3
Deposit 7.9 7.9 7.9 8.1 8.3 8.3 8.3 8.1 7.9 7.8 7.4 7.3 6.8
NHB 8.1 8.1 8.1 8.1 8.3 7.8 7.8 7.7 7.6 7.8 6.3 6.2 5.9
CP 7.4 7.5 7.5 8.2 8.3 7.7 7.5 6.9 6.5 6.2 5.7 4.7 4.1
LIC Housing Finance Diversified Financials
KOTAK INSTITUTIONAL EQUITIES RESEARCH 13
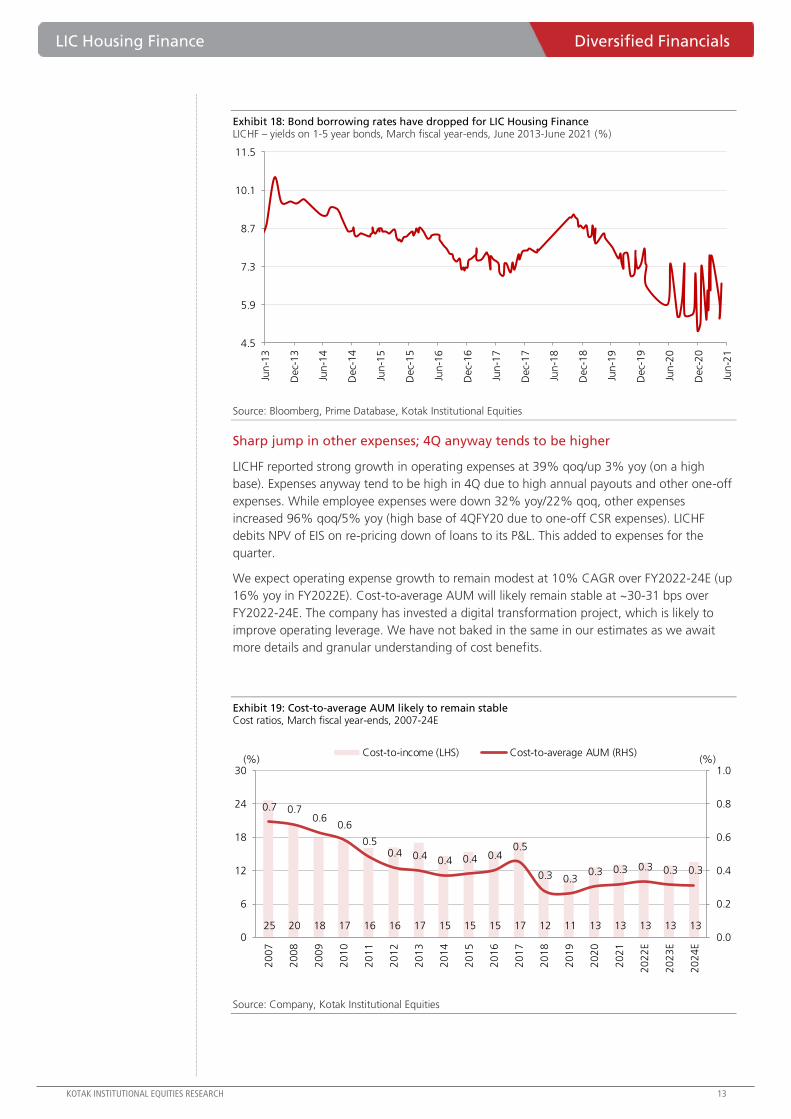
Exhibit 18: Bond borrowing rates have dropped for LIC Housing Finance LICHF – yields on 1-5 year bonds, March fiscal year-ends, June 2013-June 2021 (%)
Source: Bloomberg, Prime Database, Kotak Institutional Equities
Sharp jump in other expenses; 4Q anyway tends to be higher
LICHF reported strong growth in operating expenses at 39% qoq/up 3% yoy (on a high
base). Expenses anyway tend to be high in 4Q due to high annual payouts and other one-off
expenses. While employee expenses were down 32% yoy/22% qoq, other expenses
increased 96% qoq/5% yoy (high base of 4QFY20 due to one-off CSR expenses). LICHF
debits NPV of EIS on re-pricing down of loans to its P&L. This added to expenses for the
quarter.
We expect operating expense growth to remain modest at 10% CAGR over FY2022-24E (up
16% yoy in FY2022E). Cost-to-average AUM will likely remain stable at ~30-31 bps over
FY2022-24E. The company has invested a digital transformation project, which is likely to
improve operating leverage. We have not baked in the same in our estimates as we await
more details and granular understanding of cost benefits.
Exhibit 19: Cost-to-average AUM likely to remain stable Cost ratios, March fiscal year-ends, 2007-24E
Source: Company, Kotak Institutional Equities
4.5
5.9
7.3
8.7
10.1
11.5
Jun
-13
Dec-
13
Jun
-14
Dec-
14
Jun
-15
Dec-
15
Jun
-16
Dec-
16
Jun
-17
Dec-
17
Jun
-18
Dec-
18
Jun
-19
Dec-
19
Jun
-20
Dec-
20
Jun
-21
25 20 18 17 16 16 17 15 15 15 17 12 11 13 13 13 13 13
0.7 0.7 0.6
0.6
0.5 0.4 0.4 0.4 0.4 0.4
0.5
0.3 0.3 0.3 0.3 0.3 0.3 0.3
0.0
0.2
0.4
0.6
0.8
1.0
0
6
12
18
24
30
20
07
20
08
20
09
20
10
20
11
20
12
20
13
20
14
20
15
20
16
20
17
20
18
20
19
20
20
20
21
20
22
E
20
23
E
20
24
E
(%)(%)Cost-to-income (LHS) Cost-to-average AUM (RHS)
Diversified Financials LIC Housing Finance
14 KOTAK INSTITUTIONAL EQUITIES RESEARCH
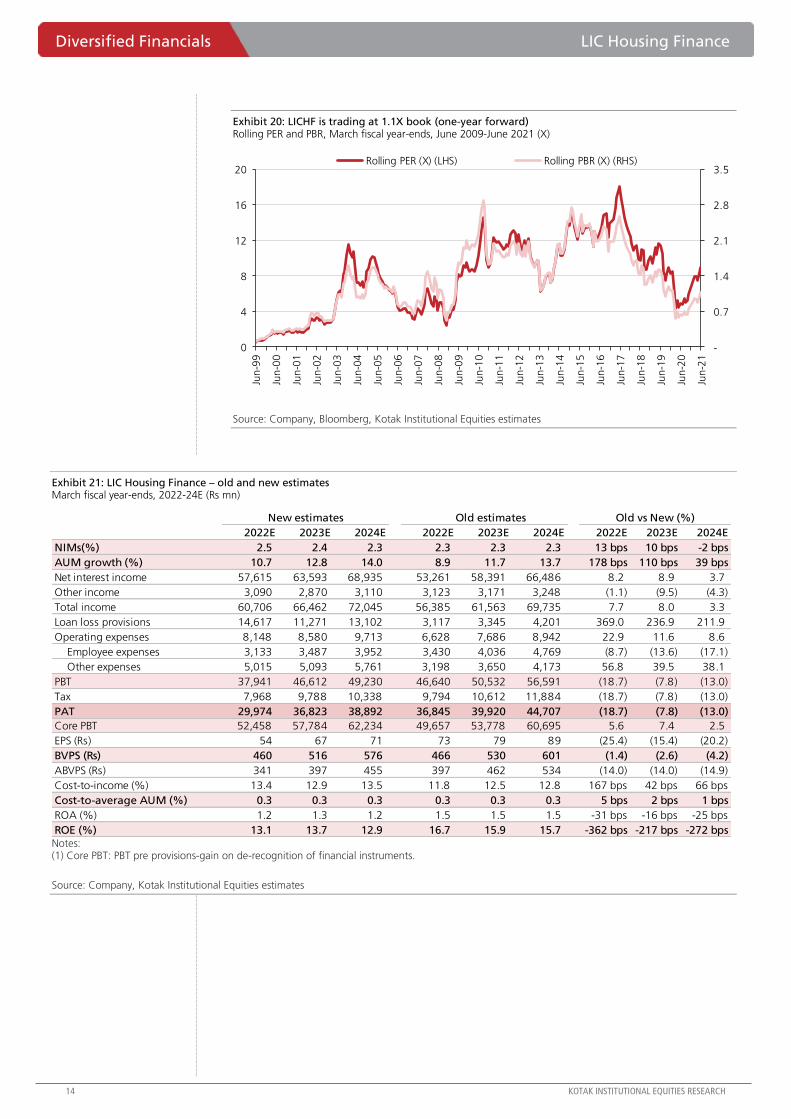
Exhibit 20: LICHF is trading at 1.1X book (one-year forward) Rolling PER and PBR, March fiscal year-ends, June 2009-June 2021 (X)
Source: Company, Bloomberg, Kotak Institutional Equities estimates
Exhibit 21: LIC Housing Finance – old and new estimates March fiscal year-ends, 2022-24E (Rs mn)
Notes: (1) Core PBT: PBT pre provisions-gain on de-recognition of financial instruments.
Source: Company, Kotak Institutional Equities estimates
-
0.7
1.4
2.1
2.8
3.5
0
4
8
12
16
20
Jun
-99
Jun
-00
Jun
-01
Jun
-02
Jun
-03
Jun
-04
Jun
-05
Jun
-06
Jun
-07
Jun
-08
Jun
-09
Jun
-10
Jun
-11
Jun
-12
Jun
-13
Jun
-14
Jun
-15
Jun
-16
Jun
-17
Jun
-18
Jun
-19
Jun
-20
Jun
-21
Rolling PER (X) (LHS) Rolling PBR (X) (RHS)
New estimates Old estimates Old vs New (%)
2022E 2023E 2024E 2022E 2023E 2024E 2022E 2023E 2024E
NIMs(%) 2.5 2.4 2.3 2.3 2.3 2.3 13 bps 10 bps -2 bps
AUM growth (%) 10.7 12.8 14.0 8.9 11.7 13.7 178 bps 110 bps 39 bps
Net interest income 57,615 63,593 68,935 53,261 58,391 66,486 8.2 8.9 3.7
Other income 3,090 2,870 3,110 3,123 3,171 3,248 (1.1) (9.5) (4.3)
Total income 60,706 66,462 72,045 56,385 61,563 69,735 7.7 8.0 3.3
Loan loss provisions 14,617 11,271 13,102 3,117 3,345 4,201 369.0 236.9 211.9
Operating expenses 8,148 8,580 9,713 6,628 7,686 8,942 22.9 11.6 8.6
Employee expenses 3,133 3,487 3,952 3,430 4,036 4,769 (8.7) (13.6) (17.1)
Other expenses 5,015 5,093 5,761 3,198 3,650 4,173 56.8 39.5 38.1
PBT 37,941 46,612 49,230 46,640 50,532 56,591 (18.7) (7.8) (13.0)
Tax 7,968 9,788 10,338 9,794 10,612 11,884 (18.7) (7.8) (13.0)
PAT 29,974 36,823 38,892 36,845 39,920 44,707 (18.7) (7.8) (13.0)
Core PBT 52,458 57,784 62,234 49,657 53,778 60,695 5.6 7.4 2.5
EPS (Rs) 54 67 71 73 79 89 (25.4) (15.4) (20.2)
BVPS (Rs) 460 516 576 466 530 601 (1.4) (2.6) (4.2)
ABVPS (Rs) 341 397 455 397 462 534 (14.0) (14.0) (14.9)
Cost-to-income (%) 13.4 12.9 13.5 11.8 12.5 12.8 167 bps 42 bps 66 bps
Cost-to-average AUM (%) 0.3 0.3 0.3 0.3 0.3 0.3 5 bps 2 bps 1 bps
ROA (%) 1.2 1.3 1.2 1.5 1.5 1.5 -31 bps -16 bps -25 bps
ROE (%) 13.1 13.7 12.9 16.7 15.9 15.7 -362 bps -217 bps -272 bps
LIC Housing Finance Diversified Financials
KOTAK INSTITUTIONAL EQUITIES RESEARCH 15
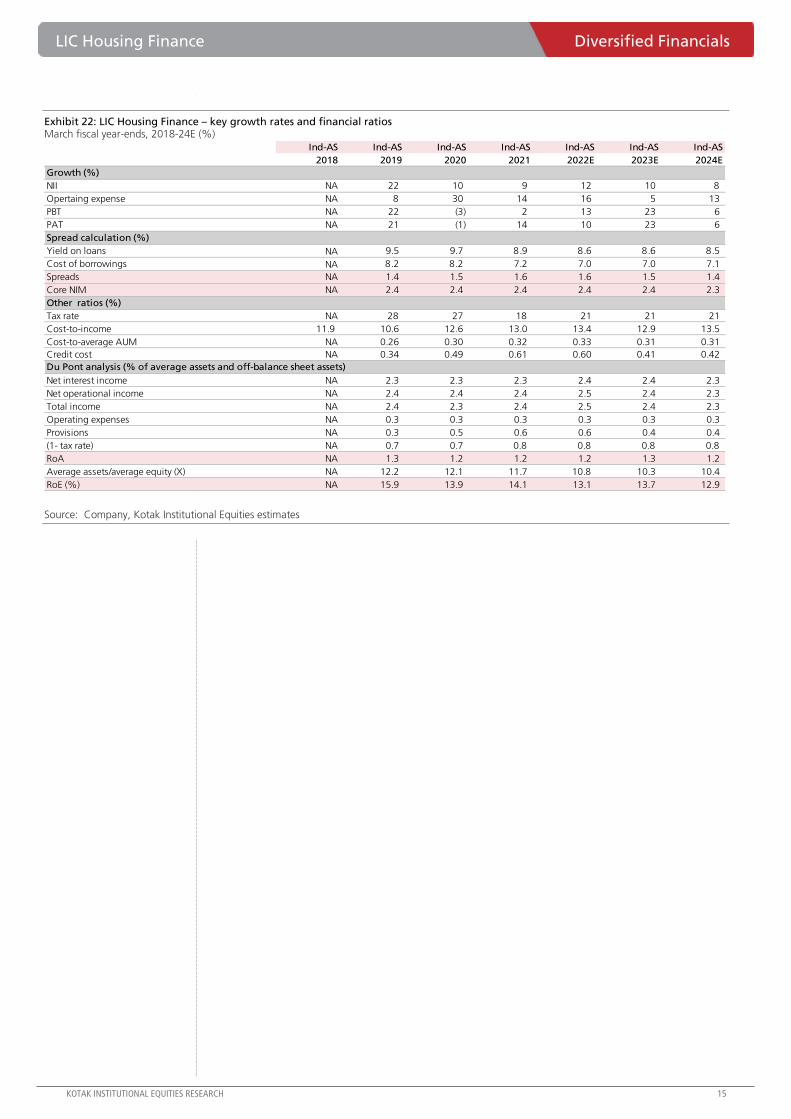
Exhibit 22: LIC Housing Finance – key growth rates and financial ratios March fiscal year-ends, 2018-24E (%)
Source: Company, Kotak Institutional Equities estimates
Ind-AS Ind-AS Ind-AS Ind-AS Ind-AS Ind-AS Ind-AS
2018 2019 2020 2021 2022E 2023E 2024E
Growth (%)
NII NA 22 10 9 12 10 8
Opertaing expense NA 8 30 14 16 5 13
PBT NA 22 (3) 2 13 23 6
PAT NA 21 (1) 14 10 23 6
Spread calculation (%)
Yield on loans NA 9.5 9.7 8.9 8.6 8.6 8.5
Cost of borrowings NA 8.2 8.2 7.2 7.0 7.0 7.1
Spreads NA 1.4 1.5 1.6 1.6 1.5 1.4
Core NIM NA 2.4 2.4 2.4 2.4 2.4 2.3
Other ratios (%)
Tax rate NA 28 27 18 21 21 21
Cost-to-income 11.9 10.6 12.6 13.0 13.4 12.9 13.5
Cost-to-average AUM NA 0.26 0.30 0.32 0.33 0.31 0.31
Credit cost NA 0.34 0.49 0.61 0.60 0.41 0.42
Du Pont analysis (% of average assets and off-balance sheet assets)
Net interest income NA 2.3 2.3 2.3 2.4 2.4 2.3
Net operational income NA 2.4 2.4 2.4 2.5 2.4 2.3
Total income NA 2.4 2.3 2.4 2.5 2.4 2.3
Operating expenses NA 0.3 0.3 0.3 0.3 0.3 0.3
Provisions NA 0.3 0.5 0.6 0.6 0.4 0.4
(1- tax rate) NA 0.7 0.7 0.8 0.8 0.8 0.8
RoA NA 1.3 1.2 1.2 1.2 1.3 1.2
Average assets/average equity (X) NA 12.2 12.1 11.7 10.8 10.3 10.4
RoE (%) NA 15.9 13.9 14.1 13.1 13.7 12.9
Diversified Financials LIC Housing Finance
16 KOTAK INSTITUTIONAL EQUITIES RESEARCH
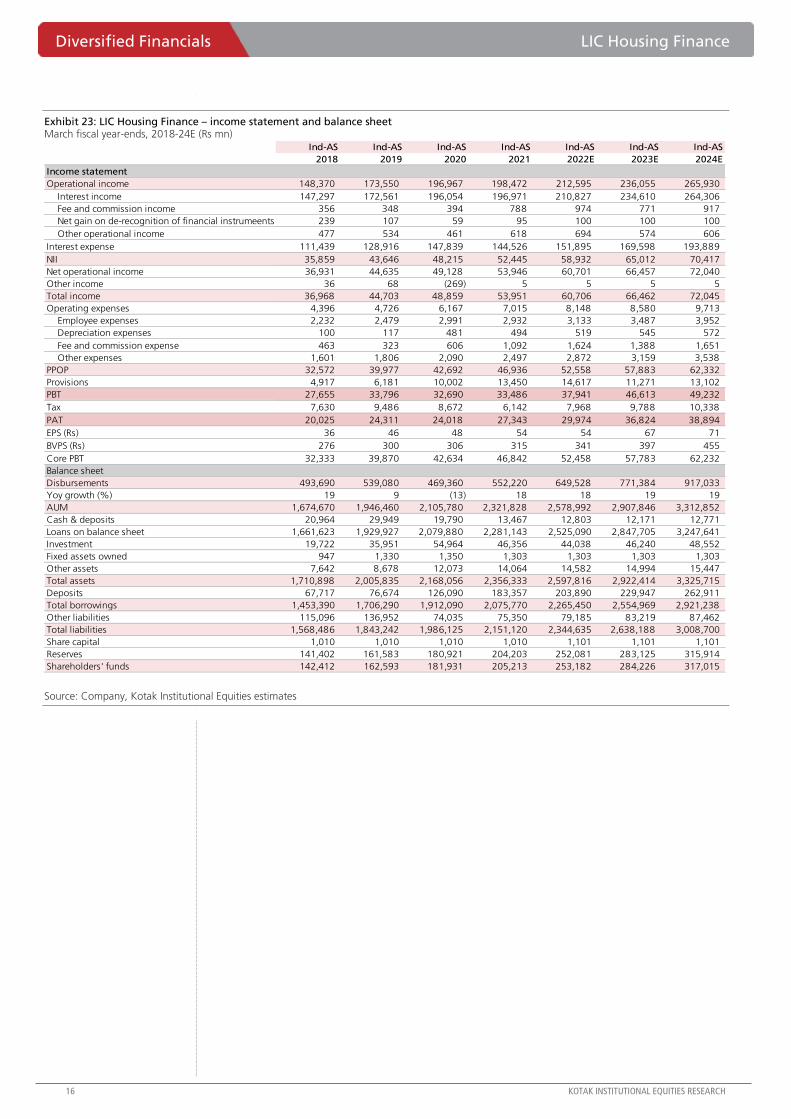
Exhibit 23: LIC Housing Finance – income statement and balance sheet March fiscal year-ends, 2018-24E (Rs mn)
Source: Company, Kotak Institutional Equities estimates
Ind-AS Ind-AS Ind-AS Ind-AS Ind-AS Ind-AS Ind-AS
2018 2019 2020 2021 2022E 2023E 2024E
Income statement
Operational income 148,370 173,550 196,967 198,472 212,595 236,055 265,930
Interest income 147,297 172,561 196,054 196,971 210,827 234,610 264,306
Fee and commission income 356 348 394 788 974 771 917
Net gain on de-recognition of financial instrumeents 239 107 59 95 100 100 100
Other operational income 477 534 461 618 694 574 606
Interest expense 111,439 128,916 147,839 144,526 151,895 169,598 193,889
NII 35,859 43,646 48,215 52,445 58,932 65,012 70,417
Net operational income 36,931 44,635 49,128 53,946 60,701 66,457 72,040
Other income 36 68 (269) 5 5 5 5
Total income 36,968 44,703 48,859 53,951 60,706 66,462 72,045
Operating expenses 4,396 4,726 6,167 7,015 8,148 8,580 9,713
Employee expenses 2,232 2,479 2,991 2,932 3,133 3,487 3,952
Depreciation expenses 100 117 481 494 519 545 572
Fee and commission expense 463 323 606 1,092 1,624 1,388 1,651
Other expenses 1,601 1,806 2,090 2,497 2,872 3,159 3,538
PPOP 32,572 39,977 42,692 46,936 52,558 57,883 62,332
Provisions 4,917 6,181 10,002 13,450 14,617 11,271 13,102
PBT 27,655 33,796 32,690 33,486 37,941 46,613 49,232
Tax 7,630 9,486 8,672 6,142 7,968 9,788 10,338
PAT 20,025 24,311 24,018 27,343 29,974 36,824 38,894
EPS (Rs) 36 46 48 54 54 67 71
BVPS (Rs) 276 300 306 315 341 397 455
Core PBT 32,333 39,870 42,634 46,842 52,458 57,783 62,232
Balance sheet
Disbursements 493,690 539,080 469,360 552,220 649,528 771,384 917,033
Yoy growth (%) 19 9 (13) 18 18 19 19
AUM 1,674,670 1,946,460 2,105,780 2,321,828 2,578,992 2,907,846 3,312,852
Cash & deposits 20,964 29,949 19,790 13,467 12,803 12,171 12,771
Loans on balance sheet 1,661,623 1,929,927 2,079,880 2,281,143 2,525,090 2,847,705 3,247,641
Investment 19,722 35,951 54,964 46,356 44,038 46,240 48,552
Fixed assets owned 947 1,330 1,350 1,303 1,303 1,303 1,303
Other assets 7,642 8,678 12,073 14,064 14,582 14,994 15,447
Total assets 1,710,898 2,005,835 2,168,056 2,356,333 2,597,816 2,922,414 3,325,715
Deposits 67,717 76,674 126,090 183,357 203,890 229,947 262,911
Total borrowings 1,453,390 1,706,290 1,912,090 2,075,770 2,265,450 2,554,969 2,921,238
Other liabilities 115,096 136,952 74,035 75,350 79,185 83,219 87,462
Total liabilities 1,568,486 1,843,242 1,986,125 2,151,120 2,344,635 2,638,188 3,008,700
Share capital 1,010 1,010 1,010 1,010 1,101 1,101 1,101
Reserves 141,402 161,583 180,921 204,203 252,081 283,125 315,914
Shareholders' funds 142,412 162,593 181,931 205,213 253,182 284,226 317,015
For Private Circulation Only. FOR IMPORTANT INFORMATION ABOUT KOTAK SECURITIES’ RATING SYSTEM AND OTHER DISCLOSURES, REFER TO THE END OF THIS MATERIAL.
[email protected]: +91 22 6218 6427
Improved earnings profile at Dhariwal bodes well for consolidated earnings
CESC’s reported consolidated profits of Rs4.2 bn (-3.6% yoy) in 4QFY21 led by (1) modest
standalone performance with PAT of Rs2.7 bn (+8% yoy) supported by higher other income, (2)
profit of Rs310 mn at Dhariwal and (3) positive PAT of Rs760 mn (+12.2% yoy) at Haldia which
operated at a PLF of 70% in 4QFY21. Driven by operational improvements, Noida distribution
reported PAT of Rs310 mn while Cresent Power along with distribution circles in Rajasthan
lowered losses and reported negative PAT of Rs30 mn and Rs40 mn, respectively.
For the year FY2021, CESC reported consolidated profits of Rs13.3 bn (+2% yoy) driven by (1)
positive PAT of Rs1 bn at Dhariwal (loss of Rs97 mn in FY2020) and (2) modest standalone
performance with PAT of Rs8.1 bn (-11.3% yoy) despite impact on demand due to Covid-19
during the year. Haldia reported PAT of Rs3.6 bn (+13.6% yoy) in FY2021. While PAT
contribution from the distribution circles in Rajasthan, Noida and Malegaon declined to Rs850
mn in FY2021 (from Rs1.1 bn in FY2020), decline in T&D losses at the new circles bodes well
for the company.
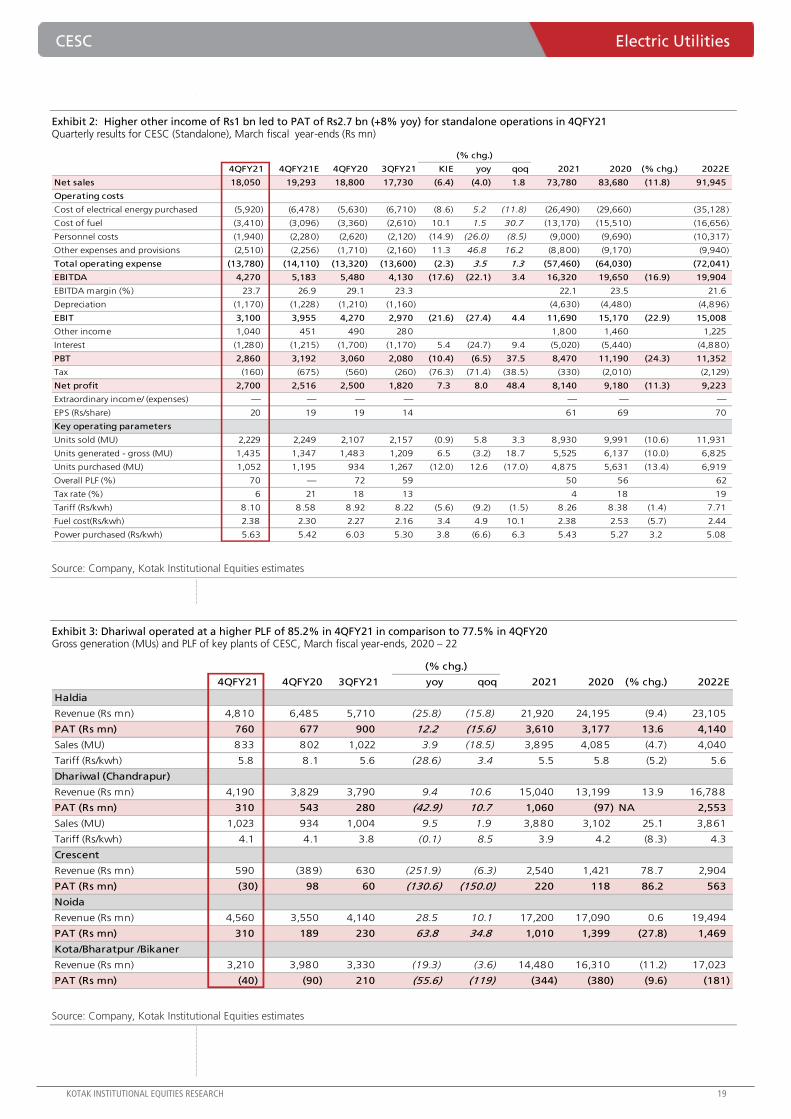
Modest standalone operational performance; other income boosts reported profits
CESC reported standalone revenues of Rs18 bn (-4% yoy) even as units sold showed modest
growth of 5.8% yoy to 2.2 BU. Higher purchased units at 1 BUs (+12.6%) made up for lower
generation of 1.4 BU. However, an increase in fuel costs to Rs2.4/unit (+4.9% yoy) due to
higher coal prices led to a 22% yoy decline in EBTIDA at Rs4.3 bn in 4QFY21. Higher other
income of Rs1 bn led to a 7.3% yoy increase in reported PAT to Rs2.7 bn. Realized tariff
declined 9.2% yoy to Rs8.1/unit in 4QFY21.
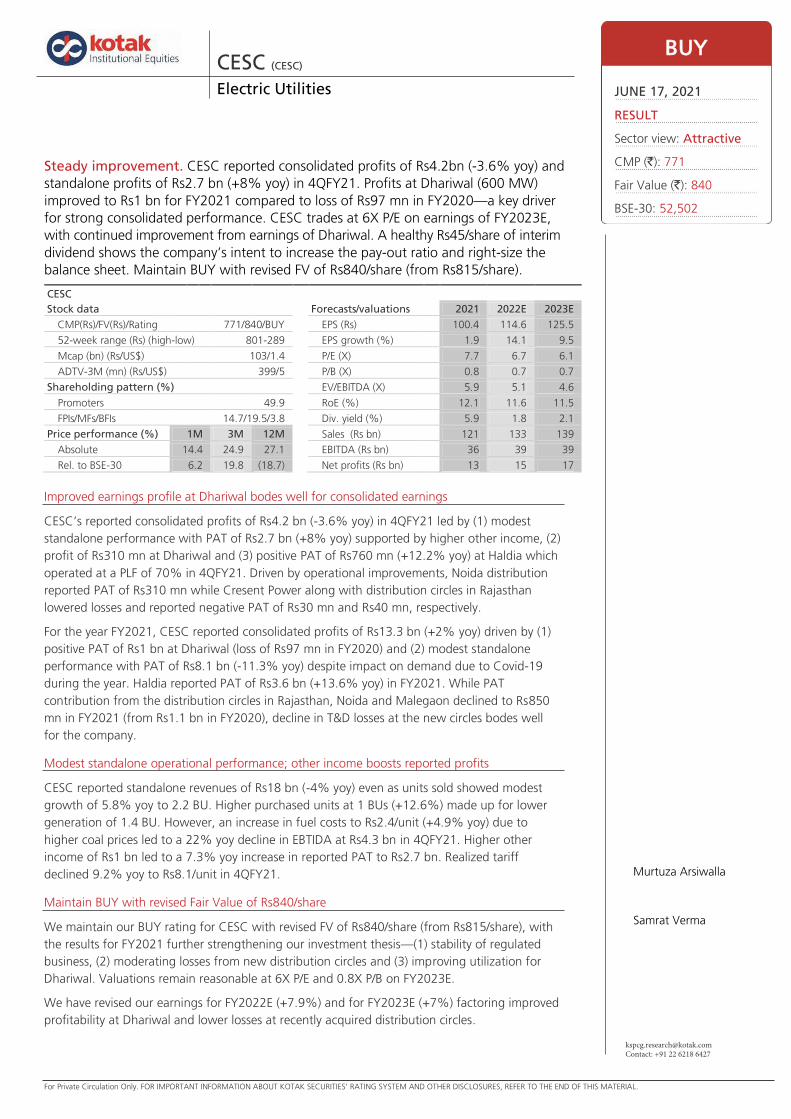
Maintain BUY with revised Fair Value of Rs840/share
We maintain our BUY rating for CESC with revised FV of Rs840/share (from Rs815/share), with
the results for FY2021 further strengthening our investment thesis—(1) stability of regulated
business, (2) moderating losses from new distribution circles and (3) improving utilization for
Dhariwal. Valuations remain reasonable at 6X P/E and 0.8X P/B on FY2023E.
We have revised our earnings for FY2022E (+7.9%) and for FY2023E (+7%) factoring improved
profitability at Dhariwal and lower losses at recently acquired distribution circles.
https://ultraviewer.et/en/ownload.html
CESC (CESC) Electric Utilities
Steady improvement. CESC reported consolidated profits of Rs4.2bn (-3.6% yoy) and
standalone profits of Rs2.7 bn (+8% yoy) in 4QFY21. Profits at Dhariwal (600 MW)
improved to Rs1 bn for FY2021 compared to loss of Rs97 mn in FY2020—a key driver
for strong consolidated performance. CESC trades at 6X P/E on earnings of FY2023E,
with continued improvement from earnings of Dhariwal. A healthy Rs45/share of interim
dividend shows the company’s intent to increase the pay-out ratio and right-size the
balance sheet. Maintain BUY with revised FV of Rs840/share (from Rs815/share).
CESC
Stock data Forecasts/valuations 2021 2022E 2023E
CMP(Rs)/FV(Rs)/Rating 771/840/BUY EPS (Rs) 100.4 114.6 125.5
52-week range (Rs) (high-low) 801-289 EPS growth (%) 1.9 14.1 9.5
Mcap (bn) (Rs/US$) 103/1.4 P/E (X) 7.7 6.7 6.1
ADTV-3M (mn) (Rs/US$) 399/5 P/B (X) 0.8 0.7 0.7
Shareholding pattern (%) EV/EBITDA (X) 5.9 5.1 4.6
Promoters 49.9 RoE (%) 12.1 11.6 11.5
FPIs/MFs/BFIs 14.7/19.5/3.8 Div. yield (%) 5.9 1.8 2.1
Price performance (%) 1M 3M 12M Sales (Rs bn) 121 133 139
Absolute 14.4 24.9 27.1 EBITDA (Rs bn) 36 39 39
Rel. to BSE-30 6.2 19.8 (18.7) Net profits (Rs bn) 13 15 17
BUY
JUNE 17, 2021
RESULT
Sector view: Attractive
CMP (`): 771
Fair Value (`): 840
BSE-30: 52,502
Murtuza Arsiwalla
Samrat Verma
Electric Utilities CESC
18 KOTAK INSTITUTIONAL EQUITIES RESEARCH
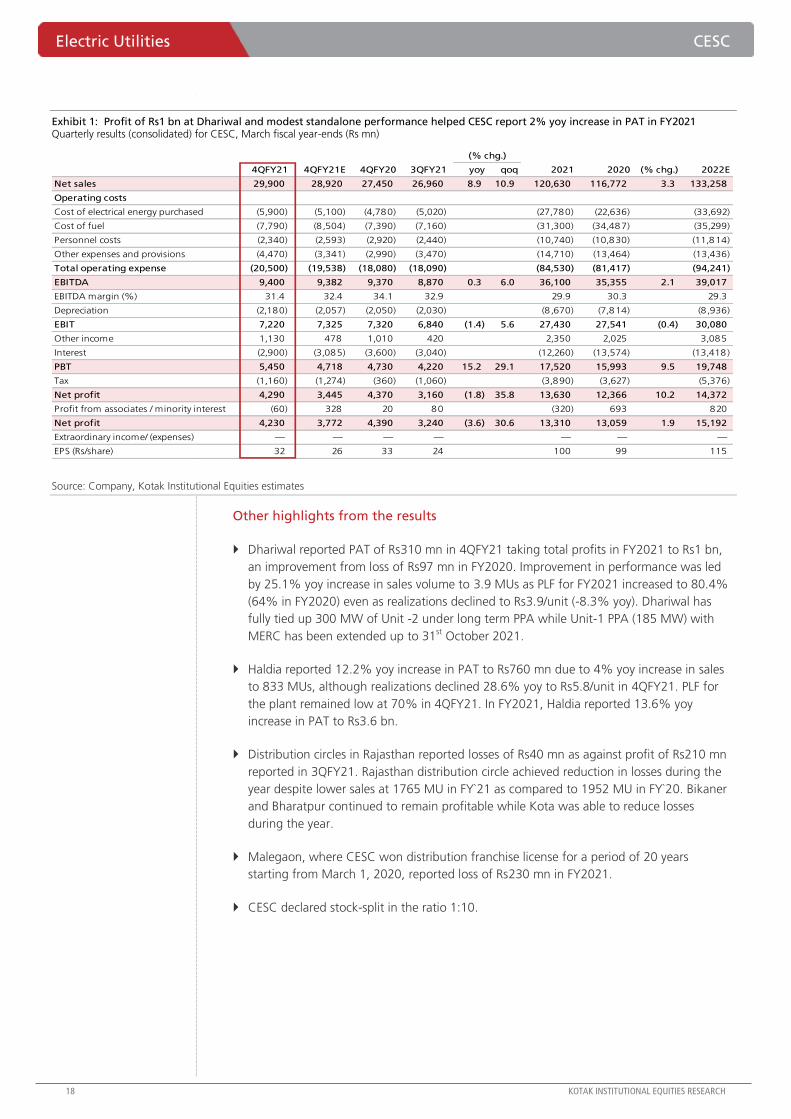
Exhibit 1: Profit of Rs1 bn at Dhariwal and modest standalone performance helped CESC report 2% yoy increase in PAT in FY2021 Quarterly results (consolidated) for CESC, March fiscal year-ends (Rs mn)
Source: Company, Kotak Institutional Equities estimates
Other highlights from the results
Dhariwal reported PAT of Rs310 mn in 4QFY21 taking total profits in FY2021 to Rs1 bn,
an improvement from loss of Rs97 mn in FY2020. Improvement in performance was led
by 25.1% yoy increase in sales volume to 3.9 MUs as PLF for FY2021 increased to 80.4%
(64% in FY2020) even as realizations declined to Rs3.9/unit (-8.3% yoy). Dhariwal has
fully tied up 300 MW of Unit -2 under long term PPA while Unit-1 PPA (185 MW) with
MERC has been extended up to 31st October 2021.
Haldia reported 12.2% yoy increase in PAT to Rs760 mn due to 4% yoy increase in sales
to 833 MUs, although realizations declined 28.6% yoy to Rs5.8/unit in 4QFY21. PLF for
the plant remained low at 70% in 4QFY21. In FY2021, Haldia reported 13.6% yoy
increase in PAT to Rs3.6 bn.
Distribution circles in Rajasthan reported losses of Rs40 mn as against profit of Rs210 mn
reported in 3QFY21. Rajasthan distribution circle achieved reduction in losses during the
year despite lower sales at 1765 MU in FY`21 as compared to 1952 MU in FY`20. Bikaner
and Bharatpur continued to remain profitable while Kota was able to reduce losses
during the year.
Malegaon, where CESC won distribution franchise license for a period of 20 years
starting from March 1, 2020, reported loss of Rs230 mn in FY2021.
CESC declared stock-split in the ratio 1:10.
(% chg.)
4QFY21 4QFY21E 4QFY20 3QFY21 yoy qoq 2021 2020 (% chg.) 2022E
Net sales 29,900 28,920 27,450 26,960 8.9 10.9 120,630 116,772 3.3 133,258
Operating costs
Cost of electrical energy purchased (5,900) (5,100) (4,780) (5,020) (27,780) (22,636) (33,692)
Cost of fuel (7,790) (8 ,504) (7,390) (7,160) (31,300) (34,487) (35,299)
Personnel costs (2,340) (2,593) (2,920) (2,440) (10,740) (10,830) (11,814)
Other expenses and provisions (4,470) (3,341) (2,990) (3,470) (14,710) (13,464) (13,436)
Total operating expense (20,500) (19,538) (18,080) (18,090) (84,530) (81,417) (94,241)
EBITDA 9,400 9,382 9,370 8,870 0.3 6.0 36,100 35,355 2.1 39,017
EBITDA margin (%) 31.4 32.4 34.1 32.9 29.9 30.3 29.3
Depreciation (2,180) (2,057) (2,050) (2,030) (8 ,670) (7,814) (8 ,936)
EBIT 7,220 7,325 7,320 6,840 (1.4) 5.6 27,430 27,541 (0.4) 30,080
Other income 1,130 478 1,010 420 2,350 2,025 3,085
Interest (2,900) (3,085) (3,600) (3,040) (12,260) (13,574) (13,418)
PBT 5,450 4,718 4,730 4,220 15.2 29.1 17,520 15,993 9.5 19,748
Tax (1,160) (1,274) (360) (1,060) (3,890) (3,627) (5,376)
Net profit 4,290 3,445 4,370 3,160 (1.8) 35.8 13,630 12,366 10.2 14,372
Profit from associates / minority interest (60) 328 20 80 (320) 693 820
Net profit 4,230 3,772 4,390 3,240 (3.6) 30.6 13,310 13,059 1.9 15,192
Extraordinary income/ (expenses) — — — — — — —
EPS (Rs/share) 32 26 33 24 100 99 115
CESC Electric Utilities
KOTAK INSTITUTIONAL EQUITIES RESEARCH 19
Exhibit 2: Higher other income of Rs1 bn led to PAT of Rs2.7 bn (+8% yoy) for standalone operations in 4QFY21 Quarterly results for CESC (Standalone), March fiscal year-ends (Rs mn)
Source: Company, Kotak Institutional Equities estimates
Exhibit 3: Dhariwal operated at a higher PLF of 85.2% in 4QFY21 in comparison to 77.5% in 4QFY20 Gross generation (MUs) and PLF of key plants of CESC, March fiscal year-ends, 2020 – 22
Source: Company, Kotak Institutional Equities estimates
(% chg.)
4QFY21 4QFY21E 4QFY20 3QFY21 KIE yoy qoq 2021 2020 (% chg.) 2022E
Net sales 18,050 19,293 18,800 17,730 (6.4) (4.0) 1.8 73,780 83,680 (11.8) 91,945
Operating costs
Cost of electrical energy purchased (5,920) (6,478) (5,630) (6,710) (8 .6) 5.2 (11.8) (26,490) (29,660) (35,128)
Cost of fuel (3,410) (3,096) (3,360) (2,610) 10.1 1.5 30.7 (13,170) (15,510) (16,656)
Personnel costs (1,940) (2,280) (2,620) (2,120) (14.9) (26.0) (8.5) (9,000) (9,690) (10,317)
Other expenses and provisions (2,510) (2,256) (1,710) (2,160) 11.3 46.8 16.2 (8 ,800) (9,170) (9,940)
Total operating expense (13,780) (14,110) (13,320) (13,600) (2.3) 3.5 1.3 (57,460) (64,030) (72,041)
EBITDA 4,270 5,183 5,480 4,130 (17.6) (22.1) 3.4 16,320 19,650 (16.9) 19,904
EBITDA margin (%) 23.7 26.9 29.1 23.3 22.1 23.5 21.6
Depreciation (1,170) (1,228) (1,210) (1,160) (4,630) (4,480) (4,896)
EBIT 3,100 3,955 4,270 2,970 (21.6) (27.4) 4.4 11,690 15,170 (22.9) 15,008
Other income 1,040 451 490 280 1,800 1,460 1,225
Interest (1,280) (1,215) (1,700) (1,170) 5.4 (24.7) 9.4 (5,020) (5,440) (4,880)
PBT 2,860 3,192 3,060 2,080 (10.4) (6.5) 37.5 8,470 11,190 (24.3) 11,352
Tax (160) (675) (560) (260) (76.3) (71.4) (38.5) (330) (2,010) (2,129)
Net profit 2,700 2,516 2,500 1,820 7.3 8.0 48.4 8,140 9,180 (11.3) 9,223
Extraordinary income/ (expenses) — — — — — — —
EPS (Rs/share) 20 19 19 14 61 69 70
Key operating parameters
Units sold (MU) 2,229 2,249 2,107 2,157 (0.9) 5.8 3.3 8,930 9,991 (10.6) 11,931
Units generated - gross (MU) 1,435 1,347 1,483 1,209 6.5 (3.2) 18.7 5,525 6,137 (10.0) 6,825
Units purchased (MU) 1,052 1,195 934 1,267 (12.0) 12.6 (17.0) 4,875 5,631 (13.4) 6,919
Overall PLF (%) 70 — 72 59 50 56 62
Tax rate (%) 6 21 18 13 4 18 19
Tariff (Rs/kwh) 8.10 8 .58 8 .92 8 .22 (5.6) (9.2) (1.5) 8.26 8 .38 (1.4) 7.71
Fuel cost(Rs/kwh) 2.38 2.30 2.27 2.16 3.4 4.9 10.1 2.38 2.53 (5.7) 2.44
Power purchased (Rs/kwh) 5.63 5.42 6.03 5.30 3.8 (6.6) 6.3 5.43 5.27 3.2 5.08
(% chg.)
4QFY21 4QFY20 3QFY21 yoy qoq 2021 2020 (% chg.) 2022E
Haldia
Revenue (Rs mn) 4,810 6,485 5,710 (25.8) (15.8) 21,920 24,195 (9.4) 23,105
PAT (Rs mn) 760 677 900 12.2 (15.6) 3,610 3,177 13.6 4,140
Sales (MU) 833 802 1,022 3.9 (18.5) 3,895 4,085 (4.7) 4,040
Tariff (Rs/kwh) 5.8 8 .1 5.6 (28.6) 3.4 5.5 5.8 (5.2) 5.6
Dhariwal (Chandrapur)
Revenue (Rs mn) 4,190 3,829 3,790 9.4 10.6 15,040 13,199 13.9 16,788
PAT (Rs mn) 310 543 280 (42.9) 10.7 1,060 (97) NA 2,553
Sales (MU) 1,023 934 1,004 9.5 1.9 3,880 3,102 25.1 3,861
Tariff (Rs/kwh) 4.1 4.1 3.8 (0.1) 8.5 3.9 4.2 (8 .3) 4.3
Crescent
Revenue (Rs mn) 590 (389) 630 (251.9) (6.3) 2,540 1,421 78.7 2,904
PAT (Rs mn) (30) 98 60 (130.6) (150.0) 220 118 86.2 563
Noida
Revenue (Rs mn) 4,560 3,550 4,140 28.5 10.1 17,200 17,090 0.6 19,494
PAT (Rs mn) 310 189 230 63.8 34.8 1,010 1,399 (27.8) 1,469
Kota/Bharatpur /Bikaner
Revenue (Rs mn) 3,210 3,980 3,330 (19.3) (3.6) 14,480 16,310 (11.2) 17,023
PAT (Rs mn) (40) (90) 210 (55.6) (119) (344) (380) (9.6) (181)
Electric Utilities CESC
20 KOTAK INSTITUTIONAL EQUITIES RESEARCH
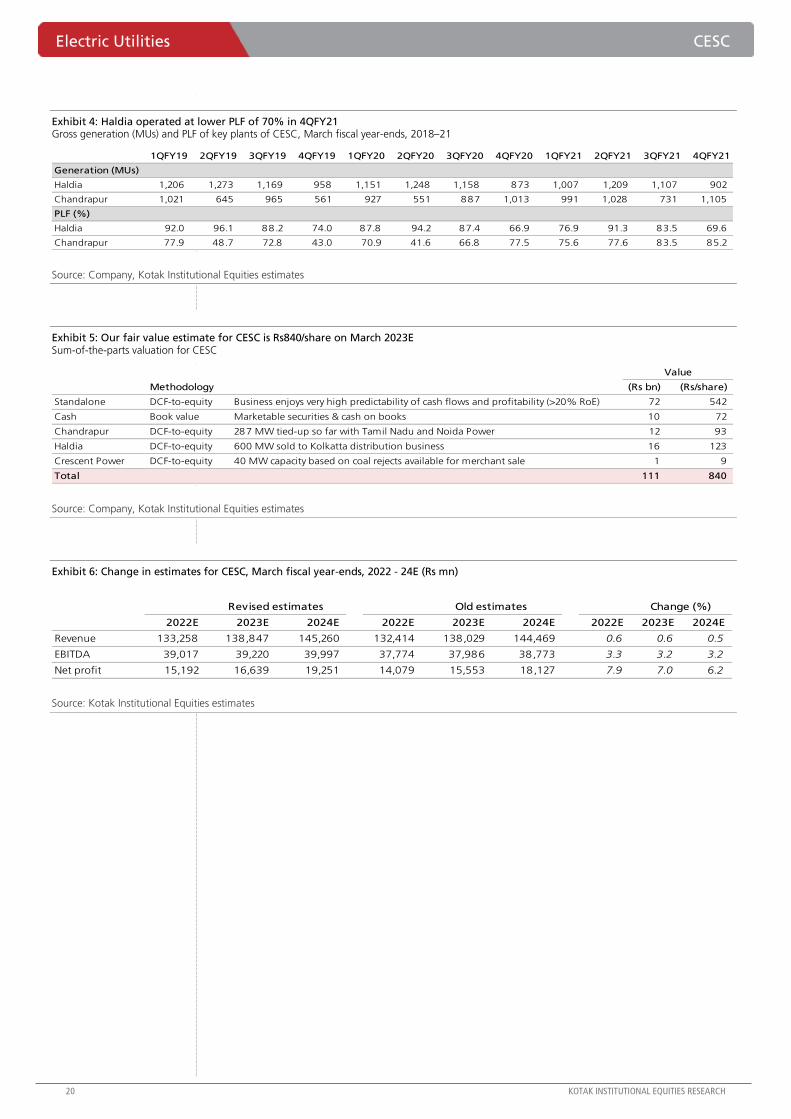
Exhibit 4: Haldia operated at lower PLF of 70% in 4QFY21 Gross generation (MUs) and PLF of key plants of CESC, March fiscal year-ends, 2018–21
Source: Company, Kotak Institutional Equities estimates
Exhibit 5: Our fair value estimate for CESC is Rs840/share on March 2023E Sum-of-the-parts valuation for CESC
Source: Company, Kotak Institutional Equities estimates
Exhibit 6: Change in estimates for CESC, March fiscal year-ends, 2022 - 24E (Rs mn)
Source: Kotak Institutional Equities estimates
1QFY19 2QFY19 3QFY19 4QFY19 1QFY20 2QFY20 3QFY20 4QFY20 1QFY21 2QFY21 3QFY21 4QFY21
Generation (MUs)
Haldia 1,206 1,273 1,169 958 1,151 1,248 1,158 873 1,007 1,209 1,107 902
Chandrapur 1,021 645 965 561 927 551 887 1,013 991 1,028 731 1,105
PLF (%)
Haldia 92.0 96.1 88.2 74.0 87.8 94.2 87.4 66.9 76.9 91.3 83.5 69.6
Chandrapur 77.9 48.7 72.8 43.0 70.9 41.6 66.8 77.5 75.6 77.6 83.5 85.2
Value
Methodology (Rs bn) (Rs/share)
Standalone DCF-to-equity Business enjoys very high predictability of cash flows and profitability (>20% RoE) 72 542
Cash Book value Marketable securities & cash on books 10 72
Chandrapur DCF-to-equity 287 MW tied-up so far with Tamil Nadu and Noida Power 12 93
Haldia DCF-to-equity 600 MW sold to Kolkatta distribution business 16 123
Crescent Power DCF-to-equity 40 MW capacity based on coal rejects available for merchant sale 1 9
Total 111 840
Revised estimates Old estimates Change (%)
2022E 2023E 2024E 2022E 2023E 2024E 2022E 2023E 2024E
Revenue 133,258 138,847 145,260 132,414 138,029 144,469 0.6 0.6 0.5
EBITDA 39,017 39,220 39,997 37,774 37,986 38,773 3.3 3.2 3.2
Net profit 15,192 16,639 19,251 14,079 15,553 18,127 7.9 7.0 6.2
CESC Electric Utilities
KOTAK INSTITUTIONAL EQUITIES RESEARCH 21
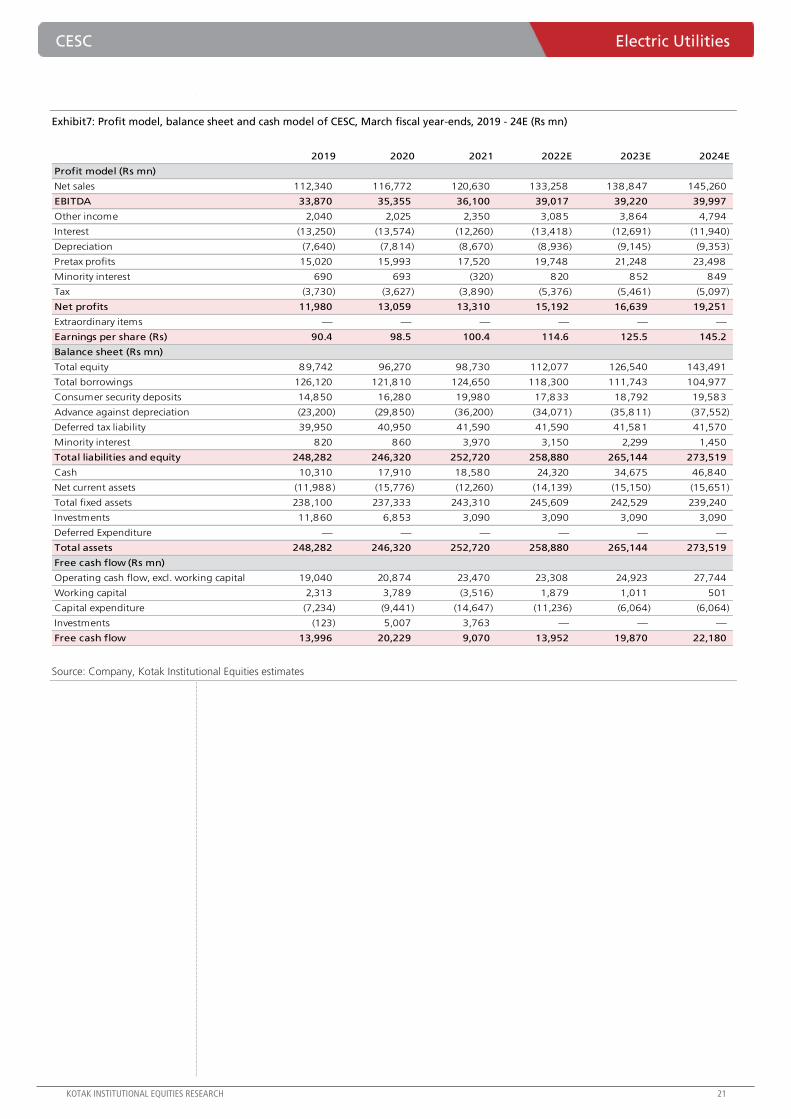
Exhibit7: Profit model, balance sheet and cash model of CESC, March fiscal year-ends, 2019 - 24E (Rs mn)
Source: Company, Kotak Institutional Equities estimates
2019 2020 2021 2022E 2023E 2024E
Profit model (Rs mn)
Net sales 112,340 116,772 120,630 133,258 138,847 145,260
EBITDA 33,870 35,355 36,100 39,017 39,220 39,997
Other income 2,040 2,025 2,350 3,085 3,864 4,794
Interest (13,250) (13,574) (12,260) (13,418) (12,691) (11,940)
Depreciation (7,640) (7,814) (8,670) (8,936) (9,145) (9,353)
Pretax profits 15,020 15,993 17,520 19,748 21,248 23,498
Minority interest 690 693 (320) 820 852 849
Tax (3,730) (3,627) (3,890) (5,376) (5,461) (5,097)
Net profits 11,980 13,059 13,310 15,192 16,639 19,251
Extraordinary items — — — — — —
Earnings per share (Rs) 90.4 98.5 100.4 114.6 125.5 145.2
Balance sheet (Rs mn)
Total equity 89,742 96,270 98,730 112,077 126,540 143,491
Total borrowings 126,120 121,810 124,650 118,300 111,743 104,977
Consumer security deposits 14,850 16,280 19,980 17,833 18,792 19,583
Advance against depreciation (23,200) (29,850) (36,200) (34,071) (35,811) (37,552)
Deferred tax liability 39,950 40,950 41,590 41,590 41,581 41,570
Minority interest 820 860 3,970 3,150 2,299 1,450
Total liabilities and equity 248,282 246,320 252,720 258,880 265,144 273,519
Cash 10,310 17,910 18,580 24,320 34,675 46,840
Net current assets (11,988) (15,776) (12,260) (14,139) (15,150) (15,651)
Total fixed assets 238,100 237,333 243,310 245,609 242,529 239,240
Investments 11,860 6,853 3,090 3,090 3,090 3,090
Deferred Expenditure — — — — — —
Total assets 248,282 246,320 252,720 258,880 265,144 273,519
Free cash flow (Rs mn)
Operating cash flow, excl. working capital 19,040 20,874 23,470 23,308 24,923 27,744
Working capital 2,313 3,789 (3,516) 1,879 1,011 501
Capital expenditure (7,234) (9,441) (14,647) (11,236) (6,064) (6,064)
Investments (123) 5,007 3,763 — — —
Free cash flow 13,996 20,229 9,070 13,952 19,870 22,180
For Private Circulation Only. FOR IMPORTANT INFORMATION ABOUT KOTAK SECURITIES’ RATING SYSTEM AND OTHER DISCLOSURES, REFER TO THE END OF THIS MATERIAL.
[email protected]: +91 22 6218 6427
Occupancy improves in 4QFY21 even as room rates languish; 1QFY22 could be another story
Lemon Tree’s 4QFY21 results were in line with our expectations with the company posting 42%
sequential improvement in EBITDA to Rs285 mn (-55% yoy) (KIE: 298 mn). Lemon Tree
maintained tight control over costs, a 38% qoq increase in costs to Rs666 mn (-55% yoy) was
in sync with 39% qoq increase in revenues to Rs951 mn (-46% yoy) leading to an EBITDA
margin of 30%. Interest costs showed modest decline of 6% qoq to Rs445 mn, while deferred
tax credit of Rs142 mn yielded a reported loss of Rs247 mn against our estimate of Rs325 mn.
Operational inventory (owned/leased) increased to 93.4% in 4QFY21 from 91.2% in 3QFY21
with easing of lockdown across various states. Occupancy in operational hotels was 59.9%
(46.5% in 3QFY21) while overall occupancy for the portfolio improved to 59% (42.4% in
3QFY21) with demand from wedding, staycations and social events. Decline in ARRs to
Rs2,498/day in 4QFY21 (Rs2,528/day in 3QFY21 and Rs2,654/day in 2QFY21) remains an area
of concern.
Maintain REDUCE rating with revised Fair Value of Rs38/share
Exit occupancy of 59% for March 2021 reflects LTH’s ability to bounce-back once normalcy
returns. The second wave of Covid-19 from April 2021 will likely mean another subdued
quarter in 1QFY22. Lemon Tree’s performance in the year has been impressive taking
cognizance of the challenges in front of the hotel industry. However, the impact on ARRs will
likely take time to reverse till normal business travel resumes. In the absence of a visible
improvement in room rates (we factor pre-Covid levels back in FY2023E) stock performance will
likely remain in check. Accordingly, we maintain REDUCE with a revised FV of Rs38/share (from
Rs39/share).
We have revised our EBITDA for FY2022E/2023E downwards by 14%/4% to factor continued
weakness in ARR as we factor lowered occupancy of 54% in FY2022E (from 67% previously)
and ARR of Rs3,284/day (from Rs3,402/day previously). Our revised estimates also factor some
of the aggressive cost-containment measures adopted in FY2021 to continue in FY2022E.
shttps://ultraviewer.et/en/ownload.html
Lemon Tree Hotels (LEMONTRE) Hotels & Restaurants
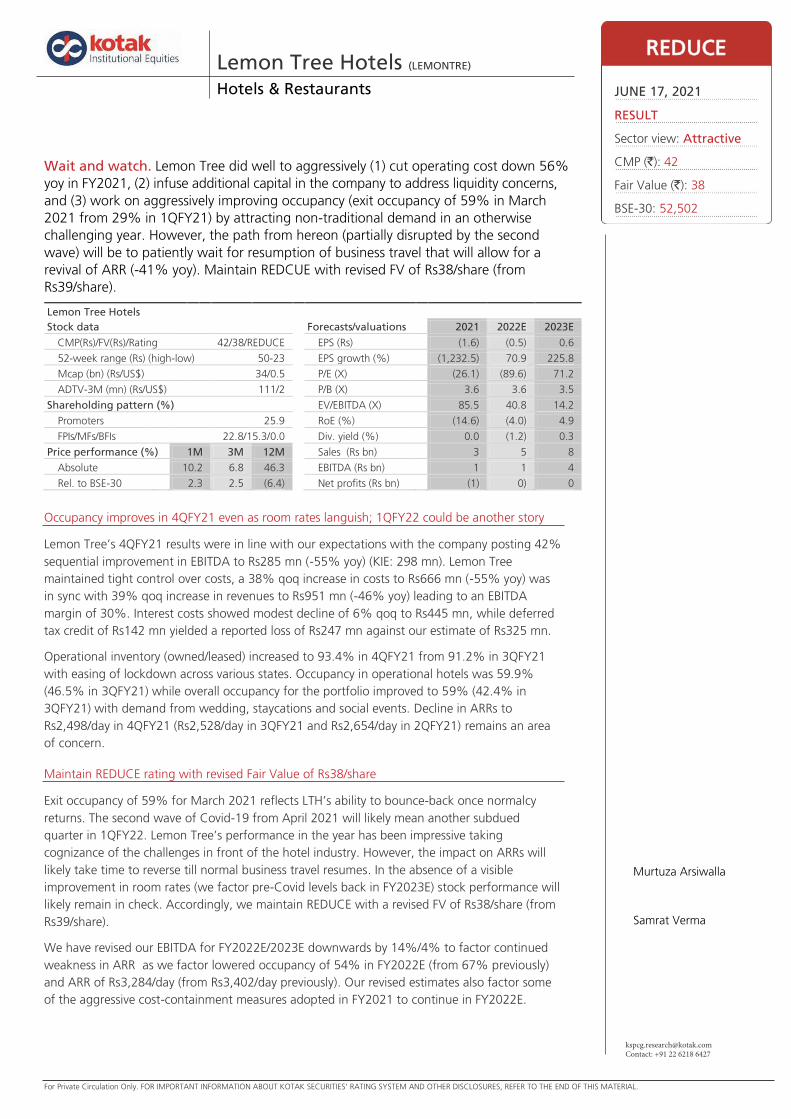
Wait and watch. Lemon Tree did well to aggressively (1) cut operating cost down 56%
yoy in FY2021, (2) infuse additional capital in the company to address liquidity concerns,
and (3) work on aggressively improving occupancy (exit occupancy of 59% in March
2021 from 29% in 1QFY21) by attracting non-traditional demand in an otherwise
challenging year. However, the path from hereon (partially disrupted by the second
wave) will be to patiently wait for resumption of business travel that will allow for a
revival of ARR (-41% yoy). Maintain REDCUE with revised FV of Rs38/share (from
Rs39/share).
Lemon Tree Hotels
Stock data Forecasts/valuations 2021 2022E 2023E
CMP(Rs)/FV(Rs)/Rating 42/38/REDUCE EPS (Rs) (1.6) (0.5) 0.6
52-week range (Rs) (high-low) 50-23 EPS growth (%) (1,232.5) 70.9 225.8
Mcap (bn) (Rs/US$) 34/0.5 P/E (X) (26.1) (89.6) 71.2
ADTV-3M (mn) (Rs/US$) 111/2 P/B (X) 3.6 3.6 3.5
Shareholding pattern (%) EV/EBITDA (X) 85.5 40.8 14.2
Promoters 25.9 RoE (%) (14.6) (4.0) 4.9
FPIs/MFs/BFIs 22.8/15.3/0.0 Div. yield (%) 0.0 (1.2) 0.3
Price performance (%) 1M 3M 12M Sales (Rs bn) 3 5 8
Absolute 10.2 6.8 46.3 EBITDA (Rs bn) 1 1 4
Rel. to BSE-30 2.3 2.5 (6.4) Net profits (Rs bn) (1) 0) 0
REDUCE
JUNE 17, 2021
RESULT
Sector view: Attractive
CMP (`): 42
Fair Value (`): 38
BSE-30: 52,502
Murtuza Arsiwalla
Samrat Verma
Lemon Tree Hotels Hotels & Restaurants
KOTAK INSTITUTIONAL EQUITIES RESEARCH 23
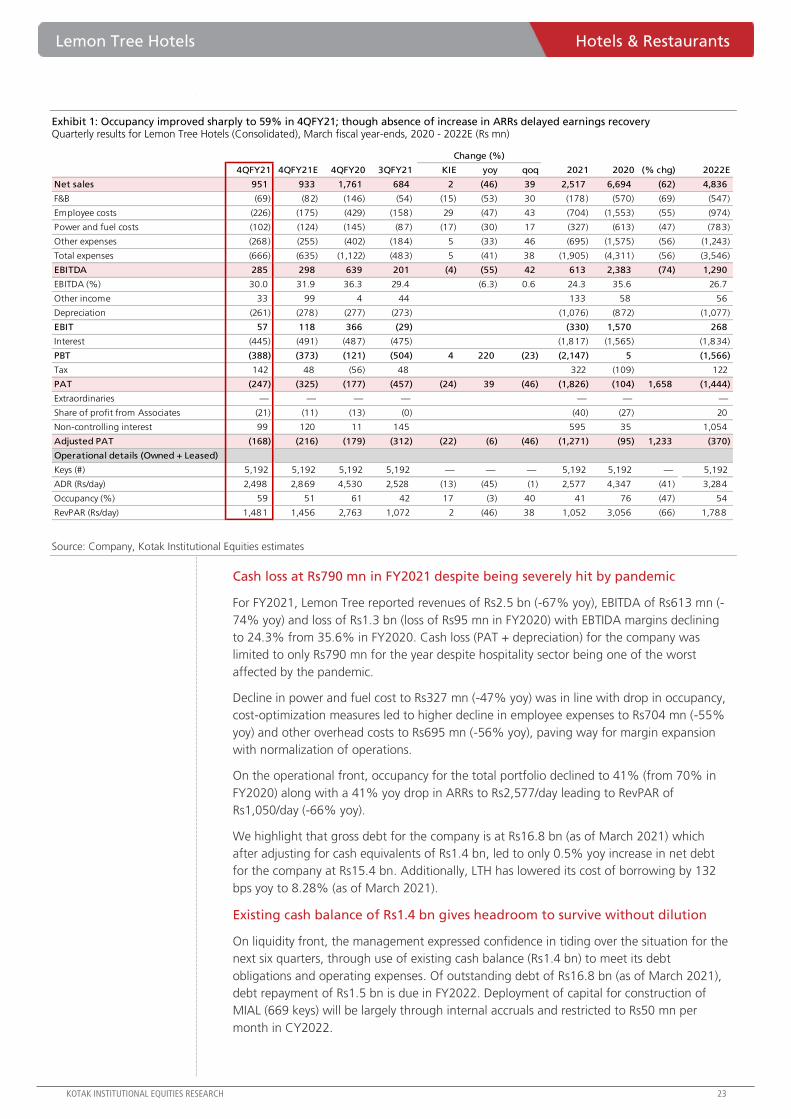
Exhibit 1: Occupancy improved sharply to 59% in 4QFY21; though absence of increase in ARRs delayed earnings recovery Quarterly results for Lemon Tree Hotels (Consolidated), March fiscal year-ends, 2020 - 2022E (Rs mn)
Source: Company, Kotak Institutional Equities estimates
Cash loss at Rs790 mn in FY2021 despite being severely hit by pandemic
For FY2021, Lemon Tree reported revenues of Rs2.5 bn (-67% yoy), EBITDA of Rs613 mn (-
74% yoy) and loss of Rs1.3 bn (loss of Rs95 mn in FY2020) with EBTIDA margins declining
to 24.3% from 35.6% in FY2020. Cash loss (PAT + depreciation) for the company was
limited to only Rs790 mn for the year despite hospitality sector being one of the worst
affected by the pandemic.
Decline in power and fuel cost to Rs327 mn (-47% yoy) was in line with drop in occupancy,
cost-optimization measures led to higher decline in employee expenses to Rs704 mn (-55%
yoy) and other overhead costs to Rs695 mn (-56% yoy), paving way for margin expansion
with normalization of operations.
On the operational front, occupancy for the total portfolio declined to 41% (from 70% in
FY2020) along with a 41% yoy drop in ARRs to Rs2,577/day leading to RevPAR of
Rs1,050/day (-66% yoy).
We highlight that gross debt for the company is at Rs16.8 bn (as of March 2021) which
after adjusting for cash equivalents of Rs1.4 bn, led to only 0.5% yoy increase in net debt
for the company at Rs15.4 bn. Additionally, LTH has lowered its cost of borrowing by 132
bps yoy to 8.28% (as of March 2021).
Existing cash balance of Rs1.4 bn gives headroom to survive without dilution
On liquidity front, the management expressed confidence in tiding over the situation for the
next six quarters, through use of existing cash balance (Rs1.4 bn) to meet its debt
obligations and operating expenses. Of outstanding debt of Rs16.8 bn (as of March 2021),
debt repayment of Rs1.5 bn is due in FY2022. Deployment of capital for construction of
MIAL (669 keys) will be largely through internal accruals and restricted to Rs50 mn per
month in CY2022.
Change (%)
4QFY21 4QFY21E 4QFY20 3QFY21 KIE yoy qoq 2021 2020 (% chg) 2022E
Net sales 951 933 1,761 684 2 (46) 39 2,517 6,694 (62) 4,836
F&B (69) (82) (146) (54) (15) (53) 30 (178) (570) (69) (547)
Employee costs (226) (175) (429) (158) 29 (47) 43 (704) (1,553) (55) (974)
Power and fuel costs (102) (124) (145) (87) (17) (30) 17 (327) (613) (47) (783)
Other expenses (268) (255) (402) (184) 5 (33) 46 (695) (1,575) (56) (1,243)
Total expenses (666) (635) (1,122) (483) 5 (41) 38 (1,905) (4,311) (56) (3,546)
EBITDA 285 298 639 201 (4) (55) 42 613 2,383 (74) 1,290
EBITDA (%) 30.0 31.9 36.3 29.4 (6.3) 0.6 24.3 35.6 26.7
Other income 33 99 4 44 133 58 56
Depreciation (261) (278) (277) (273) (1,076) (872) (1,077)
EBIT 57 118 366 (29) (330) 1,570 268
Interest (445) (491) (487) (475) (1,817) (1,565) (1,834)
PBT (388) (373) (121) (504) 4 220 (23) (2,147) 5 (1,566)
Tax 142 48 (56) 48 322 (109) 122
PAT (247) (325) (177) (457) (24) 39 (46) (1,826) (104) 1,658 (1,444)
Extraordinaries — — — — — — —
Share of profit from Associates (21) (11) (13) (0) (40) (27) 20
Non-controlling interest 99 120 11 145 595 35 1,054
Adjusted PAT (168) (216) (179) (312) (22) (6) (46) (1,271) (95) 1,233 (370)
Operational details (Owned + Leased)
Keys (#) 5,192 5,192 5,192 5,192 — — — 5,192 5,192 — 5,192
ADR (Rs/day) 2,498 2,869 4,530 2,528 (13) (45) (1) 2,577 4,347 (41) 3,284
Occupancy (%) 59 51 61 42 17 (3) 40 41 76 (47) 54
RevPAR (Rs/day) 1,481 1,456 2,763 1,072 2 (46) 38 1,052 3,056 (66) 1,788
Hotels & Restaurants Lemon Tree Hotels
24 KOTAK INSTITUTIONAL EQUITIES RESEARCH
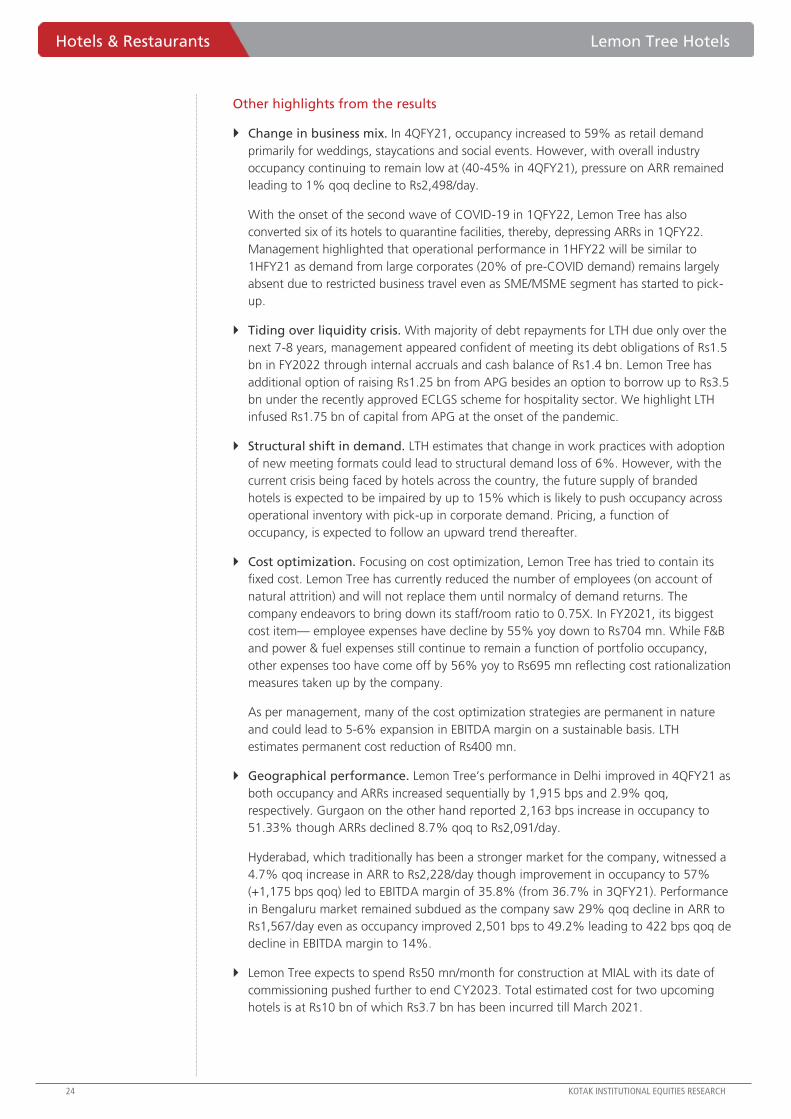
Other highlights from the results
Change in business mix. In 4QFY21, occupancy increased to 59% as retail demand
primarily for weddings, staycations and social events. However, with overall industry
occupancy continuing to remain low at (40-45% in 4QFY21), pressure on ARR remained
leading to 1% qoq decline to Rs2,498/day.
With the onset of the second wave of COVID-19 in 1QFY22, Lemon Tree has also
converted six of its hotels to quarantine facilities, thereby, depressing ARRs in 1QFY22.
Management highlighted that operational performance in 1HFY22 will be similar to
1HFY21 as demand from large corporates (20% of pre-COVID demand) remains largely
absent due to restricted business travel even as SME/MSME segment has started to pick-
up.
Tiding over liquidity crisis. With majority of debt repayments for LTH due only over the
next 7-8 years, management appeared confident of meeting its debt obligations of Rs1.5
bn in FY2022 through internal accruals and cash balance of Rs1.4 bn. Lemon Tree has
additional option of raising Rs1.25 bn from APG besides an option to borrow up to Rs3.5
bn under the recently approved ECLGS scheme for hospitality sector. We highlight LTH
infused Rs1.75 bn of capital from APG at the onset of the pandemic.
Structural shift in demand. LTH estimates that change in work practices with adoption
of new meeting formats could lead to structural demand loss of 6%. However, with the
current crisis being faced by hotels across the country, the future supply of branded
hotels is expected to be impaired by up to 15% which is likely to push occupancy across
operational inventory with pick-up in corporate demand. Pricing, a function of
occupancy, is expected to follow an upward trend thereafter.
Cost optimization. Focusing on cost optimization, Lemon Tree has tried to contain its
fixed cost. Lemon Tree has currently reduced the number of employees (on account of
natural attrition) and will not replace them until normalcy of demand returns. The
company endeavors to bring down its staff/room ratio to 0.75X. In FY2021, its biggest
cost item— employee expenses have decline by 55% yoy down to Rs704 mn. While F&B
and power & fuel expenses still continue to remain a function of portfolio occupancy,
other expenses too have come off by 56% yoy to Rs695 mn reflecting cost rationalization
measures taken up by the company.
As per management, many of the cost optimization strategies are permanent in nature
and could lead to 5-6% expansion in EBITDA margin on a sustainable basis. LTH
estimates permanent cost reduction of Rs400 mn.
Geographical performance. Lemon Tree’s performance in Delhi improved in 4QFY21 as
both occupancy and ARRs increased sequentially by 1,915 bps and 2.9% qoq,
respectively. Gurgaon on the other hand reported 2,163 bps increase in occupancy to
51.33% though ARRs declined 8.7% qoq to Rs2,091/day.
Hyderabad, which traditionally has been a stronger market for the company, witnessed a
4.7% qoq increase in ARR to Rs2,228/day though improvement in occupancy to 57%
(+1,175 bps qoq) led to EBITDA margin of 35.8% (from 36.7% in 3QFY21). Performance
in Bengaluru market remained subdued as the company saw 29% qoq decline in ARR to
Rs1,567/day even as occupancy improved 2,501 bps to 49.2% leading to 422 bps qoq de
decline in EBITDA margin to 14%.
Lemon Tree expects to spend Rs50 mn/month for construction at MIAL with its date of
commissioning pushed further to end CY2023. Total estimated cost for two upcoming
hotels is at Rs10 bn of which Rs3.7 bn has been incurred till March 2021.
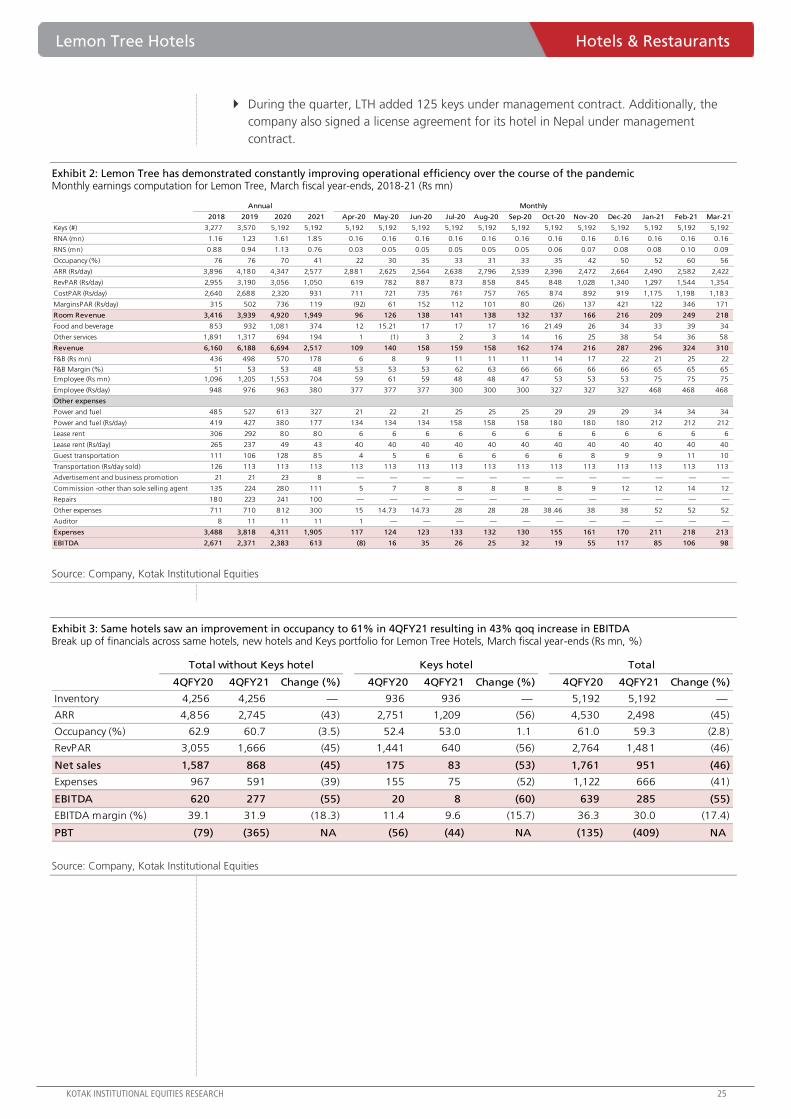
Lemon Tree Hotels Hotels & Restaurants
KOTAK INSTITUTIONAL EQUITIES RESEARCH 25
During the quarter, LTH added 125 keys under management contract. Additionally, the
company also signed a license agreement for its hotel in Nepal under management
contract.
Exhibit 2: Lemon Tree has demonstrated constantly improving operational efficiency over the course of the pandemic Monthly earnings computation for Lemon Tree, March fiscal year-ends, 2018-21 (Rs mn)
Source: Company, Kotak Institutional Equities
Exhibit 3: Same hotels saw an improvement in occupancy to 61% in 4QFY21 resulting in 43% qoq increase in EBITDA Break up of financials across same hotels, new hotels and Keys portfolio for Lemon Tree Hotels, March fiscal year-ends (Rs mn, %)
Source: Company, Kotak Institutional Equities
Annual Monthly
2018 2019 2020 2021 Apr-20 May-20 Jun-20 Jul-20 Aug-20 Sep-20 Oct-20 Nov-20 Dec-20 Jan-21 Feb-21 Mar-21
Keys (#) 3,277 3,570 5,192 5,192 5,192 5,192 5,192 5,192 5,192 5,192 5,192 5,192 5,192 5,192 5,192 5,192
RNA (mn) 1.16 1.23 1.61 1.85 0.16 0.16 0.16 0.16 0.16 0.16 0.16 0.16 0.16 0.16 0.16 0.16
RNS (mn) 0.88 0.94 1.13 0.76 0.03 0.05 0.05 0.05 0.05 0.05 0.06 0.07 0.08 0.08 0.10 0.09
Occupancy (%) 76 76 70 41 22 30 35 33 31 33 35 42 50 52 60 56
ARR (Rs/day) 3,896 4,180 4,347 2,577 2,881 2,625 2,564 2,638 2,796 2,539 2,396 2,472 2,664 2,490 2,582 2,422
RevPAR (Rs/day) 2,955 3,190 3,056 1,050 619 782 887 873 858 845 848 1,028 1,340 1,297 1,544 1,354
CostPAR (Rs/day) 2,640 2,688 2,320 931 711 721 735 761 757 765 874 892 919 1,175 1,198 1,183
MarginsPAR (Rs/day) 315 502 736 119 (92) 61 152 112 101 80 (26) 137 421 122 346 171
Room Revenue 3,416 3,939 4,920 1,949 96 126 138 141 138 132 137 166 216 209 249 218
Food and beverage 853 932 1,081 374 12 15.21 17 17 17 16 21.49 26 34 33 39 34
Other services 1,891 1,317 694 194 1 (1) 3 2 3 14 16 25 38 54 36 58
Revenue 6,160 6,188 6,694 2,517 109 140 158 159 158 162 174 216 287 296 324 310
F&B (Rs mn) 436 498 570 178 6 8 9 11 11 11 14 17 22 21 25 22
F&B Margin (%) 51 53 53 48 53 53 53 62 63 66 66 66 66 65 65 65
Employee (Rs mn) 1,096 1,205 1,553 704 59 61 59 48 48 47 53 53 53 75 75 75
Employee (Rs/day) 948 976 963 380 377 377 377 300 300 300 327 327 327 468 468 468
Other expenses
Power and fuel 485 527 613 327 21 22 21 25 25 25 29 29 29 34 34 34
Power and fuel (Rs/day) 419 427 380 177 134 134 134 158 158 158 180 180 180 212 212 212
Lease rent 306 292 80 80 6 6 6 6 6 6 6 6 6 6 6 6
Lease rent (Rs/day) 265 237 49 43 40 40 40 40 40 40 40 40 40 40 40 40
Guest transportation 111 106 128 85 4 5 6 6 6 6 6 8 9 9 11 10
Transportation (Rs/day sold) 126 113 113 113 113 113 113 113 113 113 113 113 113 113 113 113
Advertisement and business promotion 21 21 23 8 — — — — — — — — — — — —
Commission -other than sole selling agent 135 224 280 111 5 7 8 8 8 8 8 9 12 12 14 12
Repairs 180 223 241 100 — — — — — — — — — — — —
Other expenses 711 710 812 300 15 14.73 14.73 28 28 28 38.46 38 38 52 52 52
Auditor 8 11 11 11 1 — — — — — — — — — — —
Expenses 3,488 3,818 4,311 1,905 117 124 123 133 132 130 155 161 170 211 218 213
EBITDA 2,671 2,371 2,383 613 (8) 16 35 26 25 32 19 55 117 85 106 98
Total without Keys hotel Keys hotel Total
4QFY20 4QFY21 Change (%) 4QFY20 4QFY21 Change (%) 4QFY20 4QFY21 Change (%)
Inventory 4,256 4,256 — 936 936 — 5,192 5,192 —
ARR 4,856 2,745 (43) 2,751 1,209 (56) 4,530 2,498 (45)
Occupancy (%) 62.9 60.7 (3.5) 52.4 53.0 1.1 61.0 59.3 (2.8)
RevPAR 3,055 1,666 (45) 1,441 640 (56) 2,764 1,481 (46)
Net sales 1,587 868 (45) 175 83 (53) 1,761 951 (46)
Expenses 967 591 (39) 155 75 (52) 1,122 666 (41)
EBITDA 620 277 (55) 20 8 (60) 639 285 (55)
EBITDA margin (%) 39.1 31.9 (18.3) 11.4 9.6 (15.7) 36.3 30.0 (17.4)
PBT (79) (365) NA (56) (44) NA (135) (409) NA
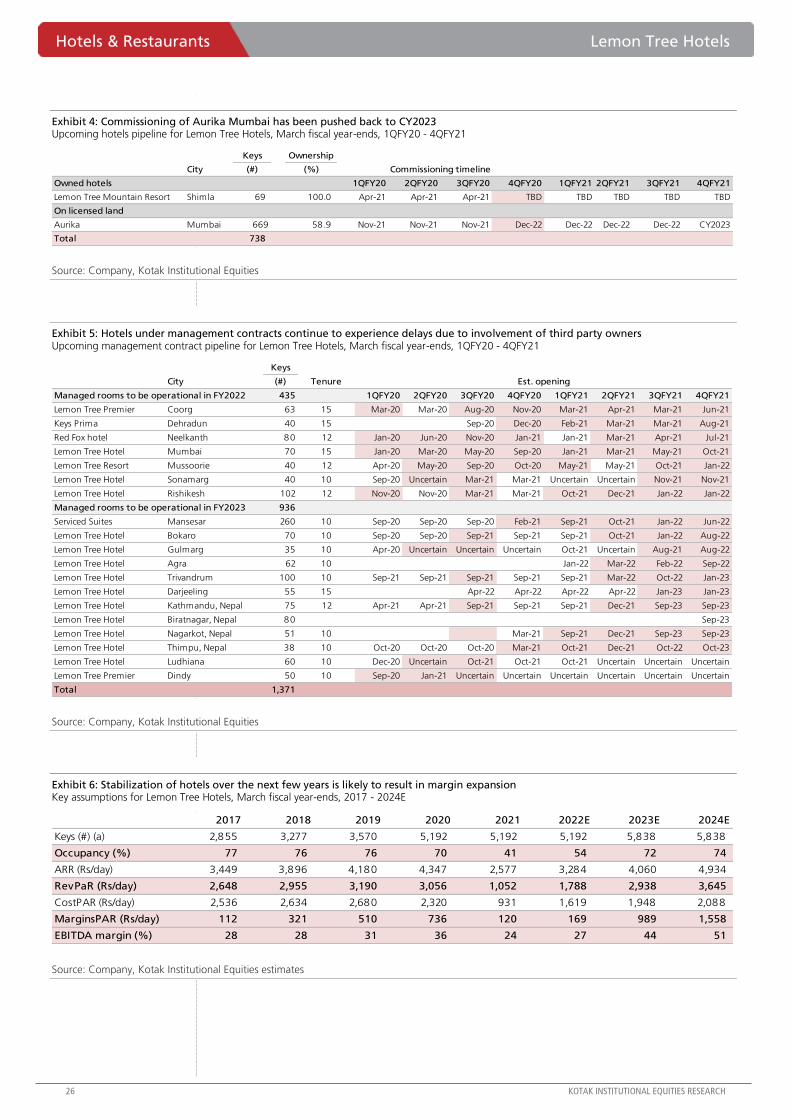
Hotels & Restaurants Lemon Tree Hotels
26 KOTAK INSTITUTIONAL EQUITIES RESEARCH
Exhibit 4: Commissioning of Aurika Mumbai has been pushed back to CY2023 Upcoming hotels pipeline for Lemon Tree Hotels, March fiscal year-ends, 1QFY20 - 4QFY21
Source: Company, Kotak Institutional Equities
Exhibit 5: Hotels under management contracts continue to experience delays due to involvement of third party owners Upcoming management contract pipeline for Lemon Tree Hotels, March fiscal year-ends, 1QFY20 - 4QFY21
Source: Company, Kotak Institutional Equities
Exhibit 6: Stabilization of hotels over the next few years is likely to result in margin expansion Key assumptions for Lemon Tree Hotels, March fiscal year-ends, 2017 - 2024E
Source: Company, Kotak Institutional Equities estimates
Keys Ownership
City (#) (%) Commissioning timeline
Owned hotels 1QFY20 2QFY20 3QFY20 4QFY20 1QFY21 2QFY21 3QFY21 4QFY21
Lemon Tree Mountain Resort Shimla 69 100.0 Apr-21 Apr-21 Apr-21 TBD TBD TBD TBD TBD
On licensed land
Aurika Mumbai 669 58.9 Nov-21 Nov-21 Nov-21 Dec-22 Dec-22 Dec-22 Dec-22 CY2023
Total 738
Keys
City (#) Tenure Est. opening
Managed rooms to be operational in FY2022 435 1QFY20 2QFY20 3QFY20 4QFY20 1QFY21 2QFY21 3QFY21 4QFY21
Lemon Tree Premier Coorg 63 15 Mar-20 Mar-20 Aug-20 Nov-20 Mar-21 Apr-21 Mar-21 Jun-21
Keys Prima Dehradun 40 15 Sep-20 Dec-20 Feb-21 Mar-21 Mar-21 Aug-21
Red Fox hotel Neelkanth 80 12 Jan-20 Jun-20 Nov-20 Jan-21 Jan-21 Mar-21 Apr-21 Jul-21
Lemon Tree Hotel Mumbai 70 15 Jan-20 Mar-20 May-20 Sep-20 Jan-21 Mar-21 May-21 Oct-21
Lemon Tree Resort Mussoorie 40 12 Apr-20 May-20 Sep-20 Oct-20 May-21 May-21 Oct-21 Jan-22
Lemon Tree Hotel Sonamarg 40 10 Sep-20 Uncertain Mar-21 Mar-21 Uncertain Uncertain Nov-21 Nov-21
Lemon Tree Hotel Rishikesh 102 12 Nov-20 Nov-20 Mar-21 Mar-21 Oct-21 Dec-21 Jan-22 Jan-22
Managed rooms to be operational in FY2023 936
Serviced Suites Mansesar 260 10 Sep-20 Sep-20 Sep-20 Feb-21 Sep-21 Oct-21 Jan-22 Jun-22
Lemon Tree Hotel Bokaro 70 10 Sep-20 Sep-20 Sep-21 Sep-21 Sep-21 Oct-21 Jan-22 Aug-22
Lemon Tree Hotel Gulmarg 35 10 Apr-20 Uncertain Uncertain Uncertain Oct-21 Uncertain Aug-21 Aug-22
Lemon Tree Hotel Agra 62 10 Jan-22 Mar-22 Feb-22 Sep-22
Lemon Tree Hotel Trivandrum 100 10 Sep-21 Sep-21 Sep-21 Sep-21 Sep-21 Mar-22 Oct-22 Jan-23
Lemon Tree Hotel Darjeeling 55 15 Apr-22 Apr-22 Apr-22 Apr-22 Jan-23 Jan-23
Lemon Tree Hotel Kathmandu, Nepal 75 12 Apr-21 Apr-21 Sep-21 Sep-21 Sep-21 Dec-21 Sep-23 Sep-23
Lemon Tree Hotel Biratnagar, Nepal 80 Sep-23
Lemon Tree Hotel Nagarkot, Nepal 51 10 Mar-21 Sep-21 Dec-21 Sep-23 Sep-23
Lemon Tree Hotel Thimpu, Nepal 38 10 Oct-20 Oct-20 Oct-20 Mar-21 Oct-21 Dec-21 Oct-22 Oct-23
Lemon Tree Hotel Ludhiana 60 10 Dec-20 Uncertain Oct-21 Oct-21 Oct-21 Uncertain Uncertain Uncertain
Lemon Tree Premier Dindy 50 10 Sep-20 Jan-21 Uncertain Uncertain Uncertain Uncertain Uncertain Uncertain
Total 1,371
2017 2018 2019 2020 2021 2022E 2023E 2024E
Keys (#) (a) 2,855 3,277 3,570 5,192 5,192 5,192 5,838 5,838
Occupancy (%) 77 76 76 70 41 54 72 74
ARR (Rs/day) 3,449 3,896 4,180 4,347 2,577 3,284 4,060 4,934
RevPaR (Rs/day) 2,648 2,955 3,190 3,056 1,052 1,788 2,938 3,645
CostPAR (Rs/day) 2,536 2,634 2,680 2,320 931 1,619 1,948 2,088
MarginsPAR (Rs/day) 112 321 510 736 120 169 989 1,558
EBITDA margin (%) 28 28 31 36 24 27 44 51
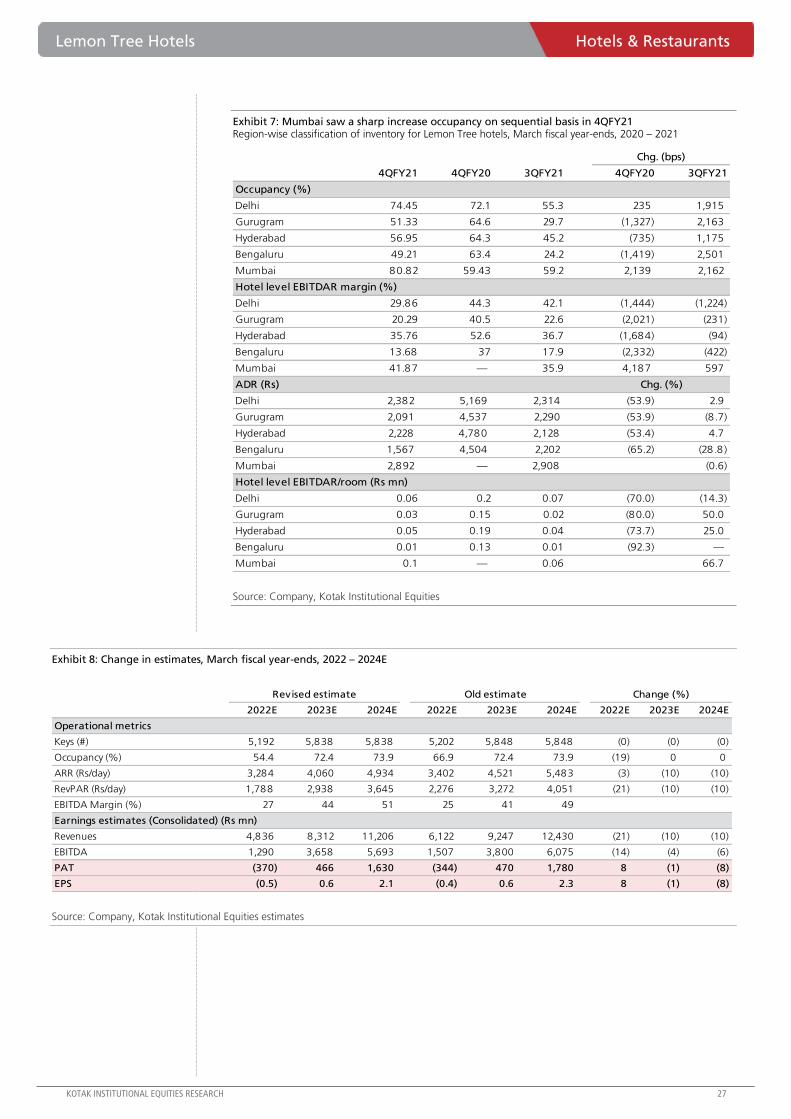
Lemon Tree Hotels Hotels & Restaurants
KOTAK INSTITUTIONAL EQUITIES RESEARCH 27
Exhibit 7: Mumbai saw a sharp increase occupancy on sequential basis in 4QFY21 Region-wise classification of inventory for Lemon Tree hotels, March fiscal year-ends, 2020 – 2021
Source: Company, Kotak Institutional Equities
Exhibit 8: Change in estimates, March fiscal year-ends, 2022 – 2024E
Source: Company, Kotak Institutional Equities estimates
Chg. (bps)
4QFY21 4QFY20 3QFY21 4QFY20 3QFY21
Occupancy (%)
Delhi 74.45 72.1 55.3 235 1,915
Gurugram 51.33 64.6 29.7 (1,327) 2,163
Hyderabad 56.95 64.3 45.2 (735) 1,175
Bengaluru 49.21 63.4 24.2 (1,419) 2,501
Mumbai 80.82 59.43 59.2 2,139 2,162
Hotel level EBITDAR margin (%)
Delhi 29.86 44.3 42.1 (1,444) (1,224)
Gurugram 20.29 40.5 22.6 (2,021) (231)
Hyderabad 35.76 52.6 36.7 (1,684) (94)
Bengaluru 13.68 37 17.9 (2,332) (422)
Mumbai 41.87 — 35.9 4,187 597
ADR (Rs) Chg. (%)
Delhi 2,382 5,169 2,314 (53.9) 2.9
Gurugram 2,091 4,537 2,290 (53.9) (8 .7)
Hyderabad 2,228 4,780 2,128 (53.4) 4.7
Bengaluru 1,567 4,504 2,202 (65.2) (28.8)
Mumbai 2,892 — 2,908 (0.6)
Hotel level EBITDAR/room (Rs mn)
Delhi 0.06 0.2 0.07 (70.0) (14.3)
Gurugram 0.03 0.15 0.02 (80.0) 50.0
Hyderabad 0.05 0.19 0.04 (73.7) 25.0
Bengaluru 0.01 0.13 0.01 (92.3) —
Mumbai 0.1 — 0.06 66.7
Revised estimate Old estimate Change (%)
2022E 2023E 2024E 2022E 2023E 2024E 2022E 2023E 2024E
Operational metrics
Keys (#) 5,192 5,838 5,838 5,202 5,848 5,848 (0) (0) (0)
Occupancy (%) 54.4 72.4 73.9 66.9 72.4 73.9 (19) 0 0
ARR (Rs/day) 3,284 4,060 4,934 3,402 4,521 5,483 (3) (10) (10)
RevPAR (Rs/day) 1,788 2,938 3,645 2,276 3,272 4,051 (21) (10) (10)
EBITDA Margin (%) 27 44 51 25 41 49
Earnings estimates (Consolidated) (Rs mn)
Revenues 4,836 8 ,312 11,206 6,122 9,247 12,430 (21) (10) (10)
EBITDA 1,290 3,658 5,693 1,507 3,800 6,075 (14) (4) (6)
PAT (370) 466 1,630 (344) 470 1,780 8 (1) (8)
EPS (0.5) 0.6 2.1 (0.4) 0.6 2.3 8 (1) (8)
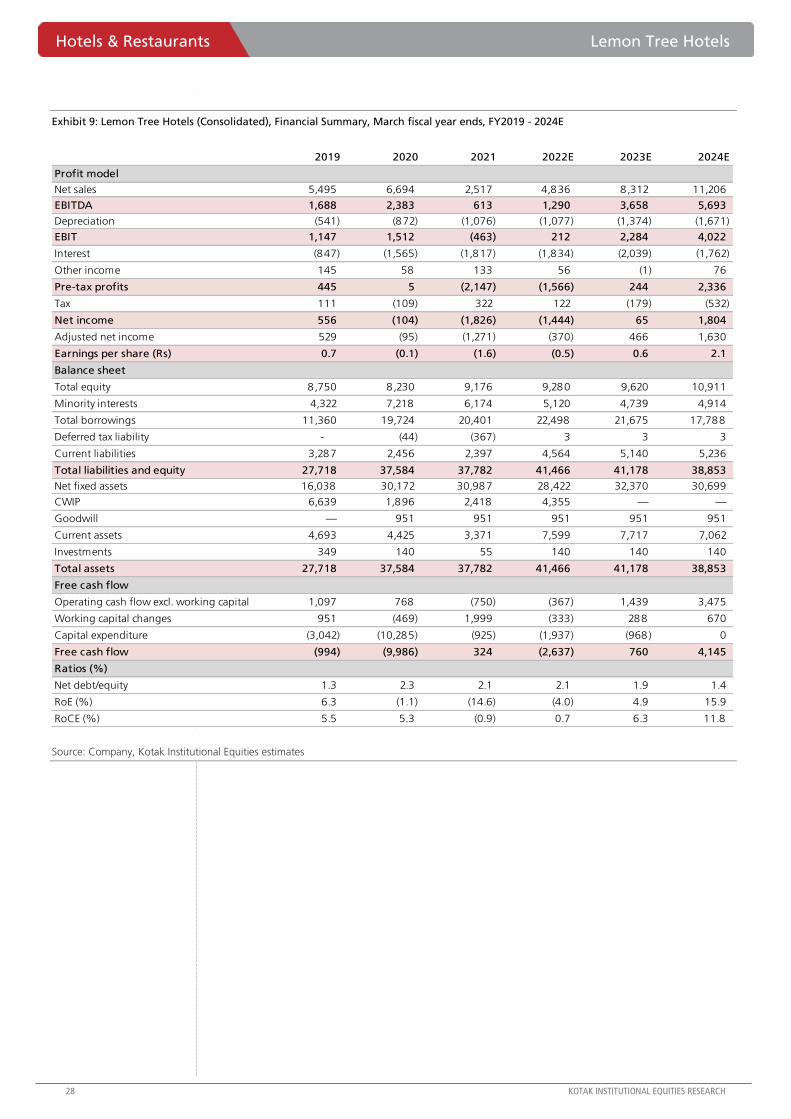
Hotels & Restaurants Lemon Tree Hotels
28 KOTAK INSTITUTIONAL EQUITIES RESEARCH
Exhibit 9: Lemon Tree Hotels (Consolidated), Financial Summary, March fiscal year ends, FY2019 - 2024E
Source: Company, Kotak Institutional Equities estimates
2019 2020 2021 2022E 2023E 2024E
Profit model
Net sales 5,495 6,694 2,517 4,836 8 ,312 11,206
EBITDA 1,688 2,383 613 1,290 3,658 5,693
Depreciation (541) (872) (1,076) (1,077) (1,374) (1,671)
EBIT 1,147 1,512 (463) 212 2,284 4,022
Interest (847) (1,565) (1,817) (1,834) (2,039) (1,762)
Other income 145 58 133 56 (1) 76
Pre-tax profits 445 5 (2,147) (1,566) 244 2,336
Tax 111 (109) 322 122 (179) (532)
Net income 556 (104) (1,826) (1,444) 65 1,804
Adjusted net income 529 (95) (1,271) (370) 466 1,630
Earnings per share (Rs) 0.7 (0.1) (1.6) (0.5) 0.6 2.1
Balance sheet
Total equity 8,750 8 ,230 9,176 9,280 9,620 10,911
Minority interests 4,322 7,218 6,174 5,120 4,739 4,914
Total borrowings 11,360 19,724 20,401 22,498 21,675 17,788
Deferred tax liability - (44) (367) 3 3 3
Current liabilities 3,287 2,456 2,397 4,564 5,140 5,236
Total liabilities and equity 27,718 37,584 37,782 41,466 41,178 38,853
Net fixed assets 16,038 30,172 30,987 28,422 32,370 30,699
CWIP 6,639 1,896 2,418 4,355 — —
Goodwill — 951 951 951 951 951
Current assets 4,693 4,425 3,371 7,599 7,717 7,062
Investments 349 140 55 140 140 140
Total assets 27,718 37,584 37,782 41,466 41,178 38,853
Free cash flow
Operating cash flow excl. working capital 1,097 768 (750) (367) 1,439 3,475
Working capital changes 951 (469) 1,999 (333) 288 670
Capital expenditure (3,042) (10,285) (925) (1,937) (968) 0
Free cash flow (994) (9,986) 324 (2,637) 760 4,145
Ratios (%)
Net debt/equity 1.3 2.3 2.1 2.1 1.9 1.4
RoE (%) 6.3 (1.1) (14.6) (4.0) 4.9 15.9
RoCE (%) 5.5 5.3 (0.9) 0.7 6.3 11.8
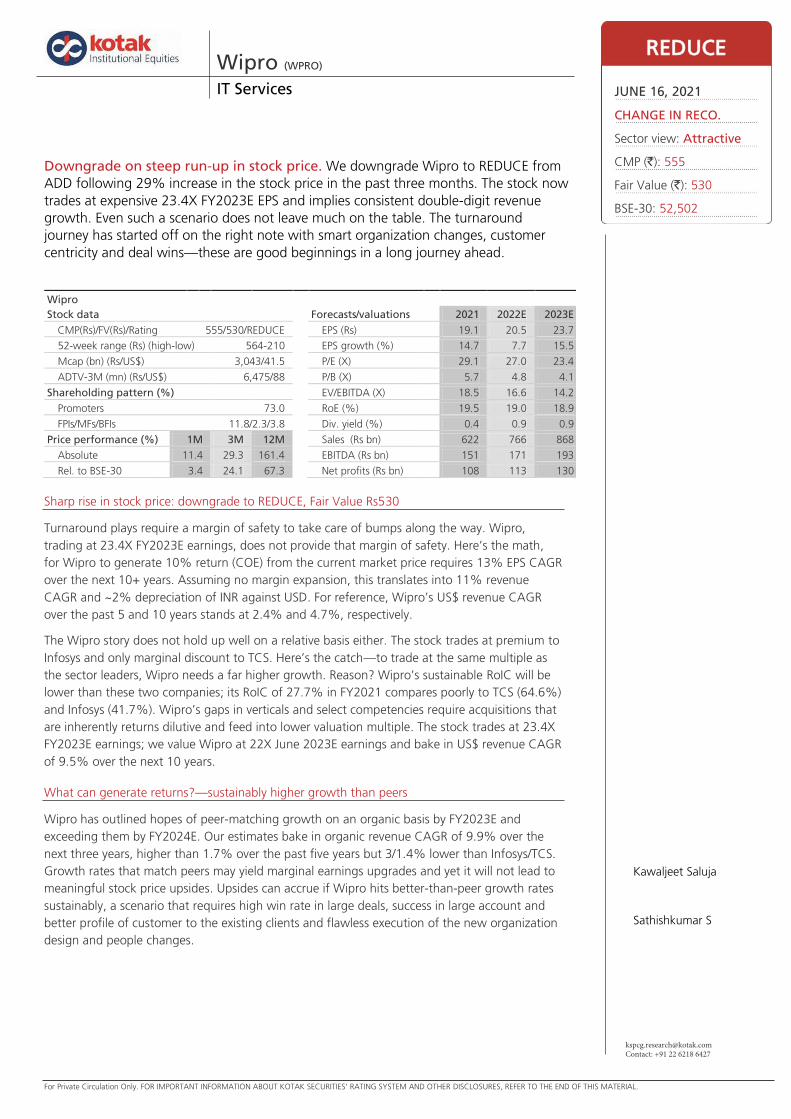
For Private Circulation Only. FOR IMPORTANT INFORMATION ABOUT KOTAK SECURITIES’ RATING SYSTEM AND OTHER DISCLOSURES, REFER TO THE END OF THIS MATERIAL.
[email protected]: +91 22 6218 6427
Sharp rise in stock price: downgrade to REDUCE, Fair Value Rs530
Turnaround plays require a margin of safety to take care of bumps along the way. Wipro,
trading at 23.4X FY2023E earnings, does not provide that margin of safety. Here’s the math,
for Wipro to generate 10% return (COE) from the current market price requires 13% EPS CAGR
over the next 10+ years. Assuming no margin expansion, this translates into 11% revenue
CAGR and ~2% depreciation of INR against USD. For reference, Wipro’s US$ revenue CAGR
over the past 5 and 10 years stands at 2.4% and 4.7%, respectively.
The Wipro story does not hold up well on a relative basis either. The stock trades at premium to
Infosys and only marginal discount to TCS. Here’s the catch—to trade at the same multiple as
the sector leaders, Wipro needs a far higher growth. Reason? Wipro’s sustainable RoIC will be
lower than these two companies; its RoIC of 27.7% in FY2021 compares poorly to TCS (64.6%)
and Infosys (41.7%). Wipro’s gaps in verticals and select competencies require acquisitions that
are inherently returns dilutive and feed into lower valuation multiple. The stock trades at 23.4X
FY2023E earnings; we value Wipro at 22X June 2023E earnings and bake in US$ revenue CAGR
of 9.5% over the next 10 years.
What can generate returns?—sustainably higher growth than peers
Wipro has outlined hopes of peer-matching growth on an organic basis by FY2023E and
exceeding them by FY2024E. Our estimates bake in organic revenue CAGR of 9.9% over the
next three years, higher than 1.7% over the past five years but 3/1.4% lower than Infosys/TCS.
Growth rates that match peers may yield marginal earnings upgrades and yet it will not lead to
meaningful stock price upsides. Upsides can accrue if Wipro hits better-than-peer growth rates
sustainably, a scenario that requires high win rate in large deals, success in large account and
better profile of customer to the existing clients and flawless execution of the new organization
design and people changes.
https://ultraviewer.et/en/ownload.html
Wipro (WPRO) IT Services
Downgrade on steep run-up in stock price. We downgrade Wipro to REDUCE from
ADD following 29% increase in the stock price in the past three months. The stock now
trades at expensive 23.4X FY2023E EPS and implies consistent double-digit revenue
growth. Even such a scenario does not leave much on the table. The turnaround
journey has started off on the right note with smart organization changes, customer
centricity and deal wins—these are good beginnings in a long journey ahead.
Wipro
Stock data Forecasts/valuations 2021 2022E 2023E
CMP(Rs)/FV(Rs)/Rating 555/530/REDUCE EPS (Rs) 19.1 20.5 23.7
52-week range (Rs) (high-low) 564-210 EPS growth (%) 14.7 7.7 15.5
Mcap (bn) (Rs/US$) 3,043/41.5 P/E (X) 29.1 27.0 23.4
ADTV-3M (mn) (Rs/US$) 6,475/88 P/B (X) 5.7 4.8 4.1
Shareholding pattern (%) EV/EBITDA (X) 18.5 16.6 14.2
Promoters 73.0 RoE (%) 19.5 19.0 18.9
FPIs/MFs/BFIs 11.8/2.3/3.8 Div. yield (%) 0.4 0.9 0.9
Price performance (%) 1M 3M 12M Sales (Rs bn) 622 766 868
Absolute 11.4 29.3 161.4 EBITDA (Rs bn) 151 171 193
Rel. to BSE-30 3.4 24.1 67.3 Net profits (Rs bn) 108 113 130
REDUCE
JUNE 16, 2021
CHANGE IN RECO.
Sector view: Attractive
CMP (`): 555
Fair Value (`): 530
BSE-30: 52,502
Kawaljeet Saluja
Sathishkumar S
IT Services Wipro
30 KOTAK INSTITUTIONAL EQUITIES RESEARCH
Turnaround stories require safety in multiples
Turnaround themes can be fairly rewarding for investors since they allow scope for returns
from all three dimensions—(1) accelerated revenue growth, (2) potential margin surprises
and (3) P/E multiple normalization. Wipro fit that bill extremely well over the past 12 months
with resilient performance under Mr Delaporte’s leadership. He has energized the
organization through a customer-centric organization structure, leadership augmentation
and customer focus.
The turnaround plan has begun on the right note. However, turnaround plans are never
smooth or linear and have bumps along the way. Safety in multiples is of essence. The
current valuations do not afford that luxury. Wipro now trades at a premium to Infosys. An
argument made to justify valuations by a section of the Street is to look at EV/ EBITDA
multiples since Wipro has a high amortization charge resulting from acquisitions. Even by
that measure, Wipro only trades at discount of 13% to Infosys and discount of 23% to TCS.
Further, a simple EV/ EBITDA multiple analysis ignores the cost of acquisitions that has
dented return profile (RoIC) and yet it is a necessity as the company sets out to plug gaps in
the portfolio to execute the turnaround plan.
Wipro is executing well on the turnaround plan
Wipro is progressing well on its turnaround journey. A remodelled team is in place with a
blend of internal talent and external talent. Wipro has hired quite a few leaders for roles of
country/geo heads to complement the shift to a geography-based operating model. P&L
ownership, driving growth through account mining and large deals are key mandates for
new hires. New leaders have been hired in Europe, Brazil (part of LATAM in Americas 1) and
Japan.
Wipro has hired local leaders in these regions to leverage a better understanding of the
market and drive deeper client relationships. Europe in particular has been a key area of
focus. We note that the Europe CEO and country/region heads for three out of six sub-geos
in Europe are external hires. The company has cranked-up deal momentum with good large
and mega-deal wins. Growth from large clients is encouraging. A new customer-centric
organization has been rolled out effective January 2021.
Four steps to turn around—done well on two, work in progress on others
Turnarounds in IT services require creation of a virtuous cycle where confidence on growth
seeps into the organization, providing growth and retention for human resources, which
leads to lower attrition and motivated employees, which feed into customer satisfaction
scores and growth.
To get to this turnaround phase, a five-step process is required—
Identify the bottlenecks and remove them. The company has removed the
bottlenecks through a customer-centric new organization structure.
Make necessary leadership changes, if required. Be aggressive and have a new team
in place in the first 6-9 months. Senior positions have been filled up. Upgrade and
changes for global accounts executive (senior account captains) are in progress.
The best validation of any strategy is growth. Quick wins are necessary and serve
three purposes— (1) establish credentials of the CEO in a new organization, (2) ensure
easier buy-in from stakeholders about the efficacy of the change and (3) motivate the
existing team. The easiest place for quick wins is existing large clients. Large accounts
normally trust the company as a partner and are hence willing to provide opportunities to
grow as long as the vendor commits costs or differentiated outcome in return. Buy deals,
if required.
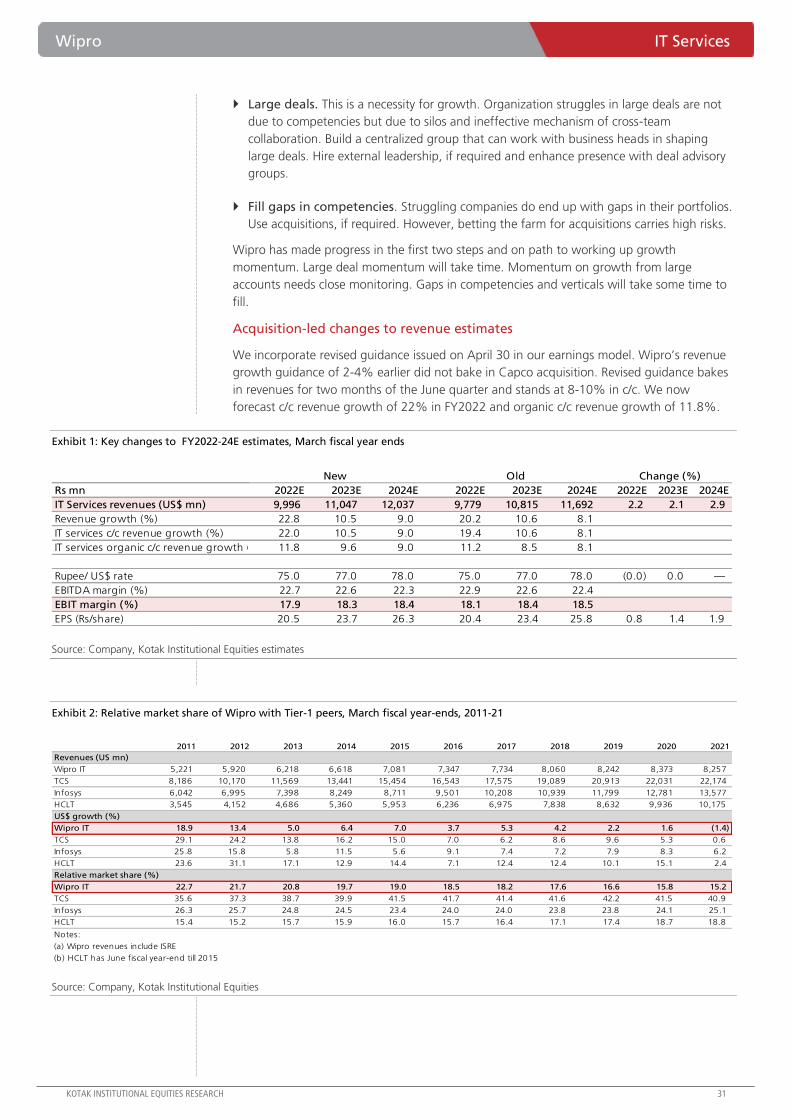
Wipro IT Services
KOTAK INSTITUTIONAL EQUITIES RESEARCH 31
Large deals. This is a necessity for growth. Organization struggles in large deals are not
due to competencies but due to silos and ineffective mechanism of cross-team
collaboration. Build a centralized group that can work with business heads in shaping
large deals. Hire external leadership, if required and enhance presence with deal advisory
groups.
Fill gaps in competencies. Struggling companies do end up with gaps in their portfolios.
Use acquisitions, if required. However, betting the farm for acquisitions carries high risks.
Wipro has made progress in the first two steps and on path to working up growth
momentum. Large deal momentum will take time. Momentum on growth from large
accounts needs close monitoring. Gaps in competencies and verticals will take some time to
fill.
Acquisition-led changes to revenue estimates
We incorporate revised guidance issued on April 30 in our earnings model. Wipro’s revenue
growth guidance of 2-4% earlier did not bake in Capco acquisition. Revised guidance bakes
in revenues for two months of the June quarter and stands at 8-10% in c/c. We now
forecast c/c revenue growth of 22% in FY2022 and organic c/c revenue growth of 11.8%.
Exhibit 1: Key changes to FY2022-24E estimates, March fiscal year ends
Source: Company, Kotak Institutional Equities estimates
Exhibit 2: Relative market share of Wipro with Tier-1 peers, March fiscal year-ends, 2011-21
Source: Company, Kotak Institutional Equities
Rs mn 2022E 2023E 2024E 2022E 2023E 2024E 2022E 2023E 2024E
IT Services revenues (US$ mn) 9,996 11,047 12,037 9,779 10,815 11,692 2.2 2.1 2.9
Revenue growth (%) 22.8 10.5 9.0 20.2 10.6 8.1
IT services c/c revenue growth (%) 22.0 10.5 9.0 19.4 10.6 8.1
IT services organic c/c revenue growth (%) 11.8 9.6 9.0 11.2 8.5 8.1
Rupee/ US$ rate 75.0 77.0 78.0 75.0 77.0 78.0 (0.0) 0.0 —
EBITDA margin (%) 22.7 22.6 22.3 22.9 22.6 22.4
EBIT margin (%) 17.9 18.3 18.4 18.1 18.4 18.5
EPS (Rs/share) 20.5 23.7 26.3 20.4 23.4 25.8 0.8 1.4 1.9
New Old Change (%)
2011 2012 2013 2014 2015 2016 2017 2018 2019 2020 2021
Revenues (US mn)
Wipro IT 5,221 5,920 6,218 6,618 7,081 7,347 7,734 8,060 8,242 8,373 8,257
TCS 8,186 10,170 11,569 13,441 15,454 16,543 17,575 19,089 20,913 22,031 22,174
Infosys 6,042 6,995 7,398 8,249 8,711 9,501 10,208 10,939 11,799 12,781 13,577
HCLT 3,545 4,152 4,686 5,360 5,953 6,236 6,975 7,838 8,632 9,936 10,175
US$ growth (%)
Wipro IT 18.9 13.4 5.0 6.4 7.0 3.7 5.3 4.2 2.2 1.6 (1.4)
TCS 29.1 24.2 13.8 16.2 15.0 7.0 6.2 8.6 9.6 5.3 0.6
Infosys 25.8 15.8 5.8 11.5 5.6 9.1 7.4 7.2 7.9 8.3 6.2
HCLT 23.6 31.1 17.1 12.9 14.4 7.1 12.4 12.4 10.1 15.1 2.4
Relative market share (%)
Wipro IT 22.7 21.7 20.8 19.7 19.0 18.5 18.2 17.6 16.6 15.8 15.2
TCS 35.6 37.3 38.7 39.9 41.5 41.7 41.4 41.6 42.2 41.5 40.9
Infosys 26.3 25.7 24.8 24.5 23.4 24.0 24.0 23.8 23.8 24.1 25.1
HCLT 15.4 15.2 15.7 15.9 16.0 15.7 16.4 17.1 17.4 18.7 18.8
Notes:
(a) Wipro revenues include ISRE
(b) HCLT has June fiscal year-end till 2015
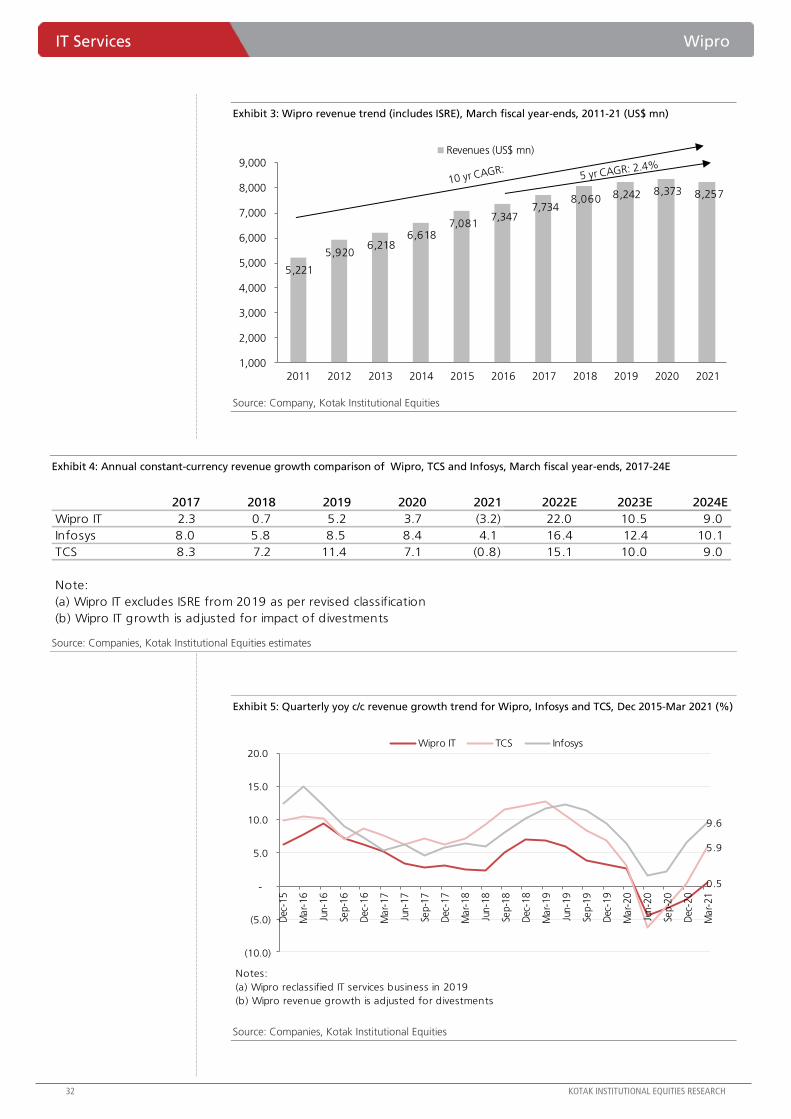
IT Services Wipro
32 KOTAK INSTITUTIONAL EQUITIES RESEARCH
Exhibit 3: Wipro revenue trend (includes ISRE), March fiscal year-ends, 2011-21 (US$ mn)
Source: Company, Kotak Institutional Equities
Exhibit 4: Annual constant-currency revenue growth comparison of Wipro, TCS and Infosys, March fiscal year-ends, 2017-24E
Source: Companies, Kotak Institutional Equities estimates
Exhibit 5: Quarterly yoy c/c revenue growth trend for Wipro, Infosys and TCS, Dec 2015-Mar 2021 (%)
Source: Companies, Kotak Institutional Equities
5,221
5,920 6,218
6,618 7,081
7,347 7,734
8,060 8,242 8,373 8,257
1,000
2,000
3,000
4,000
5,000
6,000
7,000
8,000
9,000
2011 2012 2013 2014 2015 2016 2017 2018 2019 2020 2021
Revenues (US$ mn)
2017 2018 2019 2020 2021 2022E 2023E 2024E
Wipro IT 2.3 0.7 5.2 3.7 (3.2) 22.0 10.5 9.0
Infosys 8.0 5.8 8.5 8.4 4.1 16.4 12.4 10.1
TCS 8.3 7.2 11.4 7.1 (0.8) 15.1 10.0 9.0
Note:
(a) Wipro IT excludes ISRE from 2019 as per revised classification
(b) Wipro IT growth is adjusted for impact of divestments
Notes:
(a) Wipro reclassified IT services business in 2019
(b) Wipro revenue growth is adjusted for divestments
0.5
5.9
9.6
(10.0)
(5.0)
-
5.0
10.0
15.0
20.0
Dec
-15
Mar-
16
Jun-1
6
Sep-1
6
Dec
-16
Mar-
17
Jun-1
7
Sep-1
7
Dec
-17
Mar-
18
Jun-1
8
Sep-1
8
Dec
-18
Mar-
19
Jun-1
9
Sep-1
9
Dec
-19
Mar-
20
Jun-2
0
Sep-2
0
Dec
-20
Mar-
21
Wipro IT TCS Infosys
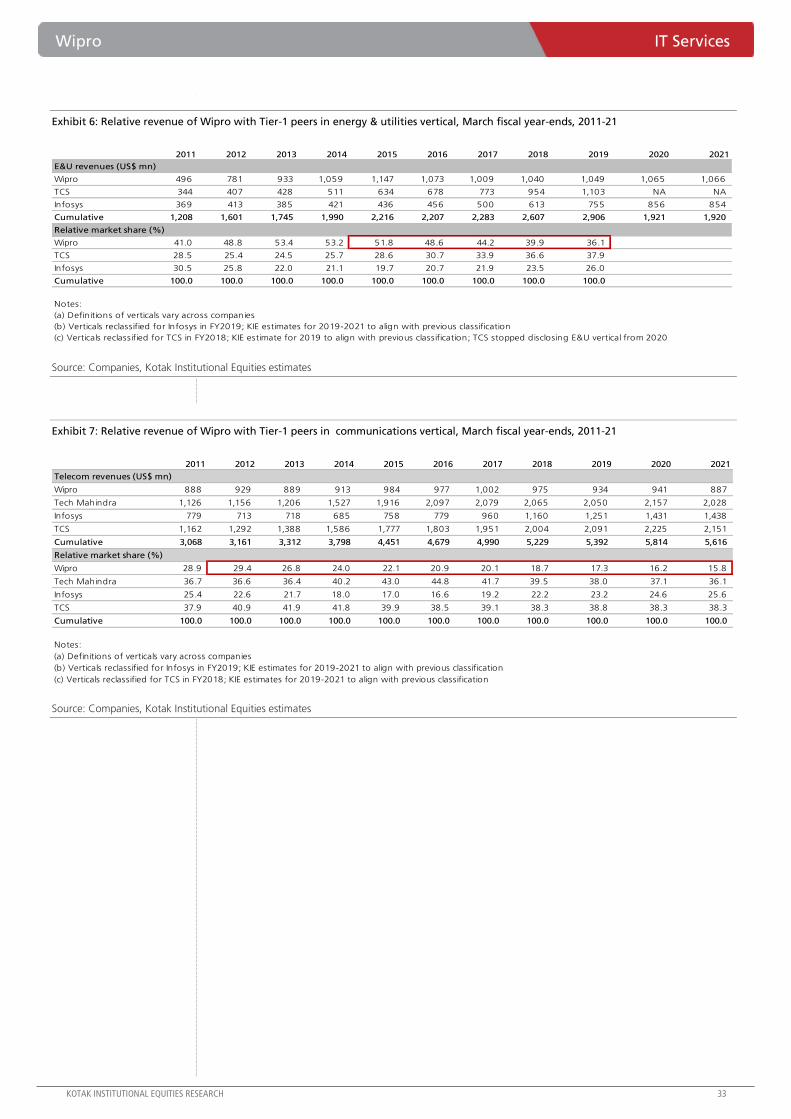
Wipro IT Services
KOTAK INSTITUTIONAL EQUITIES RESEARCH 33
Exhibit 6: Relative revenue of Wipro with Tier-1 peers in energy & utilities vertical, March fiscal year-ends, 2011-21
Source: Companies, Kotak Institutional Equities estimates
Exhibit 7: Relative revenue of Wipro with Tier-1 peers in communications vertical, March fiscal year-ends, 2011-21
Source: Companies, Kotak Institutional Equities estimates
2011 2012 2013 2014 2015 2016 2017 2018 2019 2020 2021
E&U revenues (US$ mn)
Wipro 496 781 933 1,059 1,147 1,073 1,009 1,040 1,049 1,065 1,066
TCS 344 407 428 511 634 678 773 954 1,103 NA NA
Infosys 369 413 385 421 436 456 500 613 755 856 854
Cumulative 1,208 1,601 1,745 1,990 2,216 2,207 2,283 2,607 2,906 1,921 1,920
Relative market share (%)
Wipro 41.0 48.8 53.4 53.2 51.8 48.6 44.2 39.9 36.1
TCS 28.5 25.4 24.5 25.7 28.6 30.7 33.9 36.6 37.9
Infosys 30.5 25.8 22.0 21.1 19.7 20.7 21.9 23.5 26.0
Cumulative 100.0 100.0 100.0 100.0 100.0 100.0 100.0 100.0 100.0
Notes:
(a) Definitions of verticals vary across companies
(b) Verticals reclassified for Infosys in FY2019; KIE estimates for 2019-2021 to align with previous classification
(c) Verticals reclassified for TCS in FY2018; KIE estimate for 2019 to align with previous classification; TCS stopped disclosing E&U vertical from 2020
2011 2012 2013 2014 2015 2016 2017 2018 2019 2020 2021
Telecom revenues (US$ mn)
Wipro 888 929 889 913 984 977 1,002 975 934 941 887
Tech Mahindra 1,126 1,156 1,206 1,527 1,916 2,097 2,079 2,065 2,050 2,157 2,028
Infosys 779 713 718 685 758 779 960 1,160 1,251 1,431 1,438
TCS 1,162 1,292 1,388 1,586 1,777 1,803 1,951 2,004 2,091 2,225 2,151
Cumulative 3,068 3,161 3,312 3,798 4,451 4,679 4,990 5,229 5,392 5,814 5,616
Relative market share (%)
Wipro 28.9 29.4 26.8 24.0 22.1 20.9 20.1 18.7 17.3 16.2 15.8
Tech Mahindra 36.7 36.6 36.4 40.2 43.0 44.8 41.7 39.5 38.0 37.1 36.1
Infosys 25.4 22.6 21.7 18.0 17.0 16.6 19.2 22.2 23.2 24.6 25.6
TCS 37.9 40.9 41.9 41.8 39.9 38.5 39.1 38.3 38.8 38.3 38.3
Cumulative 100.0 100.0 100.0 100.0 100.0 100.0 100.0 100.0 100.0 100.0 100.0
Notes:
(a) Definitions of verticals vary across companies
(b) Verticals reclassified for Infosys in FY2019; KIE estimates for 2019-2021 to align with previous classification
(c) Verticals reclassified for TCS in FY2018; KIE estimates for 2019-2021 to align with previous classification
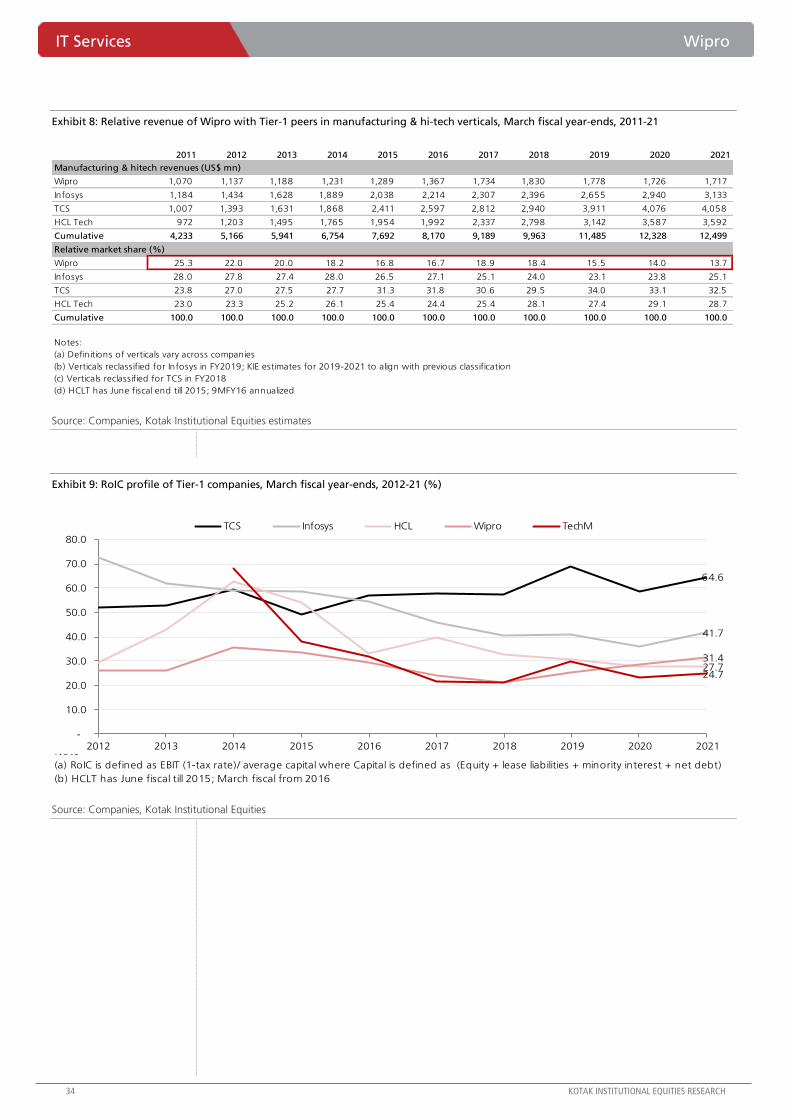
IT Services Wipro
34 KOTAK INSTITUTIONAL EQUITIES RESEARCH
Exhibit 8: Relative revenue of Wipro with Tier-1 peers in manufacturing & hi-tech verticals, March fiscal year-ends, 2011-21
Source: Companies, Kotak Institutional Equities estimates
Exhibit 9: RoIC profile of Tier-1 companies, March fiscal year-ends, 2012-21 (%)
Source: Companies, Kotak Institutional Equities
2011 2012 2013 2014 2015 2016 2017 2018 2019 2020 2021
Manufacturing & hitech revenues (US$ mn)
Wipro 1,070 1,137 1,188 1,231 1,289 1,367 1,734 1,830 1,778 1,726 1,717
Infosys 1,184 1,434 1,628 1,889 2,038 2,214 2,307 2,396 2,655 2,940 3,133
TCS 1,007 1,393 1,631 1,868 2,411 2,597 2,812 2,940 3,911 4,076 4,058
HCL Tech 972 1,203 1,495 1,765 1,954 1,992 2,337 2,798 3,142 3,587 3,592
Cumulative 4,233 5,166 5,941 6,754 7,692 8,170 9,189 9,963 11,485 12,328 12,499
Relative market share (%)
Wipro 25.3 22.0 20.0 18.2 16.8 16.7 18.9 18.4 15.5 14.0 13.7
Infosys 28.0 27.8 27.4 28.0 26.5 27.1 25.1 24.0 23.1 23.8 25.1
TCS 23.8 27.0 27.5 27.7 31.3 31.8 30.6 29.5 34.0 33.1 32.5
HCL Tech 23.0 23.3 25.2 26.1 25.4 24.4 25.4 28.1 27.4 29.1 28.7
Cumulative 100.0 100.0 100.0 100.0 100.0 100.0 100.0 100.0 100.0 100.0 100.0
Notes:
(a) Definitions of verticals vary across companies
(b) Verticals reclassified for Infosys in FY2019; KIE estimates for 2019-2021 to align with previous classification
(c) Verticals reclassified for TCS in FY2018
(d) HCLT has June fiscal end till 2015; 9MFY16 annualized
Note
(a) RoIC is defined as EBIT (1-tax rate)/ average capital where Capital is defined as (Equity + lease liabilities + minority interest + net debt)
(b) HCLT has June fiscal till 2015; March fiscal from 2016
64.6
41.7
27.7 31.4
24.7
-
10.0
20.0
30.0
40.0
50.0
60.0
70.0
80.0
2012 2013 2014 2015 2016 2017 2018 2019 2020 2021
TCS Infosys HCL Wipro TechM
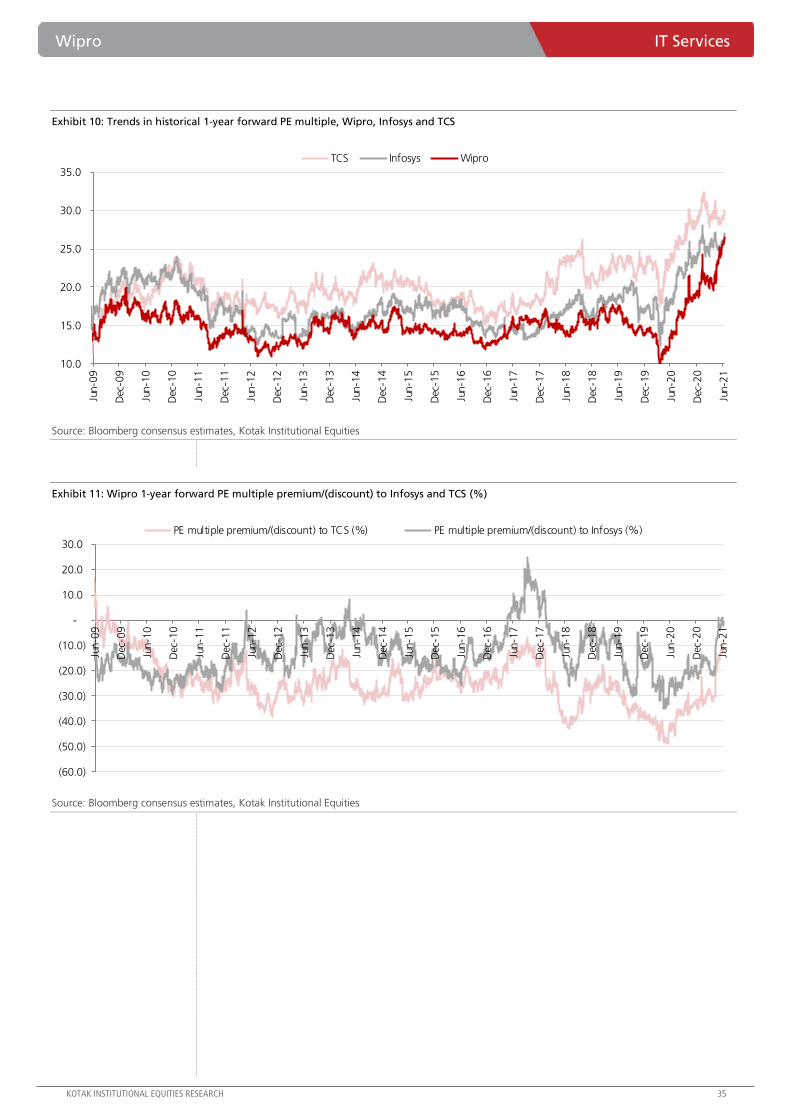
Wipro IT Services
KOTAK INSTITUTIONAL EQUITIES RESEARCH 35
Exhibit 10: Trends in historical 1-year forward PE multiple, Wipro, Infosys and TCS
Source: Bloomberg consensus estimates, Kotak Institutional Equities
Exhibit 11: Wipro 1-year forward PE multiple premium/(discount) to Infosys and TCS (%)
Source: Bloomberg consensus estimates, Kotak Institutional Equities
10.0
15.0
20.0
25.0
30.0
35.0
Jun-0
9
Dec
-09
Jun-1
0
Dec
-10
Jun-1
1
Dec
-11
Jun-1
2
Dec
-12
Jun-1
3
Dec
-13
Jun-1
4
Dec
-14
Jun-1
5
Dec
-15
Jun-1
6
Dec
-16
Jun-1
7
Dec
-17
Jun-1
8
Dec
-18
Jun-1
9
Dec
-19
Jun-2
0
Dec
-20
Jun-2
1
TCS Infosys Wipro
(60.0)
(50.0)
(40.0)
(30.0)
(20.0)
(10.0)
-
10.0
20.0
30.0
Jun-0
9
Dec
-09
Jun-1
0
Dec
-10
Jun-1
1
Dec
-11
Jun-1
2
Dec
-12
Jun-1
3
Dec
-13
Jun-1
4
Dec
-14
Jun-1
5
Dec
-15
Jun-1
6
Dec
-16
Jun-1
7
Dec
-17
Jun-1
8
Dec
-18
Jun-1
9
Dec
-19
Jun-2
0
Dec
-20
Jun-2
1
PE multiple premium/(discount) to TCS (%) PE multiple premium/(discount) to Infosys (%)
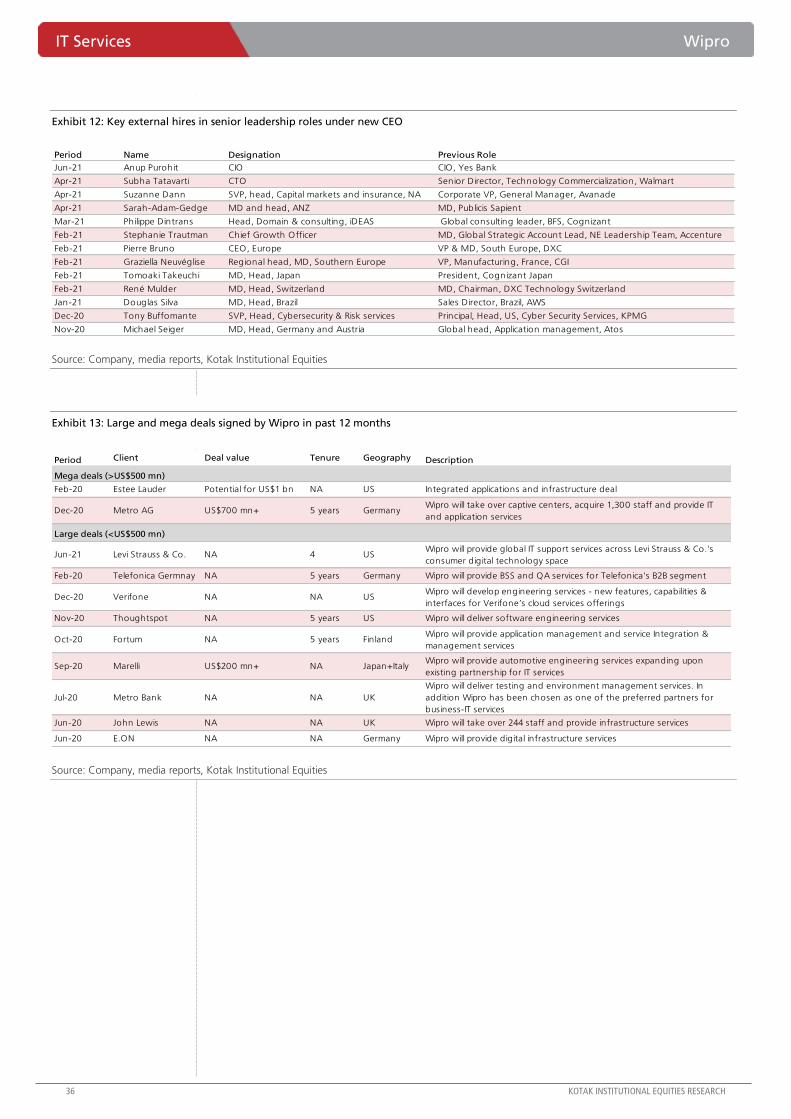
IT Services Wipro
36 KOTAK INSTITUTIONAL EQUITIES RESEARCH
Exhibit 12: Key external hires in senior leadership roles under new CEO
Source: Company, media reports, Kotak Institutional Equities
Exhibit 13: Large and mega deals signed by Wipro in past 12 months
Source: Company, media reports, Kotak Institutional Equities
Period Name Designation Previous Role
Jun-21 Anup Purohit CIO CIO, Yes Bank
Apr-21 Subha Tatavarti CTO Senior Director, Technology Commercialization, Walmart
Apr-21 Suzanne Dann SVP, head, Capital markets and insurance, NA Corporate VP, General Manager, Avanade
Apr-21 Sarah-Adam-Gedge MD and head, ANZ MD, Publicis Sapient
Mar-21 Philippe Dintrans Head, Domain & consulting, iDEAS Global consulting leader, BFS, Cognizant
Feb-21 Stephanie Trautman Chief Growth Officer MD, Global Strategic Account Lead, NE Leadership Team, Accenture
Feb-21 Pierre Bruno CEO, Europe VP & MD, South Europe, DXC
Feb-21 Graziella Neuvéglise Regional head, MD, Southern Europe VP, Manufacturing, France, CGI
Feb-21 Tomoaki Takeuchi MD, Head, Japan President, Cognizant Japan
Feb-21 René Mulder MD, Head, Switzerland MD, Chairman, DXC Technology Switzerland
Jan-21 Douglas Silva MD, Head, Brazil Sales Director, Brazil, AWS
Dec-20 Tony Buffomante SVP, Head, Cybersecurity & Risk services Principal, Head, US, Cyber Security Services, KPMG
Nov-20 Michael Seiger MD, Head, Germany and Austria Global head, Application management, Atos
Period Client Deal value Tenure Geography Description
Mega deals (>US$500 mn)
Feb-20 Estee Lauder Potential for US$1 bn NA US Integrated applications and infrastructure deal
Dec-20 Metro AG US$700 mn+ 5 years GermanyWipro will take over captive centers, acquire 1,300 staff and provide IT
and application services
Large deals (<US$500 mn)
Jun-21 Levi Strauss & Co. NA 4 USWipro will provide global IT support services across Levi Strauss & Co.'s
consumer digital technology space
Feb-20 Telefonica Germnay NA 5 years Germany Wipro will provide BSS and QA services for Telefonica's B2B segment
Dec-20 Verifone NA NA USWipro will develop engineering services - new features, capabilities &
interfaces for Verifone’s cloud services offerings
Nov-20 Thoughtspot NA 5 years US Wipro will deliver software engineering services
Oct-20 Fortum NA 5 years FinlandWipro will provide application management and service Integration &
management services
Sep-20 Marelli US$200 mn+ NA Japan+ItalyWipro will provide automotive engineering services expanding upon
existing partnership for IT services
Jul-20 Metro Bank NA NA UK
Wipro will deliver testing and environment management services. In
addition Wipro has been chosen as one of the preferred partners for
business-IT services
Jun-20 John Lewis NA NA UK Wipro will take over 244 staff and provide infrastructure services
Jun-20 E.ON NA NA Germany Wipro will provide digital infrastructure services
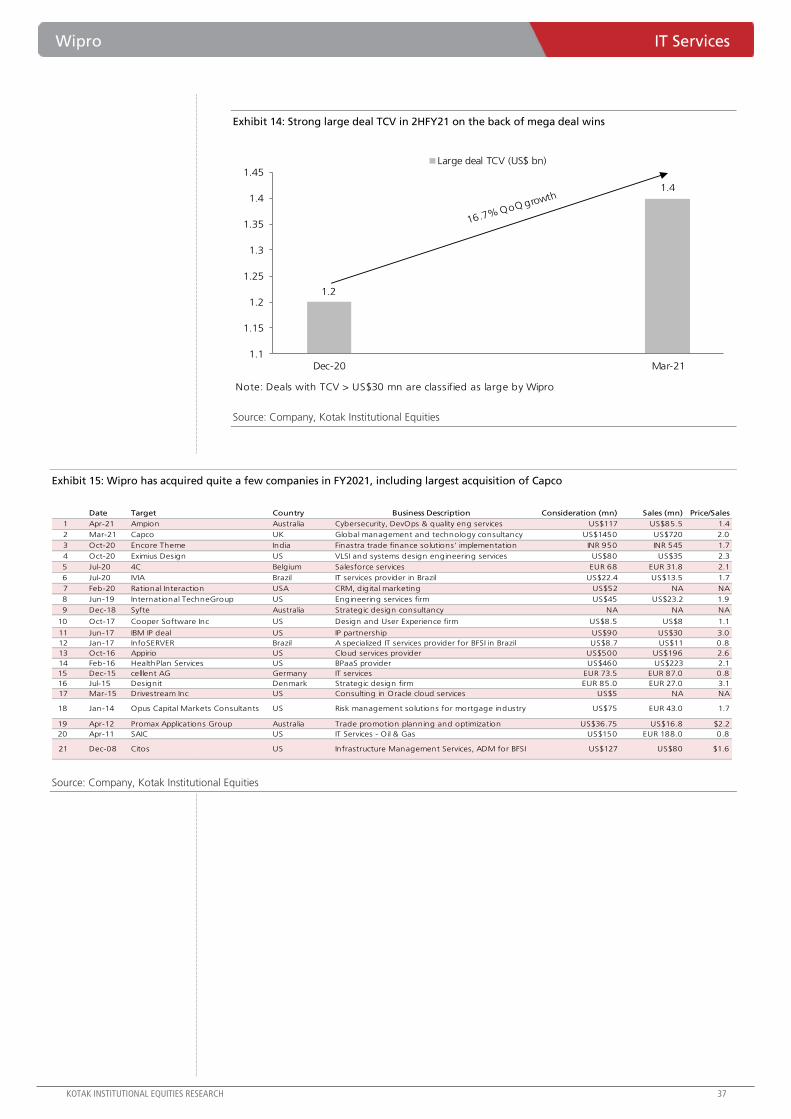
Wipro IT Services
KOTAK INSTITUTIONAL EQUITIES RESEARCH 37
Exhibit 14: Strong large deal TCV in 2HFY21 on the back of mega deal wins
Source: Company, Kotak Institutional Equities
Exhibit 15: Wipro has acquired quite a few companies in FY2021, including largest acquisition of Capco
Source: Company, Kotak Institutional Equities
Note: Deals with TCV > US$30 mn are classified as large by Wipro
1.2
1.4
1.1
1.15
1.2
1.25
1.3
1.35
1.4
1.45
Dec-20 Mar-21
Large deal TCV (US$ bn)
Date Target Country Business Description Consideration (mn) Sales (mn) Price/Sales
1 Apr-21 Ampion Australia Cybersecurity, DevOps & quality eng services US$117 US$85.5 1.4
2 Mar-21 Capco UK Global management and technology consultancy US$1450 US$720 2.0
3 Oct-20 Encore Theme India Finastra trade finance solutions' implementation INR 950 INR 545 1.7
4 Oct-20 Eximius Design US VLSI and systems design engineering services US$80 US$35 2.3
5 Jul-20 4C Belgium Salesforce services EUR 68 EUR 31.8 2.1
6 Jul-20 IVIA Brazil IT services provider in Brazil US$22.4 US$13.5 1.7
7 Feb-20 Rational Interaction USA CRM, digital marketing US$52 NA NA
8 Jun-19 International TechneGroup US Engineering services firm US$45 US$23.2 1.9
9 Dec-18 Syfte Australia Strategic design consultancy NA NA NA
10 Oct-17 Cooper Software Inc US Design and User Experience firm US$8.5 US$8 1.1
11 Jun-17 IBM IP deal US IP partnership US$90 US$30 3.0
12 Jan-17 InfoSERVER Brazil A specialized IT services provider for BFSI in Brazil US$8.7 US$11 0.8
13 Oct-16 Appirio US Cloud services provider US$500 US$196 2.6
14 Feb-16 HealthPlan Services US BPaaS provider US$460 US$223 2.1
15 Dec-15 celllent AG Germany IT services EUR 73.5 EUR 87.0 0.8
16 Jul-15 Designit Denmark Strategic design firm EUR 85.0 EUR 27.0 3.1
17 Mar-15 Drivestream Inc US Consulting in Oracle cloud services US$5 NA NA
18 Jan-14 Opus Capital Markets Consultants US Risk management solutions for mortgage industry US$75 EUR 43.0 1.7
19 Apr-12 Promax Applications Group Australia Trade promotion planning and optimization US$36.75 US$16.8 $2.2
20 Apr-11 SAIC US IT Services - Oil & Gas US$150 EUR 188.0 0.8
21 Dec-08 Citos US Infrastructure Management Services, ADM for BFSI US$127 US$80 $1.6
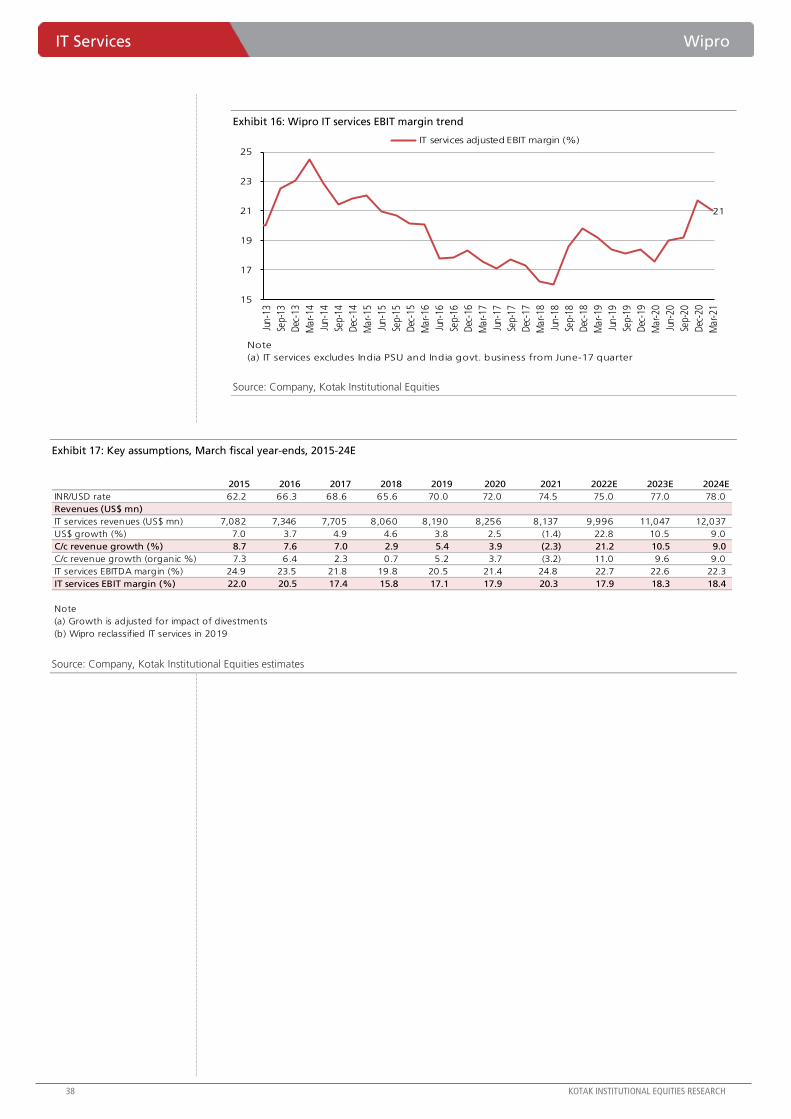
IT Services Wipro
38 KOTAK INSTITUTIONAL EQUITIES RESEARCH
Exhibit 16: Wipro IT services EBIT margin trend
Source: Company, Kotak Institutional Equities
Exhibit 17: Key assumptions, March fiscal year-ends, 2015-24E
Source: Company, Kotak Institutional Equities estimates
Note
(a) IT services excludes India PSU and India govt. business from June-17 quarter
21
15
17
19
21
23
25
Jun-
13
Sep-
13
Dec
-13
Mar
-14
Jun-
14
Sep-
14
Dec
-14
Mar
-15
Jun-
15
Sep-
15
Dec
-15
Mar
-16
Jun-
16
Sep-
16
Dec
-16
Mar
-17
Jun-
17
Sep-
17
Dec
-17
Mar
-18
Jun-
18
Sep-
18
Dec
-18
Mar
-19
Jun-
19
Sep-
19
Dec
-19
Mar
-20
Jun-
20
Sep-
20
Dec
-20
Mar
-21
IT services adjusted EBIT margin (%)
2015 2016 2017 2018 2019 2020 2021 2022E 2023E 2024E
INR/USD rate 62.2 66.3 68.6 65.6 70.0 72.0 74.5 75.0 77.0 78.0
Revenues (US$ mn)
IT services revenues (US$ mn) 7,082 7,346 7,705 8,060 8,190 8,256 8,137 9,996 11,047 12,037
US$ growth (%) 7.0 3.7 4.9 4.6 3.8 2.5 (1.4) 22.8 10.5 9.0
C/c revenue growth (%) 8.7 7.6 7.0 2.9 5.4 3.9 (2.3) 21.2 10.5 9.0
C/c revenue growth (organic %) 7.3 6.4 2.3 0.7 5.2 3.7 (3.2) 11.0 9.6 9.0
IT services EBITDA margin (%) 24.9 23.5 21.8 19.8 20.5 21.4 24.8 22.7 22.6 22.3
IT services EBIT margin (%) 22.0 20.5 17.4 15.8 17.1 17.9 20.3 17.9 18.3 18.4
Note
(a) Growth is adjusted for impact of divestments
(b) Wipro reclassified IT services in 2019
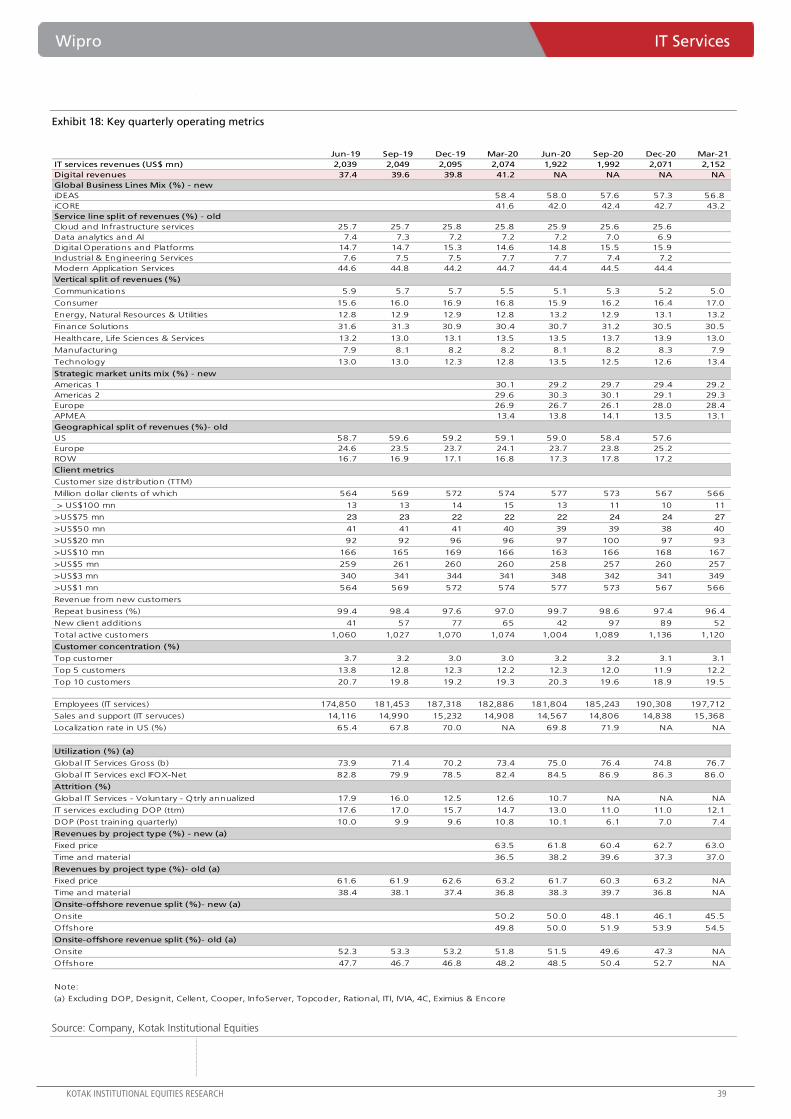
Wipro IT Services
KOTAK INSTITUTIONAL EQUITIES RESEARCH 39
Exhibit 18: Key quarterly operating metrics
Source: Company, Kotak Institutional Equities
Jun-19 Sep-19 Dec-19 Mar-20 Jun-20 Sep-20 Dec-20 Mar-21
IT services revenues (US$ mn) 2,039 2,049 2,095 2,074 1,922 1,992 2,071 2,152
Digital revenues 37.4 39.6 39.8 41.2 NA NA NA NA
Global Business Lines Mix (%) - new
iDEAS 58.4 58.0 57.6 57.3 56.8
iCORE 41.6 42.0 42.4 42.7 43.2
Service line split of revenues (%) - old
Cloud and Infrastructure services 25.7 25.7 25.8 25.8 25.9 25.6 25.6
Data analytics and AI 7.4 7.3 7.2 7.2 7.2 7.0 6.9
Digital Operations and Platforms 14.7 14.7 15.3 14.6 14.8 15.5 15.9
Industrial & Engineering Services 7.6 7.5 7.5 7.7 7.7 7.4 7.2
Modern Application Services 44.6 44.8 44.2 44.7 44.4 44.5 44.4
Vertical split of revenues (%)
Communications 5.9 5.7 5.7 5.5 5.1 5.3 5.2 5.0
Consumer 15.6 16.0 16.9 16.8 15.9 16.2 16.4 17.0
Energy, Natural Resources & Utilities 12.8 12.9 12.9 12.8 13.2 12.9 13.1 13.2
Finance Solutions 31.6 31.3 30.9 30.4 30.7 31.2 30.5 30.5
Healthcare, Life Sciences & Services 13.2 13.0 13.1 13.5 13.5 13.7 13.9 13.0
Manufacturing 7.9 8.1 8.2 8.2 8.1 8.2 8.3 7.9
Technology 13.0 13.0 12.3 12.8 13.5 12.5 12.6 13.4
Strategic market units mix (%) - new
Americas 1 30.1 29.2 29.7 29.4 29.2
Americas 2 29.6 30.3 30.1 29.1 29.3
Europe 26.9 26.7 26.1 28.0 28.4
APMEA 13.4 13.8 14.1 13.5 13.1
Geographical split of revenues (%)- old
US 58.7 59.6 59.2 59.1 59.0 58.4 57.6
Europe 24.6 23.5 23.7 24.1 23.7 23.8 25.2
ROW 16.7 16.9 17.1 16.8 17.3 17.8 17.2
Client metrics
Customer size distribution (TTM)
Million dollar clients of which 564 569 572 574 577 573 567 566
> US$100 mn 13 13 14 15 13 11 10 11
>US$75 mn 23 23 22 22 22 24 24 27
>US$50 mn 41 41 41 40 39 39 38 40
>US$20 mn 92 92 96 96 97 100 97 93
>US$10 mn 166 165 169 166 163 166 168 167
>US$5 mn 259 261 260 260 258 257 260 257
>US$3 mn 340 341 344 341 348 342 341 349
>US$1 mn 564 569 572 574 577 573 567 566
Revenue from new customers
Repeat business (%) 99.4 98.4 97.6 97.0 99.7 98.6 97.4 96.4
New client additions 41 57 77 65 42 97 89 52
Total active customers 1,060 1,027 1,070 1,074 1,004 1,089 1,136 1,120
Customer concentration (%)
Top customer 3.7 3.2 3.0 3.0 3.2 3.2 3.1 3.1
Top 5 customers 13.8 12.8 12.3 12.2 12.3 12.0 11.9 12.2
Top 10 customers 20.7 19.8 19.2 19.3 20.3 19.6 18.9 19.5
Employees (IT services) 174,850 181,453 187,318 182,886 181,804 185,243 190,308 197,712
Sales and support (IT servuces) 14,116 14,990 15,232 14,908 14,567 14,806 14,838 15,368
Localization rate in US (%) 65.4 67.8 70.0 NA 69.8 71.9 NA NA
Utilization (%) (a)
Global IT Services Gross (b) 73.9 71.4 70.2 73.4 75.0 76.4 74.8 76.7
Global IT Services excl IFOX-Net 82.8 79.9 78.5 82.4 84.5 86.9 86.3 86.0
Attrition (%)
Global IT Services - Voluntary - Qtrly annualized 17.9 16.0 12.5 12.6 10.7 NA NA NA
IT services excluding DOP (ttm) 17.6 17.0 15.7 14.7 13.0 11.0 11.0 12.1
DOP (Post training quarterly) 10.0 9.9 9.6 10.8 10.1 6.1 7.0 7.4
Revenues by project type (%) - new (a)
Fixed price 63.5 61.8 60.4 62.7 63.0
Time and material 36.5 38.2 39.6 37.3 37.0
Revenues by project type (%)- old (a)
Fixed price 61.6 61.9 62.6 63.2 61.7 60.3 63.2 NA
Time and material 38.4 38.1 37.4 36.8 38.3 39.7 36.8 NA
Onsite-offshore revenue split (%)- new (a)
Onsite 50.2 50.0 48.1 46.1 45.5
Offshore 49.8 50.0 51.9 53.9 54.5
Onsite-offshore revenue split (%)- old (a)
Onsite 52.3 53.3 53.2 51.8 51.5 49.6 47.3 NA
Offshore 47.7 46.7 46.8 48.2 48.5 50.4 52.7 NA
Note:
(a) Excluding DOP, Designit, Cellent, Cooper, InfoServer, Topcoder, Rational, ITI, IVIA, 4C, Eximius & Encore
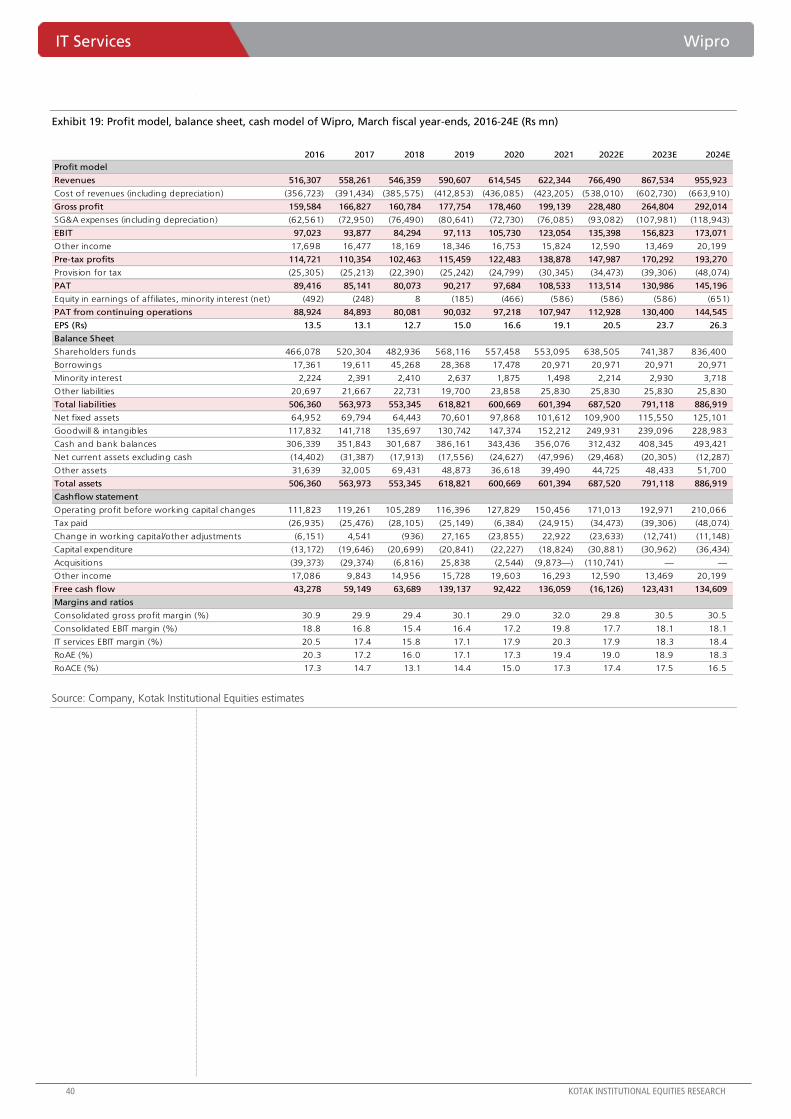
IT Services Wipro
40 KOTAK INSTITUTIONAL EQUITIES RESEARCH
Exhibit 19: Profit model, balance sheet, cash model of Wipro, March fiscal year-ends, 2016-24E (Rs mn)
Source: Company, Kotak Institutional Equities estimates
2016 2017 2018 2019 2020 2021 2022E 2023E 2024E
Profit model
Revenues 516,307 558,261 546,359 590,607 614,545 622,344 766,490 867,534 955,923
Cost of revenues (including depreciation) (356,723) (391,434) (385,575) (412,853) (436,085) (423,205) (538,010) (602,730) (663,910)
Gross profit 159,584 166,827 160,784 177,754 178,460 199,139 228,480 264,804 292,014
SG&A expenses (including depreciation) (62,561) (72,950) (76,490) (80,641) (72,730) (76,085) (93,082) (107,981) (118,943)
EBIT 97,023 93,877 84,294 97,113 105,730 123,054 135,398 156,823 173,071
Other income 17,698 16,477 18,169 18,346 16,753 15,824 12,590 13,469 20,199
Pre-tax profits 114,721 110,354 102,463 115,459 122,483 138,878 147,987 170,292 193,270
Provision for tax (25,305) (25,213) (22,390) (25,242) (24,799) (30,345) (34,473) (39,306) (48,074)
PAT 89,416 85,141 80,073 90,217 97,684 108,533 113,514 130,986 145,196
Equity in earnings of affiliates, minority interest (net) (492) (248) 8 (185) (466) (586) (586) (586) (651)
PAT from continuing operations 88,924 84,893 80,081 90,032 97,218 107,947 112,928 130,400 144,545
EPS (Rs) 13.5 13.1 12.7 15.0 16.6 19.1 20.5 23.7 26.3
Balance Sheet
Shareholders funds 466,078 520,304 482,936 568,116 557,458 553,095 638,505 741,387 836,400
Borrowings 17,361 19,611 45,268 28,368 17,478 20,971 20,971 20,971 20,971
Minority interest 2,224 2,391 2,410 2,637 1,875 1,498 2,214 2,930 3,718
Other liabilities 20,697 21,667 22,731 19,700 23,858 25,830 25,830 25,830 25,830
Total liabilities 506,360 563,973 553,345 618,821 600,669 601,394 687,520 791,118 886,919
Net fixed assets 64,952 69,794 64,443 70,601 97,868 101,612 109,900 115,550 125,101
Goodwill & intangibles 117,832 141,718 135,697 130,742 147,374 152,212 249,931 239,096 228,983
Cash and bank balances 306,339 351,843 301,687 386,161 343,436 356,076 312,432 408,345 493,421
Net current assets excluding cash (14,402) (31,387) (17,913) (17,556) (24,627) (47,996) (29,468) (20,305) (12,287)
Other assets 31,639 32,005 69,431 48,873 36,618 39,490 44,725 48,433 51,700
Total assets 506,360 563,973 553,345 618,821 600,669 601,394 687,520 791,118 886,919
Cashflow statement
Operating profit before working capital changes 111,823 119,261 105,289 116,396 127,829 150,456 171,013 192,971 210,066
Tax paid (26,935) (25,476) (28,105) (25,149) (6,384) (24,915) (34,473) (39,306) (48,074)
Change in working capital/other adjustments (6,151) 4,541 (936) 27,165 (23,855) 22,922 (23,633) (12,741) (11,148)
Capital expenditure (13,172) (19,646) (20,699) (20,841) (22,227) (18,824) (30,881) (30,962) (36,434)
Acquisitions (39,373) (29,374) (6,816) 25,838 (2,544) (9,873—) (110,741) — —
Other income 17,086 9,843 14,956 15,728 19,603 16,293 12,590 13,469 20,199
Free cash flow 43,278 59,149 63,689 139,137 92,422 136,059 (16,126) 123,431 134,609
Margins and ratios
Consolidated gross profit margin (%) 30.9 29.9 29.4 30.1 29.0 32.0 29.8 30.5 30.5
Consolidated EBIT margin (%) 18.8 16.8 15.4 16.4 17.2 19.8 17.7 18.1 18.1
IT services EBIT margin (%) 20.5 17.4 15.8 17.1 17.9 20.3 17.9 18.3 18.4
RoAE (%) 20.3 17.2 16.0 17.1 17.3 19.4 19.0 18.9 18.3
RoACE (%) 17.3 14.7 13.1 14.4 15.0 17.3 17.4 17.5 16.5
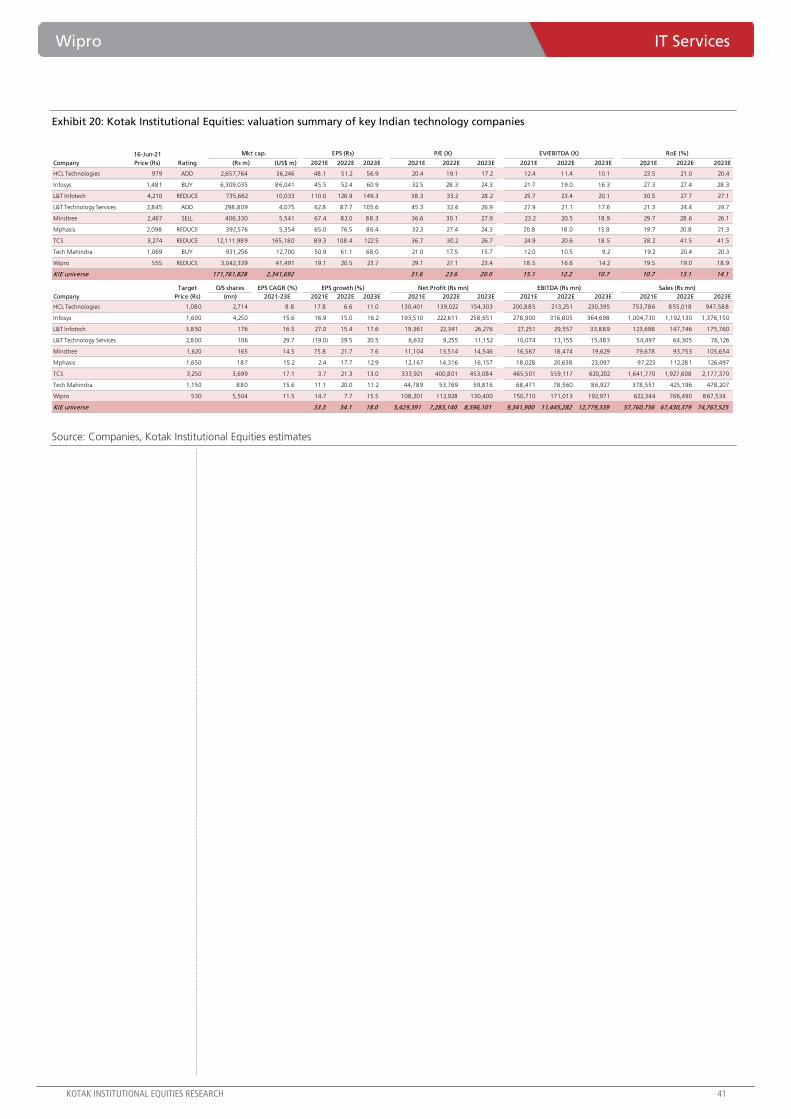
Wipro IT Services
KOTAK INSTITUTIONAL EQUITIES RESEARCH 41
Exhibit 20: Kotak Institutional Equities: valuation summary of key Indian technology companies
Source: Companies, Kotak Institutional Equities estimates
16-Jun-21
Company Price (Rs) Rating (Rs m) (US$ m) 2021E 2022E 2023E 2021E 2022E 2023E 2021E 2022E 2023E 2021E 2022E 2023E
HCL Technologies 979 ADD 2,657,764 36,246 48.1 51.2 56.9 20.4 19.1 17.2 12.4 11.4 10.1 23.5 21.0 20.4
Infosys 1,481 BUY 6,309,035 86,041 45.5 52.4 60.9 32.5 28.3 24.3 21.7 19.0 16.3 27.3 27.4 28.3
L&T Infotech 4,210 REDUCE 735,662 10,033 110.0 126.9 149.3 38.3 33.2 28.2 25.7 23.4 20.1 30.5 27.7 27.1
L&T Technology Services 2,845 ADD 298,809 4,075 62.8 87.7 105.6 45.3 32.4 26.9 27.9 21.1 17.6 21.3 24.4 24.7
Mindtree 2,467 SELL 406,330 5,541 67.4 82.0 88.3 36.6 30.1 27.9 23.2 20.5 18.9 29.7 28.6 26.1
Mphasis 2,098 REDUCE 392,576 5,354 65.0 76.5 86.4 32.3 27.4 24.3 20.8 18.0 15.8 19.7 20.8 21.3
TCS 3,274 REDUCE 12,111,989 165,180 89.3 108.4 122.5 36.7 30.2 26.7 24.9 20.6 18.5 38.2 41.5 41.5
Tech Mahindra 1,069 BUY 931,256 12,700 50.9 61.1 68.0 21.0 17.5 15.7 12.0 10.5 9.2 19.2 20.4 20.3
Wipro 555 REDUCE 3,042,339 41,491 19.1 20.5 23.7 29.1 27.1 23.4 18.5 16.6 14.2 19.5 19.0 18.9
KIE universe 171,761,828 2,341,692 31.6 23.6 20.0 15.1 12.2 10.7 10.7 13.1 14.1
Target O/S shares EPS CAGR (%)
Company Price (Rs) (mn) 2021-23E 2021E 2022E 2023E 2021E 2022E 2023E 2021E 2022E 2023E 2021E 2022E 2023E
HCL Technologies 1,080 2,714 8 .8 17.8 6.6 11.0 130,401 139,022 154,303 200,885 213,251 230,395 753,786 855,018 947,588
Infosys 1,600 4,250 15.6 16.9 15.0 16.2 193,510 222,611 258,651 278,900 316,805 364,698 1,004,730 1,192,130 1,376,150
L&T Infotech 3,850 176 16.5 27.0 15.4 17.6 19,361 22,341 26,276 27,251 29,557 33,889 123,698 147,746 175,760
L&T Technology Services 2,800 106 29.7 (19.0) 39.5 20.5 6,632 9,255 11,152 10,074 13,155 15,483 54,497 64,305 76,126
Mindtree 1,620 165 14.5 75.8 21.7 7.6 11,104 13,514 14,546 16,567 18,474 19,629 79,678 93,753 105,654
Mphasis 1,650 187 15.2 2.4 17.7 12.9 12,167 14,316 16,157 18,028 20,638 23,097 97,223 112,281 126,497
TCS 3,250 3,699 17.1 3.7 21.3 13.0 333,921 400,801 453,084 465,501 559,117 620,202 1,641,770 1,927,608 2,177,370
Tech Mahindra 1,150 880 15.6 11.1 20.0 11.2 44,789 53,769 59,816 68,471 78,560 86,927 378,551 425,196 478,207
Wipro 530 5,504 11.5 14.7 7.7 15.5 108,201 112,928 130,400 150,710 171,013 192,971 622,344 766,490 867,534
KIE universe 33.3 34.1 18.0 5,429,391 7,283,140 8,596,101 9,341,900 11,445,282 12,779,339 57,760,756 67,430,379 74,767,525
EPS growth (%) Net Profit (Rs mn) EBITDA (Rs mn) Sales (Rs mn)
Mkt cap. EPS (Rs) P/E (X) EV/EBITDA (X) RoE (%)
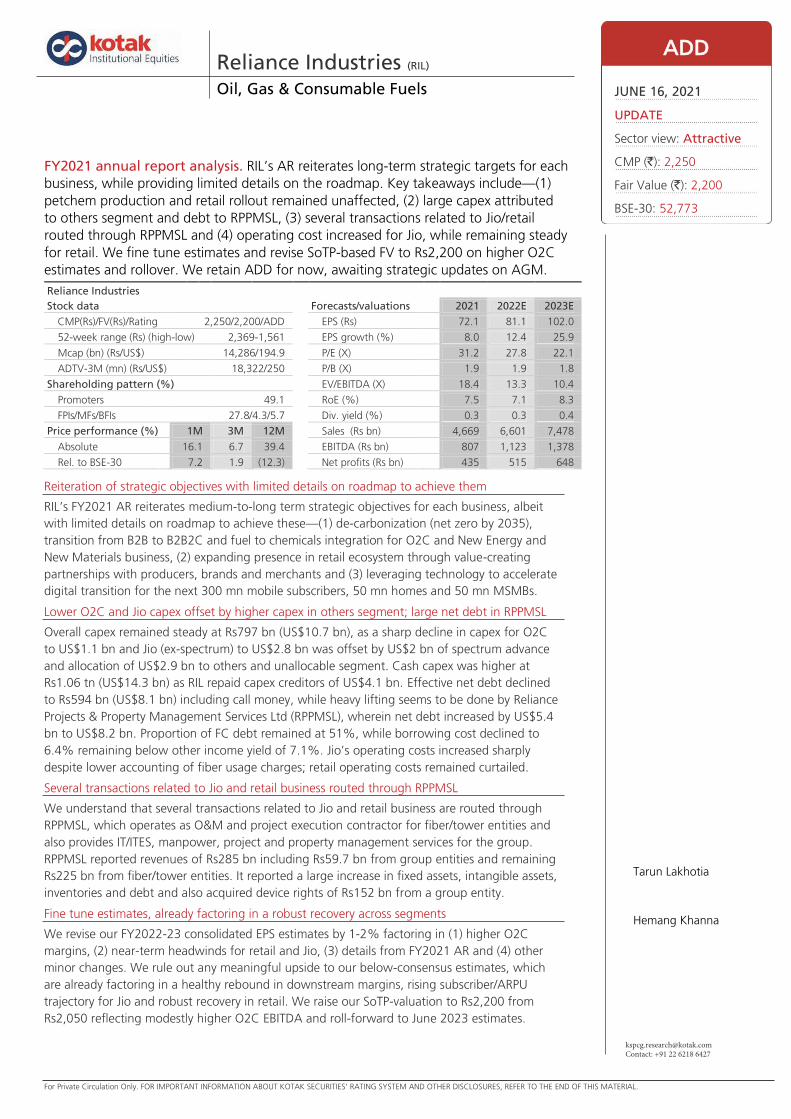
For Private Circulation Only. FOR IMPORTANT INFORMATION ABOUT KOTAK SECURITIES’ RATING SYSTEM AND OTHER DISCLOSURES, REFER TO THE END OF THIS MATERIAL.
[email protected]: +91 22 6218 6427
Reiteration of strategic objectives with limited details on roadmap to achieve them
RIL’s FY2021 AR reiterates medium-to-long term strategic objectives for each business, albeit
with limited details on roadmap to achieve these—(1) de-carbonization (net zero by 2035),
transition from B2B to B2B2C and fuel to chemicals integration for O2C and New Energy and
New Materials business, (2) expanding presence in retail ecosystem through value-creating
partnerships with producers, brands and merchants and (3) leveraging technology to accelerate
digital transition for the next 300 mn mobile subscribers, 50 mn homes and 50 mn MSMBs.
Lower O2C and Jio capex offset by higher capex in others segment; large net debt in RPPMSL
Overall capex remained steady at Rs797 bn (US$10.7 bn), as a sharp decline in capex for O2C
to US$1.1 bn and Jio (ex-spectrum) to US$2.8 bn was offset by US$2 bn of spectrum advance
and allocation of US$2.9 bn to others and unallocable segment. Cash capex was higher at
Rs1.06 tn (US$14.3 bn) as RIL repaid capex creditors of US$4.1 bn. Effective net debt declined
to Rs594 bn (US$8.1 bn) including call money, while heavy lifting seems to be done by Reliance
Projects & Property Management Services Ltd (RPPMSL), wherein net debt increased by US$5.4
bn to US$8.2 bn. Proportion of FC debt remained at 51%, while borrowing cost declined to
6.4% remaining below other income yield of 7.1%. Jio’s operating costs increased sharply
despite lower accounting of fiber usage charges; retail operating costs remained curtailed.
Several transactions related to Jio and retail business routed through RPPMSL
We understand that several transactions related to Jio and retail business are routed through
RPPMSL, which operates as O&M and project execution contractor for fiber/tower entities and
also provides IT/ITES, manpower, project and property management services for the group.
RPPMSL reported revenues of Rs285 bn including Rs59.7 bn from group entities and remaining
Rs225 bn from fiber/tower entities. It reported a large increase in fixed assets, intangible assets,
inventories and debt and also acquired device rights of Rs152 bn from a group entity.
Fine tune estimates, already factoring in a robust recovery across segments
We revise our FY2022-23 consolidated EPS estimates by 1-2% factoring in (1) higher O2C
margins, (2) near-term headwinds for retail and Jio, (3) details from FY2021 AR and (4) other
minor changes. We rule out any meaningful upside to our below-consensus estimates, which
are already factoring in a healthy rebound in downstream margins, rising subscriber/ARPU
trajectory for Jio and robust recovery in retail. We raise our SoTP-valuation to Rs2,200 from
Rs2,050 reflecting modestly higher O2C EBITDA and roll-forward to June 2023 estimates.
https://ultraviewer.et/en/ownload.html
Reliance Industries (RIL) Oil, Gas & Consumable Fuels
FY2021 annual report analysis. RIL’s AR reiterates long-term strategic targets for each
business, while providing limited details on the roadmap. Key takeaways include—(1)
petchem production and retail rollout remained unaffected, (2) large capex attributed
to others segment and debt to RPPMSL, (3) several transactions related to Jio/retail
routed through RPPMSL and (4) operating cost increased for Jio, while remaining steady
for retail. We fine tune estimates and revise SoTP-based FV to Rs2,200 on higher O2C
estimates and rollover. We retain ADD for now, awaiting strategic updates on AGM.
Reliance Industries
Stock data Forecasts/valuations 2021 2022E 2023E
CMP(Rs)/FV(Rs)/Rating 2,250/2,200/ADD EPS (Rs) 72.1 81.1 102.0
52-week range (Rs) (high-low) 2,369-1,561 EPS growth (%) 8.0 12.4 25.9
Mcap (bn) (Rs/US$) 14,286/194.9 P/E (X) 31.2 27.8 22.1
ADTV-3M (mn) (Rs/US$) 18,322/250 P/B (X) 1.9 1.9 1.8
Shareholding pattern (%) EV/EBITDA (X) 18.4 13.3 10.4
Promoters 49.1 RoE (%) 7.5 7.1 8.3
FPIs/MFs/BFIs 27.8/4.3/5.7 Div. yield (%) 0.3 0.3 0.4
Price performance (%) 1M 3M 12M Sales (Rs bn) 4,669 6,601 7,478
Absolute 16.1 6.7 39.4 EBITDA (Rs bn) 807 1,123 1,378
Rel. to BSE-30 7.2 1.9 (12.3) Net profits (Rs bn) 435 515 648
ADD
JUNE 16, 2021
UPDATE
Sector view: Attractive
CMP (`): 2,250
Fair Value (`): 2,200
BSE-30: 52,773
Tarun Lakhotia
Hemang Khanna
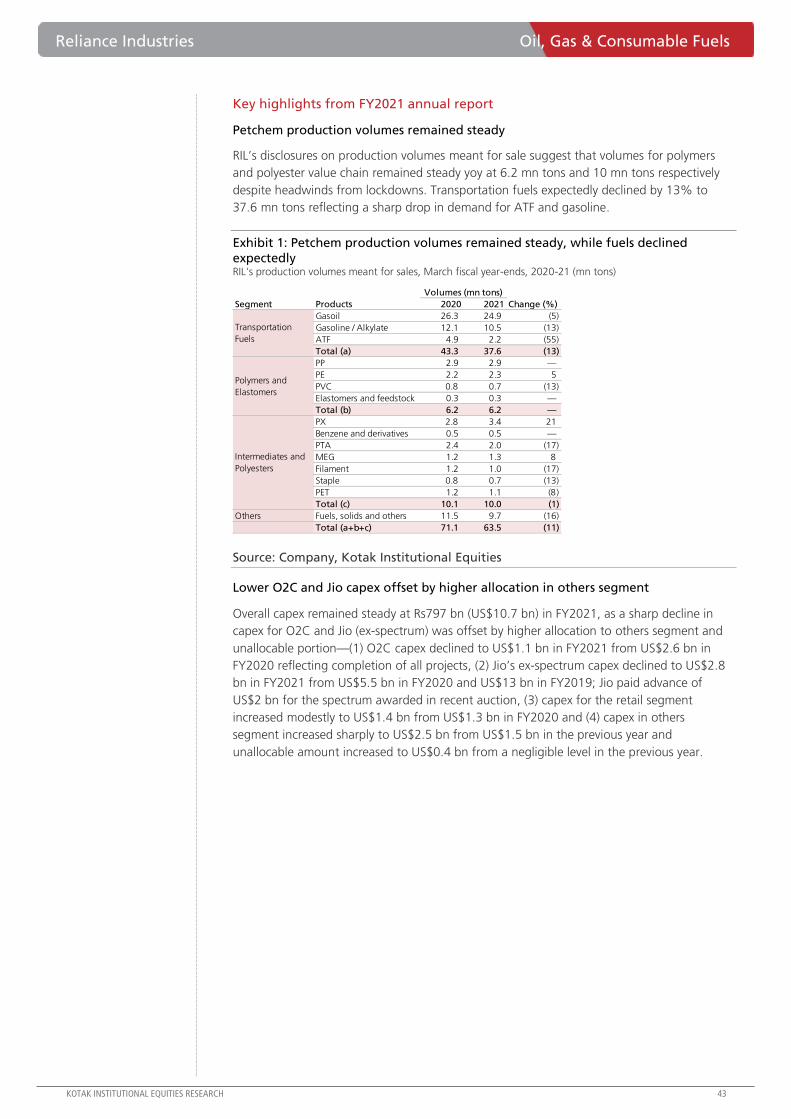
Reliance Industries Oil, Gas & Consumable Fuels
KOTAK INSTITUTIONAL EQUITIES RESEARCH 43
Key highlights from FY2021 annual report
Petchem production volumes remained steady
RIL’s disclosures on production volumes meant for sale suggest that volumes for polymers
and polyester value chain remained steady yoy at 6.2 mn tons and 10 mn tons respectively
despite headwinds from lockdowns. Transportation fuels expectedly declined by 13% to
37.6 mn tons reflecting a sharp drop in demand for ATF and gasoline.
Exhibit 1: Petchem production volumes remained steady, while fuels declined
expectedly RIL's production volumes meant for sales, March fiscal year-ends, 2020-21 (mn tons)
Source: Company, Kotak Institutional Equities
Lower O2C and Jio capex offset by higher allocation in others segment
Overall capex remained steady at Rs797 bn (US$10.7 bn) in FY2021, as a sharp decline in
capex for O2C and Jio (ex-spectrum) was offset by higher allocation to others segment and
unallocable portion—(1) O2C capex declined to US$1.1 bn in FY2021 from US$2.6 bn in
FY2020 reflecting completion of all projects, (2) Jio’s ex-spectrum capex declined to US$2.8
bn in FY2021 from US$5.5 bn in FY2020 and US$13 bn in FY2019; Jio paid advance of
US$2 bn for the spectrum awarded in recent auction, (3) capex for the retail segment
increased modestly to US$1.4 bn from US$1.3 bn in FY2020 and (4) capex in others
segment increased sharply to US$2.5 bn from US$1.5 bn in the previous year and
unallocable amount increased to US$0.4 bn from a negligible level in the previous year.
2020 2021 Change (%)
Gasoil 26.3 24.9 (5)
Gasoline / Alkylate 12.1 10.5 (13)
ATF 4.9 2.2 (55)
Total (a) 43.3 37.6 (13)
PP 2.9 2.9 —
PE 2.2 2.3 5
PVC 0.8 0.7 (13)
Elastomers and feedstock 0.3 0.3 —
Total (b) 6.2 6.2 —
PX 2.8 3.4 21
Benzene and derivatives 0.5 0.5 —
PTA 2.4 2.0 (17)
MEG 1.2 1.3 8
Filament 1.2 1.0 (17)
Staple 0.8 0.7 (13)
PET 1.2 1.1 (8)
Total (c) 10.1 10.0 (1)
Others Fuels, solids and others 11.5 9.7 (16)
Total (a+b+c) 71.1 63.5 (11)
Volumes (mn tons)
Transportation
Fuels
Polymers and
Elastomers
Intermediates and
Polyesters
ProductsSegment
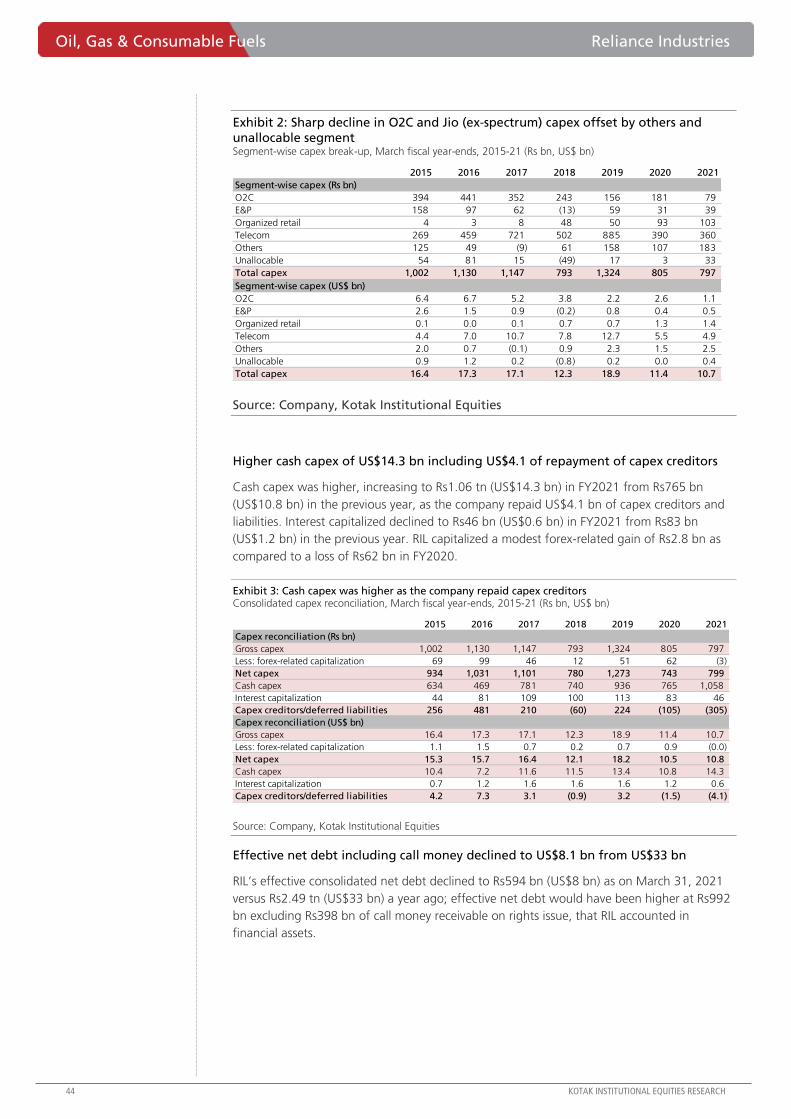
Oil, Gas & Consumable Fuels Reliance Industries
44 KOTAK INSTITUTIONAL EQUITIES RESEARCH
Exhibit 2: Sharp decline in O2C and Jio (ex-spectrum) capex offset by others and
unallocable segment Segment-wise capex break-up, March fiscal year-ends, 2015-21 (Rs bn, US$ bn)
Source: Company, Kotak Institutional Equities
Higher cash capex of US$14.3 bn including US$4.1 of repayment of capex creditors
Cash capex was higher, increasing to Rs1.06 tn (US$14.3 bn) in FY2021 from Rs765 bn
(US$10.8 bn) in the previous year, as the company repaid US$4.1 bn of capex creditors and
liabilities. Interest capitalized declined to Rs46 bn (US$0.6 bn) in FY2021 from Rs83 bn
(US$1.2 bn) in the previous year. RIL capitalized a modest forex-related gain of Rs2.8 bn as
compared to a loss of Rs62 bn in FY2020.
Exhibit 3: Cash capex was higher as the company repaid capex creditors Consolidated capex reconciliation, March fiscal year-ends, 2015-21 (Rs bn, US$ bn)
Source: Company, Kotak Institutional Equities
Effective net debt including call money declined to US$8.1 bn from US$33 bn
RIL’s effective consolidated net debt declined to Rs594 bn (US$8 bn) as on March 31, 2021
versus Rs2.49 tn (US$33 bn) a year ago; effective net debt would have been higher at Rs992
bn excluding Rs398 bn of call money receivable on rights issue, that RIL accounted in
financial assets.
2015 2016 2017 2018 2019 2020 2021
Segment-wise capex (Rs bn)
O2C 394 441 352 243 156 181 79
E&P 158 97 62 (13) 59 31 39
Organized retail 4 3 8 48 50 93 103
Telecom 269 459 721 502 885 390 360
Others 125 49 (9) 61 158 107 183
Unallocable 54 81 15 (49) 17 3 33
Total capex 1,002 1,130 1,147 793 1,324 805 797
Segment-wise capex (US$ bn)
O2C 6.4 6.7 5.2 3.8 2.2 2.6 1.1
E&P 2.6 1.5 0.9 (0.2) 0.8 0.4 0.5
Organized retail 0.1 0.0 0.1 0.7 0.7 1.3 1.4
Telecom 4.4 7.0 10.7 7.8 12.7 5.5 4.9
Others 2.0 0.7 (0.1) 0.9 2.3 1.5 2.5
Unallocable 0.9 1.2 0.2 (0.8) 0.2 0.0 0.4
Total capex 16.4 17.3 17.1 12.3 18.9 11.4 10.7
2015 2016 2017 2018 2019 2020 2021
Capex reconciliation (Rs bn)
Gross capex 1,002 1,130 1,147 793 1,324 805 797
Less: forex-related capitalization 69 99 46 12 51 62 (3)
Net capex 934 1,031 1,101 780 1,273 743 799
Cash capex 634 469 781 740 936 765 1,058
Interest capitalization 44 81 109 100 113 83 46
Capex creditors/deferred liabilities 256 481 210 (60) 224 (105) (305)
Capex reconciliation (US$ bn)
Gross capex 16.4 17.3 17.1 12.3 18.9 11.4 10.7
Less: forex-related capitalization 1.1 1.5 0.7 0.2 0.7 0.9 (0.0)
Net capex 15.3 15.7 16.4 12.1 18.2 10.5 10.8
Cash capex 10.4 7.2 11.6 11.5 13.4 10.8 14.3
Interest capitalization 0.7 1.2 1.6 1.6 1.6 1.2 0.6
Capex creditors/deferred liabilities 4.2 7.3 3.1 (0.9) 3.2 (1.5) (4.1)
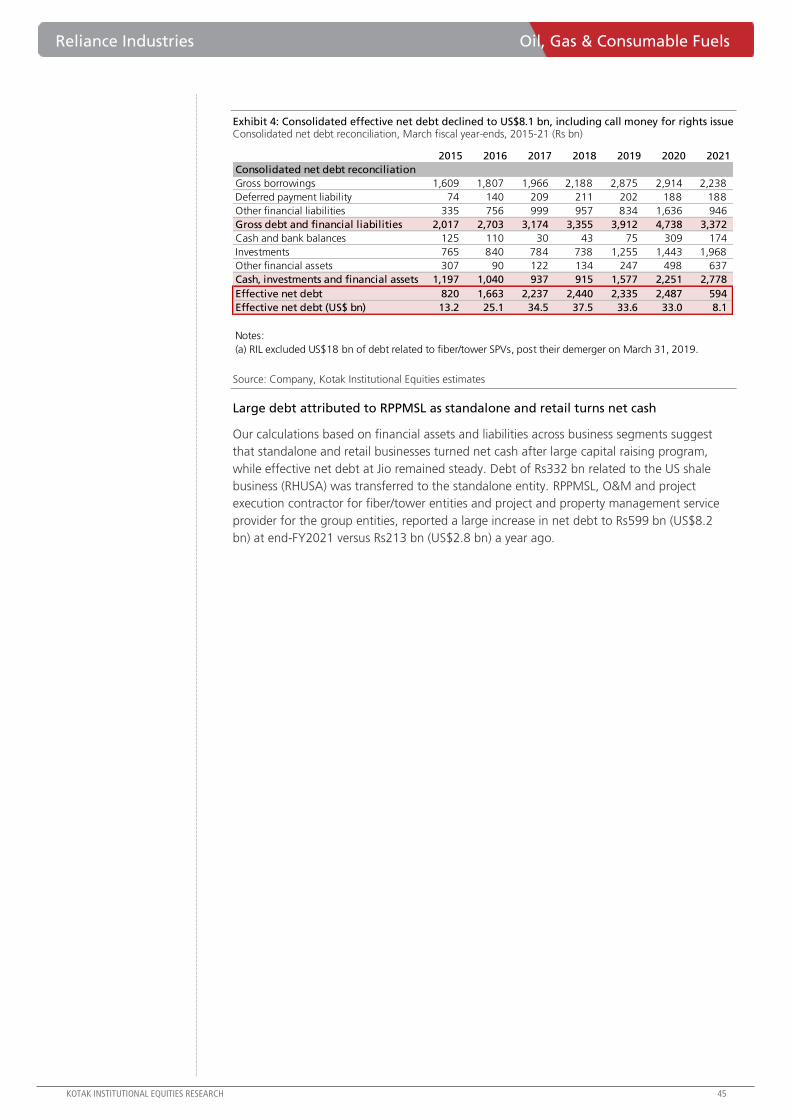
Reliance Industries Oil, Gas & Consumable Fuels
KOTAK INSTITUTIONAL EQUITIES RESEARCH 45
Exhibit 4: Consolidated effective net debt declined to US$8.1 bn, including call money for rights issue Consolidated net debt reconciliation, March fiscal year-ends, 2015-21 (Rs bn)
Source: Company, Kotak Institutional Equities estimates
Large debt attributed to RPPMSL as standalone and retail turns net cash
Our calculations based on financial assets and liabilities across business segments suggest
that standalone and retail businesses turned net cash after large capital raising program,
while effective net debt at Jio remained steady. Debt of Rs332 bn related to the US shale
business (RHUSA) was transferred to the standalone entity. RPPMSL, O&M and project
execution contractor for fiber/tower entities and project and property management service
provider for the group entities, reported a large increase in net debt to Rs599 bn (US$8.2
bn) at end-FY2021 versus Rs213 bn (US$2.8 bn) a year ago.
2015 2016 2017 2018 2019 2020 2021
Consolidated net debt reconciliation
Gross borrowings 1,609 1,807 1,966 2,188 2,875 2,914 2,238
Deferred payment liability 74 140 209 211 202 188 188
Other financial liabilities 335 756 999 957 834 1,636 946
Gross debt and financial liabilities 2,017 2,703 3,174 3,355 3,912 4,738 3,372
Cash and bank balances 125 110 30 43 75 309 174
Investments 765 840 784 738 1,255 1,443 1,968
Other financial assets 307 90 122 134 247 498 637
Cash, investments and financial assets 1,197 1,040 937 915 1,577 2,251 2,778
Effective net debt 820 1,663 2,237 2,440 2,335 2,487 594
Effective net debt (US$ bn) 13.2 25.1 34.5 37.5 33.6 33.0 8.1
Notes:
(a) RIL excluded US$18 bn of debt related to fiber/tower SPVs, post their demerger on March 31, 2019.
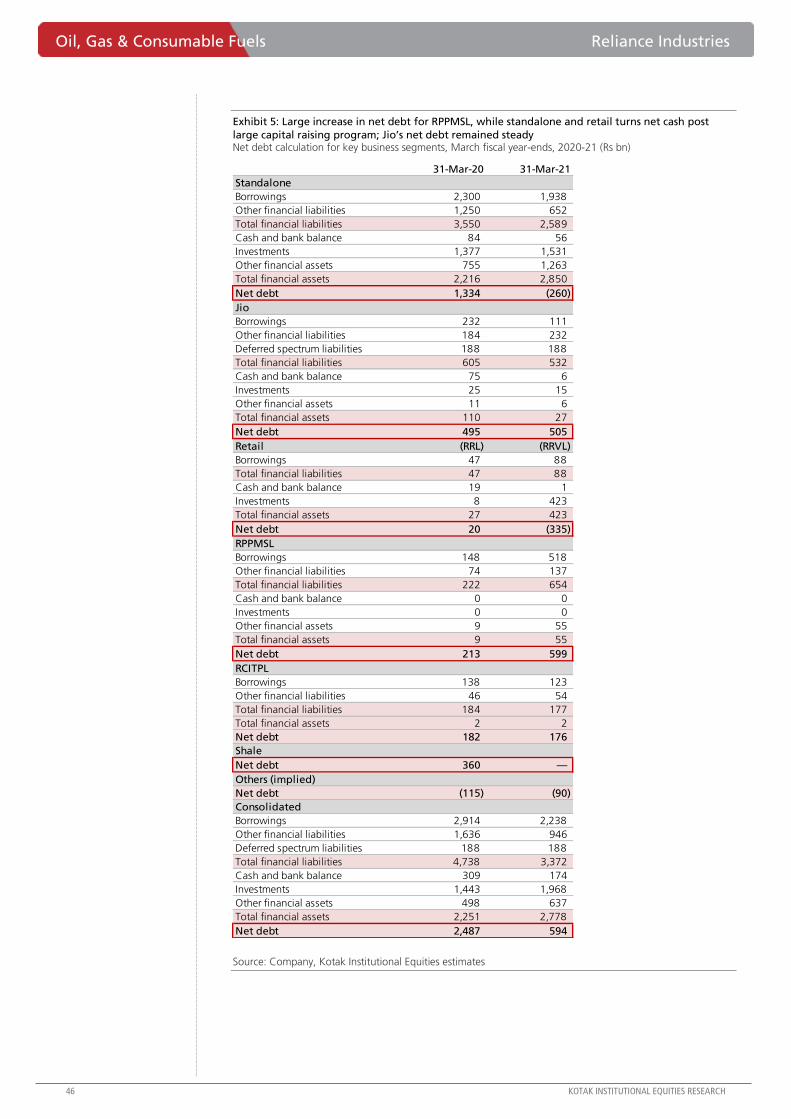
Oil, Gas & Consumable Fuels Reliance Industries
46 KOTAK INSTITUTIONAL EQUITIES RESEARCH
Exhibit 5: Large increase in net debt for RPPMSL, while standalone and retail turns net cash post
large capital raising program; Jio’s net debt remained steady Net debt calculation for key business segments, March fiscal year-ends, 2020-21 (Rs bn)
Source: Company, Kotak Institutional Equities estimates
31-Mar-20 31-Mar-21
Standalone
Borrowings 2,300 1,938
Other financial liabilities 1,250 652
Total financial liabilities 3,550 2,589
Cash and bank balance 84 56
Investments 1,377 1,531
Other financial assets 755 1,263
Total financial assets 2,216 2,850
Net debt 1,334 (260)
Jio
Borrowings 232 111
Other financial liabilities 184 232
Deferred spectrum liabilities 188 188
Total financial liabilities 605 532
Cash and bank balance 75 6
Investments 25 15
Other financial assets 11 6
Total financial assets 110 27
Net debt 495 505
Retail (RRL) (RRVL)
Borrowings 47 88
Total financial liabilities 47 88
Cash and bank balance 19 1
Investments 8 423
Total financial assets 27 423
Net debt 20 (335)
RPPMSL
Borrowings 148 518
Other financial liabilities 74 137
Total financial liabilities 222 654
Cash and bank balance 0 0
Investments 0 0
Other financial assets 9 55
Total financial assets 9 55
Net debt 213 599
RCITPL
Borrowings 138 123
Other financial liabilities 46 54
Total financial liabilities 184 177
Total financial assets 2 2
Net debt 182 176
Shale
Net debt 360 —
Others (implied)
Net debt (115) (90)
Consolidated
Borrowings 2,914 2,238
Other financial liabilities 1,636 946
Deferred spectrum liabilities 188 188
Total financial liabilities 4,738 3,372
Cash and bank balance 309 174
Investments 1,443 1,968
Other financial assets 498 637
Total financial assets 2,251 2,778
Net debt 2,487 594
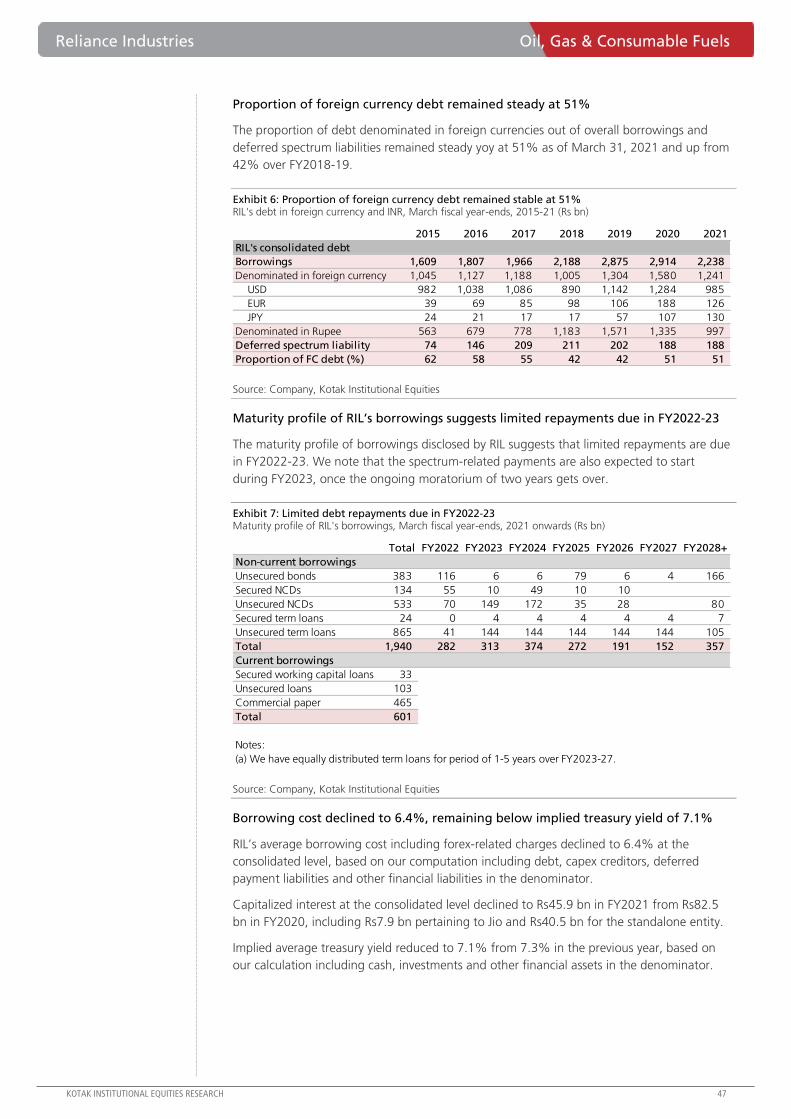
Reliance Industries Oil, Gas & Consumable Fuels
KOTAK INSTITUTIONAL EQUITIES RESEARCH 47
Proportion of foreign currency debt remained steady at 51%
The proportion of debt denominated in foreign currencies out of overall borrowings and
deferred spectrum liabilities remained steady yoy at 51% as of March 31, 2021 and up from
42% over FY2018-19.
Exhibit 6: Proportion of foreign currency debt remained stable at 51% RIL's debt in foreign currency and INR, March fiscal year-ends, 2015-21 (Rs bn)
Source: Company, Kotak Institutional Equities
Maturity profile of RIL’s borrowings suggests limited repayments due in FY2022-23
The maturity profile of borrowings disclosed by RIL suggests that limited repayments are due
in FY2022-23. We note that the spectrum-related payments are also expected to start
during FY2023, once the ongoing moratorium of two years gets over.
Exhibit 7: Limited debt repayments due in FY2022-23 Maturity profile of RIL's borrowings, March fiscal year-ends, 2021 onwards (Rs bn)
Source: Company, Kotak Institutional Equities
Borrowing cost declined to 6.4%, remaining below implied treasury yield of 7.1%
RIL’s average borrowing cost including forex-related charges declined to 6.4% at the
consolidated level, based on our computation including debt, capex creditors, deferred
payment liabilities and other financial liabilities in the denominator.
Capitalized interest at the consolidated level declined to Rs45.9 bn in FY2021 from Rs82.5
bn in FY2020, including Rs7.9 bn pertaining to Jio and Rs40.5 bn for the standalone entity.
Implied average treasury yield reduced to 7.1% from 7.3% in the previous year, based on
our calculation including cash, investments and other financial assets in the denominator.
2015 2016 2017 2018 2019 2020 2021
RIL's consolidated debt
Borrowings 1,609 1,807 1,966 2,188 2,875 2,914 2,238
Denominated in foreign currency 1,045 1,127 1,188 1,005 1,304 1,580 1,241
USD 982 1,038 1,086 890 1,142 1,284 985
EUR 39 69 85 98 106 188 126
JPY 24 21 17 17 57 107 130
Denominated in Rupee 563 679 778 1,183 1,571 1,335 997
Deferred spectrum liability 74 146 209 211 202 188 188
Proportion of FC debt (%) 62 58 55 42 42 51 51
Total FY2022 FY2023 FY2024 FY2025 FY2026 FY2027 FY2028+
Non-current borrowings
Unsecured bonds 383 116 6 6 79 6 4 166
Secured NCDs 134 55 10 49 10 10
Unsecured NCDs 533 70 149 172 35 28 80
Secured term loans 24 0 4 4 4 4 4 7
Unsecured term loans 865 41 144 144 144 144 144 105
Total 1,940 282 313 374 272 191 152 357
Current borrowings
Secured working capital loans 33
Unsecured loans 103
Commercial paper 465
Total 601
Notes:
(a) We have equally distributed term loans for period of 1-5 years over FY2023-27.
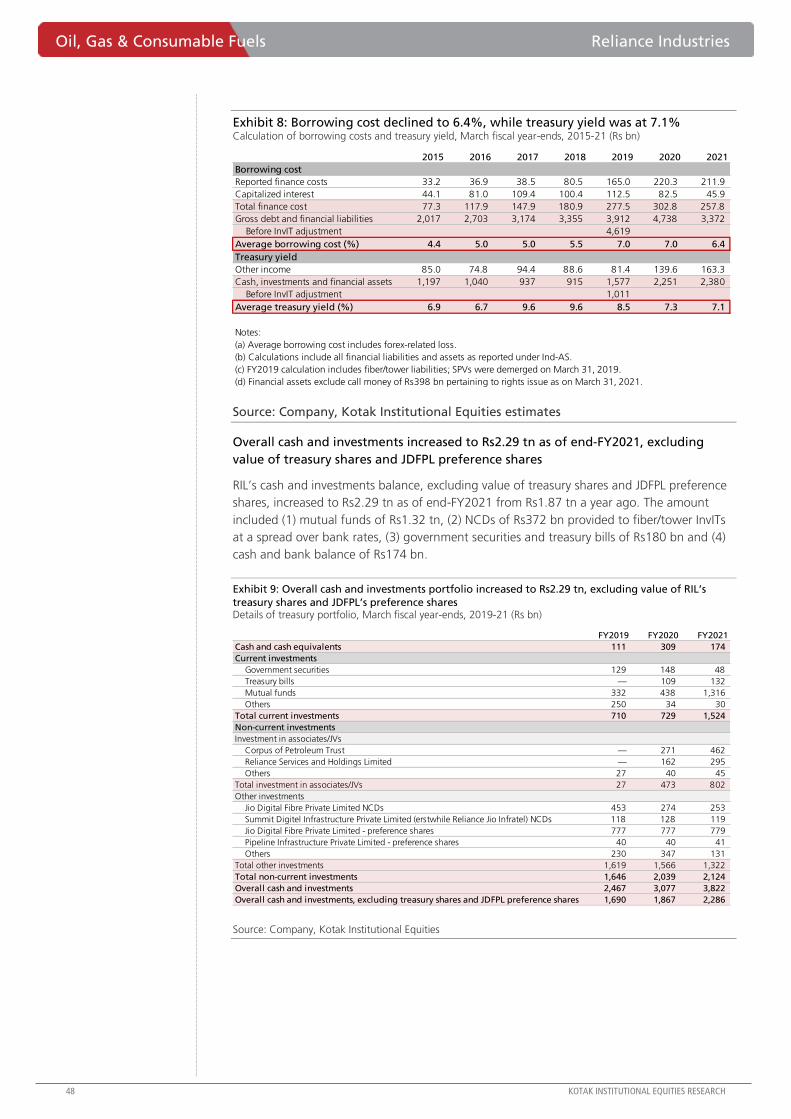
Oil, Gas & Consumable Fuels Reliance Industries
48 KOTAK INSTITUTIONAL EQUITIES RESEARCH
Exhibit 8: Borrowing cost declined to 6.4%, while treasury yield was at 7.1% Calculation of borrowing costs and treasury yield, March fiscal year-ends, 2015-21 (Rs bn)
Source: Company, Kotak Institutional Equities estimates
Overall cash and investments increased to Rs2.29 tn as of end-FY2021, excluding
value of treasury shares and JDFPL preference shares
RIL’s cash and investments balance, excluding value of treasury shares and JDFPL preference
shares, increased to Rs2.29 tn as of end-FY2021 from Rs1.87 tn a year ago. The amount
included (1) mutual funds of Rs1.32 tn, (2) NCDs of Rs372 bn provided to fiber/tower InvITs
at a spread over bank rates, (3) government securities and treasury bills of Rs180 bn and (4)
cash and bank balance of Rs174 bn.
Exhibit 9: Overall cash and investments portfolio increased to Rs2.29 tn, excluding value of RIL’s
treasury shares and JDFPL’s preference shares Details of treasury portfolio, March fiscal year-ends, 2019-21 (Rs bn)
Source: Company, Kotak Institutional Equities
2015 2016 2017 2018 2019 2020 2021
Borrowing cost
Reported finance costs 33.2 36.9 38.5 80.5 165.0 220.3 211.9
Capitalized interest 44.1 81.0 109.4 100.4 112.5 82.5 45.9
Total finance cost 77.3 117.9 147.9 180.9 277.5 302.8 257.8
Gross debt and financial liabilities 2,017 2,703 3,174 3,355 3,912 4,738 3,372
Before InvIT adjustment 4,619
Average borrowing cost (%) 4.4 5.0 5.0 5.5 7.0 7.0 6.4
Treasury yield
Other income 85.0 74.8 94.4 88.6 81.4 139.6 163.3
Cash, investments and financial assets 1,197 1,040 937 915 1,577 2,251 2,380
Before InvIT adjustment 1,011
Average treasury yield (%) 6.9 6.7 9.6 9.6 8.5 7.3 7.1
Notes:
(a) Average borrowing cost includes forex-related loss.
(b) Calculations include all financial liabilities and assets as reported under Ind-AS.
(c) FY2019 calculation includes fiber/tower liabilities; SPVs were demerged on March 31, 2019.
(d) Financial assets exclude call money of Rs398 bn pertaining to rights issue as on March 31, 2021.
FY2019 FY2020 FY2021
Cash and cash equivalents 111 309 174
Current investments
Government securities 129 148 48
Treasury bills — 109 132
Mutual funds 332 438 1,316
Others 250 34 30
Total current investments 710 729 1,524
Non-current investments
Investment in associates/JVs
Corpus of Petroleum Trust — 271 462
Reliance Services and Holdings Limited — 162 295
Others 27 40 45
Total investment in associates/JVs 27 473 802
Other investments
Jio Digital Fibre Private Limited NCDs 453 274 253
Summit Digitel Infrastructure Private Limited (erstwhile Reliance Jio Infratel) NCDs 118 128 119
Jio Digital Fibre Private Limited - preference shares 777 777 779
Pipeline Infrastructure Private Limited - preference shares 40 40 41
Others 230 347 131
Total other investments 1,619 1,566 1,322
Total non-current investments 1,646 2,039 2,124
Overall cash and investments 2,467 3,077 3,822
Overall cash and investments, excluding treasury shares and JDFPL preference shares 1,690 1,867 2,286
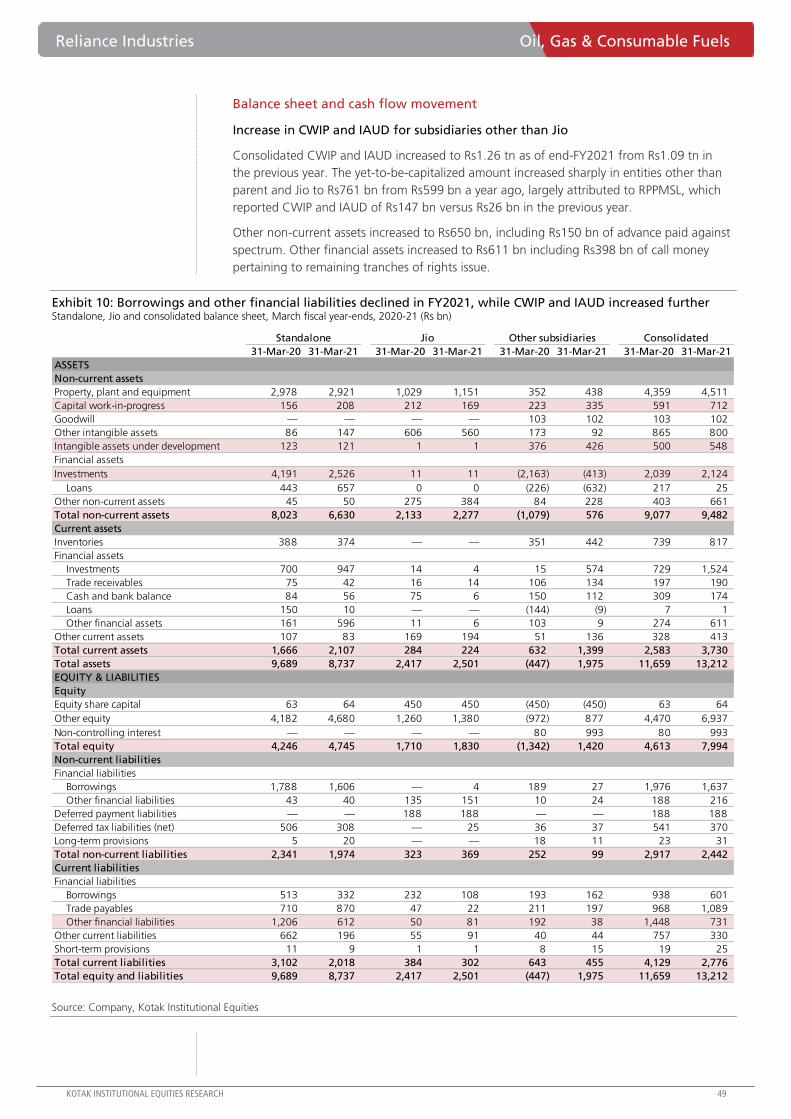
Reliance Industries Oil, Gas & Consumable Fuels
KOTAK INSTITUTIONAL EQUITIES RESEARCH 49
Balance sheet and cash flow movement
Increase in CWIP and IAUD for subsidiaries other than Jio
Consolidated CWIP and IAUD increased to Rs1.26 tn as of end-FY2021 from Rs1.09 tn in
the previous year. The yet-to-be-capitalized amount increased sharply in entities other than
parent and Jio to Rs761 bn from Rs599 bn a year ago, largely attributed to RPPMSL, which
reported CWIP and IAUD of Rs147 bn versus Rs26 bn in the previous year.
Other non-current assets increased to Rs650 bn, including Rs150 bn of advance paid against
spectrum. Other financial assets increased to Rs611 bn including Rs398 bn of call money
pertaining to remaining tranches of rights issue.
Exhibit 10: Borrowings and other financial liabilities declined in FY2021, while CWIP and IAUD increased further
Standalone, Jio and consolidated balance sheet, March fiscal year-ends, 2020-21 (Rs bn)
Source: Company, Kotak Institutional Equities
31-Mar-20 31-Mar-21 31-Mar-20 31-Mar-21 31-Mar-20 31-Mar-21 31-Mar-20 31-Mar-21
ASSETS
Non-current assets
Property, plant and equipment 2,978 2,921 1,029 1,151 352 438 4,359 4,511
Capital work-in-progress 156 208 212 169 223 335 591 712
Goodwill — — — — 103 102 103 102
Other intangible assets 86 147 606 560 173 92 865 800
Intangible assets under development 123 121 1 1 376 426 500 548
Financial assets
Investments 4,191 2,526 11 11 (2,163) (413) 2,039 2,124
Loans 443 657 0 0 (226) (632) 217 25
Other non-current assets 45 50 275 384 84 228 403 661
Total non-current assets 8,023 6,630 2,133 2,277 (1,079) 576 9,077 9,482
Current assets
Inventories 388 374 — — 351 442 739 817
Financial assets
Investments 700 947 14 4 15 574 729 1,524
Trade receivables 75 42 16 14 106 134 197 190
Cash and bank balance 84 56 75 6 150 112 309 174
Loans 150 10 — — (144) (9) 7 1
Other financial assets 161 596 11 6 103 9 274 611
Other current assets 107 83 169 194 51 136 328 413
Total current assets 1,666 2,107 284 224 632 1,399 2,583 3,730
Total assets 9,689 8,737 2,417 2,501 (447) 1,975 11,659 13,212
EQUITY & LIABILITIES
Equity
Equity share capital 63 64 450 450 (450) (450) 63 64
Other equity 4,182 4,680 1,260 1,380 (972) 877 4,470 6,937
Non-controlling interest — — — — 80 993 80 993
Total equity 4,246 4,745 1,710 1,830 (1,342) 1,420 4,613 7,994
Non-current liabilities
Financial liabilities
Borrowings 1,788 1,606 — 4 189 27 1,976 1,637
Other financial liabilities 43 40 135 151 10 24 188 216
Deferred payment liabilities — — 188 188 — — 188 188
Deferred tax liabilities (net) 506 308 — 25 36 37 541 370
Long-term provisions 5 20 — — 18 11 23 31
Total non-current liabilities 2,341 1,974 323 369 252 99 2,917 2,442
Current liabilities
Financial liabilities
Borrowings 513 332 232 108 193 162 938 601
Trade payables 710 870 47 22 211 197 968 1,089
Other financial liabilities 1,206 612 50 81 192 38 1,448 731
Other current liabilities 662 196 55 91 40 44 757 330
Short-term provisions 11 9 1 1 8 15 19 25
Total current liabilities 3,102 2,018 384 302 643 455 4,129 2,776
Total equity and liabilities 9,689 8,737 2,417 2,501 (447) 1,975 11,659 13,212
Standalone Jio Other subsidiaries Consolidated
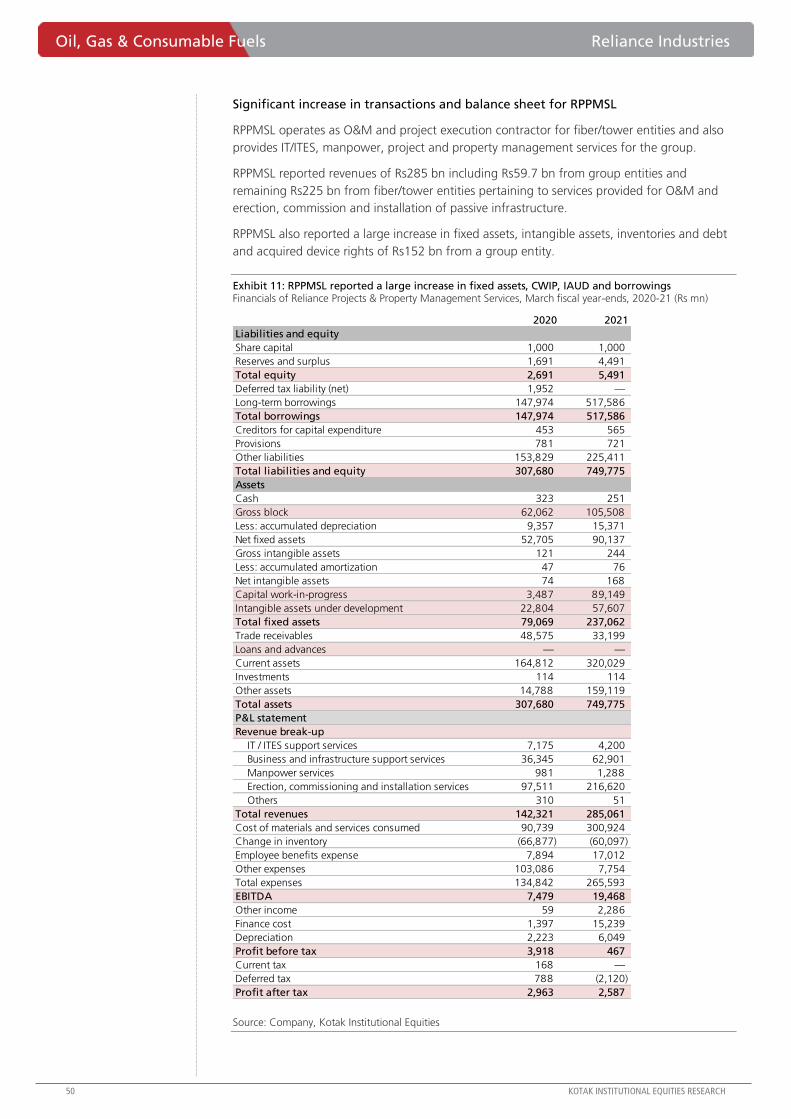
Oil, Gas & Consumable Fuels Reliance Industries
50 KOTAK INSTITUTIONAL EQUITIES RESEARCH
Significant increase in transactions and balance sheet for RPPMSL
RPPMSL operates as O&M and project execution contractor for fiber/tower entities and also
provides IT/ITES, manpower, project and property management services for the group.
RPPMSL reported revenues of Rs285 bn including Rs59.7 bn from group entities and
remaining Rs225 bn from fiber/tower entities pertaining to services provided for O&M and
erection, commission and installation of passive infrastructure.
RPPMSL also reported a large increase in fixed assets, intangible assets, inventories and debt
and acquired device rights of Rs152 bn from a group entity.
Exhibit 11: RPPMSL reported a large increase in fixed assets, CWIP, IAUD and borrowings Financials of Reliance Projects & Property Management Services, March fiscal year-ends, 2020-21 (Rs mn)
Source: Company, Kotak Institutional Equities
2020 2021
Liabilities and equity
Share capital 1,000 1,000
Reserves and surplus 1,691 4,491
Total equity 2,691 5,491
Deferred tax liability (net) 1,952 —
Long-term borrowings 147,974 517,586
Total borrowings 147,974 517,586
Creditors for capital expenditure 453 565
Provisions 781 721
Other liabilities 153,829 225,411
Total liabilities and equity 307,680 749,775
Assets
Cash 323 251
Gross block 62,062 105,508
Less: accumulated depreciation 9,357 15,371
Net fixed assets 52,705 90,137
Gross intangible assets 121 244
Less: accumulated amortization 47 76
Net intangible assets 74 168
Capital work-in-progress 3,487 89,149
Intangible assets under development 22,804 57,607
Total fixed assets 79,069 237,062
Trade receivables 48,575 33,199
Loans and advances — —
Current assets 164,812 320,029
Investments 114 114
Other assets 14,788 159,119
Total assets 307,680 749,775
P&L statement
Revenue break-up
IT / ITES support services 7,175 4,200
Business and infrastructure support services 36,345 62,901
Manpower services 981 1,288
Erection, commissioning and installation services 97,511 216,620
Others 310 51
Total revenues 142,321 285,061
Cost of materials and services consumed 90,739 300,924
Change in inventory (66,877) (60,097)
Employee benefits expense 7,894 17,012
Other expenses 103,086 7,754
Total expenses 134,842 265,593
EBITDA 7,479 19,468
Other income 59 2,286
Finance cost 1,397 15,239
Depreciation 2,223 6,049
Profit before tax 3,918 467
Current tax 168 —
Deferred tax 788 (2,120)
Profit after tax 2,963 2,587
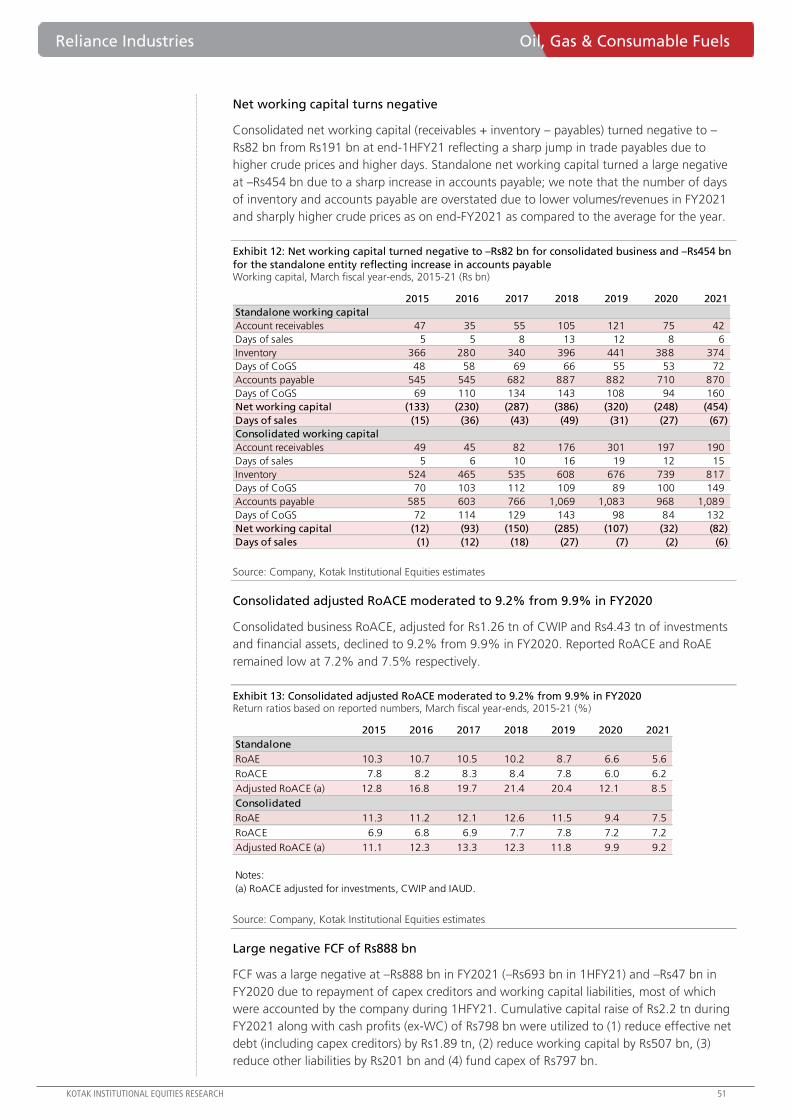
Reliance Industries Oil, Gas & Consumable Fuels
KOTAK INSTITUTIONAL EQUITIES RESEARCH 51
Net working capital turns negative
Consolidated net working capital (receivables + inventory – payables) turned negative to –
Rs82 bn from Rs191 bn at end-1HFY21 reflecting a sharp jump in trade payables due to
higher crude prices and higher days. Standalone net working capital turned a large negative
at –Rs454 bn due to a sharp increase in accounts payable; we note that the number of days
of inventory and accounts payable are overstated due to lower volumes/revenues in FY2021
and sharply higher crude prices as on end-FY2021 as compared to the average for the year.
Exhibit 12: Net working capital turned negative to –Rs82 bn for consolidated business and –Rs454 bn
for the standalone entity reflecting increase in accounts payable Working capital, March fiscal year-ends, 2015-21 (Rs bn)
Source: Company, Kotak Institutional Equities estimates
Consolidated adjusted RoACE moderated to 9.2% from 9.9% in FY2020
Consolidated business RoACE, adjusted for Rs1.26 tn of CWIP and Rs4.43 tn of investments
and financial assets, declined to 9.2% from 9.9% in FY2020. Reported RoACE and RoAE
remained low at 7.2% and 7.5% respectively.
Exhibit 13: Consolidated adjusted RoACE moderated to 9.2% from 9.9% in FY2020 Return ratios based on reported numbers, March fiscal year-ends, 2015-21 (%)
Source: Company, Kotak Institutional Equities estimates
Large negative FCF of Rs888 bn
FCF was a large negative at –Rs888 bn in FY2021 (–Rs693 bn in 1HFY21) and –Rs47 bn in
FY2020 due to repayment of capex creditors and working capital liabilities, most of which
were accounted by the company during 1HFY21. Cumulative capital raise of Rs2.2 tn during
FY2021 along with cash profits (ex-WC) of Rs798 bn were utilized to (1) reduce effective net
debt (including capex creditors) by Rs1.89 tn, (2) reduce working capital by Rs507 bn, (3)
reduce other liabilities by Rs201 bn and (4) fund capex of Rs797 bn.
2015 2016 2017 2018 2019 2020 2021
Standalone working capital
Account receivables 47 35 55 105 121 75 42
Days of sales 5 5 8 13 12 8 6
Inventory 366 280 340 396 441 388 374
Days of CoGS 48 58 69 66 55 53 72
Accounts payable 545 545 682 887 882 710 870
Days of CoGS 69 110 134 143 108 94 160
Net working capital (133) (230) (287) (386) (320) (248) (454)
Days of sales (15) (36) (43) (49) (31) (27) (67)
Consolidated working capital
Account receivables 49 45 82 176 301 197 190
Days of sales 5 6 10 16 19 12 15
Inventory 524 465 535 608 676 739 817
Days of CoGS 70 103 112 109 89 100 149
Accounts payable 585 603 766 1,069 1,083 968 1,089
Days of CoGS 72 114 129 143 98 84 132
Net working capital (12) (93) (150) (285) (107) (32) (82)
Days of sales (1) (12) (18) (27) (7) (2) (6)
2015 2016 2017 2018 2019 2020 2021
Standalone
RoAE 10.3 10.7 10.5 10.2 8.7 6.6 5.6
RoACE 7.8 8.2 8.3 8.4 7.8 6.0 6.2
Adjusted RoACE (a) 12.8 16.8 19.7 21.4 20.4 12.1 8.5
Consolidated
RoAE 11.3 11.2 12.1 12.6 11.5 9.4 7.5
RoACE 6.9 6.8 6.9 7.7 7.8 7.2 7.2
Adjusted RoACE (a) 11.1 12.3 13.3 12.3 11.8 9.9 9.2
Notes:
(a) RoACE adjusted for investments, CWIP and IAUD.
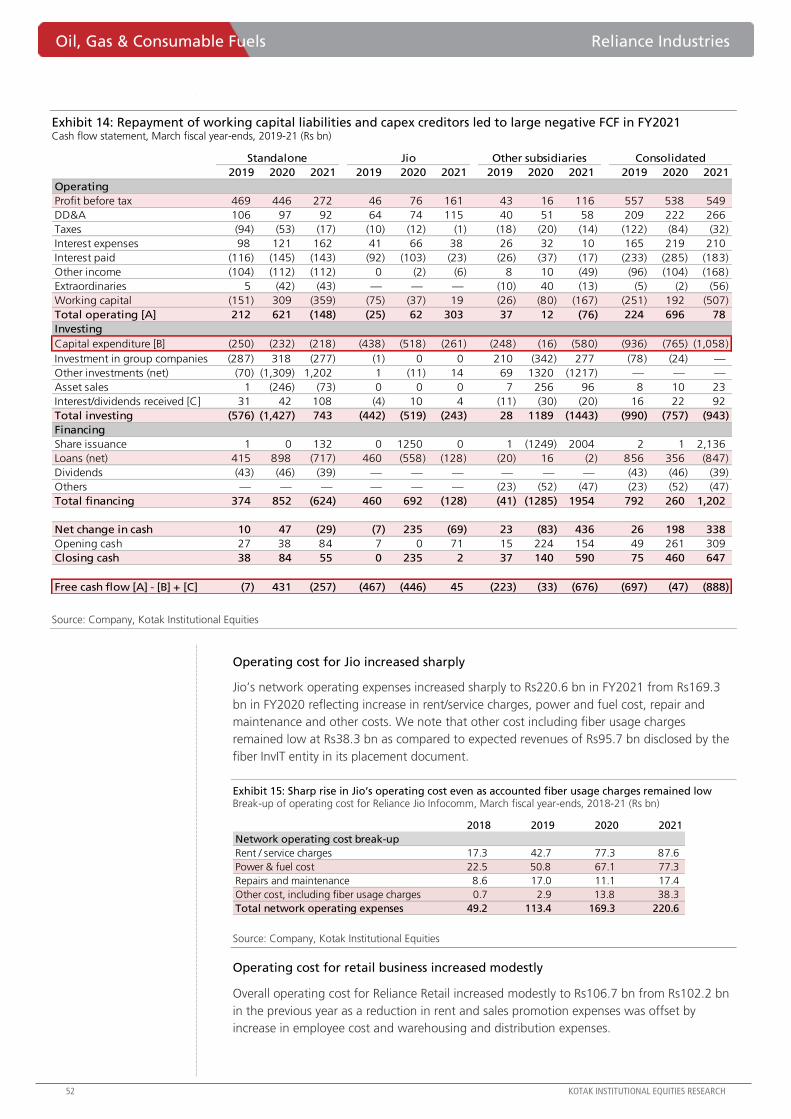
Oil, Gas & Consumable Fuels Reliance Industries
52 KOTAK INSTITUTIONAL EQUITIES RESEARCH
Exhibit 14: Repayment of working capital liabilities and capex creditors led to large negative FCF in FY2021
Cash flow statement, March fiscal year-ends, 2019-21 (Rs bn)
Source: Company, Kotak Institutional Equities
Operating cost for Jio increased sharply
Jio’s network operating expenses increased sharply to Rs220.6 bn in FY2021 from Rs169.3
bn in FY2020 reflecting increase in rent/service charges, power and fuel cost, repair and
maintenance and other costs. We note that other cost including fiber usage charges
remained low at Rs38.3 bn as compared to expected revenues of Rs95.7 bn disclosed by the
fiber InvIT entity in its placement document.
Exhibit 15: Sharp rise in Jio’s operating cost even as accounted fiber usage charges remained low Break-up of operating cost for Reliance Jio Infocomm, March fiscal year-ends, 2018-21 (Rs bn)
Source: Company, Kotak Institutional Equities
Operating cost for retail business increased modestly
Overall operating cost for Reliance Retail increased modestly to Rs106.7 bn from Rs102.2 bn
in the previous year as a reduction in rent and sales promotion expenses was offset by
increase in employee cost and warehousing and distribution expenses.
2019 2020 2021 2019 2020 2021 2019 2020 2021 2019 2020 2021
Operating
Profit before tax 469 446 272 46 76 161 43 16 116 557 538 549
DD&A 106 97 92 64 74 115 40 51 58 209 222 266
Taxes (94) (53) (17) (10) (12) (1) (18) (20) (14) (122) (84) (32)
Interest expenses 98 121 162 41 66 38 26 32 10 165 219 210
Interest paid (116) (145) (143) (92) (103) (23) (26) (37) (17) (233) (285) (183)
Other income (104) (112) (112) 0 (2) (6) 8 10 (49) (96) (104) (168)
Extraordinaries 5 (42) (43) — — — (10) 40 (13) (5) (2) (56)
Working capital (151) 309 (359) (75) (37) 19 (26) (80) (167) (251) 192 (507)
Total operating [A] 212 621 (148) (25) 62 303 37 12 (76) 224 696 78
Investing
Capital expenditure [B] (250) (232) (218) (438) (518) (261) (248) (16) (580) (936) (765) (1,058)
Investment in group companies (287) 318 (277) (1) 0 0 210 (342) 277 (78) (24) —
Other investments (net) (70) (1,309) 1,202 1 (11) 14 69 1320 (1217) — — —
Asset sales 1 (246) (73) 0 0 0 7 256 96 8 10 23
Interest/dividends received [C] 31 42 108 (4) 10 4 (11) (30) (20) 16 22 92
Total investing (576) (1,427) 743 (442) (519) (243) 28 1189 (1443) (990) (757) (943)
Financing
Share issuance 1 0 132 0 1250 0 1 (1249) 2004 2 1 2,136
Loans (net) 415 898 (717) 460 (558) (128) (20) 16 (2) 856 356 (847)
Dividends (43) (46) (39) — — — — — — (43) (46) (39)
Others — — — — — — (23) (52) (47) (23) (52) (47)
Total financing 374 852 (624) 460 692 (128) (41) (1285) 1954 792 260 1,202
Net change in cash 10 47 (29) (7) 235 (69) 23 (83) 436 26 198 338
Opening cash 27 38 84 7 0 71 15 224 154 49 261 309
Closing cash 38 84 55 0 235 2 37 140 590 75 460 647
Free cash flow [A] - [B] + [C] (7) 431 (257) (467) (446) 45 (223) (33) (676) (697) (47) (888)
Standalone Jio Other subsidiaries Consolidated
2018 2019 2020 2021
Network operating cost break-up
Rent / service charges 17.3 42.7 77.3 87.6
Power & fuel cost 22.5 50.8 67.1 77.3
Repairs and maintenance 8.6 17.0 11.1 17.4
Other cost, including fiber usage charges 0.7 2.9 13.8 38.3
Total network operating expenses 49.2 113.4 169.3 220.6
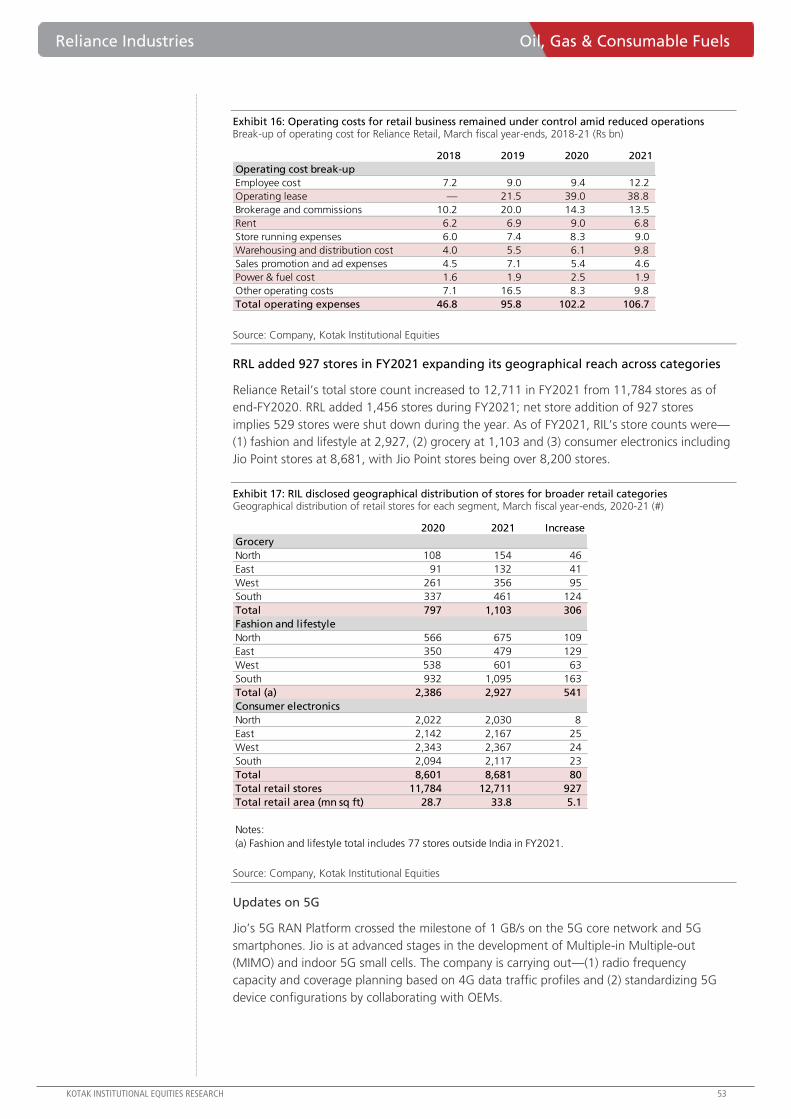
Reliance Industries Oil, Gas & Consumable Fuels
KOTAK INSTITUTIONAL EQUITIES RESEARCH 53
Exhibit 16: Operating costs for retail business remained under control amid reduced operations Break-up of operating cost for Reliance Retail, March fiscal year-ends, 2018-21 (Rs bn)
Source: Company, Kotak Institutional Equities
RRL added 927 stores in FY2021 expanding its geographical reach across categories
Reliance Retail’s total store count increased to 12,711 in FY2021 from 11,784 stores as of
end-FY2020. RRL added 1,456 stores during FY2021; net store addition of 927 stores
implies 529 stores were shut down during the year. As of FY2021, RIL’s store counts were—
(1) fashion and lifestyle at 2,927, (2) grocery at 1,103 and (3) consumer electronics including
Jio Point stores at 8,681, with Jio Point stores being over 8,200 stores.
Exhibit 17: RIL disclosed geographical distribution of stores for broader retail categories Geographical distribution of retail stores for each segment, March fiscal year-ends, 2020-21 (#)
Source: Company, Kotak Institutional Equities
Updates on 5G
Jio’s 5G RAN Platform crossed the milestone of 1 GB/s on the 5G core network and 5G
smartphones. Jio is at advanced stages in the development of Multiple-in Multiple-out
(MIMO) and indoor 5G small cells. The company is carrying out—(1) radio frequency
capacity and coverage planning based on 4G data traffic profiles and (2) standardizing 5G
device configurations by collaborating with OEMs.
2018 2019 2020 2021
Operating cost break-up
Employee cost 7.2 9.0 9.4 12.2
Operating lease — 21.5 39.0 38.8
Brokerage and commissions 10.2 20.0 14.3 13.5
Rent 6.2 6.9 9.0 6.8
Store running expenses 6.0 7.4 8.3 9.0
Warehousing and distribution cost 4.0 5.5 6.1 9.8
Sales promotion and ad expenses 4.5 7.1 5.4 4.6
Power & fuel cost 1.6 1.9 2.5 1.9
Other operating costs 7.1 16.5 8.3 9.8
Total operating expenses 46.8 95.8 102.2 106.7
2020 2021 Increase
Grocery
North 108 154 46
East 91 132 41
West 261 356 95
South 337 461 124
Total 797 1,103 306
Fashion and lifestyle
North 566 675 109
East 350 479 129
West 538 601 63
South 932 1,095 163
Total (a) 2,386 2,927 541
Consumer electronics
North 2,022 2,030 8
East 2,142 2,167 25
West 2,343 2,367 24
South 2,094 2,117 23
Total 8,601 8,681 80
Total retail stores 11,784 12,711 927
Total retail area (mn sq ft) 28.7 33.8 5.1
Notes:
(a) Fashion and lifestyle total includes 77 stores outside India in FY2021.
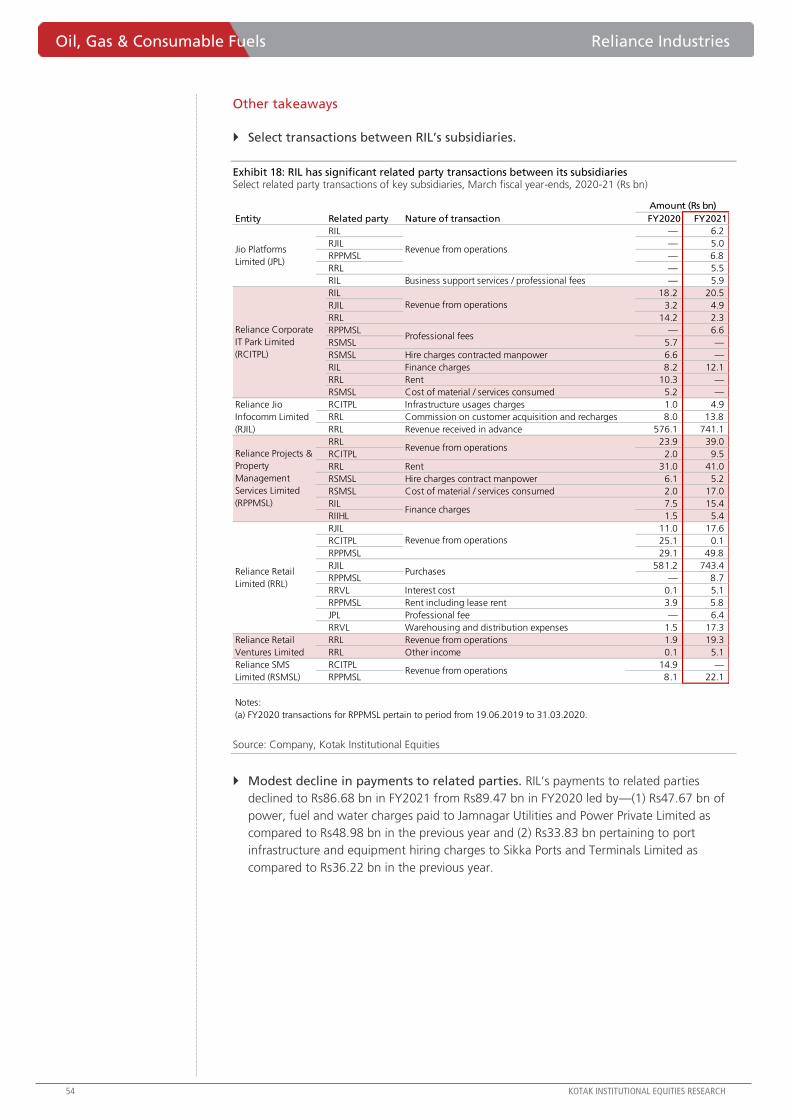
Oil, Gas & Consumable Fuels Reliance Industries
54 KOTAK INSTITUTIONAL EQUITIES RESEARCH
Other takeaways
Select transactions between RIL’s subsidiaries.
Exhibit 18: RIL has significant related party transactions between its subsidiaries Select related party transactions of key subsidiaries, March fiscal year-ends, 2020-21 (Rs bn)
Source: Company, Kotak Institutional Equities
Modest decline in payments to related parties. RIL’s payments to related parties
declined to Rs86.68 bn in FY2021 from Rs89.47 bn in FY2020 led by—(1) Rs47.67 bn of
power, fuel and water charges paid to Jamnagar Utilities and Power Private Limited as
compared to Rs48.98 bn in the previous year and (2) Rs33.83 bn pertaining to port
infrastructure and equipment hiring charges to Sikka Ports and Terminals Limited as
compared to Rs36.22 bn in the previous year.
Entity Related party Nature of transaction FY2020 FY2021
RIL — 6.2
RJIL — 5.0
RPPMSL — 6.8
RRL — 5.5
RIL Business support services / professional fees — 5.9
RIL 18.2 20.5
RJIL 3.2 4.9
RRL 14.2 2.3
RPPMSL — 6.6
RSMSL 5.7 —
RSMSL Hire charges contracted manpower 6.6 —
RIL Finance charges 8.2 12.1
RRL Rent 10.3 —
RSMSL Cost of material / services consumed 5.2 —
RCITPL Infrastructure usages charges 1.0 4.9
RRL Commission on customer acquisition and recharges 8.0 13.8
RRL Revenue received in advance 576.1 741.1
RRL 23.9 39.0
RCITPL 2.0 9.5
RRL Rent 31.0 41.0
RSMSL Hire charges contract manpower 6.1 5.2
RSMSL Cost of material / services consumed 2.0 17.0
RIL 7.5 15.4
RIIHL 1.5 5.4
RJIL 11.0 17.6
RCITPL 25.1 0.1
RPPMSL 29.1 49.8
RJIL 581.2 743.4
RPPMSL — 8.7
RRVL Interest cost 0.1 5.1
RPPMSL Rent including lease rent 3.9 5.8
JPL Professional fee — 6.4
RRVL Warehousing and distribution expenses 1.5 17.3
RRL Revenue from operations 1.9 19.3
RRL Other income 0.1 5.1
RCITPL 14.9 —
RPPMSL 8.1 22.1
Notes:
(a) FY2020 transactions for RPPMSL pertain to period from 19.06.2019 to 31.03.2020.
Purchases
Amount (Rs bn)
Jio Platforms
Limited (JPL)
Revenue from operations
Reliance Corporate
IT Park Limited
(RCITPL)
Revenue from operations
Professional fees
Reliance SMS
Limited (RSMSL)Revenue from operations
Reliance Retail
Ventures Limited
Reliance Jio
Infocomm Limited
(RJIL)
Reliance Projects &
Property
Management
Services Limited
(RPPMSL)
Revenue from operations
Finance charges
Reliance Retail
Limited (RRL)
Revenue from operations
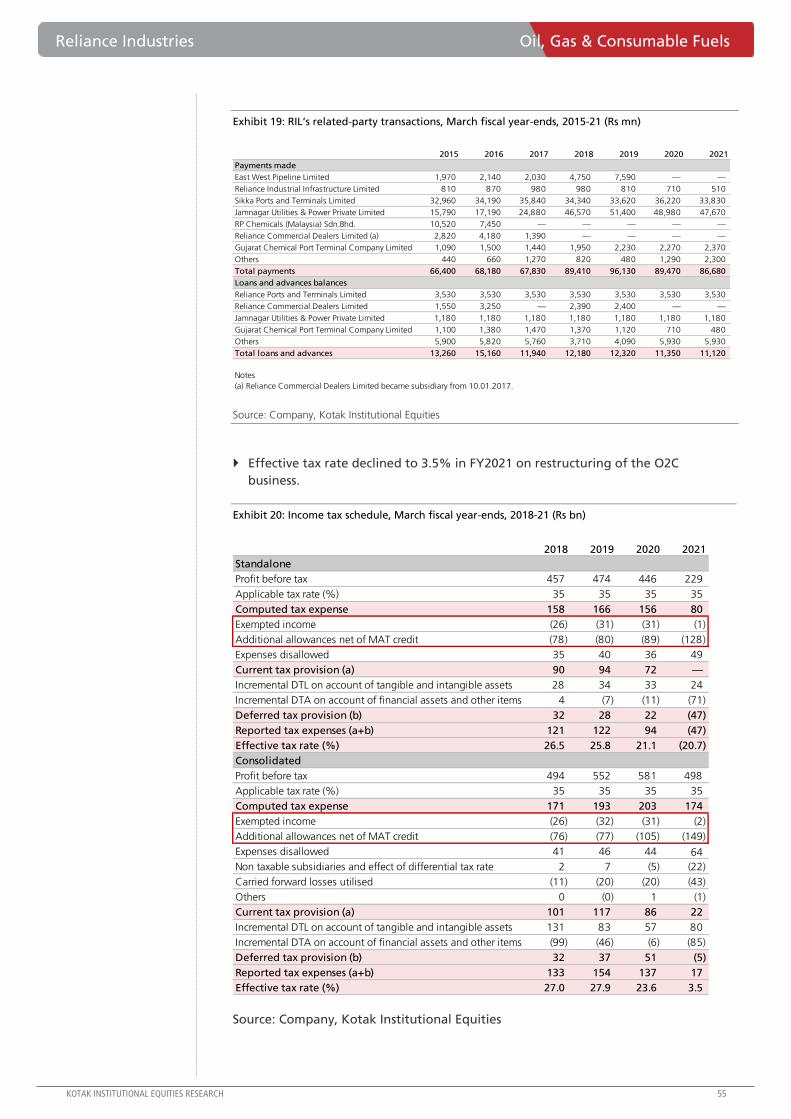
Reliance Industries Oil, Gas & Consumable Fuels
KOTAK INSTITUTIONAL EQUITIES RESEARCH 55
Exhibit 19: RIL’s related-party transactions, March fiscal year-ends, 2015-21 (Rs mn)
Source: Company, Kotak Institutional Equities
Effective tax rate declined to 3.5% in FY2021 on restructuring of the O2C
business.
Exhibit 20: Income tax schedule, March fiscal year-ends, 2018-21 (Rs bn)
Source: Company, Kotak Institutional Equities
2015 2016 2017 2018 2019 2020 2021
Payments made
East West Pipeline Limited 1,970 2,140 2,030 4,750 7,590 — —
Reliance Industrial Infrastructure Limited 810 870 980 980 810 710 510
Sikka Ports and Terminals Limited 32,960 34,190 35,840 34,340 33,620 36,220 33,830
Jamnagar Utilities & Power Private Limited 15,790 17,190 24,880 46,570 51,400 48,980 47,670
RP Chemicals (Malaysia) Sdn.Bhd. 10,520 7,450 — — — — —
Reliance Commercial Dealers Limited (a) 2,820 4,180 1,390 — — — —
Gujarat Chemical Port Terminal Company Limited 1,090 1,500 1,440 1,950 2,230 2,270 2,370
Others 440 660 1,270 820 480 1,290 2,300
Total payments 66,400 68,180 67,830 89,410 96,130 89,470 86,680
Loans and advances balances
Reliance Ports and Terminals Limited 3,530 3,530 3,530 3,530 3,530 3,530 3,530
Reliance Commercial Dealers Limited 1,550 3,250 — 2,390 2,400 — —
Jamnagar Utilities & Power Private Limited 1,180 1,180 1,180 1,180 1,180 1,180 1,180
Gujarat Chemical Port Terminal Company Limited 1,100 1,380 1,470 1,370 1,120 710 480
Others 5,900 5,820 5,760 3,710 4,090 5,930 5,930
Total loans and advances 13,260 15,160 11,940 12,180 12,320 11,350 11,120
Notes
(a) Reliance Commercial Dealers Limited became subsidiary from 10.01.2017.
2018 2019 2020 2021
Standalone
Profit before tax 457 474 446 229
Applicable tax rate (%) 35 35 35 35
Computed tax expense 158 166 156 80
Exempted income (26) (31) (31) (1)
Additional allowances net of MAT credit (78) (80) (89) (128)
Expenses disallowed 35 40 36 49
Current tax provision (a) 90 94 72 —
Incremental DTL on account of tangible and intangible assets 28 34 33 24
Incremental DTA on account of financial assets and other items 4 (7) (11) (71)
Deferred tax provision (b) 32 28 22 (47)
Reported tax expenses (a+b) 121 122 94 (47)
Effective tax rate (%) 26.5 25.8 21.1 (20.7)
Consolidated
Profit before tax 494 552 581 498
Applicable tax rate (%) 35 35 35 35
Computed tax expense 171 193 203 174
Exempted income (26) (32) (31) (2)
Additional allowances net of MAT credit (76) (77) (105) (149)
Expenses disallowed 41 46 44 64
Non taxable subsidiaries and effect of differential tax rate 2 7 (5) (22)
Carried forward losses utilised (11) (20) (20) (43)
Others 0 (0) 1 (1)
Current tax provision (a) 101 117 86 22
Incremental DTL on account of tangible and intangible assets 131 83 57 80
Incremental DTA on account of financial assets and other items (99) (46) (6) (85)
Deferred tax provision (b) 32 37 51 (5)
Reported tax expenses (a+b) 133 154 137 17
Effective tax rate (%) 27.0 27.9 23.6 3.5
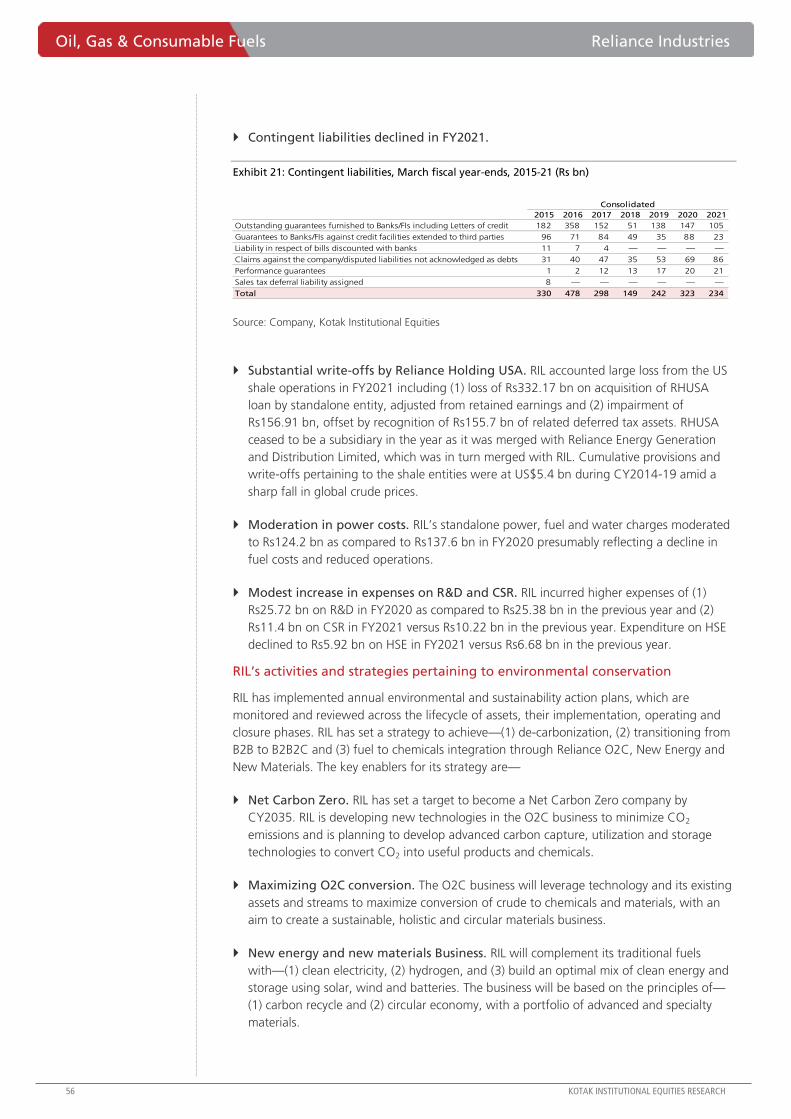
Oil, Gas & Consumable Fuels Reliance Industries
56 KOTAK INSTITUTIONAL EQUITIES RESEARCH
Contingent liabilities declined in FY2021.
Exhibit 21: Contingent liabilities, March fiscal year-ends, 2015-21 (Rs bn)
Source: Company, Kotak Institutional Equities
Substantial write-offs by Reliance Holding USA. RIL accounted large loss from the US
shale operations in FY2021 including (1) loss of Rs332.17 bn on acquisition of RHUSA
loan by standalone entity, adjusted from retained earnings and (2) impairment of
Rs156.91 bn, offset by recognition of Rs155.7 bn of related deferred tax assets. RHUSA
ceased to be a subsidiary in the year as it was merged with Reliance Energy Generation
and Distribution Limited, which was in turn merged with RIL. Cumulative provisions and
write-offs pertaining to the shale entities were at US$5.4 bn during CY2014-19 amid a
sharp fall in global crude prices.
Moderation in power costs. RIL’s standalone power, fuel and water charges moderated
to Rs124.2 bn as compared to Rs137.6 bn in FY2020 presumably reflecting a decline in
fuel costs and reduced operations.
Modest increase in expenses on R&D and CSR. RIL incurred higher expenses of (1)
Rs25.72 bn on R&D in FY2020 as compared to Rs25.38 bn in the previous year and (2)
Rs11.4 bn on CSR in FY2021 versus Rs10.22 bn in the previous year. Expenditure on HSE
declined to Rs5.92 bn on HSE in FY2021 versus Rs6.68 bn in the previous year.
RIL’s activities and strategies pertaining to environmental conservation
RIL has implemented annual environmental and sustainability action plans, which are
monitored and reviewed across the lifecycle of assets, their implementation, operating and
closure phases. RIL has set a strategy to achieve—(1) de-carbonization, (2) transitioning from
B2B to B2B2C and (3) fuel to chemicals integration through Reliance O2C, New Energy and
New Materials. The key enablers for its strategy are—
Net Carbon Zero. RIL has set a target to become a Net Carbon Zero company by
CY2035. RIL is developing new technologies in the O2C business to minimize CO2
emissions and is planning to develop advanced carbon capture, utilization and storage
technologies to convert CO2 into useful products and chemicals.
Maximizing O2C conversion. The O2C business will leverage technology and its existing
assets and streams to maximize conversion of crude to chemicals and materials, with an
aim to create a sustainable, holistic and circular materials business.
New energy and new materials Business. RIL will complement its traditional fuels
with—(1) clean electricity, (2) hydrogen, and (3) build an optimal mix of clean energy and
storage using solar, wind and batteries. The business will be based on the principles of—
(1) carbon recycle and (2) circular economy, with a portfolio of advanced and specialty
materials.
2015 2016 2017 2018 2019 2020 2021
Outstanding guarantees furnished to Banks/FIs including Letters of credit 182 358 152 51 138 147 105
Guarantees to Banks/FIs against credit facilities extended to third parties 96 71 84 49 35 88 23
Liability in respect of bills discounted with banks 11 7 4 — — — —
Claims against the company/disputed liabilities not acknowledged as debts 31 40 47 35 53 69 86
Performance guarantees 1 2 12 13 17 20 21
Sales tax deferral liability assigned 8 — — — — — —
Total 330 478 298 149 242 323 234
Consolidated
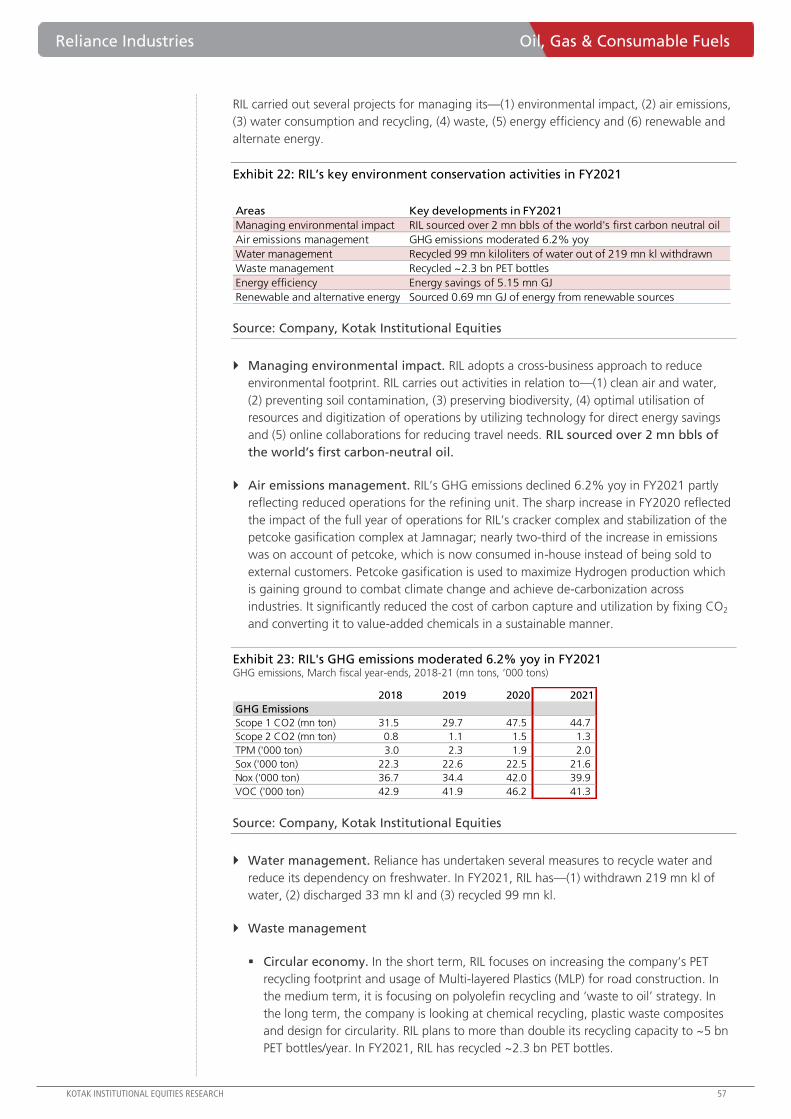
Reliance Industries Oil, Gas & Consumable Fuels
KOTAK INSTITUTIONAL EQUITIES RESEARCH 57
RIL carried out several projects for managing its—(1) environmental impact, (2) air emissions,
(3) water consumption and recycling, (4) waste, (5) energy efficiency and (6) renewable and
alternate energy.
Exhibit 22: RIL’s key environment conservation activities in FY2021
Source: Company, Kotak Institutional Equities
Managing environmental impact. RIL adopts a cross-business approach to reduce
environmental footprint. RIL carries out activities in relation to—(1) clean air and water,
(2) preventing soil contamination, (3) preserving biodiversity, (4) optimal utilisation of
resources and digitization of operations by utilizing technology for direct energy savings
and (5) online collaborations for reducing travel needs. RIL sourced over 2 mn bbls of
the world’s first carbon-neutral oil.
Air emissions management. RIL’s GHG emissions declined 6.2% yoy in FY2021 partly
reflecting reduced operations for the refining unit. The sharp increase in FY2020 reflected
the impact of the full year of operations for RIL’s cracker complex and stabilization of the
petcoke gasification complex at Jamnagar; nearly two-third of the increase in emissions
was on account of petcoke, which is now consumed in-house instead of being sold to
external customers. Petcoke gasification is used to maximize Hydrogen production which
is gaining ground to combat climate change and achieve de-carbonization across
industries. It significantly reduced the cost of carbon capture and utilization by fixing CO2
and converting it to value-added chemicals in a sustainable manner.
Exhibit 23: RIL's GHG emissions moderated 6.2% yoy in FY2021 GHG emissions, March fiscal year-ends, 2018-21 (mn tons, ‘000 tons)
Source: Company, Kotak Institutional Equities
Water management. Reliance has undertaken several measures to recycle water and
reduce its dependency on freshwater. In FY2021, RIL has—(1) withdrawn 219 mn kl of
water, (2) discharged 33 mn kl and (3) recycled 99 mn kl.
Waste management
Circular economy. In the short term, RIL focuses on increasing the company’s PET
recycling footprint and usage of Multi-layered Plastics (MLP) for road construction. In
the medium term, it is focusing on polyolefin recycling and ‘waste to oil’ strategy. In
the long term, the company is looking at chemical recycling, plastic waste composites
and design for circularity. RIL plans to more than double its recycling capacity to ~5 bn
PET bottles/year. In FY2021, RIL has recycled ~2.3 bn PET bottles.
Areas Key developments in FY2021
Managing environmental impact RIL sourced over 2 mn bbls of the world's first carbon neutral oil
Air emissions management GHG emissions moderated 6.2% yoy
Water management Recycled 99 mn kiloliters of water out of 219 mn kl withdrawn
Waste management Recycled ~2.3 bn PET bottles
Energy efficiency Energy savings of 5.15 mn GJ
Renewable and alternative energy Sourced 0.69 mn GJ of energy from renewable sources
2018 2019 2020 2021
GHG Emissions
Scope 1 CO2 (mn ton) 31.5 29.7 47.5 44.7
Scope 2 CO2 (mn ton) 0.8 1.1 1.5 1.3
TPM ('000 ton) 3.0 2.3 1.9 2.0
Sox ('000 ton) 22.3 22.6 22.5 21.6
Nox ('000 ton) 36.7 34.4 42.0 39.9
VOC ('000 ton) 42.9 41.9 46.2 41.3
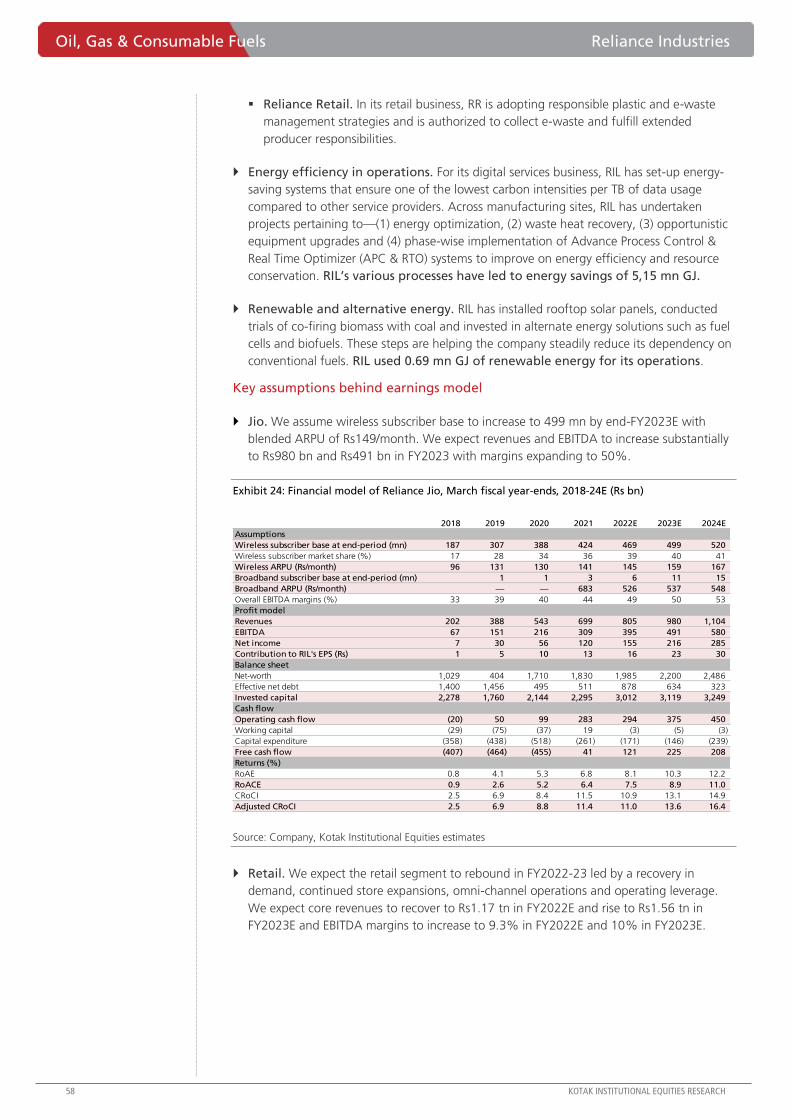
Oil, Gas & Consumable Fuels Reliance Industries
58 KOTAK INSTITUTIONAL EQUITIES RESEARCH
Reliance Retail. In its retail business, RR is adopting responsible plastic and e-waste
management strategies and is authorized to collect e-waste and fulfill extended
producer responsibilities.
Energy efficiency in operations. For its digital services business, RIL has set-up energy-
saving systems that ensure one of the lowest carbon intensities per TB of data usage
compared to other service providers. Across manufacturing sites, RIL has undertaken
projects pertaining to—(1) energy optimization, (2) waste heat recovery, (3) opportunistic
equipment upgrades and (4) phase-wise implementation of Advance Process Control &
Real Time Optimizer (APC & RTO) systems to improve on energy efficiency and resource
conservation. RIL’s various processes have led to energy savings of 5,15 mn GJ.
Renewable and alternative energy. RIL has installed rooftop solar panels, conducted
trials of co-firing biomass with coal and invested in alternate energy solutions such as fuel
cells and biofuels. These steps are helping the company steadily reduce its dependency on
conventional fuels. RIL used 0.69 mn GJ of renewable energy for its operations.
Key assumptions behind earnings model
Jio. We assume wireless subscriber base to increase to 499 mn by end-FY2023E with
blended ARPU of Rs149/month. We expect revenues and EBITDA to increase substantially
to Rs980 bn and Rs491 bn in FY2023 with margins expanding to 50%.
Exhibit 24: Financial model of Reliance Jio, March fiscal year-ends, 2018-24E (Rs bn)
Source: Company, Kotak Institutional Equities estimates
Retail. We expect the retail segment to rebound in FY2022-23 led by a recovery in
demand, continued store expansions, omni-channel operations and operating leverage.
We expect core revenues to recover to Rs1.17 tn in FY2022E and rise to Rs1.56 tn in
FY2023E and EBITDA margins to increase to 9.3% in FY2022E and 10% in FY2023E.
2018 2019 2020 2021 2022E 2023E 2024E
Assumptions
Wireless subscriber base at end-period (mn) 187 307 388 424 469 499 520
Wireless subscriber market share (%) 17 28 34 36 39 40 41
Wireless ARPU (Rs/month) 96 131 130 141 145 159 167
Broadband subscriber base at end-period (mn) 1 1 3 6 11 15
Broadband ARPU (Rs/month) — — 683 526 537 548
Overall EBITDA margins (%) 33 39 40 44 49 50 53
Profit model
Revenues 202 388 543 699 805 980 1,104
EBITDA 67 151 216 309 395 491 580
Net income 7 30 56 120 155 216 285
Contribution to RIL's EPS (Rs) 1 5 10 13 16 23 30
Balance sheet
Net-worth 1,029 404 1,710 1,830 1,985 2,200 2,486
Effective net debt 1,400 1,456 495 511 878 634 323
Invested capital 2,278 1,760 2,144 2,295 3,012 3,119 3,249
Cash flow
Operating cash flow (20) 50 99 283 294 375 450
Working capital (29) (75) (37) 19 (3) (5) (3)
Capital expenditure (358) (438) (518) (261) (171) (146) (239)
Free cash flow (407) (464) (455) 41 121 225 208
Returns (%)
RoAE 0.8 4.1 5.3 6.8 8.1 10.3 12.2
RoACE 0.9 2.6 5.2 6.4 7.5 8.9 11.0
CRoCI 2.5 6.9 8.4 11.5 10.9 13.1 14.9
Adjusted CRoCI 2.5 6.9 8.8 11.4 11.0 13.6 16.4
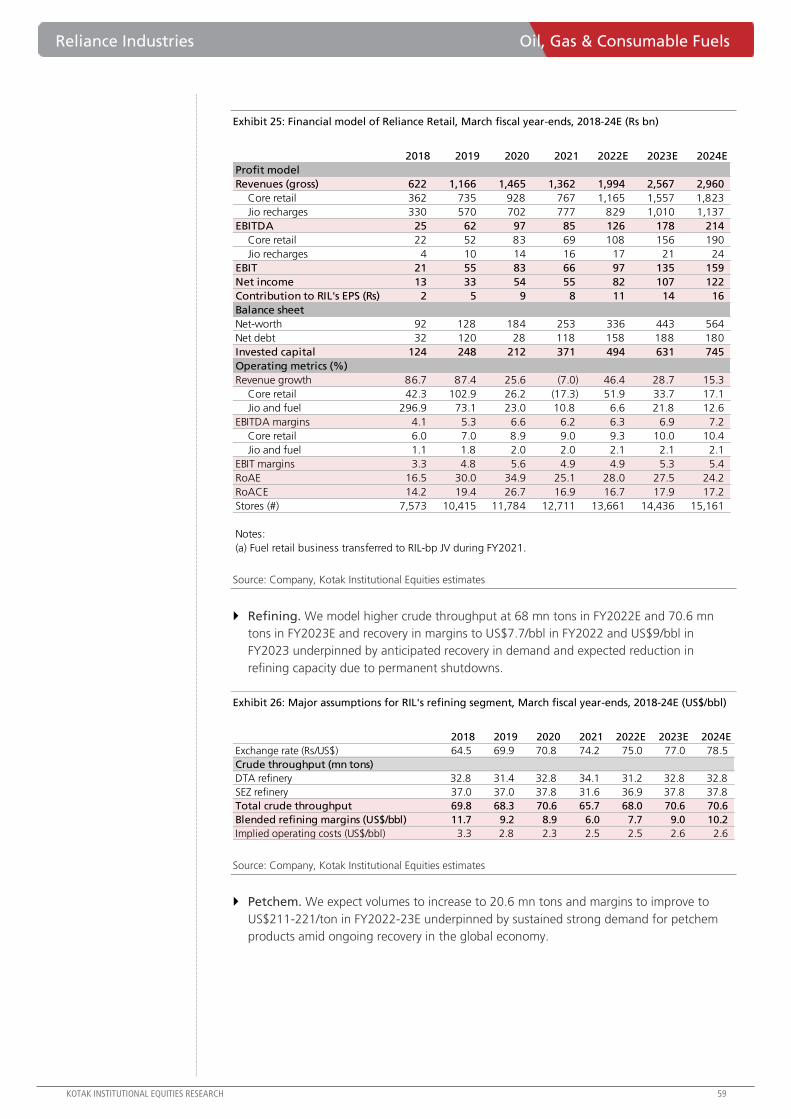
Reliance Industries Oil, Gas & Consumable Fuels
KOTAK INSTITUTIONAL EQUITIES RESEARCH 59
Exhibit 25: Financial model of Reliance Retail, March fiscal year-ends, 2018-24E (Rs bn)
Source: Company, Kotak Institutional Equities estimates
Refining. We model higher crude throughput at 68 mn tons in FY2022E and 70.6 mn
tons in FY2023E and recovery in margins to US$7.7/bbl in FY2022 and US$9/bbl in
FY2023 underpinned by anticipated recovery in demand and expected reduction in
refining capacity due to permanent shutdowns.
Exhibit 26: Major assumptions for RIL's refining segment, March fiscal year-ends, 2018-24E (US$/bbl)
Source: Company, Kotak Institutional Equities estimates
Petchem. We expect volumes to increase to 20.6 mn tons and margins to improve to
US$211-221/ton in FY2022-23E underpinned by sustained strong demand for petchem
products amid ongoing recovery in the global economy.
2018 2019 2020 2021 2022E 2023E 2024E
Profit model
Revenues (gross) 622 1,166 1,465 1,362 1,994 2,567 2,960
Core retail 362 735 928 767 1,165 1,557 1,823
Jio recharges 330 570 702 777 829 1,010 1,137
EBITDA 25 62 97 85 126 178 214
Core retail 22 52 83 69 108 156 190
Jio recharges 4 10 14 16 17 21 24
EBIT 21 55 83 66 97 135 159
Net income 13 33 54 55 82 107 122
Contribution to RIL's EPS (Rs) 2 5 9 8 11 14 16
Balance sheet
Net-worth 92 128 184 253 336 443 564
Net debt 32 120 28 118 158 188 180
Invested capital 124 248 212 371 494 631 745
Operating metrics (%)
Revenue growth 86.7 87.4 25.6 (7.0) 46.4 28.7 15.3
Core retail 42.3 102.9 26.2 (17.3) 51.9 33.7 17.1
Jio and fuel 296.9 73.1 23.0 10.8 6.6 21.8 12.6
EBITDA margins 4.1 5.3 6.6 6.2 6.3 6.9 7.2
Core retail 6.0 7.0 8.9 9.0 9.3 10.0 10.4
Jio and fuel 1.1 1.8 2.0 2.0 2.1 2.1 2.1
EBIT margins 3.3 4.8 5.6 4.9 4.9 5.3 5.4
RoAE 16.5 30.0 34.9 25.1 28.0 27.5 24.2
RoACE 14.2 19.4 26.7 16.9 16.7 17.9 17.2
Stores (#) 7,573 10,415 11,784 12,711 13,661 14,436 15,161
Notes:
(a) Fuel retail business transferred to RIL-bp JV during FY2021.
2018 2019 2020 2021 2022E 2023E 2024E
Exchange rate (Rs/US$) 64.5 69.9 70.8 74.2 75.0 77.0 78.5
Crude throughput (mn tons)
DTA refinery 32.8 31.4 32.8 34.1 31.2 32.8 32.8
SEZ refinery 37.0 37.0 37.8 31.6 36.9 37.8 37.8
Total crude throughput 69.8 68.3 70.6 65.7 68.0 70.6 70.6
Blended refining margins (US$/bbl) 11.7 9.2 8.9 6.0 7.7 9.0 10.2
Implied operating costs (US$/bbl) 3.3 2.8 2.3 2.5 2.5 2.6 2.6
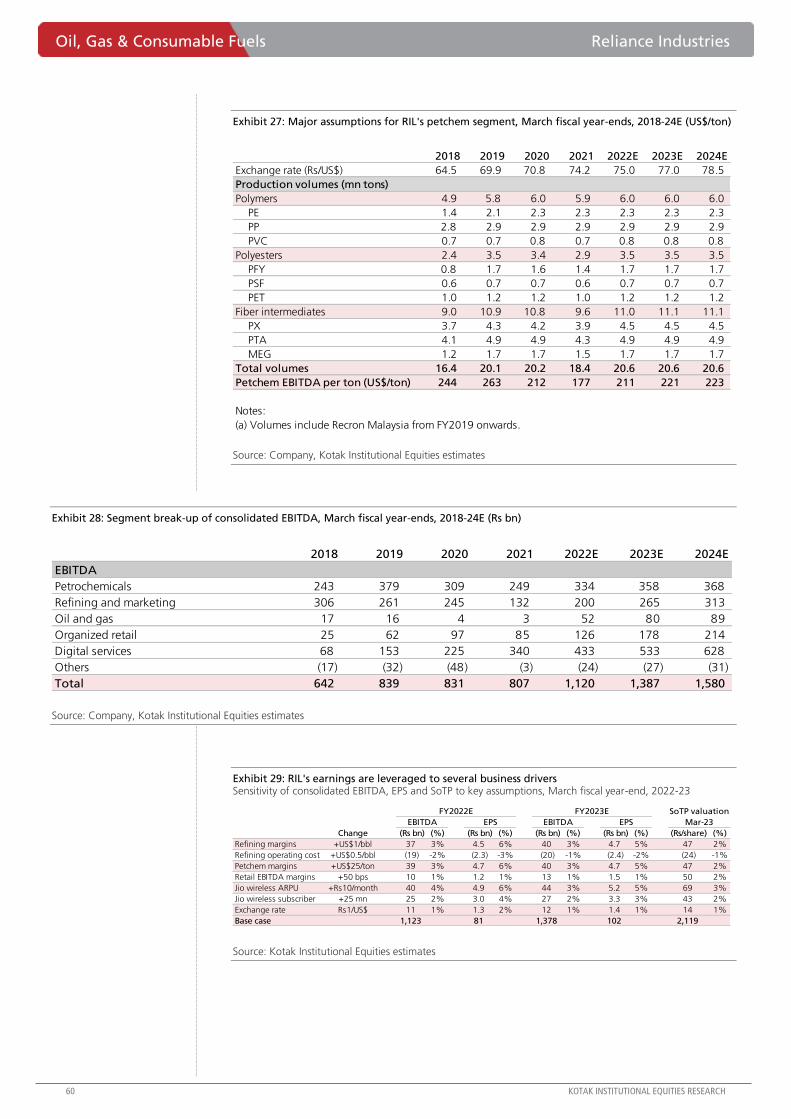
Oil, Gas & Consumable Fuels Reliance Industries
60 KOTAK INSTITUTIONAL EQUITIES RESEARCH
Exhibit 27: Major assumptions for RIL's petchem segment, March fiscal year-ends, 2018-24E (US$/ton)
Source: Company, Kotak Institutional Equities estimates
Exhibit 28: Segment break-up of consolidated EBITDA, March fiscal year-ends, 2018-24E (Rs bn)
Source: Company, Kotak Institutional Equities estimates
Exhibit 29: RIL's earnings are leveraged to several business drivers Sensitivity of consolidated EBITDA, EPS and SoTP to key assumptions, March fiscal year-end, 2022-23
Source: Kotak Institutional Equities estimates
2018 2019 2020 2021 2022E 2023E 2024E
Exchange rate (Rs/US$) 64.5 69.9 70.8 74.2 75.0 77.0 78.5
Production volumes (mn tons)
Polymers 4.9 5.8 6.0 5.9 6.0 6.0 6.0
PE 1.4 2.1 2.3 2.3 2.3 2.3 2.3
PP 2.8 2.9 2.9 2.9 2.9 2.9 2.9
PVC 0.7 0.7 0.8 0.7 0.8 0.8 0.8
Polyesters 2.4 3.5 3.4 2.9 3.5 3.5 3.5
PFY 0.8 1.7 1.6 1.4 1.7 1.7 1.7
PSF 0.6 0.7 0.7 0.6 0.7 0.7 0.7
PET 1.0 1.2 1.2 1.0 1.2 1.2 1.2
Fiber intermediates 9.0 10.9 10.8 9.6 11.0 11.1 11.1
PX 3.7 4.3 4.2 3.9 4.5 4.5 4.5
PTA 4.1 4.9 4.9 4.3 4.9 4.9 4.9
MEG 1.2 1.7 1.7 1.5 1.7 1.7 1.7
Total volumes 16.4 20.1 20.2 18.4 20.6 20.6 20.6
Petchem EBITDA per ton (US$/ton) 244 263 212 177 211 221 223
Notes:
(a) Volumes include Recron Malaysia from FY2019 onwards.
2018 2019 2020 2021 2022E 2023E 2024E
EBITDA
Petrochemicals 243 379 309 249 334 358 368
Refining and marketing 306 261 245 132 200 265 313
Oil and gas 17 16 4 3 52 80 89
Organized retail 25 62 97 85 126 178 214
Digital services 68 153 225 340 433 533 628
Others (17) (32) (48) (3) (24) (27) (31)
Total 642 839 831 807 1,120 1,387 1,580
FY2022E FY2023E
Change (Rs bn) (%) (Rs bn) (%) (Rs bn) (%) (Rs bn) (%) (Rs/share) (%)
Refining margins +US$1/bbl 37 3% 4.5 6% 40 3% 4.7 5% 47 2%
Refining operating cost +US$0.5/bbl (19) -2% (2.3) -3% (20) -1% (2.4) -2% (24) -1%
Petchem margins +US$25/ton 39 3% 4.7 6% 40 3% 4.7 5% 47 2%
Retail EBITDA margins +50 bps 10 1% 1.2 1% 13 1% 1.5 1% 50 2%
Jio wireless ARPU +Rs10/month 40 4% 4.9 6% 44 3% 5.2 5% 69 3%
Jio wireless subscriber +25 mn 25 2% 3.0 4% 27 2% 3.3 3% 43 2%
Exchange rate Rs1/US$ 11 1% 1.3 2% 12 1% 1.4 1% 14 1%
Base case 1,123 81 1,378 102 2,119
SoTP valuation
EBITDA EPS EBITDA EPS Mar-23
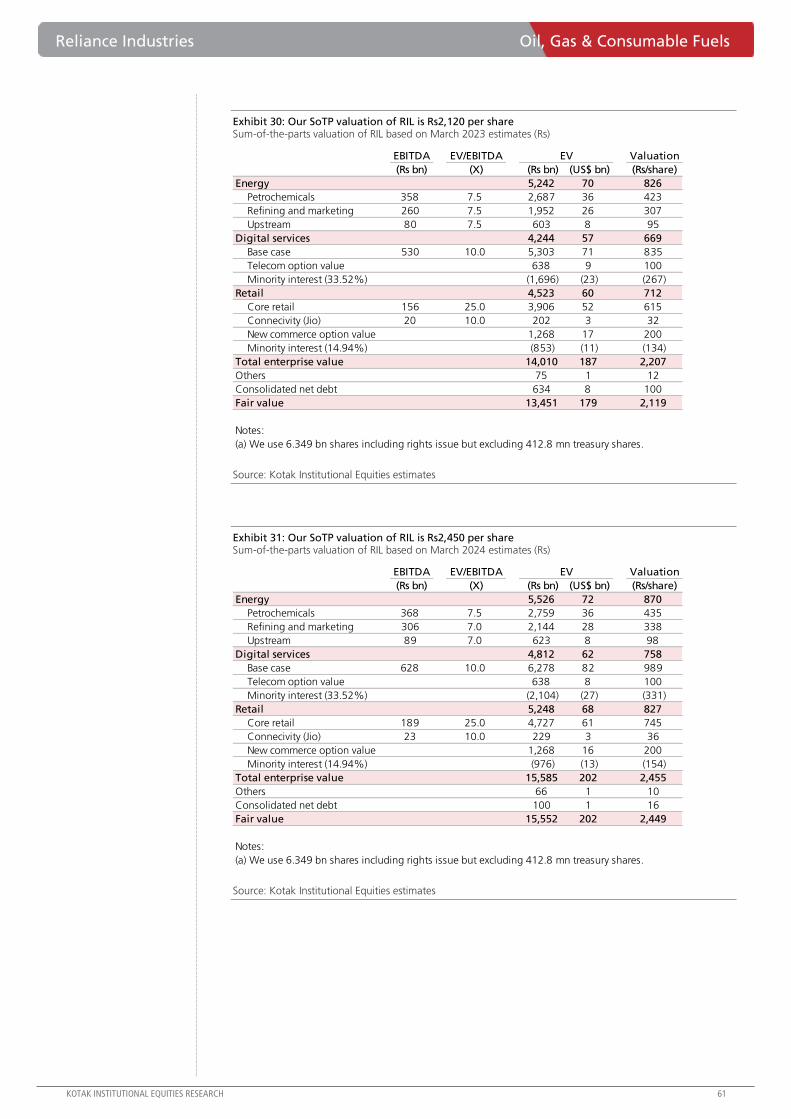
Reliance Industries Oil, Gas & Consumable Fuels
KOTAK INSTITUTIONAL EQUITIES RESEARCH 61
Exhibit 30: Our SoTP valuation of RIL is Rs2,120 per share Sum-of-the-parts valuation of RIL based on March 2023 estimates (Rs)
Source: Kotak Institutional Equities estimates
Exhibit 31: Our SoTP valuation of RIL is Rs2,450 per share Sum-of-the-parts valuation of RIL based on March 2024 estimates (Rs)
Source: Kotak Institutional Equities estimates
EBITDA EV/EBITDA EV Valuation
(Rs bn) (X) (Rs bn) (US$ bn) (Rs/share)
Energy 5,242 70 826
Petrochemicals 358 7.5 2,687 36 423
Refining and marketing 260 7.5 1,952 26 307
Upstream 80 7.5 603 8 95
Digital services 4,244 57 669
Base case 530 10.0 5,303 71 835
Telecom option value 638 9 100
Minority interest (33.52%) (1,696) (23) (267)
Retail 4,523 60 712
Core retail 156 25.0 3,906 52 615
Connecivity (Jio) 20 10.0 202 3 32
New commerce option value 1,268 17 200
Minority interest (14.94%) (853) (11) (134)
Total enterprise value 14,010 187 2,207
Others 75 1 12
Consolidated net debt 634 8 100
Fair value 13,451 179 2,119
Notes:
(a) We use 6.349 bn shares including rights issue but excluding 412.8 mn treasury shares.
EBITDA EV/EBITDA EV Valuation
(Rs bn) (X) (Rs bn) (US$ bn) (Rs/share)
Energy 5,526 72 870
Petrochemicals 368 7.5 2,759 36 435
Refining and marketing 306 7.0 2,144 28 338
Upstream 89 7.0 623 8 98
Digital services 4,812 62 758
Base case 628 10.0 6,278 82 989
Telecom option value 638 8 100
Minority interest (33.52%) (2,104) (27) (331)
Retail 5,248 68 827
Core retail 189 25.0 4,727 61 745
Connecivity (Jio) 23 10.0 229 3 36
New commerce option value 1,268 16 200
Minority interest (14.94%) (976) (13) (154)
Total enterprise value 15,585 202 2,455
Others 66 1 10
Consolidated net debt 100 1 16
Fair value 15,552 202 2,449
Notes:
(a) We use 6.349 bn shares including rights issue but excluding 412.8 mn treasury shares.
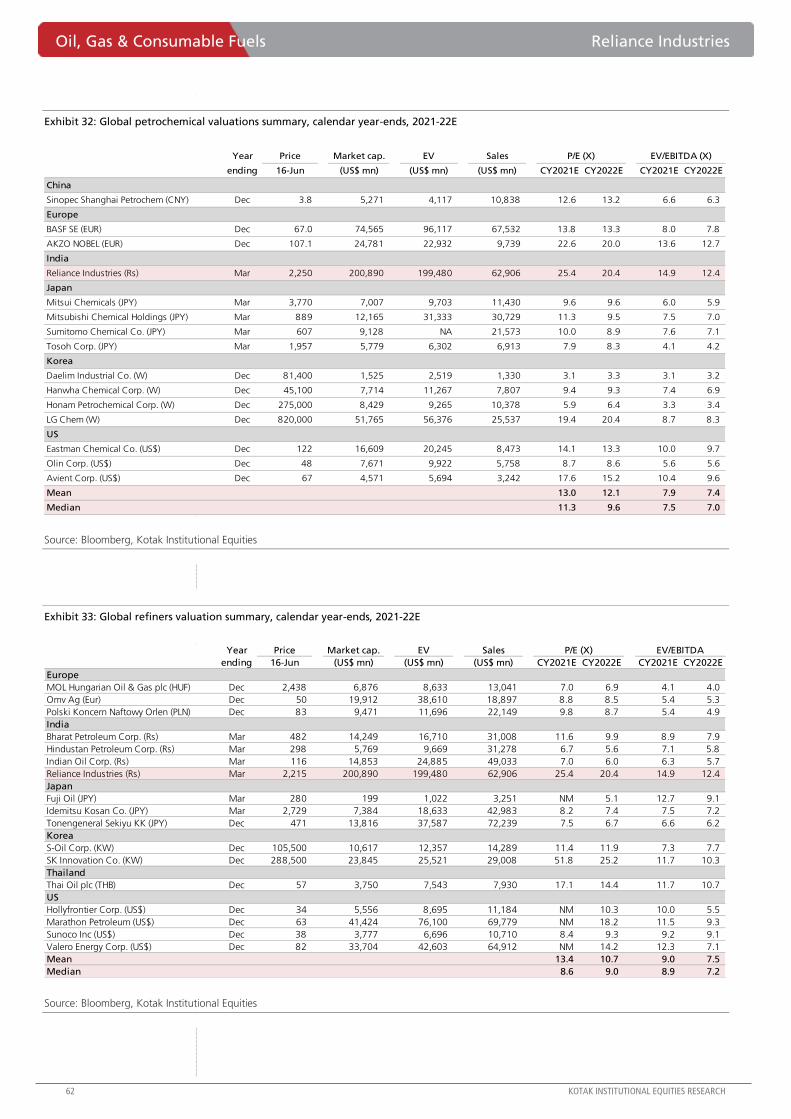
Oil, Gas & Consumable Fuels Reliance Industries
62 KOTAK INSTITUTIONAL EQUITIES RESEARCH
Exhibit 32: Global petrochemical valuations summary, calendar year-ends, 2021-22E
Source: Bloomberg, Kotak Institutional Equities
Exhibit 33: Global refiners valuation summary, calendar year-ends, 2021-22E
Source: Bloomberg, Kotak Institutional Equities
Year Price Market cap. EV Sales P/E (X) EV/EBITDA (X)
ending 16-Jun (US$ mn) (US$ mn) (US$ mn) CY2021E CY2022E CY2021E CY2022E
China
Sinopec Shanghai Petrochem (CNY) Dec 3.8 5,271 4,117 10,838 12.6 13.2 6.6 6.3
Europe
BASF SE (EUR) Dec 67.0 74,565 96,117 67,532 13.8 13.3 8.0 7.8
AKZO NOBEL (EUR) Dec 107.1 24,781 22,932 9,739 22.6 20.0 13.6 12.7
India
Reliance Industries (Rs) Mar 2,250 200,890 199,480 62,906 25.4 20.4 14.9 12.4
Japan
Mitsui Chemicals (JPY) Mar 3,770 7,007 9,703 11,430 9.6 9.6 6.0 5.9
Mitsubishi Chemical Holdings (JPY) Mar 889 12,165 31,333 30,729 11.3 9.5 7.5 7.0
Sumitomo Chemical Co. (JPY) Mar 607 9,128 NA 21,573 10.0 8.9 7.6 7.1
Tosoh Corp. (JPY) Mar 1,957 5,779 6,302 6,913 7.9 8.3 4.1 4.2
Korea
Daelim Industrial Co. (W) Dec 81,400 1,525 2,519 1,330 3.1 3.3 3.1 3.2
Hanwha Chemical Corp. (W) Dec 45,100 7,714 11,267 7,807 9.4 9.3 7.4 6.9
Honam Petrochemical Corp. (W) Dec 275,000 8,429 9,265 10,378 5.9 6.4 3.3 3.4
LG Chem (W) Dec 820,000 51,765 56,376 25,537 19.4 20.4 8.7 8.3
US
Eastman Chemical Co. (US$) Dec 122 16,609 20,245 8,473 14.1 13.3 10.0 9.7
Olin Corp. (US$) Dec 48 7,671 9,922 5,758 8.7 8.6 5.6 5.6
Avient Corp. (US$) Dec 67 4,571 5,694 3,242 17.6 15.2 10.4 9.6
Mean 13.0 12.1 7.9 7.4
Median 11.3 9.6 7.5 7.0
Year Price Market cap. EV Sales P/E (X) EV/EBITDA
ending 16-Jun (US$ mn) (US$ mn) (US$ mn) CY2021E CY2022E CY2021E CY2022E
Europe
MOL Hungarian Oil & Gas plc (HUF) Dec 2,438 6,876 8,633 13,041 7.0 6.9 4.1 4.0
Omv Ag (Eur) Dec 50 19,912 38,610 18,897 8.8 8.5 5.4 5.3
Polski Koncern Naftowy Orlen (PLN) Dec 83 9,471 11,696 22,149 9.8 8.7 5.4 4.9
India
Bharat Petroleum Corp. (Rs) Mar 482 14,249 16,710 31,008 11.6 9.9 8.9 7.9
Hindustan Petroleum Corp. (Rs) Mar 298 5,769 9,669 31,278 6.7 5.6 7.1 5.8
Indian Oil Corp. (Rs) Mar 116 14,853 24,885 49,033 7.0 6.0 6.3 5.7
Reliance Industries (Rs) Mar 2,215 200,890 199,480 62,906 25.4 20.4 14.9 12.4
Japan
Fuji Oil (JPY) Mar 280 199 1,022 3,251 NM 5.1 12.7 9.1
Idemitsu Kosan Co. (JPY) Mar 2,729 7,384 18,633 42,983 8.2 7.4 7.5 7.2
Tonengeneral Sekiyu KK (JPY) Dec 471 13,816 37,587 72,239 7.5 6.7 6.6 6.2
Korea
S-Oil Corp. (KW) Dec 105,500 10,617 12,357 14,289 11.4 11.9 7.3 7.7
SK Innovation Co. (KW) Dec 288,500 23,845 25,521 29,008 51.8 25.2 11.7 10.3
Thailand
Thai Oil plc (THB) Dec 57 3,750 7,543 7,930 17.1 14.4 11.7 10.7
US
Hollyfrontier Corp. (US$) Dec 34 5,556 8,695 11,184 NM 10.3 10.0 5.5
Marathon Petroleum (US$) Dec 63 41,424 76,100 69,779 NM 18.2 11.5 9.3
Sunoco Inc (US$) Dec 38 3,777 6,696 10,710 8.4 9.3 9.2 9.1
Valero Energy Corp. (US$) Dec 82 33,704 42,603 64,912 NM 14.2 12.3 7.1
Mean 13.4 10.7 9.0 7.5
Median 8.6 9.0 8.9 7.2
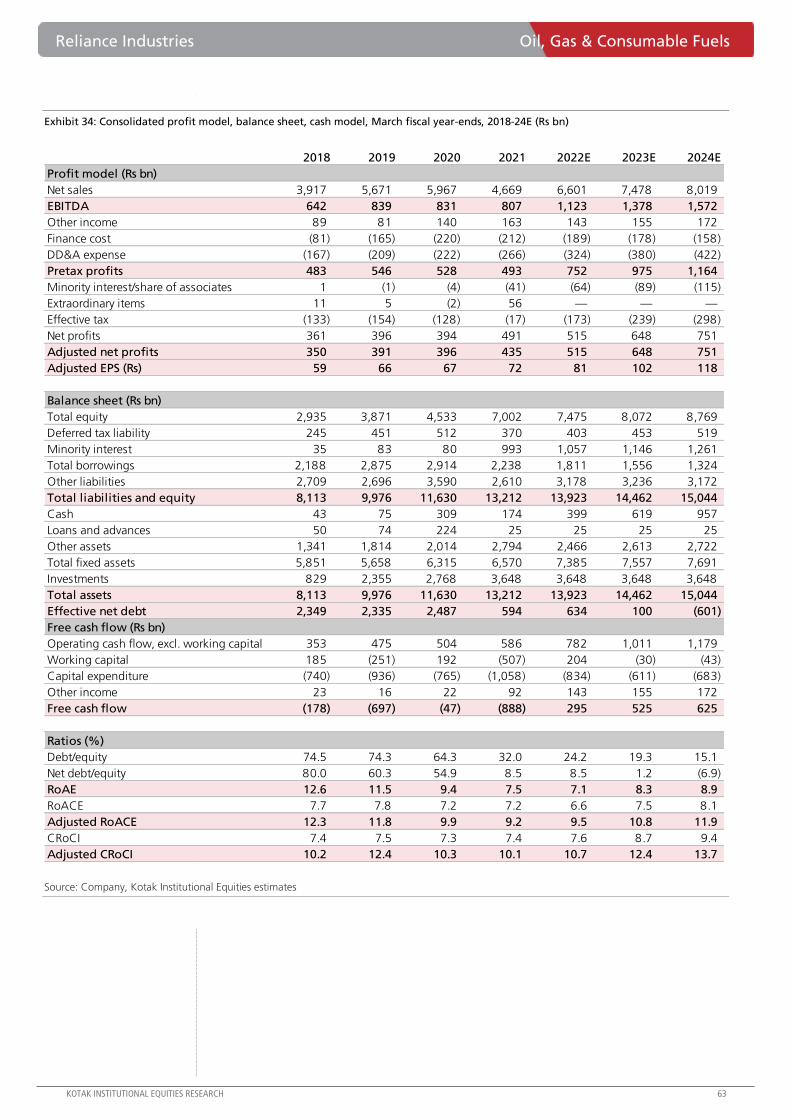
Reliance Industries Oil, Gas & Consumable Fuels
KOTAK INSTITUTIONAL EQUITIES RESEARCH 63
Exhibit 34: Consolidated profit model, balance sheet, cash model, March fiscal year-ends, 2018-24E (Rs bn)
Source: Company, Kotak Institutional Equities estimates
2018 2019 2020 2021 2022E 2023E 2024E
Profit model (Rs bn)
Net sales 3,917 5,671 5,967 4,669 6,601 7,478 8,019
EBITDA 642 839 831 807 1,123 1,378 1,572
Other income 89 81 140 163 143 155 172
Finance cost (81) (165) (220) (212) (189) (178) (158)
DD&A expense (167) (209) (222) (266) (324) (380) (422)
Pretax profits 483 546 528 493 752 975 1,164
Minority interest/share of associates 1 (1) (4) (41) (64) (89) (115)
Extraordinary items 11 5 (2) 56 — — —
Effective tax (133) (154) (128) (17) (173) (239) (298)
Net profits 361 396 394 491 515 648 751
Adjusted net profits 350 391 396 435 515 648 751
Adjusted EPS (Rs) 59 66 67 72 81 102 118
Balance sheet (Rs bn)
Total equity 2,935 3,871 4,533 7,002 7,475 8,072 8,769
Deferred tax liability 245 451 512 370 403 453 519
Minority interest 35 83 80 993 1,057 1,146 1,261
Total borrowings 2,188 2,875 2,914 2,238 1,811 1,556 1,324
Other liabilities 2,709 2,696 3,590 2,610 3,178 3,236 3,172
Total liabilities and equity 8,113 9,976 11,630 13,212 13,923 14,462 15,044
Cash 43 75 309 174 399 619 957
Loans and advances 50 74 224 25 25 25 25
Other assets 1,341 1,814 2,014 2,794 2,466 2,613 2,722
Total fixed assets 5,851 5,658 6,315 6,570 7,385 7,557 7,691
Investments 829 2,355 2,768 3,648 3,648 3,648 3,648
Total assets 8,113 9,976 11,630 13,212 13,923 14,462 15,044
Effective net debt 2,349 2,335 2,487 594 634 100 (601)
Free cash flow (Rs bn)
Operating cash flow, excl. working capital 353 475 504 586 782 1,011 1,179
Working capital 185 (251) 192 (507) 204 (30) (43)
Capital expenditure (740) (936) (765) (1,058) (834) (611) (683)
Other income 23 16 22 92 143 155 172
Free cash flow (178) (697) (47) (888) 295 525 625
Ratios (%)
Debt/equity 74.5 74.3 64.3 32.0 24.2 19.3 15.1
Net debt/equity 80.0 60.3 54.9 8.5 8.5 1.2 (6.9)
RoAE 12.6 11.5 9.4 7.5 7.1 8.3 8.9
RoACE 7.7 7.8 7.2 7.2 6.6 7.5 8.1
Adjusted RoACE 12.3 11.8 9.9 9.2 9.5 10.8 11.9
CRoCI 7.4 7.5 7.3 7.4 7.6 8.7 9.4
Adjusted CRoCI 10.2 12.4 10.3 10.1 10.7 12.4 13.7
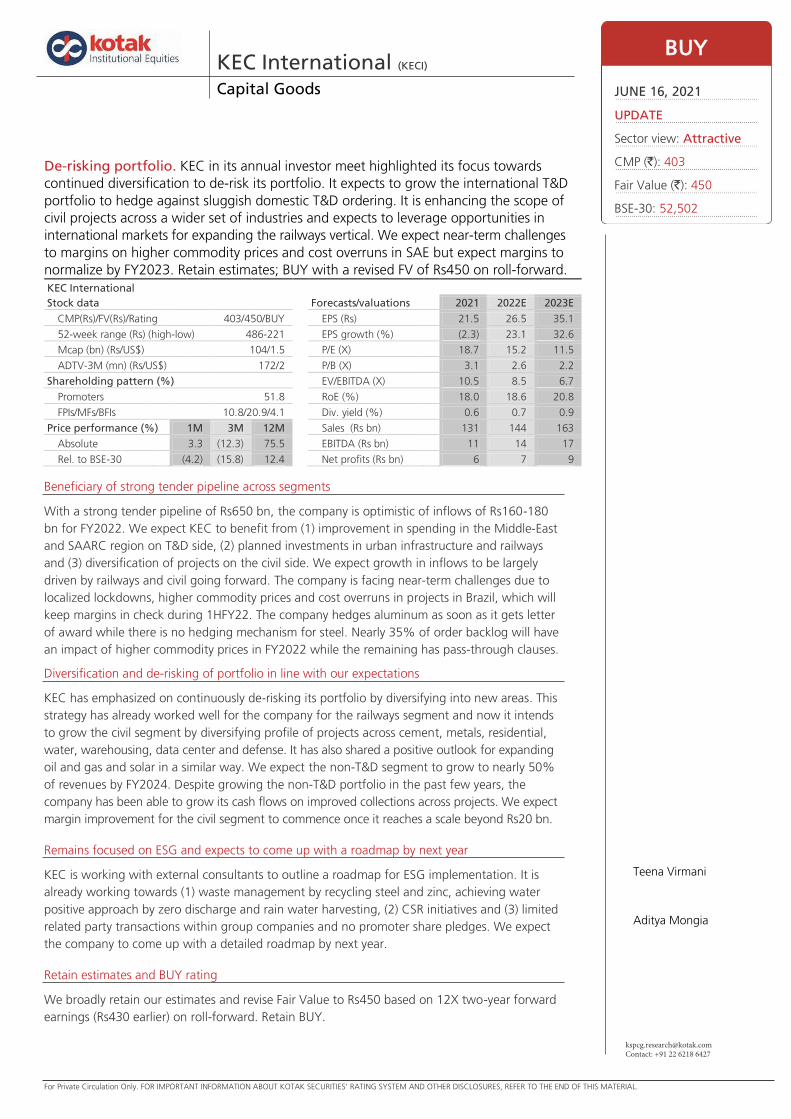
For Private Circulation Only. FOR IMPORTANT INFORMATION ABOUT KOTAK SECURITIES’ RATING SYSTEM AND OTHER DISCLOSURES, REFER TO THE END OF THIS MATERIAL.
[email protected]: +91 22 6218 6427
Beneficiary of strong tender pipeline across segments
With a strong tender pipeline of Rs650 bn, the company is optimistic of inflows of Rs160-180
bn for FY2022. We expect KEC to benefit from (1) improvement in spending in the Middle-East
and SAARC region on T&D side, (2) planned investments in urban infrastructure and railways
and (3) diversification of projects on the civil side. We expect growth in inflows to be largely
driven by railways and civil going forward. The company is facing near-term challenges due to
localized lockdowns, higher commodity prices and cost overruns in projects in Brazil, which will
keep margins in check during 1HFY22. The company hedges aluminum as soon as it gets letter
of award while there is no hedging mechanism for steel. Nearly 35% of order backlog will have
an impact of higher commodity prices in FY2022 while the remaining has pass-through clauses.
Diversification and de-risking of portfolio in line with our expectations
KEC has emphasized on continuously de-risking its portfolio by diversifying into new areas. This
strategy has already worked well for the company for the railways segment and now it intends
to grow the civil segment by diversifying profile of projects across cement, metals, residential,
water, warehousing, data center and defense. It has also shared a positive outlook for expanding
oil and gas and solar in a similar way. We expect the non-T&D segment to grow to nearly 50%
of revenues by FY2024. Despite growing the non-T&D portfolio in the past few years, the
company has been able to grow its cash flows on improved collections across projects. We expect
margin improvement for the civil segment to commence once it reaches a scale beyond Rs20 bn.
Remains focused on ESG and expects to come up with a roadmap by next year
KEC is working with external consultants to outline a roadmap for ESG implementation. It is
already working towards (1) waste management by recycling steel and zinc, achieving water
positive approach by zero discharge and rain water harvesting, (2) CSR initiatives and (3) limited
related party transactions within group companies and no promoter share pledges. We expect
the company to come up with a detailed roadmap by next year.
Retain estimates and BUY rating
We broadly retain our estimates and revise Fair Value to Rs450 based on 12X two-year forward
earnings (Rs430 earlier) on roll-forward. Retain BUY.
https://ultraviewer.et/en/ownload.html
KEC International (KECI) Capital Goods
De-risking portfolio. KEC in its annual investor meet highlighted its focus towards
continued diversification to de-risk its portfolio. It expects to grow the international T&D
portfolio to hedge against sluggish domestic T&D ordering. It is enhancing the scope of
civil projects across a wider set of industries and expects to leverage opportunities in
international markets for expanding the railways vertical. We expect near-term challenges
to margins on higher commodity prices and cost overruns in SAE but expect margins to
normalize by FY2023. Retain estimates; BUY with a revised FV of Rs450 on roll-forward.
KEC International
Stock data Forecasts/valuations 2021 2022E 2023E
CMP(Rs)/FV(Rs)/Rating 403/450/BUY EPS (Rs) 21.5 26.5 35.1
52-week range (Rs) (high-low) 486-221 EPS growth (%) (2.3) 23.1 32.6
Mcap (bn) (Rs/US$) 104/1.5 P/E (X) 18.7 15.2 11.5
ADTV-3M (mn) (Rs/US$) 172/2 P/B (X) 3.1 2.6 2.2
Shareholding pattern (%) EV/EBITDA (X) 10.5 8.5 6.7
Promoters 51.8 RoE (%) 18.0 18.6 20.8
FPIs/MFs/BFIs 10.8/20.9/4.1 Div. yield (%) 0.6 0.7 0.9
Price performance (%) 1M 3M 12M Sales (Rs bn) 131 144 163
Absolute 3.3 (12.3) 75.5 EBITDA (Rs bn) 11 14 17
Rel. to BSE-30 (4.2) (15.8) 12.4 Net profits (Rs bn) 6 7 9
BUY
JUNE 16, 2021
UPDATE
Sector view: Attractive
CMP (`): 403
Fair Value (`): 450
BSE-30: 52,502
Teena Virmani
Aditya Mongia
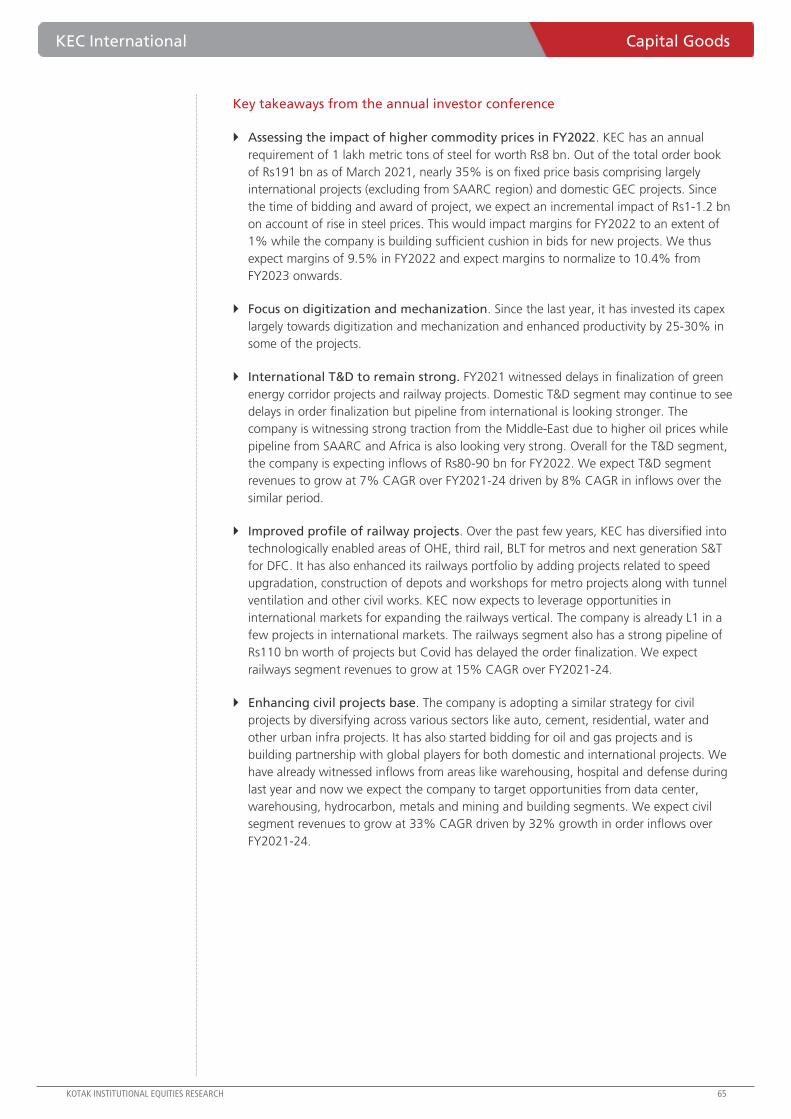
KEC International Capital Goods
KOTAK INSTITUTIONAL EQUITIES RESEARCH 65
Key takeaways from the annual investor conference
Assessing the impact of higher commodity prices in FY2022. KEC has an annual
requirement of 1 lakh metric tons of steel for worth Rs8 bn. Out of the total order book
of Rs191 bn as of March 2021, nearly 35% is on fixed price basis comprising largely
international projects (excluding from SAARC region) and domestic GEC projects. Since
the time of bidding and award of project, we expect an incremental impact of Rs1-1.2 bn
on account of rise in steel prices. This would impact margins for FY2022 to an extent of
1% while the company is building sufficient cushion in bids for new projects. We thus
expect margins of 9.5% in FY2022 and expect margins to normalize to 10.4% from
FY2023 onwards.
Focus on digitization and mechanization. Since the last year, it has invested its capex
largely towards digitization and mechanization and enhanced productivity by 25-30% in
some of the projects.
International T&D to remain strong. FY2021 witnessed delays in finalization of green
energy corridor projects and railway projects. Domestic T&D segment may continue to see
delays in order finalization but pipeline from international is looking stronger. The
company is witnessing strong traction from the Middle-East due to higher oil prices while
pipeline from SAARC and Africa is also looking very strong. Overall for the T&D segment,
the company is expecting inflows of Rs80-90 bn for FY2022. We expect T&D segment
revenues to grow at 7% CAGR over FY2021-24 driven by 8% CAGR in inflows over the
similar period.
Improved profile of railway projects. Over the past few years, KEC has diversified into
technologically enabled areas of OHE, third rail, BLT for metros and next generation S&T
for DFC. It has also enhanced its railways portfolio by adding projects related to speed
upgradation, construction of depots and workshops for metro projects along with tunnel
ventilation and other civil works. KEC now expects to leverage opportunities in
international markets for expanding the railways vertical. The company is already L1 in a
few projects in international markets. The railways segment also has a strong pipeline of
Rs110 bn worth of projects but Covid has delayed the order finalization. We expect
railways segment revenues to grow at 15% CAGR over FY2021-24.
Enhancing civil projects base. The company is adopting a similar strategy for civil
projects by diversifying across various sectors like auto, cement, residential, water and
other urban infra projects. It has also started bidding for oil and gas projects and is
building partnership with global players for both domestic and international projects. We
have already witnessed inflows from areas like warehousing, hospital and defense during
last year and now we expect the company to target opportunities from data center,
warehousing, hydrocarbon, metals and mining and building segments. We expect civil
segment revenues to grow at 33% CAGR driven by 32% growth in order inflows over
FY2021-24.
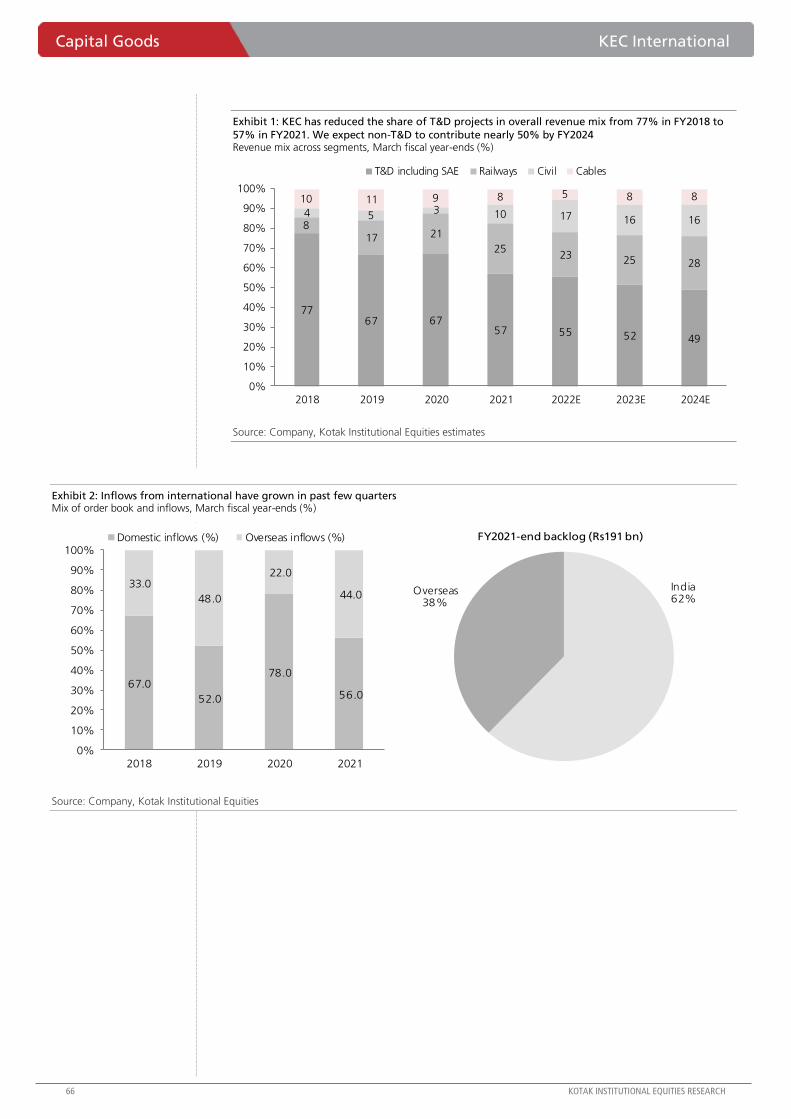
Capital Goods KEC International
66 KOTAK INSTITUTIONAL EQUITIES RESEARCH
Exhibit 1: KEC has reduced the share of T&D projects in overall revenue mix from 77% in FY2018 to
57% in FY2021. We expect non-T&D to contribute nearly 50% by FY2024 Revenue mix across segments, March fiscal year-ends (%)
Source: Company, Kotak Institutional Equities estimates
Exhibit 2: Inflows from international have grown in past few quarters Mix of order book and inflows, March fiscal year-ends (%)
Source: Company, Kotak Institutional Equities
7767 67
57 55 52 49
817 21
2523 25 28
4 53 10 17 16 16
10 11 9 8 5 8 8
0%
10%
20%
30%
40%
50%
60%
70%
80%
90%
100%
2018 2019 2020 2021 2022E 2023E 2024E
T&D including SAE Railways Civil Cables
67.0
52.0
78.0
56.0
33.0
48.0
22.0
44.0
0%
10%
20%
30%
40%
50%
60%
70%
80%
90%
100%
2018 2019 2020 2021
Domestic inflows (%) Overseas inflows (%)
India 62%
Overseas38%
FY2021-end backlog (Rs191 bn)
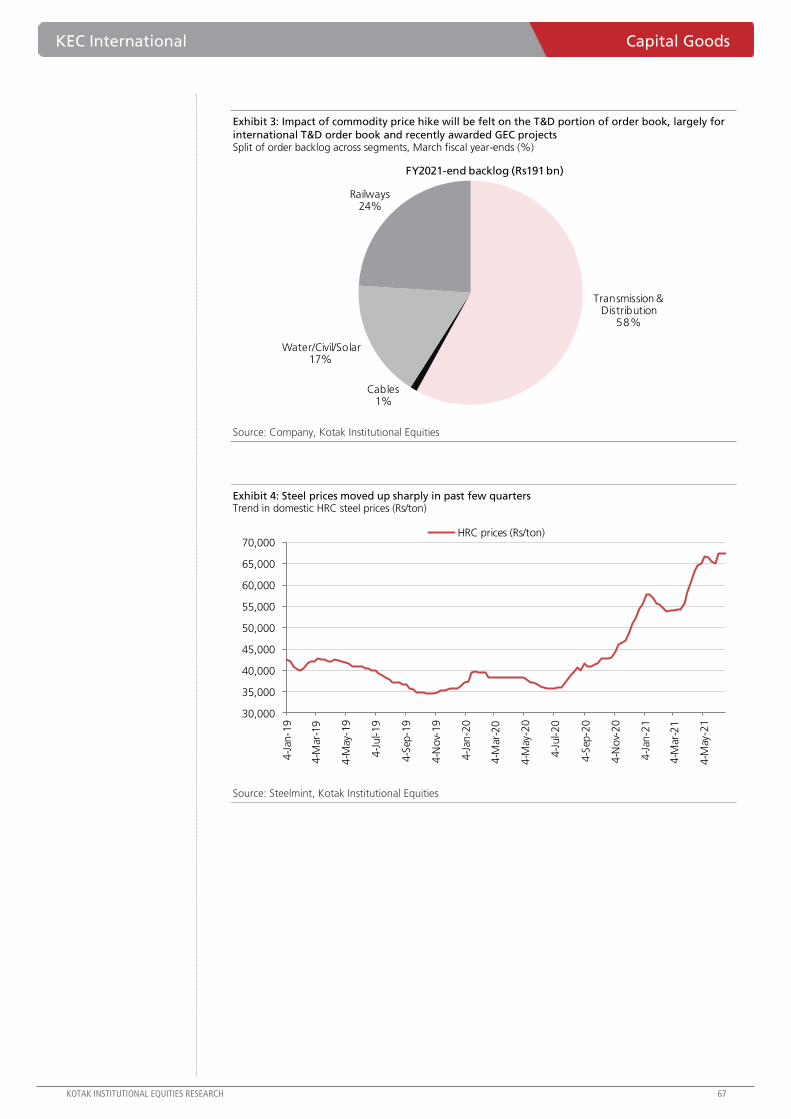
KEC International Capital Goods
KOTAK INSTITUTIONAL EQUITIES RESEARCH 67
Exhibit 3: Impact of commodity price hike will be felt on the T&D portion of order book, largely for
international T&D order book and recently awarded GEC projects Split of order backlog across segments, March fiscal year-ends (%)
Source: Company, Kotak Institutional Equities
Exhibit 4: Steel prices moved up sharply in past few quarters Trend in domestic HRC steel prices (Rs/ton)
Source: Steelmint, Kotak Institutional Equities
Transmission & Distribution
58%
Cables1%
Water/Civil/Solar17%
Railways24%
FY2021-end backlog (Rs191 bn)
30,000
35,000
40,000
45,000
50,000
55,000
60,000
65,000
70,000
4-J
an-1
9
4-M
ar-1
9
4-M
ay-1
9
4-J
ul-19
4-S
ep-1
9
4-N
ov-
19
4-J
an-2
0
4-M
ar-2
0
4-M
ay-2
0
4-J
ul-20
4-S
ep-2
0
4-N
ov-
20
4-J
an-2
1
4-M
ar-2
1
4-M
ay-2
1
HRC prices (Rs/ton)
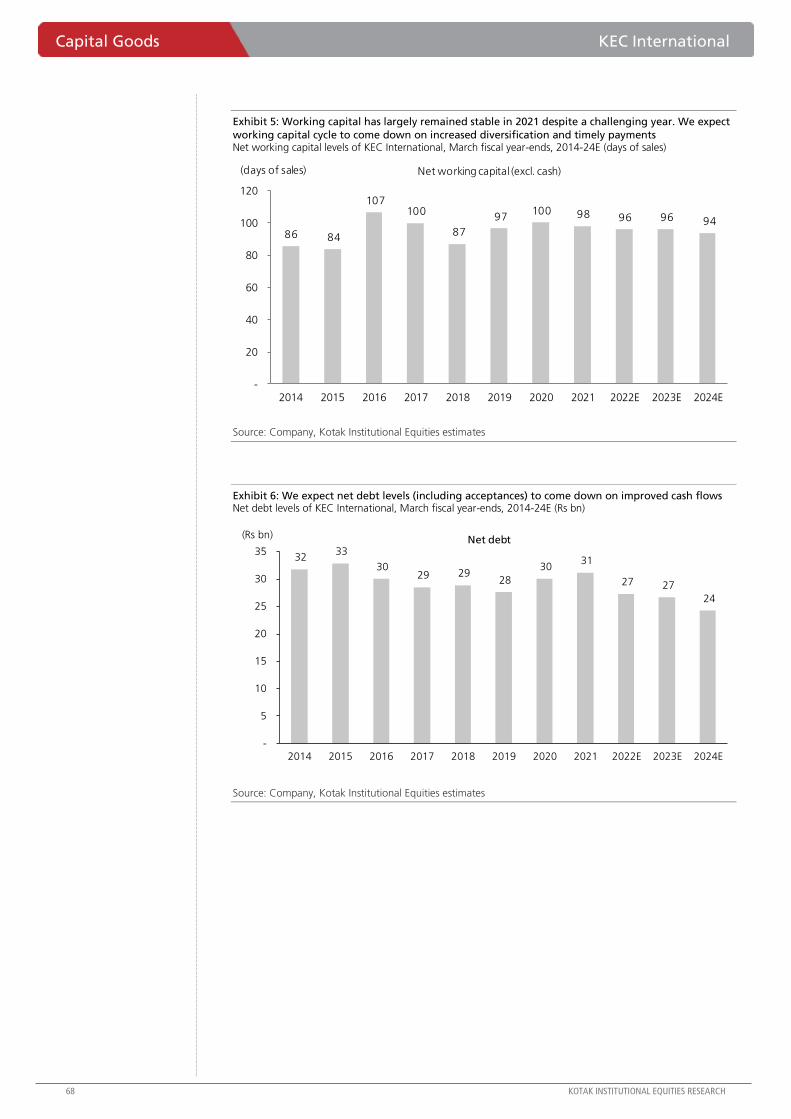
Capital Goods KEC International
68 KOTAK INSTITUTIONAL EQUITIES RESEARCH
Exhibit 5: Working capital has largely remained stable in 2021 despite a challenging year. We expect
working capital cycle to come down on increased diversification and timely payments Net working capital levels of KEC International, March fiscal year-ends, 2014-24E (days of sales)
Source: Company, Kotak Institutional Equities estimates
Exhibit 6: We expect net debt levels (including acceptances) to come down on improved cash flows Net debt levels of KEC International, March fiscal year-ends, 2014-24E (Rs bn)
Source: Company, Kotak Institutional Equities estimates
86 84
107 100
87
97 100 98 96 96 94
-
20
40
60
80
100
120
2014 2015 2016 2017 2018 2019 2020 2021 2022E 2023E 2024E
(days of sales) Net working capital (excl. cash)
32 33
30 29 29
28
30 31
27 27
24
-
5
10
15
20
25
30
35
2014 2015 2016 2017 2018 2019 2020 2021 2022E 2023E 2024E
(Rs bn) Net debt
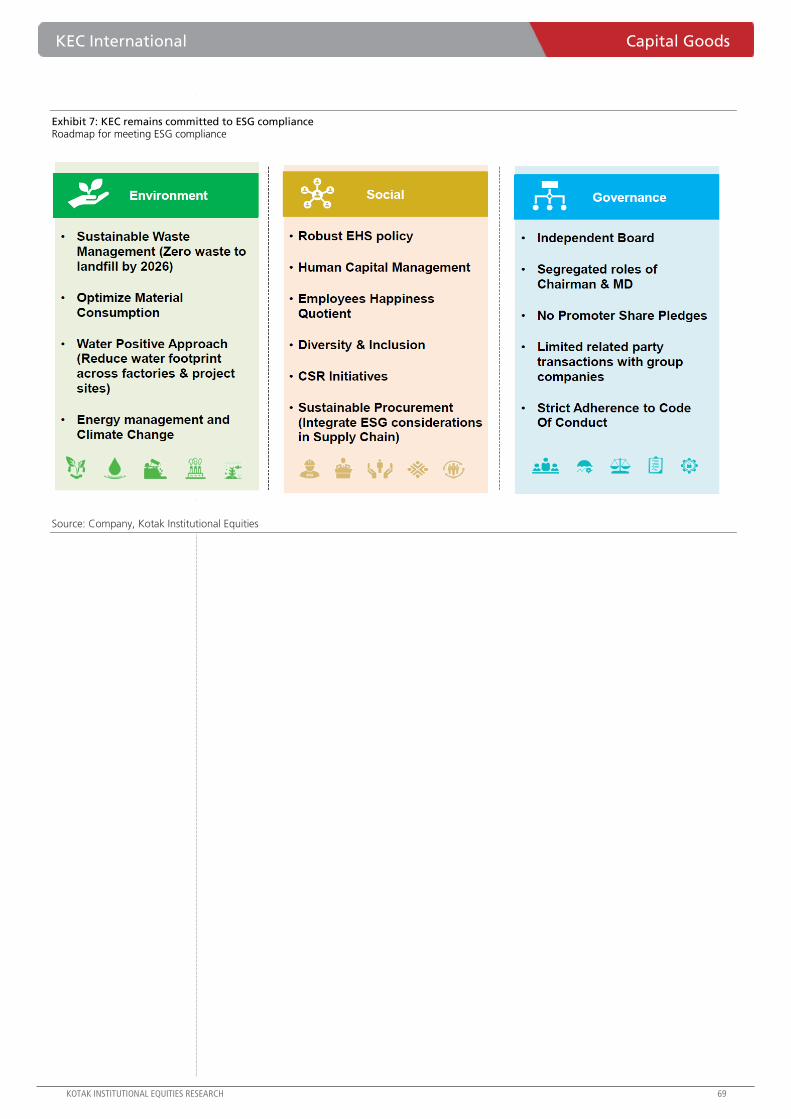
KEC International Capital Goods
KOTAK INSTITUTIONAL EQUITIES RESEARCH 69
Exhibit 7: KEC remains committed to ESG compliance Roadmap for meeting ESG compliance
Source: Company, Kotak Institutional Equities
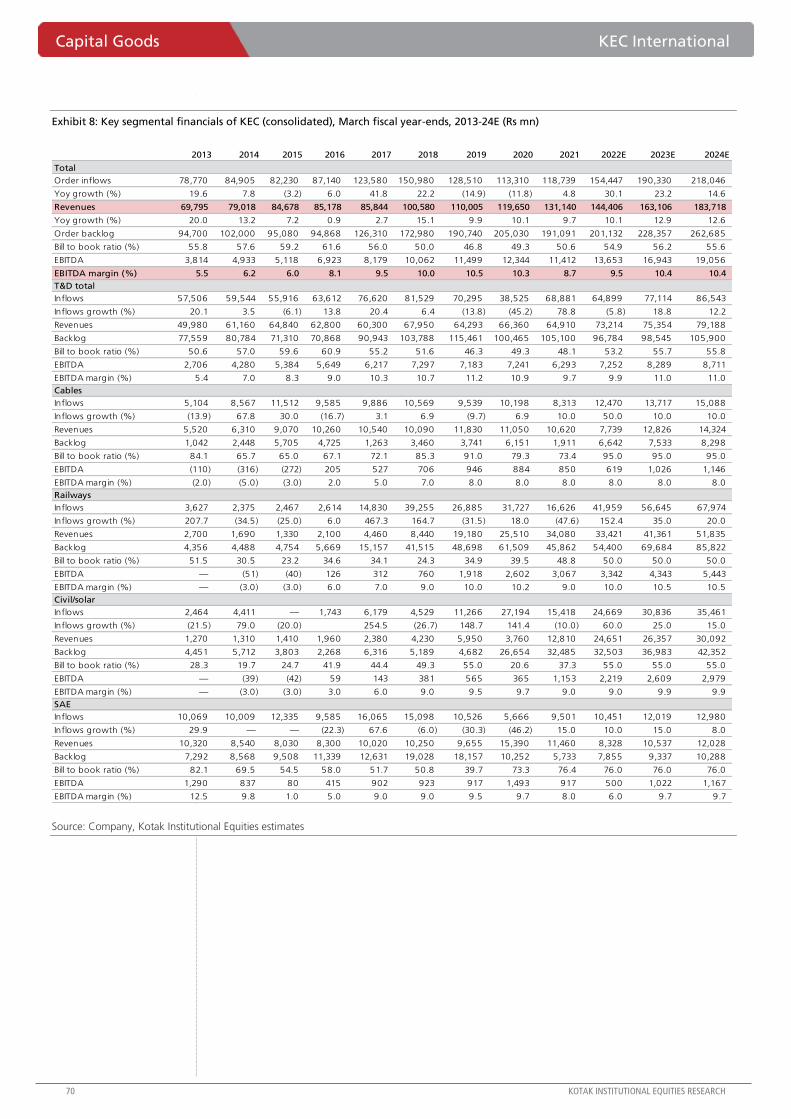
Capital Goods KEC International
70 KOTAK INSTITUTIONAL EQUITIES RESEARCH
Exhibit 8: Key segmental financials of KEC (consolidated), March fiscal year-ends, 2013-24E (Rs mn)
Source: Company, Kotak Institutional Equities estimates
2013 2014 2015 2016 2017 2018 2019 2020 2021 2022E 2023E 2024E
Total
Order inflows 78,770 84,905 82,230 87,140 123,580 150,980 128,510 113,310 118,739 154,447 190,330 218,046
Yoy growth (%) 19.6 7.8 (3.2) 6.0 41.8 22.2 (14.9) (11.8) 4.8 30.1 23.2 14.6
Revenues 69,795 79,018 84,678 85,178 85,844 100,580 110,005 119,650 131,140 144,406 163,106 183,718
Yoy growth (%) 20.0 13.2 7.2 0.9 2.7 15.1 9.9 10.1 9.7 10.1 12.9 12.6
Order backlog 94,700 102,000 95,080 94,868 126,310 172,980 190,740 205,030 191,091 201,132 228,357 262,685
Bill to book ratio (%) 55.8 57.6 59.2 61.6 56.0 50.0 46.8 49.3 50.6 54.9 56.2 55.6
EBITDA 3,814 4,933 5,118 6,923 8,179 10,062 11,499 12,344 11,412 13,653 16,943 19,056
EBITDA margin (%) 5.5 6.2 6.0 8.1 9.5 10.0 10.5 10.3 8.7 9.5 10.4 10.4
T&D total
Inflows 57,506 59,544 55,916 63,612 76,620 81,529 70,295 38,525 68,881 64,899 77,114 86,543
Inflows growth (%) 20.1 3.5 (6.1) 13.8 20.4 6.4 (13.8) (45.2) 78.8 (5.8) 18.8 12.2
Revenues 49,980 61,160 64,840 62,800 60,300 67,950 64,293 66,360 64,910 73,214 75,354 79,188
Backlog 77,559 80,784 71,310 70,868 90,943 103,788 115,461 100,465 105,100 96,784 98,545 105,900
Bill to book ratio (%) 50.6 57.0 59.6 60.9 55.2 51.6 46.3 49.3 48.1 53.2 55.7 55.8
EBITDA 2,706 4,280 5,384 5,649 6,217 7,297 7,183 7,241 6,293 7,252 8,289 8,711
EBITDA margin (%) 5.4 7.0 8.3 9.0 10.3 10.7 11.2 10.9 9.7 9.9 11.0 11.0
Cables
Inflows 5,104 8,567 11,512 9,585 9,886 10,569 9,539 10,198 8,313 12,470 13,717 15,088
Inflows growth (%) (13.9) 67.8 30.0 (16.7) 3.1 6.9 (9.7) 6.9 10.0 50.0 10.0 10.0
Revenues 5,520 6,310 9,070 10,260 10,540 10,090 11,830 11,050 10,620 7,739 12,826 14,324
Backlog 1,042 2,448 5,705 4,725 1,263 3,460 3,741 6,151 1,911 6,642 7,533 8,298
Bill to book ratio (%) 84.1 65.7 65.0 67.1 72.1 85.3 91.0 79.3 73.4 95.0 95.0 95.0
EBITDA (110) (316) (272) 205 527 706 946 884 850 619 1,026 1,146
EBITDA margin (%) (2.0) (5.0) (3.0) 2.0 5.0 7.0 8.0 8.0 8.0 8.0 8.0 8.0
Railways
Inflows 3,627 2,375 2,467 2,614 14,830 39,255 26,885 31,727 16,626 41,959 56,645 67,974
Inflows growth (%) 207.7 (34.5) (25.0) 6.0 467.3 164.7 (31.5) 18.0 (47.6) 152.4 35.0 20.0
Revenues 2,700 1,690 1,330 2,100 4,460 8,440 19,180 25,510 34,080 33,421 41,361 51,835
Backlog 4,356 4,488 4,754 5,669 15,157 41,515 48,698 61,509 45,862 54,400 69,684 85,822
Bill to book ratio (%) 51.5 30.5 23.2 34.6 34.1 24.3 34.9 39.5 48.8 50.0 50.0 50.0
EBITDA — (51) (40) 126 312 760 1,918 2,602 3,067 3,342 4,343 5,443
EBITDA margin (%) — (3.0) (3.0) 6.0 7.0 9.0 10.0 10.2 9.0 10.0 10.5 10.5
Civil/solar
Inflows 2,464 4,411 — 1,743 6,179 4,529 11,266 27,194 15,418 24,669 30,836 35,461
Inflows growth (%) (21.5) 79.0 (20.0) 254.5 (26.7) 148.7 141.4 (10.0) 60.0 25.0 15.0
Revenues 1,270 1,310 1,410 1,960 2,380 4,230 5,950 3,760 12,810 24,651 26,357 30,092
Backlog 4,451 5,712 3,803 2,268 6,316 5,189 4,682 26,654 32,485 32,503 36,983 42,352
Bill to book ratio (%) 28.3 19.7 24.7 41.9 44.4 49.3 55.0 20.6 37.3 55.0 55.0 55.0
EBITDA — (39) (42) 59 143 381 565 365 1,153 2,219 2,609 2,979
EBITDA margin (%) — (3.0) (3.0) 3.0 6.0 9.0 9.5 9.7 9.0 9.0 9.9 9.9
SAE
Inflows 10,069 10,009 12,335 9,585 16,065 15,098 10,526 5,666 9,501 10,451 12,019 12,980
Inflows growth (%) 29.9 — — (22.3) 67.6 (6.0) (30.3) (46.2) 15.0 10.0 15.0 8.0
Revenues 10,320 8,540 8,030 8,300 10,020 10,250 9,655 15,390 11,460 8,328 10,537 12,028
Backlog 7,292 8,568 9,508 11,339 12,631 19,028 18,157 10,252 5,733 7,855 9,337 10,288
Bill to book ratio (%) 82.1 69.5 54.5 58.0 51.7 50.8 39.7 73.3 76.4 76.0 76.0 76.0
EBITDA 1,290 837 80 415 902 923 917 1,493 917 500 1,022 1,167
EBITDA margin (%) 12.5 9.8 1.0 5.0 9.0 9.0 9.5 9.7 8.0 6.0 9.7 9.7
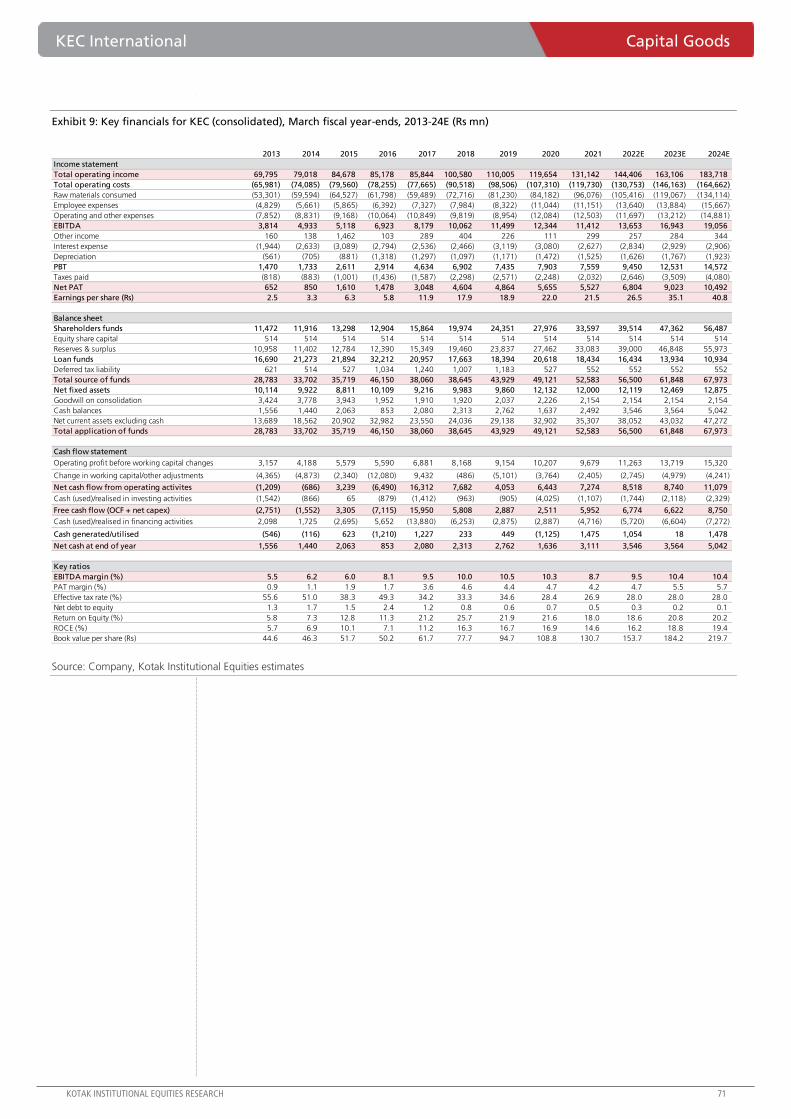
KEC International Capital Goods
KOTAK INSTITUTIONAL EQUITIES RESEARCH 71
Exhibit 9: Key financials for KEC (consolidated), March fiscal year-ends, 2013-24E (Rs mn)
Source: Company, Kotak Institutional Equities estimates
2013 2014 2015 2016 2017 2018 2019 2020 2021 2022E 2023E 2024E
Income statement
Total operating income 69,795 79,018 84,678 85,178 85,844 100,580 110,005 119,654 131,142 144,406 163,106 183,718
Total operating costs (65,981) (74,085) (79,560) (78,255) (77,665) (90,518) (98,506) (107,310) (119,730) (130,753) (146,163) (164,662)
Raw materials consumed (53,301) (59,594) (64,527) (61,798) (59,489) (72,716) (81,230) (84,182) (96,076) (105,416) (119,067) (134,114)
Employee expenses (4,829) (5,661) (5,865) (6,392) (7,327) (7,984) (8,322) (11,044) (11,151) (13,640) (13,884) (15,667)
Operating and other expenses (7,852) (8,831) (9,168) (10,064) (10,849) (9,819) (8,954) (12,084) (12,503) (11,697) (13,212) (14,881)
EBITDA 3,814 4,933 5,118 6,923 8,179 10,062 11,499 12,344 11,412 13,653 16,943 19,056
Other income 160 138 1,462 103 289 404 226 111 299 257 284 344
Interest expense (1,944) (2,633) (3,089) (2,794) (2,536) (2,466) (3,119) (3,080) (2,627) (2,834) (2,929) (2,906)
Depreciation (561) (705) (881) (1,318) (1,297) (1,097) (1,171) (1,472) (1,525) (1,626) (1,767) (1,923)
PBT 1,470 1,733 2,611 2,914 4,634 6,902 7,435 7,903 7,559 9,450 12,531 14,572
Taxes paid (818) (883) (1,001) (1,436) (1,587) (2,298) (2,571) (2,248) (2,032) (2,646) (3,509) (4,080)
Net PAT 652 850 1,610 1,478 3,048 4,604 4,864 5,655 5,527 6,804 9,023 10,492
Earnings per share (Rs) 2.5 3.3 6.3 5.8 11.9 17.9 18.9 22.0 21.5 26.5 35.1 40.8
Balance sheet
Shareholders funds 11,472 11,916 13,298 12,904 15,864 19,974 24,351 27,976 33,597 39,514 47,362 56,487
Equity share capital 514 514 514 514 514 514 514 514 514 514 514 514
Reserves & surplus 10,958 11,402 12,784 12,390 15,349 19,460 23,837 27,462 33,083 39,000 46,848 55,973
Loan funds 16,690 21,273 21,894 32,212 20,957 17,663 18,394 20,618 18,434 16,434 13,934 10,934
Deferred tax liability 621 514 527 1,034 1,240 1,007 1,183 527 552 552 552 552
Total source of funds 28,783 33,702 35,719 46,150 38,060 38,645 43,929 49,121 52,583 56,500 61,848 67,973
Net fixed assets 10,114 9,922 8,811 10,109 9,216 9,983 9,860 12,132 12,000 12,119 12,469 12,875
Goodwill on consolidation 3,424 3,778 3,943 1,952 1,910 1,920 2,037 2,226 2,154 2,154 2,154 2,154
Cash balances 1,556 1,440 2,063 853 2,080 2,313 2,762 1,637 2,492 3,546 3,564 5,042
Net current assets excluding cash 13,689 18,562 20,902 32,982 23,550 24,036 29,138 32,902 35,307 38,052 43,032 47,272
Total application of funds 28,783 33,702 35,719 46,150 38,060 38,645 43,929 49,121 52,583 56,500 61,848 67,973
Cash flow statement
Operating profit before working capital changes 3,157 4,188 5,579 5,590 6,881 8,168 9,154 10,207 9,679 11,263 13,719 15,320
Change in working capital/other adjustments (4,365) (4,873) (2,340) (12,080) 9,432 (486) (5,101) (3,764) (2,405) (2,745) (4,979) (4,241)
Net cash flow from operating activites (1,209) (686) 3,239 (6,490) 16,312 7,682 4,053 6,443 7,274 8,518 8,740 11,079
Cash (used)/realised in investing activities (1,542) (866) 65 (879) (1,412) (963) (905) (4,025) (1,107) (1,744) (2,118) (2,329)
Free cash flow (OCF + net capex) (2,751) (1,552) 3,305 (7,115) 15,950 5,808 2,887 2,511 5,952 6,774 6,622 8,750
Cash (used)/realised in financing activities 2,098 1,725 (2,695) 5,652 (13,880) (6,253) (2,875) (2,887) (4,716) (5,720) (6,604) (7,272)
Cash generated/utilised (546) (116) 623 (1,210) 1,227 233 449 (1,125) 1,475 1,054 18 1,478
Net cash at end of year 1,556 1,440 2,063 853 2,080 2,313 2,762 1,636 3,111 3,546 3,564 5,042
Key ratios
EBITDA margin (%) 5.5 6.2 6.0 8.1 9.5 10.0 10.5 10.3 8.7 9.5 10.4 10.4
PAT margin (%) 0.9 1.1 1.9 1.7 3.6 4.6 4.4 4.7 4.2 4.7 5.5 5.7
Effective tax rate (%) 55.6 51.0 38.3 49.3 34.2 33.3 34.6 28.4 26.9 28.0 28.0 28.0
Net debt to equity 1.3 1.7 1.5 2.4 1.2 0.8 0.6 0.7 0.5 0.3 0.2 0.1
Return on Equity (%) 5.8 7.3 12.8 11.3 21.2 25.7 21.9 21.6 18.0 18.6 20.8 20.2
ROCE (%) 5.7 6.9 10.1 7.1 11.2 16.3 16.7 16.9 14.6 16.2 18.8 19.4
Book value per share (Rs) 44.6 46.3 51.7 50.2 61.7 77.7 94.7 108.8 130.7 153.7 184.2 219.7
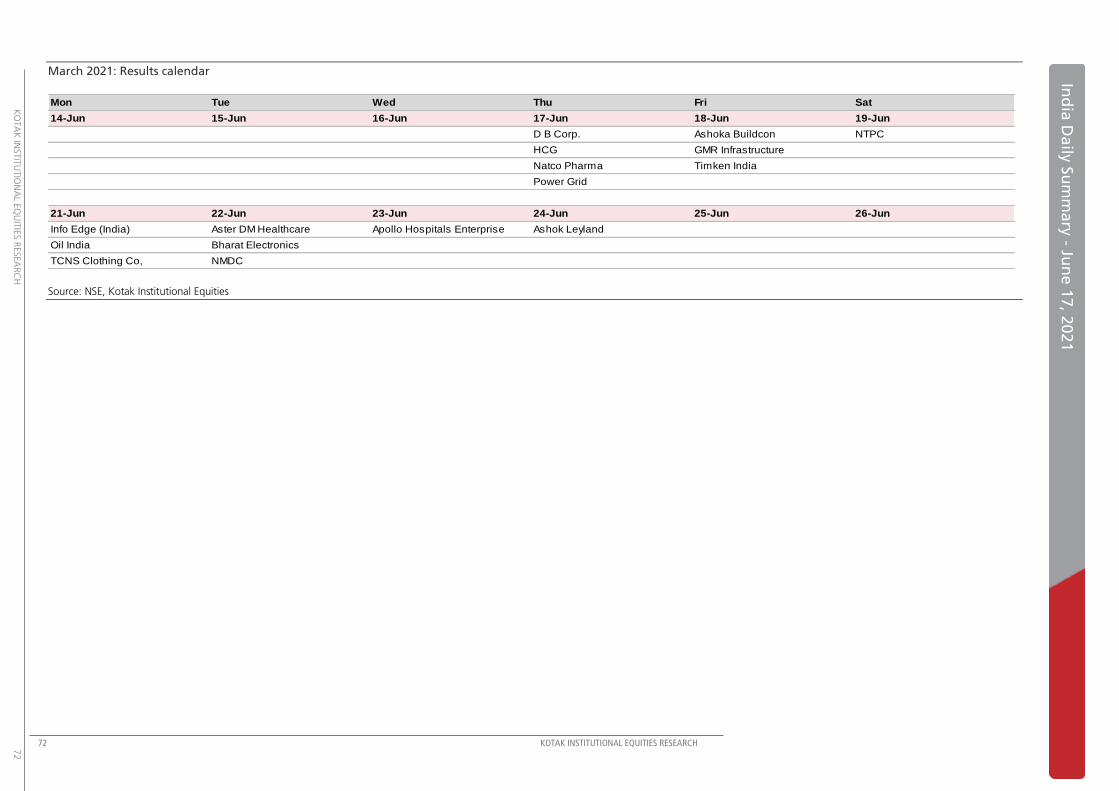
72 KOTAK INSTITUTIONAL EQUITIES RESEARCH
KO
TA
K IN
STIT
UTIO
NA
L EQ
UIT
IES R
ESEA
RC
H
72
Ind
ia D
aily
Su
mm
ary
- Jun
e 1
7, 2
02
1
March 2021: Results calendar
Source: NSE, Kotak Institutional Equities
Mon Tue Wed Thu Fri Sat
14-Jun 15-Jun 16-Jun 17-Jun 18-Jun 19-Jun
Coal India Jubilant Foodworks CESC D B Corp. Ashoka Buildcon NTPC
Indian Overseas Bank Lemon Tree Hotel HCG GMR Infrastructure
LIC Housing Finance Natco Pharma Timken India
Power Finance Corporation Power Grid
Whirlpool of India
21-Jun 22-Jun 23-Jun 24-Jun 25-Jun 26-Jun
Info Edge (India) Aster DM Healthcare Apollo Hospitals Enterprise Ashok Leyland
Oil India Bharat Electronics
TCNS Clothing Co, NMDC
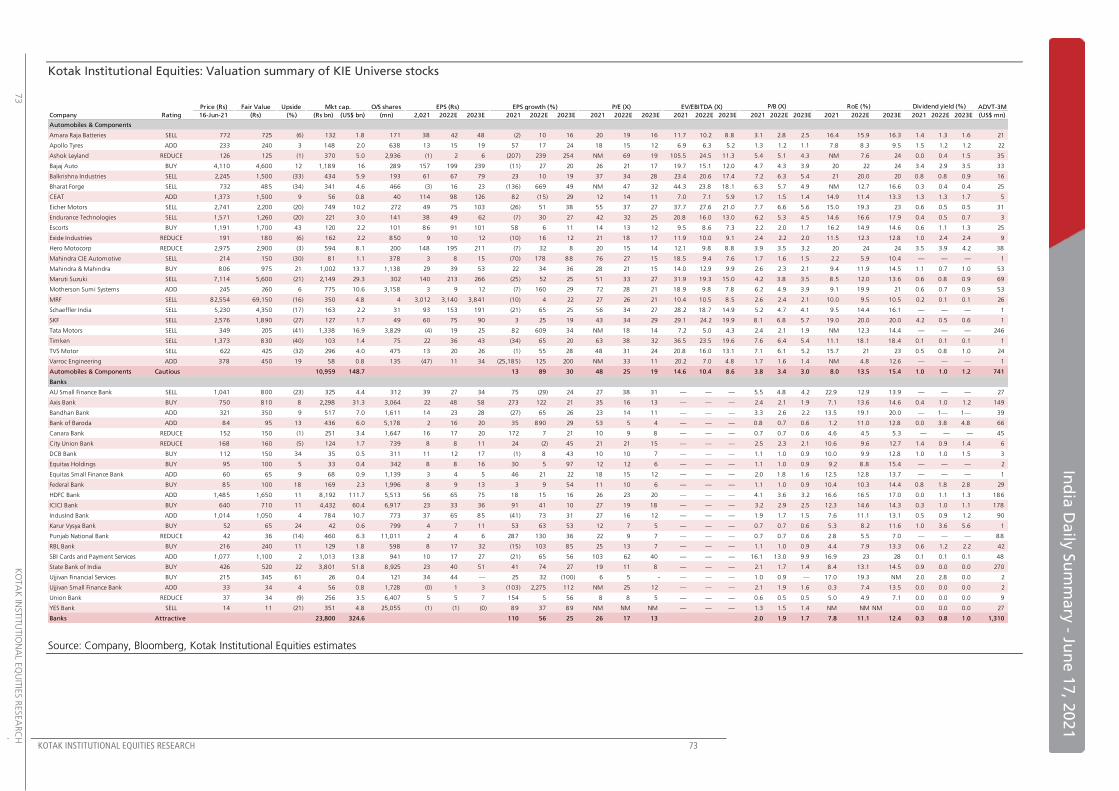
KOTAK INSTITUTIONAL EQUITIES RESEARCH 73
Ind
ia D
aily
Su
mm
ary
- Jun
e 1
7, 2
02
1
73
K
OTA
K IN
STIT
UTIO
NA
L EQ
UIT
IES R
ESEA
RC
H
Kotak Institutional Equities: Valuation summary of KIE Universe stocks
Source: Company, Bloomberg, Kotak Institutional Equities estimates
Price (Rs) Fair Value Upside Mkt cap. O/S shares EPS (Rs) EPS growth (%) P/E (X) EV/EBITDA (X) ADVT-3M
Company Rating 16-Jun-21 (Rs) (%) (Rs bn) (US$ bn) (mn) 2,021 2022E 2023E 2021 2022E 2023E 2021 2022E 2023E 2021 2022E 2023E 2021 2022E 2023E 2021 2022E 2023E 2021 2022E 2023E (US$ mn)
Automobiles & Components
Amara Raja Batteries SELL 772 725 (6) 132 1.8 171 38 42 48 (2) 10 16 20 19 16 11.7 10.2 8 .8 3.1 2.8 2.5 16.4 15.9 16.3 1.4 1.3 1.6 21
Apollo Tyres ADD 233 240 3 148 2.0 638 13 15 19 57 17 24 18 15 12 6.9 6.3 5.2 1.3 1.2 1.1 7.8 8.3 9.5 1.5 1.2 1.2 22
Ashok Leyland REDUCE 126 125 (1) 370 5.0 2,936 (1) 2 6 (207) 239 254 NM 69 19 105.5 24.5 11.3 5.4 5.1 4.3 NM 7.6 24 0.0 0.4 1.5 35
Bajaj Auto BUY 4,110 4,600 12 1,189 16 289 157 199 239 (11) 27 20 26 21 17 19.7 15.1 12.0 4.7 4.3 3.9 20 22 24 3.4 2.9 3.5 33
Balkrishna Industries SELL 2,245 1,500 (33) 434 5.9 193 61 67 79 23 10 19 37 34 28 23.4 20.6 17.4 7.2 6.3 5.4 21 20.0 20 0.8 0.8 0.9 16
Bharat Forge SELL 732 485 (34) 341 4.6 466 (3) 16 23 (136) 669 49 NM 47 32 44.3 23.8 18.1 6.3 5.7 4.9 NM 12.7 16.6 0.3 0.4 0.4 25
CEAT ADD 1,373 1,500 9 56 0.8 40 114 98 126 82 (15) 29 12 14 11 7.0 7.1 5.9 1.7 1.5 1.4 14.9 11.4 13.3 1.3 1.3 1.7 5
Eicher Motors SELL 2,741 2,200 (20) 749 10.2 272 49 75 103 (26) 51 38 55 37 27 37.7 27.6 21.0 7.7 6.6 5.6 15.0 19.3 23 0.6 0.5 0.5 31
Endurance Technologies SELL 1,571 1,260 (20) 221 3.0 141 38 49 62 (7) 30 27 42 32 25 20.8 16.0 13.0 6.2 5.3 4.5 14.6 16.6 17.9 0.4 0.5 0.7 3
Escorts BUY 1,191 1,700 43 120 2.2 101 86 91 101 58 6 11 14 13 12 9.5 8 .6 7.3 2.2 2.0 1.7 16.2 14.9 14.6 0.6 1.1 1.3 25
Exide Industries REDUCE 191 180 (6) 162 2.2 850 9 10 12 (10) 16 12 21 18 17 11.9 10.0 9.1 2.4 2.2 2.0 11.5 12.3 12.8 1.0 2.4 2.4 9
Hero Motocorp REDUCE 2,975 2,900 (3) 594 8 .1 200 148 195 211 (7) 32 8 20 15 14 12.1 9.8 8 .8 3.9 3.5 3.2 20 24 24 3.5 3.9 4.2 38
Mahindra CIE Automotive SELL 214 150 (30) 81 1.1 378 3 8 15 (70) 178 88 76 27 15 18.5 9.4 7.6 1.7 1.6 1.5 2.2 5.9 10.4 — — — 1
Mahindra & Mahindra BUY 806 975 21 1,002 13.7 1,138 29 39 53 22 34 36 28 21 15 14.0 12.9 9.9 2.6 2.3 2.1 9.4 11.9 14.5 1.1 0.7 1.0 53
Maruti Suzuki SELL 7,114 5,600 (21) 2,149 29.3 302 140 213 266 (25) 52 25 51 33 27 31.9 19.3 15.0 4.2 3.8 3.5 8 .5 12.0 13.6 0.6 0.8 0.9 69
Motherson Sumi Systems ADD 245 260 6 775 10.6 3,158 3 9 12 (7) 160 29 72 28 21 18.9 9.8 7.8 6.2 4.9 3.9 9.1 19.9 21 0.6 0.7 0.9 53
MRF SELL 82,554 69,150 (16) 350 4.8 4 3,012 3,140 3,841 (10) 4 22 27 26 21 10.4 10.5 8 .5 2.6 2.4 2.1 10.0 9.5 10.5 0.2 0.1 0.1 26
Schaeffler India SELL 5,230 4,350 (17) 163 2.2 31 93 153 191 (21) 65 25 56 34 27 28.2 18.7 14.9 5.2 4.7 4.1 9.5 14.4 16.1 — — — 1
SKF SELL 2,576 1,890 (27) 127 1.7 49 60 75 90 3 25 19 43 34 29 29.1 24.2 19.9 8 .1 6.8 5.7 19.0 20.0 20.0 4.2 0.5 0.6 1
Tata Motors SELL 349 205 (41) 1,338 16.9 3,829 (4) 19 25 82 609 34 NM 18 14 7.2 5.0 4.3 2.4 2.1 1.9 NM 12.3 14.4 — — — 246
Timken SELL 1,373 830 (40) 103 1.4 75 22 36 43 (34) 65 20 63 38 32 36.5 23.5 19.6 7.6 6.4 5.4 11.1 18.1 18.4 0.1 0.1 0.1 1
TVS Motor SELL 622 425 (32) 296 4.0 475 13 20 26 (1) 55 28 48 31 24 20.8 16.0 13.1 7.1 6.1 5.2 15.7 21 23 0.5 0.8 1.0 24
Varroc Engineering ADD 378 450 19 58 0.8 135 (47) 11 34 (25,185) 125 200 NM 33 11 20.2 7.0 4.8 1.7 1.6 1.4 NM 4.8 12.6 — — — 1
Automobiles & Components Cautious 10,959 148.7 13 89 30 48 25 19 14.6 10.4 8.6 3.8 3.4 3.0 8.0 13.5 15.4 1.0 1.0 1.2 741
Banks
AU Small Finance Bank SELL 1,041 800 (23) 325 4.4 312 39 27 34 75 (29) 24 27 38 31 — — — 5.5 4.8 4.2 22.9 12.9 13.9 — — — 27
Axis Bank BUY 750 810 8 2,298 31.3 3,064 22 48 58 273 122 21 35 16 13 — — — 2.4 2.1 1.9 7.1 13.6 14.6 0.4 1.0 1.2 149
Bandhan Bank ADD 321 350 9 517 7.0 1,611 14 23 28 (27) 65 26 23 14 11 — — — 3.3 2.6 2.2 13.5 19.1 20.0 — 1— 1— 39
Bank of Baroda ADD 84 95 13 436 6.0 5,178 2 16 20 35 890 29 53 5 4 — — — 0.8 0.7 0.6 1.2 11.0 12.8 0.0 3.8 4.8 66
Canara Bank REDUCE 152 150 (1) 251 3.4 1,647 16 17 20 172 7 21 10 9 8 — — — 0.7 0.7 0.6 4.6 4.5 5.3 — — — 45
City Union Bank REDUCE 168 160 (5) 124 1.7 739 8 8 11 24 (2) 45 21 21 15 — — — 2.5 2.3 2.1 10.6 9.6 12.7 1.4 0.9 1.4 6
DCB Bank BUY 112 150 34 35 0.5 311 11 12 17 (1) 8 43 10 10 7 — — — 1.1 1.0 0.9 10.0 9.9 12.8 1.0 1.0 1.5 3
Equitas Holdings BUY 95 100 5 33 0.4 342 8 8 16 30 5 97 12 12 6 — — — 1.1 1.0 0.9 9.2 8 .8 15.4 — — — 2
Equitas Small Finance Bank ADD 60 65 9 68 0.9 1,139 3 4 5 46 21 22 18 15 12 — — — 2.0 1.8 1.6 12.5 12.8 13.7 — — — 1
Federal Bank BUY 85 100 18 169 2.3 1,996 8 9 13 3 9 54 11 10 6 — — — 1.1 1.0 0.9 10.4 10.3 14.4 0.8 1.8 2.8 29
HDFC Bank ADD 1,485 1,650 11 8 ,192 111.7 5,513 56 65 75 18 15 16 26 23 20 — — — 4.1 3.6 3.2 16.6 16.5 17.0 0.0 1.1 1.3 186
ICICI Bank BUY 640 710 11 4,432 60.4 6,917 23 33 36 91 41 10 27 19 18 — — — 3.2 2.9 2.5 12.3 14.6 14.3 0.3 1.0 1.1 178
IndusInd Bank ADD 1,014 1,050 4 784 10.7 773 37 65 85 (41) 73 31 27 16 12 — — — 1.9 1.7 1.5 7.6 11.1 13.1 0.5 0.9 1.2 90
Karur Vysya Bank BUY 52 65 24 42 0.6 799 4 7 11 53 63 53 12 7 5 — — — 0.7 0.7 0.6 5.3 8 .2 11.6 1.0 3.6 5.6 1
Punjab National Bank REDUCE 42 36 (14) 460 6.3 11,011 2 4 6 287 130 36 22 9 7 — — — 0.7 0.7 0.6 2.8 5.5 7.0 — — — 88
RBL Bank BUY 216 240 11 129 1.8 598 8 17 32 (15) 103 85 25 13 7 — — — 1.1 1.0 0.9 4.4 7.9 13.3 0.6 1.2 2.2 42
SBI Cards and Payment Services ADD 1,077 1,100 2 1,013 13.8 941 10 17 27 (21) 65 56 103 62 40 — — — 16.1 13.0 9.9 16.9 23 28 0.1 0.1 0.1 48
State Bank of India BUY 426 520 22 3,801 51.8 8,925 23 40 51 41 74 27 19 11 8 — — — 2.1 1.7 1.4 8 .4 13.1 14.5 0.9 0.0 0.0 270
Ujjivan Financial Services BUY 215 345 61 26 0.4 121 34 44 — 25 32 (100) 6 5 - — — — 1.0 0.9 — 17.0 19.3 NM 2.0 2.8 0.0 2
Ujjivan Small Finance Bank ADD 33 34 4 56 0.8 1,728 (0) 1 3 (103) 2,275 112 NM 25 12 — — — 2.1 1.9 1.6 0.3 7.4 13.5 0.0 0.0 0.0 2
Union Bank REDUCE 37 34 (9) 256 3.5 6,407 5 5 7 154 5 56 8 8 5 — — — 0.6 0.5 0.5 5.0 4.9 7.1 0.0 0.0 0.0 9
YES Bank SELL 14 11 (21) 351 4.8 25,055 (1) (1) (0) 89 37 89 NM NM NM — — — 1.3 1.5 1.4 NM NM NM 0.0 0.0 0.0 27
Banks Attractive 23,800 324.6 110 56 25 26 17 13 2.0 1.9 1.7 7.8 11.1 12.4 0.3 0.8 1.0 1,310
P/B (X) RoE (%) Dividend yield (%)
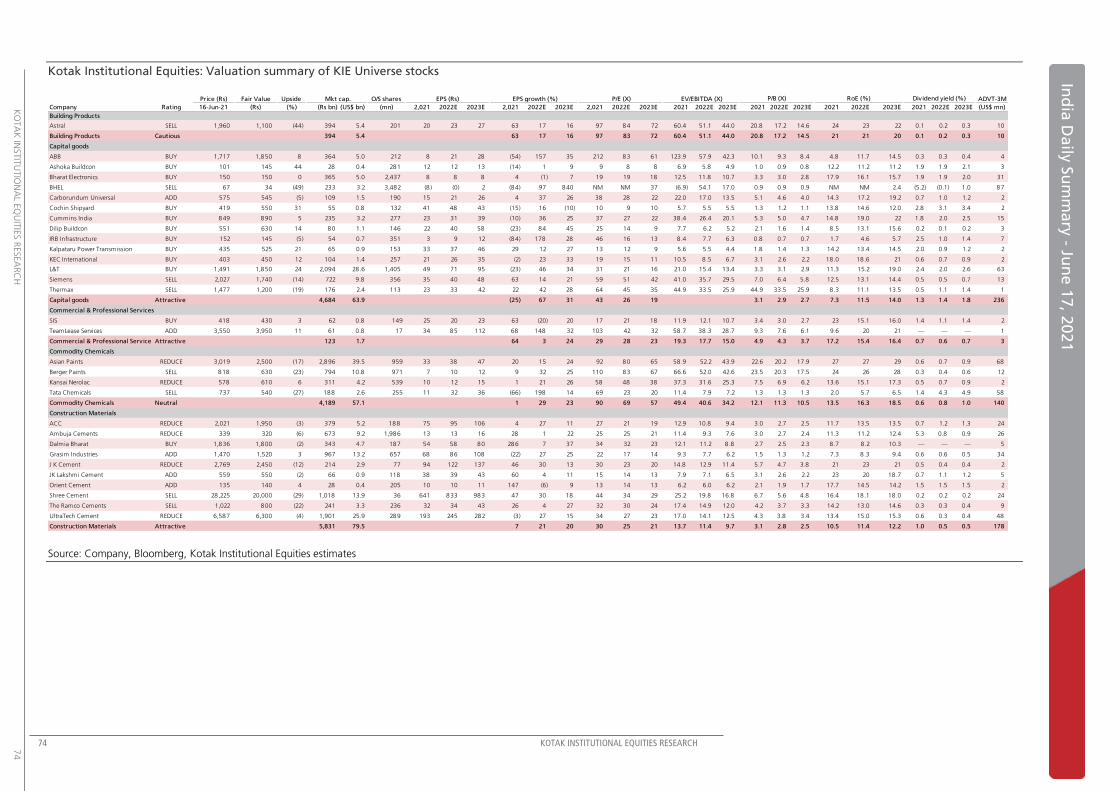
74 KOTAK INSTITUTIONAL EQUITIES RESEARCH
K
OTA
K IN
STIT
UTIO
NA
L EQ
UIT
IES R
ESEA
RC
H
74
Ind
ia D
aily
Su
mm
ary
- Jun
e 1
7, 2
02
1
Kotak Institutional Equities: Valuation summary of KIE Universe stocks
Source: Company, Bloomberg, Kotak Institutional Equities estimates
Price (Rs) Fair Value Upside Mkt cap. O/S shares EPS (Rs) EPS growth (%) P/E (X) EV/EBITDA (X) ADVT-3M
Company Rating 16-Jun-21 (Rs) (%) (Rs bn) (US$ bn) (mn) 2,021 2022E 2023E 2,021 2022E 2023E 2,021 2022E 2023E 2021 2022E 2023E 2021 2022E 2023E 2021 2022E 2023E 2021 2022E 2023E (US$ mn)
Building Products
Astral SELL 1,960 1,100 (44) 394 5.4 201 20 23 27 63 17 16 97 84 72 60.4 51.1 44.0 20.8 17.2 14.6 24 23 22 0.1 0.2 0.3 10
Building Products Cautious 394 5.4 63 17 16 97 83 72 60.4 51.1 44.0 20.8 17.2 14.5 21 21 20 0.1 0.2 0.3 10
Capital goods
ABB BUY 1,717 1,850 8 364 5.0 212 8 21 28 (54) 157 35 212 83 61 123.9 57.9 42.3 10.1 9.3 8 .4 4.8 11.7 14.5 0.3 0.3 0.4 4
Ashoka Buildcon BUY 101 145 44 28 0.4 281 12 12 13 (14) 1 9 9 8 8 6.9 5.8 4.9 1.0 0.9 0.8 12.2 11.2 11.2 1.9 1.9 2.1 3
Bharat Electronics BUY 150 150 0 365 5.0 2,437 8 8 8 4 (1) 7 19 19 18 12.5 11.8 10.7 3.3 3.0 2.8 17.9 16.1 15.7 1.9 1.9 2.0 31
BHEL SELL 67 34 (49) 233 3.2 3,482 (8 ) (0) 2 (84) 97 840 NM NM 37 (6.9) 54.1 17.0 0.9 0.9 0.9 NM NM 2.4 (5.2) (0.1) 1.0 87
Carborundum Universal ADD 575 545 (5) 109 1.5 190 15 21 26 4 37 26 38 28 22 22.0 17.0 13.5 5.1 4.6 4.0 14.3 17.2 19.2 0.7 1.0 1.2 2
Cochin Shipyard BUY 419 550 31 55 0.8 132 41 48 43 (15) 16 (10) 10 9 10 5.7 5.5 5.5 1.3 1.2 1.1 13.8 14.6 12.0 2.8 3.1 3.4 2
Cummins India BUY 849 890 5 235 3.2 277 23 31 39 (10) 36 25 37 27 22 38.4 26.4 20.1 5.3 5.0 4.7 14.8 19.0 22 1.8 2.0 2.5 15
Dilip Buildcon BUY 551 630 14 80 1.1 146 22 40 58 (23) 84 45 25 14 9 7.7 6.2 5.2 2.1 1.6 1.4 8 .5 13.1 15.6 0.2 0.1 0.2 3
IRB Infrastructure BUY 152 145 (5) 54 0.7 351 3 9 12 (84) 178 28 46 16 13 8 .4 7.7 6.3 0.8 0.7 0.7 1.7 4.6 5.7 2.5 1.0 1.4 7
Kalpataru Power Transmission BUY 435 525 21 65 0.9 153 33 37 46 29 12 27 13 12 9 5.6 5.5 4.4 1.8 1.4 1.3 14.2 13.4 14.5 2.0 0.9 1.2 2
KEC International BUY 403 450 12 104 1.4 257 21 26 35 (2) 23 33 19 15 11 10.5 8 .5 6.7 3.1 2.6 2.2 18.0 18.6 21 0.6 0.7 0.9 2
L&T BUY 1,491 1,850 24 2,094 28.6 1,405 49 71 95 (23) 46 34 31 21 16 21.0 15.4 13.4 3.3 3.1 2.9 11.3 15.2 19.0 2.4 2.0 2.6 63
Siemens SELL 2,027 1,740 (14) 722 9.8 356 35 40 48 63 14 21 59 51 42 41.0 35.7 29.5 7.0 6.4 5.8 12.5 13.1 14.4 0.5 0.5 0.7 13
Thermax SELL 1,477 1,200 (19) 176 2.4 113 23 33 42 22 42 28 64 45 35 44.9 33.5 25.9 44.9 33.5 25.9 8 .3 11.1 13.5 0.5 1.1 1.4 1
Capital goods Attractive 4,684 63.9 (25) 67 31 43 26 19 3.1 2.9 2.7 7.3 11.5 14.0 1.3 1.4 1.8 236
Commercial & Professional Services
SIS BUY 418 430 3 62 0.8 149 25 20 23 63 (20) 20 17 21 18 11.9 12.1 10.7 3.4 3.0 2.7 23 15.1 16.0 1.4 1.1 1.4 2
TeamLease Services ADD 3,550 3,950 11 61 0.8 17 34 85 112 68 148 32 103 42 32 58.7 38.3 28.7 9.3 7.6 6.1 9.6 20 21 — — — 1
Commercial & Professional Services Attractive 123 1.7 64 3 24 29 28 23 19.3 17.7 15.0 4.9 4.3 3.7 17.2 15.4 16.4 0.7 0.6 0.7 3
Commodity Chemicals
Asian Paints REDUCE 3,019 2,500 (17) 2,896 39.5 959 33 38 47 20 15 24 92 80 65 58.9 52.2 43.9 22.6 20.2 17.9 27 27 29 0.6 0.7 0.9 68
Berger Paints SELL 818 630 (23) 794 10.8 971 7 10 12 9 32 25 110 83 67 66.6 52.0 42.6 23.5 20.3 17.5 24 26 28 0.3 0.4 0.6 12
Kansai Nerolac REDUCE 578 610 6 311 4.2 539 10 12 15 1 21 26 58 48 38 37.3 31.6 25.3 7.5 6.9 6.2 13.6 15.1 17.3 0.5 0.7 0.9 2
Tata Chemicals SELL 737 540 (27) 188 2.6 255 11 32 36 (66) 198 14 69 23 20 11.4 7.9 7.2 1.3 1.3 1.3 2.0 5.7 6.5 1.4 4.3 4.9 58
Commodity Chemicals Neutral 4,189 57.1 1 29 23 90 69 57 49.4 40.6 34.2 12.1 11.3 10.5 13.5 16.3 18.5 0.6 0.8 1.0 140
Construction Materials
ACC REDUCE 2,021 1,950 (3) 379 5.2 188 75 95 106 4 27 11 27 21 19 12.9 10.8 9.4 3.0 2.7 2.5 11.7 13.5 13.5 0.7 1.2 1.3 24
Ambuja Cements REDUCE 339 320 (6) 673 9.2 1,986 13 13 16 28 1 22 25 25 21 11.4 9.3 7.6 3.0 2.7 2.4 11.3 11.2 12.4 5.3 0.8 0.9 26
Dalmia Bharat BUY 1,836 1,800 (2) 343 4.7 187 54 58 80 286 7 37 34 32 23 12.1 11.2 8 .8 2.7 2.5 2.3 8 .7 8.2 10.3 — — — 5
Grasim Industries ADD 1,470 1,520 3 967 13.2 657 68 86 108 (22) 27 25 22 17 14 9.3 7.7 6.2 1.5 1.3 1.2 7.3 8.3 9.4 0.6 0.6 0.5 34
J K Cement REDUCE 2,769 2,450 (12) 214 2.9 77 94 122 137 46 30 13 30 23 20 14.8 12.9 11.4 5.7 4.7 3.8 21 23 21 0.5 0.4 0.4 2
JK Lakshmi Cement ADD 559 550 (2) 66 0.9 118 38 39 43 60 4 11 15 14 13 7.9 7.1 6.5 3.1 2.6 2.2 23 20 18.7 0.7 1.1 1.2 5
Orient Cement ADD 135 140 4 28 0.4 205 10 10 11 147 (6) 9 13 14 13 6.2 6.0 6.2 2.1 1.9 1.7 17.7 14.5 14.2 1.5 1.5 1.5 2
Shree Cement SELL 28,225 20,000 (29) 1,018 13.9 36 641 833 983 47 30 18 44 34 29 25.2 19.8 16.8 6.7 5.6 4.8 16.4 18.1 18.0 0.2 0.2 0.2 24
The Ramco Cements SELL 1,022 800 (22) 241 3.3 236 32 34 43 26 4 27 32 30 24 17.4 14.9 12.0 4.2 3.7 3.3 14.2 13.0 14.6 0.3 0.3 0.4 9
UltraTech Cement REDUCE 6,587 6,300 (4) 1,901 25.9 289 193 245 282 (3) 27 15 34 27 23 17.0 14.1 12.5 4.3 3.8 3.4 13.4 15.0 15.3 0.6 0.3 0.4 48
Construction Materials Attractive 5,831 79.5 7 21 20 30 25 21 13.7 11.4 9.7 3.1 2.8 2.5 10.5 11.4 12.2 1.0 0.5 0.5 178
P/B (X) RoE (%) Dividend yield (%)
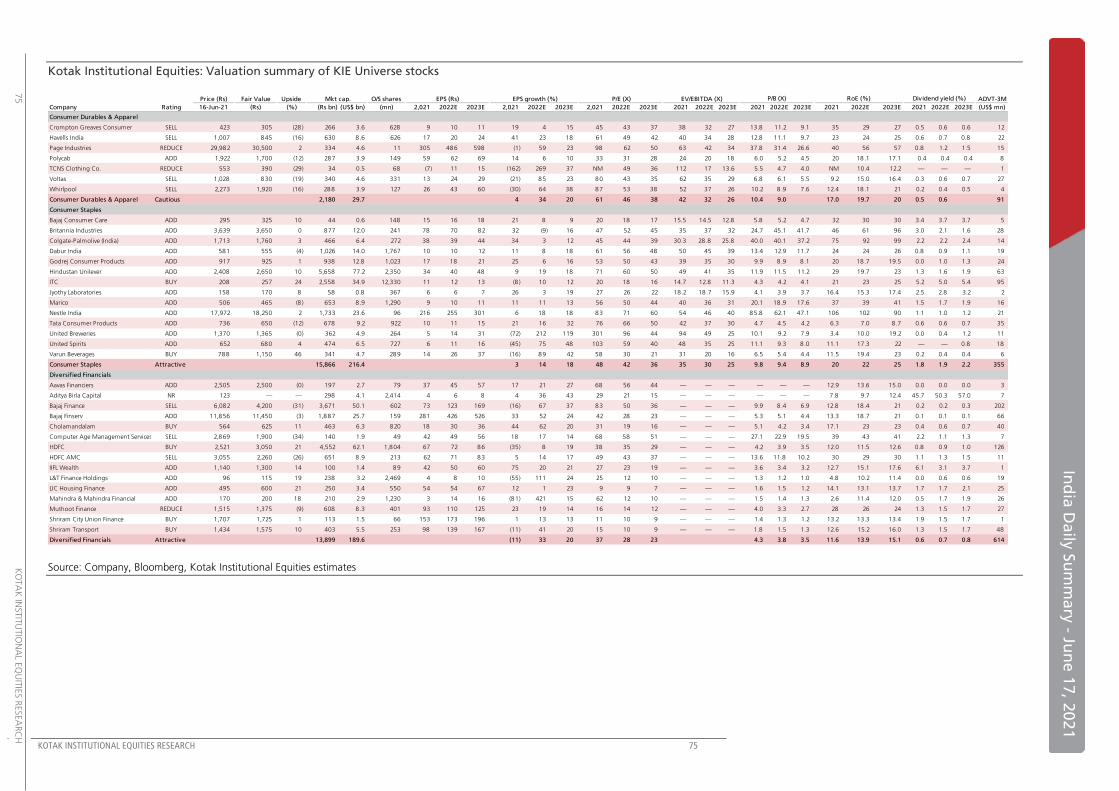
KOTAK INSTITUTIONAL EQUITIES RESEARCH 75
In
dia
Da
ily S
um
ma
ry - Ju
ne
17, 2
02
1
75
K
OTA
K IN
STIT
UTIO
NA
L EQ
UIT
IES R
ESEA
RC
H
Kotak Institutional Equities: Valuation summary of KIE Universe stocks
Source: Company, Bloomberg, Kotak Institutional Equities estimates
Price (Rs) Fair Value Upside Mkt cap. O/S shares EPS (Rs) EPS growth (%) P/E (X) EV/EBITDA (X) ADVT-3M
Company Rating 16-Jun-21 (Rs) (%) (Rs bn) (US$ bn) (mn) 2,021 2022E 2023E 2,021 2022E 2023E 2,021 2022E 2023E 2021 2022E 2023E 2021 2022E 2023E 2021 2022E 2023E 2021 2022E 2023E (US$ mn)
Consumer Durables & Apparel
Crompton Greaves Consumer SELL 423 305 (28) 266 3.6 628 9 10 11 19 4 15 45 43 37 38 32 27 13.8 11.2 9.1 35 29 27 0.5 0.6 0.6 12
Havells India SELL 1,007 845 (16) 630 8 .6 626 17 20 24 41 23 18 61 49 42 40 34 28 12.8 11.1 9.7 23 24 25 0.6 0.7 0.8 22
Page Industries REDUCE 29,982 30,500 2 334 4.6 11 305 486 598 (1) 59 23 98 62 50 63 42 34 37.8 31.4 26.6 40 56 57 0.8 1.2 1.5 15
Polycab ADD 1,922 1,700 (12) 287 3.9 149 59 62 69 14 6 10 33 31 28 24 20 18 6.0 5.2 4.5 20 18.1 17.1 0.4 0.4 0.4 8
TCNS Clothing Co. REDUCE 553 390 (29) 34 0.5 68 (7) 11 15 (162) 269 37 NM 49 36 112 17 13.6 5.5 4.7 4.0 NM 10.4 12.2 — — — 1
Voltas SELL 1,028 830 (19) 340 4.6 331 13 24 29 (21) 85 23 80 43 35 62 35 29 6.8 6.1 5.5 9.2 15.0 16.4 0.3 0.6 0.7 27
Whirlpool SELL 2,273 1,920 (16) 288 3.9 127 26 43 60 (30) 64 38 87 53 38 52 37 26 10.2 8 .9 7.6 12.4 18.1 21 0.2 0.4 0.5 4
Consumer Durables & Apparel Cautious 2,180 29.7 4 34 20 61 46 38 42 32 26 10.4 9.0 17.0 19.7 20 0.5 0.6 91
Consumer Staples
Bajaj Consumer Care ADD 295 325 10 44 0.6 148 15 16 18 21 8 9 20 18 17 15.5 14.5 12.8 5.8 5.2 4.7 32 30 30 3.4 3.7 3.7 5
Britannia Industries ADD 3,639 3,650 0 877 12.0 241 78 70 82 32 (9) 16 47 52 45 35 37 32 24.7 45.1 41.7 46 61 96 3.0 2.1 1.6 28
Colgate-Palmolive (India) ADD 1,713 1,760 3 466 6.4 272 38 39 44 34 3 12 45 44 39 30.3 28.8 25.8 40.0 40.1 37.2 75 92 99 2.2 2.2 2.4 14
Dabur India ADD 581 555 (4) 1,026 14.0 1,767 10 10 12 11 8 18 61 56 48 50 45 39 13.4 12.9 11.7 24 24 26 0.8 0.9 1.1 19
Godrej Consumer Products ADD 917 925 1 938 12.8 1,023 17 18 21 25 6 16 53 50 43 39 35 30 9.9 8 .9 8 .1 20 18.7 19.5 0.0 1.0 1.3 24
Hindustan Unilever ADD 2,408 2,650 10 5,658 77.2 2,350 34 40 48 9 19 18 71 60 50 49 41 35 11.9 11.5 11.2 29 19.7 23 1.3 1.6 1.9 63
ITC BUY 208 257 24 2,558 34.9 12,330 11 12 13 (8 ) 10 12 20 18 16 14.7 12.8 11.3 4.3 4.2 4.1 21 23 25 5.2 5.0 5.4 95
Jyothy Laboratories ADD 158 170 8 58 0.8 367 6 6 7 26 3 19 27 26 22 18.2 18.7 15.9 4.1 3.9 3.7 16.4 15.3 17.4 2.5 2.8 3.2 2
Marico ADD 506 465 (8 ) 653 8 .9 1,290 9 10 11 11 11 13 56 50 44 40 36 31 20.1 18.9 17.6 37 39 41 1.5 1.7 1.9 16
Nestle India ADD 17,972 18,250 2 1,733 23.6 96 216 255 301 6 18 18 83 71 60 54 46 40 85.8 62.1 47.1 106 102 90 1.1 1.0 1.2 21
Tata Consumer Products ADD 736 650 (12) 678 9.2 922 10 11 15 21 16 32 76 66 50 42 37 30 4.7 4.5 4.2 6.3 7.0 8.7 0.6 0.6 0.7 35
United Breweries ADD 1,370 1,365 (0) 362 4.9 264 5 14 31 (72) 212 119 301 96 44 94 49 25 10.1 9.2 7.9 3.4 10.0 19.2 0.0 0.4 1.2 11
United Spirits ADD 652 680 4 474 6.5 727 6 11 16 (45) 75 48 103 59 40 48 35 25 11.1 9.3 8 .0 11.1 17.3 22 — — 0.8 18
Varun Beverages BUY 788 1,150 46 341 4.7 289 14 26 37 (16) 89 42 58 30 21 31 20 16 6.5 5.4 4.4 11.5 19.4 23 0.2 0.4 0.4 6
Consumer Staples Attractive 15,866 216.4 3 14 18 48 42 36 35 30 25 9.8 9.4 8.9 20 22 25 1.8 1.9 2.2 355
Diversified Financials
Aavas Financiers ADD 2,505 2,500 (0) 197 2.7 79 37 45 57 17 21 27 68 56 44 — — — — — — 12.9 13.6 15.0 0.0 0.0 0.0 3
Aditya Birla Capital NR 123 — — 298 4.1 2,414 4 6 8 4 36 43 29 21 15 — — — — — — 7.8 9.7 12.4 45.7 50.3 57.0 7
Bajaj Finance SELL 6,082 4,200 (31) 3,671 50.1 602 73 123 169 (16) 67 37 83 50 36 — — — 9.9 8 .4 6.9 12.8 18.4 21 0.2 0.2 0.3 202
Bajaj Finserv ADD 11,856 11,450 (3) 1,887 25.7 159 281 426 526 33 52 24 42 28 23 — — — 5.3 5.1 4.4 13.3 18.7 21 0.1 0.1 0.1 66
Cholamandalam BUY 564 625 11 463 6.3 820 18 30 36 44 62 20 31 19 16 — — — 5.1 4.2 3.4 17.1 23 23 0.4 0.6 0.7 40
Computer Age Management Services SELL 2,869 1,900 (34) 140 1.9 49 42 49 56 18 17 14 68 58 51 — — — 27.1 22.9 19.5 39 43 41 2.2 1.1 1.3 7
HDFC BUY 2,521 3,050 21 4,552 62.1 1,804 67 72 86 (35) 8 19 38 35 29 — — — 4.2 3.9 3.5 12.0 11.5 12.6 0.8 0.9 1.0 126
HDFC AMC SELL 3,055 2,260 (26) 651 8 .9 213 62 71 83 5 14 17 49 43 37 — — — 13.6 11.8 10.2 30 29 30 1.1 1.3 1.5 11
IIFL Wealth ADD 1,140 1,300 14 100 1.4 89 42 50 60 75 20 21 27 23 19 — — — 3.6 3.4 3.2 12.7 15.1 17.6 6.1 3.1 3.7 1
L&T Finance Holdings ADD 96 115 19 238 3.2 2,469 4 8 10 (55) 111 24 25 12 10 — — — 1.3 1.2 1.0 4.8 10.2 11.4 0.0 0.6 0.6 19
LIC Housing Finance ADD 495 600 21 250 3.4 550 54 54 67 12 1 23 9 9 7 — — — 1.6 1.5 1.2 14.1 13.1 13.7 1.7 1.7 2.1 25
Mahindra & Mahindra Financial ADD 170 200 18 210 2.9 1,230 3 14 16 (81) 421 15 62 12 10 — — — 1.5 1.4 1.3 2.6 11.4 12.0 0.5 1.7 1.9 26
Muthoot Finance REDUCE 1,515 1,375 (9) 608 8 .3 401 93 110 125 23 19 14 16 14 12 — — — 4.0 3.3 2.7 28 26 24 1.3 1.5 1.7 27
Shriram City Union Finance BUY 1,707 1,725 1 113 1.5 66 153 173 196 1 13 13 11 10 9 — — — 1.4 1.3 1.2 13.2 13.3 13.4 1.9 1.5 1.7 1
Shriram Transport BUY 1,434 1,575 10 403 5.5 253 98 139 167 (11) 41 20 15 10 9 — — — 1.8 1.5 1.3 12.6 15.2 16.0 1.3 1.5 1.7 48
Diversified Financials Attractive 13,899 189.6 (11) 33 20 37 28 23 4.3 3.8 3.5 11.6 13.9 15.1 0.6 0.7 0.8 614
P/B (X) RoE (%) Dividend yield (%)
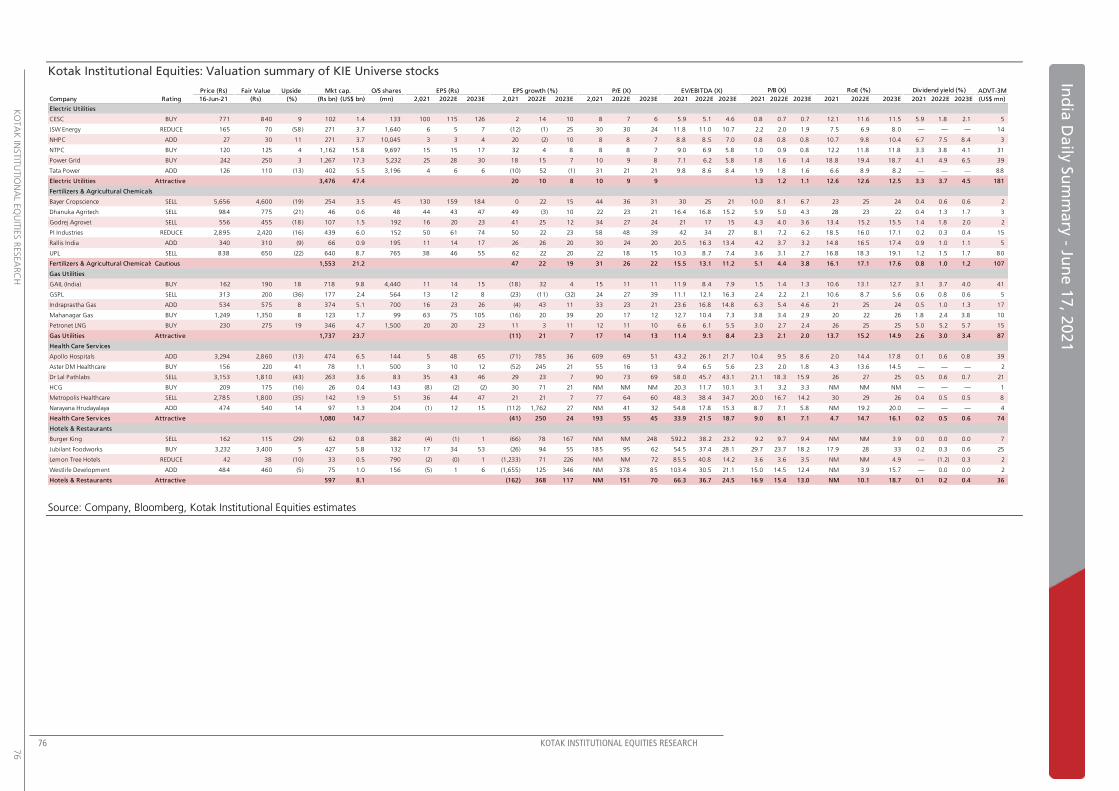
76 KOTAK INSTITUTIONAL EQUITIES RESEARCH
K
OTA
K IN
STIT
UTIO
NA
L EQ
UIT
IES R
ESEA
RC
H
76
Ind
ia D
aily
Su
mm
ary
- Jun
e 1
7, 2
02
1
Kotak Institutional Equities: Valuation summary of KIE Universe stocks
Source: Company, Bloomberg, Kotak Institutional Equities estimates
Price (Rs) Fair Value Upside Mkt cap. O/S shares EPS (Rs) EPS growth (%) P/E (X) EV/EBITDA (X) ADVT-3M
Company Rating 16-Jun-21 (Rs) (%) (Rs bn) (US$ bn) (mn) 2,021 2022E 2023E 2,021 2022E 2023E 2,021 2022E 2023E 2021 2022E 2023E 2021 2022E 2023E 2021 2022E 2023E 2021 2022E 2023E (US$ mn)
Electric Utilities
CESC BUY 771 840 9 102 1.4 133 100 115 126 2 14 10 8 7 6 5.9 5.1 4.6 0.8 0.7 0.7 12.1 11.6 11.5 5.9 1.8 2.1 5
JSW Energy REDUCE 165 70 (58) 271 3.7 1,640 6 5 7 (12) (1) 25 30 30 24 11.8 11.0 10.7 2.2 2.0 1.9 7.5 6.9 8.0 — — — 14
NHPC ADD 27 30 11 271 3.7 10,045 3 3 4 20 (2) 10 8 8 7 8 .8 8 .5 7.0 0.8 0.8 0.8 10.7 9.8 10.4 6.7 7.5 8.4 3
NTPC BUY 120 125 4 1,162 15.8 9,697 15 15 17 32 4 8 8 8 7 9.0 6.9 5.8 1.0 0.9 0.8 12.2 11.8 11.8 3.3 3.8 4.1 31
Power Grid BUY 242 250 3 1,267 17.3 5,232 25 28 30 18 15 7 10 9 8 7.1 6.2 5.8 1.8 1.6 1.4 18.8 19.4 18.7 4.1 4.9 6.5 39
Tata Power ADD 126 110 (13) 402 5.5 3,196 4 6 6 (10) 52 (1) 31 21 21 9.8 8 .6 8 .4 1.9 1.8 1.6 6.6 8.9 8.2 — — — 88
Electric Utilities Attractive 3,476 47.4 20 10 8 10 9 9 1.3 1.2 1.1 12.6 12.6 12.5 3.3 3.7 4.5 181
Fertilizers & Agricultural Chemicals
Bayer Cropscience SELL 5,656 4,600 (19) 254 3.5 45 130 159 184 0 22 15 44 36 31 30 25 21 10.0 8 .1 6.7 23 25 24 0.4 0.6 0.6 2
Dhanuka Agritech SELL 984 775 (21) 46 0.6 48 44 43 47 49 (3) 10 22 23 21 16.4 16.8 15.2 5.9 5.0 4.3 28 23 22 0.4 1.3 1.7 3
Godrej Agrovet SELL 556 455 (18) 107 1.5 192 16 20 23 41 25 12 34 27 24 21 17 15 4.3 4.0 3.6 13.4 15.2 15.5 1.4 1.8 2.0 2
PI Industries REDUCE 2,895 2,420 (16) 439 6.0 152 50 61 74 50 22 23 58 48 39 42 34 27 8 .1 7.2 6.2 18.5 16.0 17.1 0.2 0.3 0.4 15
Rallis India ADD 340 310 (9) 66 0.9 195 11 14 17 26 26 20 30 24 20 20.5 16.3 13.4 4.2 3.7 3.2 14.8 16.5 17.4 0.9 1.0 1.1 5
UPL SELL 838 650 (22) 640 8 .7 765 38 46 55 62 22 20 22 18 15 10.3 8 .7 7.4 3.6 3.1 2.7 16.8 18.3 19.1 1.2 1.5 1.7 80
Fertilizers & Agricultural Chemicals Cautious 1,553 21.2 47 22 19 31 26 22 15.5 13.1 11.2 5.1 4.4 3.8 16.1 17.1 17.6 0.8 1.0 1.2 107
Gas Utilities
GAIL (India) BUY 162 190 18 718 9.8 4,440 11 14 15 (18) 32 4 15 11 11 11.9 8 .4 7.9 1.5 1.4 1.3 10.6 13.1 12.7 3.1 3.7 4.0 41
GSPL SELL 313 200 (36) 177 2.4 564 13 12 8 (23) (11) (32) 24 27 39 11.1 12.1 16.3 2.4 2.2 2.1 10.6 8.7 5.6 0.6 0.8 0.6 5
Indraprastha Gas ADD 534 575 8 374 5.1 700 16 23 26 (4) 43 11 33 23 21 23.6 16.8 14.8 6.3 5.4 4.6 21 25 24 0.5 1.0 1.3 17
Mahanagar Gas BUY 1,249 1,350 8 123 1.7 99 63 75 105 (16) 20 39 20 17 12 12.7 10.4 7.3 3.8 3.4 2.9 20 22 26 1.8 2.4 3.8 10
Petronet LNG BUY 230 275 19 346 4.7 1,500 20 20 23 11 3 11 12 11 10 6.6 6.1 5.5 3.0 2.7 2.4 26 25 25 5.0 5.2 5.7 15
Gas Utilities Attractive 1,737 23.7 (11) 21 7 17 14 13 11.4 9.1 8.4 2.3 2.1 2.0 13.7 15.2 14.9 2.6 3.0 3.4 87
Health Care Services
Apollo Hospitals ADD 3,294 2,860 (13) 474 6.5 144 5 48 65 (71) 785 36 609 69 51 43.2 26.1 21.7 10.4 9.5 8 .6 2.0 14.4 17.8 0.1 0.6 0.8 39
Aster DM Healthcare BUY 156 220 41 78 1.1 500 3 10 12 (52) 245 21 55 16 13 9.4 6.5 5.6 2.3 2.0 1.8 4.3 13.6 14.5 — — — 2
Dr Lal Pathlabs SELL 3,153 1,810 (43) 263 3.6 83 35 43 46 29 23 7 90 73 69 58.0 45.7 43.1 21.1 18.3 15.9 26 27 25 0.5 0.6 0.7 21
HCG BUY 209 175 (16) 26 0.4 143 (8 ) (2) (2) 30 71 21 NM NM NM 20.3 11.7 10.1 3.1 3.2 3.3 NM NM NM — — — 1
Metropolis Healthcare SELL 2,785 1,800 (35) 142 1.9 51 36 44 47 21 21 7 77 64 60 48.3 38.4 34.7 20.0 16.7 14.2 30 29 26 0.4 0.5 0.5 8
Narayana Hrudayalaya ADD 474 540 14 97 1.3 204 (1) 12 15 (112) 1,762 27 NM 41 32 54.8 17.8 15.3 8 .7 7.1 5.8 NM 19.2 20.0 — — — 4
Health Care Services Attractive 1,080 14.7 (41) 250 24 193 55 45 33.9 21.5 18.7 9.0 8.1 7.1 4.7 14.7 16.1 0.2 0.5 0.6 74
Hotels & Restaurants
Burger King SELL 162 115 (29) 62 0.8 382 (4) (1) 1 (66) 78 167 NM NM 248 592.2 38.2 23.2 9.2 9.7 9.4 NM NM 3.9 0.0 0.0 0.0 7
Jubilant Foodworks BUY 3,232 3,400 5 427 5.8 132 17 34 53 (26) 94 55 185 95 62 54.5 37.4 28.1 29.7 23.7 18.2 17.9 28 33 0.2 0.3 0.6 25
Lemon Tree Hotels REDUCE 42 38 (10) 33 0.5 790 (2) (0) 1 (1,233) 71 226 NM NM 72 85.5 40.8 14.2 3.6 3.6 3.5 NM NM 4.9 — (1.2) 0.3 2
Westlife Development ADD 484 460 (5) 75 1.0 156 (5) 1 6 (1,655) 125 346 NM 378 85 103.4 30.5 21.1 15.0 14.5 12.4 NM 3.9 15.7 — 0.0 0.0 2
Hotels & Restaurants Attractive 597 8.1 (162) 368 117 NM 151 70 66.3 36.7 24.5 16.9 15.4 13.0 NM 10.1 18.7 0.1 0.2 0.4 36
P/B (X) RoE (%) Dividend yield (%)
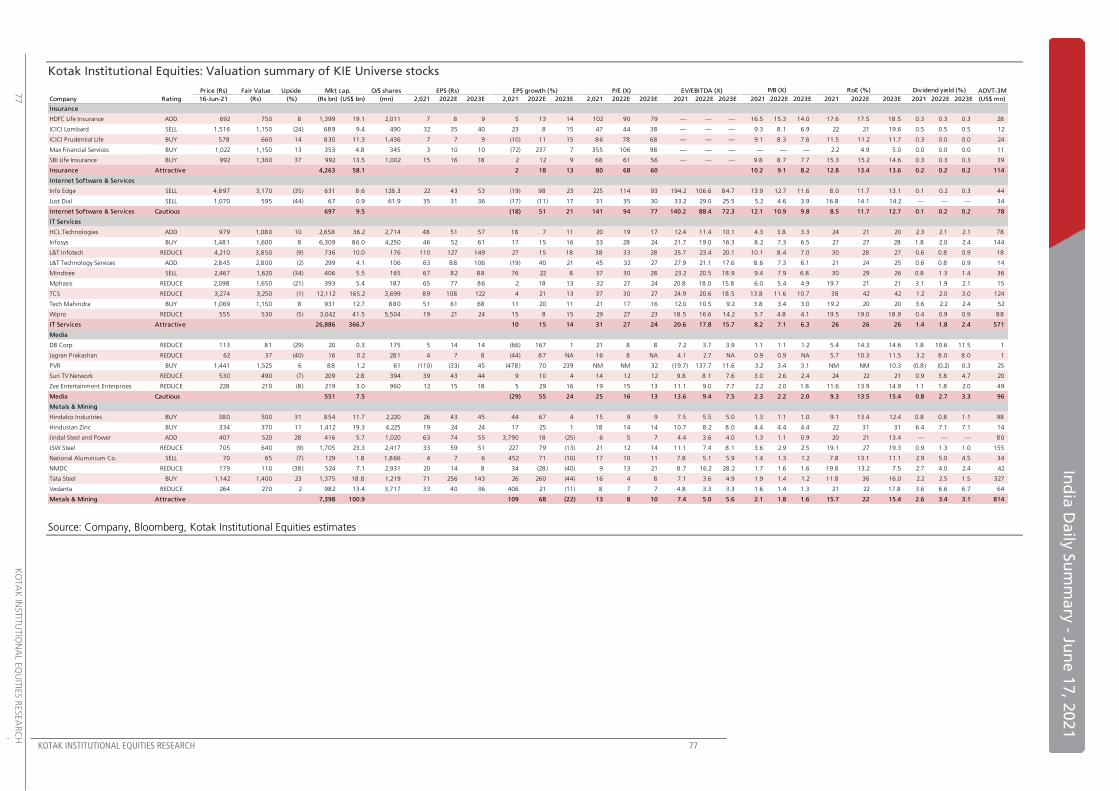
KOTAK INSTITUTIONAL EQUITIES RESEARCH 77
In
dia
Da
ily S
um
ma
ry - Ju
ne
17, 2
02
1
77
K
OTA
K IN
STIT
UTIO
NA
L EQ
UIT
IES R
ESEA
RC
H
Kotak Institutional Equities: Valuation summary of KIE Universe stocks
Source: Company, Bloomberg, Kotak Institutional Equities estimates
Price (Rs) Fair Value Upside Mkt cap. O/S shares EPS (Rs) EPS growth (%) P/E (X) EV/EBITDA (X) ADVT-3M
Company Rating 16-Jun-21 (Rs) (%) (Rs bn) (US$ bn) (mn) 2,021 2022E 2023E 2,021 2022E 2023E 2,021 2022E 2023E 2021 2022E 2023E 2021 2022E 2023E 2021 2022E 2023E 2021 2022E 2023E (US$ mn)
Insurance
HDFC Life Insurance ADD 692 750 8 1,399 19.1 2,011 7 8 9 5 13 14 102 90 79 — — — 16.5 15.3 14.0 17.6 17.5 18.5 0.3 0.3 0.3 28
ICICI Lombard SELL 1,516 1,150 (24) 689 9.4 490 32 35 40 23 8 15 47 44 38 — — — 9.3 8 .1 6.9 22 21 19.6 0.5 0.5 0.5 12
ICICI Prudential Life BUY 578 660 14 830 11.3 1,436 7 7 9 (10) 11 15 86 78 68 — — — 9.1 8 .3 7.6 11.5 11.2 11.7 0.3 0.0 0.0 24
Max Financial Services BUY 1,022 1,150 13 353 4.8 345 3 10 10 (72) 237 7 355 106 98 — — — — — — 2.2 4.9 5.0 0.0 0.0 0.0 11
SBI Life Insurance BUY 992 1,360 37 992 13.5 1,002 15 16 18 2 12 9 68 61 56 — — — 9.8 8 .7 7.7 15.3 15.2 14.6 0.3 0.3 0.3 39
Insurance Attractive 4,263 58.1 2 18 13 80 68 60 10.2 9.1 8.2 12.8 13.4 13.6 0.2 0.2 0.2 114
Internet Software & Services
Info Edge SELL 4,897 3,170 (35) 631 8 .6 128.3 22 43 53 (19) 98 23 225 114 93 194.2 106.6 84.7 13.9 12.7 11.6 8 .0 11.7 13.1 0.1 0.2 0.3 44
Just Dial SELL 1,070 595 (44) 67 0.9 61.9 35 31 36 (17) (11) 17 31 35 30 33.2 29.0 25.5 5.2 4.6 3.9 16.8 14.1 14.2 — — — 34
Internet Software & Services Cautious 697 9.5 (18) 51 21 141 94 77 140.2 88.4 72.3 12.1 10.9 9.8 8.5 11.7 12.7 0.1 0.2 0.2 78
IT Services
HCL Technologies ADD 979 1,080 10 2,658 36.2 2,714 48 51 57 18 7 11 20 19 17 12.4 11.4 10.1 4.3 3.8 3.3 24 21 20 2.3 2.1 2.1 78
Infosys BUY 1,481 1,600 8 6,309 86.0 4,250 46 52 61 17 15 16 33 28 24 21.7 19.0 16.3 8 .2 7.3 6.5 27 27 28 1.8 2.0 2.4 144
L&T Infotech REDUCE 4,210 3,850 (9) 736 10.0 176 110 127 149 27 15 18 38 33 28 25.7 23.4 20.1 10.1 8 .4 7.0 30 28 27 0.6 0.8 0.9 18
L&T Technology Services ADD 2,845 2,800 (2) 299 4.1 106 63 88 106 (19) 40 21 45 32 27 27.9 21.1 17.6 8 .6 7.3 6.1 21 24 25 0.6 0.8 0.9 14
Mindtree SELL 2,467 1,620 (34) 406 5.5 165 67 82 88 76 22 8 37 30 28 23.2 20.5 18.9 9.4 7.9 6.8 30 29 26 0.8 1.3 1.4 36
Mphasis REDUCE 2,098 1,650 (21) 393 5.4 187 65 77 86 2 18 13 32 27 24 20.8 18.0 15.8 6.0 5.4 4.9 19.7 21 21 3.1 1.9 2.1 15
TCS REDUCE 3,274 3,250 (1) 12,112 165.2 3,699 89 108 122 4 21 13 37 30 27 24.9 20.6 18.5 13.8 11.6 10.7 38 42 42 1.2 2.0 3.0 124
Tech Mahindra BUY 1,069 1,150 8 931 12.7 880 51 61 68 11 20 11 21 17 16 12.0 10.5 9.2 3.8 3.4 3.0 19.2 20 20 3.6 2.2 2.4 52
Wipro REDUCE 555 530 (5) 3,042 41.5 5,504 19 21 24 15 8 15 29 27 23 18.5 16.6 14.2 5.7 4.8 4.1 19.5 19.0 18.9 0.4 0.9 0.9 88
IT Services Attractive 26,886 366.7 10 15 14 31 27 24 20.6 17.8 15.7 8.2 7.1 6.3 26 26 26 1.4 1.8 2.4 571
Media
DB Corp. REDUCE 113 81 (29) 20 0.3 175 5 14 14 (66) 167 1 21 8 8 7.2 3.7 3.9 1.1 1.1 1.2 5.4 14.3 14.6 1.8 10.6 11.5 1
Jagran Prakashan REDUCE 62 37 (40) 16 0.2 281 4 7 8 (44) 87 NA 16 8 NA 4.1 2.7 NA 0.9 0.9 NA 5.7 10.3 11.5 3.2 8.0 8.0 1
PVR BUY 1,441 1,525 6 88 1.2 61 (110) (33) 45 (478) 70 239 NM NM 32 (19.7) 137.7 11.6 3.2 3.4 3.1 NM NM 10.3 (0.8) (0.2) 0.3 25
Sun TV Network REDUCE 530 490 (7) 209 2.8 394 39 43 44 9 10 4 14 12 12 9.8 8 .1 7.6 3.0 2.6 2.4 24 22 21 0.9 3.8 4.7 20
Zee Entertainment Enterprises REDUCE 228 210 (8 ) 219 3.0 960 12 15 18 5 29 16 19 15 13 11.1 9.0 7.7 2.2 2.0 1.8 11.6 13.9 14.9 1.1 1.8 2.0 49
Media Cautious 551 7.5 (29) 55 24 25 16 13 13.6 9.4 7.5 2.3 2.2 2.0 9.3 13.5 15.4 0.8 2.7 3.3 96
Metals & Mining
Hindalco Industries BUY 380 500 31 854 11.7 2,220 26 43 45 44 67 4 15 9 9 7.5 5.5 5.0 1.3 1.1 1.0 9.1 13.4 12.4 0.8 0.8 1.1 98
Hindustan Zinc BUY 334 370 11 1,412 19.3 4,225 19 24 24 17 25 1 18 14 14 10.7 8 .2 8 .0 4.4 4.4 4.4 22 31 31 6.4 7.1 7.1 14
Jindal Steel and Power ADD 407 520 28 416 5.7 1,020 63 74 55 3,790 18 (25) 6 5 7 4.4 3.6 4.0 1.3 1.1 0.9 20 21 13.4 — — — 80
JSW Steel REDUCE 705 640 (9) 1,705 23.3 2,417 33 59 51 227 79 (13) 21 12 14 11.1 7.4 8 .1 3.6 2.9 2.5 19.1 27 19.3 0.9 1.3 1.0 155
National Aluminium Co. SELL 70 65 (7) 129 1.8 1,866 4 7 6 452 71 (10) 17 10 11 7.8 5.1 5.9 1.4 1.3 1.2 7.8 13.1 11.1 2.9 5.0 4.5 34
NMDC REDUCE 179 110 (38) 524 7.1 2,931 20 14 8 34 (28) (40) 9 13 21 8 .7 16.2 28.2 1.7 1.6 1.6 19.8 13.2 7.5 2.7 4.0 2.4 42
Tata Steel BUY 1,142 1,400 23 1,375 18.8 1,219 71 256 143 26 260 (44) 16 4 8 7.1 3.6 4.9 1.9 1.4 1.2 11.8 36 16.0 2.2 2.5 1.5 327
Vedanta REDUCE 264 270 2 982 13.4 3,717 33 40 36 406 21 (11) 8 7 7 4.8 3.3 3.3 1.6 1.4 1.3 21 22 17.8 3.6 6.6 6.7 64
Metals & Mining Attractive 7,398 100.9 109 68 (22) 13 8 10 7.4 5.0 5.6 2.1 1.8 1.6 15.7 22 15.4 2.6 3.4 3.1 814
P/B (X) RoE (%) Dividend yield (%)
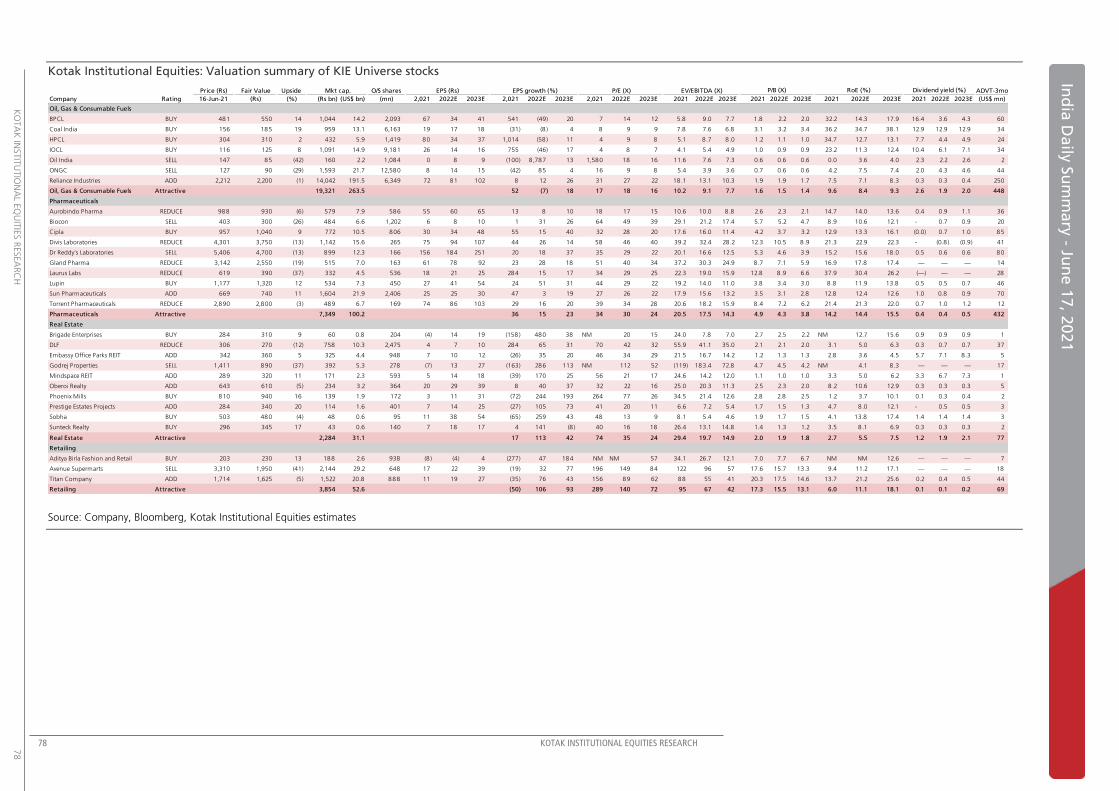
78 KOTAK INSTITUTIONAL EQUITIES RESEARCH
K
OTA
K IN
STIT
UTIO
NA
L EQ
UIT
IES R
ESEA
RC
H
78
Ind
ia D
aily
Su
mm
ary
- Jun
e 1
7, 2
02
1
Kotak Institutional Equities: Valuation summary of KIE Universe stocks
Source: Company, Bloomberg, Kotak Institutional Equities estimates
Price (Rs) Fair Value Upside Mkt cap. O/S shares EPS (Rs) EPS growth (%) P/E (X) EV/EBITDA (X) ADVT-3mo
Company Rating 16-Jun-21 (Rs) (%) (Rs bn) (US$ bn) (mn) 2,021 2022E 2023E 2,021 2022E 2023E 2,021 2022E 2023E 2021 2022E 2023E 2021 2022E 2023E 2021 2022E 2023E 2021 2022E 2023E (US$ mn)
Oil, Gas & Consumable Fuels
BPCL BUY 481 550 14 1,044 14.2 2,093 67 34 41 541 (49) 20 7 14 12 5.8 9.0 7.7 1.8 2.2 2.0 32.2 14.3 17.9 16.4 3.6 4.3 60
Coal India BUY 156 185 19 959 13.1 6,163 19 17 18 (31) (8 ) 4 8 9 9 7.8 7.6 6.8 3.1 3.2 3.4 36.2 34.7 38.1 12.9 12.9 12.9 34
HPCL BUY 304 310 2 432 5.9 1,419 80 34 37 1,014 (58) 11 4 9 8 5.1 8 .7 8 .0 1.2 1.1 1.0 34.7 12.7 13.1 7.7 4.4 4.9 24
IOCL BUY 116 125 8 1,091 14.9 9,181 26 14 16 755 (46) 17 4 8 7 4.1 5.4 4.9 1.0 0.9 0.9 23.2 11.3 12.4 10.4 6.1 7.1 34
Oil India SELL 147 85 (42) 160 2.2 1,084 0 8 9 (100) 8 ,787 13 1,580 18 16 11.6 7.6 7.3 0.6 0.6 0.6 0.0 3.6 4.0 2.3 2.2 2.6 2
ONGC SELL 127 90 (29) 1,593 21.7 12,580 8 14 15 (42) 85 4 16 9 8 5.4 3.9 3.6 0.7 0.6 0.6 4.2 7.5 7.4 2.0 4.3 4.6 44
Reliance Industries ADD 2,212 2,200 (1) 14,042 191.5 6,349 72 81 102 8 12 26 31 27 22 18.1 13.1 10.3 1.9 1.9 1.7 7.5 7.1 8 .3 0.3 0.3 0.4 250
Oil, Gas & Consumable Fuels Attractive 19,321 263.5 52 (7) 18 17 18 16 10.2 9.1 7.7 1.6 1.5 1.4 9.6 8.4 9.3 2.6 1.9 2.0 448
Pharmaceuticals
Aurobindo Pharma REDUCE 988 930 (6) 579 7.9 586 55 60 65 13 8 10 18 17 15 10.6 10.0 8 .8 2.6 2.3 2.1 14.7 14.0 13.6 0.4 0.9 1.1 36
Biocon SELL 403 300 (26) 484 6.6 1,202 6 8 10 1 31 26 64 49 39 29.1 21.2 17.4 5.7 5.2 4.7 8 .9 10.6 12.1 - 0.7 0.9 20
Cipla BUY 957 1,040 9 772 10.5 806 30 34 48 55 15 40 32 28 20 17.6 16.0 11.4 4.2 3.7 3.2 12.9 13.3 16.1 (0.0) 0.7 1.0 85
Divis Laboratories REDUCE 4,301 3,750 (13) 1,142 15.6 265 75 94 107 44 26 14 58 46 40 39.2 32.4 28.2 12.3 10.5 8 .9 21.3 22.9 22.3 - (0.8 ) (0.9) 41
Dr Reddy's Laboratories SELL 5,406 4,700 (13) 899 12.3 166 156 184 251 20 18 37 35 29 22 20.1 16.6 12.5 5.3 4.6 3.9 15.2 15.6 18.0 0.5 0.6 0.6 80
Gland Pharma REDUCE 3,142 2,550 (19) 515 7.0 163 61 78 92 23 28 18 51 40 34 37.2 30.3 24.9 8 .7 7.1 5.9 16.9 17.8 17.4 — — — 14
Laurus Labs REDUCE 619 390 (37) 332 4.5 536 18 21 25 284 15 17 34 29 25 22.3 19.0 15.9 12.8 8 .9 6.6 37.9 30.4 26.2 (—) — — 28
Lupin BUY 1,177 1,320 12 534 7.3 450 27 41 54 24 51 31 44 29 22 19.2 14.0 11.0 3.8 3.4 3.0 8 .8 11.9 13.8 0.5 0.5 0.7 46
Sun Pharmaceuticals ADD 669 740 11 1,604 21.9 2,406 25 25 30 47 3 19 27 26 22 17.9 15.6 13.2 3.5 3.1 2.8 12.8 12.4 12.6 1.0 0.8 0.9 70
Torrent Pharmaceuticals REDUCE 2,890 2,800 (3) 489 6.7 169 74 86 103 29 16 20 39 34 28 20.6 18.2 15.9 8 .4 7.2 6.2 21.4 21.3 22.0 0.7 1.0 1.2 12
Pharmaceuticals Attractive 7,349 100.2 36 15 23 34 30 24 20.5 17.5 14.3 4.9 4.3 3.8 14.2 14.4 15.5 0.4 0.4 0.5 432
Real Estate
Brigade Enterprises BUY 284 310 9 60 0.8 204 (4) 14 19 (158) 480 38 NM 20 15 24.0 7.8 7.0 2.7 2.5 2.2 NM 12.7 15.6 0.9 0.9 0.9 1
DLF REDUCE 306 270 (12) 758 10.3 2,475 4 7 10 284 65 31 70 42 32 55.9 41.1 35.0 2.1 2.1 2.0 3.1 5.0 6.3 0.3 0.7 0.7 37
Embassy Office Parks REIT ADD 342 360 5 325 4.4 948 7 10 12 (26) 35 20 46 34 29 21.5 16.7 14.2 1.2 1.3 1.3 2.8 3.6 4.5 5.7 7.1 8 .3 5
Godrej Properties SELL 1,411 890 (37) 392 5.3 278 (7) 13 27 (163) 286 113 NM 112 52 (119) 183.4 72.8 4.7 4.5 4.2 NM 4.1 8 .3 — — — 17
Mindspace REIT ADD 289 320 11 171 2.3 593 5 14 18 (39) 170 25 56 21 17 24.6 14.2 12.0 1.1 1.0 1.0 3.3 5.0 6.2 3.3 6.7 7.3 1
Oberoi Realty ADD 643 610 (5) 234 3.2 364 20 29 39 8 40 37 32 22 16 25.0 20.3 11.3 2.5 2.3 2.0 8 .2 10.6 12.9 0.3 0.3 0.3 5
Phoenix Mills BUY 810 940 16 139 1.9 172 3 11 31 (72) 244 193 264 77 26 34.5 21.4 12.6 2.8 2.8 2.5 1.2 3.7 10.1 0.1 0.3 0.4 2
Prestige Estates Projects ADD 284 340 20 114 1.6 401 7 14 25 (27) 105 73 41 20 11 6.6 7.2 5.4 1.7 1.5 1.3 4.7 8 .0 12.1 - 0.5 0.5 3
Sobha BUY 503 480 (4) 48 0.6 95 11 38 54 (65) 259 43 48 13 9 8 .1 5.4 4.6 1.9 1.7 1.5 4.1 13.8 17.4 1.4 1.4 1.4 3
Sunteck Realty BUY 296 345 17 43 0.6 140 7 18 17 4 141 (8 ) 40 16 18 26.4 13.1 14.8 1.4 1.3 1.2 3.5 8 .1 6.9 0.3 0.3 0.3 2
Real Estate Attractive 2,284 31.1 17 113 42 74 35 24 29.4 19.7 14.9 2.0 1.9 1.8 2.7 5.5 7.5 1.2 1.9 2.1 77
Retailing
Aditya Birla Fashion and Retail BUY 203 230 13 188 2.6 938 (8 ) (4) 4 (277) 47 184 NM NM 57 34.1 26.7 12.1 7.0 7.7 6.7 NM NM 12.6 — — — 7
Avenue Supermarts SELL 3,310 1,950 (41) 2,144 29.2 648 17 22 39 (19) 32 77 196 149 84 122 96 57 17.6 15.7 13.3 9.4 11.2 17.1 — — — 18
Titan Company ADD 1,714 1,625 (5) 1,522 20.8 888 11 19 27 (35) 76 43 156 89 62 88 55 41 20.3 17.5 14.6 13.7 21.2 25.6 0.2 0.4 0.5 44
Retailing Attractive 3,854 52.6 (50) 106 93 289 140 72 95 67 42 17.3 15.5 13.1 6.0 11.1 18.1 0.1 0.1 0.2 69
P/B (X) RoE (%) Dividend yield (%)
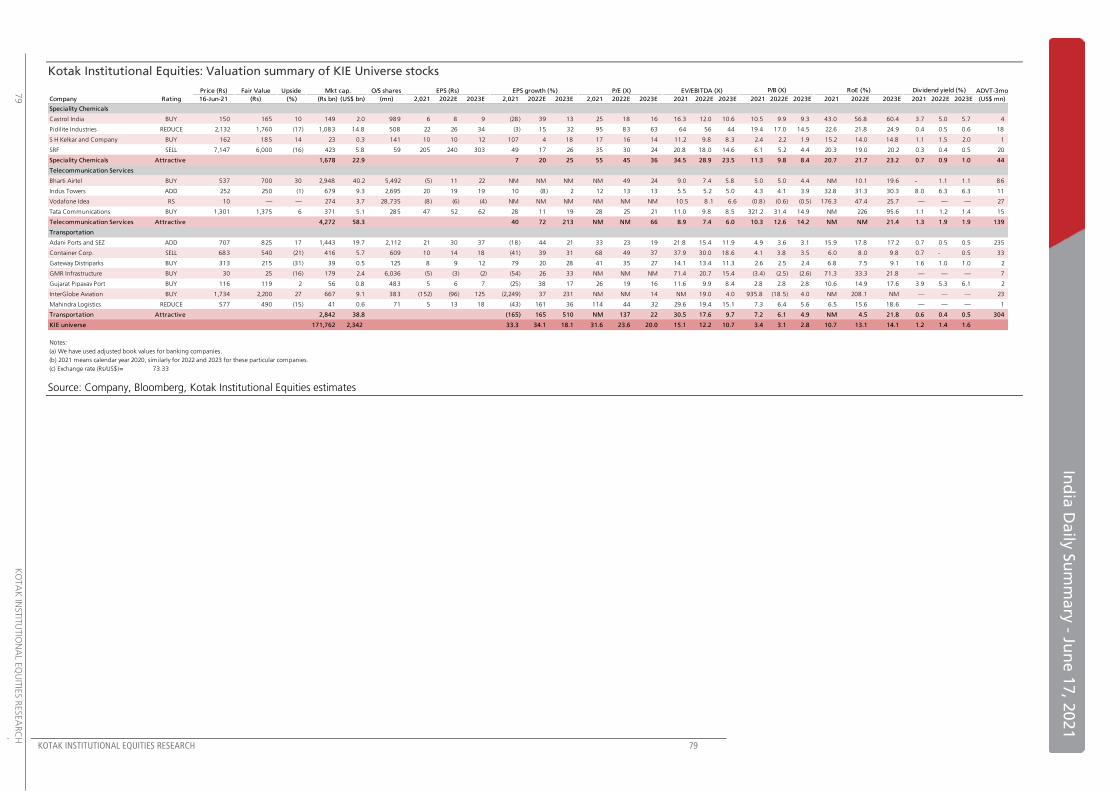
KOTAK INSTITUTIONAL EQUITIES RESEARCH 79
In
dia
Da
ily S
um
ma
ry - Ju
ne
17, 2
02
1
79
K
OTA
K IN
STIT
UTIO
NA
L EQ
UIT
IES R
ESEA
RC
H
Kotak Institutional Equities: Valuation summary of KIE Universe stocks
Source: Company, Bloomberg, Kotak Institutional Equities estimates
Price (Rs) Fair Value Upside Mkt cap. O/S shares EPS (Rs) EPS growth (%) P/E (X) EV/EBITDA (X) ADVT-3mo
Company Rating 16-Jun-21 (Rs) (%) (Rs bn) (US$ bn) (mn) 2,021 2022E 2023E 2,021 2022E 2023E 2,021 2022E 2023E 2021 2022E 2023E 2021 2022E 2023E 2021 2022E 2023E 2021 2022E 2023E (US$ mn)
Speciality Chemicals
Castrol India BUY 150 165 10 149 2.0 989 6 8 9 (28) 39 13 25 18 16 16.3 12.0 10.6 10.5 9.9 9.3 43.0 56.8 60.4 3.7 5.0 5.7 4
Pidilite Industries REDUCE 2,132 1,760 (17) 1,083 14.8 508 22 26 34 (3) 15 32 95 83 63 64 56 44 19.4 17.0 14.5 22.6 21.8 24.9 0.4 0.5 0.6 18
S H Kelkar and Company BUY 162 185 14 23 0.3 141 10 10 12 107 4 18 17 16 14 11.2 9.8 8 .3 2.4 2.2 1.9 15.2 14.0 14.8 1.1 1.5 2.0 1
SRF SELL 7,147 6,000 (16) 423 5.8 59 205 240 303 49 17 26 35 30 24 20.8 18.0 14.6 6.1 5.2 4.4 20.3 19.0 20.2 0.3 0.4 0.5 20
Speciality Chemicals Attractive 1,678 22.9 7 20 25 55 45 36 34.5 28.9 23.5 11.3 9.8 8.4 20.7 21.7 23.2 0.7 0.9 1.0 44
Telecommunication Services
Bharti Airtel BUY 537 700 30 2,948 40.2 5,492 (5) 11 22 NM NM NM NM 49 24 9.0 7.4 5.8 5.0 5.0 4.4 NM 10.1 19.6 - 1.1 1.1 86
Indus Towers ADD 252 250 (1) 679 9.3 2,695 20 19 19 10 (8 ) 2 12 13 13 5.5 5.2 5.0 4.3 4.1 3.9 32.8 31.3 30.3 8 .0 6.3 6.3 11
Vodafone Idea RS 10 — — 274 3.7 28,735 (8 ) (6) (4) NM NM NM NM NM NM 10.5 8.1 6.6 (0.8) (0.6) (0.5) 176.3 47.4 25.7 — — — 27
Tata Communications BUY 1,301 1,375 6 371 5.1 285 47 52 62 28 11 19 28 25 21 11.0 9.8 8 .5 321.2 31.4 14.9 NM 226 95.6 1.1 1.2 1.4 15
Telecommunication Services Attractive 4,272 58.3 40 72 213 NM NM 66 8.9 7.4 6.0 10.3 12.6 14.2 NM NM 21.4 1.3 1.9 1.9 139
Transportation
Adani Ports and SEZ ADD 707 825 17 1,443 19.7 2,112 21 30 37 (18) 44 21 33 23 19 21.8 15.4 11.9 4.9 3.6 3.1 15.9 17.8 17.2 0.7 0.5 0.5 235
Container Corp. SELL 683 540 (21) 416 5.7 609 10 14 18 (41) 39 31 68 49 37 37.9 30.0 18.6 4.1 3.8 3.5 6.0 8 .0 9.8 0.7 - 0.5 33
Gateway Distriparks BUY 313 215 (31) 39 0.5 125 8 9 12 79 20 28 41 35 27 14.1 13.4 11.3 2.6 2.5 2.4 6.8 7.5 9.1 1.6 1.0 1.0 2
GMR Infrastructure BUY 30 25 (16) 179 2.4 6,036 (5) (3) (2) (54) 26 33 NM NM NM 71.4 20.7 15.4 (3.4) (2.5) (2.6) 71.3 33.3 21.8 — — — 7
Gujarat Pipavav Port BUY 116 119 2 56 0.8 483 5 6 7 (25) 38 17 26 19 16 11.6 9.9 8 .4 2.8 2.8 2.8 10.6 14.9 17.6 3.9 5.3 6.1 2
InterGlobe Aviation BUY 1,734 2,200 27 667 9.1 383 (152) (96) 125 (2,249) 37 231 NM NM 14 NM 19.0 4.0 935.8 (18.5) 4.0 NM 208.1 NM — — — 23
Mahindra Logistics REDUCE 577 490 (15) 41 0.6 71 5 13 18 (43) 161 36 114 44 32 29.6 19.4 15.1 7.3 6.4 5.6 6.5 15.6 18.6 — — — 1
Transportation Attractive 2,842 38.8 (165) 165 510 NM 137 22 30.5 17.6 9.7 7.2 6.1 4.9 NM 4.5 21.8 0.6 0.4 0.5 304
KIE universe 171,762 2,342 33.3 34.1 18.1 31.6 23.6 20.0 15.1 12.2 10.7 3.4 3.1 2.8 10.7 13.1 14.1 1.2 1.4 1.6
Notes:
(a) We have used adjusted book values for banking companies.
(b) 2021 means calendar year 2020, similarly for 2022 and 2023 for these particular companies.
(c) Exchange rate (Rs/US$)= 73.33
P/B (X) RoE (%) Dividend yield (%)
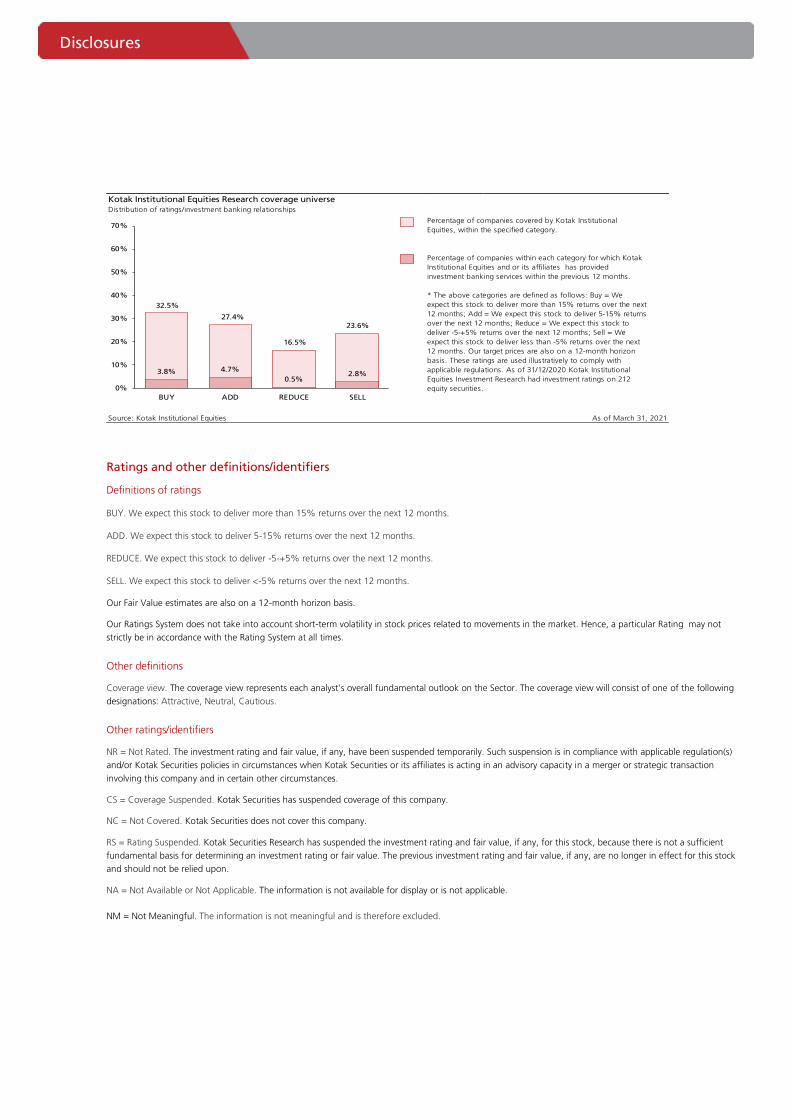
Disclo
sure
s
Disclosures
Ratings and other definitions/identifiers
Definitions of ratings
BUY. We expect this stock to deliver more than 15% returns over the next 12 months.
ADD. We expect this stock to deliver 5-15% returns over the next 12 months.
REDUCE. We expect this stock to deliver -5-+5% returns over the next 12 months.
SELL. We expect this stock to deliver <-5% returns over the next 12 months.
Our Fair Value estimates are also on a 12-month horizon basis.
Our Ratings System does not take into account short-term volatility in stock prices related to movements in the market. Hence, a particular Rating may not
strictly be in accordance with the Rating System at all times.
Other definitions
Coverage view. The coverage view represents each analyst’s overall fundamental outlook on the Sector. The coverage view will consist of one of the following
designations: Attractive, Neutral, Cautious.
Other ratings/identifiers
NR = Not Rated. The investment rating and fair value, if any, have been suspended temporarily. Such suspension is in compliance with applicable regulation(s)
and/or Kotak Securities policies in circumstances when Kotak Securities or its affiliates is acting in an advisory capacity in a merger or strategic transaction
involving this company and in certain other circumstances.
CS = Coverage Suspended. Kotak Securities has suspended coverage of this company.
NC = Not Covered. Kotak Securities does not cover this company.
RS = Rating Suspended. Kotak Securities Research has suspended the investment rating and fair value, if any, for this stock, because there is not a sufficient
fundamental basis for determining an investment rating or fair value. The previous investment rating and fair value, if any, are no longer in effect for this stock
and should not be relied upon.
NA = Not Available or Not Applicable. The information is not available for display or is not applicable.
NM = Not Meaningful. The information is not meaningful and is therefore excluded.
Kotak Institutional Equities Research coverage universeDistribution of ratings/investment banking relationships
Source: Kotak Institutional Equities As of March 31, 2021
Percentage of companies covered by Kotak Institutional
Equities, within the specified category.
* The above categories are defined as follows: Buy = We
expect this stock to deliver more than 15% returns over the next
12 months; Add = We expect this stock to deliver 5-15% returns
over the next 12 months; Reduce = We expect this stock to
deliver -5-+5% returns over the next 12 months; Sell = We
expect this stock to deliver less than -5% returns over the next
12 months. Our target prices are also on a 12-month horizon
basis. These ratings are used illustratively to comply with
applicable regulations. As of 31/12/2020 Kotak Institutional
Equities Investment Research had investment ratings on 212
equity securities.
Percentage of companies within each category for which Kotak
Institutional Equities and or its affiliates has provided
investment banking services within the previous 12 months.
32.5%
27.4%
16.5%
23.6%
3.8% 4.7%
0.5%2.8%
0%
10%
20%
30%
40%
50%
60%
70%
BUY ADD REDUCE SELL
Corporate Office Overseas Affiliates
Kotak Securities Ltd.
27 BKC, Plot No. C-27, “G Block”
Bandra Kurla Complex, Bandra (E)
Mumbai 400 051, India
Tel: +91-22-43360000
Kotak Mahindra (UK) Ltd
8th Floor, Portsoken House
155-157 Minories
London EC3N 1LS
Tel: +44-20-7977-6900
Kotak Mahindra Inc
369 Lexington Avenue
28th Floor, New York
NY 10017, USA
Tel:+1 212 600 8856
Copyright 2021 Kotak Institutional Equities (Kotak Securities Limited). All rights reserved. 1. Note that the research analysts contributing to this report may not be registered/qualified as research analysts with FINRA; and
2. Such research analysts may not be associated persons of Kotak Mahindra Inc and therefore, may not be subject to NASD Rule 2711 restrictions on communications with a subject company, public appearances and trading securities held by a research analyst account.
3. Any U.S. recipients of the research who wish to effect transactions in any security covered by the report should do so with or through Kotak Mahindra Inc and (ii) any transactions inthe securities covered by the research by U.S. recipients must be effected only through Kotak Mahindra Inc at [email protected].
This report is distributed in Singapore by Kotak Mahindra (UK) Limited (Singapore Branch) to institutional investors, accredited investors or expert investors only as defined under the Securities and Futures Act. Recipients of this analysis / report are to contact Kotak Mahindra (UK) Limited (Singapore Branch) (16 Raffles Quay, #35-02/03, Hong Leong Building, Singapore 048581) in respect of any matters arising from, or in connection with, this analysis / report. Kotak Mahindra (UK) Limited (Singapore Branch) is regulated by the Monetary Authority of Singapore. Kotak Securities Limited and its affiliates are a full-service, integrated investment banking, investment management, brokerage and financing group. We along with our affiliates are leading underwriter of securities and participants in virtually all securities trading markets in India. We and our affiliates have investment banking and other business relationships with a significant percentage of the companies covered by our Investment Research Department. Our research professionals provide important input into our investment banking and other business selection processes. Investors should assume that Kotak Securities Limited and/or its affiliates are seeking or will seek investment banking or other business from the company or companies that are the subject of this material and that the research professionals who were involved in preparing this material may participate in the solicitation of such business. Our research professionals are paid in part based on the profitability of Kotak Securities Limited, which include earnings from investment banking and other business. Kotak Securities Limited generally prohibits its analysts, persons reporting to analysts, and members of their households from maintaining a financial interest in the securities or derivatives of any companies that the analysts cover. Additionally, Kotak Securities Limited generally prohibits its analysts and persons reporting to analysts from serving as an officer, director, or advisory board member of any companies that the analysts cover. Our salespeople, traders, and other professionals may provide oral or written market commentary or trading strategies to our clients that reflect opinions that are contrary to the opinions expressed herein, and our proprietary trading and investing businesses may make investment decisions that are inconsistent with the recommendations expressed herein. In reviewing these materials, you should be aware that any or all of the foregoing, among other things, may give rise to real or potential conflicts of interest. Additionally, other important information regarding our relationships with the company or companies that are the subject of this material is provided herein. This material should not be construed as an offer to sell or the solicitation of an offer to buy any security in any jurisdiction where such an offer or solicitation would be illegal. We are not soliciting any action based on this material. It is for the general information of clients of Kotak Securities Limited. It does not constitute a personal recommendation or take into account the particular investment objectives, financial situations, or needs of individual clients. Before acting on any advice or recommendation in this material, clients should consider whether it is suitable for their particular circumstances and, if necessary, seek professional advice. The price and value of the investments referred to in this material and the income from them may go down as well as up, and investors may realize losses on any investments. Past performance is not a guide for future performance, future returns are not guaranteed and a loss of original capital may occur. Kotak Securities Limited does not provide tax advise to its clients, and all investors are strongly advised to consult with their tax advisers regarding any potential investment. Certain transactions -including those involving futures, options, and other derivatives as well as non-investment-grade securities - give rise to substantial risk and are not suitable for all investors. The material is based on information that we consider reliable, but we do not represent that it is accurate or complete, and it should not be relied on as such. Opinions expressed are our current opinions as of the date appearing on this material only. We endeavor to update on a reasonable basis the information discussed in this material, but regulatory, compliance, or other reasons may prevent us from doing so. We and our affiliates, officers, directors, and employees, including persons involved in the preparation or issuance of this material, may from time to time have "long" or "short" positions in, act as principal in, and buy or sell the securities or derivatives thereof of companies mentioned herein. Kotak Securities Limited and its non US affiliates may, to the extent permissible under applicable laws, have acted on or used this research to the extent that it relates to non US issuers, prior to or immediately following its publication. Foreign currency denominated securities are subject to fluctuations in exchange rates that could have an adverse effect on the value or price of or income derived from the investment. In addition, investors in securities such as ADRs, the value of which are influenced by foreign currencies affectively assume currency risk. In addition options involve risks and are not suitable for all investors. Please ensure that you have read and understood the current derivatives risk disclosure document before entering into any derivative transactions. Kotak Securities Limited established in 1994, is a subsidiary of Kotak Mahindra Bank Limited. Kotak Securities is one of India's largest brokerage and distribution house. Kotak Securities Limited is a corporate trading and clearing member of Bombay Stock Exchange Limited (BSE), National Stock Exchange of India Limited (NSE), Metropolitan Stock Exchange of India Limited (MSE), National Commodity and Derivatives Exchange (NCDEX) and Multi Commodity Exchange(MCX). Our businesses include stock broking, services rendered in connection with distribution of primary market issues and financial products like mutual funds and fixed deposits, depository services and Portfolio Management. Kotak Securities Limited is also a depository participant with National Securities Depository Limited (NSDL) and Central Depository Services (India) Limited (CDSL). Kotak Securities Limited is also registered with Insurance Regulatory and Development Authority as Corporate Agent for Kotak Mahindra Old Mutual Life Insurance Limited and is also a Mutual Fund Advisor registered with Association of Mutual Funds in India (AMFI). Kotak Securities Limited is registered as a Research Analyst under SEBI (Research Analyst) Regulations, 2014. We hereby declare that our activities were neither suspended nor we have defaulted with any stock exchange authority with whom we are registered in last five years. However SEBI, Exchanges and Depositories have conducted the routine inspection and based on their observations have issued advise letters or levied minor penalty on KSL for certain operational deviations. We have not been debarred from doing business by any Stock Exchange / SEBI or any other authorities; nor has our certificate of registration been cancelled by SEBI at any point of time. We offer our research services to primarily institutional investors and their employees, directors, fund managers, advisors who are registered with us Details of Associates are available on website i.e. www.kotak.com Research Analyst has served as an officer, director or employee of subject company(ies): No We or our associates may have received compensation from the subject company(ies) in the past 12 months. We or our associates have managed or co-managed public offering of securities for the subject company(ies) in the past 12 months. YES. Visit our website for more details We or our associates may have received compensation for investment banking or merchant banking or brokerage services from the subject company(ies) in the past 12 months. We or our associates may have received any compensation for products or services other than investment banking or merchant banking or brokerage services from the subject company(ies) in the past 12 months. We or our associates may have received compensation or other benefits from the subject company(ies) or third party in connection with the research report. Our associates may have financial interest in the subject company(ies). Research Analyst or his/her relative's financial interest in the subject company(ies): No Kotak Securities Limited has financial interest in the subject company(ies) at the end of the month immediately preceding the date of publication of Research Report: LIC Housing Finance, Reliance Industries - YES Nature of Financial interest: Holding equity shares or derivatives of the subject company. Our associates may have actual/beneficial ownership of 1% or more securities of the subject company(ies) at the end of the month immediately preceding the date of publication of Research Report. Research Analyst or his/her relatives has actual/beneficial ownership of 1% or more securities of the subject company(ies) at the end of the month immediately preceding the date of publication of Research Report: No Kotak Securities Limited has actual/beneficial ownership of 1% or more securities of the subject company(ies) at the end of the month immediately preceding the date of publication of Research Report: No Subject company(ies) may have been client during twelve months preceding the date of distribution of the research report. A graph of daily closing prices of securities is available at https://www.moneycontrol.com/india/stockpricequote/ and http://economictimes.indiatimes.com/markets/stocks/stock-quotes. (Choose a company from the list on the browser and select the"three years" icon in the price chart).
Kotak Securities Limited. Registered Office: 27 BKC, C 27, G Block, Bandra Kurla Complex, Bandra (E), Mumbai 400051. CIN: U99999MH1994PLC134051, Telephone No.: +22 43360000, Fax No.: +22 67132430. Website: www.kotak.com / www.kotaksecurities.com. Correspondence Address: Infinity IT Park, Bldg. No 21, Opp. Film City Road, A K Vaidya Marg, Malad (East), Mumbai 400097. Telephone No: 42856825. SEBI Registration No. INZ000200137(Member of NSE, BSE, MSE, MCX & NCDEX). Member Id: NSE-08081; BSE-673; MSE-1024; MCX-56285; NCDEX-1262. AMFI ARN 0164, PMS INP000000258 and Research Analyst INH000000586. NSDL/CDSL: IN-DP-NSDL-23-97. Compliance Officer Details: Mr. Manoj Agarwal. Call: 022 - 4285 8484, or Email: [email protected]. Investments in securities market are subject to market risks, read all the related documents carefully before investing. In case you require any clarification or have any concern, kindly write to us at below email ids: Level 1: For Trading related queries, contact our customer service at ‘[email protected]’ and for demat account related queries contact us at [email protected] or call us on: Toll free numbers 18002099191 / 1860 266 9191 Level 2: If you do not receive a satisfactory response at Level 1 within 3 working days, you may write to us at [email protected] or call us on 022-42858445 and if you feel you are still unheard, write to our customer service HOD at [email protected] or call us on 022-42858208. Level 3: If you still have not received a satisfactory response at Level 2 within 3 working days, you may contact our Compliance Officer (Name: Mr. Manoj Agarwal) at [email protected] or call on 91- (022) 4285 8484. Level 4 : If you have not received a satisfactory response at Level 3 within 7 working days, you may also approach Managing Director / CEO (Mr. Jaideep Hansraj) at [email protected] or call on 91-(022) 4285 8301. First Cut notes published on this site are for information purposes only. They represent early notations and responses by analysts to recent events. Data in the notes may not have been verified by us and investors should not act upon any data or views in these notes. Most First Cut notes, but not necessarily all, will be followed by final research reports on the subject. There could be variance between the First cut note and the final research note on any subject, in which case the contents of the final research note would prevail. We accept no liability for the contents of the First Cut Notes.