monitoring brain development of chick embryos in vivo using
TRANSCRIPT
RESEARCH ARTICLE Open Access
Monitoring brain development of chickembryos in vivo using 3.0 T MRI:subdivision volume change and preliminarystructural quantification using DTIZien Zhou1†, Zengai Chen1†, Jiehui Shan2, Weiwei Ma1, Lei Li1, Jinyan Zu1 and Jianrong Xu1*
Abstract
Background: Magnetic resonance imaging (MRI) has many advantages in the research of in vivo embryonic braindevelopment, specifically its noninvasive aspects and ability to avoid skeletal interference. However, few studieshave focused on brain development in chick, which is a traditional animal model in developmental biology. Weaimed to serially monitor chick embryo brain development in vivo using 3.0 T MRI.
Methods: Ten fertile Hy-line white eggs were incubated and seven chick embryo brains were monitored in vivoand analyzed serially from 5 to 20 days during incubation using 3.0 T MRI. A fast positioning sequence was pre-scanned to obtain sagittal and coronal brain planes corresponding to the established atlas. T2-weighted imaging(T2WI) was performed for volume estimation of the whole brain and subdivision (telencephalon, cerebellum,brainstem, and lateral ventricle [LV]); diffusion tensor imaging (DTI) was used to reflect the evolution of neuralbundle structures.
Results: The chick embryos’ whole brain and subdivision grew non-linearly over time; the DTI fractional anisotropy(FA) value within the telencephalon increased non-linearly as well. All seven scanned eggs hatched successfully.
Conclusions: MRI avoids embryonic sacrifice in a way that allows serial monitoring of longitudinal developmentalprocesses of a single embryo. Feasibility for analyzing subdivision of the brain during development, and addingstructural information related to neural bundles, makes MRI a powerful tool for exploring brain development.
Keywords: Chick embryo, Brain development, In vivo, Magnetic resonance imaging, Diffusion tensor imaging
BackgroundSeveral imaging techniques have been developed to as-sess embryonic development among small animals, in-cluding special light microscopy (confocal fluorescencemicroscopy, multi-photon microscopy, optical coherencetomography), ultrasound, micro-CT, micro-MRI, etc.[1–5]. Ideally, in vivo embryonic research should avoidembryonic sacrifice, which allows monitoring of a serial,longitudinal developmental process of a single embryo.MRI has great advantages over other techniques in the
research of in vivo embryonic brain development givenits high spatial and tissue-contrast resolution, no skullinterference, flexible imaging plane orientation, and ab-sence of radiation and obvious teratogenical influences.Diffusion tensor imaging (DTI) tends to reflect aspectsof tissue structure by detecting water molecule diffusionthrough those tissues. Fractional anisotropy (FA) is aDTI-derived measurement of tissue structural anisotropyranging from 0 (isotropy) to 1 (anisotropy) [6]. DTIcould be used to reflect brain maturation by measuringdiffusion characteristics based on neuronal differenti-ation and neural bundle formations [7–9]. For instance,mesenchymal cells or neuroblasts are round in shape,allowing water to diffuse isotropically (FA is approxi-mately 0). Conversely, mature neural bundles have a
* Correspondence: [email protected]†Equal contributors1Department of Radiology, Ren Ji Hospital, School of Medicine, Shanghai JiaoTong University, Shanghai, ChinaFull list of author information is available at the end of the article
© 2015 Zhou et al. This is an Open Access article distributed under the terms of the Creative Commons Attribution License(http://creativecommons.org/licenses/by/4.0), which permits unrestricted use, distribution, and reproduction in any medium,provided the original work is properly credited. The Creative Commons Public Domain Dedication waiver (http://creativecommons.org/publicdomain/zero/1.0/) applies to the data made available in this article, unless otherwise stated.
Zhou et al. BMC Developmental Biology (2015) 15:29 DOI 10.1186/s12861-015-0077-6
fiber-like texture, and water molecules mainly diffusealong the bundle’s direction (FA is approximately 1).In vivo MRI studies assessing normal mouse, baboon,
and marmoset brain development have been conducted[10–12]. However, there are few in vivo MRI studiesassessing serial brain development of the chick embryo.The chick embryo is an accessible and economicalmodel, with an extensive history of use in developmentalbiology, genetic experiments, transplantation research,teratogenicity evaluation, and cancer research [13, 14].The brain developmental time frame for chicks is alsosimilar to humans, with both chick and human new-borns showing well developed brains at hatching andbirth, respectively [15]. Bain et al. [16] estimated thebrain volume of developing chick embryos using a 7.0 TMRI system, but images were only obtained at late de-velopmental stages (12, 15, 17, 18, 19, 20 days during in-cubation). Thus, some problems are encountered andneed to be resolved when assessing in vivo MRIs of em-bryonic chick brains. (a) Embryo-associated motion arti-facts seriously reduce imaging quality after 6 days ofincubation. Several methods have been proposed to ef-fectively suppress motion artifacts, including the use of afast imaging sequence, intravenous injection of a small-dose sedative or anesthetic [17], and cooling before im-aging [18]. (b) In order to balance long scan times, thespatial resolution and signal-to-noise ratio (SNR) for invivo imaging should be set relatively lower than for exvivo imaging. However, the spatial resolution and SNRneed to be increased sufficiently to account for smallembryos during the early developmental stages. Micro-MRIs with ultra-high magnetic fields (≥7 T) and a dedi-cated small coil that is able to fit a small embryo arecommonly adopted. (c) Because embryonic position isvariable, it is almost impossible to obtain axial, sagittal,and coronal brain slices directly after scanning. Imageswith a 3D MRI sequence have high isotropic spatialresolution and could be used to reconstruct standardaxial, sagittal, and coronal slices corresponding to anestablished atlas during post-processing. However, this issometimes a less attractive option for in vivo researchbecause of long scan durations [19]. Additionally, someforms of functional and structural imaging (such as mag-netic resonance spectroscopy [MRS], blood oxygen leveldependent MRI [BOLD], diffusion weighted imaging[DWI], DTI, etc.) do not have a 3D sequence. Thus, a2D sequence is adopted. When obtaining 2D imageswith high resolution, adjusting the positioning lines andusing a fast positioning sequence with a large field ofview (FOV) and thick slice are usually needed to obtainaxial, sagittal, and coronal slices (which often requiresrepeated attempts).The present study aimed to serially monitor chick em-
bryo brain development in vivo using 3.0 T MRI from 5
to 20 days of incubation. A method of adjusting the po-sitioning lines was proposed using 2D imaging to obtainstandard sagittal and coronal slices corresponding to anestablished atlas [20]. Whole brain and subdivision (tel-encephalon, cerebellum, brainstem, and lateral ventricle[LV]) volume changes were measured from anatomicalimages on a day-to-day basis. The DTI FA value waspreliminarily used to reflect structural evolution intelencephalon.
ResultsAll seven scanned eggs were normally developing from 5to 20 days of incubation (eggs were candled before MRscanning and capillary network was monitored to iden-tify the developing status), and hatched successfully after23 days of incubation. All images of the seven scannedeggs had no obvious motion artifacts and were adoptedfor analysis. Table 1 shows the whole brain volume, sub-division volume (telencephalon, cerebellum, brainstem,and LV), volume ratio of telencephalon to lateral ven-tricle (Tel/LV), and the DTI FA value from 5 to 20 daysof incubation. The cerebellum could not be clearly dis-criminated until 9 days of incubation; thus, we measuredthe cerebellum from 9 to 20 days of incubation. Fig. 1plots corresponding growth change over time. Thewhole brain, telencephalon, cerebellum, and brainstemgrew non-linearly during incubation. The whole brainvolume reported by Bain et al. is also shown in Fig. 1afor comparison. LV volume did not decrease linearlyover time, and flex points appeared at 6, 12, and 17 daysof incubation. The Tel/LV ratio did not increase linearlyover time, and flex points appeared at 14 and 17 days ofincubation. The FA value of the telencephalon increasednon-linearly from 5 days (0.026 ± 0.004) to 20 days(0.362 ± 0.017).Figure 2 shows serial brain developmental processes
for one chick embryo in the mid-sagittal and coronalplanes with a maximum ventricle area. As shown inFig. 2a, the telencephalic vesicles were formed at anearly developmental stage. The telencephalon, cerebel-lum, and brainstem could be discriminated at 9 days andgrew gradually over the following incubation days. Asshown in Fig. 2b, the parenchyma was very thin, and theventricle was relatively large at early developmentalstages. The cortex became thicker, and the ventricle wasreduced over the course of incubation.
DiscussionWe serially monitored chick-embryo brain developmentin vivo using 3.0 T MRI. Compared with previous work,we first conducted serial scans across an early to late de-velopmental stage (5 to 20 days of incubation) at a con-stant interval (24 h). Bain et al. [16] only scanned duringthe late stage (12 to 20 days of incubation) at a non-
Zhou et al. BMC Developmental Biology (2015) 15:29 Page 2 of 10
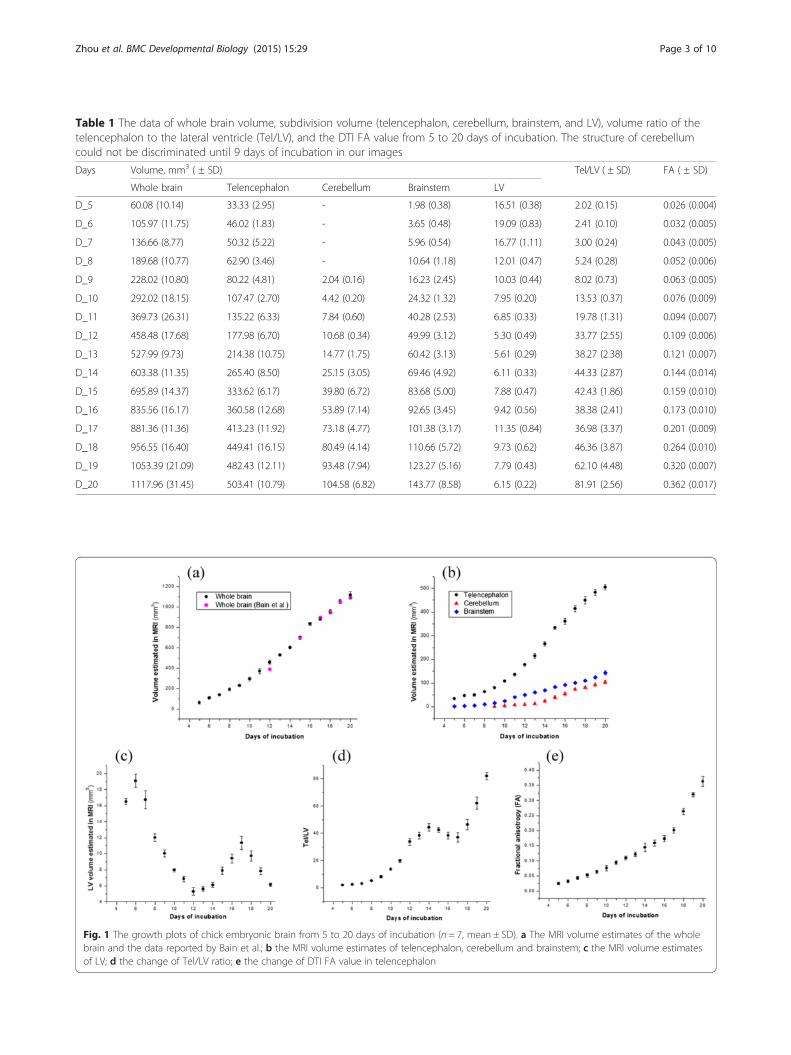
Table 1 The data of whole brain volume, subdivision volume (telencephalon, cerebellum, brainstem, and LV), volume ratio of thetelencephalon to the lateral ventricle (Tel/LV), and the DTI FA value from 5 to 20 days of incubation. The structure of cerebellumcould not be discriminated until 9 days of incubation in our images
Days Volume, mm3 ( ± SD) Tel/LV ( ± SD) FA ( ± SD)
Whole brain Telencephalon Cerebellum Brainstem LV
D_5 60.08 (10.14) 33.33 (2.95) - 1.98 (0.38) 16.51 (0.38) 2.02 (0.15) 0.026 (0.004)
D_6 105.97 (11.75) 46.02 (1.83) - 3.65 (0.48) 19.09 (0.83) 2.41 (0.10) 0.032 (0.005)
D_7 136.66 (8.77) 50.32 (5.22) - 5.96 (0.54) 16.77 (1.11) 3.00 (0.24) 0.043 (0.005)
D_8 189.68 (10.77) 62.90 (3.46) - 10.64 (1.18) 12.01 (0.47) 5.24 (0.28) 0.052 (0.006)
D_9 228.02 (10.80) 80.22 (4.81) 2.04 (0.16) 16.23 (2.45) 10.03 (0.44) 8.02 (0.73) 0.063 (0.005)
D_10 292.02 (18.15) 107.47 (2.70) 4.42 (0.20) 24.32 (1.32) 7.95 (0.20) 13.53 (0.37) 0.076 (0.009)
D_11 369.73 (26.31) 135.22 (6.33) 7.84 (0.60) 40.28 (2.53) 6.85 (0.33) 19.78 (1.31) 0.094 (0.007)
D_12 458.48 (17.68) 177.98 (6.70) 10.68 (0.34) 49.99 (3.12) 5.30 (0.49) 33.77 (2.55) 0.109 (0.006)
D_13 527.99 (9.73) 214.38 (10.75) 14.77 (1.75) 60.42 (3.13) 5.61 (0.29) 38.27 (2.38) 0.121 (0.007)
D_14 603.38 (11.35) 265.40 (8.50) 25.15 (3.05) 69.46 (4.92) 6.11 (0.33) 44.33 (2.87) 0.144 (0.014)
D_15 695.89 (14.37) 333.62 (6.17) 39.80 (6.72) 83.68 (5.00) 7.88 (0.47) 42.43 (1.86) 0.159 (0.010)
D_16 835.56 (16.17) 360.58 (12.68) 53.89 (7.14) 92.65 (3.45) 9.42 (0.56) 38.38 (2.41) 0.173 (0.010)
D_17 881.36 (11.36) 413.23 (11.92) 73.18 (4.77) 101.38 (3.17) 11.35 (0.84) 36.98 (3.37) 0.201 (0.009)
D_18 956.55 (16.40) 449.41 (16.15) 80.49 (4.14) 110.66 (5.72) 9.73 (0.62) 46.36 (3.87) 0.264 (0.010)
D_19 1053.39 (21.09) 482.43 (12.11) 93.48 (7.94) 123.27 (5.16) 7.79 (0.43) 62.10 (4.48) 0.320 (0.007)
D_20 1117.96 (31.45) 503.41 (10.79) 104.58 (6.82) 143.77 (8.58) 6.15 (0.22) 81.91 (2.56) 0.362 (0.017)
Fig. 1 The growth plots of chick embryonic brain from 5 to 20 days of incubation (n = 7, mean ± SD). a The MRI volume estimates of the wholebrain and the data reported by Bain et al.; b the MRI volume estimates of telencephalon, cerebellum and brainstem; c the MRI volume estimatesof LV; d the change of Tel/LV ratio; e the change of DTI FA value in telencephalon
Zhou et al. BMC Developmental Biology (2015) 15:29 Page 3 of 10
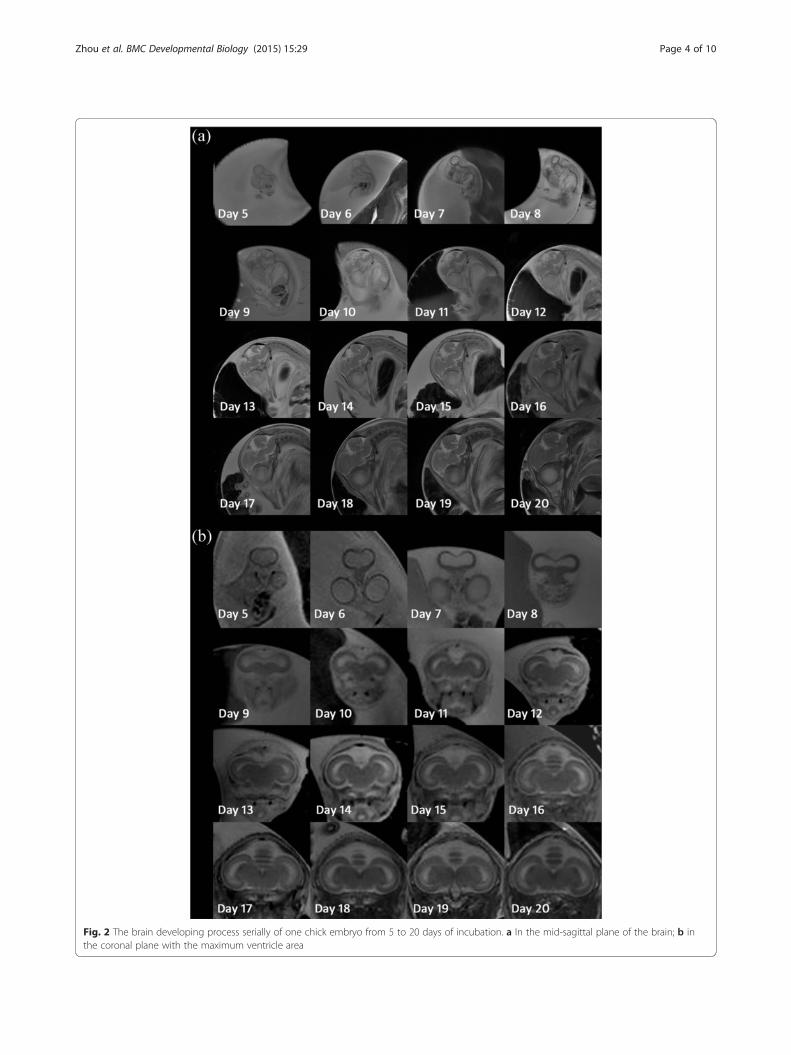
Fig. 2 The brain developing process serially of one chick embryo from 5 to 20 days of incubation. a In the mid-sagittal plane of the brain; b inthe coronal plane with the maximum ventricle area
Zhou et al. BMC Developmental Biology (2015) 15:29 Page 4 of 10
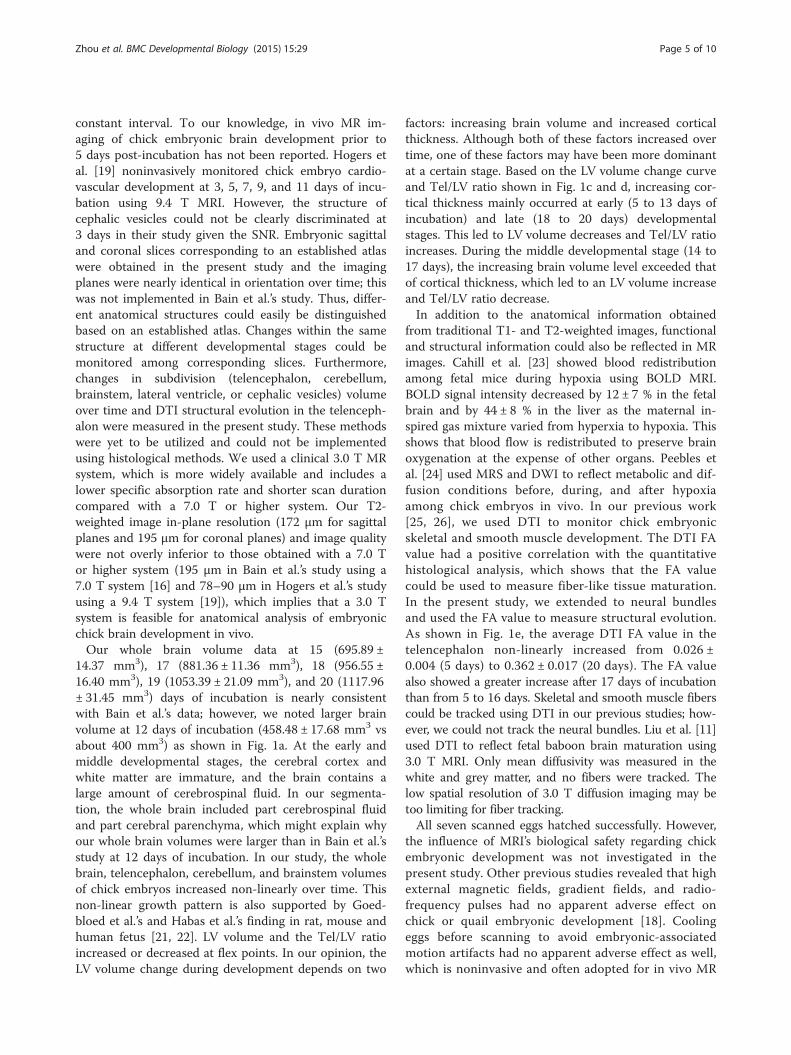
constant interval. To our knowledge, in vivo MR im-aging of chick embryonic brain development prior to5 days post-incubation has not been reported. Hogers etal. [19] noninvasively monitored chick embryo cardio-vascular development at 3, 5, 7, 9, and 11 days of incu-bation using 9.4 T MRI. However, the structure ofcephalic vesicles could not be clearly discriminated at3 days in their study given the SNR. Embryonic sagittaland coronal slices corresponding to an established atlaswere obtained in the present study and the imagingplanes were nearly identical in orientation over time; thiswas not implemented in Bain et al.’s study. Thus, differ-ent anatomical structures could easily be distinguishedbased on an established atlas. Changes within the samestructure at different developmental stages could bemonitored among corresponding slices. Furthermore,changes in subdivision (telencephalon, cerebellum,brainstem, lateral ventricle, or cephalic vesicles) volumeover time and DTI structural evolution in the telenceph-alon were measured in the present study. These methodswere yet to be utilized and could not be implementedusing histological methods. We used a clinical 3.0 T MRsystem, which is more widely available and includes alower specific absorption rate and shorter scan durationcompared with a 7.0 T or higher system. Our T2-weighted image in-plane resolution (172 μm for sagittalplanes and 195 μm for coronal planes) and image qualitywere not overly inferior to those obtained with a 7.0 Tor higher system (195 μm in Bain et al.’s study using a7.0 T system [16] and 78–90 μm in Hogers et al.’s studyusing a 9.4 T system [19]), which implies that a 3.0 Tsystem is feasible for anatomical analysis of embryonicchick brain development in vivo.Our whole brain volume data at 15 (695.89 ±
14.37 mm3), 17 (881.36 ± 11.36 mm3), 18 (956.55 ±16.40 mm3), 19 (1053.39 ± 21.09 mm3), and 20 (1117.96± 31.45 mm3) days of incubation is nearly consistentwith Bain et al.’s data; however, we noted larger brainvolume at 12 days of incubation (458.48 ± 17.68 mm3 vsabout 400 mm3) as shown in Fig. 1a. At the early andmiddle developmental stages, the cerebral cortex andwhite matter are immature, and the brain contains alarge amount of cerebrospinal fluid. In our segmenta-tion, the whole brain included part cerebrospinal fluidand part cerebral parenchyma, which might explain whyour whole brain volumes were larger than in Bain et al.’sstudy at 12 days of incubation. In our study, the wholebrain, telencephalon, cerebellum, and brainstem volumesof chick embryos increased non-linearly over time. Thisnon-linear growth pattern is also supported by Goed-bloed et al.’s and Habas et al.’s finding in rat, mouse andhuman fetus [21, 22]. LV volume and the Tel/LV ratioincreased or decreased at flex points. In our opinion, theLV volume change during development depends on two
factors: increasing brain volume and increased corticalthickness. Although both of these factors increased overtime, one of these factors may have been more dominantat a certain stage. Based on the LV volume change curveand Tel/LV ratio shown in Fig. 1c and d, increasing cor-tical thickness mainly occurred at early (5 to 13 days ofincubation) and late (18 to 20 days) developmentalstages. This led to LV volume decreases and Tel/LV ratioincreases. During the middle developmental stage (14 to17 days), the increasing brain volume level exceeded thatof cortical thickness, which led to an LV volume increaseand Tel/LV ratio decrease.In addition to the anatomical information obtained
from traditional T1- and T2-weighted images, functionaland structural information could also be reflected in MRimages. Cahill et al. [23] showed blood redistributionamong fetal mice during hypoxia using BOLD MRI.BOLD signal intensity decreased by 12 ± 7 % in the fetalbrain and by 44 ± 8 % in the liver as the maternal in-spired gas mixture varied from hyperxia to hypoxia. Thisshows that blood flow is redistributed to preserve brainoxygenation at the expense of other organs. Peebles etal. [24] used MRS and DWI to reflect metabolic and dif-fusion conditions before, during, and after hypoxiaamong chick embryos in vivo. In our previous work[25, 26], we used DTI to monitor chick embryonicskeletal and smooth muscle development. The DTI FAvalue had a positive correlation with the quantitativehistological analysis, which shows that the FA valuecould be used to measure fiber-like tissue maturation.In the present study, we extended to neural bundlesand used the FA value to measure structural evolution.As shown in Fig. 1e, the average DTI FA value in thetelencephalon non-linearly increased from 0.026 ±0.004 (5 days) to 0.362 ± 0.017 (20 days). The FA valuealso showed a greater increase after 17 days of incubationthan from 5 to 16 days. Skeletal and smooth muscle fiberscould be tracked using DTI in our previous studies; how-ever, we could not track the neural bundles. Liu et al. [11]used DTI to reflect fetal baboon brain maturation using3.0 T MRI. Only mean diffusivity was measured in thewhite and grey matter, and no fibers were tracked. Thelow spatial resolution of 3.0 T diffusion imaging may betoo limiting for fiber tracking.All seven scanned eggs hatched successfully. However,
the influence of MRI’s biological safety regarding chickembryonic development was not investigated in thepresent study. Other previous studies revealed that highexternal magnetic fields, gradient fields, and radio-frequency pulses had no apparent adverse effect onchick or quail embryonic development [18]. Coolingeggs before scanning to avoid embryonic-associatedmotion artifacts had no apparent adverse effect as well,which is noninvasive and often adopted for in vivo MR
Zhou et al. BMC Developmental Biology (2015) 15:29 Page 5 of 10
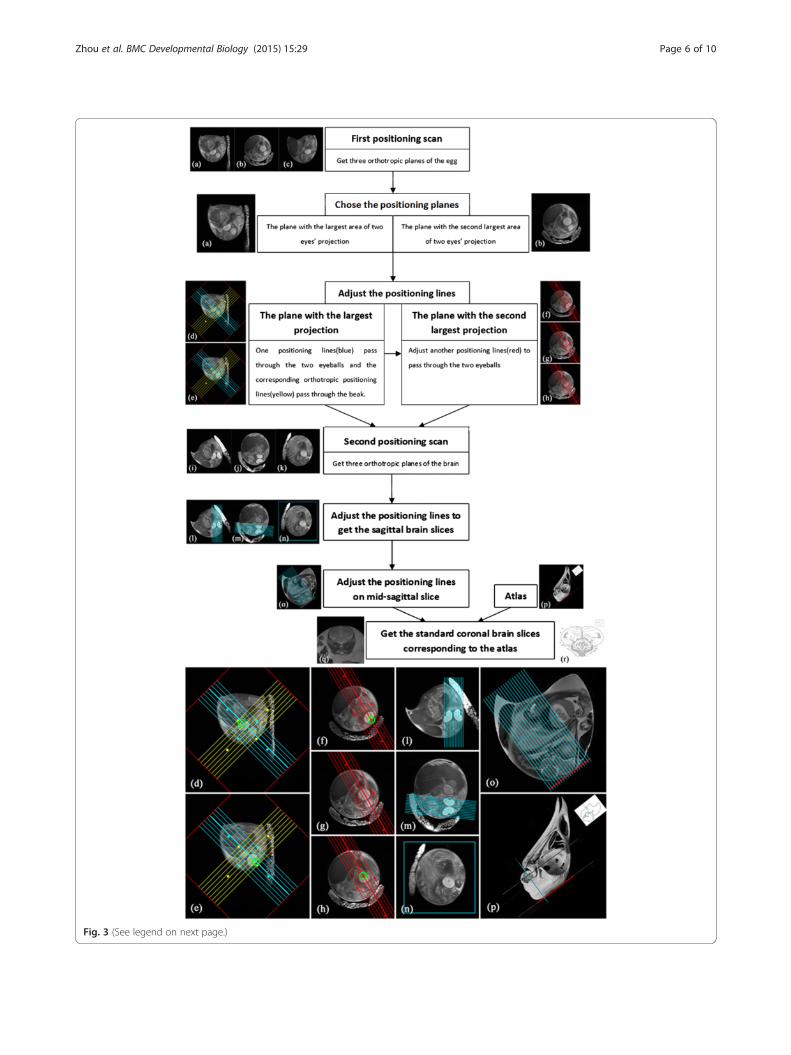
Fig. 3 (See legend on next page.)
Zhou et al. BMC Developmental Biology (2015) 15:29 Page 6 of 10
imaging of chick embryo. We should also note somelimitations to the present study. For instance, we manu-ally defined the borders between different brain subdi-visions according to an established atlas. These bordersare usually three-dimensional surfaces moving in andout of the imaging planes, which may induce subdiv-ision volume measurement errors. Higher spatial reso-lution and thinner imaging slices may be helpful formore accurate measurement. However, image SNRswould reduce as a result. Nevertheless, the presentstudy reveals the possible feasibility of using the DTIFA value to reflect neural bundle structural evolution.As this was a preliminary in vivo imaging study, nohistological validation was conducted. Thus, a correl-ation analysis between the imaging parameters andhistological quantification will be pursued in the future.
ConclusionsThe present study succeeded in serially monitoring chickembryonic brain development in vivo. The currentmethods included segmenting sagittal and coronalplanes (corresponding to an established atlas) using ourproposed positioning method. A 3.0 T MRI system isfeasible for anatomical analysis of in vivo chick embry-onic brain development; however, one caveat is that veryearly developmental stages could not be properlyassessed. The present volume results were the first phaseof quantitative analyses regarding brain subdivision de-velopment, which could not be implemented using aninvasive histological method. Chick embryonic brain andsubdivision growth patterns were non-linear. Addition-ally, the DTI FA value was first used as a measure ofneural bundle maturation, which revealed structural evo-lution in the absence of resolution at the cellular level.Overall, this form of MRI has great potential for re-search on brain development.
MethodsAnimals and treatmentsThe study was designed and implemented according tothe ARRIVE guidelines [27]. For chick embryos repre-sent an intermediate stage between isolated culturedcells and animals, animals’ housing and husbandry
conditions listed in the ARRIVE guidelines checklist didnot involve in our expreriment. The Animal EthicsCommittee of Shanghai Jiao Tong University School ofMedicine (No.20140125) approved this study. Ten fertileHy-line white eggs, each weighting 50–55 g, were ob-tained from a commercial hatchery and placed in an in-cubator with automatic temperature (37.8 °C) andhumidity (60 %) control. Eggs were automatically rolledevery 2 h. After four days of incubation, eggs were can-dled with a hand-held light source to observe whetherthey were developing normally. We considered the chickembryo to be developing normally if the capillary net-work was observed. Three eggs were removed from theincubator due to underdevelopment or lack of fertility.The remaining seven eggs were scanned every 24 h from5 to 20 days of incubation. Embryonic-associated motionartifacts are present at 7 days of incubation and lead tobad image quality. A dual-cooling method, as proposedin our previous work, was used to avoid motion arti-facts [28]; the egg was cooled for 1 h in a refrigerator(at 3.5–4 °C) prior to imaging. During imaging, the eggwas wrapped in a piece of Techni-Ice (Techni Ice,Victoria, Australia) to maintain a low-temperatureenvironment.
MR imaging and section methodMRI scans were performed using a 3.0 T GE SignaExcite System (GE Medical Systems, Waukesha, WI,USA) with a four-channel dedicated animal coil. The innerdiameter of the coil was 5 cm, which precisely fits to anegg with wrapped Techni-Ice. First, fast positioning im-aging was performed using a T2-weighted fast spin echo(FSE) sequence with a large FOV and thick slice (TR/TE1763/43 ms, FOV 10 cm, matrix 320 × 320, ETL 1, NEX 1,Slice thickness 2 mm, gap 1 mm, No. of slices 8, 43-s dur-ation) to obtain standard axial, sagittal, and coronal brainplanes corresponding to an established atlas. Next, ana-tomical imaging of the sagittal and coronal brain planeswas conducted using a T2-weighted FSE sequence at ahigher resolution (Sagittal planes: TR/TE 4800/91 ms,FOV 5.5 cm, matrix 320 × 320, ETL 18, NEX 6, Slicethickness 1 mm, no gap, No. of slices 16, approximately8-min duration; Coronal planes: TR/TE 4400/88 ms,
(See figure on previous page.)Fig. 3 The flow chart and illustrations of our method to obtain the standard chick embryonic brain slices corresponding to the atlas in vivo. Theamplificatory illustrations are shown in the bottom for clearly showing the positioning method. a, b and c are three orthotropic planes of theegg after first positioning scan; d and e are two serial slices in the plane with the largest area of two eyes’ projection. One set of positioning lines(blue) is adjusted to pass through the two eyeballs (green circle) and the corresponding orthotropic set of positioning lines (yellow) is put to passthrough the beak; f, g and h are three serial slices in the plane with the second largest area of two eyes’ projection. Another set of positioninglines (red) should also be adjusted to pass through two eyeballs (green circle); i, j and k are three orthotropic planes of chick embryonic brainafter second positioning scan; l, m and n show the positioning method to get the standard sagittal planes of brain with the positioning linespassing through the mid-line of the brain; o is the mid-sagittal plane with positioning lines corresponding to the section direction of atlas in p.The positioning lines to get coronal slices are perpendicular to the line which is tangent to the dorsal surface of parietal and frontal bones(red line in o and p). q is one of the standard coronal slices and r is corresponding established atlas [20]
Zhou et al. BMC Developmental Biology (2015) 15:29 Page 7 of 10
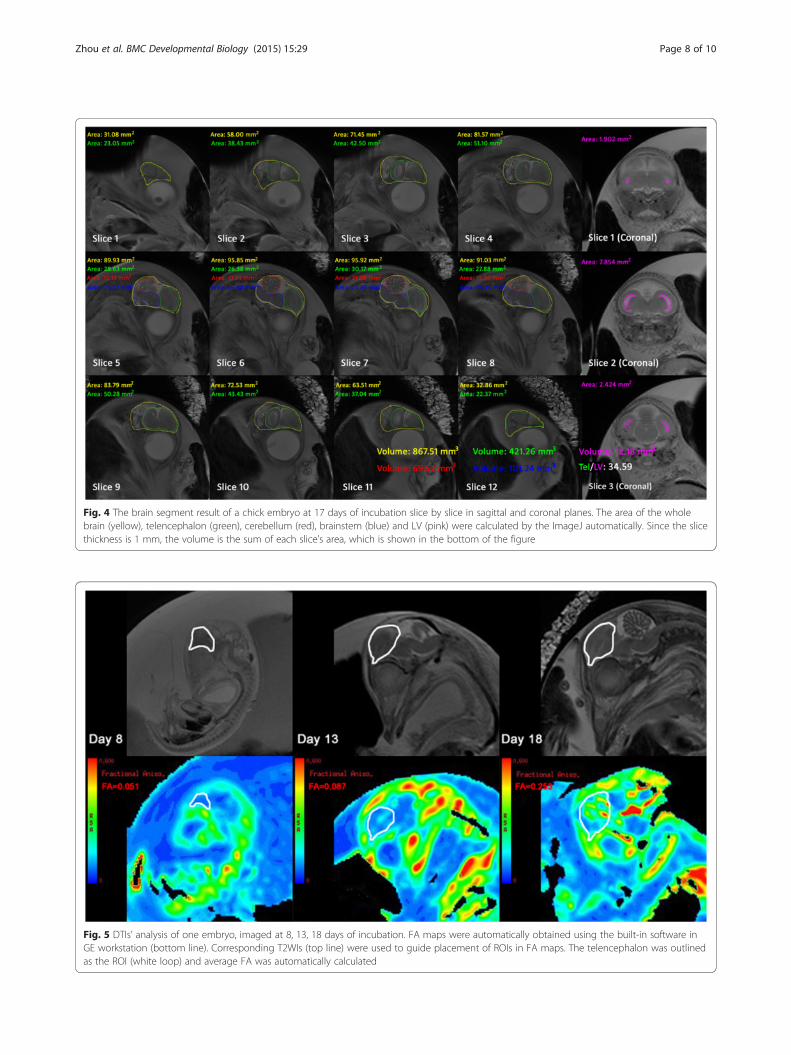
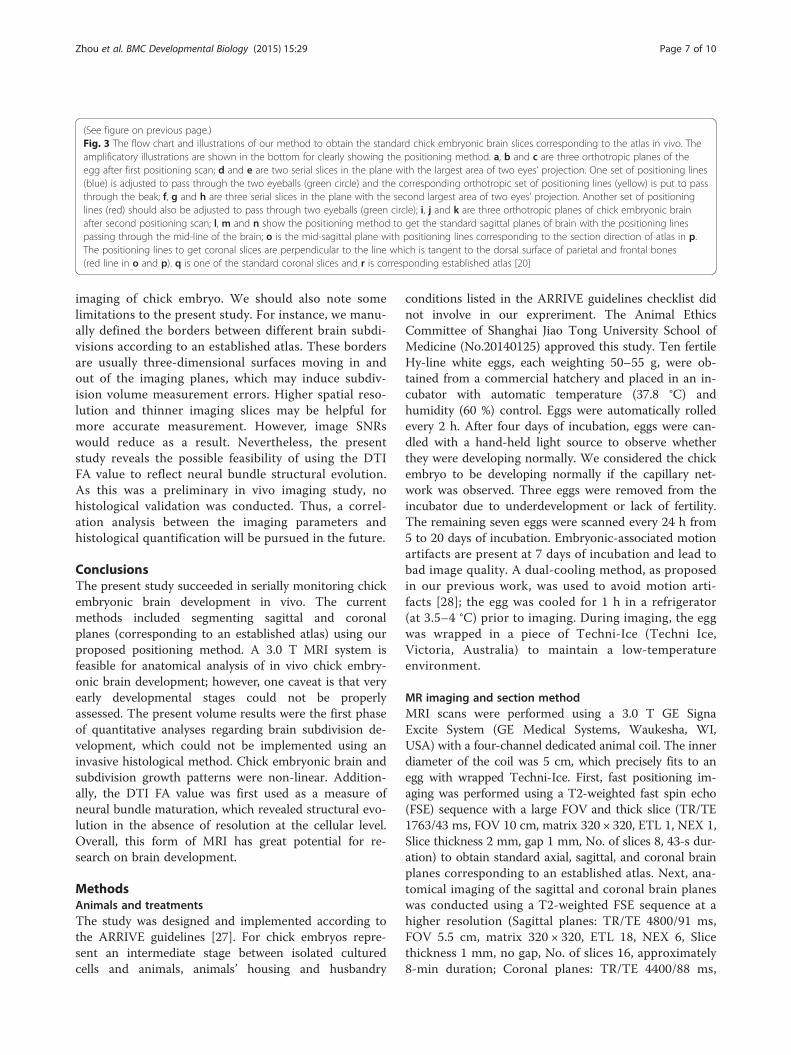
Fig. 4 The brain segment result of a chick embryo at 17 days of incubation slice by slice in sagittal and coronal planes. The area of the wholebrain (yellow), telencephalon (green), cerebellum (red), brainstem (blue) and LV (pink) were calculated by the ImageJ automatically. Since the slicethickness is 1 mm, the volume is the sum of each slice’s area, which is shown in the bottom of the figure
Fig. 5 DTIs’ analysis of one embryo, imaged at 8, 13, 18 days of incubation. FA maps were automatically obtained using the built-in software inGE workstation (bottom line). Corresponding T2WIs (top line) were used to guide placement of ROIs in FA maps. The telencephalon was outlinedas the ROI (white loop) and average FA was automatically calculated
Zhou et al. BMC Developmental Biology (2015) 15:29 Page 8 of 10
FOV 5 cm, matrix 256 × 256, ETL 18, NEX 6, Slicethickness 1 mm, no gap, No. of slices 16, approximately6-min duration). Finally, a DTI was performed, and theadjusted positioning lines for sagittal brain planes wereadopted. The DTI parameters are as follows: 16 direc-tions of diffusion gradients, TR/TE 5700/92 ms, FOV8 cm, matrix 64 × 64, ETL 1, NEX 3, Slice thickness1 mm, no gap, No. of slices 7, b = 800 s/mm2, approxi-mately 6-min duration.Two eyeballs and the beak were used as the anatom-
ical feature points when adjusting the positioning lines.Figure 3 shows the flow chart and illustrations of the po-sitioning method. Because the chick embryonic positionin the egg was unknown, after the first positioning scan(axial, sagittal, and coronal planes of the egg), three arbi-trary orthotropic brain planes were obtained. We chosethe plane with the largest area of eye projection, and theplane with the second largest eye projection was used asthe base of the next positioning scan. We first adjustedone set of positioning lines to pass through two eyeballs inthe plane with the largest projection, and a correspondingorthotropic set of positioning lines were put through thebeak. We then adjusted another set of positioning lines inthe plane with the second largest projection, which wouldalso pass through two eyeballs. This was followed by thesecond positioning scan. After the second positioningscan, one standard sagittal plane and other symmetricalplanes passing through the eyeballs were obtained. Wethen obtained standard sagittal brain slices by adjustingpositioning lines to pass through the mid-line of the brainon the last positioning images. According to the atlas andstandard sagittal slices, we finally produced standard cor-onal brain slices by placing the set of positioning lines(which were perpendicular to the line that was tangentialto the dorsal surface of the parietal and frontal bones)onto the mid-sagittal brain slice.
Measurement and analysisFor volumetric analyses, the anatomical images (T2WI)were analyzed using the ImageJ software package. Thetelencephalon, cerebellum, brainstem, and whole brainvolume were calculated from the sagittal brain slices,and LV volume was calculated from the coronal brainslices. The cortex was very thin, and the LV had notbeen completely formed during the early developmentalstage (5 to 8 days of incubation); thus, we measured thetelencephalic vesicle volume as a stand in for the LV vol-ume. Different anatomical regions were manually out-lined slice by slice according to a standard atlas. Thesoftware automatically calculated the segmented area ofeach brain region within each slice. Since slice thicknesswas 1 mm, the volume was equal to the sum of the seg-mented area within each slice. Figure 4 shows the brainsegment results and corresponding areas within the
sagittal and coronal slices of an embryo at 17 days of in-cubation. The whole brain, telencephalon, cerebellum,brainstem, and LV volume for each chick embryo werecalculated from 5 to 20 days of incubation. To investi-gate the relationship between brain volume change andLV, the volume ratio from telencephalon to LV (Tel/LV)was calculated by dividing the telencephalon volume bythe LV volume.DTIs were analyzed using a built-in software at a GE
workstation, and FA maps were obtained. As shown inFig. 5, the mid-sagittal brain slice was chosen, and anROI was placed in the telencephalon region. T2WIswere used to assist with outlining the telencephalon.After drawing the ROI, the software calculated the aver-age FA within the ROI. Volume data, Tel/LV ratio, andthe FA value were all expressed as mean ± standard devi-ation (SD). The hatching rate was examined at 23 daysof incubation.
AbbreviationsBOLD: Blood oxygen level dependent; DTI: Diffusion tensor imaging;DWI: Diffusion weighted imaging; FA: Fractional anisotropy; FOV: Field ofview; FSE: Fast spin echo; LV: Lateral ventricle; MRI: Magnetic resonanceimaging; MRS: Magnetic resonance spectroscopy; ROI: Region of interest;SNR: Signal to noise ratio; Tel/LV: Volume ratio of telencephalon to lateralventricle; 2D: 2-dimensional; 3D: 3-dimensional.
Competing interestsThe authors declare that they have no competing interests.
Authors’ contributionsResearch idea and study design (JRX, ZEZ, and ZAC), chick embryo hatching(ZEZ and JHS); MRI acquisition and parameter measurement (ZEZ, WWM, andLL), statistical analysis (JYZ and JHS), manuscript drafting (ZEZ, ZAC, and JRX),manuscript revision for important intellectual content (all authors). Allauthors read and approved the final manuscript.
AcknowledgmentsThis work was supported by the National Natural Science Foundation ofChina (No. 81371622), a research grant from the Shanghai Health and FamilyPlanning Commission (No. 20144Y0119) and a research grant from ShanghaiRen Ji Hospital (No. RJZZ13-013).
Author details1Department of Radiology, Ren Ji Hospital, School of Medicine, Shanghai JiaoTong University, Shanghai, China. 2Department of Geriatrics, Ren Ji Hospital,School of Medicine, Shanghai Jiao Tong University , Shanghai, China.
Received: 9 December 2014 Accepted: 29 June 2015
References1. Kulesa PM. Developmental imaging: insights into the avian embryo. Birth
Defects Res C Embryo Today. 2004;72:260–6.2. Dickinson ME. Multimodal imaging of mouse development: tools for the
postgenomic era. Dev Dyn. 2006;235:2386–400.3. Winkelmann CT, Wise LD. High-throughput micro-computed tomography
imaging as a method to evaluate rat and rabbit fetal skeletal abnormalitiesfor developmental toxicity studies. J Pharmacol Toxicol Methods.2009;59:156–65.
4. Gregg CL, Butcher JT. Quantitative in vivo imaging of embryonicdevelopment: opportunities and challenges. Differentiation. 2012;84:149–62.
5. Kulesa PM, McKinney MC, McLennan R. Developmental imaging: the avianembryo hatches to the challenge. Birth Defects Res C Embryo Today.2013;99:121–33.
Zhou et al. BMC Developmental Biology (2015) 15:29 Page 9 of 10

6. Le Bihan D, Mangin JF, Poupon C, Clark CA, Pappata S, Molko N, et al.Diffusion tensor imaging: concepts and applications. J Magn ResonImaging. 2001;13:534–46.
7. Ruffins SW, Jacobs RE. MRI in developmental biology and the constructionof developmental atlases. Cold Spring Harb Protoc. 2011;doi:-http://creativecommons.org/publicdomain/zero/1.0/10.1101/pdb.top100.
8. Turnbull DH, Mori S. MRI in mouse developmental biology. NMR Biomed.2007;20:265–74.
9. Zhang J, Richards LJ, Yarowsky P, Huang H, van Zijl PC, Mori S. Three-dimensional anatomical characterization of the developing mouse brain bydiffusion tensor microimaging. NeuroImage. 2003;20:1639–48.
10. Parasoglou P, Berrios-Otero CA, Nieman BJ, Turnbull DH. High-resolutionMRI of early-stage mouse embryos. NMR Biomed. 2013;26:224–31.
11. Liu F, Garland M, Duan Y, Stark RI, Xu D, Bansal R, et al. Techniques for inutero, longitudinal MRI of fetal brain development in baboons at 3 T.Methods. 2010;50:147–56.
12. Hikishima K, Sawada K, Murayama AY, Komaki Y, Kawai K, Sato N, et al. Atlasof the developing brain of the marmoset monkey constructed usingmagnetic resonance histology. Neuroscience. 2013;230:102–13.
13. Rashidi H, Sottile V. The chick embryo: hatching a model for contemporarybiomedical research. Bioessays. 2009;31:459–65.
14. Deryugina EI, Quigley JP. Chick embryo chorioallantoic membrane modelsystems to study and visualize human tumor cell metastasis. Histochem CellBiol. 2008;130:1119–30.
15. Nishigori H, Kagami K, Takahashi A, Tezuka Y, Sanbe A, Nishigori H. Impairedsocial behavior in chicks exposed to sodium valproate during the last weekof embryogenesis. Psychopharmacology. 2013;227:393–402.
16. Bain MM, Fagan AJ, Mullin JM, McNaught I, McLean J, Condon B.Noninvasive monitoring of chick development in ovo using a 7 T MRIsystem from day 12 of incubation through to hatching. J Magn ResonImaging. 2007;26:198–201.
17. Boss A, Oppitz M, Wehrl HF, Rossi C, Feuerstein M, Claussen CD et al.Measurement of T1, T2 and magnetization transfer properties duringembryonic development at 7 Tesla using the chicken model. J Magn ResonImaging. 2008;28:1510–4.
18. Duce S, Morrison F, Welten M, Baggott G, Tickle C. Micro-magnetic resonanceimaging study of live quail embryos during embryonic development. MagnReson Imaging. 2011;29:132–9.
19. Hogers B, van der Weerd L, Olofsen H, van der Graaf LM, DeRuiter MC,Gittenberger-de Groot AC, et al. Non-invasive tracking of aviandevelopment in vivo by MRI. NMR Biomed. 2009;22:365–73.
20. VAN TIENHOVEN A, JUHASZ LP. The chicken telencephalon, diencephalonand mesencephalon in sterotaxic coordinates. J Comp Neurol.1962;118:185–97.
21. Goedbloed JF. Embryonic and postnatal growth of rat and mouse. IV.Prenatal growth of organs and tissues: age determination, and generalgrowth pattern. Acta Anat (Basel). 1976;95:8–33.
22. Habas PA, Kim K, Corbett-Detig JM, Rousseau F, Glenn OA, Barkovich AJ, etal. A spatiotemporal atlas of MR intensity, tissue probability and shape ofthe fetal brain with application to segmentation. Neuroimage.2010;53:460–70.
23. Cahill LS, Zhou YQ, Seed M, Macgowan CK, Sled JG. Brain sparing in fetalmice: BOLD MRI and Doppler ultrasound show blood redistribution duringhypoxia. J Cereb Blood Flow Metab. 2014;34:1082–8.
24. Peebles DM, Dixon JC, Thornton JS, Cady EB, Priest A, Miller SL, et al.Magnetic resonance proton spectroscopy and diffusion weighted imagingof chick embryo brain in ovo. Brain Res Dev Brain Res. 2003;141:101–7.
25. Zhou Z, Delproposto Z, Wu L, Xu J, Hua J, Zhou Y, et al. In ovo serialskeletal muscle diffusion tractography of the developing chick embryousing DTI: feasibility and correlation with histology. BMC Dev Biol.2012;12:38.
26. Xu J, Delproposto Z, Zhou Z, Shen H, Xuan SY, Li QH, et al. In ovo monitoringof smooth muscle fiber development in the chick embryo: diffusion tensorimaging with histologic correlation. PLoS One. 2012;7:e34009.
27. Kilkenny C, Browne W, Cuthill IC, Emerson M, Altman DG. Animal research:reporting in vivo experiments: the ARRIVE guidelines. Br J Pharmacol.2010;160:1577–9 .
28. Zhou Z, Xu J, Delproposto ZS, Hua J, Fan Y, Zhang Z, et al. Feasibility of inovo diffusion tractography in the chick embryo using a dual-coolingtechnique. J Magn Reson Imaging. 2012;36:993–1001.
Submit your next manuscript to BioMed Centraland take full advantage of:
• Convenient online submission
• Thorough peer review
• No space constraints or color figure charges
• Immediate publication on acceptance
• Inclusion in PubMed, CAS, Scopus and Google Scholar
• Research which is freely available for redistribution
Submit your manuscript at www.biomedcentral.com/submit
Zhou et al. BMC Developmental Biology (2015) 15:29 Page 10 of 10