in vivo photoacoustic imaging of mouse embryos
TRANSCRIPT
In vivo photoacoustic imaging of mouseembryos
Jan LauferFrancesca NorrisJon ClearyEdward ZhangBradley TreebyBen CoxPeter JohnsonPete ScamblerMark LythgoePaul Beard
In vivo photoacoustic imaging of mouse embryos
Jan Laufer,a,b Francesca Norris,b Jon Cleary,a,b Edward Zhang,a Bradley Treeby,a* Ben Cox,a Peter Johnson,bPete Scambler,c Mark Lythgoe,b and Paul Bearda,b
aUniversity College London, Department of Medical Physics and Bioengineering, Gower Street, London WC1E 6BT, United KingdombUniversity College London, Centre for Advanced Biomedical Imaging, Department of Medicine and Institute of Child Health, Paul O’GormanBuilding, 72 Huntley Street, London WC1E 6DD, United KingdomcUCL Institute of Child Health, 30 Guilford Street, London WC1N 1EH, United Kingdom
Abstract. The ability to noninvasively image embryonic vascular anatomy in mouse models is an important require-ment for characterizing the development of the normal cardiovascular system and malformations in the heart andvascular supply. Photoacoustic imaging, which can provide high resolution non invasive images of the vasculaturebased upon optical absorption by endogenous hemoglobin, is well suited to this application. In this study, photo-acoustic images of mouse embryos were obtained ex vivo and in vivo. The images show intricate details of theembryonic vascular system to depths of up to 10 mm, which allowed whole embryos to be imaged in situ. Toachieve this, an all-optical photoacoustic scanner and a novel time reversal image reconstruction algorithm,which provide deep tissue imaging capability while maintaining high spatial resolution and contrast wereemployed. This technology may find application as an imaging tool for preclinical embryo studies in developmentalbiology as well as more generally in preclinical and clinical medicine for studying pathologies characterized bychanges in the vasculature. © 2012 Society of Photo-Optical Instrumentation Engineers (SPIE). [DOI: 10.1117/1.JBO.17.6.061220]
Keywords: photoacoustics imaging; embryo; in vivo.
Paper 11784 received Dec. 22, 2011; revised manuscript received Feb. 29, 2012; accepted for publication Mar. 7, 2012; publishedonline May 18, 2012.
1 IntroductionThe ability to characterize the structure and function of theembryonic vascular system in mouse models is an importantrequirement for a range of applications in developmental biolo-gical research. These include the study of the development of thenormal cardiovascular system and the role of the blood supply inthe development of organs, the musculoskeletal system and otheranatomical structures. In addition, large-scale mutagenesis pro-grammes are currently under way worldwide to create transgenicmouse models for each of the >25; 000 genes in order to enablethe study of gene function.1 This increasing use of geneticallymodified mice has highlighted the need for techniques thatcan visualize abnormalities in cardiac and vascular developmentin genetically manipulated late-gestation embryos. Convention-ally this is achieved ex vivo by microscopic examination with his-tology thus precluding performing longitudinal studies in thesame animal.2 As a consequence, there is a need for noninvasiveimaging techniques that are capable of visualizing the evolutionof embryonic vascular anatomy in utero (i.e., in vivo in the motheranimal) over time, preferably without the use of exogenous con-trast agents. The modalities that have shown the most promise forembryo imaging are ultrasound,3 magnetic resonance imaging(MRI),4,5 and x-ray computed tomography (CT).6 However, inultrasound imaging, which has been used to study early tomid-gestational embryos,3 microbubble contrast agents areoften required to overcome the low echogenicity of blood in
order to visualize the vasculature.3 Although MRI has beenused to visualise the heart and vasculature of the embryoin vivo,7 it is more widely used in ex vivo studies,8 due to thetechnical challenges of in vivo imaging. For example, the qualityof in vivo embryo images is limited by motion artefacts and poorspatial resolution due to the limited image acquisition time avail-able. X-ray CT provides weak, soft tissue contrast and typicallyrequires the use of exogenous contrast agents to visualize the vas-culature. In addition, the use of ionizing radiation can limit theduration of longitudinal studies.
Photoacoustic imaging is an emerging technique that canprovide label-free noninvasive three- dimensional images ofthe vasculature9 to depths of several cm with a spatial resolutionranging from tens to hundreds of microns (depending on depth).It is based upon the generation of ultrasound waves through theabsorption of nanosecond laser pulses by light absorbing tissuechromophores. The acoustic waves travel to the tissue surfacewhere they are detected by an ultrasound receiver array.From the detected signals, three-dimensional (3-D) imagesthat are proportional to the absorbed optical energy distributioncan be reconstructed. The fundamental advantage of photoa-coustic imaging is that it combines the physics of both opticaland ultrasound imaging thus providing both the spectral speci-ficity of purely optical methods and the high spatial resolution ofultrasound. Image contrast is dominated by optical absorptionmaking the technique well suited to visualizing the vasculaturedue to the strong absorption exhibited by hemoglobin at visibleand nearinfrared wavelengths. As well as providing images ofvascular anatomy, quantitative spectroscopic measurements ofblood oxygen saturation and hemoglobin concentration10 canbe made by acquiring images at multiple wavelengths. In addi-tion, there is the potential for measuring blood flow using
*Bradley Treeby is currently at Australian National University, Research School ofEngineering, College of Engineering and Computer Science, Building 115, NorthRoad, Canberra ACT 0200, Australia.
Address all correspondence to: Jan Laufer, Julius Wolff Institut, Charité – Univer-sitätsmedizin Berlin, Berlin 13353, Germany. Tel: +49 30 450 539 419; Fax: +4930 450 539 918; E-mail: [email protected] 0091-3286/2012/$25.00 © 2012 SPIE
Journal of Biomedical Optics 061220-1 June 2012 • Vol. 17(6)
Journal of Biomedical Optics 17(6), 061220 (June 2012)
Doppler techniques.11–13 These attributes suggests photoacous-tic imaging has strong potential as a preclinical investigative toolfor the noninvasive assessment of embryonic vascular structureand function.
Photoacoustic imaging has been used previously to obtainnoninvasive tomographic images of the vasculature of majororgans in mice, such as the brain14 and the skin.15 The potentialof photoacoustic imaging to visualize the vascular anatomy ofmouse embryos ex vivo has been demonstrated in preliminarystudies16,17 but not in situ or in vivo. In this paper, we demon-strate for the first time deep tissue (>10 mm) 3-D imaging ofwhole mouse embryos in vivo (and in utero) using an all-opticalPA scanner and an image reconstruction algorithm based onacoustic time reversal.
2 Methods
2.1 Photoacoustic Imaging System
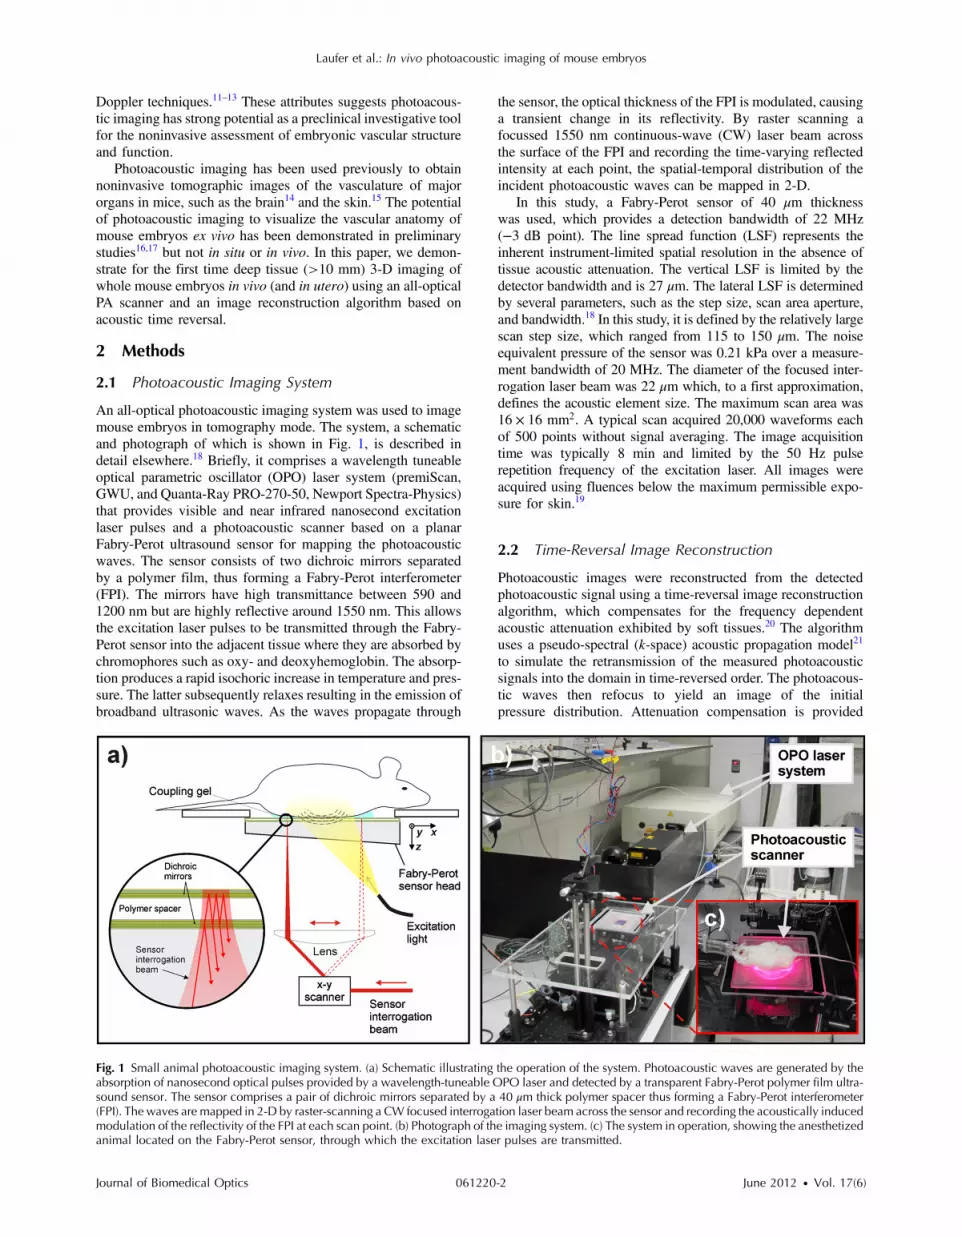
An all-optical photoacoustic imaging system was used to imagemouse embryos in tomography mode. The system, a schematicand photograph of which is shown in Fig. 1, is described indetail elsewhere.18 Briefly, it comprises a wavelength tuneableoptical parametric oscillator (OPO) laser system (premiScan,GWU, and Quanta-Ray PRO-270-50, Newport Spectra-Physics)that provides visible and near infrared nanosecond excitationlaser pulses and a photoacoustic scanner based on a planarFabry-Perot ultrasound sensor for mapping the photoacousticwaves. The sensor consists of two dichroic mirrors separatedby a polymer film, thus forming a Fabry-Perot interferometer(FPI). The mirrors have high transmittance between 590 and1200 nm but are highly reflective around 1550 nm. This allowsthe excitation laser pulses to be transmitted through the Fabry-Perot sensor into the adjacent tissue where they are absorbed bychromophores such as oxy- and deoxyhemoglobin. The absorp-tion produces a rapid isochoric increase in temperature and pres-sure. The latter subsequently relaxes resulting in the emission ofbroadband ultrasonic waves. As the waves propagate through
the sensor, the optical thickness of the FPI is modulated, causinga transient change in its reflectivity. By raster scanning afocussed 1550 nm continuous-wave (CW) laser beam acrossthe surface of the FPI and recording the time-varying reflectedintensity at each point, the spatial-temporal distribution of theincident photoacoustic waves can be mapped in 2-D.
In this study, a Fabry-Perot sensor of 40 μm thicknesswas used, which provides a detection bandwidth of 22 MHz(−3 dB point). The line spread function (LSF) represents theinherent instrument-limited spatial resolution in the absence oftissue acoustic attenuation. The vertical LSF is limited by thedetector bandwidth and is 27 μm. The lateral LSF is determinedby several parameters, such as the step size, scan area aperture,and bandwidth.18 In this study, it is defined by the relatively largescan step size, which ranged from 115 to 150 μm. The noiseequivalent pressure of the sensor was 0.21 kPa over a measure-ment bandwidth of 20 MHz. The diameter of the focused inter-rogation laser beam was 22 μm which, to a first approximation,defines the acoustic element size. The maximum scan area was16 × 16 mm2. A typical scan acquired 20,000 waveforms eachof 500 points without signal averaging. The image acquisitiontime was typically 8 min and limited by the 50 Hz pulserepetition frequency of the excitation laser. All images wereacquired using fluences below the maximum permissible expo-sure for skin.19
2.2 Time-Reversal Image Reconstruction
Photoacoustic images were reconstructed from the detectedphotoacoustic signal using a time-reversal image reconstructionalgorithm, which compensates for the frequency dependentacoustic attenuation exhibited by soft tissues.20 The algorithmuses a pseudo-spectral (k-space) acoustic propagation model21
to simulate the retransmission of the measured photoacousticsignals into the domain in time-reversed order. The photoacous-tic waves then refocus to yield an image of the initialpressure distribution. Attenuation compensation is provided
Fig. 1 Small animal photoacoustic imaging system. (a) Schematic illustrating the operation of the system. Photoacoustic waves are generated by theabsorption of nanosecond optical pulses provided by a wavelength-tuneable OPO laser and detected by a transparent Fabry-Perot polymer film ultra-sound sensor. The sensor comprises a pair of dichroic mirrors separated by a 40 μm thick polymer spacer thus forming a Fabry-Perot interferometer(FPI). The waves are mapped in 2-D by raster-scanning a CW focused interrogation laser beam across the sensor and recording the acoustically inducedmodulation of the reflectivity of the FPI at each scan point. (b) Photograph of the imaging system. (c) The system in operation, showing the anesthetizedanimal located on the Fabry-Perot sensor, through which the excitation laser pulses are transmitted.
Journal of Biomedical Optics 061220-2 June 2012 • Vol. 17(6)
Laufer et al.: In vivo photoacoustic imaging of mouse embryos
via an acoustic equation of state which accounts for acousticabsorption following a frequency power law. This significantlyincreases image magnitude and resolution, especially at greaterdepths.20 The attenuation parameters were set to those of humanbreast tissue22 with an absorption coefficient α ¼ α0f y dB cm−1
where f is the frequency, α0 ¼ 0.75 dBMHz−y cm−1 andy ¼ 1.5. The sound speed was determined using an autofocusmethod.23 This involved using a fast FFT-based reconstructionalgorithm24 without attenuation compensation to reconstruct anumber of images using different sound speeds. A metric relatedto image sharpness was calculated for each image, and the soundspeed corresponding to its maximum was chosen for the finalimage reconstruction using the time reversal algorithm.
For display purposes, the reconstructed 3-D images wereinterpolated onto a mesh with four times higher grid densityin x and y. To aid visualization of deeper lying features, theimage intensity was normalized with respect to depth using aone-dimensional exponential function to account for opticalattenuation. Maximum intensity projections (MIP) were com-puted from the 3-D image data set and displayed using alogarithmic image intensity scale. Three dimensional renderingwas accomplished using 3-D-Doctor (Able Software Corp.).
2.3 Embryo Imaging
Three sets of experiments were performed. In the first set,embryos of CD-1 mice at two stages of development (E15.5and E18.5, i.e., 15.5 days and 18.5 days gestation) were imagedex vivowithin 1 h of dissection. The embryos were placed on the
scanner and immersed in a strongly scattering intralipidsuspension (Fresenius Kabi) of 1% lipid concentration inorder to homogenize the incident illumination. The embryoswere irradiated either through the sensor (backward mode) orfrom above (forward mode) or in both forward and backwardmodes simultaneously using the signal and idler outputs ofthe OPO laser system.
The second set of experiments was aimed at demonstratingthe feasibility of imaging embryos in situ and involved imagingthe abdomen of two pregnant CD-1 mice (E15.5) within 1 h ofsacrifice. The fur on the abdomen was removed using commer-cial hair removal products. The skin remained intact. The abdo-men of the animals was then placed on the Fabry-Perot sensorwith a thin layer of aqueous gel inserted between the skin andthe sensor to provide acoustic coupling. The abdomen was illu-minated through the sensor (backward mode).
The third set of experiments was aimed at establishing thefeasibility of in vivo imaging of mouse embryos in the motheranimal. A pregnant CD-1 mouse (E15.5) was anesthetized usinga mixture of oxygen and isofluorane at a concentration of 4% forinduction and 1% to 2% for maintenance. The flow rate was1.1 min−1. Body temperature and respiration were monitoredand maintained constantly during the experiment.
For all experiments, the beam diameter of the incident excita-tion light was approximately 2 cm. This resulted in a fluence of<10 mJ cm−2, which is below the maximum permissible expo-sure for skin.19 The excitation wavelengths ranged from 600 to770 nm and the duration of the scans was approximately 8 min.
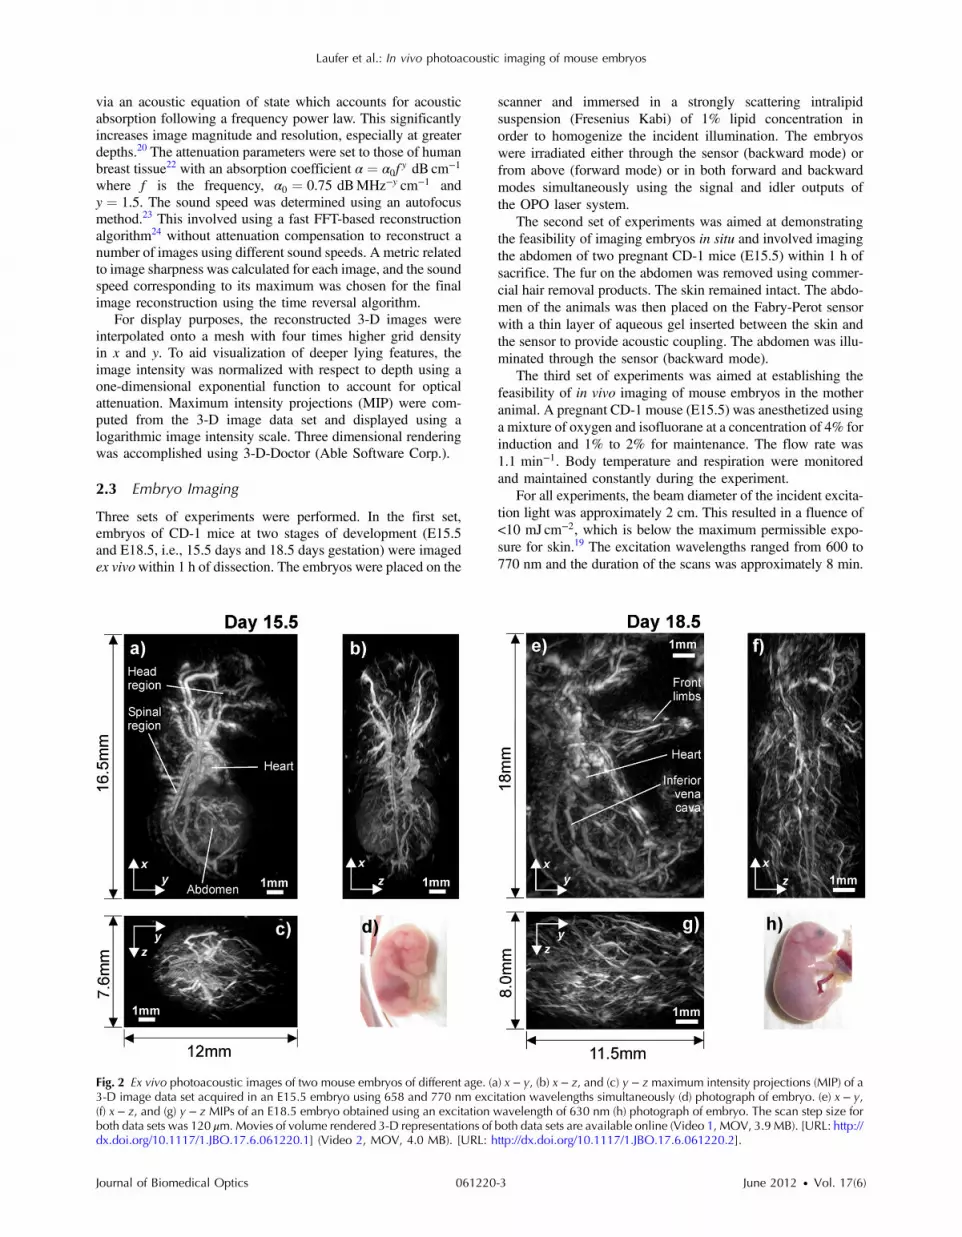
Fig. 2 Ex vivo photoacoustic images of two mouse embryos of different age. (a) x − y, (b) x − z, and (c) y − z maximum intensity projections (MIP) of a3-D image data set acquired in an E15.5 embryo using 658 and 770 nm excitation wavelengths simultaneously (d) photograph of embryo. (e) x − y,(f) x − z, and (g) y − z MIPs of an E18.5 embryo obtained using an excitation wavelength of 630 nm (h) photograph of embryo. The scan step size forboth data sets was 120 μm. Movies of volume rendered 3-D representations of both data sets are available online (Video 1, MOV, 3.9 MB). [URL: http://dx.doi.org/10.1117/1.JBO.17.6.061220.1] (Video 2, MOV, 4.0 MB). [URL: http://dx.doi.org/10.1117/1.JBO.17.6.061220.2].
Journal of Biomedical Optics 061220-3 June 2012 • Vol. 17(6)
Laufer et al.: In vivo photoacoustic imaging of mouse embryos
3 Results
3.1 Ex Vivo Photoacoustic Images of Mouse Embryos
Figure 2 shows ex vivo images of two embryos at differentstages of development. To obtain these images, forwardand backward mode illumination were used simultaneously.Figure 2(a)–2(c) shows MIPs (16.5 × 12.0 × 7.6 mm3) of the3-D image data set of an E15.5 embryo. Figure 2(a) showsregions such as the head, heart, abdomen and spine.Figure 2(e)–2(g) shows MIPs (18.0 × 11.5 × 8.0 mm3) of anE18.5 embryo and illustrates the more advanced anatomicaldevelopment. 3-D volume rendered representations of the
image data sets shown in Fig. 2 can be viewed online in Videos 1and 2.
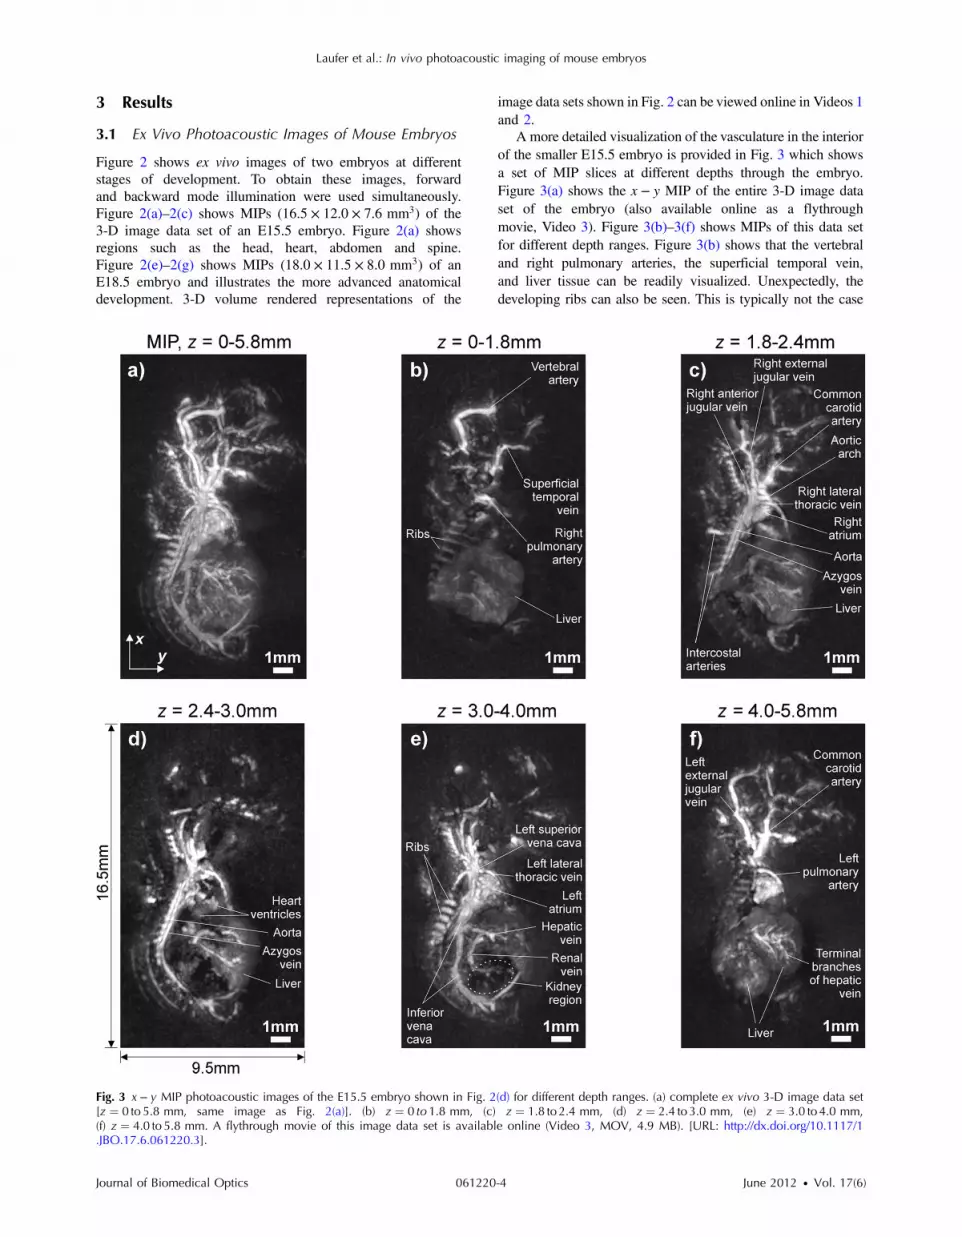
A more detailed visualization of the vasculature in the interiorof the smaller E15.5 embryo is provided in Fig. 3 which showsa set of MIP slices at different depths through the embryo.Figure 3(a) shows the x − y MIP of the entire 3-D image dataset of the embryo (also available online as a flythroughmovie, Video 3). Figure 3(b)–3(f) shows MIPs of this data setfor different depth ranges. Figure 3(b) shows that the vertebraland right pulmonary arteries, the superficial temporal vein,and liver tissue can be readily visualized. Unexpectedly, thedeveloping ribs can also be seen. This is typically not the case
Fig. 3 x − y MIP photoacoustic images of the E15.5 embryo shown in Fig. 2(d) for different depth ranges. (a) complete ex vivo 3-D image data set[z ¼ 0 to 5.8 mm, same image as Fig. 2(a)]. (b) z ¼ 0 to 1.8 mm, (c) z ¼ 1.8 to2.4 mm, (d) z ¼ 2.4 to 3.0 mm, (e) z ¼ 3.0 to4.0 mm,(f) z ¼ 4.0 to 5.8 mm. A flythrough movie of this image data set is available online (Video 3, MOV, 4.9 MB). [URL: http://dx.doi.org/10.1117/1.JBO.17.6.061220.3].
Journal of Biomedical Optics 061220-4 June 2012 • Vol. 17(6)
Laufer et al.: In vivo photoacoustic imaging of mouse embryos
in adult mice, as bone tissue has limited photoacoustic contrastdue to its low hemoglobin content. Figure 3(c) shows the vascu-lature around the right atrium of the heart, such as the lateral thor-acic vein, the aorta and the aortic arch, Azygos vein, and thejugular vein. The intercostal arteries, which branch off theaorta towards the region of the developing spine, can also beseen. Figure 3(d) shows the MIP for z ¼ 2.4 to 3.0 mm andreveals features resembling the heart ventricles. The lowerimage contrast produced by the ventricles compared to that ofthe heart atria may be a consequence of differences in their
anatomical structure. While the atria are smooth walledcompartments at this stage of embryonic development, the devel-oping ventricles are trabeculated structures,25 which may holdless blood volume than the atria and therefore produce lessphotoacoustic contrast. Figure 3(e) shows sections of the heart,such as the left atrium, and major parts of the vasculature, such asthe left lateral thoracic vein and the left superior vena cava. Themost noticeable feature is the inferior vena cava and its branches,such as the hepatic and renal veins. Also, regions correspondingto the developing bone tissue, such as the ribs, are again clearly
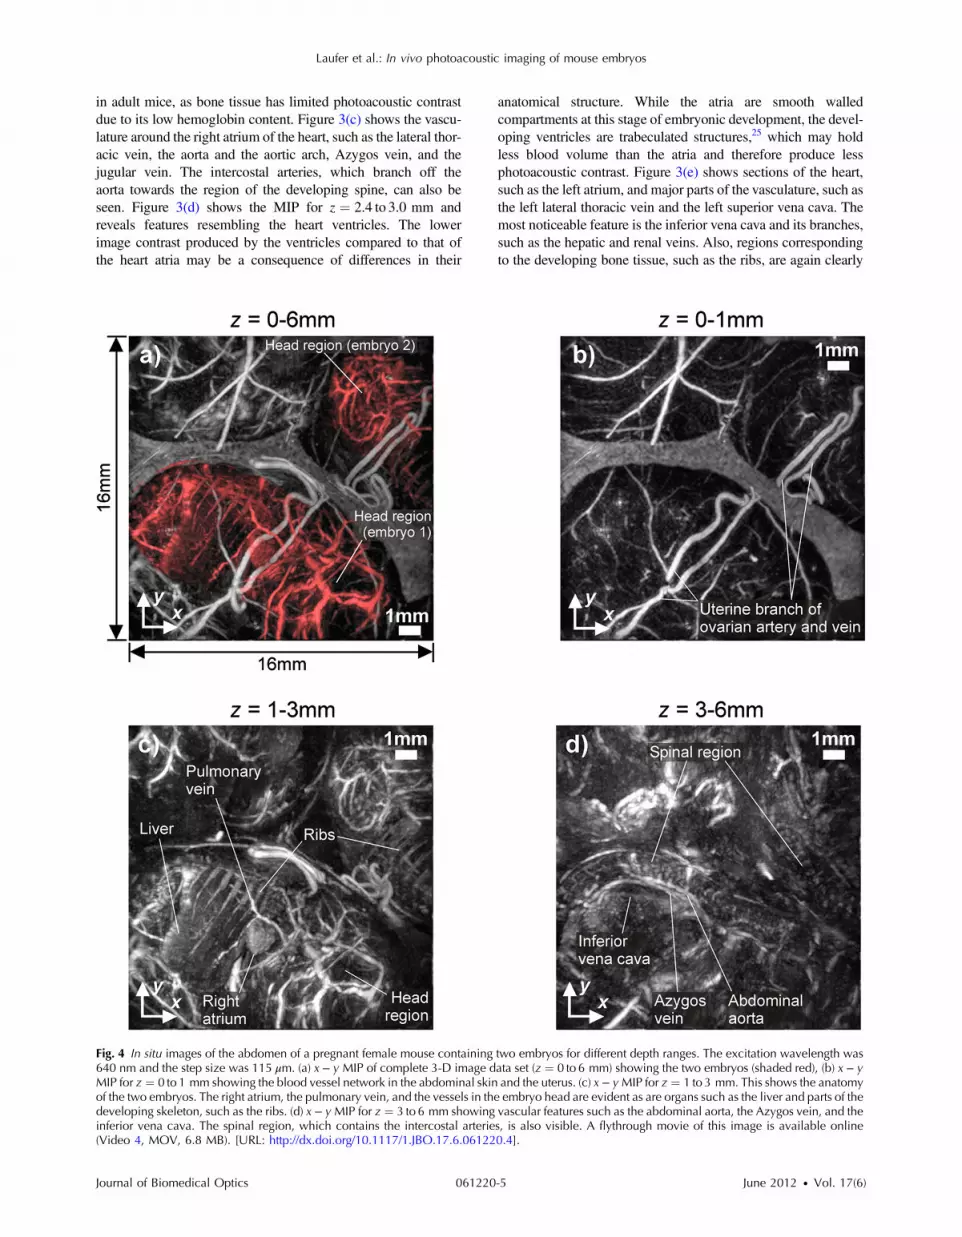
Fig. 4 In situ images of the abdomen of a pregnant female mouse containing two embryos for different depth ranges. The excitation wavelength was640 nm and the step size was 115 μm. (a) x − y MIP of complete 3-D image data set (z ¼ 0 to 6 mm) showing the two embryos (shaded red), (b) x − yMIP for z ¼ 0 to 1 mm showing the blood vessel network in the abdominal skin and the uterus. (c) x − yMIP for z ¼ 1 to 3 mm. This shows the anatomyof the two embryos. The right atrium, the pulmonary vein, and the vessels in the embryo head are evident as are organs such as the liver and parts of thedeveloping skeleton, such as the ribs. (d) x − y MIP for z ¼ 3 to 6 mm showing vascular features such as the abdominal aorta, the Azygos vein, and theinferior vena cava. The spinal region, which contains the intercostal arteries, is also visible. A flythrough movie of this image is available online(Video 4, MOV, 6.8 MB). [URL: http://dx.doi.org/10.1117/1.JBO.17.6.061220.4].
Journal of Biomedical Optics 061220-5 June 2012 • Vol. 17(6)
Laufer et al.: In vivo photoacoustic imaging of mouse embryos
evident. Figure 3(f) shows major external blood vessels, such asthe left external jugular vein, and internal vessels, such as thecommon carotid, the left pulmonary artery, and the terminalbranches of the hepatic vein within the liver.
3.2 In Situ Embryo Images
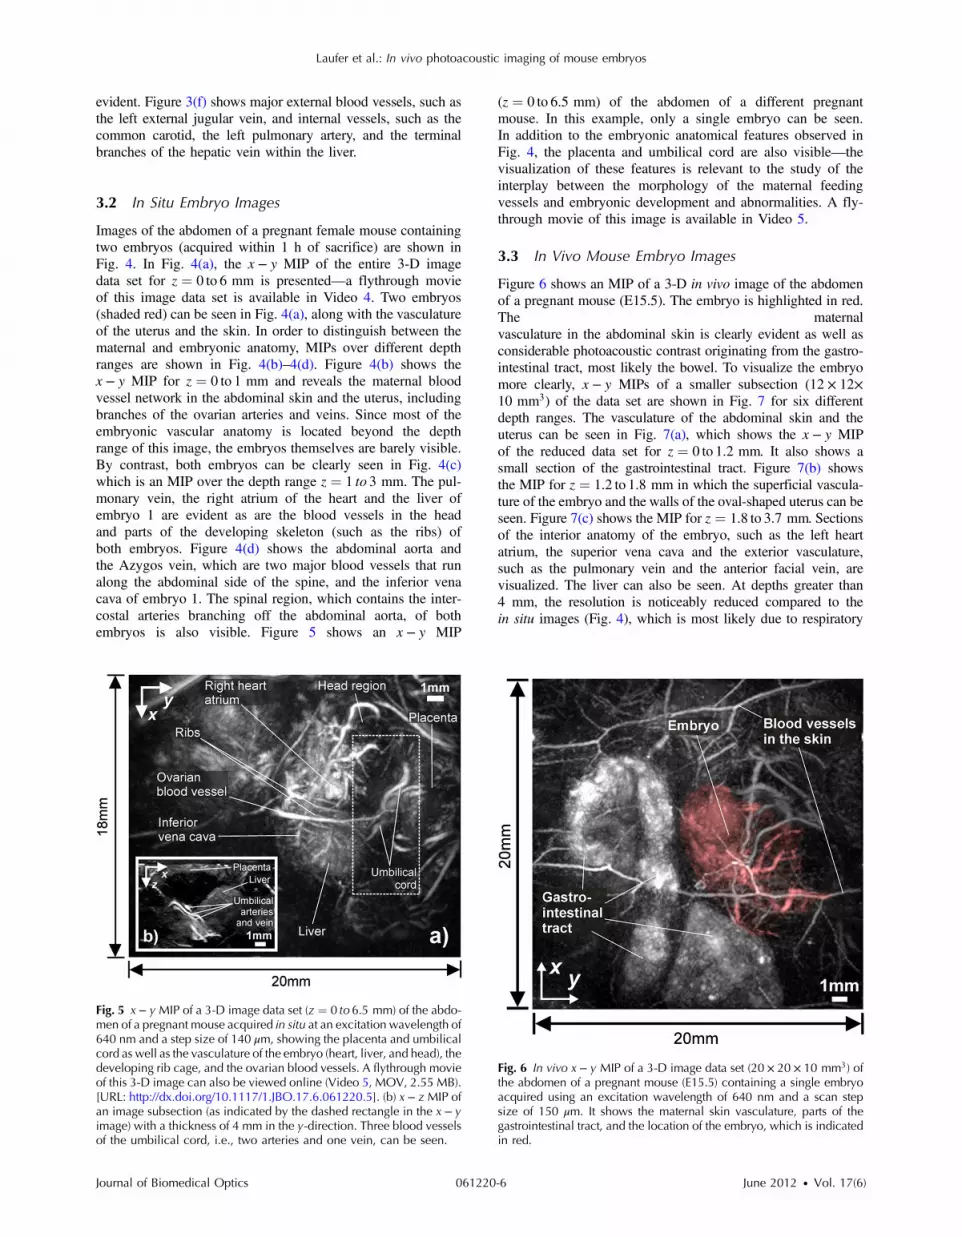
Images of the abdomen of a pregnant female mouse containingtwo embryos (acquired within 1 h of sacrifice) are shown inFig. 4. In Fig. 4(a), the x − y MIP of the entire 3-D imagedata set for z ¼ 0 to 6 mm is presented—a flythrough movieof this image data set is available in Video 4. Two embryos(shaded red) can be seen in Fig. 4(a), along with the vasculatureof the uterus and the skin. In order to distinguish between thematernal and embryonic anatomy, MIPs over different depthranges are shown in Fig. 4(b)–4(d). Figure 4(b) shows thex − y MIP for z ¼ 0 to 1 mm and reveals the maternal bloodvessel network in the abdominal skin and the uterus, includingbranches of the ovarian arteries and veins. Since most of theembryonic vascular anatomy is located beyond the depthrange of this image, the embryos themselves are barely visible.By contrast, both embryos can be clearly seen in Fig. 4(c)which is an MIP over the depth range z ¼ 1 to 3 mm. The pul-monary vein, the right atrium of the heart and the liver ofembryo 1 are evident as are the blood vessels in the headand parts of the developing skeleton (such as the ribs) ofboth embryos. Figure 4(d) shows the abdominal aorta andthe Azygos vein, which are two major blood vessels that runalong the abdominal side of the spine, and the inferior venacava of embryo 1. The spinal region, which contains the inter-costal arteries branching off the abdominal aorta, of bothembryos is also visible. Figure 5 shows an x − y MIP
(z ¼ 0 to 6.5 mm) of the abdomen of a different pregnantmouse. In this example, only a single embryo can be seen.In addition to the embryonic anatomical features observed inFig. 4, the placenta and umbilical cord are also visible—thevisualization of these features is relevant to the study of theinterplay between the morphology of the maternal feedingvessels and embryonic development and abnormalities. A fly-through movie of this image is available in Video 5.
3.3 In Vivo Mouse Embryo Images
Figure 6 shows an MIP of a 3-D in vivo image of the abdomenof a pregnant mouse (E15.5). The embryo is highlighted in red.The maternalvasculature in the abdominal skin is clearly evident as well asconsiderable photoacoustic contrast originating from the gastro-intestinal tract, most likely the bowel. To visualize the embryomore clearly, x − y MIPs of a smaller subsection (12 × 12×10 mm3) of the data set are shown in Fig. 7 for six differentdepth ranges. The vasculature of the abdominal skin and theuterus can be seen in Fig. 7(a), which shows the x − y MIPof the reduced data set for z ¼ 0 to 1.2 mm. It also shows asmall section of the gastrointestinal tract. Figure 7(b) showsthe MIP for z ¼ 1.2 to 1.8 mm in which the superficial vascula-ture of the embryo and the walls of the oval-shaped uterus can beseen. Figure 7(c) shows the MIP for z ¼ 1.8 to 3.7 mm. Sectionsof the interior anatomy of the embryo, such as the left heartatrium, the superior vena cava and the exterior vasculature,such as the pulmonary vein and the anterior facial vein, arevisualized. The liver can also be seen. At depths greater than4 mm, the resolution is noticeably reduced compared to thein situ images (Fig. 4), which is most likely due to respiratory
Fig. 5 x − y MIP of a 3-D image data set (z ¼ 0 to 6.5 mm) of the abdo-men of a pregnant mouse acquired in situ at an excitation wavelength of640 nm and a step size of 140 μm, showing the placenta and umbilicalcord as well as the vasculature of the embryo (heart, liver, and head), thedeveloping rib cage, and the ovarian blood vessels. A flythrough movieof this 3-D image can also be viewed online (Video 5, MOV, 2.55 MB).[URL: http://dx.doi.org/10.1117/1.JBO.17.6.061220.5]. (b) x − z MIP ofan image subsection (as indicated by the dashed rectangle in the x − yimage) with a thickness of 4 mm in the y-direction. Three blood vesselsof the umbilical cord, i.e., two arteries and one vein, can be seen.
Fig. 6 In vivo x − y MIP of a 3-D image data set (20 × 20 × 10 mm3) ofthe abdomen of a pregnant mouse (E15.5) containing a single embryoacquired using an excitation wavelength of 640 nm and a scan stepsize of 150 μm. It shows the maternal skin vasculature, parts of thegastrointestinal tract, and the location of the embryo, which is indicatedin red.
Journal of Biomedical Optics 061220-6 June 2012 • Vol. 17(6)
Laufer et al.: In vivo photoacoustic imaging of mouse embryos
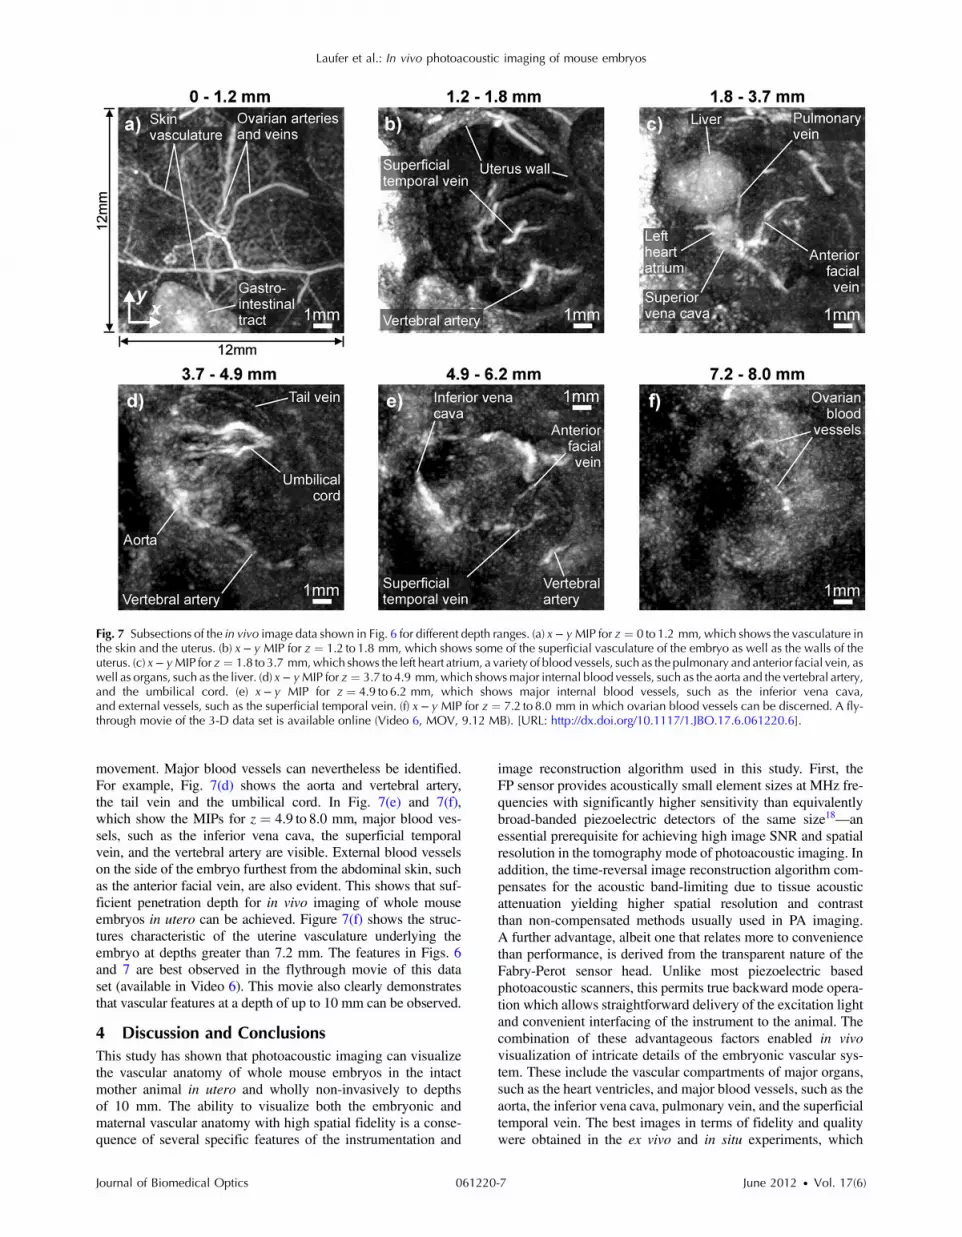
movement. Major blood vessels can nevertheless be identified.For example, Fig. 7(d) shows the aorta and vertebral artery,the tail vein and the umbilical cord. In Fig. 7(e) and 7(f),which show the MIPs for z ¼ 4.9 to 8.0 mm, major blood ves-sels, such as the inferior vena cava, the superficial temporalvein, and the vertebral artery are visible. External blood vesselson the side of the embryo furthest from the abdominal skin, suchas the anterior facial vein, are also evident. This shows that suf-ficient penetration depth for in vivo imaging of whole mouseembryos in utero can be achieved. Figure 7(f) shows the struc-tures characteristic of the uterine vasculature underlying theembryo at depths greater than 7.2 mm. The features in Figs. 6and 7 are best observed in the flythrough movie of this dataset (available in Video 6). This movie also clearly demonstratesthat vascular features at a depth of up to 10 mm can be observed.
4 Discussion and ConclusionsThis study has shown that photoacoustic imaging can visualizethe vascular anatomy of whole mouse embryos in the intactmother animal in utero and wholly non-invasively to depthsof 10 mm. The ability to visualize both the embryonic andmaternal vascular anatomy with high spatial fidelity is a conse-quence of several specific features of the instrumentation and
image reconstruction algorithm used in this study. First, theFP sensor provides acoustically small element sizes at MHz fre-quencies with significantly higher sensitivity than equivalentlybroad-banded piezoelectric detectors of the same size18—anessential prerequisite for achieving high image SNR and spatialresolution in the tomography mode of photoacoustic imaging. Inaddition, the time-reversal image reconstruction algorithm com-pensates for the acoustic band-limiting due to tissue acousticattenuation yielding higher spatial resolution and contrastthan non-compensated methods usually used in PA imaging.A further advantage, albeit one that relates more to conveniencethan performance, is derived from the transparent nature of theFabry-Perot sensor head. Unlike most piezoelectric basedphotoacoustic scanners, this permits true backward mode opera-tion which allows straightforward delivery of the excitation lightand convenient interfacing of the instrument to the animal. Thecombination of these advantageous factors enabled in vivovisualization of intricate details of the embryonic vascular sys-tem. These include the vascular compartments of major organs,such as the heart ventricles, and major blood vessels, such as theaorta, the inferior vena cava, pulmonary vein, and the superficialtemporal vein. The best images in terms of fidelity and qualitywere obtained in the ex vivo and in situ experiments, which
Fig. 7 Subsections of the in vivo image data shown in Fig. 6 for different depth ranges. (a) x − yMIP for z ¼ 0 to 1.2 mm, which shows the vasculature inthe skin and the uterus. (b) x − y MIP for z ¼ 1.2 to 1.8 mm, which shows some of the superficial vasculature of the embryo as well as the walls of theuterus. (c) x − yMIP for z ¼ 1.8 to 3.7 mm,which shows the left heart atrium, a variety of blood vessels, such as the pulmonary and anterior facial vein, aswell as organs, such as the liver. (d) x − yMIP for z ¼ 3.7 to 4.9 mm,which showsmajor internal blood vessels, such as the aorta and the vertebral artery,and the umbilical cord. (e) x − y MIP for z ¼ 4.9 to 6.2 mm, which shows major internal blood vessels, such as the inferior vena cava,and external vessels, such as the superficial temporal vein. (f) x − y MIP for z ¼ 7.2 to 8.0 mm in which ovarian blood vessels can be discerned. A fly-through movie of the 3-D data set is available online (Video 6, MOV, 9.12 MB). [URL: http://dx.doi.org/10.1117/1.JBO.17.6.061220.6].
Journal of Biomedical Optics 061220-7 June 2012 • Vol. 17(6)
Laufer et al.: In vivo photoacoustic imaging of mouse embryos

visualized the internal vasculature of major organs in greaterdetail than the in vivo images. Better in vivo imaging perfor-mance may be achieved by employing gating techniques similarto those used in MRI7 to compensate for detrimental factors suchas motion artefacts due to, for example, breathing, the beating ofthe heart, and possibly movements of the gastrointestinal tract.
The ability to obtain high resolution 3-D images of the vas-culature of mouse embryos in vivo makes this technology applic-able to, for example, longitudinal imaging studies of transgenicmouse embryos in which specific genetic knockouts induce heartand vascular malformations. These studies are currently carriedout ex vivo using modalities such as MRI26 or optical projectiontomography,27 which require extensive preparation of the excisedembryos and may involve the draining of blood and the useof contrast agents, such as gadolinium or fluorescent dyes. Bycontrast, photoacoustic imaging has the potential to enablethese studies to be conducted in vivo, over a period of time,and in a non-invasive manner thus making it a potentially power-ful tool for developmental biological research.
AcknowledgmentsWe would like to acknowledge the support of the British HeartFoundation and the Engineering and Physical SciencesResearch Council.
References1. F. S. Collins, J. Rossant, and W. Wurst, “A mouse for all reasons,” Cell
128(1), 9–13 (2007).2. M. H. Kaufman, The Atlas of Mouse Development, Vol. 512, Academic
Press, San Diego, CA (1992).3. F. S. Foster, J. Hossack, and S. L. Adamson, “Micro-ultrasound for
preclinical imaging,” Interface Focus 1(4), 576–601 (2011).4. J. O. Cleary et al., “Cardiac phenotyping in ex vivo murine embryos
using microMRI,” NMR Biomed. 22(8), 857–866 (2009).5. J. O. Cleary et al., “Magnetic resonance virtual histology for embryos:
3D atlases for automated high-throughput phenotyping,” NeuroImage54(2), 769–778 (2011).
6. J. T. Johnson et al., “Virtual histology of transgenic mouse embryos forhigh-throughput phenotyping,” PLoS Genetics 2(4), e61 (2006).
7. B. J. Nieman, K. U. Szulc, and D. H. Turnbull, “Three-dimensional, invivo MRI with self-gating and image coregistration in the mouse,”Magn. Reson. Med. 61(5), 1148–1157 (2009).
8. C. A. Berrios-Otero et al., “Three-dimensional micro-MRI analysis ofcerebral artery development in mouse embryos,” Magn. Reson. Med.62(6), 1431–1439 (2009).
9. P. Beard, “Biomedical photoacoustic imaging,” Interface Focus 1(4),602–631 (2011).
10. J. Laufer et al., “Quantitative spatially resolved measurement oftissue chromophore concentrations using photoacoustic spectroscopy:application to the measurement of blood oxygenation and haemoglobinconcentration,” Phys. Med. Biol. 52, 141–168 (2007).
11. J. Yao et al., “In vivo photoacoustic imaging of transverse blood flow byusing Doppler broadening of bandwidth,” Opt. Lett. 35(9), 1419–1421(2010).
12. A. Sheinfeld, S. Gilead, and A. Eyal, “Simultaneous spatial and spectralmapping of flow using photoacoustic Doppler measurement,”J. Biomed. Opt. 15(6), 066010 (2010).
13. J. Brunker and P. Beard, “Pulsed photoacoustic Doppler flow measure-ments in blood-mimicking phantoms,”Proc. SPIE7899, 78991K (2011).
14. J. Laufer et al., “Three-dimensional noninvasive imaging of the vascu-lature in the mouse brain using a high resolution photoacoustic scanner,”Appl. Opt. 48(10), D299–306 (2009).
15. E. Z. Zhang et al., “In vivo high-resolution 3D photoacoustic imaging ofsuperficial vascular anatomy,” Phys. Med. Biol. 54(4), 1035–1046(2009).
16. J. G. Laufer et al., “Photoacoustic imaging of vascular networks intransgenic mice,” Proc. SPIE 7564, 75641A (2010).
17. J. Xia et al., “Three-dimensional photoacoustic tomography based onthe focal-line concept,” J. Biomed. Opt. 16(9), 090505 (2011).
18. E. Zhang, J. Laufer, and P. Beard, “Backward-mode multiwavelengthphotoacoustic scanner using a planar Fabry-Perot polymer filmultrasound sensor for high-resolution three-dimensional imaging ofbiological tissues,” Appl. Opt. 47(4), 561–577 (2008).
19. British Standard: Safety of laser products BS EN 60825-1:1994.20. B. E. Treeby, E. Z. Zhang, and B. T. Cox, “Photoacoustic tomography in
absorbing acoustic media using time reversal,” Inverse Problems26(11), 115003 (2010).
21. B. E. Treeby and B. T. Cox, “k-Wave: MATLAB toolbox for the simu-lation and reconstruction of photoacoustic wave fields,” J. Biomed. Opt.15(2), 021314 (2010).
22. T. L. Szabo, Diagnostic Ultrasound Imaging, Elsevier Academic Press,London (2004).
23. B. E. Treeby et al., “Automatic sound speed selection in photoacousticimage reconstruction using an autofocus approach,” J. Biomed. Opt.16(9), 090501 (2011).
24. K. P. Köstli et al., “Temporal backward projection of optoacousticpressure transients using fourier transform methods,” Phys. Med. Biol.46, 1863–1872 (2001).
25. A. T. Soufan et al., “Three-dimensional reconstruction of gene expressionpatterns during cardiac development,” Physiol. Genom. 13, 187–195(2003).
26. J. O. Cleary et al., “Cardiac phenotyping in ex vivo murine embryosusing microMRI,” NMR Biomed. 22, 857–866 (2009).
27. J. R. Walls et al., “Three-dimensional analysis of vascular developmentin the mouse embryo,” PloS One 3(8), e2853 (2008).
Journal of Biomedical Optics 061220-8 June 2012 • Vol. 17(6)
Laufer et al.: In vivo photoacoustic imaging of mouse embryos