during prometaphase in drosophila melanogaster embryos
TRANSCRIPT
Temporal and Spatial Coordination of Chromosome Movement, Spindle Formation, and Nuclear Envelope Breakdown During Prometaphase in Drosophila melanogaster Embryos Yasushi Hi raoka , David A. Agard, and John W. Sedat
Department of Biochemistry and Biophysics and the Howard Hughes Medical Institute, University of California, San Francisco, San Francisco, California 94143-0554
Abstract. The spatial and temporal dynamics of diploid chromosome organization, microtubule ar- rangement, and the state of the nuclear envelope have been analyzed in syncytial blastoderm embryos of Drosophila melanogaster during the transition from prophase to metaphase, by three-dimensional optical sectioning microscopy. Time-lapse, three-dimensional data recorded in living embryos revealed that congres- sion of chromosomes (the process whereby chromo- somes move to form the metaphase plate) at prometaphase occurs as a wave, starting at the top of the nucleus near the embryo surface and proceeding through the nucleus to the bottom. The time-lapse analysis was augmented by a high-resolution analysis of fixed embryos where it was possible to unambigu-
ously trace the three-dimensional paths of individual chromosomes. In prophase, the centromeres were found to be clustered at the top of the nucleus while the telomeres were situated at the bottom of the nu- cleus or towards the embryo interior. This polarized centromere-telomere orientation, perpendicular to the embryo surface, was preserved during the process of prometaphase chromosome congression. Correspond- ingly, breakdown of the nuclear envelope started at the top of the nucleus with the mitotic spindle being formed at the positions of the partial breakdown of the nuclear envelope. Our observations provide an exam- ple in which nuclear structures are spatially organized and their functions are locally and coordinately con- trolled in three dimensions.
M ITOSIS requires a precise coordination of cytoplas- mic and nuclear events: chromosome condensa- tion, fragmentation of the endoplasmic reticulum,
vesicularization of the Golgi apparatus, nuclear envelope breakdown, spindle formation, chromosome segregation, and reformation of the nuclear envelope. Control mecha- nisms involved in the initiation of mitosis have been exten- sively studied genetically and biochemically (reviewed in Nurse, 1990). These lead to dramatic changes in phosphory- lation of a number of proteins including histones and lamins; for example, chromosome condensation is accompanied by phosphorylation of histone HI and H3 (Matthews and Brad- bury, 1978; Gurley et al., 1978), nuclear envelope break- down is likely to be caused by phosphorylation of lamins (Ward and Kirschner, 1990; Heald and McKeon, 1990; Pe- ter et al., 1990), and phosphorylation of centrosomes in- creases their microtubule-organizing capacity (Vandr6 and Borisy, 1985). It remains to determine the temporal and spa- tial relationships of these events to build a complete picture of this dynamic process. In this paper, we have analyzed the dynamics of the three-dimensional arrangement of chromo- somes within the nucleus and have sought to relate the ob- served spatial patterns to the dynamics of the nuclear enve- lope and microtubule organization during the prometaphase
transition. A key aspect of this work has been the three- dimensional microscopic examination of individual nuclei, which provides the unique capability of direcdy visualizing transient, ephemeral structures, and interactions.
Early embryos of Drosophila melanogaster provide a powerful system for studying dynamic aspects of the mitotic cycle. In the first 13 nuclear cycles of Drosophila embryos, nuclei divide every 10-20 min (Zalokar and Erk, 1976). At late syncytial blastoderm stage from nuclear cycles 10-13, nuclei form a monolayer on the embryo surface, providing as many as 5,000 geometrically related examples of nuclear structures in a single embryo. Nuclear divisions are essen- tially synchronous with a shallow gradient of mitotic stages along the length of the embryo (Foe and Alberts, 1983). This gradient allows the time dependence of the chromosome ar- rangement to be examined by simply viewing closely spaced nuclei in a single fixed embryo. Another advantage of Dro- sophila is that a number of mutations affecting chromosome structure and mitosis during these stages of embryogenesis have been obtained (reviewed in Glover, 1989). In addition, the small number of chromosomes (2 n = 8) simplifies the identification of chromosomes and the analysis of their spa- tial relationships.
Until recently, it has only been possible to examine the
© The Rockefeller University Press, 0021-9525/90/12/2815/14 $2.00 The Journal of Cell Biology, Volume 111 (No. 6, Pt. 2), Dec. 1990 2815-2828 2815
nondisrupted, three-dimensional arrangement of chromo- somes in certain specialized tissues containing polytenized giant chromosomes such as salivary gland nuclei in Dro- sophila melanogaster (Mathog et al., 1984; Hochstrasser et al., 1986). By contrast, in diploid tissues, chromosome ar- rangement has been studied mostly using squash prepara- tions of chromosomes and statistical models to infer their three-dimensional arrangement (reviewed in Avivi and Feld- man, 1980). The major difficulty associated with the direct examination of diploid chromosomes was their considerably smaller size. Drosophila diploid chromosomes (with widths of 0.2-0.4 #m in the condensed states) are packed in a nu- cleus of 4-5 #m diameter. In dramatic contrast, the diameter of a polytene nucleus is 30/zm and each polytene chromo- some has a width of 3 #m. Thus, an increase of nearly an order of magnitude in resolution over that obtained for the studies on polytene chromosomes was required to examine diploid chromosomes.
Recent technological developments in light microscopy, using computational image processing (reviewed in Agard et al., 1989; Fay et al., 1989) or confocal microscopes (re- viewed in Brakenhoff et al., 1989) to remove out-of-focus image information, have made it possible to examine the three-dimensional organization of diploid chrom'osomes directly in intact cells (Agard et al., 1988; Rawlins and Shaw, 1988; Oud et al., 1989). Unfortunately, currently available confocal microscopes have proved to be too insensitive to record useful three-dimensional data for the very small Dro- sophila embryonic chromosomes. Thus, in our procedures, three-dimensional microscopic images are recorded on a cooled, charge-coupled device (CCD) l using an ordinary fluorescence microscope (Hiraoka et al., 1987; Aikens et al., 1989) and the out-of-focus image information is com- putationally removed (Agard et al., 1989). Furthermore, using the computational approach it is now possible to exam- ine living samples in three dimensions by time-lapse, optical sectioning microscopy (Minden et al., 1989; Hiraoka et al., 1989).
In this report, we describe the evolution of the spatial or- ganization of chromosomes during the transition from pro- phase to metaphase and their interactions with nuclear enve- lope and mitotic spindle in Drosophila syncytial blastoderm embryos. This was accomplished by three-dimensional, op- tical sectioning microscopy, using both time-lapse optical sectioning of nuclei in living embryos and high-resolution optical sectioning in fixed embryos. The time-lapse record- ing scheme allows analysis of the dynamic behavior of chro- mosomes in individual nuclei as a function of time. This was augmented by the high-resolution analysis in fixed embryos where the exact locations of the centromeres and telomeres can be determined and the individual chromosome arms traced in three dimensions and uniquely identified. The spa- tial relationships among chromosomes, microtubules, and the nuclear envelope were examined by simultaneous obser- vation of multiple cellular components in three dimensions. Our results revealed that in blastoderm stage embryos, pro- phase and metaphase chromosomes have a geometrically po- larized arrangement relative to the embryo surface, and that this polarized arrangement is preserved during pro-
1. Abbreviations used in this paper: CCD, charge-coupled device; DAPI, 4',6-diamidino-2-phenylindole.
metaphase chromosome congression (the process whereby chromosomes move together and pack tightly to form the metaphase plate). Importantly, prometaphase chromosome congression, nuclear envelope breakdown, and mitotic spin- die formation all take place in a polarized fashion starting near the embryo surface. An implication of our observations is that prometaphase chromosome congression, nuclear en- velope breakdown, and mitotic spindle formation are locally regulated and that the three-dimensional, spatial organiza- tion of nuclear structures is important for the coordination of their functions.
Materials and Methods
Microscope System Description Two CCD microscope systems were used for data collection. (a) A liquid nitrogen-cooled CCD camera (Photometrics, Ltd., Tucson, AZ) with a 640 × 1,024 pixel CCD chip (RCA) is coupled to a Zeiss in~'erted Axiomat mi- croscope; microscope lamp shutter, focus movement, and CCD data collec- tion are controlled by a VAX 8650 computer (Hiraoka et al., 1987). (b) A Peltier-cooled CCD camera (Photometrics, Ltd.) with a 1,340 × 1,027 pixel CCD chip (Kodak-Videk) is coupled to an Olympus inverted microscope IMT-2; microscope lamp shutter, focus movement, CCD data collection, and filter combinations are controlled by a MicroVax IIl workstation (Min- den et al., 1989; Hiraoka et al., 1989).
Optical Sectioning Microscopy of Chromosomes in Living Embryos Rhodamine-labeled calf thymus histones H2A and H2B (a gift of Dr. J. S. Minden) were microinjected to Drosophila embryos 30 rain after oviposi- tion. The injected histones are incorporated into chromosomes during the periods of DNA replication and allow visualization of chromosomes in the living state during several mitotic cycles. Embryos injected with histones and observed under the microscope develop normally to hatching. The de- tails of the methods are described in Minden et al. (1989).
The embryos were illuminated with a 100 W mercury arc lamp attenu- ated 20-fold and observed on the Olympus IMT-2 microscope using an Olympus oil immersion objective lens (40×; NA = 1.3) and a high selec- tivity rhodamine filter combination (Omega Optical, Inc., Brattleboro, VT). The CCD pixel size corresponds to 0.17 t~m in the specimen plane. To speed up image readout, images were taken on a small portion of the CCD, 256 x 256 pixels corresponding to a 44 × 44/~m area. Five optical section images were taken by stepping the microscope focus in increments of 1/~m with an exposure time of 0.1 s. It took 5 s to read out each image; thus, 25 s for one cycle of a focus series. This was repeated continuously as a time course:
Optical Sectioning Microscopy of Chromosomes in Fixed Embryos Drosophila embryos were fixed with 3.7% formaldehyde (freshly prepared from paraformaldehyde) in a 1:1 mixture of heptane/buffer A (15 mM Pipes pH 7.0, 80 mM KC1, 20 mM NaC1, 0.5 mM EGTA, 2 mM EDTA, 0.5 mM spermidine, 0.2 mM spermine, 0.1% 2-mercaptoethanol); chorion and vitelline membrane were removed as described previously (Mitchison and Sedat, 1983). The embryos were stained with 0.1 ~g/ml 4',6-diamidino-2- phenylindole (DAPI) and examined on a Zeiss Universal microscope to de- termine their developmental stage from the density of nuclei on embryo sur- face (Foe and Alberts, 1983). The selected embryos were attached to a glass slide by adhesion to poly-L-lysine and mounted in buffer A as a immersion medium without coverslip. For high-resolution imaging of chromosomes, optical section images were collected on the CCD at focus step of 0.2 or 0.25/zm using a Zeiss water immersion coverslip-free objective lens (63 x; NA = 1.2) on a Zeiss Axiomat microscope. The CCD pixel size corre- sponds to 0.070/~m in the specimen plane.
Indirect lmmunofluorescence and Optical Sectioning Microscopy of Triply Stained Embryos For indirect immunofluorescence microscopy, embryos were prepared as
The Journal of Cell Biology, Volume 111, 1990 2816
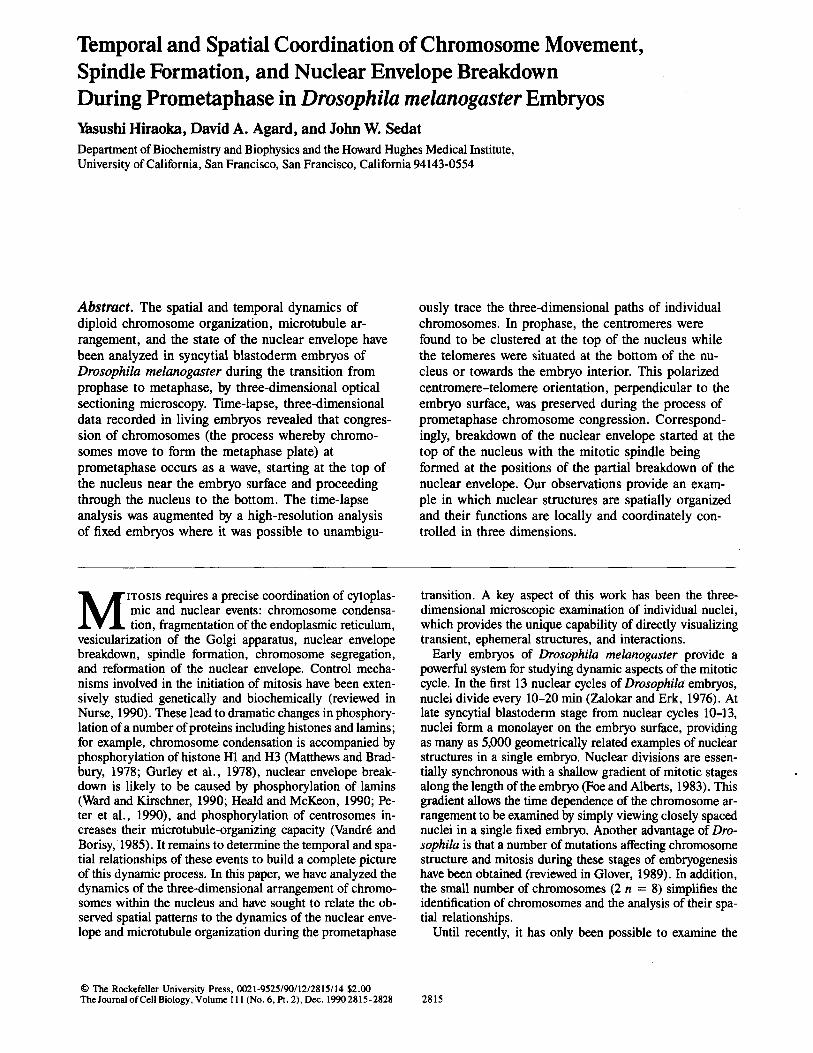
l~gure 1. A cytological map of DAPI-staining patterns. (A) Squash preparation of chromosomes from a male embryo stained with DAPI. (B) Computationally straightened chromosomes (left) and diagram of DAPI-stalning patterns (right). In the diagram, dark regions represent bright fluorescence in DAPI staining; short verti- cal bars represent the position of centromere.
described above but with one modification; taxol (10/zl of a 0.5 mM solution in dimethylsuifoxide) was added to the fixation mixture (5 mi of heptane and 5 mi of buffer A containing 3.7 % formaldehyde) to stabilize microtu- bules (Karr and Alberts, 1986). Antibody staining was carried out as de- scribed previously (Fuchs et al., 1983) in a 96-well microtiter plate. Whole fixed embryos were incubated with PBT (PBS/0.1% Triton X-100) contain- ing 10% normal goat serum, and then incubated with a mouse monoclonal antibody against Drosophila melanogaster lamin, B9 (Kuo et al., 1982) and a rat monoclonal antibody against yeast a-tubulin, YL1/2 (Kiimartin et al., 1982; Accurate Chemical & Scientific Corp., Westbury, NY) in PBT. Loca- tions of lamin and tubulin were detected by incubation of these embryos with rhodamine-conjuga~d goat anti-mouse lgG (with minimal cross- reaction to rat serum proteins; Jackson Immuno Research Laboratories, Avondale, PA) and fluorescein-conjngated goat anti-rat IgG (with minimal cross-reaction to mouse serum proteins; Jackson lmmuno Research Laboratories) in PBT containing 10% normal goat serum. The embryos were mounted in buffer A containing 0.1 #g/mi DAPI. The triply stained embryos were observed on the Olympus IMT-2 microscope using an Olympus oil immersion objective lens (60x; NA = 1.3). The CCD pixel size corresponds to 0.11 /~m in the specimen plane. Optical section data were collected on the CCD at 0.2-/~m focus intervals by repeating the fol- lowing sequence at each focal plane. Three images were obtained sequen- tially for chromosomes (DAPI), microtubules (fluorescein), and nuclear envelope (rhodamine), and then microscope focus was stepped by 0.2/~m. High selectivity excitation and barrier filter combinations (Omega Optical, Inc.) for DAPI, fluorescein, and Texas red were used (Texas red filter com- bination was used for rhodamine-labeled specimens). For wavelength switching during data collection, excitation and barrier filters are mounted on wheels rotated by a microsteppiag motor controlled by the Micro VAX. A single dichroic mirror with triple-band pass properties (Omega Optical, Inc.) designed for wavelengths of DAPI, fluorescein, and Texas red was used to eliminate significant image displacement during the wavelength switching, thus allowing the triple-color images to be superimposed without
further alignment (the residual translational displacement was estimated using multicolor fluorescent beads under the observation conditions; x, y, and z displacements are 0.023, 0.062, and 0.084 #m, respectively, between DAPI and Texas red images, and 0.292, 0.131, and 0.285/~m, respectively, between DAPI and fluorescein images).
Image Processing and Analysis Image processing and analysis are carried out on a VAX8650 computer or attached FPS 264 array processor (Floating Point Systems, Inc., Beaverton, OR) using programs written in Fortran. The out-of-focus information was removed by a three-dimensional iterative, deconvolution method with a non- negativity constraint (Agard et ai., 1989) using the optical transfer function experimentally determined for the objective lens used (Hiraoka ct al., 1990). Unlike subtraetive methods such as the nearest neighbor deblurring method appropriate for larger biological structures (Agard and Sedat, 1983; Agard, 1984), this apprnaeh effectively moves the out-of-focns photons back to their correct positions within the object, thereby maintaining a high signal-to-noise ratio. By using current computer technology, three-dimen- sional deconvolution (25 iterations) can be performed in 1-2 h for a 512 × 512 x 64 pixel image. Images were further processed, as necessary, to enhance local contrast (Belmont et al., 1987), or to detect chromosome boundaries based on the three-dimensional intensity gradient (Chen et al., 1989).
An interactive modeling program to trace chromosome paths in a three- dimensional data stack is based on an earlier implementation (Mathog, 1985). Details of the computer algorithms are described in Chen et al. (1989). This program can open up to eight windows on a display screen at one time and display computationally rotated multiple views of the same object in each window. Chromosome paths are traced by a cursor and recorded as sets of three-dimensional coordinates, while the multiple im- ages from various view angles are updated simultaneously to follow the cur- sor movement. Modeling and image display are carried out on a Parallax model 1280 graphic display with a 12 Mbyte image memory (Parallax Graphics Inc., Santa Clara, CA).
Software for computational manipulation of grey level information as- sociated with traced chromosome paths to straighten or dissect the chromo- somes has been developed. Grey level information associated with the selected chromosome paths is discriminated by thresholding the grey level intensity and/or detecting chromosome edges based on the intensity gra- dient, and dissected from the rest of chromosomes. The dissected chromo- somes are recomposed as the outlines filled with a particular color. Each traced chromosome can be computationally straightened by a combination of operations of rotation, translation and transformation based on the three- dimensional geometry.
Identification of Chromosomes Drosophila melanogaster has two sets of four chromosomes (X(Y), 2, 3, and 4) that can be identified by their shapes and DAPI-stalning patterns. Chromosome 4 is the smallest and is recognized as a tiny bright spot; chro- mosomes 2 and 3 are metacentric and each arm is shorter than that of sex chromosomes X and Y, which are telocentric and acrocentric, respectively. Thus, 10 chromosome arms should be recognized in a diploid nucleus (two sets of X(Y), 2L, 2R, 3L and 3R; chromosome 4 and the short arm of chro- mosome Y are ignored). The Y chromosome is the most distinctive with its bright heterochromatic blocks along the entire chromosome. Although the euchromatic arms of chromosomes 2 and 3 have relatively few distinc- tive features, these chromosomes can be distinguished from one another by the heterochromatic blocks near the centromere. These features were deduced from spread chromosome preparations (Fig. 1); similar results have been previously reported (Kaufmann, 1934; Holmquist, 1975; Gatti et al., 1976; Halfer, 1981; Gatti and Pimpinelli, 1983).
Results
We examined three-dimensional nuclear structures in Dro- sophila melanogaster embryos specifically at nuclear cycles 12 and 13 while nuclei divide rapidly and essentially syn- chronously. Nuclei were viewed from a direction perpendic- ular to the embryo surface; thus microscopic images are ap- proximately parallel to the embryo surface unless described otherwise. In this report, the "top" of a nucleus refers to loca-
Hiraoka et al. Spatial Coordination of Polarized Nuclear Events 2817

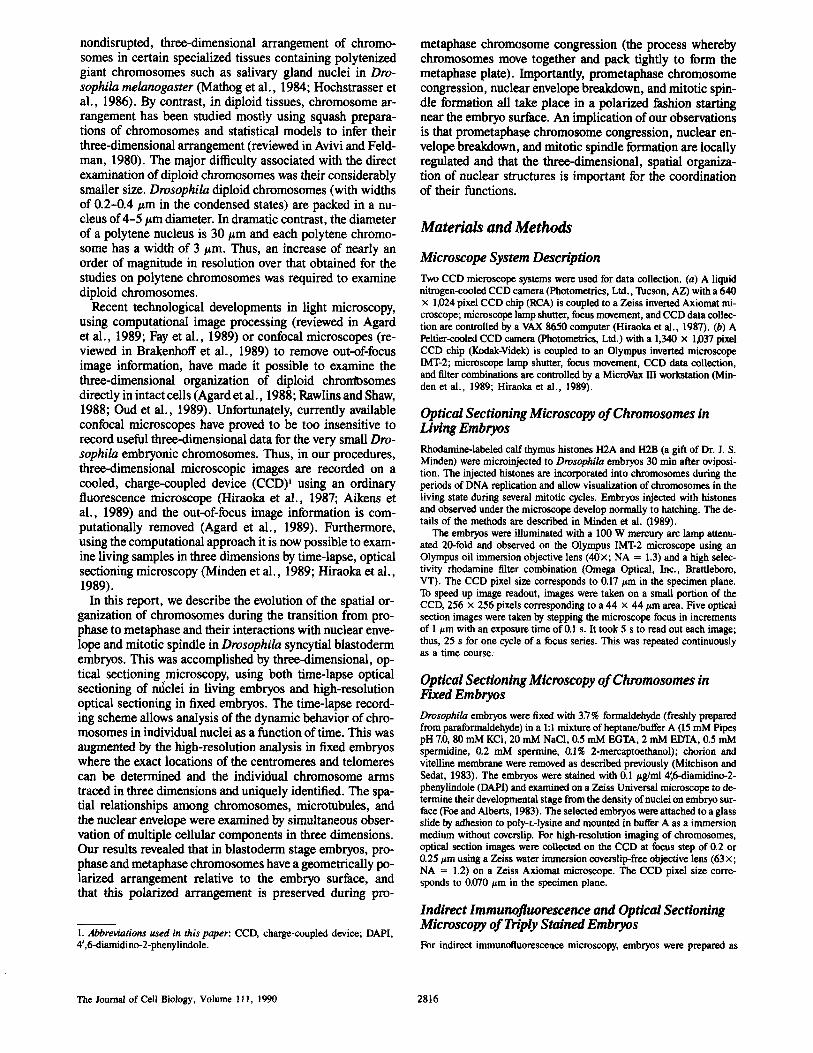
Figure 2. Optical sectioning and image processing of em- bryonic nuclei. Low magnifi- cation view (A) of a whole em- bryo stained with a DNA-spe- cific fluorescent dye, DAPI. Every bright spot distributed throughout the embryo surface represents a single individual nucleus. An example of optical sections from a three-dimen- sional data stack before (B) and after (C) the removal of out-of-focus image contamina- tion. ~ n s i o n a l image data were obtained at 0.25-~m focus intervals under computer control. Each displayed sec- tion is separated by 0.5 #rn in the focus (z) direction. The out-of-focus information was removed by an iterative decon- volution method with a non- negativity constraint (Agard et al., 1989) using the optical transfer function experimen- tally determined for the objec- tive lens used (Hiraoka et al., 1990).
tions near the embryo surface whereas the "bottom" refers to locations toward the embryo interior.
Determination of Chromosome Arrangement V~thin a Diploid Nucleus
Three-dimensional data were collected as a series of images recorded at different focal planes by stepping the microscope focus. For the high-resolution analysis of chromosome orga- nization in fixed specimens, optical section images were taken at 0.2-0.25-#m focus intervals and computationally processed to remove out-of-focus image information as de- scribed in Materials and Methods. An example of such opti- cal sectioning of diploid prophase nuclei in fixed embryos is shown in Fig. 2. Fig. 2 A shows an entire Drosophila embryo prepared and fixed under conditions previously shown to preserve chromosome structure by electron microscopy (Bel- mont et al., 1989) and stained with the nonintercalative DNA-specific fluorescent dye, DAPI. Optical sections, be- fore and after the image processing, are shown in Fig. 2, B and C, respectively. The image processing employed here, three-dimensional iterative, constrained deconvolution, acts to improve the microscopic resolution by recovering an esti- mate of the true object from the observed microscopic image using knowledge of the microscope's point-spread function, or a smearing function (for a discussion of mathematical ba- sis of this method, see Agard et al., 1989; also see Materials and Methods). To trace the paths of chromosomes in an em-
bryonic diploid nucleus, image processing of this type is ab- solutely essential, because an embryonic diploid nucleus is so small that the point spread function covers almost the en- tire nucleus. Note that chromosome strands barely resolved in the original image are clearly resolved following image processing (Fig. 2, B and C).
The processed three-dimensional data were analyzed to determine the spatial arrangement of chromosomes within the nucleus. First, paths of chromosomes were traced in three dimensions using interactive computer software op- timized for examining complex biological images (Chen et al., 1989; also see Materials and Methods). Once chromo- some paths were determined, a computational dissection scheme was used to visualize the structural features of the chromosomes (see Materials and Methods). Second, the traced paths were identified as belonging to particular chro- mosomes by their characteristic DAPI-staining patterns and also by their shapes. To accomplish this, a cytological map of DAPI-staining patterns for diploid chromosomes was made from spread chromosome preparations that were fixed and stained under the conditions used for the three-dimen- sional analysis (see Fig. 1 in Materials and Methods).
An example of a model representing the traced three- dimensional paths of the chromosomes is shown in Fig. 3. Fig. 3 A shows a projected view of a diploid prophase nu- cleus reconstructed from the processed optical section data presented in Fig. 2 C. Models of chromosome paths that
The Journal of Cell Biology, Volume 111, 1990 2818
were traced and identified are shown in Fig. 3, B and C, in top and side views, respectively. All of the chromosomes were identified (X, Y, 2, 3 and 4) and each is presented using a different color. Centromeres and telomeres are marked by closed and open circles, respectively. To aid in the examina- tion of chromosome organization, the modeled paths can be used as a guide to computationally dissect the chromosomes from within the prophase nucleus (Fig. 3 D) and to then reconstruct the nucleus with each chromosome appropri- ately colored (Fig. 3 E, compare with Fig. 3 A). Note spe- cifically that the configuration of the third chromosomes, ob- scured in the projected view by the remaining chromosomes, can be clearly seen in the dissected view. These capabilities of modelling greatly facilitated the interpretations described in the next section.
Spatial Arrangement of Chromosomes in Prophase Nuclei
Chromosome paths were traced for 13 prophase nuclei. These nuclei shared several common features. The nucleus presented in Fig. 3 represents a typical example of late prophase nuclei. Two homologous sets of chromosomes can be clearly seen, indicating that homologous chromosomes are not synapsed (Fig. 3, B and D). Centromeres were found to cluster along a line as indicated by arrow heads in Fig. 3 B. Based on observations from the living data (see Fig. 4 A below), this line forms what will later become the axis of metaphase plate. Examined from the top, the arrangement of chromosomes seems to be roughly spherical in shape (Fig. 3 B). However, when examined in a side view from the direction of the centromere line-up, the very early stage of chromosome congression in the top portion of nucleus can be seen as an indentation (shown by arrows in Fig. 3 C).
By using the side view of the model (Fig. 3 C), it can be clearly seen that the centromeres are located in the top half of the nucleus near the embryos surface (top of the figure), the telomeres in the bottom half of the nucleus, and that the chromosome arms are oriented approximately perpendicular to the embryo surface. This polarized centromere-telomere orientation of autosomal as well as sex chromosomes per- pendicular to the embryo surface was observed in all the prophase nuclei examined.
It is also clear from the data (Fig. 3, B-D) that telomeres of homologous chromosomes are closely associated at the bottom of the nucleus (indicated by asterisk in Fig. 3 D). In this nucleus, all four telomeres of the third chromosomes are near each other, with two of them touching each other; the telomeres of one arm of the second chromosomes are also associated. Association of telomeres was commonly ob- served in prophase nuclei, often making it difficult to detect the precise ends of individual chromosomes.
The total length of the prophase chromosomes contained within a nucleus ranged from 64 to 78/~m (average 70 + 6/zm for 13 examples) as expected for two separate sets of chromosomes (Holmquist, 1975; Halfer, 1981; Pimpinelli et al., 1976). This provides a further indication that homolo- gous chromosomes are not synapsed.
Prometaphase Chromosome Congression Takes Place in a Polarized Fashion Starting at the Top of the Nucleus To examine how prophase chromosomes change their three-
dimensional arrangement as they approach metaphase, we followed chromosomes in the living state. Chromosomes in living Drosophila embryos were visualized by microinjec- tion of fluorescently labeled histones that are subsequently incorporated into newly replicated chromatin (Minden et al., 1989; Hiraoka et al., 1989). Owing to temporal con- straints caused by the very rapid mitotic cycle, optical sec- tion data were taken on the CCD at five focal planes span- ning the nucleus with a 1-#m focus step every 5 s. Such three-dimensional data sets were collected as a function of time to make a time-lapse series of optical section data.
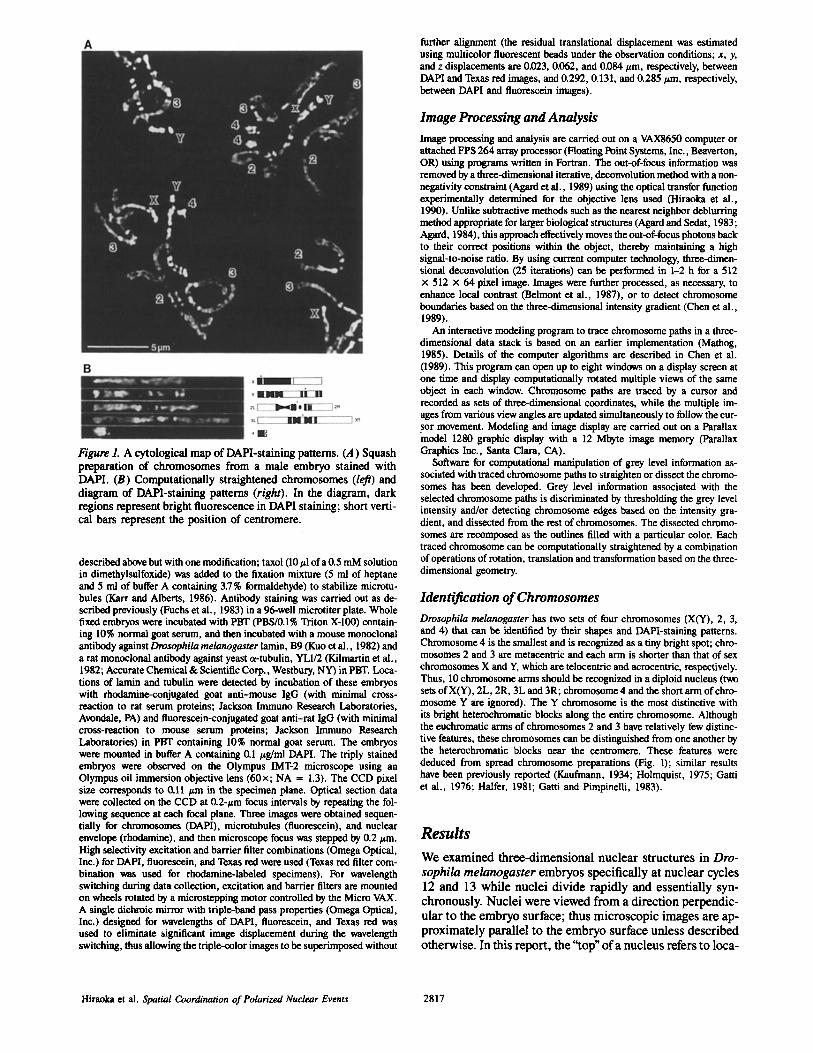
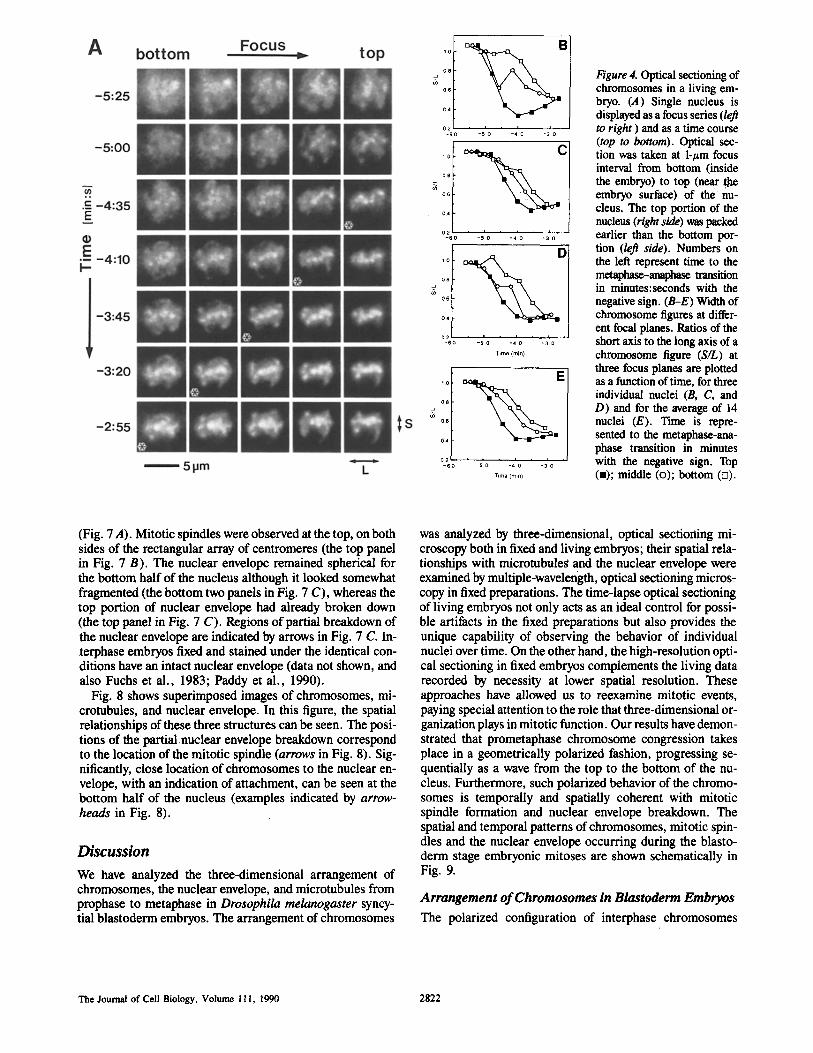
Fig. 4 A shows, for a single nucleus, the morphological changes occurring from prophase to metaphase displayed as a focus series (left to right represents the progression from the bottom to top of the nucleus) and as a time course (shown vertically; time to the metaphase/anaphase transition is rep- resented with the negative sign). Based on this data, forma- tion of the metaphase plate (visualized as a rectangular shape) can be seen to initiate at the top of the nucleus, and to progress from top to bottom by the passage through the nucleus of a smooth wave of chromosome congression (indi- cated by asterisks in Fig. 4 A).
This process of chromosome congression was quantified by measuring the ellipticity of chromosome figures at differ- ent focal planes as a function of time. The width measured in the short axis was normalized to the length along the long axis, where the long axis (L) was defined by the direction of metaphase plate and the short axis (S) was defined to be per- pendicular to the long axis (see Fig. 4 A). This ratio of the short axis to the long axis (S/L) was measured at three focal planes, each separated by 2 #m. The ratio is 1 for the spheri- cal morphology occurring in prophase and decreases toward metaphase. The ratio was averaged over 14 nuclei and plot- ted for each focal plane as a function of time (Fig. 4 E), to- gether with examples for three individual nuclei (Fig. 4, B-D). This shows that the width of chromosome figures decreases earlier at the top of the nucleus than at bottom. This differential behavior of chromosome congression is not a result of the time-lapse interval, as the 5-s delay per section was taken into consideration in the plotting.
By using the averaged data shown in Fig. 4 E the speed of the wave of congression can be estimated. It takes the wave 2 min to travel the 4 #m from the top to the bottom of the nucleus or 2 #m/min. Note that at this developmental stage the duration of the mitotic cycle is 22 min. Once the wave reaches the bottom of the nucleus, formation of the metaphase plate is complete. Chromosomes then remain on the metaphase plate for an additional 3 min before separating in anaphase. During this period, chromosomes are making elastic motions, or swaying, inside the metaphase plate.
The Polarized Arrangement of Chromosomes Is Maintained During the Process of Metaphase Plate Formation
To analyze the detailed arrangement of chromosomes from prophase to metaphase, fixed preparations were examined. The same overall three-dimensional nuclear morphology ob- served in living embryos was also seen in fixed embryos. Fig. 5 shows a portion of a fixed embryo, displayed as a focus se- ries. By comparison with the living preparation shown in Fig. 4 A, it can be seen that a series of nuclei of gradually
Hiraoka et al. Spatial Coordination of Polarized Nuclear Events 2819
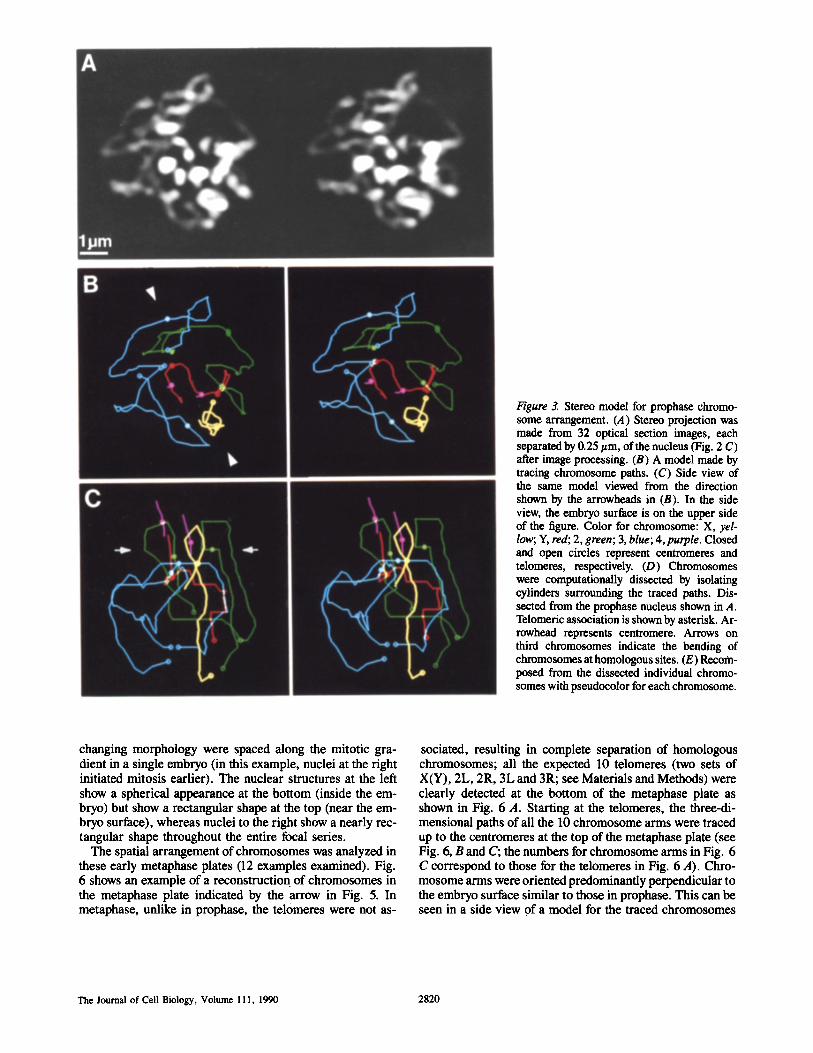
Figure 3. Stereo model for prophase chromo- some arrangement. (A) Stereo projection was made from 32 optical section images, each separated by 0.25 #m, of the nucleus (Fig. 2 C) after image processing. (B) A model made by tracing chromosome paths. (C) Side view of the same model viewed from the direction shown by the arrowheads in (B). In the side view, the embryo surface is on the upper side of the figure. Color for chromosome: X, yel- low; Y, red; 2, green; 3, blue; 4,purple. Closed and open circles represent centromeres and telomeres, respectively. (D) Chromosomes were computationally dissected by isolating cylinders surrounding the traced paths. Dis- sected from the prophase nucleus shown in A. Telomeric association is shown by asterisk. Ar- rowhead represents centromere. Arrows on third chromosomes indicate the bending of chromosomes at homologous sites. (E) Recom- posed from the dissected individual chromo- somes with pseudocolor for each chromosome.
changing morphology were spaced along the mitotic gra- dient in a single embryo (in this example, nuclei at the right initiated mitosis earlier). The nuclear structures at the left show a spherical appearance at the bottom (inside the em- bryo) but show a rectangular shape at the top (near the em- bryo surface), whereas nuclei to the right show a nearly rec- tangular shape throughout the entire focal series.
The spatial arrangement of chromosomes was analyzed in these early metaphase plates (12 examples examined). Fig. 6 shows an example of a reconstruction of chromosomes in the metaphase plate indicated by the arrow in Fig. 5. In metaphase, unlike in prophase, the telomeres were not as-
sociated, resulting in complete separation of homologous chromosomes; all the expected 10 telomeres (two sets of X(Y), 2L, 2R, 3L and 3R; see Materials and Methods) were clearly detected at the bottom of the metaphase plate as shown in Fig. 6 A. Starting at the telomeres, the three-di- mensional paths of all the 10 chromosome arms were traced up to the centromeres at the top of the metaphase plate (see Fig. 6, B and C; the numbers for chromosome arms in Fig. 6 C correspond to those for the telomeres in Fig. 6 A). Chro- mosome arms were oriented predominantly perpendicular to the embryo surface similar to those in prophase. This can be seen in a side view of a model for the traced chromosomes
The Journal of Cell Biology, Volume 111, 1990 2820
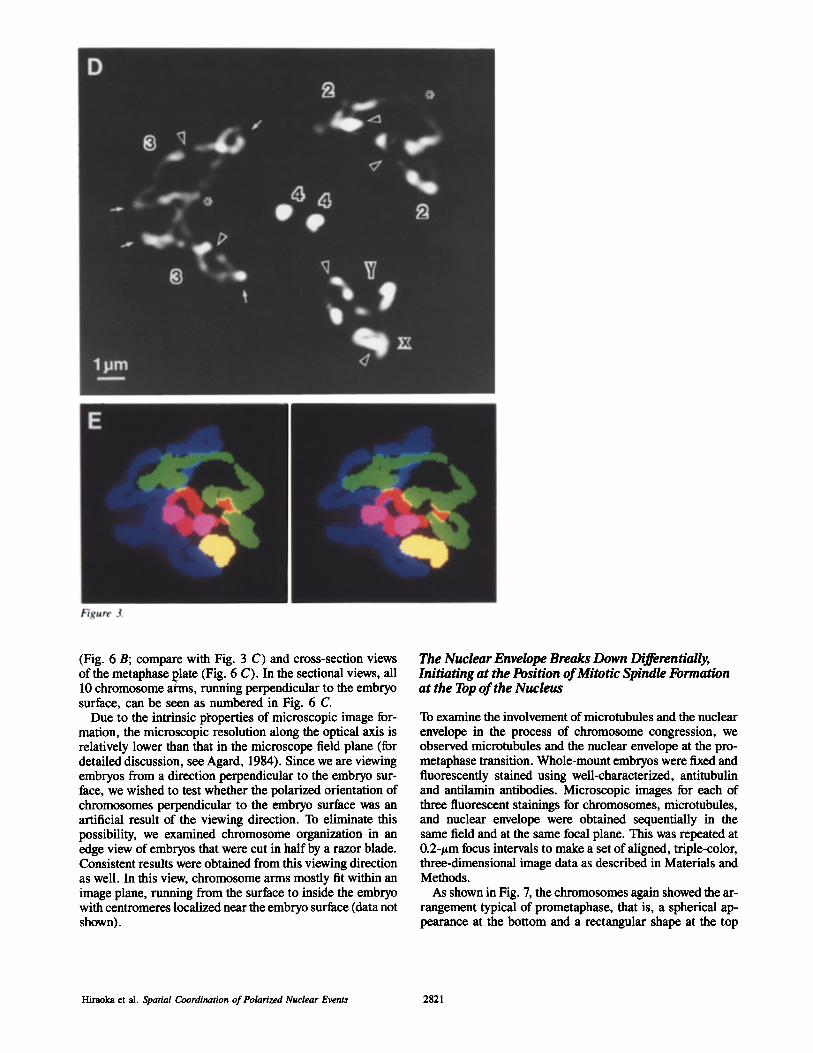
(Fig. 6 B; compare with Fig. 3 C) and cross-secrion views of the metaphase l~late (Fig. 6 C). In the sectional views, all 10 chromosome arms, running perpendicular to the embryo surface, can be seen as numbered in Fig. 6 C
Due to the intrinsic properties of microscopic image for- marion, the microscopic resolution along the optical axis is relatively lower than that in the microscope field plane (for detailed discussion, see Agard, 1984). Since we are viewing embryos from a direction perpendicular to the embryo sur- face, we wished to test whether the polarized orientation of chromosomes perpendicular to the embryo surface was an artificial result of the viewing direction. To eliminate this possibility, we examined chromosome organization in an edge view of embryos that were cut in half by a razor blade. Consistent results were obtained from this viewing direction as well. In this view, chromosome arms mostly fit within an image plane, running from the surface to inside the embryo with centromeres localized near the embryo surface (data not shown).
The Nuclear Envelope Breaks Down Differentially, Initiating at the Position of Mitotic Spindle Formation at the Top of the Nucleus
To examine the involvement of microtubules and the nuclear envelope in the process of chromosome congression, we observed microtubules and the nuclear envelope at the pro- metaphase transition. Whole-mount embryos were fixed and fluorescently stained using well-characterized, antitubulin and antilamin antibodies. Microscopic images for each of three fluorescent stainings for chromosomes, microtubules, and nuclear envelope were obtained sequentially in the same field and at the same focal plane. This was repeated at 0.2-#m focus intervals to make a set of aligned, triple-color, three-dimensional image data as described in Materials and Methods.
As shown in Fig. 7, the chromosomes again showed the ar- rangement typical of prometaphase, that is, a spherical ap- pearance at the bottom and a rectangular shape at the top
Hiraoka et al. Spatial Coordination of Polarized Nuclear Events 2821
oil, I o a
o 6
0 a
0 2 - 6 0 - 5 0 - 4 O - 3 0
o e
o 6
o 4
. . , ~ . o 2 i - 60 - 50 - 40 - 3 0 ,oI ol
O 8
O 6
0 4
0 2 - 60 - 50 - 40 - 30
T ime(min)
O 8
0 6
0 1
0 ~ L
- 60 - 50 - 40 - 30
Tlmalm~n)
Figure 4. Optical sectioning of chromosomes in a living em- bryo. (,4) Single nucleus is displayed as a focus series (left to right ) and as a time course (top to bottom). Optical sec- tion was taken at 1-#m focus interval from bottom (inside the embryo) to top (near ghe embryo surface) of the nu- cleus. The top portion of the nucleus (right side) was packed earlier than the bottom por- tion (left side). Numbers on the left represent time to the mctaphase-anaphase transition in minutes:seconds with the negative sign. (B-E) Width of chromosome figures at differ- ent focal planes. Ratios of the short axis to the long axis of a chromosome figure (S/L) at three focus planes are plotted as a function of time, for three individual nuclei (B, C, and D) and for the average of 14 nuclei (E). Time is repre- sented to the metaphase-ana- phase transition in minutes with the negative sign. Top (-); middle (o); bottom (o).
(Fig. 7 A). Mitotic spindles were observed at the top, on both sides of the rectangular array of centromeres (the top panel in Fig. 7 B). The nuclear envelope remained spherical for the bottom half of the nucleus although it looked somewhat fragmented (the bottom two panels in Fig. 7 C), whereas the top portion of nuclear envelope had already broken down (the top panel in Fig. 7 C). Regions of partial breakdown of the nuclear envelope are indicated by arrows in Fig. 7 C. In- ~terphase embryos fixed and stained under the identical con- ditions have an intact nuclear envelope (data not shown, and also Fuchs et al., 1983; Paddy et al., 1990).
Fig. 8 shows superimposed images of chromosomes, mi- crotubules, and nuclear envelope. In this figure, the spatial relationships of these three structures can be seen. The posi- tions of the partial nuclear envelope breakdown correspond to the location of the mitotic spindle (arrows in Fig. 8). Sig- nificantly, close location of chromosomes to the nuclear en- velope, with an indication of attachment, can be seen at the bottom half of the nucleus (examples indicated by arrow- heads in Fig. 8).
Discussion
We have analyzed the three-dimensional arrangement of chromosomes, the nuclear envelope, and microtubules from prophase to metaphase in Drosophila melanogaster syncy- tial blastoderm embryos. The arrangement of chromosomes
was analyzed by three-dimensional, optical sectioning mi- croscopy both in fixed and living embryos; their spatial rela- tionships with microtubules and the nuclear envelope were examined by multiple-wavelength, optical sectioning micros: copy in fixed preparations. The time-lapse optical sectioning of living embryos not only acts as an ideal control for possi- ble artifacts in the fixed preparations but also provides the unique capability of observing the behavior of individual nuclei over time. On the other hand, the high-resolution opti- cal sectioning in fixed embryos complements the living data recorded by necessity at lower spatial resolution. These approaches have allowed us to reexamine mitotic events, paying special attention to the role that three-dimensional or- ganization plays in mitotic function. Our results have demon- strated that prometaphase chromosome congression takes place in a geometrically polarized fashion, progressing se- quentially as a wave from the top to the bottom of the nu- cleus. Furthermore, such polarized behavior of the chromo- somes is temporally and spatially coherent with mitotic spindle formation and nuclear envelope breakdown. The spatial and temporal patterns of chromosomes, mitotic spin- dles and the nuclear envelope occurring during the blasto- derm stage embryonic mitoses are shown schematically in Fig. 9.
Arrangement o f Chromosomes in Blastoderm Embryos
The polarized configuration of interphase chromosomes
The Journal of Cell Biology, Volume 111, 1990 2822
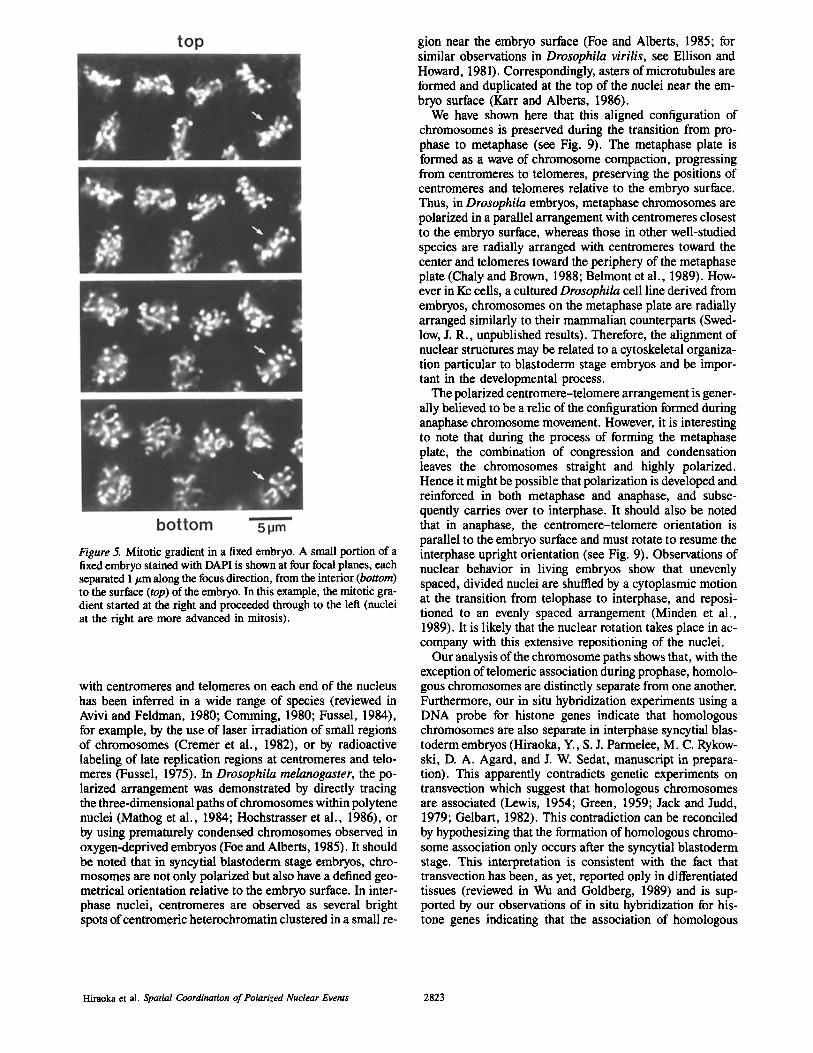
Figure 5. Mitotic gradient in a fixed embryo. A small portion of a fixed embryo stained with DAPI is shown at four focal planes, each separated 1 #m along the focus direction, from the interior (bottom) to the surface (top) of the embryo. In this example, the mitotic gra- dient started at the right and proceeded through to the left (nuclei at the right are more advanced in mitosis).
with centromeres and telomeres on each end of the nucleus has been inferred in a wide range of species (reviewed in Avivi and Feldman, 1980; Comming, 1980; Fussel, 1984), for example, by the use of laser irradiation of small regions of chromosomes (Cremer et al., 1982), or by radioactive labeling of late replication regions at centromeres and telo- meres (Fussel, 1975). In Drosophila melanogaster, the po- larized arrangement was demonstrated by directly tracing the three-dimensional paths of chromosomes within polytene nuclei (Mathog et al., 1984; Hochstrasser et al., 1986), or by using prematurely condensed chromosomes observed in oxygen-deprived embryos (Foe and Alberts, 1985). It should be noted that in syncytial blastoderm stage embryos, chro- mosomes are not only polarized but also have a defined geo- metrical orientation relative to the embryo surface. In inter- phase nuclei, centromeres are observed as several bright spots of centromeric heterochromatin clustered in a small re-
gion near the embryo surface (Foe and Alberts, 1985; for similar observations in Drosophila virilis, see Ellison and Howard, 198 I). Correspondingly, asters of microtubules are formed and duplicated at the top of the nuclei near the em- bryo surface (Karr and Alberts, 1986).
We have shown here that this aligned configuration of chromosomes is preserved during the transition from pro- phase to metaphase (see Fig. 9). The metaphase plate is formed as a wave of chromosome compaction, progressing from centromeres to telomeres, preserving the positions of centromeres and telomeres relative to the embryo surface. Thus, in Drosophila embryos, metaphase chromosomes are polarized in a parallel arrangement with centromeres closest to the embryo surface, whereas those in other well-studied species are radially arranged with centromeres toward the center and telomeres toward the periphery of the metaphase plate (Chaly and Brown, 1988; Belmont et al., 1989). How- ever in Kc cells, a cultured Drosophila cell line derived from embryos, chromosomes on the metaphase plate are radially arranged similarly to their mammalian counterparts (Swed- low, J. R., unpublished results). Therefore, the alignment of nuclear structures may be related to a cytoskeletal organiza- tion particular to blastoderm stage embryos and be impor- tant in the developmental process.
The polarized centromere-telomere arrangement is gener- ally believed to be a relic of the configuration formed during anaphase chromosome movement. However, it is interesting to note that during the process of forming the metaphase plate, the combination of congression and condensation leaves the chromosomes straight and highly polarized. Hence it might be possible that polarization is developed and reinforced in both metaphase and anaphase, and subse- quently carries over to interphase. It should also be noted that in anaphase, the centromere-telomere orientation is parallel to the embryo surface and must rotate to resume the interphase upright orientation (see Fig. 9). Observations of nuclear behavior in living embryos show that unevenly spaced, divided nuclei are shuffled by a cytoplasmic motion at the transition from telophase to interphase, and reposi- tioned to an evenly spaced arrangement (Minden et al., 1989). It is likely that the nuclear rotation takes place in ac- company with this extensive repositioning of the nuclei.
Our analysis of the chromosome paths shows that, with the exception of telomeric association during prophase, homolo- gous chromosomes are distinctly separate from one another. Furthermore, our in situ hybridization experiments using a DNA probe for histone genes indicate that homologous chromosomes are also separate in interphase syncytial blas- toderm embryos (Hiraoka, Y., S. J. Parmelee, M. C. Rykow- ski, D. A. Agard, and J. W. Sedat, manuscript in prepara- tion). This apparently contradicts genetic experiments on transvection which suggest that homologous chromosomes are associated (Lewis, 1954; Green, 1959; Jack and Judd, 1979; Gelbart, 1982). This contradiction can be reconciled by hypothesizing that the formation of homologous chromo- some association only occurs after the syncytial blastoderm stage. This interpretation is consistent with the fact that transvection has been, as yet, reported only in differentiated tissues (reviewed in Wu and Goldberg, 1989) and is sup- ported by our observations of in situ hybridization for his- tone genes indicating that the association of homologous
Hiraoka ct al. Spatial Coordination of Polarized Nuclear Events 2823
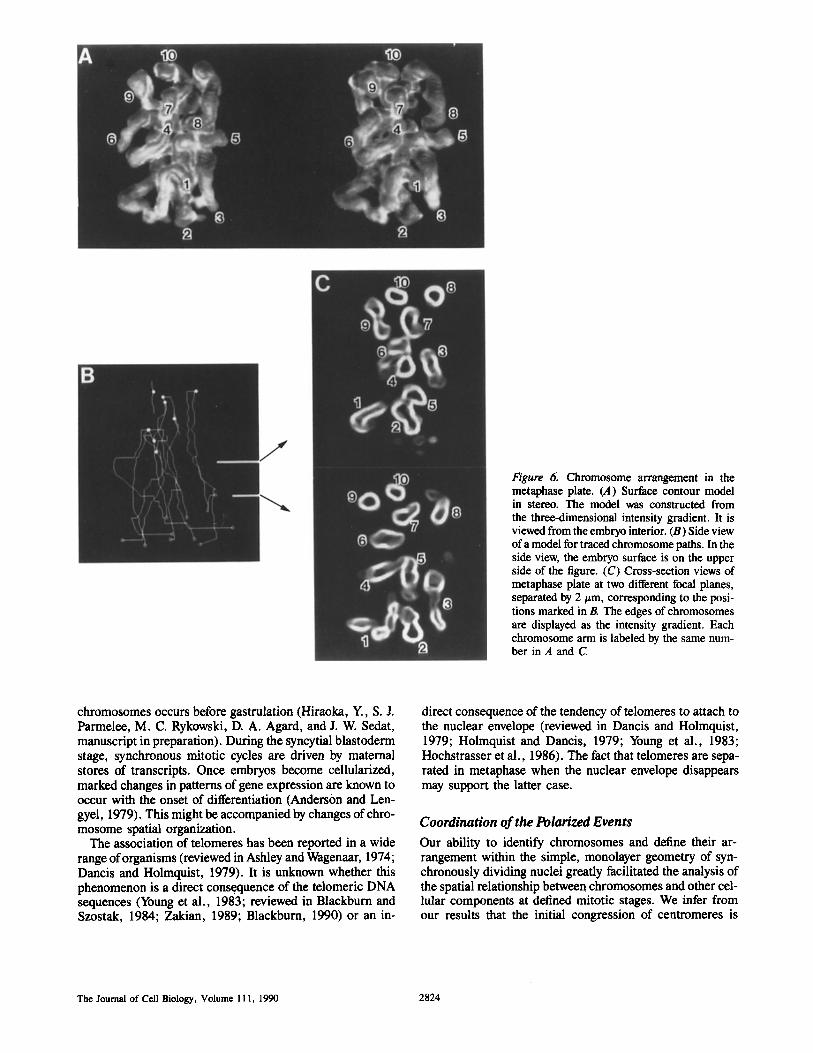
Figure 6. Chromosome arrangement in the metaphase plate. (A) Surface contour model in stereo. The model was constructed from the three-dimensional intensity gradient. It is viewed from the embryo interior. (B) Side view of a model for traced chromosome paths. In the side view, the embryo surface is on the upper side of the figure. (C) Cross-section views of metaphase plate at two different focal planes, separated by 2/xm, corresponding to the posi- tions marked in R The edges of chromosomes are displayed as the intensity gradient. Each chromosome arm is labeled by the same num- ber in A and C.
chromosomes occurs before gastrulation (Hiraoka, Y., S. J. Parmelee, M. C. Rykowski, D. A. Agard, and J. W. Sedat, manuscript in preparation). During the syncytial blastoderm stage, synchronous mitotic cycles are driven by maternal stores of transcripts. Once embryos become cellularized, marked changes in patterns of gene expression are known to occur with the onset of differentiation (Anderson and Len- gyel; 1979). This might be accompanied by changes of chro- mosome spatial organization.
The association of telomeres has been reported in a wide range of organisms (reviewed in Ashley and Wagenaar, 1974; Dancis and Holmquist, 1979). It is unknown whether this phenomenon is a direct consequence of the telomeric DNA sequences (Young et al., 1983; reviewed in Blackburn and Szostak, 1984; Zakian, 1989; Blackburn, 1990) or an in-
direct consequence of the tendency of telomeres to attach to the nuclear envelope (reviewed in Dancis and Holmquist, 1979; Holmquist and Dancis, 1979; Young et al., 1983; Hochstrasser et al., 1986). The fact that telomeres are sepa- rated in metaphase when the nuclear envelope disappears may support the latter case.
Coordination of the Polarized Events
Our ability to identify chromosomes and define their ar- rangement within the simple, monolayer geometry of syn- chronously dividing nuclei greatly facilitated the analysis of the spatial relationship between chromosomes and other cel- lular components at defined mitotic stages. We infer from our results that the initial congression of centromeres is
The Journal of Cell Biology, Volume 11 l, 1990 2824
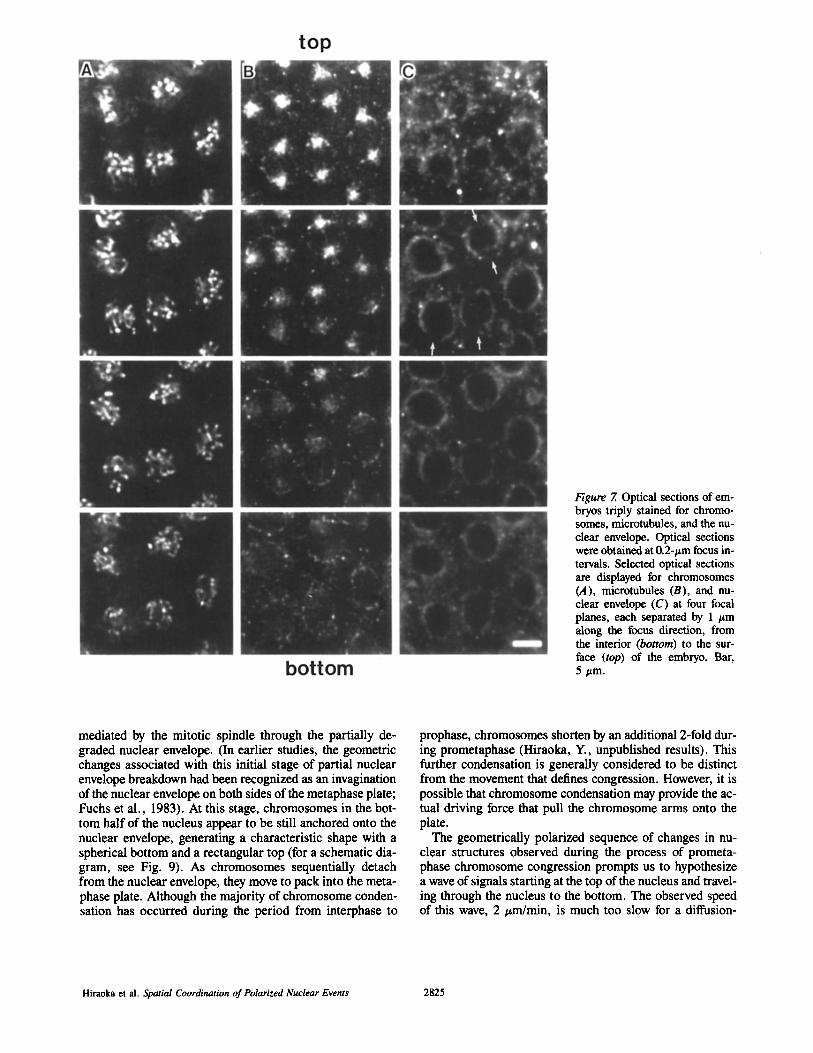
Figure 7. Optical sections of em- bryos triply stained for chromo- somes, microtubules, and the nu- clear envelope. Optical sections were obtained at 0.2-#m focus in- tervals. Selected optical sections are displayed for chromosomes (A), microtubules (B), and nu- clear envelope (C) at four focal planes, each separated by 1 #m along the focus direction, from the interior (bottom) to the sur- face (top) of the embryo. Bar, 5 #m.
mediated by the mitotic spindle through the partially de- graded nuclear envelope. (In earlier studies, the geometric changes associated with this initial stage of partial nuclear envelope breakdown had been recognized as an invagination of the nuclear envelope on both sides of the metaphase plate; Fuchs et al., 1983). At this stage, chromosomes in the bot- tom half of the nucleus appear to be still anchored onto the nuclear envelope, generating a characteristic shape with a spherical bottom and a rectangular top (for a schematic dia- gram, see Fig. 9). As chromosomes sequentially detach from the nuclear envelope, they move to pack into the meta- phase plate. Although the majority of chromosome conden- sation has occurred during the period from interphase to
prophase, chromosomes shorten by an additional 2-fold dur- ing prometaphase (Hiraoka, Y., unpublished results). This further condensation is generally considered to be distinct from the movement that defines congression. However, it is possible that chromosome condensation may provide the ac- tual driving force that pull the chromosome arms onto the plate.
The geometrically polarized sequence of changes in nu- clear structures observed during the process of prometa- phase chromosome congression prompts us to hypothesize a wave of signals starting at the top of the nucleus and travel- ing through the nucleus to the bottom. The observed speed of this wave, 2 t~m/min, is much too slow for a diffusion-
Hiraoka et al. Spatial Coordination of Polarized Nuclear Events 2825
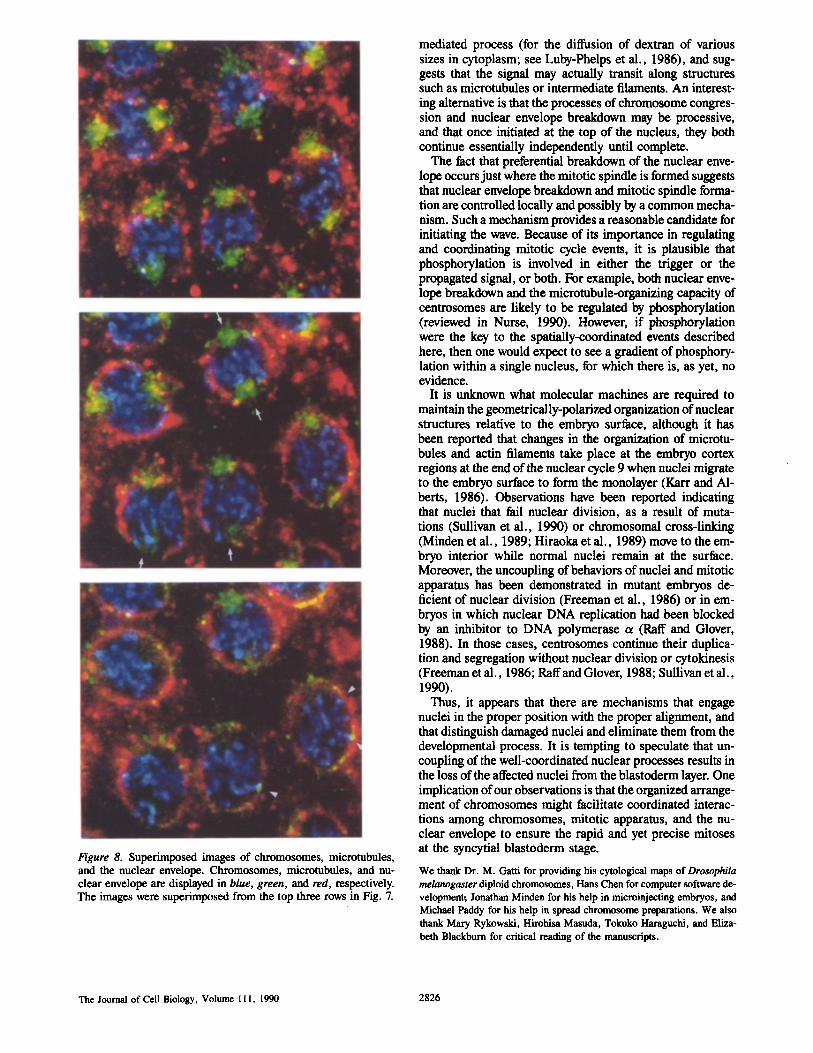
Figure 8. Superimposed images of chromosomes, microtubules, and the nuclear envelope. Chromosomes, microtubules, and nu- clear envelope are displayed in blue, green, and red, respectively. The images were superimposed from the top three rows in Fig. 7.
mediated process (for the diffusion of dextran of various sizes in cytoplasm; see Luby-Phelps et al., 1986), and sug- gests that the signal may actually transit along structures such as microtubules or intermediate filaments. An interest- ing alternative is that the processes of chromosome congres- sion and nuclear envelope breakdown may be processive, and that once initiated at the top of the nucleus, they both continue essentially independently until complete.
The fact that preferential breakdown of the nuclear enve- lope occurs just where the mitotic spindle is formed suggests that nuclear envelope breakdown and mitotic spindle forma- tion are controlled locally and possibly by a common mecha- nism. Such a mechanism provides a reasonable candidate for initiating the wave. Because of its importance in regulating and coordinating mitotic cycle events, it is plausible that phosphorylation is involved in either the trigger or the propagated signal, or both. For example, both nuclear enve- lope breakdown and the microtubule-organizing capacity of centrosomes are likely to be regulated by phosphorylation (reviewed in Nurse, 1990). However, if phosphorylation were the key to the spatially-coordinated events described here, then one would expect to see a gradient of phosphory- lation within a single nucleus, for which there is, as yet, no evidence.
It is unknown what molecular machines are required to maintain the geometrically-polarized organization of nuclear structures relative to the embryo surface, although it has been reported that changes in the organization of microtu- bules and actin filaments take place at the embryo cortex regions at the end of the nuclear cycle 9 when nuclei migrate to the embryo surface to form the monolayer (Karr and AI- berts, 1986). Observations have been reported indicating that nuclei that fail nuclear division, as a result of muta- tions (Sullivan et al., 1990) or chromosomal cross-linking (Minden et al., 1989; I-Iiraoka et al., 1989) move to the em- bryo interior while normal nuclei remain at the surface. Moreover, the uncoupling of behaviors of nuclei and mitotic apparatus has been demonstrated in mutant embryos de- ficient of nuclear division (Freeman et al., 1986) or in em- bryos in which nuclear DNA replication had been blocked by an inhibitor to DNA polymerase ot (Raft and Glover, 1988). In those cases, centrosomes continue their duplica- tion and segregation without nuclear division or cytokinesis (Freeman et al., 1986; Raffand Glover, 1988; Sullivan et al., 1990).
Thus, it appears that there are mechanisms that engage nuclei in the proper position with the proper alignment, and that distinguish damaged nuclei and eliminate them from the developmental process. It is tempting to speculate that un- coupling of the well-coordinated nuclear processes results in the loss of the affected nuclei from the blastoderm layer. One implication of our observations is that the organized arrange- ment of chromosomes might facilitate coordinated interac- tions among chromosomes, mitotic apparatus, and the nu- clear envelope to ensure the rapid and yet precise mitoses at the syncytial blastoderm stage.
We thank Dr. M. Gatti for providing his cytological maps of Drosophila melanogaster diploid chromosomes, Hans Chen for computer software de- velopment~ Jonathan Minden for his help in mieroinjecting embryos, and Michael Paddy for his help in spread chromosome preparations. We also thank Mary Rykowski, Hirohisa Masuda, Toknko Haraguchi, and Eliza- beth Blackburn for critical reading of the manuscripts.
The Journal of Cell Biology, Volume 111, 1990 2826

Embryo Surface f Cantromeras
1 Telomares
Intarphase Prophaaa Metaphase Anaphase Interphase
Figure 9. Spatial arrangement of embryonic ch romosomes in the mitot ic cycle. Chromo- some arrangement during the mitot ic cycle is shown relative to embryo surface. F rom in- terphase to metaphase , cen- t romeres are situated at one side of the nucleus near the embryo surface and telomeres at the other side. Metaphase plate is formed as a wave f rom the top to the bo t tom side. During the process of ana- phase ch romosome separa- tion, ch romosome arms are oriented parallel to the em- bryo surface and centromeres converge into a small region as they are pulled by the mi- totic spindles. By interphase, chromosomes rotate to recover
the upright cen t romere - te lomere orientation. Based on analyses of mitosis in living embryos, the durations of prometaphase , metaphase, and anaphase are '~2, 3, and 1.7 min, respectively, while the total duration o f mitot ic cycle is 22 min at 23°C in the 13th nuclear cycle (similar values are reported in Minden et al. , 1989). Lower panel is a schematic diagram of chromosomes (lightly shaded; darkly shaded circles, centromeres) , nuclear envelope (cross-hatched), and mitotic spindle (thick lines) during prometaphase. The top por t ion of the nuclear envelope breaks down first; mitot ic spindle is formed through the partially degraded nuclear envelope. Chromosomes are packed into the metaphase plate as a wave f rom the top to the bo t tom as the nuclear envelope sequentially breaks down.
We thank Dr. M. Gatti for providing his cytological maps of Drosophila melanogaster diploid chromosomes, Hans Chen for computer software de- velopment, Jonathan Minden for his help in microinjecting embryos, and Michael Paddy for his help in spread chromosome preparations. We also thank Mary Rykowski, Hirohisa Masuda, Tokuko Haraguchi, and Eliza- beth Blackburn for critical reading of the manuscripts.
This work was supported by grants from National Institute of Health to J. W. Sedat (GM-25101) and D. A. Agard (GM-31627). J. W. Sedat and D. A. Agard are Howard Hughes Investigators. D. A. Agard is also a Na- tional Science Foundation Presidential Young Investigator. Y. Hiraoka was supported by Damon Runyon-Walter Winchell Cancer Research Fund Fel- lowship DRG903.
Received for publication 16 July 1990 and in revised form 5 September 1990.
References
Agard, D. A. 1984. Optical sectioning microscopy: cellular architecture in three dimensions. Annu. Rev. Biophys. Bioeng. 13:191-219.
Agard, D. A., and J. W. Sedat. 1983. Three-dimensional architecture ofa poly- tene nucleus. Nature (Lond.). 302:676-681.
Agard, D. A., Y. Hiraoka, and J. W. Sedat. 1988. Three-dimensional light mi- croscopy of diploid Drosophila chromosomes. Cell Motil. Cytoskeleton. 10:18-27.
Agard, D. A., Y. Hiraoka, P. Shaw, and J. W. Sedat. 1989. Fluorescence mi- croscopy in three dimensions. Methods Cell Biol. 30:353-377.
Aikens, R. S., D. A. Agard, and J. W. Sedat. 1989. Solid-state imagers for microscopy. Methods Cell BioL 29:291-313.
Anderson, K. V., and J. A. Lengyel. 1979. Rates of synthesis of major classes of RNA in Drosophila embryos. Dev. Biol. 70:217-231.
Ashley, T., and E. B. Wagenaar. 1974. Telomeric association of gametic and somatic chromosomes in diploid and autotetraploid Ornithogahm virens. Can. J. Genet. Cytol. 16:61-76.
Avivi, L., and M. Feldman. 1980. Arrangement of chromosomes in the inter- phase nucleus of plants. Hum. Genet. 55:281-295.
Belmont, A. S., J. W. Sedat, and D. A. Agard. 1987. A three-dimensional ap- proach to mitotic chromosome structure: Evidence for a complex hierarchi- cal organization. J. Cell Biol. 105:77-92.
Belmont, A. S., M. B. Braunfeld, J. W. Sedat, and D. A. Agard. 1989. Large- scale chromatin structural domains within mitotic and interphase chromo- somes in vivo and in vitro. Chromosoma (Bed.). 98:129-143.
Blackburn, E. H. 1990. Telomeres: structure and synthesis. J. Biol. Chem.
265:5919-5921. Blackburn, E. H., and J. W. Szostak. 1984. The molecular structure of centro-
meres and telomeres. Annu. Rev. Biochem. 53:163-194. Brakenhoff, G. J., E. A. van Spronsen, H. T. van der Voort, and N. Narminga.
1989. Three-dimensional confocal microscopy. Methods Cell Biol. 30: 379-398.
Chaly, N., and D. L. Brown. 1988. The prometaphase configuration and chro- mosome order in early mitosis. J. Cell Sci. 91:325-335.
Chen, H., J. Sedat, and D. A. Agard. 1989. Manipulation, display, and analysis of three-dimensional biological images. In The Handbook of Biological Con- focal Microscopy. J. Pawley, editor. IMP Press, Madison, Wisconsin. 127-135.
Comming, D. E. 1980. Arrangement ofchromatin in the nucleus. Hum. Genet. 53:131-143.
Cremer, T., C. Cremer, H. Baumann, E.-K. Luedke, K. Sperling, V. Teuber, and C. Zorn. 1982. Rabl's model of the interphase chromosome arrangement tested in chinese hamster cells by premature chromosome condensation and laser-UV microbeam experiments. Hum. Genet. 60:46-56.
Dancis, B. M., and G. P. Holmquist. 1979. Telomere replication and fusion in eukaryotes. J. Theor. Biol. 78:211-224.
Ellison, J. R., and G. C. Howard. 1981. Non-random position of the AT rich DNA sequences in early embryos of Drosophila virilis. Chromosoma (Berl.). 83:555-561.
Fay, F. S., W. Carrington, and K. E. Fogarty. 1989. Three-dimensional molec- ular distribution in single cells analysed using the digital imaging micro- scope. J. Microsc. 153:133-149.
Foe, V. E., and B. M. Alberts. 1983. Studies of nuclear and cytoplasmic be- havior during the five mitotic cycles that precede gasturation in Drosophila embryogenesis. J. Cell Sci. 61:31-70.
Foe, V. E., and B. M. Alberts. 1985. Reversible chromosome condensation in- duced in Drosophila embryos by anoxia: visualization of interphase nuclear organization. J. Cell Biol. 100:1623-1636.
Freeman, M., C. Nusslein-Volhard, and D. M. Glover. 1986. The dissociation of nuclear and centrosomal division in gnu, a mutation causing giant nuclei in Drosophila. Cell. 46:457--468.
Fuchs, J.-P., H. Giloh, C.-H. Kuo, H. Saumweber, and J. W. Sedat. 1983. Nuclear structure: determination of the fate of the nuclear envelope in Drosophila during mitosis using monoclonal antibodies. J. Cell. Sci. 64: 331-349.
Fussel, C. P. 1975. The position ofinterphase chromosomes and late replicating DNA in centromere and telomere regions of Allium cepa L. Chromosoma (Berl.). 50:201-210.
Fussel, C. P. 1984. Interphase chromosome order: a proposal. Genetica (The Hague). 62:193-201.
Gatti, M., and S. PimpineUi. 1983. Cytological and genetic analysis of the Y chromosome of Drosophila melanogaster. I. Organization of the fertility fac- tors. Chromosoma (Berl.). 88:349-373.
Hiraoka et al. Spatial Coordination of Polarized Nuclear Events 2827
Gatti, M., S. PimpineUi, and G. Santini. 1976. Characterization of Drosophila heteroehromatin. I. Staining and decondensation with Hoechst 33258 and quinaerine. Chromosoma (Berl.). 57:351-375.
Gelbart, W. M. 1982. Synapsis-dependent allelic complementation at the de- eapentaplegic gene complex in Drosophila melanogaster. Proc. Natl. Acad. Sci. USA. 79:2636-2640.
Glover, D. M. 1989. Mitosis in Drosophila. jr Cell Sci. 92:137-146. Green, M. M. 1959. Spatial and functional properties of pseudoalleles at the
white loons in Drosophila melanogaster. Heredity. 13:303-315. Gurley, L. R., J. A. D'Anna, S. S. Barham, L. L. Deaven, and R. A. Tobey.
1978. Historic phosphorylation and chromatin structure during mitosis in Chinese hamster cells. Eur. J. Biochem. 84:1-15.
Halfer, C. 1981. lnterstain heteroehromatin polymorphisms in Drosophila me- lanogaster. Chromosoma (Berl. ). 84:195-206.
Heald, R., and F. McKeon. 1990. Mutations of phosphorylation sites in lamin A that prevent nuclear lamina disassembly in mitosis. Cell. 61:579-589.
Hiraoka, Y., J. W. Sedat, and D. A. Agard. 1987. The use of a charge-coupled device for quantitative optical microscopy of biological structures. Science (Wash. DC.). 238:36--41.
Hiranka, Y., J. S. Minden, J. R. Swedlow, J. W. Sedat, and D. A. Agard. 1989. Focal points for chromosome condensation and dacondensation from three-dimensional in vivo time-lapse microscopy. Nature (Lond.). 342: 293-296.
Hiraoka, Y., J. W. Sedat, and D. A. Agard. 1990. Determination of three- dimensional imaging properties of a light microscope system: Partial confo- cal behavior in epifluorescence microscopy. Biophys. J. 57:325-333.
Hochstrasser, M., D. Mathog, Y. Gruenhaum, H. Saumweber, and J. W. Sedat. 1986. Spatial organization of chromosomes in the salivary gland nuclei of Drosophila melanogaster. J. Cell Biol. 102:112-123.
Holmquist, G. 1975. Hoechst 33258 fluorescent staining of Drosophila chromo- somes. Chromosoma (Berl.). 49:333-356.
Holmquist, G. P., and B. Dancis. 1979. Telomere replication, kinetochore or- ganization, and satellite DNA evolution. Proc. Natl. Acad. Sci. USA. 76:4566-4570.
Jack, J. W., and B. H. Judd. 1979. Allelic pairing and gene regulation: a model for the zeste-white interaction in Drosophila melanogaster. Proc. Natl. Acad. Sci. USA. 76:1368-1372.
Karr, T. L., and B. M. Alberts. 1986. Organization of the cytoskeleton in early Drosophila embryos. J. Cell Biol. 102:1494-1509.
Kanfmann, B. P. 1934. Somatic mitoses of Drosophila melanogaster. J. Mor- phol. 56:125-155.
Kilmartin, J. V., B. Wright, and C. Milstein. 1982. Rat monoclonal antibodies derived by using a new nonsecreting rat cell line. J. Cell Biol. 93:576-582.
Kuo, C. H., H. Giloh, A. B. Blumenthal, and J. W. Sedat. 1982. A library of monoolonal antibodies to nuclear proteins from Drosophila melanogaster embryos. Exp. Cell Res. 142:141-154.
Lewis, E. B. 1954. The theory and application of a new method of detecting chromosomal rearrangements in Drosophila melanogaster. Am. Nat. 88: 225-239.
Luby-Phelps, K., D. L. Taylor, and F. Lanni. 1986. Probing the structure of cytoplasm. J. Cell Biol. 102:2015-2022.
Mathog, D. 1985. Light microscope based analysis of three-dimensional struc- ture: applications to the study of Drosophila salivary gland nuclei. II. AI-
gorithms for model analysis. J. Microsc. 137:253-273. Mathog, D., M. Hoohstrasser, Y. Grnenhaum, H. Saumweber, and J. W.
Sedat. 1984. Characteristic folding pattern of the polytene chromosomes in Drosophila salivary gland nuclei. Nature (Lond.). 308:414--421.
Matthews, H., and E. Bradbury. 1978. The role of histone H1 phosphorylation in the cell cycle: turbidity studies of HI-DNA interactions. Exp. Cell Res. 111:343-351.
Minden, J. S., D. A. Agard, J. W. Sedat, and B. M. Alberts. 1989. Direct cell linage analysis in Drosophila melanogaster by time-lapse, three-dimensional optical microscopy of living embryos. J. Cell Biol. 109:505-516.
Mitchinson, T. J., and J. W. Sedat. 1983. Localization of antigenic deter- minants in whole Drosophila embryos. Dev. Biol. 99:261-264.
Nurse, P. 1990. Universal control mechanism regulating onset of M-phase. Na- ture (Lond.). 344:503-508.
Oud, J. L., A. Mans, G. J. Brakenhoft, H. T. M. van der Voort, E. A. van Spronsen, and N. Nanninga. 1989. Three-dimensional chromosome ar- rangement of Crepis capillaris in mitotic prnphase and anaphase as studied by confooal scanning laser microscopy. J. Cell Sci. 92:329-339.
Paddy, M. R., A. S. Belmont, H. Saumweber, D. A. Agard, and J. W. Sedat. 1990. Interphase nuclear envelope lamins form a discontinuous network in interphase nuclei which interacts with only a fraction of the chromatin in the nuclear periphery. Cell. 62:89-106.
Peter, M., J. Nakagawa, M. Dorde, J. C. Labb~, and E. A. Nigg. 1990. In vitro disassembly of the nuclear lamina and M phase-specific phosphoryla- tion of lamins by cdc2 kinase. Cell. 61:591-602.
Pimpinelli, S., G. Santini, and M. Gatti. 1976. Characterization of Drosophila heterochromatin. II. C- and N-banding. Chromosoma (Berl.). 57:377-386.
Raft, J. W., and D. M. Glover. 1988. Nuclear and cytoplasmic mitotic cycles continue in Drosophila embryos in which DNA synthesis is inhibited with aphidicolin. J. Cell Biol. 107:2009-2019.
Rawlins, D. J., and P. J. Shaw. 1988. Three-dimensional organization of chro- mosomes of Crepis capillaris by optical tomography. J. Cell Sci. 91: 401-414.
Sullivan, W., J. S. Minden, and B. Alberts. 1990. daughterless-abo-like, a Drosophila maternal-effect mutation that exhibits abnormal centrosome separation during the late blastderm divisions. Development. In press.
Vandr6, D. D., and G. G. Borisy. 1985. The interphase-mitosis transformation of the microtubule network in mammalian cells. In Cell Motility: Mechanism and Regulation. H. Ishikawa, S. Hatano, H. Sato, editors. University of Tokyo Press, Japan. 389-401.
Ward, G. E., and M. W. Kirschner. 1990. Identification of cell cycle-regulated phosphorylation sites on nuclear lamin C. Cell. 61:561-577.
Wu, C. T., and M. L. Goldberg. 1989. The Drosophila zeste gene and transvec- tion. Trends Genetics. 5:189-194.
Young, B. S., A. Pession, K. L. Traverse, C. French, andM. L. Pardue. 1983. Telomere region in Drosophila share complex DNA sequences with pericen- tric heterochrnmatin. Cell. 34:85-94.
Zakian, V. A. 1989. Structure and function of telomeres. Annu. Rev. Genet. 23:579-604.
Zalokar, M., and I. Erk. 1976. Division and migration of nuclei during early embryogenesis of Drosophila melanogaster. J. Microsc. Biol. Cell. 25: 97-106.
The Journal of Cell Biology, Volume 111, 1990 2828