modern analogues from the southern urals provide insights into biodiversity change in the early...
TRANSCRIPT
ORIGINALARTICLE
Modern analogues from the SouthernUrals provide insights into biodiversitychange in the early Holocene forests ofCentral Europe
Milan Chytry1*, Jirı Danihelka1,2, Michal Horsak1, Martin Kocı1, Svatava
Kubesova1,3, Zdenka Lososova1,4, Zdenka Otypkova1, Lubomır Tichy1,
Vasiliy B. Martynenko5 and El’vira Z. Baisheva5
1Department of Botany and Zoology, Masaryk
University, Kotlarska 2, CZ-611 37 Brno,
Czech Republic, 2Institute of Botany, Academy
of Sciences of the Czech Republic, Porıcı 3a,
CZ-603 00 Brno, Czech Republic, 3Department
of Botany, Moravian Museum, Hviezdoslavova
29a, CZ-627 00 Brno, Czech Republic,4Department of Biology, Masaryk University,
Porıcı 7, CZ-603 00 Brno, Czech Republic,5Institute of Biology, Ufa Scientific Center,
Russian Academy of Sciences, prosp. Oktyabrya
69, RU-450054 Ufa, Bashkortostan, Russia
*Correspondence: Milan Chytry, Department of
Botany and Zoology, Masaryk University,
Kotlarska 2, CZ-611 37 Brno, Czech Republic.
E-mail: [email protected]
ABSTRACT
Aim The diversity changes that occurred in Central European forests during the
early Holocene can be better understood using ecological knowledge of modern
analogues of these forests, which occur in far Eastern Europe. Here we compare
the diversity of vascular plants, bryophytes and snails among different forest types
of the Southern Urals to provide insights into the palaeoecology of the vanished
Central European forests.
Location Southern Ural Mountains, Bashkortostan, Russia.
Methods We recorded all species of vascular plants, ground-dwelling bryophytes
and land snails, and measured biotic and abiotic variables, in 100-m2 plots located
in four forest types dominated by different trees: Pinus sylvestris–Larix sibirica,
Betula pendula–Populus tremula, Quercus robur and Acer platanoides–Tilia cordata–
Ulmus glabra. These types correspond to the chronosequence of forest
communities that occurred in Central Europe in the early Holocene.
Results The species richness of herb-layer plants was most affected by the
canopy-transmitted light. The former three forest types had open canopy and
were rich in species, whereas the Acer–Tilia–Ulmus forests were darker and poor
in species. The species richness of ground-dwelling bryophytes decreased from
coniferous to broad-leaved deciduous forests. In contrast, the highest species
richness of snails was in the Acer–Tilia–Ulmus forests owing to the higher calcium
content in the litter of these trees.
Main conclusions Based on the modern analogue of the Southern Ural forests,
we propose the hypothesis that the late-glacial open-canopy pine and larch forests
of Central European lowlands were rich in light-demanding species of vascular
plants, many of which were also typical of tall-grass steppes or mesic grasslands.
They also contained several species of ground-dwelling bryophytes. The spread of
birch, aspen and oak in the early Holocene reduced the local species richness of
ground-dwelling bryophytes but not of vascular plants. The subsequent spread
of elm, lime, maple and ash caused canopy closure, a retreat of the light-
demanding herbs and a decline in the local species richness of vascular plants.
Besides the increased shading by these tree species, their litter enriched soils in
calcium, and enhanced decomposition and nutrient cycling. This supported an
increase in the species richness of land snails.
Keywords
Bryophytes, broad-leaved trees, canopy shading, mixed oak forests, palaeo-
ecology, Russia, snails, species richness, vascular plants, vegetation change.
Journal of Biogeography (J. Biogeogr.) (2010) 37, 767–780
ª 2010 Blackwell Publishing Ltd www.blackwellpublishing.com/jbi 767doi:10.1111/j.1365-2699.2009.02256.x
INTRODUCTION
Palynological and macrofossil charcoal evidence suggests that
in the full- and late-glacial, lowland areas of eastern Central
Europe were covered by a forest-steppe with open woodlands
of coniferous (Larix decidua, Pinus sylvestris) and small-leaved
deciduous (Betula pendula, Populus tremula) trees (Willis &
van Andel, 2004; Birks & Willis, 2008; Kunes et al., 2008;
Svenning et al., 2008). Following the climatic amelioration of
the early Holocene, these woodlands expanded at the expense
of open steppe, and simultaneously, or with some time lag,
were gradually invaded by broad-leaved deciduous trees, such
as Quercus, Ulmus, Tilia, Acer and Fraxinus (Huntley & Birks,
1983; Lang, 1994; Berglund et al., 1996; Willis et al., 1997).
Tree assemblages that developed in Central Europe by the
mid-Holocene are traditionally termed ‘mixed oak forest’
(Eichenmischwald, Quercetum mixtum) in the palynological
literature (e.g. Firbas, 1949); however, the actual structure of
such forests is unclear, because the stable coexistence of
light-demanding oaks with the shading broad-leaved trees is
unlikely (Ellenberg, 1988; Vera, 2000; Svenning, 2002).
The transition from the late-glacial open woodlands to the
mid-Holocene mixed oak forests was a major environmental
change, which probably had a significant effect on biodiversity.
However, it is very difficult to reconstruct the change in diversity
of forest plant communities from fossil records. There are
reasonably good fossil pollen or macrofossil data on the diversity
of Central European trees during the Holocene, but data for
forest herbs are deficient, as a result of the impossibility of pollen
identification to the species level in some genera and families
(Beug, 2004), the absence of long-distance pollen dispersal in
some (mainly insect-pollinated) herb species, and the low level
of deposition and poor preservation of plant macrofossils at
mesic and dry forest sites. It is herbaceous plants rather than
trees, however, that constitute the main component of the
vascular plant diversity in Central European forests (Ellenberg,
1988). Environmental conditions in the forest herb layer can be
better indicated by taxa that provide a more complete fossil
record, such as snails (Lozek, 1964, 2000), but it is unclear how
historical changes in the diversity of snails related to plant
diversity and vegetation change.
Our understanding of palaeoecological processes in the early
Holocene forests of Central Europe may be improved by
studies of modern analogues of the mixed oak forests.
However, these forests retreated from Central Europe owing
to the mid- to late Holocene spread of beech (Fagus sylvatica)
and hornbeam (Carpinus betulus; Kuster, 1997; Magri, 2008).
Both of these trees develop dense canopies, which prevent the
establishment of oak seedlings (Ellenberg, 1988), and thus
outcompete oak and most other trees, unless the forest is
disturbed by logging or grazing (Vera, 2000). Therefore, the
modern analogues of the mixed oak forests must be sought
outside the geographical ranges of beech and hornbeam,
possibly in the east, where the current continental climate
resembles the early Holocene climate of Central Europe (Davis
et al., 2003).
Beech reaches its eastern distribution limit on the eastern
fringes of the Carpathians, and hornbeam in the area of the
middle Dniepr River in the Ukraine (Walter, 1974; Gribova
et al., 1980). For the purpose of this paper, we interpret the
eastern limits of Central Europe as being identical with the
eastern limits of these species. Forests between the Dniepr
River and the Southern Ural Mountains are formed of broad-
leaved tree species that are considered typical of the Central
European early to mid-Holocene mixed oak forests (Gribova
et al., 1980; Bohn & Neuhausl, 2000–2003): oak (Quercus
robur), maple (Acer platanoides), lime (Tilia cordata), elm
(Ulmus glabra, U. laevis) and ash (Fraxinus excelsior). Except
for ash, which has its eastern distribution limit on the Volga
River, all of these species reach the Southern Urals, and T.
cordata extends even to western Siberia (Gorchakovskii, 1968).
The foothills of the Southern Urals provide perhaps the best
modern analogue of the Central European early Holocene
forests, because here the broad-leaved deciduous forests of
European temperate distribution meet with the small-leaved
deciduous and light-coniferous forests of Siberian distribution.
The latter are called hemiboreal forests (Ermakov et al., 2000),
or subtaiga in the Russian literature (e.g. Sochava, 1979), and
are dominated by birch (Betula pendula), aspen (Populus
tremula), pine (Pinus sylvestris) and, in some places, also by
larch (Larix sibirica). As the hemiboreal forests can be
considered as analogues of the late-glacial and preboreal
forests of the Central European lowlands (Kunes et al., 2008),
the Southern Ural foothills provide an excellent opportunity to
study, side by side, the analogues of the two forest types of
which one replaced the other in Central European post-glacial
vegetation history.
The analogue between the modern forests of the Southern
Urals and the early Holocene forests of Central Europe is
supported not only by the nearly identical assemblages of
forest trees but also by the compositional similarity of snail
faunas (Horsak et al., 2010). Rich fossil data on the early
Holocene snail faunas of Central Europe (e.g. Lozek, 1993,
2000) show a combination of drought-adapted steppe species
[e.g. Chondrula tridens (Muller, 1774)], species of boreal
forests [e.g. Discus ruderatus (Ferussac, 1821)] and species of
scrub and ecotones [e.g. Fruticicola fruticum (Muller, 1774)].
Such a combination has no modern analogue in Central
Europe. In contrast, thermophilous forest species such as
Discus perspectivus (M. von Muhlfeld, 1816), Platyla polita
(Hartmann, 1840) and many clausiliid species were absent in
Central Europe in the early Holocene and appeared only in the
mid-Holocene. Modern snail assemblages found in the
Southern Ural forests are remarkably similar to the Central
European early Holocene fossil record in terms of species
composition, richness and broader realized niches of some
species (Horsak et al., 2010). We acknowledge that modern
analogues are never perfect, because palaeoenvironments that
are not analogous to any present situation were common
(Monserud et al., 1993; Williams & Jackson, 2007) and the
space-for-time-substitution method of ecological enquiry
involves some interpretation risks (Pickett, 1989). At the same
M. Chytry et al.
768 Journal of Biogeography 37, 767–780ª 2010 Blackwell Publishing Ltd
time, however, we believe that carefully interpreted analogues
can significantly contribute to the ecological understanding of
past environments.
In this paper we aim to provide new insights into the early
Holocene biodiversity change in Central European forests
through a comparative study of their modern analogues –
different forest types occurring on the Southern Ural foothills.
We focus on the diversity of vascular plants and bryophytes,
both of which are very important for forest ecosystem
functioning, but each of them utilizes a different niche. In
addition, we focus on snails, which are well preserved in the
fossil record, and, therefore, frequently used as indicators of
past environmental conditions (Lozek, 1964; Rousseau, 1990).
STUDY AREA
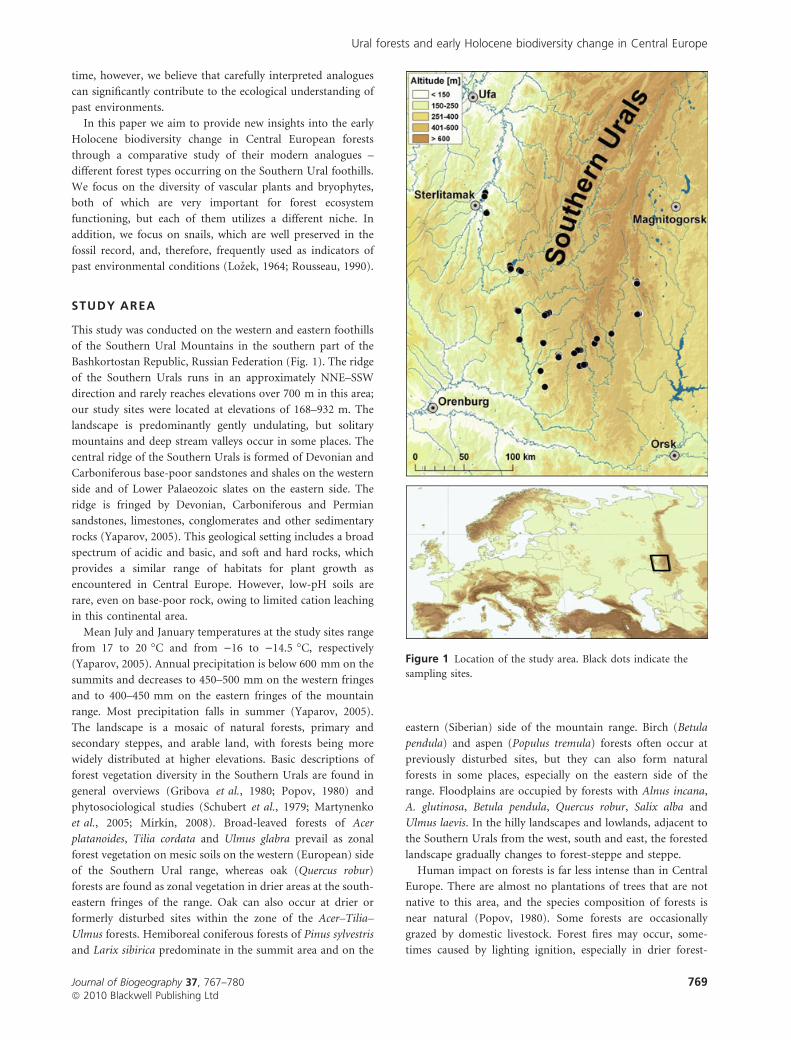
This study was conducted on the western and eastern foothills
of the Southern Ural Mountains in the southern part of the
Bashkortostan Republic, Russian Federation (Fig. 1). The ridge
of the Southern Urals runs in an approximately NNE–SSW
direction and rarely reaches elevations over 700 m in this area;
our study sites were located at elevations of 168–932 m. The
landscape is predominantly gently undulating, but solitary
mountains and deep stream valleys occur in some places. The
central ridge of the Southern Urals is formed of Devonian and
Carboniferous base-poor sandstones and shales on the western
side and of Lower Palaeozoic slates on the eastern side. The
ridge is fringed by Devonian, Carboniferous and Permian
sandstones, limestones, conglomerates and other sedimentary
rocks (Yaparov, 2005). This geological setting includes a broad
spectrum of acidic and basic, and soft and hard rocks, which
provides a similar range of habitats for plant growth as
encountered in Central Europe. However, low-pH soils are
rare, even on base-poor rock, owing to limited cation leaching
in this continental area.
Mean July and January temperatures at the study sites range
from 17 to 20 �C and from )16 to )14.5 �C, respectively
(Yaparov, 2005). Annual precipitation is below 600 mm on the
summits and decreases to 450–500 mm on the western fringes
and to 400–450 mm on the eastern fringes of the mountain
range. Most precipitation falls in summer (Yaparov, 2005).
The landscape is a mosaic of natural forests, primary and
secondary steppes, and arable land, with forests being more
widely distributed at higher elevations. Basic descriptions of
forest vegetation diversity in the Southern Urals are found in
general overviews (Gribova et al., 1980; Popov, 1980) and
phytosociological studies (Schubert et al., 1979; Martynenko
et al., 2005; Mirkin, 2008). Broad-leaved forests of Acer
platanoides, Tilia cordata and Ulmus glabra prevail as zonal
forest vegetation on mesic soils on the western (European) side
of the Southern Ural range, whereas oak (Quercus robur)
forests are found as zonal vegetation in drier areas at the south-
eastern fringes of the range. Oak can also occur at drier or
formerly disturbed sites within the zone of the Acer–Tilia–
Ulmus forests. Hemiboreal coniferous forests of Pinus sylvestris
and Larix sibirica predominate in the summit area and on the
eastern (Siberian) side of the mountain range. Birch (Betula
pendula) and aspen (Populus tremula) forests often occur at
previously disturbed sites, but they can also form natural
forests in some places, especially on the eastern side of the
range. Floodplains are occupied by forests with Alnus incana,
A. glutinosa, Betula pendula, Quercus robur, Salix alba and
Ulmus laevis. In the hilly landscapes and lowlands, adjacent to
the Southern Urals from the west, south and east, the forested
landscape gradually changes to forest-steppe and steppe.
Human impact on forests is far less intense than in Central
Europe. There are almost no plantations of trees that are not
native to this area, and the species composition of forests is
near natural (Popov, 1980). Some forests are occasionally
grazed by domestic livestock. Forest fires may occur, some-
times caused by lighting ignition, especially in drier forest-
Figure 1 Location of the study area. Black dots indicate the
sampling sites.
Ural forests and early Holocene biodiversity change in Central Europe
Journal of Biogeography 37, 767–780 769ª 2010 Blackwell Publishing Ltd
steppe areas. After logging or burning, forests either regenerate
spontaneously or are being replanted with the same tree species
as occurred at the site before. Spontaneous regeneration often
leads to an increased dominance of birch or aspen, which are
replaced by competitively superior broad-leaved or coniferous
trees after a few decades (Khairetdinov, 2004). At some dry
sites, post-fire succession is dominated by oak, which is better
adapted to drought stress than maple, lime or elm.
MATERIALS AND METHODS
In July 2007 we sampled natural forests at 78 sites, using square
plots of 100 m2 placed in homogeneous vegetation, avoiding
plantations and disturbed or ecotonal situations. Floodplain
forests were not considered in this study.
In each plot we recorded all species of vascular plants
(taxonomy and nomenclature according to Cherepanov, 1995)
and ground-dwelling bryophytes and lichens, and estimated
their individual covers and total percentage covers of particular
vegetation layers. As ground-dwelling lichens were very rare in
these forests, they were not included in the analyses. In 52 of 78
sampled plots, we harvested the above-ground herb-layer
biomass within four square subplots of 0.25 m2 by clipping the
vegetation 1 cm above the soil surface. Biomass from these
four subplots was merged, and then separated into herbaceous
plants, wood (of seedlings, saplings and low shrubs) and leaves
of woody plants; they were then dried, weighed and analysed
for contents of total nitrogen (N), phosphorus (P), potassium
(K) and calcium (Ca). N was measured by the Kjehldahl
method, P spectrophotometrically, K by atomic emission
spectrophotometry and Ca by atomic absorption spectropho-
tometry (Zbıral, 1995).
In 37 of these plots, we recorded species of land snails. These
plots were selected to represent a geographical and habitat
range similar to that of the full sample set of 78 plots. For 2 h,
one person searched for snails by eye in all the appropriate
microhabitats. In addition, approximately 3 L of litter, moss
polsters and topsoil were sampled for recording small ground-
dwelling species and were processed immediately in the field,
using the wet sieving method (Horsak, 2003).
In all plots, we recorded the following environmental
variables. (1) Altitude was measured with a Global Positioning
System (GPS) receiver Garmin 60CSx (Garmin International
Inc., Olathe, KS). (2) Slope inclination was measured with a
Clino Master clinometer (Silva Sweden AB, Sollentuna,
Sweden). (3–4) Soil depth and litter depth were measured
using a metal rod in four places within each plot and averaged;
depths greater than 30 cm were given the value of 30 cm. (5)
Litter cover was estimated in percentage by eye. (6–7) Soil pH
and electrical conductivity: soil samples were taken in four
places within each plot, at 1–2 cm and 5–15 cm depth,
respectively, in order to assess separately the topmost soil layer,
which is more influenced by litter decomposition and directly
affects snails, and lower soil layer, which contains maximum
root biomass of herbaceous plants. A 2:5 soil-distilled water
solution was prepared from mixed samples from each depth
and measured after 24 h by a Greisinger GPRT 1400 AN pH-
meter (Greisinger Electronic GmbH, Regenstauf, Germany)
and a CM113 conductivity meter (Snail Instruments, Beroun,
Czech Republic). (8–9) Topographical indices of radiation and
heat were calculated from latitude, slope inclination and
aspect, according to McCune & Keon (2002, eq. 3). These two
indices differ in that the radiation index attains maximal values
on south-facing slopes and the heat index on south-west-facing
slopes. (10–13) Four measures of potential radiation were
derived from hemispherical photographs, taken in the vertical
direction at a height of 1.5 m above ground at three sites
within each plot. A Nikon CoolPix 4500 digital camera with a
fish-eye lens was used. Potential direct and total solar radiation
were calculated using the Gap Light Analyzer software (Frazer
et al., 1999) and averaged over the three photographs from
each plot. Latitude, slope inclination, aspect and shading by
the surrounding topography were considered in the calcula-
tions. We quantified potential radiation for 21 June above the
canopy (Above direct and Above total radiation) and below the
canopy (Transmitted direct and Transmitted total radiation),
(14–17). Mean temperature of July and January, and precipi-
tation sum for the periods April–October and November–March
were obtained from the climatic maps of Bashkortostan
(Yaparov, 2005).
Besides these abiotic variables, we used canopy covers of
individual tree species because of their potential effect on the
diversity of target taxa. As an additional environmental
variable, we used summed covers of Acer, Tilia and Ulmus,
because the leaves of these trees are rich in calcium citrate and
contribute significantly to calcium availability in the topsoil
(Wareborn, 1969, 1970) and, consequently, to litter decom-
position (Hobbie et al., 2006). The structure of variation in
environmental variables, both abiotic (1–17) and canopy
covers of individual trees, was simplified using principal
components analysis (PCA) of a correlation matrix from the
statistica 8 package (http://www.statsoft.com). The input
data for PCA was a matrix of 78 plots · 28 environmental
variables. Subsequently, the environmental variable that was
most strongly correlated with the first PCA axis was selected as
a representative of this axis, and characteristics of the target
taxa were related to it by correlation analysis.
For comparative purposes, plots were classified into four
types based on dominant tree species. These types roughly
corresponded to the temporal sequence in which tree species
replaced each other in Central Europe between the late-glacial
and mid-Holocene, as follows: (1) Pinus–Larix (n = 18):
hemiboreal open-canopy coniferous forests dominated by
pine (P. sylvestris) and/or, less frequently, by larch (L. sibirica).
(2) Betula–Populus (n = 20): open-canopy small-leaved decid-
uous forests dominated by birch (B. pendula) and/or, less
frequently, by aspen (P. tremula). (3) Quercus (n = 13): broad-
leaved deciduous forests dominated by oak (Q. robur). (4)
Acer–Tilia–Ulmus (n = 27): closed-canopy broad-leaved
deciduous forests dominated by maple (A. platanoides), lime
(T. cordata) and/or elm (U. glabra). Plots were assigned to
groups 1, 2 or 3 only if maple, lime or elm had a cover <5%.
M. Chytry et al.
770 Journal of Biogeography 37, 767–780ª 2010 Blackwell Publishing Ltd
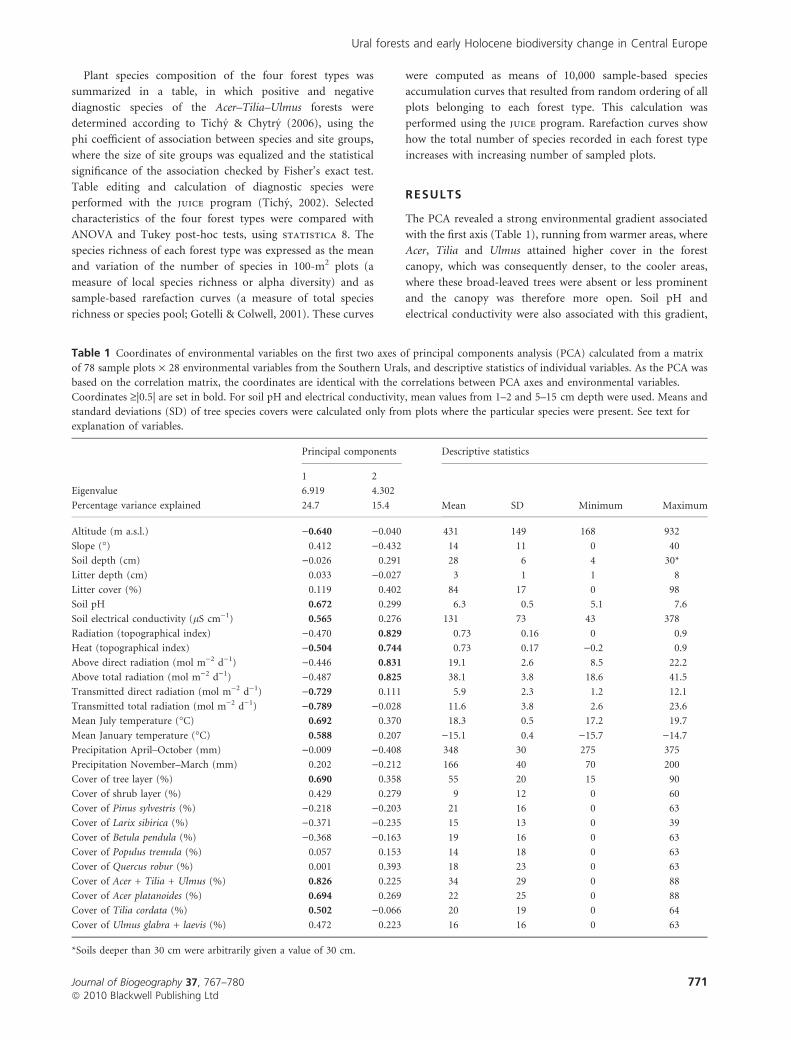
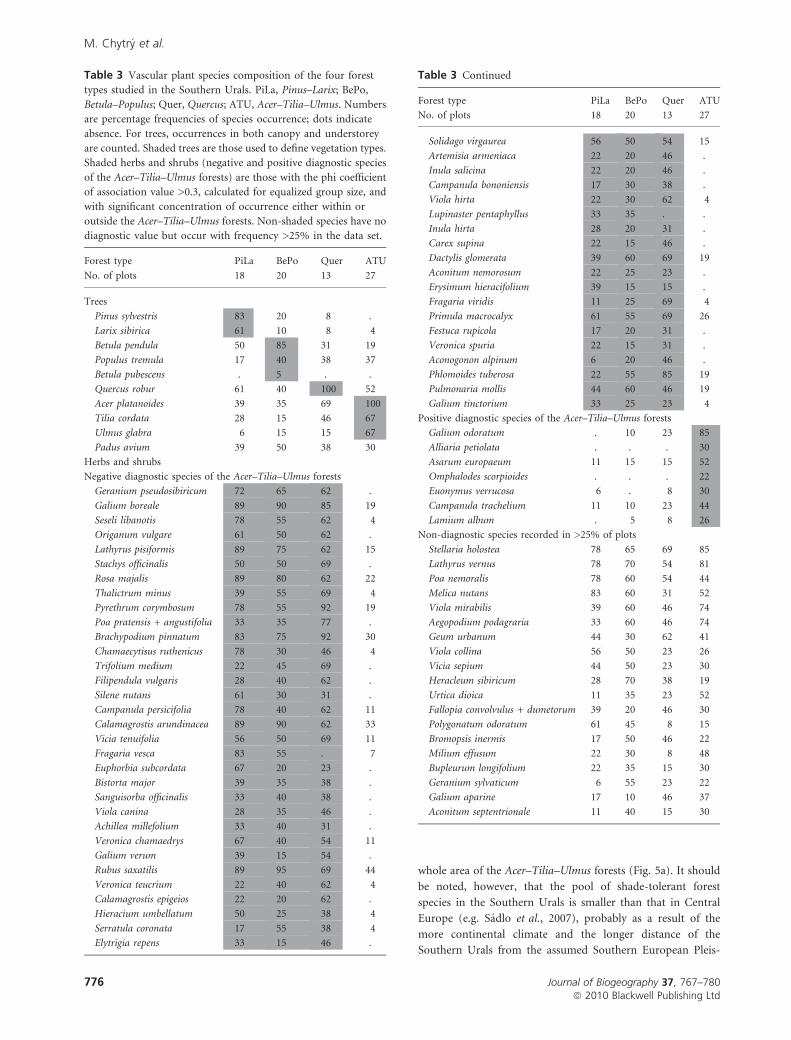
Plant species composition of the four forest types was
summarized in a table, in which positive and negative
diagnostic species of the Acer–Tilia–Ulmus forests were
determined according to Tichy & Chytry (2006), using the
phi coefficient of association between species and site groups,
where the size of site groups was equalized and the statistical
significance of the association checked by Fisher’s exact test.
Table editing and calculation of diagnostic species were
performed with the juice program (Tichy, 2002). Selected
characteristics of the four forest types were compared with
ANOVA and Tukey post-hoc tests, using statistica 8. The
species richness of each forest type was expressed as the mean
and variation of the number of species in 100-m2 plots (a
measure of local species richness or alpha diversity) and as
sample-based rarefaction curves (a measure of total species
richness or species pool; Gotelli & Colwell, 2001). These curves
were computed as means of 10,000 sample-based species
accumulation curves that resulted from random ordering of all
plots belonging to each forest type. This calculation was
performed using the juice program. Rarefaction curves show
how the total number of species recorded in each forest type
increases with increasing number of sampled plots.
RESULTS
The PCA revealed a strong environmental gradient associated
with the first axis (Table 1), running from warmer areas, where
Acer, Tilia and Ulmus attained higher cover in the forest
canopy, which was consequently denser, to the cooler areas,
where these broad-leaved trees were absent or less prominent
and the canopy was therefore more open. Soil pH and
electrical conductivity were also associated with this gradient,
Table 1 Coordinates of environmental variables on the first two axes of principal components analysis (PCA) calculated from a matrix
of 78 sample plots · 28 environmental variables from the Southern Urals, and descriptive statistics of individual variables. As the PCA was
based on the correlation matrix, the coordinates are identical with the correlations between PCA axes and environmental variables.
Coordinates ‡|0.5| are set in bold. For soil pH and electrical conductivity, mean values from 1–2 and 5–15 cm depth were used. Means and
standard deviations (SD) of tree species covers were calculated only from plots where the particular species were present. See text for
explanation of variables.
Principal components Descriptive statistics
1 2
Mean SD Minimum Maximum
Eigenvalue 6.919 4.302
Percentage variance explained 24.7 15.4
Altitude (m a.s.l.) )0.640 )0.040 431 149 168 932
Slope (�) 0.412 )0.432 14 11 0 40
Soil depth (cm) )0.026 0.291 28 6 4 30*
Litter depth (cm) 0.033 )0.027 3 1 1 8
Litter cover (%) 0.119 0.402 84 17 0 98
Soil pH 0.672 0.299 6.3 0.5 5.1 7.6
Soil electrical conductivity (lS cm)1) 0.565 0.276 131 73 43 378
Radiation (topographical index) )0.470 0.829 0.73 0.16 0 0.9
Heat (topographical index) )0.504 0.744 0.73 0.17 )0.2 0.9
Above direct radiation (mol m)2 d)1) )0.446 0.831 19.1 2.6 8.5 22.2
Above total radiation (mol m)2 d)1) )0.487 0.825 38.1 3.8 18.6 41.5
Transmitted direct radiation (mol m)2 d)1) )0.729 0.111 5.9 2.3 1.2 12.1
Transmitted total radiation (mol m)2 d)1) )0.789 )0.028 11.6 3.8 2.6 23.6
Mean July temperature (�C) 0.692 0.370 18.3 0.5 17.2 19.7
Mean January temperature (�C) 0.588 0.207 )15.1 0.4 )15.7 )14.7
Precipitation April–October (mm) )0.009 )0.408 348 30 275 375
Precipitation November–March (mm) 0.202 )0.212 166 40 70 200
Cover of tree layer (%) 0.690 0.358 55 20 15 90
Cover of shrub layer (%) 0.429 0.279 9 12 0 60
Cover of Pinus sylvestris (%) )0.218 )0.203 21 16 0 63
Cover of Larix sibirica (%) )0.371 )0.235 15 13 0 39
Cover of Betula pendula (%) )0.368 )0.163 19 16 0 63
Cover of Populus tremula (%) 0.057 0.153 14 18 0 63
Cover of Quercus robur (%) 0.001 0.393 18 23 0 63
Cover of Acer + Tilia + Ulmus (%) 0.826 0.225 34 29 0 88
Cover of Acer platanoides (%) 0.694 0.269 22 25 0 88
Cover of Tilia cordata (%) 0.502 )0.066 20 19 0 64
Cover of Ulmus glabra + laevis (%) 0.472 0.223 16 16 0 63
*Soils deeper than 30 cm were arbitrarily given a value of 30 cm.
Ural forests and early Holocene biodiversity change in Central Europe
Journal of Biogeography 37, 767–780 771ª 2010 Blackwell Publishing Ltd
being higher in the Acer–Tilia–Ulmus forests. The second PCA
axis reflected insolation above the canopy, dependent on
differences in slope aspect, and was therefore less important for
the explanation of diversity in the forest sub-canopy layers.
Of the individual environmental variables, the summed
cover of Acer, Tilia and Ulmus was the most strongly correlated
with the first PCA axis. We therefore used it as a representative
of this axis, and correlated sub-canopy biotic variables with it
(Table 2). With the increasing cover of Acer, Tilia and Ulmus,
the biomass and cover of the herb layer decreased, but
nutrients (N, P, K and Ca) measured in herbaceous biomass
and calcium measured in leaves of the herb-layer woody plants
increased. The species richness of vascular plants in all layers
(except juvenile woody plants) decreased, and so did that of
ground-dwelling bryophytes. However, the species richness of
snails increased.
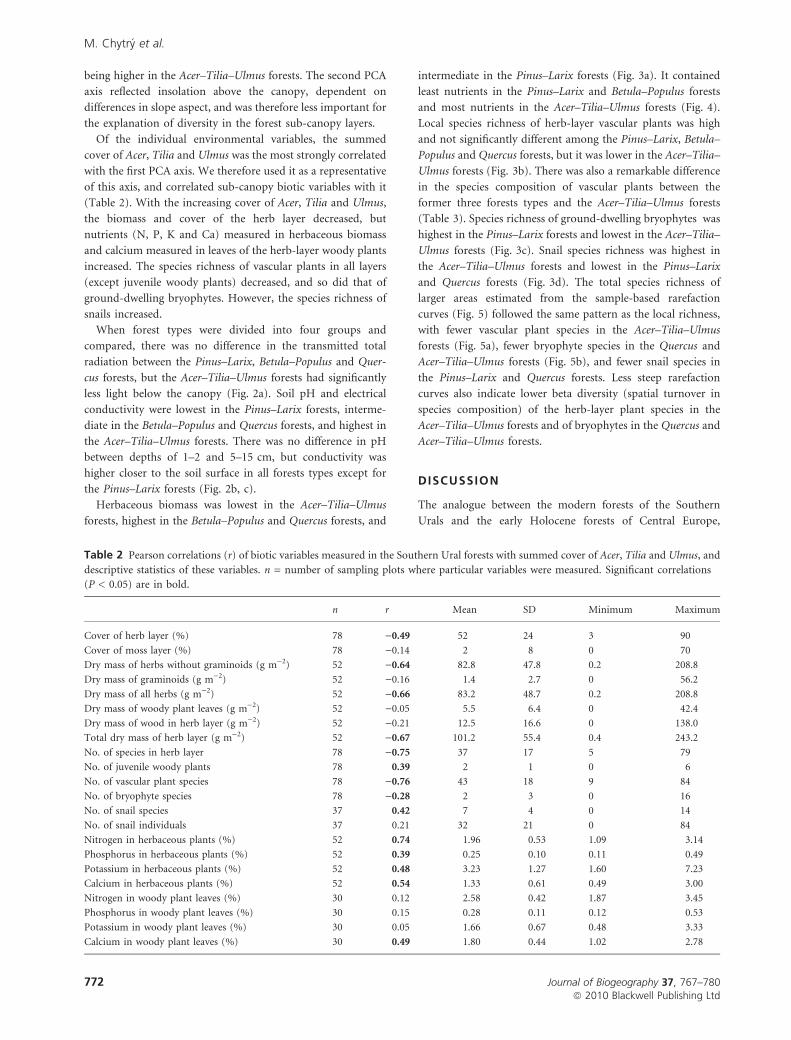
When forest types were divided into four groups and
compared, there was no difference in the transmitted total
radiation between the Pinus–Larix, Betula–Populus and Quer-
cus forests, but the Acer–Tilia–Ulmus forests had significantly
less light below the canopy (Fig. 2a). Soil pH and electrical
conductivity were lowest in the Pinus–Larix forests, interme-
diate in the Betula–Populus and Quercus forests, and highest in
the Acer–Tilia–Ulmus forests. There was no difference in pH
between depths of 1–2 and 5–15 cm, but conductivity was
higher closer to the soil surface in all forests types except for
the Pinus–Larix forests (Fig. 2b, c).
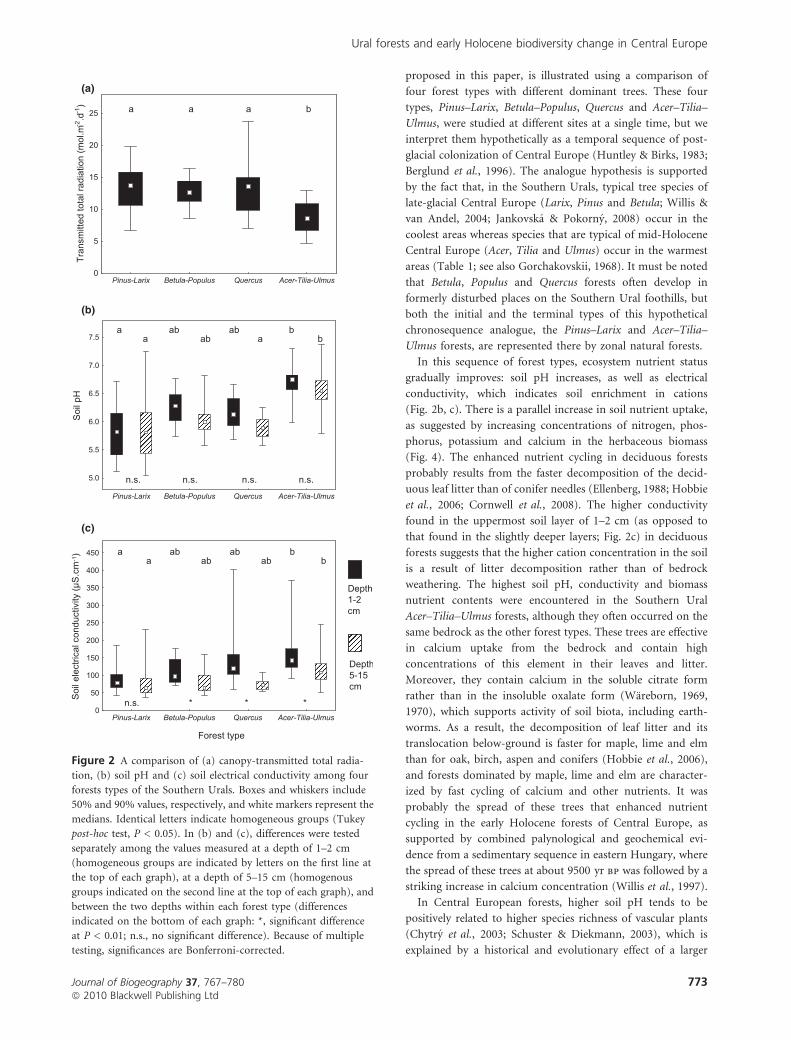
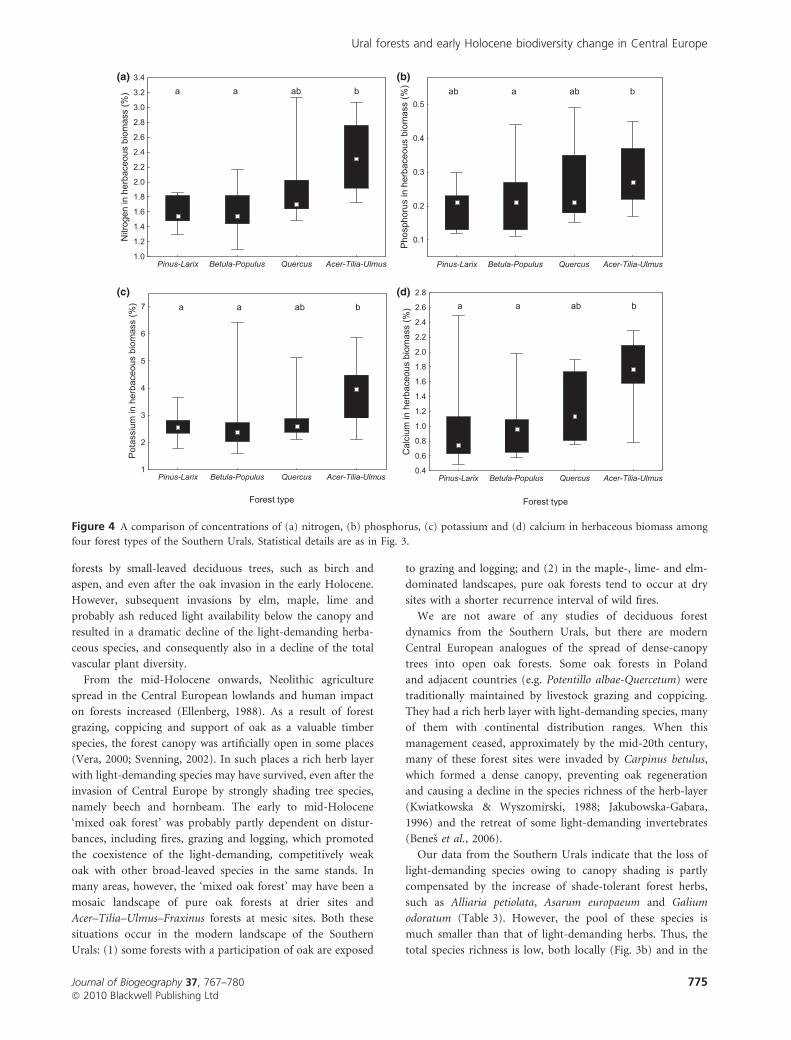
Herbaceous biomass was lowest in the Acer–Tilia–Ulmus
forests, highest in the Betula–Populus and Quercus forests, and
intermediate in the Pinus–Larix forests (Fig. 3a). It contained
least nutrients in the Pinus–Larix and Betula–Populus forests
and most nutrients in the Acer–Tilia–Ulmus forests (Fig. 4).
Local species richness of herb-layer vascular plants was high
and not significantly different among the Pinus–Larix, Betula–
Populus and Quercus forests, but it was lower in the Acer–Tilia–
Ulmus forests (Fig. 3b). There was also a remarkable difference
in the species composition of vascular plants between the
former three forests types and the Acer–Tilia–Ulmus forests
(Table 3). Species richness of ground-dwelling bryophytes was
highest in the Pinus–Larix forests and lowest in the Acer–Tilia–
Ulmus forests (Fig. 3c). Snail species richness was highest in
the Acer–Tilia–Ulmus forests and lowest in the Pinus–Larix
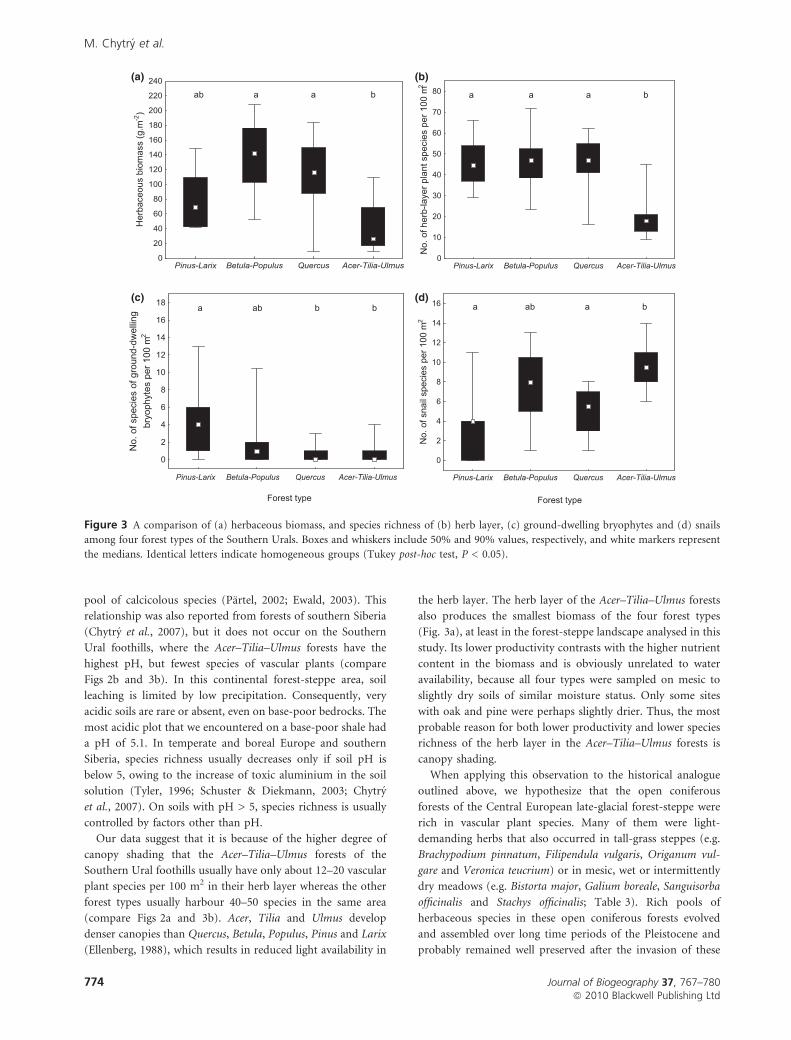
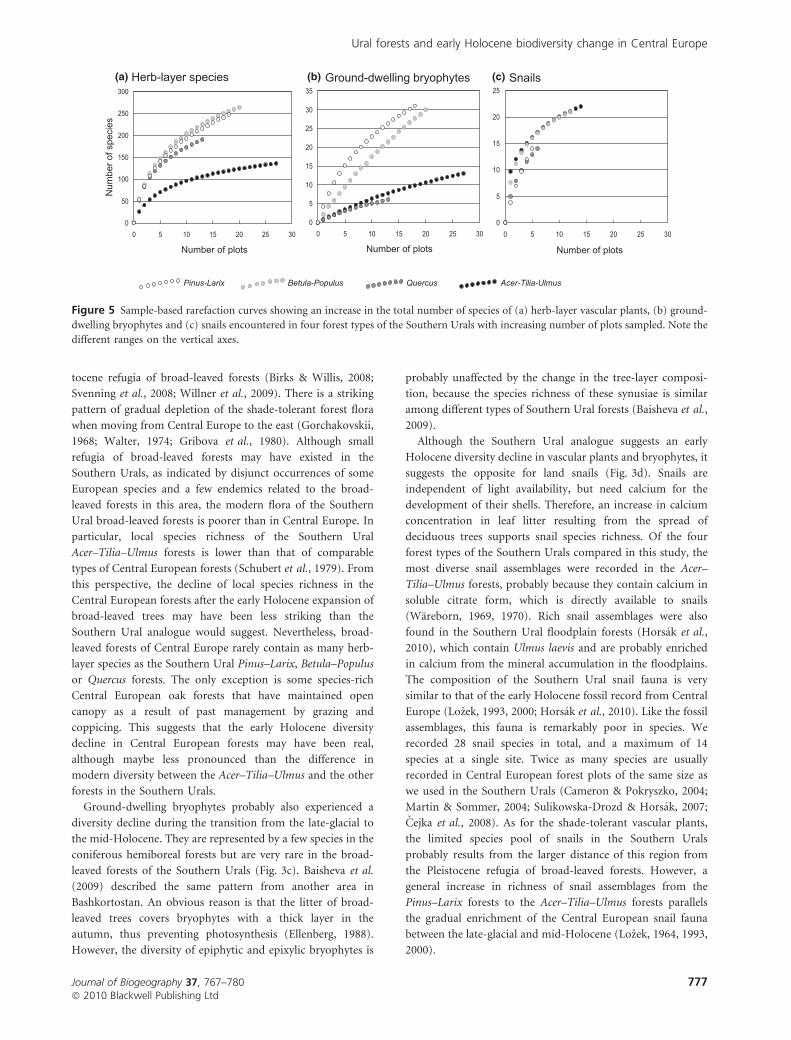
and Quercus forests (Fig. 3d). The total species richness of
larger areas estimated from the sample-based rarefaction
curves (Fig. 5) followed the same pattern as the local richness,
with fewer vascular plant species in the Acer–Tilia–Ulmus
forests (Fig. 5a), fewer bryophyte species in the Quercus and
Acer–Tilia–Ulmus forests (Fig. 5b), and fewer snail species in
the Pinus–Larix and Quercus forests. Less steep rarefaction
curves also indicate lower beta diversity (spatial turnover in
species composition) of the herb-layer plant species in the
Acer–Tilia–Ulmus forests and of bryophytes in the Quercus and
Acer–Tilia–Ulmus forests.
DISCUSSION
The analogue between the modern forests of the Southern
Urals and the early Holocene forests of Central Europe,
Table 2 Pearson correlations (r) of biotic variables measured in the Southern Ural forests with summed cover of Acer, Tilia and Ulmus, and
descriptive statistics of these variables. n = number of sampling plots where particular variables were measured. Significant correlations
(P < 0.05) are in bold.
n r Mean SD Minimum Maximum
Cover of herb layer (%) 78 )0.49 52 24 3 90
Cover of moss layer (%) 78 )0.14 2 8 0 70
Dry mass of herbs without graminoids (g m)2) 52 )0.64 82.8 47.8 0.2 208.8
Dry mass of graminoids (g m)2) 52 )0.16 1.4 2.7 0 56.2
Dry mass of all herbs (g m)2) 52 )0.66 83.2 48.7 0.2 208.8
Dry mass of woody plant leaves (g m)2) 52 )0.05 5.5 6.4 0 42.4
Dry mass of wood in herb layer (g m)2) 52 )0.21 12.5 16.6 0 138.0
Total dry mass of herb layer (g m)2) 52 )0.67 101.2 55.4 0.4 243.2
No. of species in herb layer 78 )0.75 37 17 5 79
No. of juvenile woody plants 78 0.39 2 1 0 6
No. of vascular plant species 78 )0.76 43 18 9 84
No. of bryophyte species 78 )0.28 2 3 0 16
No. of snail species 37 0.42 7 4 0 14
No. of snail individuals 37 0.21 32 21 0 84
Nitrogen in herbaceous plants (%) 52 0.74 1.96 0.53 1.09 3.14
Phosphorus in herbaceous plants (%) 52 0.39 0.25 0.10 0.11 0.49
Potassium in herbaceous plants (%) 52 0.48 3.23 1.27 1.60 7.23
Calcium in herbaceous plants (%) 52 0.54 1.33 0.61 0.49 3.00
Nitrogen in woody plant leaves (%) 30 0.12 2.58 0.42 1.87 3.45
Phosphorus in woody plant leaves (%) 30 0.15 0.28 0.11 0.12 0.53
Potassium in woody plant leaves (%) 30 0.05 1.66 0.67 0.48 3.33
Calcium in woody plant leaves (%) 30 0.49 1.80 0.44 1.02 2.78
M. Chytry et al.
772 Journal of Biogeography 37, 767–780ª 2010 Blackwell Publishing Ltd
proposed in this paper, is illustrated using a comparison of
four forest types with different dominant trees. These four
types, Pinus–Larix, Betula–Populus, Quercus and Acer–Tilia–
Ulmus, were studied at different sites at a single time, but we
interpret them hypothetically as a temporal sequence of post-
glacial colonization of Central Europe (Huntley & Birks, 1983;
Berglund et al., 1996). The analogue hypothesis is supported
by the fact that, in the Southern Urals, typical tree species of
late-glacial Central Europe (Larix, Pinus and Betula; Willis &
van Andel, 2004; Jankovska & Pokorny, 2008) occur in the
coolest areas whereas species that are typical of mid-Holocene
Central Europe (Acer, Tilia and Ulmus) occur in the warmest
areas (Table 1; see also Gorchakovskii, 1968). It must be noted
that Betula, Populus and Quercus forests often develop in
formerly disturbed places on the Southern Ural foothills, but
both the initial and the terminal types of this hypothetical
chronosequence analogue, the Pinus–Larix and Acer–Tilia–
Ulmus forests, are represented there by zonal natural forests.
In this sequence of forest types, ecosystem nutrient status
gradually improves: soil pH increases, as well as electrical
conductivity, which indicates soil enrichment in cations
(Fig. 2b, c). There is a parallel increase in soil nutrient uptake,
as suggested by increasing concentrations of nitrogen, phos-
phorus, potassium and calcium in the herbaceous biomass
(Fig. 4). The enhanced nutrient cycling in deciduous forests
probably results from the faster decomposition of the decid-
uous leaf litter than of conifer needles (Ellenberg, 1988; Hobbie
et al., 2006; Cornwell et al., 2008). The higher conductivity
found in the uppermost soil layer of 1–2 cm (as opposed to
that found in the slightly deeper layers; Fig. 2c) in deciduous
forests suggests that the higher cation concentration in the soil
is a result of litter decomposition rather than of bedrock
weathering. The highest soil pH, conductivity and biomass
nutrient contents were encountered in the Southern Ural
Acer–Tilia–Ulmus forests, although they often occurred on the
same bedrock as the other forest types. These trees are effective
in calcium uptake from the bedrock and contain high
concentrations of this element in their leaves and litter.
Moreover, they contain calcium in the soluble citrate form
rather than in the insoluble oxalate form (Wareborn, 1969,
1970), which supports activity of soil biota, including earth-
worms. As a result, the decomposition of leaf litter and its
translocation below-ground is faster for maple, lime and elm
than for oak, birch, aspen and conifers (Hobbie et al., 2006),
and forests dominated by maple, lime and elm are character-
ized by fast cycling of calcium and other nutrients. It was
probably the spread of these trees that enhanced nutrient
cycling in the early Holocene forests of Central Europe, as
supported by combined palynological and geochemical evi-
dence from a sedimentary sequence in eastern Hungary, where
the spread of these trees at about 9500 yr bp was followed by a
striking increase in calcium concentration (Willis et al., 1997).
In Central European forests, higher soil pH tends to be
positively related to higher species richness of vascular plants
(Chytry et al., 2003; Schuster & Diekmann, 2003), which is
explained by a historical and evolutionary effect of a larger
(a)
(b)
(c)
Figure 2 A comparison of (a) canopy-transmitted total radia-
tion, (b) soil pH and (c) soil electrical conductivity among four
forests types of the Southern Urals. Boxes and whiskers include
50% and 90% values, respectively, and white markers represent the
medians. Identical letters indicate homogeneous groups (Tukey
post-hoc test, P < 0.05). In (b) and (c), differences were tested
separately among the values measured at a depth of 1–2 cm
(homogeneous groups are indicated by letters on the first line at
the top of each graph), at a depth of 5–15 cm (homogenous
groups indicated on the second line at the top of each graph), and
between the two depths within each forest type (differences
indicated on the bottom of each graph: *, significant difference
at P < 0.01; n.s., no significant difference). Because of multiple
testing, significances are Bonferroni-corrected.
Ural forests and early Holocene biodiversity change in Central Europe
Journal of Biogeography 37, 767–780 773ª 2010 Blackwell Publishing Ltd
pool of calcicolous species (Partel, 2002; Ewald, 2003). This
relationship was also reported from forests of southern Siberia
(Chytry et al., 2007), but it does not occur on the Southern
Ural foothills, where the Acer–Tilia–Ulmus forests have the
highest pH, but fewest species of vascular plants (compare
Figs 2b and 3b). In this continental forest-steppe area, soil
leaching is limited by low precipitation. Consequently, very
acidic soils are rare or absent, even on base-poor bedrocks. The
most acidic plot that we encountered on a base-poor shale had
a pH of 5.1. In temperate and boreal Europe and southern
Siberia, species richness usually decreases only if soil pH is
below 5, owing to the increase of toxic aluminium in the soil
solution (Tyler, 1996; Schuster & Diekmann, 2003; Chytry
et al., 2007). On soils with pH > 5, species richness is usually
controlled by factors other than pH.
Our data suggest that it is because of the higher degree of
canopy shading that the Acer–Tilia–Ulmus forests of the
Southern Ural foothills usually have only about 12–20 vascular
plant species per 100 m2 in their herb layer whereas the other
forest types usually harbour 40–50 species in the same area
(compare Figs 2a and 3b). Acer, Tilia and Ulmus develop
denser canopies than Quercus, Betula, Populus, Pinus and Larix
(Ellenberg, 1988), which results in reduced light availability in
the herb layer. The herb layer of the Acer–Tilia–Ulmus forests
also produces the smallest biomass of the four forest types
(Fig. 3a), at least in the forest-steppe landscape analysed in this
study. Its lower productivity contrasts with the higher nutrient
content in the biomass and is obviously unrelated to water
availability, because all four types were sampled on mesic to
slightly dry soils of similar moisture status. Only some sites
with oak and pine were perhaps slightly drier. Thus, the most
probable reason for both lower productivity and lower species
richness of the herb layer in the Acer–Tilia–Ulmus forests is
canopy shading.
When applying this observation to the historical analogue
outlined above, we hypothesize that the open coniferous
forests of the Central European late-glacial forest-steppe were
rich in vascular plant species. Many of them were light-
demanding herbs that also occurred in tall-grass steppes (e.g.
Brachypodium pinnatum, Filipendula vulgaris, Origanum vul-
gare and Veronica teucrium) or in mesic, wet or intermittently
dry meadows (e.g. Bistorta major, Galium boreale, Sanguisorba
officinalis and Stachys officinalis; Table 3). Rich pools of
herbaceous species in these open coniferous forests evolved
and assembled over long time periods of the Pleistocene and
probably remained well preserved after the invasion of these
(a)
(c)
(b)
(d)
Figure 3 A comparison of (a) herbaceous biomass, and species richness of (b) herb layer, (c) ground-dwelling bryophytes and (d) snails
among four forest types of the Southern Urals. Boxes and whiskers include 50% and 90% values, respectively, and white markers represent
the medians. Identical letters indicate homogeneous groups (Tukey post-hoc test, P < 0.05).
M. Chytry et al.
774 Journal of Biogeography 37, 767–780ª 2010 Blackwell Publishing Ltd
forests by small-leaved deciduous trees, such as birch and
aspen, and even after the oak invasion in the early Holocene.
However, subsequent invasions by elm, maple, lime and
probably ash reduced light availability below the canopy and
resulted in a dramatic decline of the light-demanding herba-
ceous species, and consequently also in a decline of the total
vascular plant diversity.
From the mid-Holocene onwards, Neolithic agriculture
spread in the Central European lowlands and human impact
on forests increased (Ellenberg, 1988). As a result of forest
grazing, coppicing and support of oak as a valuable timber
species, the forest canopy was artificially open in some places
(Vera, 2000; Svenning, 2002). In such places a rich herb layer
with light-demanding species may have survived, even after the
invasion of Central Europe by strongly shading tree species,
namely beech and hornbeam. The early to mid-Holocene
‘mixed oak forest’ was probably partly dependent on distur-
bances, including fires, grazing and logging, which promoted
the coexistence of the light-demanding, competitively weak
oak with other broad-leaved species in the same stands. In
many areas, however, the ‘mixed oak forest’ may have been a
mosaic landscape of pure oak forests at drier sites and
Acer–Tilia–Ulmus–Fraxinus forests at mesic sites. Both these
situations occur in the modern landscape of the Southern
Urals: (1) some forests with a participation of oak are exposed
to grazing and logging; and (2) in the maple-, lime- and elm-
dominated landscapes, pure oak forests tend to occur at dry
sites with a shorter recurrence interval of wild fires.
We are not aware of any studies of deciduous forest
dynamics from the Southern Urals, but there are modern
Central European analogues of the spread of dense-canopy
trees into open oak forests. Some oak forests in Poland
and adjacent countries (e.g. Potentillo albae-Quercetum) were
traditionally maintained by livestock grazing and coppicing.
They had a rich herb layer with light-demanding species, many
of them with continental distribution ranges. When this
management ceased, approximately by the mid-20th century,
many of these forest sites were invaded by Carpinus betulus,
which formed a dense canopy, preventing oak regeneration
and causing a decline in the species richness of the herb-layer
(Kwiatkowska & Wyszomirski, 1988; Jakubowska-Gabara,
1996) and the retreat of some light-demanding invertebrates
(Benes et al., 2006).
Our data from the Southern Urals indicate that the loss of
light-demanding species owing to canopy shading is partly
compensated by the increase of shade-tolerant forest herbs,
such as Alliaria petiolata, Asarum europaeum and Galium
odoratum (Table 3). However, the pool of these species is
much smaller than that of light-demanding herbs. Thus, the
total species richness is low, both locally (Fig. 3b) and in the
(a)
(c)
(b)
(d)
Figure 4 A comparison of concentrations of (a) nitrogen, (b) phosphorus, (c) potassium and (d) calcium in herbaceous biomass among
four forest types of the Southern Urals. Statistical details are as in Fig. 3.
Ural forests and early Holocene biodiversity change in Central Europe
Journal of Biogeography 37, 767–780 775ª 2010 Blackwell Publishing Ltd
whole area of the Acer–Tilia–Ulmus forests (Fig. 5a). It should
be noted, however, that the pool of shade-tolerant forest
species in the Southern Urals is smaller than that in Central
Europe (e.g. Sadlo et al., 2007), probably as a result of the
more continental climate and the longer distance of the
Southern Urals from the assumed Southern European Pleis-
Table 3 Vascular plant species composition of the four forest
types studied in the Southern Urals. PiLa, Pinus–Larix; BePo,
Betula–Populus; Quer, Quercus; ATU, Acer–Tilia–Ulmus. Numbers
are percentage frequencies of species occurrence; dots indicate
absence. For trees, occurrences in both canopy and understorey
are counted. Shaded trees are those used to define vegetation types.
Shaded herbs and shrubs (negative and positive diagnostic species
of the Acer–Tilia–Ulmus forests) are those with the phi coefficient
of association value >0.3, calculated for equalized group size, and
with significant concentration of occurrence either within or
outside the Acer–Tilia–Ulmus forests. Non-shaded species have no
diagnostic value but occur with frequency >25% in the data set.
Forest type PiLa BePo Quer ATU
No. of plots 18 20 13 27
Trees
Pinus sylvestris 83 20 8 .
Larix sibirica 61 10 8 4
Betula pendula 50 85 31 19
Populus tremula 17 40 38 37
Betula pubescens . 5 . .
Quercus robur 61 40 100 52
Acer platanoides 39 35 69 100
Tilia cordata 28 15 46 67
Ulmus glabra 6 15 15 67
Padus avium 39 50 38 30
Herbs and shrubs
Negative diagnostic species of the Acer–Tilia–Ulmus forests
Geranium pseudosibiricum 72 65 62 .
Galium boreale 89 90 85 19
Seseli libanotis 78 55 62 4
Origanum vulgare 61 50 62 .
Lathyrus pisiformis 89 75 62 15
Stachys officinalis 50 50 69 .
Rosa majalis 89 80 62 22
Thalictrum minus 39 55 69 4
Pyrethrum corymbosum 78 55 92 19
Poa pratensis + angustifolia 33 35 77 .
Brachypodium pinnatum 83 75 92 30
Chamaecytisus ruthenicus 78 30 46 4
Trifolium medium 22 45 69 .
Filipendula vulgaris 28 40 62 .
Silene nutans 61 30 31 .
Campanula persicifolia 78 40 62 11
Calamagrostis arundinacea 89 90 62 33
Vicia tenuifolia 56 50 69 11
Fragaria vesca 83 55 . 7
Euphorbia subcordata 67 20 23 .
Bistorta major 39 35 38 .
Sanguisorba officinalis 33 40 38 .
Viola canina 28 35 46 .
Achillea millefolium 33 40 31 .
Veronica chamaedrys 67 40 54 11
Galium verum 39 15 54 .
Rubus saxatilis 89 95 69 44
Veronica teucrium 22 40 62 4
Calamagrostis epigeios 22 20 62 .
Hieracium umbellatum 50 25 38 4
Serratula coronata 17 55 38 4
Elytrigia repens 33 15 46 .
Table 3 Continued
Forest type PiLa BePo Quer ATU
No. of plots 18 20 13 27
Solidago virgaurea 56 50 54 15
Artemisia armeniaca 22 20 46 .
Inula salicina 22 20 46 .
Campanula bononiensis 17 30 38 .
Viola hirta 22 30 62 4
Lupinaster pentaphyllus 33 35 . .
Inula hirta 28 20 31 .
Carex supina 22 15 46 .
Dactylis glomerata 39 60 69 19
Aconitum nemorosum 22 25 23 .
Erysimum hieracifolium 39 15 15 .
Fragaria viridis 11 25 69 4
Primula macrocalyx 61 55 69 26
Festuca rupicola 17 20 31 .
Veronica spuria 22 15 31 .
Aconogonon alpinum 6 20 46 .
Phlomoides tuberosa 22 55 85 19
Pulmonaria mollis 44 60 46 19
Galium tinctorium 33 25 23 4
Positive diagnostic species of the Acer–Tilia–Ulmus forests
Galium odoratum . 10 23 85
Alliaria petiolata . . . 30
Asarum europaeum 11 15 15 52
Omphalodes scorpioides . . . 22
Euonymus verrucosa 6 . 8 30
Campanula trachelium 11 10 23 44
Lamium album . 5 8 26
Non-diagnostic species recorded in >25% of plots
Stellaria holostea 78 65 69 85
Lathyrus vernus 78 70 54 81
Poa nemoralis 78 60 54 44
Melica nutans 83 60 31 52
Viola mirabilis 39 60 46 74
Aegopodium podagraria 33 60 46 74
Geum urbanum 44 30 62 41
Viola collina 56 50 23 26
Vicia sepium 44 50 23 30
Heracleum sibiricum 28 70 38 19
Urtica dioica 11 35 23 52
Fallopia convolvulus + dumetorum 39 20 46 30
Polygonatum odoratum 61 45 8 15
Bromopsis inermis 17 50 46 22
Milium effusum 22 30 8 48
Bupleurum longifolium 22 35 15 30
Geranium sylvaticum 6 55 23 22
Galium aparine 17 10 46 37
Aconitum septentrionale 11 40 15 30
M. Chytry et al.
776 Journal of Biogeography 37, 767–780ª 2010 Blackwell Publishing Ltd
tocene refugia of broad-leaved forests (Birks & Willis, 2008;
Svenning et al., 2008; Willner et al., 2009). There is a striking
pattern of gradual depletion of the shade-tolerant forest flora
when moving from Central Europe to the east (Gorchakovskii,
1968; Walter, 1974; Gribova et al., 1980). Although small
refugia of broad-leaved forests may have existed in the
Southern Urals, as indicated by disjunct occurrences of some
European species and a few endemics related to the broad-
leaved forests in this area, the modern flora of the Southern
Ural broad-leaved forests is poorer than in Central Europe. In
particular, local species richness of the Southern Ural
Acer–Tilia–Ulmus forests is lower than that of comparable
types of Central European forests (Schubert et al., 1979). From
this perspective, the decline of local species richness in the
Central European forests after the early Holocene expansion of
broad-leaved trees may have been less striking than the
Southern Ural analogue would suggest. Nevertheless, broad-
leaved forests of Central Europe rarely contain as many herb-
layer species as the Southern Ural Pinus–Larix, Betula–Populus
or Quercus forests. The only exception is some species-rich
Central European oak forests that have maintained open
canopy as a result of past management by grazing and
coppicing. This suggests that the early Holocene diversity
decline in Central European forests may have been real,
although maybe less pronounced than the difference in
modern diversity between the Acer–Tilia–Ulmus and the other
forests in the Southern Urals.
Ground-dwelling bryophytes probably also experienced a
diversity decline during the transition from the late-glacial to
the mid-Holocene. They are represented by a few species in the
coniferous hemiboreal forests but are very rare in the broad-
leaved forests of the Southern Urals (Fig. 3c). Baisheva et al.
(2009) described the same pattern from another area in
Bashkortostan. An obvious reason is that the litter of broad-
leaved trees covers bryophytes with a thick layer in the
autumn, thus preventing photosynthesis (Ellenberg, 1988).
However, the diversity of epiphytic and epixylic bryophytes is
probably unaffected by the change in the tree-layer composi-
tion, because the species richness of these synusiae is similar
among different types of Southern Ural forests (Baisheva et al.,
2009).
Although the Southern Ural analogue suggests an early
Holocene diversity decline in vascular plants and bryophytes, it
suggests the opposite for land snails (Fig. 3d). Snails are
independent of light availability, but need calcium for the
development of their shells. Therefore, an increase in calcium
concentration in leaf litter resulting from the spread of
deciduous trees supports snail species richness. Of the four
forest types of the Southern Urals compared in this study, the
most diverse snail assemblages were recorded in the Acer–
Tilia–Ulmus forests, probably because they contain calcium in
soluble citrate form, which is directly available to snails
(Wareborn, 1969, 1970). Rich snail assemblages were also
found in the Southern Ural floodplain forests (Horsak et al.,
2010), which contain Ulmus laevis and are probably enriched
in calcium from the mineral accumulation in the floodplains.
The composition of the Southern Ural snail fauna is very
similar to that of the early Holocene fossil record from Central
Europe (Lozek, 1993, 2000; Horsak et al., 2010). Like the fossil
assemblages, this fauna is remarkably poor in species. We
recorded 28 snail species in total, and a maximum of 14
species at a single site. Twice as many species are usually
recorded in Central European forest plots of the same size as
we used in the Southern Urals (Cameron & Pokryszko, 2004;
Martin & Sommer, 2004; Sulikowska-Drozd & Horsak, 2007;
Cejka et al., 2008). As for the shade-tolerant vascular plants,
the limited species pool of snails in the Southern Urals
probably results from the larger distance of this region from
the Pleistocene refugia of broad-leaved forests. However, a
general increase in richness of snail assemblages from the
Pinus–Larix forests to the Acer–Tilia–Ulmus forests parallels
the gradual enrichment of the Central European snail fauna
between the late-glacial and mid-Holocene (Lozek, 1964, 1993,
2000).
(a) (b) (c)
Figure 5 Sample-based rarefaction curves showing an increase in the total number of species of (a) herb-layer vascular plants, (b) ground-
dwelling bryophytes and (c) snails encountered in four forest types of the Southern Urals with increasing number of plots sampled. Note the
different ranges on the vertical axes.
Ural forests and early Holocene biodiversity change in Central Europe
Journal of Biogeography 37, 767–780 777ª 2010 Blackwell Publishing Ltd
CONCLUSIONS
Using an analogue with the modern forests of the Southern
Ural foothills, we propose the hypothesis that the spread of
broad-leaved trees in the early Holocene forests of Central
Europe caused a profound environmental change. First, the
accumulation of leaf litter from birch, aspen and oak reduced
the diversity of ground-dwelling bryophytes. Later on, elm,
lime, maple and ash formed a dense canopy and caused a
decline of the light-demanding, species-rich herb layer, typical
of the previous open-canopy forests. However, the calcium-
rich litter of these trees enhanced nutrient cycling and
supported an increase in the species richness of land snails.
ACKNOWLEDGEMENTS
We thank Larisa Abramova, Amina Galeeva, Nikolai Ermakov,
Boris Mirkin and Al’bert Muldashev for supporting our
fieldwork; Michal Hajek and Jan Rolecek for comments and
discussions; Petra Makovcova for processing hemispherical
photographs; Ondrej Hajek for drawing the map; and Jens-
Christian Svenning and two anonymous referees for helpful
comments on the previous manuscript version. This study was
funded by the Grant Agency of the Academy of Sciences of the
Czech Republic (IAA6163303), the Ministry of Education of
the Czech Republic (MSM0021622416), the Academy of
Sciences of the Czech Republic (AV0Z60050516) and the
Russian Foundation for Basic Research RFBR (07-04-00030-a).
REFERENCES
Baisheva, E.Z., Zhigunova, S.N., Martynenko, V.B. &
Shirokikh, P.S. (2009) Ecological and phytocenotic features
of the bryophyte component of water protection forests
on the Ufa Plateau. Russian Journal of Ecology, 40, 180–186.
Benes, J., Cızek, O., Dovala, J. & Konvicka, M. (2006) Intensive
game keeping, coppicing and butterflies: the story of
Milovicky Wood, Czech Republic. Forest Ecology and
Management, 237, 353–365.
Berglund, B.E., Birks, H.J.B., Ralska-Jasiewiczowa, M. &
Wright, H.E. (eds) (1996) Palaeoecological events during the
last 15 000 years. John Wiley & Sons, Chichester.
Beug, H.-J. (2004) Leitfaden der Pollenbestimmung fur Mittel-
europa und angrenzende Gebiete. Verlag Dr. Friedrich Pfeil,
Munich.
Birks, H.J.B. & Willis, K.J. (2008) Alpines, trees, and refugia in
Europe. Plant Ecology & Diversity, 1, 147–160.
Bohn, U. & Neuhausl, R. (eds) (2000–2003) Karte der naturlichen
Vegetation Europas. Bundesamt fur Naturschutz, Bonn.
Cameron, R.D.A. & Pokryszko, B. (2004) Land mollusc faunas
of Białowie_za forest (Poland), and the character and survival
of forest faunas in the North European Plain. Journal of
Molluscan Studies, 70, 149–164.
Cejka, T., Horsak, M. & Nemethova, D. (2008) The compo-
sition and richness of Danubian floodplain forest land snail
faunas in relation to forest type and flood frequency. Journal
of Molluscan Studies, 74, 37–45.
Cherepanov, S.K. (1995) Sosudistye rasteniya Rossii i
sopredel’nykh gosudarstv (Vascular plants of Russia and
adjacent countries). Mir i sem’ya-95, Saint Petersburg
(in Russian).
Chytry, M., Tichy, L. & Rolecek, J. (2003) Local and regional
patterns of species richness in Central European vegetation
types along the pH/calcium gradient. Folia Geobotanica, 38,
429–442.
Chytry, M., Danihelka, J., Ermakov, N., Hajek, M., Hajkova, P.,
Kocı, M., Kubesova, S., Lustyk, P., Otypkova, Z., Popov, D.,
Rolecek, J., Reznıckova, M., Smarda, P. & Valachovic, M.
(2007) Plant species richness in continental southern Siberia:
effects of pH and climate in the context of the species pool
hypothesis. Global Ecology and Biogeography, 16, 668–678.
Cornwell, W.K., Cornelissen, J.H.C., Amatangelo, K. et al.
(2008) Plant species traits are the predominant control on
litter decomposition rates within biomes worldwide. Ecology
Letters, 11, 1065–1071.
Davis, B.A.S., Brewer, S., Stevenson, A.C. & Guiot, J. & Data
Contributors (2003) The temperature of Europe during the
Holocene reconstructed from pollen data. Quaternary Sci-
ence Reviews, 22, 1701–1716.
Ellenberg, H. (1988) Vegetation ecology of Central Europe.
Cambridge University Press, Cambridge.
Ermakov, N., Dring, J. & Rodwell, J. (2000) Classification of
continental hemiboreal forests of North Asia. Braun-Blan-
quetia, 28, 1–129.
Ewald, J. (2003) The calcareous riddle: why are there so many
calciphilous species in the Central European flora? Folia
Geobotanica, 38, 357–366.
Firbas, F. (1949) Spat- und nacheiszeitliche Waldgeschichte Mit-
teleuropas nordlich der Alpen. Gustav Fischer Verlag, Jena.
Frazer, G.W., Canham, C.D. & Lertzman, K.P. (1999) Gap
Light Analyzer (GLA). Imaging software to extract canopy
structure and gap light transmission indices from true-colour
fisheye photographs. Users manual and program documenta-
tion, Version 2.0. Simon Fraser University, Burnaby &
Institute of Ecosystem Studies, Millbrook, NY.
Gorchakovskii, P.L. (1968) Rasteniya evropeiskikh shi-
rokolistvennykh lesov na vostochnom predele ikh areala (Plants
of the European broad-leaved forests on the eastern limit of
their range). Institut ekologii rastenii i zhivotnykh, Sverd-
lovsk (in Russian).
Gotelli, N.J. & Colwell, R.K. (2001) Quantifying biodiversity:
procedures and pitfalls in the measurement and comparison
of species richness. Ecology Letters, 4, 379–391.
Gribova, S.A., Isachenko, T.I. & Lavrenko, E.M. (1980) Ras-
titel’nost’ evropeiskoi chasti SSSR (Vegetation of the European
part of the USSR). Nauka, Leningrad (in Russian).
Hobbie, S.E., Reich, P.B., Oleksyn, J., Ogdahl, M., Zytkowiak,
R., Hale, C. & Karolewski, P. (2006) Tree species effects on
decomposition and forest floor dynamics in a common
garden. Ecology, 87, 2288–2297.
M. Chytry et al.
778 Journal of Biogeography 37, 767–780ª 2010 Blackwell Publishing Ltd
Horsak, M. (2003) How to sample mollusc communities in
mires easily. Malacologica Bohemoslovaca, 2, 11–14.
Horsak, M., Chytry, M., Danihelka, J., Kocı, M., Kubesova, S.,
Lososova, Z., Otypkova, Z. & Tichy, L. (2010) Snail faunas
in the Southern Ural forests and their relations to vegeta-
tion: an analogue of the Early Holocene assemblages of
Central Europe? Journal of Molluscan Studies, doi:10.1093/
mollus/eyp039.
Huntley, B. & Birks, H.J.B. (1983) An atlas of past and present
pollen maps for Europe 0–13000 years ago. Cambridge
University Press, Cambridge.
Jakubowska-Gabara, J. (1996) Decline of Potentillo albae-
Quercetum Libb. 1933 phytocoenoses in Poland. Vegetatio,
124, 45–59.
Jankovska, V. & Pokorny, P. (2008) Forest vegetation of the
last full-glacial period in the Western Carpathians (Slovakia
and Czech Republic). Preslia, 80, 307–324.
Khairetdinov, A.F. (ed.) (2004) Lesa Bashkortostana (Forests of
Bashkortostan). OGUPR RF po RB & BGAU, Ufa (in Rus-
sian).
Kunes, P., Pelankova, B., Chytry, M., Jankovska, V., Pokorny,
P. & Petr, L. (2008) Interpretation of the last-glacial vege-
tation of eastern-central Europe using modern analogues
from southern Siberia. Journal of Biogeography, 35, 2223–
2236.
Kuster, H. (1997) The role of farming in the postglacial
expansion of beech and hornbeam in the oak woodlands of
central Europe. The Holocene, 7, 239–242.
Kwiatkowska, A.J. & Wyszomirski, T. (1988) Decline of
Potentillo albae-Quercetum phytocoenoses associated with
the invasion of Carpinus betulus. Vegetatio, 75, 49–55.
Lang, G. (1994) Quartare Vegetationsgeschichte Europas.
Gustav Fischer Verlag, Jena.
Lozek, V. (1964) Quartarmollusken der Tschechoslowakei.
Nakladatelstvı CSAV, Praha.
Lozek, V. (1993) Diversity changes in Mid-European mollus-
can fauna during the Postglacial. Ekologia, 12, 247–258.
Lozek, V. (2000) Palaeoecology of Quaternary Mollusca.
Sbornık geologickych ved, Antropozoikum, 24, 35–59.
Magri, D. (2008) Patterns of post-glacial spread and the extent
of glacial refugia of European beech (Fagus sylvatica).
Journal of Biogeography, 35, 450–463.
Martin, K. & Sommer, M. (2004) Relationships between land
snail assemblage patterns and soil properties in temperate-
humid forest ecosystems. Journal of Biogeography, 31, 531–
545.
Martynenko, V.B., Yamalov, S.M., Zhigunov, O.Yu. & Filinov,
A.A. (2005) Rastitel’nost’ gosudarstvennogo prirodnogo
zapovednika ‘‘Shul’gan-Tash’’ (Vegetation of the State Nature
Reserve ‘‘Shul’gan-Tash’’). Gilem, Ufa (in Russian).
McCune, B. & Keon, D. (2002) Equations for potential annual
direct incident radiation and heat load. Journal of Vegetation
Science, 13, 603–606.
Mirkin, B.M. (ed.) (2008) Flora i rastitel’nost’ Yuzhno-
Ural’skogo gosudarstvennogo prirodnogo zapovednika (Flora
and vegetation of the Southern Ural State Nature Reserve).
Gilem, Ufa (in Russian).
Monserud, R.A., Denissenko, O.V. & Tchebakova, N.M.
(1993) Comparison of Siberian paleovegetation to current
and future vegetation under climate change. Climate
Research, 3, 143–159.
Partel, M. (2002) Local plant diversity patterns and
evolutionary history at the regional scale. Ecology, 83, 2361–
2366.
Pickett, S.T.A. (1989) Space-for-time substitution as an alter-
native to long-term studies. Long-term studies in ecology:
approaches and alternatives (ed. by G.E. Likens), pp. 110–
135. Springer-Verlag, New York.
Popov, G.V. (1980) Lesa Bashkirii (Forests of Bashkiria).
Bashkirskoe knizhnoe izdate’lstvo, Ufa (in Russian).
Rousseau, D.-D. (1990) Statistical analyses of loess molluscs
for paleoecological reconstructions. Quaternary Interna-
tional, 7, 81–89.
Sadlo, J., Chytry, M. & Pysek, P. (2007) Regional species pools
of vascular plants in habitats of the Czech Republic. Preslia,
79, 303–321.
Schubert, R., Jager, E.J. & Mahn, E.-G. (1979) Vergleichende
geobotanische Untersuchungen in der Baschkirischen ASSR.
1. Teil: Walder. Hercynia, N. F., 16, 206–263.
Schuster, B. & Diekmann, M. (2003) Changes in species den-
sity along the soil pH gradient — evidence from German
plant communities. Folia Geobotanica, 38, 367–379.
Sochava, V.B. (1979) Rastitel’nyi pokrov na tematicheskikh
kartakh (Plant cover on thematic maps). Nauka, Novosibirsk
(in Russian).
Sulikowska-Drozd, A. & Horsak, M. (2007) Woodland mollusc
faunas along environmental gradients in the East Carpa-
thians. Biologia, 62, 201–209.
Svenning, J.-C. (2002) A review of natural vegetation openness
in north-western Europe. Biological Conservation, 104, 133–
148.
Svenning, J.-C., Normand, S. & Kageyama, M. (2008) Gla-
cial refugia of temperate trees in Europe: insights from
species distribution modelling. Journal of Ecology, 96,
1117–1127.
Tichy, L. (2002) JUICE, software for vegetation classification.
Journal of Vegetation Science, 13, 451–453.
Tichy, L. & Chytry, M. (2006) Statistical determination of
diagnostic species for site groups of unequal size. Journal of
Vegetation Science, 17, 809–818.
Tyler, G. (1996) Soil chemistry and plant distributions in rock
habitats of southern Sweden. Nordic Journal of Botany, 16,
609–635.
Vera, F.W.M. (2000) Grazing ecology and forest history. CABI
Publishing, Wallingford, UK.
Walter, H. (1974) Die Vegetation Osteuropas, Nord- und
Zentralasiens. Gustav Fischer Verlag, Stuttgart.
Wareborn, I. (1969) Land molluscs and their environments in
an oligotrophic area in southern Sweden. Oikos, 20, 461–
479.
Ural forests and early Holocene biodiversity change in Central Europe
Journal of Biogeography 37, 767–780 779ª 2010 Blackwell Publishing Ltd
Wareborn, I. (1970) Environmental factors influencing the
distribution of land molluscs of an oligotrophic area in
southern Sweden. Oikos, 21, 285–291.
Williams, J.W. & Jackson, S.T. (2007) Novel climates,
no-analog communities, and ecological surprises. Frontiers
in Ecology and the Environment, 5, 475–482.
Willis, K.J., Braun, M., Sumegi, P. & Toth, A. (1997) Does soil
change cause vegetation change or vice versa? A temporal
perspective from Hungary. Ecology, 78, 740–750.
Willis, K.J. & van Andel, T.H. (2004) Trees or no trees? The
environments of central and eastern Europe during the Last
Glaciation. Quaternary Science Reviews, 23, 2369–2387.
Willner, W., Di Pietro, R. & Bergmeier, E. (2009) Phytogeo-
graphical evidence for post-glacial dispersal limitation of
European beech forest species. Ecography, 32, 1011–1018.
Yaparov, I.M. (ed.) (2005) Atlas Respubliki Bashkortostan
(Atlas of the Bashkortostan Republic). Pravitel’stvo Respub-
liki Bashkortostan, Ufa (in Russian).
Zbıral, J. (1995) Analyza rostlinneho materialu. Jednotne prac-
ovnı postupy (Analysis of plant material. Unified techniques).
Central Institute for Supervising and Testing in Agriculture,
Brno (in Czech).
BIOSKETCH
Milan Chytry is a professor of botany at Masaryk University,
Brno, Czech Republic. With a team of Czech, Russian and
Slovak plant ecologist, palynologists and a malacologist,
Michal Horsak, he is studying the diversity of the natural
ecosystems of southern Siberia and the Southern Ural
Mountains. This research focuses particularly on the determi-
nants of species diversity patterns and on the interpretation of
the full-glacial to early Holocene biota and environments of
eastern Central Europe using modern analogues from these
continental areas.
Author contributions: M.C. conceived the ideas and led the
writing; M.H. collected and processed the snail data and the
other authors collected and processed the botanical data;
J.D. and S.K. revised identifications of vascular plants and
bryophytes, respectively; M.C. and L.T. analysed the data; all
authors commented on the manuscript.
Editor: Jens-Christian Svenning
M. Chytry et al.
780 Journal of Biogeography 37, 767–780ª 2010 Blackwell Publishing Ltd