modelling the winter distribution of a rare and endangered migrant, the aquatic warbler acrocephalus...
TRANSCRIPT
Ibis
(2007),
149
, 701–714
© 2007 The Authors Journal compilation © 2007 British Ornithologists’ Union
Blackwell Publishing Ltd
Modelling the winter distribution of a rare and endangered migrant, the Aquatic Warbler
Acrocephalus paludicola
BRUNO A. WALTHER,
1
,
2
* NORBERT SCHÄFFER,
3
ADRIAAN VAN NIEKERK,
4
WILFRIED THUILLER,
5
,
6
CARSTEN RAHBEK
1
,
7
& STEVEN L. CHOWN
2
1
Zoological Museum, and
7
Center for Macroecology, Institute of Biology, University of Copenhagen, Universitetsparken 15, 2100 København Ø, Denmark
2
DST-NRF Centre for Invasion Biology, Department of Botany & Zoology, and
4
Department of Geography & Environmental Studies, University of Stellenbosch, Private Bag X1, Matieland 7602, South Africa
3
The Royal Society for the Protection of Birds, The Lodge, Sandy, Bedfordshire SG19 2DL, UK
5
Climate Change Research Group, Ecology and Conservation, Kirstenbosch Research Center, National Biodiversity Institute, P/Bag X7 Claremont 7735, Cape Town, South Africa
6
Laboratoire d’Ecologie Alpine, UMR CNRS 5553, Université J. Fourier, BP 53, 38041 Grenoble Cedex 9, France
The Aquatic Warbler
Acrocephalus paludicola
is one of the most threatened Western Palearcticpasserine species, classified as globally Vulnerable. With its breeding grounds relativelysecure, a clear need remains for the monitoring and protection of the migration andwintering grounds of this rare and endangered migrant. Recent research has shown that theAquatic Warbler migrates through northwest Africa in autumn and spring. The winteringgrounds are apparently limited to wetlands of sub-Saharan West Africa, with records fromonly about 20 localities in Mauritania, Mali, Senegal and Ghana. Given the lack of knowledgeof its whereabouts, we decided to use the available data to predict the wintering distributionof the Aquatic Warbler with the help of Geographic Information Systems (GIS). We useda novel approach to model the distribution of rarely recorded species, which is based on acombination of presence-only and presence–absence modelling techniques. Using theprogram BIOMOD, we thus generated four progressively more conservative predictions ofwhere the Aquatic Warbler overwinters in Africa. Whereas the most permissive modelpredicts the Aquatic Warbler to be found in a latitudinal band stretching from the Senegalriver delta all the way to the Red Sea coast, the most restrictive model suggests a muchsmaller area concentrated within the regions around the Senegal river delta in northernSenegal and southern Mauritania and around the Niger inundation zone in southern Maliand eastern Burkina Faso. Such model predictions may be useful guidelines to focus furtherfield research on the Aquatic Warbler. Given the excellent model predictions in this study,this novel technique may prove useful to model the distribution of other rare and endangeredspecies, thus providing a means to guide future survey efforts.
The conservation of migratory bird species posesparticular problems associated with their annualmovements, which often span continents, becausespecies survival is dependent on the conservation notonly of breeding grounds, but also of stop-over sites
and wintering grounds (Salathé 1991, Crick & Jones1992, Bibby 2003). For the
c
. 340 species of birdbreeding in the Palearctic region that migrate toAfrican wintering grounds (Moreau 1972, Curry-Lindahl 1981), the breeding grounds and principalmigration routes through Europe and the Medi-terranean are reasonably well known (Cramp 1998,Glutz von Blotzheim 2001). However, knowledge ofthe distribution of these migrants in their African
*Corresponding author. Email: [email protected]
702
B. A. Walther
et al.
© 2007 The Authors Journal compilation © 2007 British Ornithologists’ Union
wintering grounds is still fragmentary (Walther &Rahbek 2002, Wisz
et al
. in press). For many species,knowledge of distribution may be as superficial as‘occurs in eastern Africa’ or the necessarily over-simplified range maps in the otherwise impressive
Birds of Africa
series (Brown
et al
. 1982, Urban
et al
.1986, 1997, Fry
et al
. 1988, 2000, Keith
et al
. 1992,Fry & Keith 2004). Such information lacks the spatialresolution for thorough scientific analyses and con-servation management.
In an effort to collate information on migrants, adatabase on the geographical distribution of WesternPalearctic migratory birds in Africa has been estab-lished (Walther & Rahbek 2006). The information inthis database aims to enhance our understanding ofthe whereabouts of migrants in Africa and improvethe grounds on which conservation decisions arebased (Walther & Rahbek 2002). One of the resultsof this work was a study of the African migrationand wintering grounds of the Aquatic Warbler
Acro-cephalus paludicola
(Schäffer
et al
. 2006), one of themost threatened Western Palearctic passerine speciesclassified as globally Vulnerable by BirdLife Inter-national (2004).
Only a century ago, the Aquatic Warbler was awidespread species in Europe, but the massivedestruction of its breeding habitat during the 20thcentury brought this species to the brink of globalextinction (Aquatic Warbler Conservation Team1999). The breeding habitats of the Aquatic Warblerare lowland marshes (mostly large open sedge and
Cladium
fen mires with water less than 10 cm deep),which have declined dramatically during the lastfew decades, resulting in a highly fragmented rangeincluding Germany, Hungary, Poland, Lithuania,Russia, Ukraine and Belarus, with approximately13 500–21 000 singing males remaining (AquaticWarbler Conservation Team 1999, BirdLife Interna-tional 2004). Although the recent protection of keybreeding sites has relieved some of the pressure, afundamental threat to the survival of this habitatspecialist could still lie in the wintering sites andpotentially outweigh the conservation success in thebreeding sites (Convention on Migratory Species2003).
To reach their wintering grounds, the AquaticWarbler migrates along the Baltic and North Seacoasts and then heads south along the Europeanand African Atlantic coasts to arrive in sub-SaharanWest Africa in September and October (Mester1967, Wawrzyniak & Sohns 1977, de By 1990,Schulze-Hagen 1993, Cramp 1998, Aquatic Warbler
Conservation Team 1999, Atienza
et al
. 2001, Glutzvon Blotzheim 2001, Julliard
et al
. 2006, Schäffer
et al
. 2006). However, only about 20 sub-Saharanlocalities for wintering Aquatic Warblers have so farbeen documented, probably because of low samplingintensity (Schäffer
et al
. 2006).Because of this lack of knowledge of the where-
abouts of wintering Aquatic Warblers, Pain
et al
.(2004) studied the stable isotopes found in theirmoult feathers. The results suggest that more easterlybreeding populations (e.g. from Belarus) leapfrogmore westerly breeding populations (e.g. fromPoland) in their wintering grounds and may some-times winter as far south as 5
°
N in countries such asThe Gambia, Guinea-Bissau, Guinea, Sierra Leone,Liberia, Ivory Coast, Ghana, Togo and Benin. As theresults from this isotope study suggest that AquaticWarblers may migrate considerably further souththan the documented records for West Africa(Schäffer
et al
. 2006), we investigated whether wecould resolve this apparent contradiction with thehelp of climate envelope models based on GeographicInformation Systems (GIS) techniques that use theknown localities of the Aquatic Warbler to model itspotential winter distribution. Such model predic-tions may provide useful guidelines to focus furtherfield research on this species.
Two types of analytical models are commonly usedto predict species distributions: so-called deductiveand inductive models (Corsi
et al
. 2000, Guisan &Zimmermann 2000, Scott
et al
. 2002, Guisan &Thuiller 2005). In this study, we exclusively useinductive models that use known localities to derivea species’ environmental preferences. These are thenused to predict other suitable areas, which mayinclude areas occupied by the species and areas notoccupied by the species even though they are suitable.Distributional maps based on inductive modelsmay thus ‘overpredict’ the actual range because theyinclude not just the realized, but also the potential,distribution of the species, thereby ignoring historicaland biogeographical influences as well as speciesinteractions (Engler
et al
. 2004). Therefore, positivepredictions for regions in which the species has actuallynever been recorded may be cut from the overallprediction to render a more realistic distributionmap (e.g. Walther
et al
. 2004, Wisz
et al
. in press).Another problem with modelling the distribution of
rare and elusive species such as the Aquatic Warblerin an under-sampled region such as West Africa isthat we cannot put much faith in absence records.However, many of the most powerful distribution
© 2007 The AuthorsJournal compilation © 2007 British Ornithologists’ Union
Winter distribution of Aquatic Warbler
703
modelling techniques require presence as well asabsence records (e.g. Guisan & Zimmermann 2000,Zaniewski
et al
. 2002, Thuiller 2003, Brotons
et al
.2004, Guisan & Thuiller 2005, Elith
et al
. 2006).Therefore, we here use a relatively novel combinationof presence-only and presence–absence modellingtechniques that relies on generating randomly placedpseudo-absences outside of the area predicted to beoccupied by the presence-only model, thus com-bining the strength of both techniques to model thedistribution of a rarely recorded species (Engler
et al
.2004). To our knowledge, this is the first applicationof this technique for a bird species.
Results of modelling techniques are also influencedby the bioclimatic variables used to model a speciesdistribution. We chose six bioclimatic variables whichreflect primary qualities of climate that, on the basisof prior knowledge, have known roles in imposingconstraints upon species distributions as a result ofwell-understood and quite general physiologicalmechanisms (e.g. Woodward 1987, 1990, Whittaker
et al
. 2001), and are, for these reasons, widely andsuccessfully used when modelling species distributions(Huntley
et al
. 2004, Pearson
et al
. 2004, Thuiller
et al
. 2004a, 2004b, Huntley
et al
. 2006). We alsochose one variable representing anthropogenic landtransformation because this has been implicatedin the habitat choice of Palearctic migrants inAfrica, with both positive and negative effects onpopulations (Elgood
et al
. 1966, Moreau 1972, Curry-Lindahl 1981, Ledant 1986, Gatter & Mattes 1987,Jones
et al
. 1996, Vickery
et al
. 1999).
METHODS
Data acquisition
Data acquisition of Aquatic Warbler records isdescribed in detail in Schäffer
et al
. (2006), and theappendix in Schäffer
et al
. (2006) presents all data,including details of suspicious records that wereexcluded from our analyses here for reasons statedtherein. Briefly, we used the following sources ofinformation: (1) direct contacting of numerous fieldornithologists, organizations (e.g. BirdLife Partners),ringing schemes (e.g. EURING, AFRING) and naturalhistory museums requesting data and references;and (2) a literature and internet search. Each recordof the Aquatic Warbler was entered into an MS-ACCESS database containing information on number,age and sex of individuals observed, as well as dataon habitat, date and locality. The geographical
coordinates of each locality were established asfollows: if the source did not provide coordinates, weconsulted the
Times Atlas
(Bartholomew 1956, Anon.2001), various printed gazetteers or the internet-based gazetteer of the National Geospatial-IntelligenceAgency (2005). If these gazetteers provided moreaccurate coordinates than those given in the originalsources, the coordinates provided by the originalsources were corrected.
Climate data
Climate data for each locality at which the AquaticWarbler was recorded were generated by DIVA-GIS,Version 5 (Hijmans
et al
. 2005), using the Climate/Extract function, which assigns environmental andclimatic data to localities using DIVA’s defaultclimate dataset generated from global climate layersprovided by New
et al
. (2002).
Environmental data layers
Inductive models of potential species distributionsrequire that the chosen bioclimatic variables berepresented as environmental data layers thatcontain the values of environmental variables forthe study area. For our layers, we chose to dividethe African continent into grid cells of 10-minuteresolution (10
′
×
10
′
). Each data layer was generatedat the same resolution and overlaid perfectly withthe other layers (i.e. had the same extent andborders). Seven data layers were developed, six forclimate and one for land transformation.
The CRU CL 2.0 dataset (New
et al
. 2002) at aresolution of 10
′ ×
10
′
was chosen to represent currentclimate (generated from climate data averages span-ning the years 1961–90). We used six uncorrelatedbioclimatic variables (selected after cross-correlationevaluation from principal component analysis)representing the major climatic gradients in Africa,namely: mean annual potential evapotranspiration,annual growing-degree days, minimum temperatureof the coldest month, maximum temperature of thewarmest month, mean annual temperature and totalannual precipitation. Potential evapotranspirationestimates were calculated using the FAO 56 PenmanMonteith combination equation (Allen
et al
. 1998).Data on land transformation were resampled
from the 0.5
′
resolution ‘Human Footprint’ dataset(Sanderson
et al
. 2002) to the required resolution of10
′
×
10
′
. The Human Footprint measures human-induced land transformation using four data types
704
B. A. Walther
et al.
© 2007 The Authors Journal compilation © 2007 British Ornithologists’ Union
as proxies for human influence: population density,land transformation, accessibility and electricalpower infrastructure. Data values range from 0 to 1,corresponding, respectively, to completely naturalhabitat or completely transformed (and thus mostlyinadequate) habitat for wildlife.
Modelling species distribution
We modelled the Aquatic Warbler’s winter distributionusing BIOMOD (Thuiller 2003, 2004, 2006) andthe environmental layers described above. BIOMODaims to maximize the predictive accuracy of speciesdistributions using different types of statisticalmodelling techniques. For each species, it computespredictions using the following models: artificialneural networks (ANN; Moisen & Frescino 2002,Luoto & Hjort 2005), classification tree analysis(CTA; De’Ath & Fabricius 2000, Thuiller
et al
.2003b), generalized additive models (GAM; Guisan& Zimmermann 2000, Thuiller
et al
. 2003a, Guisan& Thuiller 2005, Elith
et al
. 2006), generalized linearmodels (GLM; Guisan & Zimmermann 2000, Thuiller
et al
. 2003a, Guisan & Thuiller 2005, Elith
et al
.2006), multiple adaptive regression splines (MARS;Moisen & Frescino 2002, Luoto & Hjort 2005, Elith
et al
. 2006), mixture discriminant analysis (MDA;Manel
et al
. 1999a), Breiman and Cutler’s randomforests for classification and regression (Random-Forest; Elith
et al
. 2006, Prasad
et al
. 2006), andsurface range envelope (SRE), the last of these beingessentially equivalent to the well-known BIOCLIMalgorithm (Busby 1991, Beaumont
et al
. 2005). SREidentifies minimum and maximum values for eachenvironmental variable from the localities where thespecies is present, and the predicted distributionthen includes any site with all variables falling be-tween these minimum and maximum limits. WhileSRE only requires presence data, all other modelsrequire presence–absence data.
Once each model has been applied to the environ-mental data and the predicted distribution has beencalculated, BIOMOD compares the performance ofeach model and chooses the best performing one byusing two evaluation techniques, the kappa statisticand the area under the curve (AUC) of the receiver-operating characteristic (ROC) plot (Fielding & Bell1997, Cumming 2000, Pearce & Ferrier 2000,Thuiller 2006). In this study, we exclusively used theAUC score because, unlike the kappa statistic, it isnot dependent on a probability threshold whichdifferentiates between a site predicted to be occupied
and a site predicted to be unoccupied (Pearce &Ferrier 2000, Manel
et al
. 2001, McPherson
et al
.2004, Elith
et al
. 2006). The AUC score is calculatedwith the help of two other measures of model per-formance: sensitivity and specificity (Fielding & Bell1997, Pepe 2000). Sensitivity is the ratio of positivesites (presence) correctly predicted over the totalnumber of positive sites in the sample, while specifi-city is the ratio of negatives sites (absence) correctlypredicted over the total number of negative sites inthe sample. The ROC curve is then obtained byplotting sensitivity vs. (1
−
specificity) for a range ofprobability thresholds. A 45
°
line signifies a modelthat is no better than one generated by chance, whileany curve above the 45
°
line signifies a model that isbetter than one generated by chance. Thus, goodmodel performance is characterized by a curve thatmaximizes sensitivity for low values of (1
−
specificity),i.e. when the curve passes close to the upper leftcorner of the ROC plot (e.g. Fielding & Bell 1997,Pepe 2000).
Below we describe our modelling procedure stepby step. Step one was to run the SRE model with thepresence-only data (i.e. the presence localities wherethe Aquatic Warbler had been observed). Because it iswidely acknowledged that presence-only modellingtechniques often overpredict species distributions(Brotons
et al
. 2004, Engler
et al
. 2004, Elith
et al
.2006), the second step was to restrict the SREprediction to the West African region where theAquatic Warbler has actually been recorded (similarto the procedure used in Walther
et al
. (2004) andWisz
et al
. in press) in which ecoregions were used torestrict the overprediction). Four more steps werethen added to the procedure presented in Walther
et al
. (2004) and Wisz
et al
. (in press). In step three,20 pseudo-absences were randomly placed insidethe African mainland, but outside the restricted SREprediction generated in the second step (using anArcview GIS 3.3 script). We chose a balanced designof 20 presences and 20 pseudo-absences because theperformance of AUC scores is best at intermediatesampling prevalence, i.e. the proportion of datapoints that are presences (McPherson
et al
. 2004).The fourth step was to run all models provided byBIOMOD on both the presence and the pseudo-absence data. In step five, the best of the eightgenerated model predictions was chosen, as indicatedby the highest AUC score for the evaluation dataset,i.e. the 30% of the initial dataset not used to calibrateeach model but used to evaluate the performanceof each model (Thuiller 2004, 2006). In step six,
© 2007 The AuthorsJournal compilation © 2007 British Ornithologists’ Union
Winter distribution of Aquatic Warbler
705
the best prediction was used within the restrictedSRE prediction generated in the second step, thuscombining the results from the presence-only modelwith the results from the best model chosen by usingthe presence/pseudo-absence data.
To consider the possible influence of outliers inthe environmental data, we re-ran steps four to sixbut removed one presence locality in turn for eachmodel run, resulting in 20 new models for which wecould observe the change in performance due toeach locality by observing an increase or decrease inthe AUC score.
RESULTS
Known migration and wintering records of the Aquatic Warbler
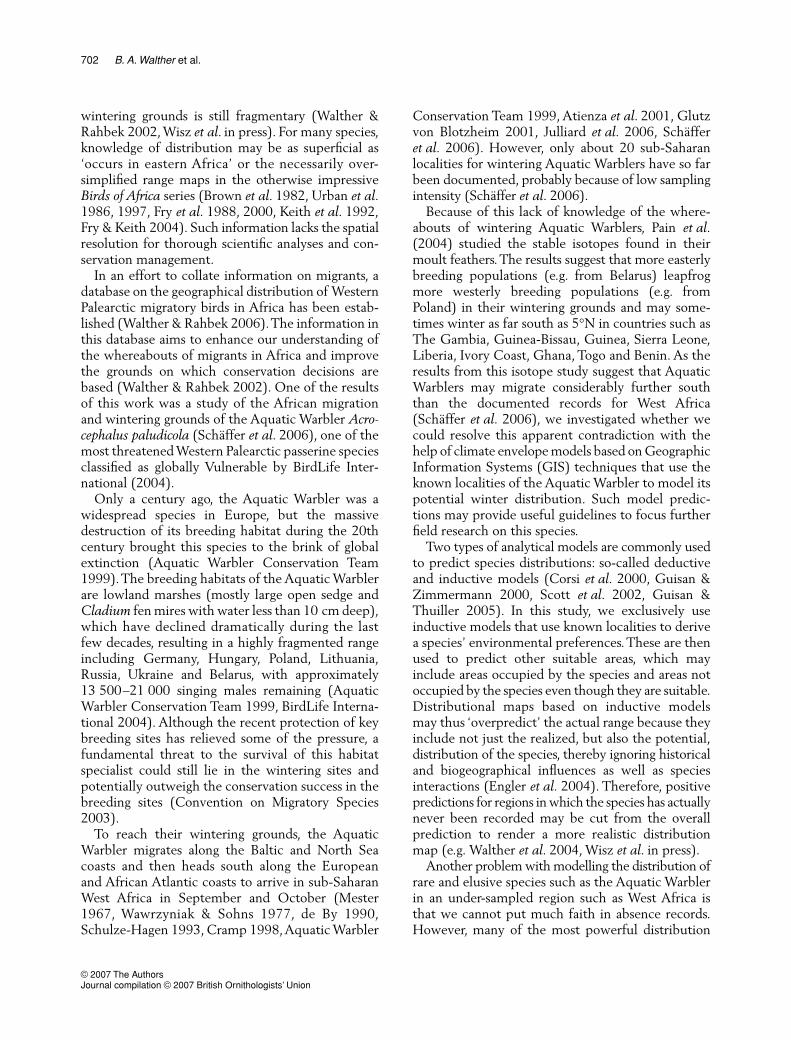
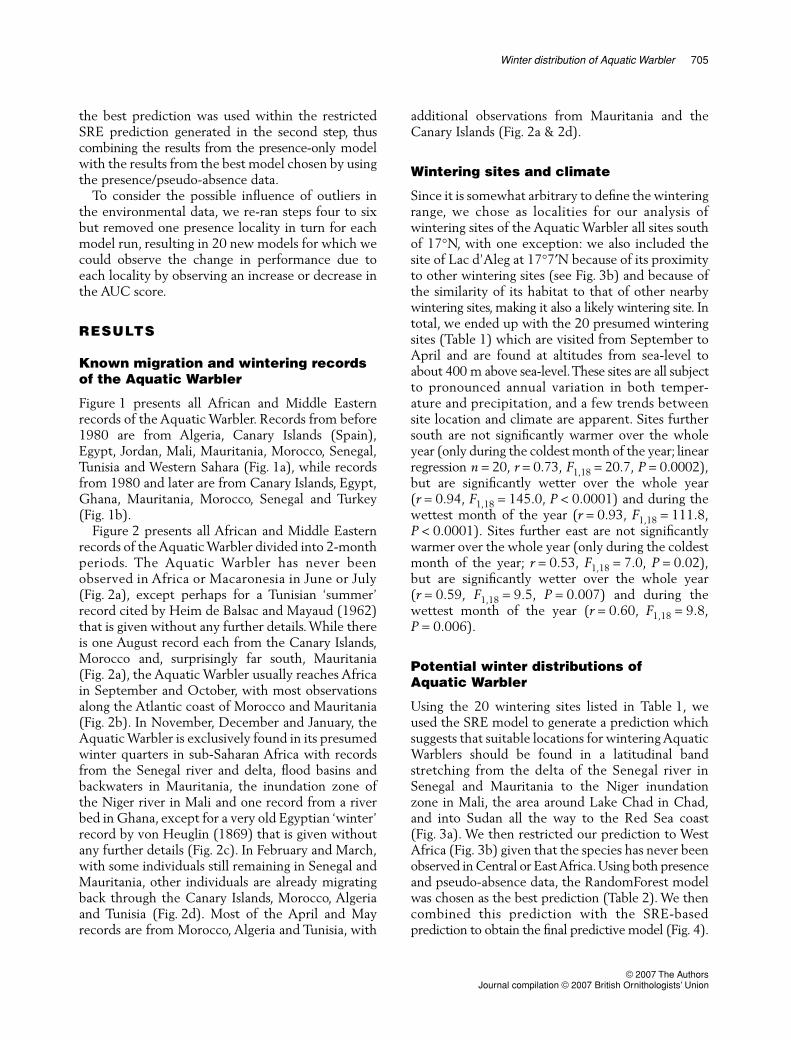
Figure 1 presents all African and Middle Easternrecords of the Aquatic Warbler. Records from before1980 are from Algeria, Canary Islands (Spain),Egypt, Jordan, Mali, Mauritania, Morocco, Senegal,Tunisia and Western Sahara (Fig. 1a), while recordsfrom 1980 and later are from Canary Islands, Egypt,Ghana, Mauritania, Morocco, Senegal and Turkey(Fig. 1b).
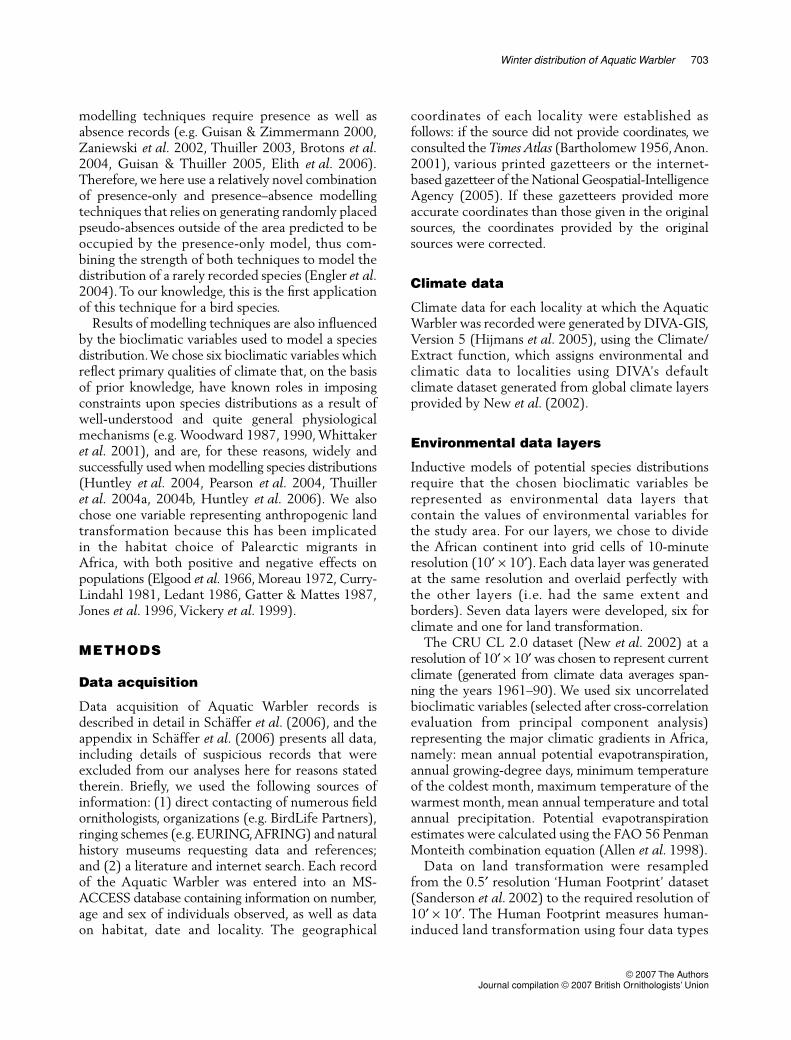
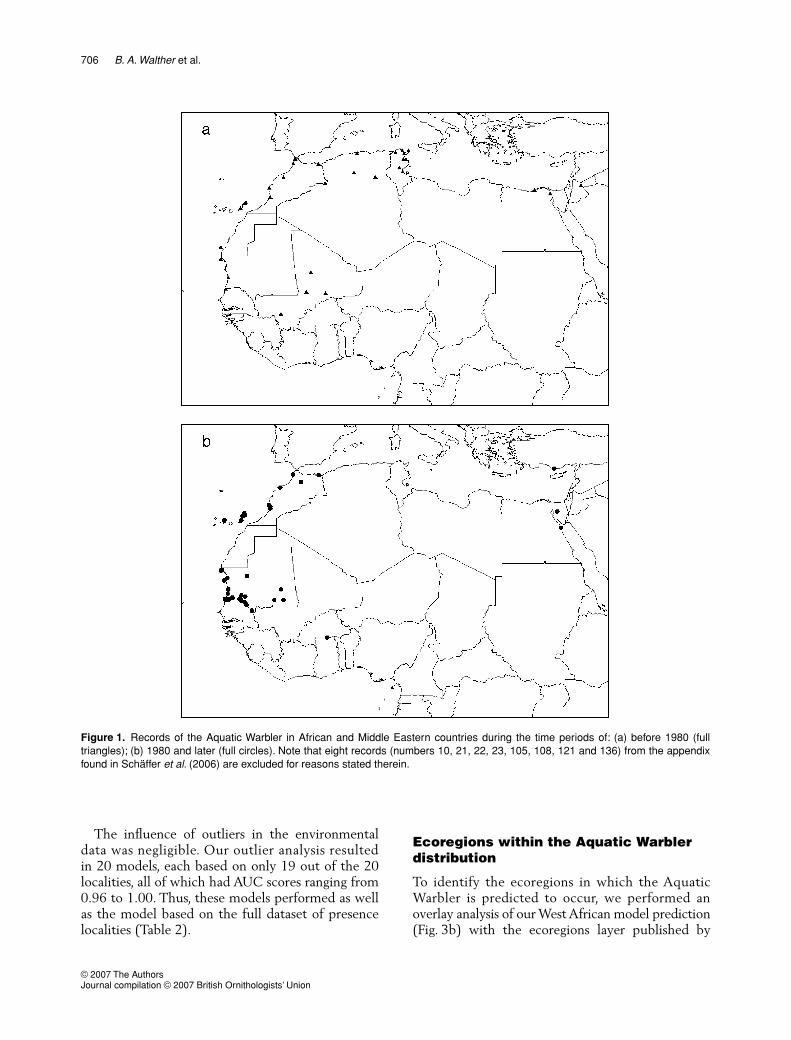
Figure 2 presents all African and Middle Easternrecords of the Aquatic Warbler divided into 2-monthperiods. The Aquatic Warbler has never beenobserved in Africa or Macaronesia in June or July(Fig. 2a), except perhaps for a Tunisian ‘summer’record cited by Heim de Balsac and Mayaud (1962)that is given without any further details. While thereis one August record each from the Canary Islands,Morocco and, surprisingly far south, Mauritania(Fig. 2a), the Aquatic Warbler usually reaches Africain September and October, with most observationsalong the Atlantic coast of Morocco and Mauritania(Fig. 2b). In November, December and January, theAquatic Warbler is exclusively found in its presumedwinter quarters in sub-Saharan Africa with recordsfrom the Senegal river and delta, flood basins andbackwaters in Mauritania, the inundation zone ofthe Niger river in Mali and one record from a riverbed in Ghana, except for a very old Egyptian ‘winter’record by von Heuglin (1869) that is given withoutany further details (Fig. 2c). In February and March,with some individuals still remaining in Senegal andMauritania, other individuals are already migratingback through the Canary Islands, Morocco, Algeriaand Tunisia (Fig. 2d). Most of the April and Mayrecords are from Morocco, Algeria and Tunisia, with
additional observations from Mauritania and theCanary Islands (Fig. 2a & 2d).
Wintering sites and climate
Since it is somewhat arbitrary to define the winteringrange, we chose as localities for our analysis ofwintering sites of the Aquatic Warbler all sites southof 17
°
N, with one exception: we also included thesite of Lac d’Aleg at 17°7′N because of its proximityto other wintering sites (see Fig. 3b) and because ofthe similarity of its habitat to that of other nearbywintering sites, making it also a likely wintering site. Intotal, we ended up with the 20 presumed winteringsites (Table 1) which are visited from September toApril and are found at altitudes from sea-level toabout 400 m above sea-level. These sites are all subjectto pronounced annual variation in both temper-ature and precipitation, and a few trends betweensite location and climate are apparent. Sites furthersouth are not significantly warmer over the wholeyear (only during the coldest month of the year; linearregression n = 20, r = 0.73, F1,18 = 20.7, P = 0.0002),but are significantly wetter over the whole year(r = 0.94, F1,18 = 145.0, P < 0.0001) and during thewettest month of the year (r = 0.93, F1,18 = 111.8,P < 0.0001). Sites further east are not significantlywarmer over the whole year (only during the coldestmonth of the year; r = 0.53, F1,18 = 7.0, P = 0.02),but are significantly wetter over the whole year(r = 0.59, F1,18 = 9.5, P = 0.007) and during thewettest month of the year (r = 0.60, F1,18 = 9.8,P = 0.006).
Potential winter distributions of Aquatic Warbler
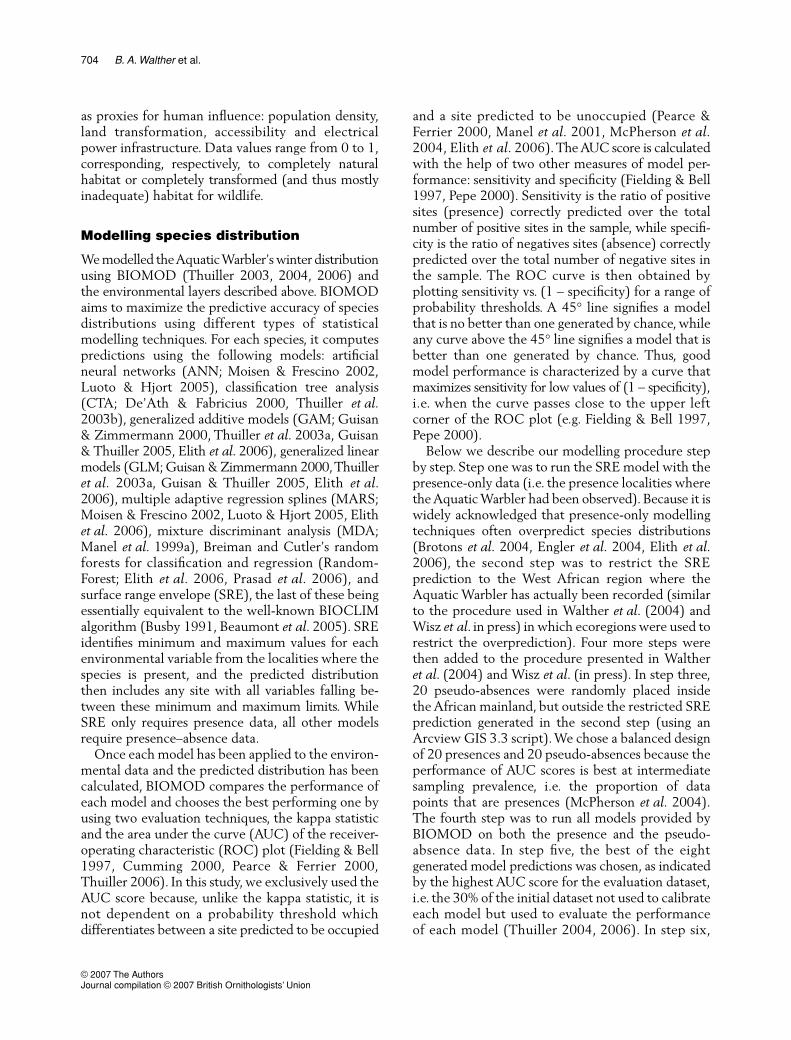
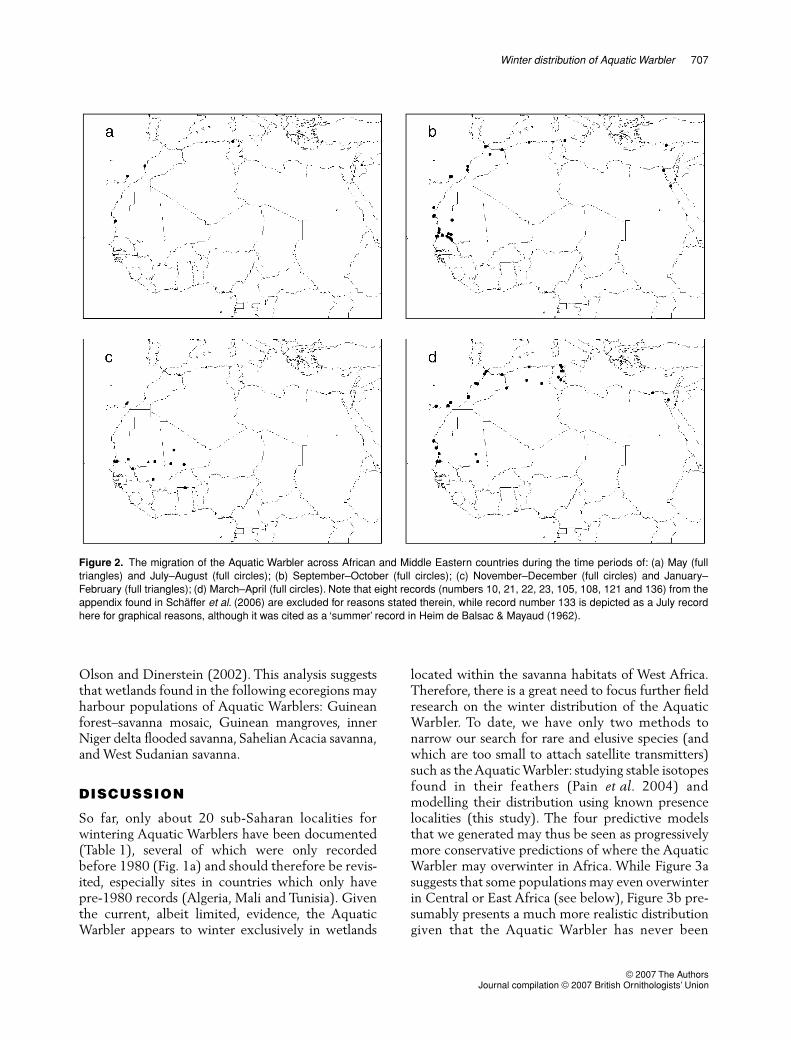
Using the 20 wintering sites listed in Table 1, weused the SRE model to generate a prediction whichsuggests that suitable locations for wintering AquaticWarblers should be found in a latitudinal bandstretching from the delta of the Senegal river inSenegal and Mauritania to the Niger inundationzone in Mali, the area around Lake Chad in Chad,and into Sudan all the way to the Red Sea coast(Fig. 3a). We then restricted our prediction to WestAfrica (Fig. 3b) given that the species has never beenobserved in Central or East Africa. Using both presenceand pseudo-absence data, the RandomForest modelwas chosen as the best prediction (Table 2). We thencombined this prediction with the SRE-basedprediction to obtain the final predictive model (Fig. 4).
706 B. A. Walther et al.
© 2007 The Authors Journal compilation © 2007 British Ornithologists’ Union
The influence of outliers in the environmentaldata was negligible. Our outlier analysis resultedin 20 models, each based on only 19 out of the 20localities, all of which had AUC scores ranging from0.96 to 1.00. Thus, these models performed as wellas the model based on the full dataset of presencelocalities (Table 2).
Ecoregions within the Aquatic Warbler distribution
To identify the ecoregions in which the AquaticWarbler is predicted to occur, we performed anoverlay analysis of our West African model prediction(Fig. 3b) with the ecoregions layer published by
Figure 1. Records of the Aquatic Warbler in African and Middle Eastern countries during the time periods of: (a) before 1980 (fulltriangles); (b) 1980 and later (full circles). Note that eight records (numbers 10, 21, 22, 23, 105, 108, 121 and 136) from the appendixfound in Schäffer et al. (2006) are excluded for reasons stated therein.
© 2007 The AuthorsJournal compilation © 2007 British Ornithologists’ Union
Winter distribution of Aquatic Warbler 707
Olson and Dinerstein (2002). This analysis suggeststhat wetlands found in the following ecoregions mayharbour populations of Aquatic Warblers: Guineanforest–savanna mosaic, Guinean mangroves, innerNiger delta flooded savanna, Sahelian Acacia savanna,and West Sudanian savanna.
DISCUSSION
So far, only about 20 sub-Saharan localities forwintering Aquatic Warblers have been documented(Table 1), several of which were only recordedbefore 1980 (Fig. 1a) and should therefore be revis-ited, especially sites in countries which only havepre-1980 records (Algeria, Mali and Tunisia). Giventhe current, albeit limited, evidence, the AquaticWarbler appears to winter exclusively in wetlands
located within the savanna habitats of West Africa.Therefore, there is a great need to focus further fieldresearch on the winter distribution of the AquaticWarbler. To date, we have only two methods tonarrow our search for rare and elusive species (andwhich are too small to attach satellite transmitters)such as the Aquatic Warbler: studying stable isotopesfound in their feathers (Pain et al. 2004) andmodelling their distribution using known presencelocalities (this study). The four predictive modelsthat we generated may thus be seen as progressivelymore conservative predictions of where the AquaticWarbler may overwinter in Africa. While Figure 3asuggests that some populations may even overwinterin Central or East Africa (see below), Figure 3b pre-sumably presents a much more realistic distributiongiven that the Aquatic Warbler has never been
Figure 2. The migration of the Aquatic Warbler across African and Middle Eastern countries during the time periods of: (a) May (fulltriangles) and July–August (full circles); (b) September–October (full circles); (c) November–December (full circles) and January–February (full triangles); (d) March–April (full circles). Note that eight records (numbers 10, 21, 22, 23, 105, 108, 121 and 136) from theappendix found in Schäffer et al. (2006) are excluded for reasons stated therein, while record number 133 is depicted as a July recordhere for graphical reasons, although it was cited as a ‘summer’ record in Heim de Balsac & Mayaud (1962).
708 B. A. Walther et al.
© 2007 The Authors Journal compilation © 2007 British Ornithologists’ Union
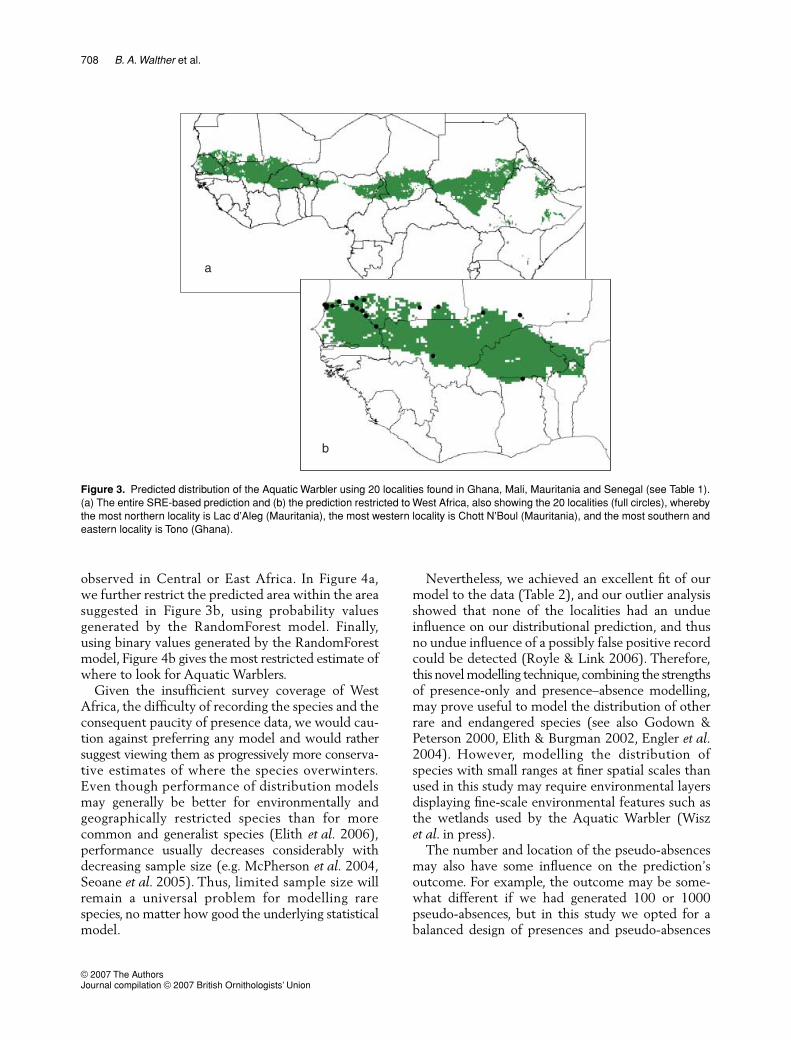
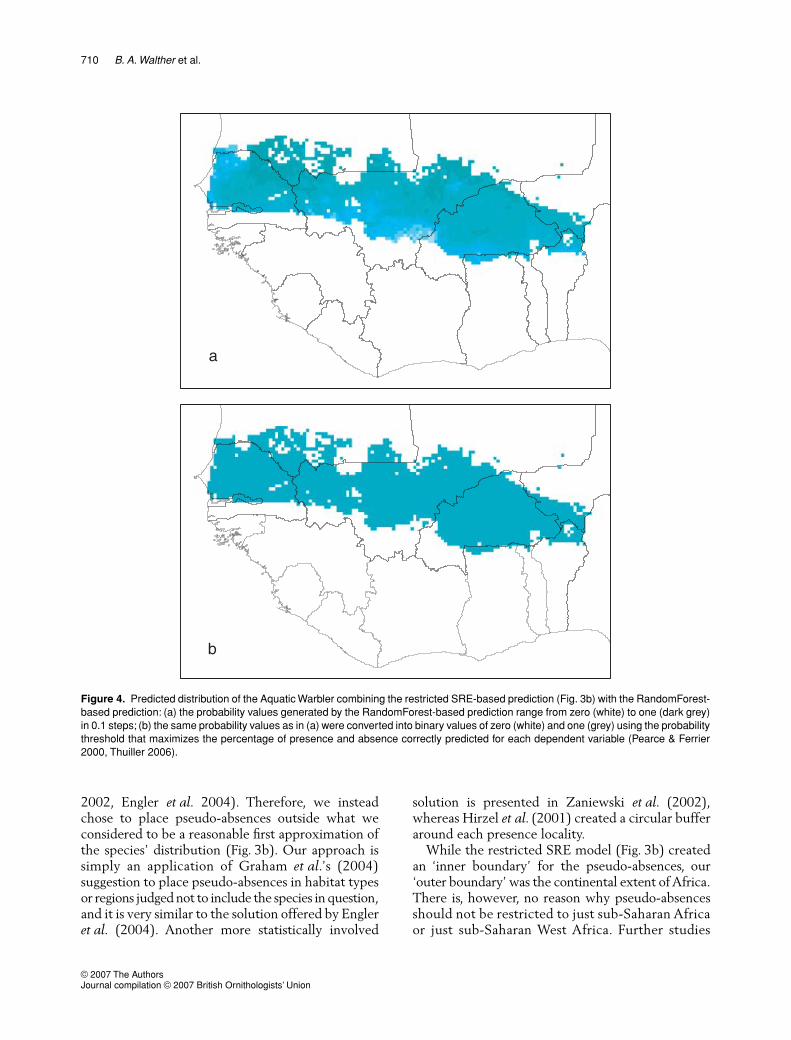
observed in Central or East Africa. In Figure 4a,we further restrict the predicted area within the areasuggested in Figure 3b, using probability valuesgenerated by the RandomForest model. Finally,using binary values generated by the RandomForestmodel, Figure 4b gives the most restricted estimate ofwhere to look for Aquatic Warblers.
Given the insufficient survey coverage of WestAfrica, the difficulty of recording the species and theconsequent paucity of presence data, we would cau-tion against preferring any model and would rathersuggest viewing them as progressively more conserva-tive estimates of where the species overwinters.Even though performance of distribution modelsmay generally be better for environmentally andgeographically restricted species than for morecommon and generalist species (Elith et al. 2006),performance usually decreases considerably withdecreasing sample size (e.g. McPherson et al. 2004,Seoane et al. 2005). Thus, limited sample size willremain a universal problem for modelling rarespecies, no matter how good the underlying statisticalmodel.
Nevertheless, we achieved an excellent fit of ourmodel to the data (Table 2), and our outlier analysisshowed that none of the localities had an undueinfluence on our distributional prediction, and thusno undue influence of a possibly false positive recordcould be detected (Royle & Link 2006). Therefore,this novel modelling technique, combining the strengthsof presence-only and presence–absence modelling,may prove useful to model the distribution of otherrare and endangered species (see also Godown &Peterson 2000, Elith & Burgman 2002, Engler et al.2004). However, modelling the distribution ofspecies with small ranges at finer spatial scales thanused in this study may require environmental layersdisplaying fine-scale environmental features such asthe wetlands used by the Aquatic Warbler (Wiszet al. in press).
The number and location of the pseudo-absencesmay also have some influence on the prediction’soutcome. For example, the outcome may be some-what different if we had generated 100 or 1000pseudo-absences, but in this study we opted for abalanced design of presences and pseudo-absences
Figure 3. Predicted distribution of the Aquatic Warbler using 20 localities found in Ghana, Mali, Mauritania and Senegal (see Table 1).(a) The entire SRE-based prediction and (b) the prediction restricted to West Africa, also showing the 20 localities (full circles), wherebythe most northern locality is Lac d’Aleg (Mauritania), the most western locality is Chott N’Boul (Mauritania), and the most southern andeastern locality is Tono (Ghana).
© 2007 The AuthorsJournal compilation © 2007 British Ornithologists’ Union
Winter distribution of Aquatic Warbler 709
because McPherson et al. (2004) clearly showed thatintermediate sampling prevalence results in the bestpredictive model (see also Fielding & Haworth 1995,Manel et al. 1999b, Cumming 2000, Olden et al.2002). Another option is to generate many morepseudo-absences than presences and then to down-weight each pseudo-absence in the statistical modelto emulate an equal number of presences andpseudo-absences (Ferrier et al. 2002).
There are also several options for placing pseudo-absences. The simplest approach is to place pseudo-absences randomly at any site, even on or adjacent topresence localities (Ferrier et al. 2002, Zaniewskiet al. 2002, Engler et al. 2004, Elith et al. 2006).Such placement of pseudo-absences will almostcertainly include some presence localities (bothrecorded and unrecorded), which may lead todecreased model performance, especially for specieswith few recorded presence localities (Boyce et al.
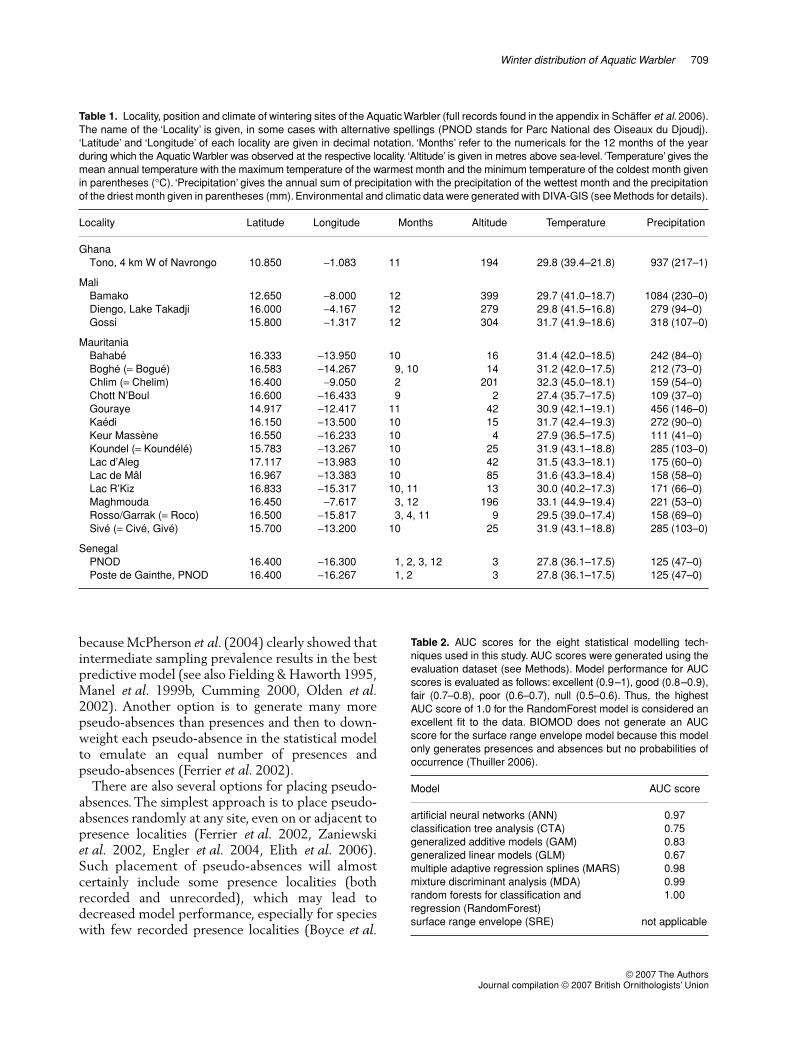
Table 1. Locality, position and climate of wintering sites of the Aquatic Warbler (full records found in the appendix in Schäffer et al. 2006).The name of the ‘Locality’ is given, in some cases with alternative spellings (PNOD stands for Parc National des Oiseaux du Djoudj).‘Latitude’ and ‘Longitude’ of each locality are given in decimal notation. ‘Months’ refer to the numericals for the 12 months of the yearduring which the Aquatic Warbler was observed at the respective locality. ‘Altitude’ is given in metres above sea-level. ‘Temperature’ gives themean annual temperature with the maximum temperature of the warmest month and the minimum temperature of the coldest month givenin parentheses (°C). ‘Precipitation’ gives the annual sum of precipitation with the precipitation of the wettest month and the precipitationof the driest month given in parentheses (mm). Environmental and climatic data were generated with DIVA-GIS (see Methods for details).
Locality Latitude Longitude Months Altitude Temperature Precipitation
GhanaTono, 4 km W of Navrongo 10.850 −1.083 11 194 29.8 (39.4–21.8) 937 (217–1)
MaliBamako 12.650 −8.000 12 399 29.7 (41.0–18.7) 1084 (230–0)Diengo, Lake Takadji 16.000 −4.167 12 279 29.8 (41.5–16.8) 279 (94–0)Gossi 15.800 −1.317 12 304 31.7 (41.9–18.6) 318 (107–0)
MauritaniaBahabé 16.333 −13.950 10 16 31.4 (42.0–18.5) 242 (84–0)Boghé (= Bogué) 16.583 −14.267 9, 10 14 31.2 (42.0–17.5) 212 (73–0)Chlim (= Chelim) 16.400 −9.050 2 201 32.3 (45.0–18.1) 159 (54–0)Chott N’Boul 16.600 −16.433 9 2 27.4 (35.7–17.5) 109 (37–0)Gouraye 14.917 −12.417 11 42 30.9 (42.1–19.1) 456 (146–0)Kaédi 16.150 −13.500 10 15 31.7 (42.4–19.3) 272 (90–0)Keur Massène 16.550 −16.233 10 4 27.9 (36.5–17.5) 111 (41–0)Koundel (= Koundélé) 15.783 −13.267 10 25 31.9 (43.1–18.8) 285 (103–0)Lac d’Aleg 17.117 −13.983 10 42 31.5 (43.3–18.1) 175 (60–0)Lac de Mâl 16.967 −13.383 10 85 31.6 (43.3–18.4) 158 (58–0)Lac R’Kiz 16.833 −15.317 10, 11 13 30.0 (40.2–17.3) 171 (66–0)Maghmouda 16.450 −7.617 3, 12 196 33.1 (44.9–19.4) 221 (53–0)Rosso/Garrak (= Roco) 16.500 −15.817 3, 4, 11 9 29.5 (39.0–17.4) 158 (69–0)Sivé (= Civé, Givé) 15.700 −13.200 10 25 31.9 (43.1–18.8) 285 (103–0)
SenegalPNOD 16.400 −16.300 1, 2, 3, 12 3 27.8 (36.1–17.5) 125 (47–0)Poste de Gainthe, PNOD 16.400 −16.267 1, 2 3 27.8 (36.1–17.5) 125 (47–0)
Table 2. AUC scores for the eight statistical modelling tech-niques used in this study. AUC scores were generated using theevaluation dataset (see Methods). Model performance for AUCscores is evaluated as follows: excellent (0.9–1), good (0.8–0.9),fair (0.7–0.8), poor (0.6–0.7), null (0.5–0.6). Thus, the highestAUC score of 1.0 for the RandomForest model is considered anexcellent fit to the data. BIOMOD does not generate an AUCscore for the surface range envelope model because this modelonly generates presences and absences but no probabilities ofoccurrence (Thuiller 2006).
Model AUC score
artificial neural networks (ANN) 0.97classification tree analysis (CTA) 0.75generalized additive models (GAM) 0.83generalized linear models (GLM) 0.67multiple adaptive regression splines (MARS) 0.98mixture discriminant analysis (MDA) 0.99random forests for classification and 1.00regression (RandomForest)surface range envelope (SRE) not applicable
710 B. A. Walther et al.
© 2007 The Authors Journal compilation © 2007 British Ornithologists’ Union
2002, Engler et al. 2004). Therefore, we insteadchose to place pseudo-absences outside what weconsidered to be a reasonable first approximation ofthe species’ distribution (Fig. 3b). Our approach issimply an application of Graham et al.’s (2004)suggestion to place pseudo-absences in habitat typesor regions judged not to include the species in question,and it is very similar to the solution offered by Engleret al. (2004). Another more statistically involved
solution is presented in Zaniewski et al. (2002),whereas Hirzel et al. (2001) created a circular bufferaround each presence locality.
While the restricted SRE model (Fig. 3b) createdan ‘inner boundary’ for the pseudo-absences, our‘outer boundary’ was the continental extent of Africa.There is, however, no reason why pseudo-absencesshould not be restricted to just sub-Saharan Africaor just sub-Saharan West Africa. Further studies
Figure 4. Predicted distribution of the Aquatic Warbler combining the restricted SRE-based prediction (Fig. 3b) with the RandomForest-based prediction: (a) the probability values generated by the RandomForest-based prediction range from zero (white) to one (dark grey)in 0.1 steps; (b) the same probability values as in (a) were converted into binary values of zero (white) and one (grey) using the probabilitythreshold that maximizes the percentage of presence and absence correctly predicted for each dependent variable (Pearce & Ferrier2000, Thuiller 2006).
© 2007 The AuthorsJournal compilation © 2007 British Ornithologists’ Union
Winter distribution of Aquatic Warbler 711
may consider such design differences in generatingpseudo-absences. In our case, however, given theexcellent performance of the model using ourapproach, such design differences would presumablynot lead to much more realistic models.
Our modelled distribution of the Aquatic Warblerdoes not suggest that it occurs in more southernregions of West Africa as suggested by the stableisotope study (Pain et al. 2004). However, inductivemodels will only predict areas with climates similarto those of the presence localities, so without morerecords from southern regions, inductive models willfail to predict these areas. Therefore, future fieldwork should also focus on areas to the south of ourmodelled distribution, especially as the relative lackof January and February records from the morenortherly countries of Mali and Mauritania (Table 1)does suggest that Aquatic Warblers may move furthersouth in the later stages of their wintering season.Similar southward movements on their Africanwintering grounds have been documented for otherPalearctic passerines (Curry-Lindahl 1981, Jones 1995).
Although very unlikely given the observationalevidence (Schäffer et al. 2006) and the stable isotoperesearch (Pain et al. 2004), there remains a slightpossibility that Aquatic Warblers also winter inCentral or East Africa. Single records from Greece,Turkey, Crete, Jordan and Egypt (Schäffer et al.2006) suggest the intriguing possibility that a yet un-discovered population of Aquatic Warblers to theeast of its known breeding range does not migratethrough Western Europe, but follows an alternativeflyway via the Middle East and Egypt to someCentral or East African wintering grounds, e.g. LakeChad, the Salamat wetlands in southeastern Chad,the Sudd swamps along the White Nile, the Likoualawetlands north of the Congo river, or even the vastMalagarasi–Muyovozi wetlands in northwesternTanzania, all of which are possible locations forundetected Aquatic Warbler populations. However,despite past and present ringing projects (Dowsett1969, Ottosson et al. 2002), no records from LakeChad have emerged, nor from any other Central orEast African site (Schäffer et al. 2006). Furthermore,the stable isotope research strongly suggests thatall currently known breeding populations, eveneasterly ones, migrate through Western Europe toWest Africa (Pain et al. 2004). Given the presentevidence, an eastern flyway is very unlikely, as alldata suggest that the Aquatic Warbler indeedconcentrates its wintering quarters into a relativelysmall area within West Africa.
Migratory birds with relatively small ranges andspecific habitat requirements, such as the AquaticWarbler, may not only be vulnerable to habitat losscaused by land-use changes, but may furthermore beespecially vulnerable to the effects of climate change.This may not just alter their preferred habitats butalso increase their migration distances and lead to adecoupling of migratory schedule and food availability(Strode 2003, Bairlein & Hüppop 2004, Crick 2004,Huntley et al. 2006). Therefore, it becomes evermore important to find and monitor the winteringgrounds of the Aquatic Warbler.
We thank the many people and institutions who havehelped with our project ‘A database of Western Palearcticbirds migrating within Africa to guide conservationdecisions’ and who are acknowledged on the websitehttp://www.macroecology.ku.dk/africamigrants. For pro-viding references for this particular study, we specificallythank Linda Birch, Robert Dowsett, Louis Hansen, SueRobinson, and the librarians at BirdLife International,Cambridge, and the Royal Society for the Protection ofBirds, Sandy, especially Ian Dawson and Lynn Giddings.Our thanks also go to Joost Brouwer, Tim Dodman,John P. Gee, Paul Isenmann, Peter Jones, Bruno Lamarche,Stephen Rodwell, Stephen Rumsey, Mike Smart, AlainSauvage and Michel Thévenot, who have shown a specialinterest in our study and provided very useful data. Wethank Indrikis Krams and two anonymous reviewers forcomments on the paper. We are very grateful to the GlobalChange Research Group led by Dr G.F. Midgley at theSouth African National Botanical Institute and particularlyGreg O. Hughes for creating and combining the climaticlayers for the African continent. Finally, special thanks toKim Gutteridge who was instrumental in pulling togethermuch of the data. B.A.W. was financed through a 2-yearMarie Curie Individual Fellowship funded by theEuropean Commission’s ‘Improving Human ResearchPotential’ programme, administered by the EuropeanCommission Research Directorate General in Brussels.B.A.W. and S.L.C. are supported by the DST-NRF Centreof Excellence for Invasion Biology. C.R. acknowledges theDanish National Science Foundation grant no. I. h. 21-03-0221 for support. W.T. received support from the Inter-national Research Network (GDRI) project ‘France SouthAfrica – Dynamics of biodiversity in Southern Africanecosystems and sustainable use in the context of globalchange: processes and mechanisms involved’. W.T. wasalso partly funded by the EU FP6 MACIS species targetedproject (Minimization of and Adaptation to Climatechange: Impacts on biodiversity).
REFERENCESAllen, G.A., Pereira, L.S., Raes, D. & Smith, M. 1998. Crop
Evapotranspiration – Guidelines for Computing Crop WaterRequirements. FAO Irrigation and Drainage Paper 56. Rome:FAO.
712 B. A. Walther et al.
© 2007 The Authors Journal compilation © 2007 British Ornithologists’ Union
Anon. 2001. The Times Comprehensive Atlas of the World. London:Times Book Group Ltd.
Aquatic Warbler Conservation Team. 1999. World population,trends and conservation status of the Aquatic WarblerAcrocephalus paludicola. Vogelwelt 120: 65–85.
Atienza, J.C., Pinilla, J. & Justribó, J.H. 2001. Migration andconservation of the Aquatic Warbler Acrocephalus paludicolain Spain. Ardeola 48: 197–208.
Bairlein, F. & Hüppop, O. 2004. Migratory fuelling and globalclimate change. Adv. Ecol. Res. 35: 33–47.
Bartholomew, J. 1956. The Times Atlas of the World, Vol. IV:Southern Europe and Africa. London: The Times PublishingCo. Ltd.
Beaumont, L.J., Hughes, L. & Poulsen, M. 2005. Predictingspecies distributions: use of climatic parameters in BIOCLIMand its impact on predictions of species’ current and futuredistributions. Ecol. Modelling 186: 250–269.
Bibby, C.J. 2003. Conservation of migratory birds. In Berthold, P.,Gwinner, E. & Sonnenschein, E. (eds) Avian Migration: 407–420. Berlin: Springer.
BirdLife International. 2004. Threatened Birds of the World2004. CD-ROM. Cambridge: BirdLife International.
Boyce, M.S., Vernier, P.R., Nielsen, S.E. & Schmiegelow,F.K.A. 2002. Evaluating resource selection functions. Ecol.Modelling 157: 281–300.
Brotons, L., Thuiller, W., Araújo, M.B. & Hirzel, A.H. 2004.Presence–absence versus presence-only modelling methodsfor predicting bird habitat suitability. Ecography 27: 437–448.
Brown, L.H., Urban, E.K., Fry, C.H. & Newman, K. 1982. TheBirds of Africa, Vol. I. London: Academic Press.
Busby, J.R. 1991. BIOCLIM – a bioclimatic analysis and predictionsystem. In Margules, C.R. & Austin, M.P. (eds) Nature Con-servation: Cost Effective Biological Surveys and Data Analysis:64–68. Canberra: CSIRO.
de By, R.A. 1990. Migration of Aquatic Warbler in westernEurope. Dutch Birding 12: 165–181.
Convention on Migratory Species. 2003. Action PlanConcerning Conservation Measures for the Aquatic WarblerAcrocephalus paludicola. Annex to the Memorandum ofUnderstanding concerning Conservation Measures forthe Aquatic Warbler (Acrocephalus paludicola) under theConvention on Migratory Species (CMS). http://www.cms.int/species/aquatic_warbler/pdf/AW_Action_Plan_Final_Eng.pdf.or http://www.aquaticwarbler.net/download/AW_MoU_Action_Plan_30_April_2003.doc (accessed 15 January 2007).
Corsi, F., de Leeuw, J. & Skidmore, A. 2000. Modelling speciesdistribution with GIS. In Boitani, L. & Fuller, T.K. (eds) Re-search Techniques in Animal Ecology: Controversies andConsequences: 389–434. New York: Columbia UniversityPress.
Cramp, S. 1998. The Complete Birds of the Western Palearcticon CD-ROM. Oxford: Oxford University Press.
Crick, H.Q.P. 2004. The impact of climate change on birds. Ibis146 (Suppl. 1): 48–56.
Crick, H.Q.P. & Jones, P.J. 1992. The ecology and conservationof Palaearctic–African migrants. Ibis 134 (Suppl.): 1–132.
Cumming, G.S. 2000. Using between-model comparisons tofine-tune linear models of species ranges. J. Biogeogr. 27:441–455.
Curry-Lindahl, K. 1981. Bird Migration in Africa. London:Academic Press.
De’Ath, G. & Fabricius, K.E. 2000. Classification and regressiontrees: a powerful yet simple technique for ecological dataanalysis. Ecology 81: 3178–3192.
Dowsett, R.J. 1969. B.O.U. supported research at Lake Chad in1968. Ibis 111: 449–452.
Elgood, J.H., Sharland, R.E. & Ward, P. 1966. Palaearcticmigrants in Nigeria. Ibis 108: 84–116.
Elith, J. & Burgman, M.A. 2002. Predictions and their valida-tion: rare plants in the central highlands, Victoria, Australia. InScott, J.M., Heglund, P.J., Morrison, M.L., Haufler, J.B.,Raphael, M.G., Wall, W.A. & Samson, F.B. (eds) PredictingSpecies Occurrences: Issues of Accuracy and Scale: 303–313. Covelo: Island Press.
Elith, J., Graham, C.H., Anderson, R.P., Dudík, M., Ferrier, S.,Guisan, A., Hijmans, R.J., Huettmann, F.L.J.R., Lehmann,A., Li, J., Lohmann, L.G., Loiselle, B.A., Manion, G.,Moritz, C., Nakamura, M., Nakazawa, Y., Overton, J.M.M.,Peterson, A.T., Phillips, S.J., Richardson, K., Scachetti-Pereira, R., Schapire, R.E., Soberón, J., Williams, S.,Wisz, M.S. & Zimmermann, N.E. 2006. Novel methodsimprove prediction of species’ distributions from occurrencedata. Ecography 29: 129–151.
Engler, R., Guisan, A. & Rechsteiner, L. 2004. An improvedapproach for predicting the distribution of rare and endangeredspecies from occurrence and pseudo-absence data. J. Appl.Ecol. 41: 263–274.
Ferrier, S., Watson, G., Pearce, J. & Drielsma, M. 2002.Extended statistical approaches to modelling spatial patternin biodiversity in northeast New South Wales. I. Species-levelmodelling. Biodiv. Conserv. 11: 2275–2307.
Fielding, A.H. & Bell, J.F. 1997. A review of methods for theassessment of prediction errors in conservation presence/absence models. Envir. Conserv. 24: 38–49.
Fielding, A.H. & Haworth, P.F. 1995. Testing the generality ofbird-habitat models. Conserv. Biol. 9: 1466–1481.
Fry, C.H. & Keith, S. 2004. The Birds of Africa, Vol. VII. London:Christopher Helm.
Fry, C.H., Keith, S. & Urban, E.K. 1988. The Birds of Africa,Vol. III. London: Academic Press.
Fry, C.H., Keith, S. & Urban, E.K. 2000. The Birds of Africa,Vol. VI. London: Academic Press.
Gatter, W. & Mattes, H. 1987. Anpassungen von SchafstelzeMotacilla flava und afrikanischer Motacilliden an die Wald-zerstörung in Liberia (Westafrika). Verh. Orn. Ges. Bayern 24:467–477.
Glutz von Blotzheim, U.N. 2001. Handbuch der Vögel Mittel-europas (CD-ROM). Wiesbaden: Aula-Verlag.
Godown, M.E. & Peterson, A.T. 2000. Preliminary distributionalanalysis of US endangered bird species. Biodiv. Conserv. 9:1313–1322.
Graham, C.H., Ferrier, S., Huettman, F., Moritz, C. & Peterson,A.T. 2004. New developments in museum-based informaticsand applications in biodiversity analysis. Trends Ecol. Evol.19: 497–503.
Guisan, A. & Thuiller, W. 2005. Predicting species distribution:offering more than simple habitat models. Ecol. Lett. 8: 993–1009.
Guisan, A. & Zimmermann, N.E. 2000. Predictive habitatdistribution models in ecology. Ecol. Modelling 135: 147–186.
Heim de Balsac, H. & Mayaud, N. 1962. Les Oiseaux duNord-Ouest de l’Afrique. Paris: Éditions Paul Lechevalier.
© 2007 The AuthorsJournal compilation © 2007 British Ornithologists’ Union
Winter distribution of Aquatic Warbler 713
von Heuglin, M.T. 1869. Ornithologie Nordost-Afrika’s, derNilquellen- und Küsten-Gebiete des Rothen Meeres und desNördlichen Somal-Landes, Vol. 1. Cassel: Verlag von TheodorFischer.
Hijmans, R.J., Guarino, L., Bussink, C., Mathur, P., Cruz, M.,Barrantes, I. & Rojas, E. 2005. DIVA-GIS, Version 5. A Geo-graphic Information System for the Analysis of BiodiversityData. Manual. http://www.diva-gis.org (accessed 15 January2007).
Hirzel, A.H., Helfer, V. & Métral, F. 2001. Assessing habitat-suitability models with a virtual species. Ecol. Modelling 145:111–121.
Huntley, B., Collingham, Y.C., Green, R.E., Hilton, G.M.,Rahbek, C. & Willis, S.G. 2006. Potential impacts of climaticchange upon geographical distributions of birds. Ibis 148:8–28.
Huntley, B., Green, R.E., Collingham, Y.C., Hill, J.K., Willis,S.G., Bartlein, P.J., Cramer, W., Hagemeijer, W.J.M. &Thomas, C.J. 2004. The performance of models relatingspecies geographical distributions to climate is independentof trophic level. Ecol. Lett. 7: 417–426.
Jones, P.J. 1995. Migration strategies of Palearctic passerinesin Africa. Israel J. Zool. 41: 393–406.
Jones, P., Vickery, J.A., Holt, S. & Cresswell, W. 1996. A pre-liminary assessment of some factors influencing the densityand distribution of palearctic passerine migrants wintering inthe Sahel zone of West Africa. Bird Study 43: 73–84.
Julliard, R., Bargain, B., Dubos, A. & Jiguet, F. 2006. Identifyingautumn migration routes for the globally threatened AquaticWarbler Acrocephalus paludicola. Ibis 148: 735–743.
Keith, S., Urban, E.K. & Fry, C.H. 1992. The Birds of Africa,Vol. IV. London: Academic Press.
Ledant, J.P. 1986. L’habitat du traquet tarier dans le centre de laCôte d’Ivoire. Gerfaut 76: 139–145.
Luoto, M. & Hjort, J. 2005. Evaluation of current statisticalapproaches for predictive geomorphological mapping.Geomorphology 67: 299–315.
Manel, S., Dias, J.M., Buckton, S.T. & Ormerod, S.J. 1999a.Alternative methods for predicting species distribution: anillustration with Himalayan river birds. J. Appl. Ecol. 36: 734–747.
Manel, S., Dias, J.-M. & Ormerod, S.J. 1999b. Comparing dis-criminant analysis, neural networks and logistic regressionfor predicting species distributions: a case study with a Hima-layan river bird. Ecol. Modelling 120: 337–347.
Manel, S., Williams, H.C. & Ormerod, S.J. 2001. Evaluatingpresence–absence models in ecology: the need to accountfor prevalence. J. Appl. Ecol. 38: 921–931.
McPherson, J.M., Jetz, W. & Rogers, D.J. 2004. The effects ofspecies’ range sizes on the accuracy of distribution models:ecological phenomenon or statistical artefact? J. Appl. Ecol.41: 811–823.
Mester, H. 1967. Über den Zug des Seggenrohrsängers. Anthus4: 1–6.
Moisen, G.G. & Frescino, T.S. 2002. Comparing five modellingtechniques for predicting forest characteristics. Ecol. Modelling157: 209–225.
Moreau, R.E. 1972. The Palaearctic–African Bird MigrationSystems. London: Academic Press.
National Geospatial-Intelligence Agency. 2005. GeoNetNames Server (GNS). http://gnshttp://www.nga.mil/geonames/GNS/index.jsp.
New, M., Lister, D., Hulme, M. & Makin, I. 2002. A high-resolutiondata set of surface climate over global land areas. ClimateRes. 21: 1–25.
Olden, J.D., Jackson, D.A. & Peres-Neto, P.R. 2002. Predictivemodels of fish species distributions: a note on proper validationand chance predictions. Trans. Am. Fish Soc. 131: 329–336.
Olson, D.M. & Dinerstein, E. 2002. The Global 200: Priorityecoregions for global conservation. Ann. Missouri Bot. Gard.89: 199–224.
Ottosson, U., Bengtsson, D., Gustafsson, R., Hall, P., Hjort, C.,Leventis, A.P., Neumann, R., Pettersson, J., Rhönnstad, P.,Rumsey, S., Waldenström, J. & Velmala, W. 2002. Newbirds for Nigeria observed during the Lake Chad BirdMigration Project. Bull. ABC 9: 52–55.
Pain, D.J., Green, R.E., Gießing, B., Kozulin, A., Poluda, A.,Ottosson, U., Flade, M. & Hilton, G.M. 2004. Using stableisotopes to investigate migratory connectivity of the globallythreatened aquatic warbler Acrocephalus paludicola.Oecologia 138: 168–174.
Pearce, J. & Ferrier, S. 2000. Evaluating the predictive perform-ance of habitat models developed using logistic regression.Ecol. Modelling 133: 225–245.
Pearson, R.G., Dawson, T.P. & Liu, C. 2004. Modelling speciesdistributions in Britain: a hierarchical integration of climateand land-cover data. Ecography 27: 285–298.
Pepe, M.S. 2000. An interpretation for the ROC curve and infer-ence using GLM procedures. Biometrics 56: 352–359.
Prasad, A.M., Iverson, L.R. & Liaw, A. 2006. Newer classificationand regression tree techniques: bagging and random forestsfor ecological prediction. Ecosystems 9: 181–199.
Royle, J.A. & Link, W.A. 2006. Generalized site occupancymodels allowing for false positive and false negative errors.Ecology 87: 835–841.
Salathé, T. (ed.) 1991. Conserving Migratory Birds. Cambridge:International Council for Bird Preservation.
Sanderson, E.W., Jaiteh, M., Levy, M.A., Redford, K.H.,Wannebo, A.V. & Woolmer, G. 2002. The human footprintand the last of the wild. Bioscience 52: 891–904.
Schäffer, N., Walther, B.A., Gutteridge, K. & Rahbek, C. 2006.The African migration and wintering grounds of the AquaticWarbler Acrocephalus paludicola. Bird Conserv. Int. 16: 33–56.
Schulze-Hagen, K. 1993. Winter quarters of the AquaticWarbler and habitat situation there – short review of recentknowledge. Unpublished report available from BirdLife Inter-national, Cambridge, 4 pages.
Scott, J.M., Heglund, P.J., Morrison, M.L., Haufler, J.B.,Raphael, M.G., Wall, W.A. & Samson, F.B. 2002. PredictingSpecies Occurrences: Issues of Accuracy and Scale.Washington, DC: Island Press.
Seoane, J., Carrascal, L.M., Alonso, C.L. & Palomino, D.2005. Species-specific traits associated to prediction errorsin bird habitat suitability modelling. Ecol. Modelling 185: 299–308.
Strode, P.K. 2003. Implications of climate change for NorthAmerican wood warblers (Parulidae). Glob. Change Biol. 9:1137–1144.
Thuiller, W. 2003. BIOMOD – optimizing predictions of speciesdistributions and projecting potential future shifts underglobal change. Glob. Change Biol. 9: 1353–1362.
Thuiller, W. 2004. Patterns and uncertainties of species’ rangeshifts under climate change. Glob. Change Biol. 10: 2020–2027.
714 B. A. Walther et al.
© 2007 The Authors Journal compilation © 2007 British Ornithologists’ Union
Thuiller, W. 2006. Operating Manual for BIOMOD: User Guide.Grenoble: Laboratoire d’Ecologie Alpine. CNRS, UniversitéJoseph Fourier.
Thuiller, W., Araújo, M.B. & Lavorel, S. 2003a. Generalizedmodels versus classification tree analysis: a comparativestudy for predicting spatial distributions of plant species atdifferent scales. J. Vegetation Sci. 14: 669–680.
Thuiller, W., Vaydera, J., Pino, J., Sabaté, S., Lavorel, S. &Gracia, C. 2003b. Large-scale environmental correlates offorest tree distributions in Catalonia (NE Spain). Global Ecol.Biogeogr. 12: 313–325.
Thuiller, W., Araujo, M.B. & Lavorel, S. 2004a. Do we needland-cover data to model species distributions in Europe?J. Biogeogr. 31: 353–361.
Thuiller, W., Brotons, L., Araújo, M.B. & Lavorel, S. 2004b.Effects of restricting environmental range of data to projectcurrent and future species distributions. Ecography 27: 165–172.
Urban, E.K., Fry, C.H. & Keith, S. 1986. The Birds of Africa,Vol. II. London: Academic Press.
Urban, E.K., Fry, C.H. & Keith, S. 1997. The Birds of Africa,Vol. V. London: Academic Press.
Vickery, J., Rowcliffe, M., Cresswell, W., Jones, P. & Holt, S.1999. Habitat selection by Whitethroats Sylvia communisduring spring passage in the Sahel zone of northern Nigeria.Bird Study 46: 348–355.
Walther, B.A. & Rahbek, C. 2002. Where do Palearctic migratorybirds overwinter in Africa? Dansk Orn. Foren. Tidsskr. 96:4–8.
Walther, B.A. & Rahbek, C. 2006. A Database of Western Pal-earctic Birds Migrating within Africa to Guide ConservationDecisions. www.macroecology.ku.dk/africamigrants.
Walther, B.A., Wisz, M.S. & Rahbek, C. 2004. Known andpredicted African winter distributions and habitat use of theendangered Basra Reed Warbler (Acrocephalus griseldis)and the near-threatened Cinereous Bunting (Emberiza ciner-acea). J. Ornithol. 145: 287–299.
Wawrzyniak, H. & Sohns, G. 1977. Der Seggenrohrsänger.Neue Brehm-Bücherei No. 504. Wittenberg Lutherstadt:Ziemsen Verlag.
Whittaker, R.J., Willis, K.J. & Field, R. 2001. Scale and speciesrichness: towards a general, hierarchical theory of speciesdiversity. J. Biogeogr. 28: 453–470.
Wisz, M.S., Walther, B.A. & Rahbek, C. 2007. Using potentialdistributions to explore determinants of Western Palearcticmigratory songbird species richness in sub-Saharan Africa.J. Biogeogr. in press.
Woodward, F.I. 1987. Climate and Plant Distributions.Cambridge: Cambridge University Press.
Woodward, F.I. 1990. The impact of low temperatures incontrolling the geographical distribution of plants. Phil. Trans.Roy. Soc. Lond. B 326: 585–593.
Zaniewski, A.E., Lehmann, A. & Overton, J.M. 2002. Predict-ing species spatial distributions using presence-only data: acase study of native New Zealand ferns. Ecol. Modelling 157:261–280.
Received 5 June 2006; revision accepted 20 January 2007.
STOP PRESS
An expedition containing several members of theAquatic Warbler Conservation Team (AWCT;contact via [email protected])was able to capture 58 Aquatic Warblers in andaround Djoudj National Park in January 2007, mostof them in the so-called buffer zone just north of thepark. They were not found in Typha spp. stands, butin very large, uniform grassy marshes of Scirpusmaritimus, S. littoralis and Sporobulus robustus. Theseareas were shallowly inundated in January, but areexpected to dry out during February and March. Onthe Senegalese side, according to habitat mappingperformed in the mid-1990s, about 13 000 ha ofsuitable habitat exists, and on the Mauritanian sideabout 10 000 ha. Capture rates led to a minimumdensity estimate of 0.5 individuals/ha, an averagedensity estimate of 1–2 individuals/ha and a maxi-mum density average of > 10 individuals/ha. Thatmeans that at least two-thirds of the global population,or perhaps almost the entire global population, iswintering in this rather small area on both sides ofthe lower Senegal river. There is no doubt that largeareas of suitable habitat have been transformed intorice and sugarcane fields in the past decades, but theremaining area seems currently to be safe within twoNational Parks and their buffer zones.