conservation planning of the endangered pyrenean frog by
TRANSCRIPT

Conservation Planning of the Endangered Pyrenean frog by integratingnatural history, landscape and
population genomics under Global Changes Scenarios
Marcos Peso Fernández
ADVERTIMENT. La consulta d’aquesta tesi queda condicionada a l’acceptació de les següents condicions d'ús: La difusió d’aquesta tesi per mitjà del servei TDX (www.tdx.cat) i a través del Dipòsit Digital de la UB (diposit.ub.edu) ha estat autoritzada pels titulars dels drets de propietat intel·lectual únicament per a usos privats emmarcats en activitats d’investigació i docència. No s’autoritza la seva reproducció amb finalitats de lucre ni la seva difusió i posada a disposició des d’un lloc aliè al servei TDX ni al Dipòsit Digital de la UB. No s’autoritza la presentació del seu contingut en una finestra o marc aliè a TDX o al Dipòsit Digital de la UB (framing). Aquesta reserva de drets afecta tant al resum de presentació de la tesi com als seus continguts. En la utilització o cita de parts de la tesi és obligat indicar el nom de la persona autora. ADVERTENCIA. La consulta de esta tesis queda condicionada a la aceptación de las siguientes condiciones de uso: La difusión de esta tesis por medio del servicio TDR (www.tdx.cat) y a través del Repositorio Digital de la UB (diposit.ub.edu) ha sido autorizada por los titulares de los derechos de propiedad intelectual únicamente para usos privados enmarcados en actividades de investigación y docencia. No se autoriza su reproducción con finalidades de lucro ni su difusión y puesta a disposición desde un sitio ajeno al servicio TDR o al Repositorio Digital de la UB. No se autoriza la presentación de su contenido en una ventana o marco ajeno a TDR o al Repositorio Digital de la UB (framing). Esta reserva de derechos afecta tanto al resumen de presentación de la tesis como a sus contenidos. En la utilización o cita de partes de la tesis es obligado indicar el nombre de la persona autora. WARNING. On having consulted this thesis you’re accepting the following use conditions: Spreading this thesis by the TDX (www.tdx.cat) service and by the UB Digital Repository (diposit.ub.edu) has been authorized by the titular of the intellectual property rights only for private uses placed in investigation and teaching activities. Reproduction with lucrative aims is not authorized nor its spreading and availability from a site foreign to the TDX service or to the UB Digital Repository. Introducing its content in a window or frame foreign to the TDX service or to the UB Digital Repository is not authorized (framing). Those rights affect to the presentation summary of the thesis as well as to its contents. In the using or citation of parts of the thesis it’s obliged to indicate the name of the author.
Departamento de Biología Evolutiva, Ecología y Ciencias Ambientales. Programa de Doctorado en BIODIVERSIDAD.
Museo Nacional de Ciencias Naturales (MNCN). Consejo Superior de Investigaciones Científicas (CSIC)
“Conservation planning of the Endangered Pyrenean frog by integrating natural history, landscape and population
genomics under Global Change Scenarios.”
Memoria presentada por Marcos Peso Fernández para optar al título de Doctor por la Universidad de Barcelona.
Marcos Peso Fernández
El director de la tesis: Tutor:
Dr. David Vieites Rodríguez
Museo Nacional de Ciencias Naturales (MNCN). Consejo Superior de
Investigaciones Científicas (CSIC)
Dr. Javier María Ferrer Parareda
Departamento de Biología Animal. Universidad de Barcelona


“Life always finds its way”Jurassic Park
This doctoral thesis was financed by a doctoral grant ((202402/2011-8) from CNPq (Conselho Nacional de Desenvolvimento Científico e Técnologico)
under the Science without Borders Program from the Ministry of Science - Brazil.
Essa Tese de doutorado foi financiada por uma bolsa (202402/2011-8) do CNPq sob o programa Ciências sem Fronteiras do Minitério da Ciência do Brasil.
Laboratory and fieldwork were financed by a research project from the National Parks OPAN-MMARM of Spain, and fieldwork was partially
financed by a research project from the Barcelona Zoo (Ayuntamiento de Barcelona).
El trabajo de campo en Pirineos fue en parte financiado por un proyecto de Investigación del Zoo de Barcelona (Ayuntamiento de Barcelona), y por un proyecto de Investigación en
Parques Nacionales OPAN – MMARM de España, este último también ha financiado el trabajo de laboratorio.
Front cover: Male of Rana pirenaica in Barranco Comas, Añisclo Valley – PNOMP-
Credits: David Vieites
Back cover Arazas river in Ordesa Valley – Ordesa and Monte Perdido national park.
Credits: Marcos Peso
Copyrigth all rights reserved.
Todos los derechos reservados Toda forma de reproducción, distribución, comunicación pública o transformación de esta obra solo pueden realizarse
mediante previa autorización de sus autores, salvo excepción prevista por ley.

INDEX
INSTITUTIONAL ACKNOWLEDGMENTS/AGRADECIMIENTOS INTITUCIONALES ....... 6
PERSONAL ACKNOWLEDGMENTS/AGRADECIMIENTOS PERSONALES .......................... 7
GENERAL INTRODUCTION ........................................................................................................... 13
STRUCTURE OF THE THESIS AND OBJECTIVES .................................................................... 23
Chapter 1: ......................................................................................................................................... 25
Chapter 2: ......................................................................................................................................... 61
Chapter 3: ......................................................................................................................................... 83
Chapter 4: ......................................................................................................................................... 93
Chapter 5: ....................................................................................................................................... 121
DISCUSSION ..................................................................................................................................... 173
CONCLUSIONS ................................................................................................................................ 181

6
INSTITUTIONAL ACKNOWLEDGMENTS/AGRADECIMIENTOS INTITUCIONALES
I would like to thank:
Fernando Carmena and Ignácio Gómez from SARGA and Iosu Antón from
Forestal Guardness of Navarra for their inestimable collaboration in fieldwork.
Antor Casterllanau for the logistical support that was fundamental for the
realization of this thesis, likewise SARGA from the Aragon Government for providing
their field station in the Ordesa National Park that served as headquarters in 2011.
Aragon and Navarra´s governments for the animal capture permits during
those years.
The Spanish Meteorological Agency (AEMet) for providing
meteorological data from the meteo-stations in the Pyrenees.
Isaac Pozo for help with GIS and statistical analyses.
The Barcelona Zoo (Ayuntamiento de Barcelona) and National Parks
Autonomous Organism (OAPN) for financing the research project that has led to this
thesis.
AGRADECIMIENTOS PERSONALES
7
PERSONAL ACKNOWLEDGMENTS/AGRADECIMIENTOS PERSONALES
Fueron muchas las personas que de forma muy activa directa e indirectamente han apoyado,
ayudado y hecho parte de esta tesis. Muchas de estas personas han estado presentes en diferentes etapas y
momentos de la tesis y de mi vida durante estos años (fueron muchas las “vidas” vividas dentro de esta
tesis, muchos momentos), algunas de estas personas han estado en más de uno de estos “momentos”. Seré
eternamente agradecido a ellos. También me gustaría agradecer a ti, por leer esta tesis. Escribir pero sin que
alguien lo lea carece de sentido. Un filósofo brasileño (Mário Sérgio Cortella) dijo una vez que el afecto y
el conocimiento son dos cosas que si lo guardas, lo pierdes. Por lo tanto estas líneas a seguir son para
profesar y compartir todo el afecto y el cariño que mantengo por las personas que me han ayudado en este
largo proceso cuyo resultado es un poquito más de conocimiento que también lo compartiré a seguir de este
apartado de agradecimiento. Me permitiréis también en este emotivo apartado cometer algún error
gramatical, ortográfico y por qué no, de memoria (aunque intentaré ser lo más atento que las lágrimas que
brotan de mis ojos lo permitan).
En primer lugar, y como no podía ser diferente, tengo que agradecer al Dr David Vieites, que al
principio era “solamente” el director de mi tesis, pero durante este largo y arduo camino, se convirtió en un
amigo y un referente. No tengo la menor duda, ni la más mínima vergüenza en asegurar que sin David, esta
tesis nunca llegaría a su término. Así que David, queda eternizado en estas líneas mi más sincero
agradecimiento a ti como investigador y como persona. Estaré eternamente agradecido por todo lo que me
enseñaste, soy sumamente importante de formar parte de tus f1 científicos.
También debo agradecer al Dr. Xavi Ferrer, mi tutor en la Universitat de Barcelona, gracias Xavi
por el cariño con el que siempre me has acogido en tu despacho y por las palabras de aliento. Aprovecho
para disculparme por los inúmeros trámites administrativos que has tenido que gestionar a lo largo de esta
tesis. Tampoco debería olvidarme de las dos directoras que tuvieron este programa de doctorado y que me
han facilitado la vida incluso a veces más allá del extremo de la flexibilidad que institucionalmente era
posible, Dra Dolors Vinyoles y Dra Maria José López Fuster
I also want to say thanks to Dra Kathryn Elmer to support me in her lab in Galsgow, for helping
me to make the genomics libraries and for having shared fieldwork in Asturias. At this point I will also
never forget the invaluable lab work help of Arne Jacobs, thanks man for the field station tour, for the lab
help, and the weekend lab conversations. And many thanks to the others Elmer´s lab members, Hans,
James, Robyn; I am grateful to you that you have converted your coffee time into our coffee time those
days.
También soy verdaderamente grato a los gobiernos de Aragón y Navarra por conceder los
permisos necesarios para realizar los trabajos de campo imprescindibles para la realización de esta tesis.
También me gustaría nombrar a Elena Villagrasa, Técnico del Parque Nacional de Ordesa y Monte
Perdido, muchas gracias Elena por facilitar nuestro trabajo, con una notable organización para que
pudiéramos coordinar con los agentes de protección de la naturaleza (APN) actuantes dentro del parque.

PERSONAL ACKNOWLEDGMENTS
8
Los agradecimientos a los APN no podrían faltar, su labor como protectores de la naturaleza va
más allá de su puesto, es una forma de entender la vida, dedicación de quien de veras ama la naturaleza. Sin
la colaboración de ellos, mi trabajo en campo hubiera sido mucho más difícil. Así que gracias a José
Antonio, Javier Campo, Javi Fanlo, Emilio Ramón, Ricardo, Carlos Tarazona, Rafa Vidaller,
Manolo Grasa y a todos los demás que por desgracia no he podido conocer o mi memoria me traiciona.
Con todos vosotros he compartido gratos momentos en el campo y os soy muy agradecido. Rafa, Manolo,
Carlos y Javier, con vosotros he pasado algo más de tiempo, y quiero recalcar la gran admiración que os
profeso personal y profesionalmente. Gracias por compartir estos momentos, espero haber correspondido de
alguna forma con esta tesis para la conservación de nuestras cucharetas y ranitas.
Además de los APN, hay otros apasionados de la naturaleza que han hecho lo posible para que el
trabajo en el campo fuera excepcional, son los señores que, para mí, personifican la empresa Sarga (antigua
Sodemasa): Nacho Gómez y Fernando Carmena. No tengo palabras para agradeceros, recibirme en
vuestras casas, tener el teléfono siempre disponible para cualquier duda, siempre dispuestos a cuadrar
agendas para unificar las idas al campo. Todavía guardo con cariño las memorias de aquel lejano julio del
2010, cuando vosotros y David me enseñasteis por primera vez una rana pirenaica. Solamente puedo
deciros gracias de todo corazón!
En total fueron más de doce meses de trabajo de campo en los pirineos aragoneses, navarros y
franceses distribuidos a lo largo de cuatro años para adquirir los datos necesarios para esta tesis. En este
tiempo fueron muchos los acompañantes que tuve en el campo, algunos que venían a visitarme, otros a
ayudarme, a hacer sus propios proyectos de tesis, máster o fin de carrera, pero al fin y al cabo acompañantes
que han hecho que el campo fuera mas ameno. Para los que no tuvisteis la suerte de hacer trabajo en campo,
sepan que la soledad es la mejor y también la peor compañera de trabajo. Así que quiero agradecer a Bea
(la primera en visitarme en pirineos, no podría ser diferente), David Vieites, Javi, Carlitos, Rigo, Guille,
Ana, Miguel Peñalver, Cristina, Davi TVS, Nina, Ori, Jorge, Rubén, Daniel, Marti. Perdonarme si me
olvido de alguien, pero fuisteis muy importante en aquellos momentos, no sé si sois conscientes de cuanto,
pero quiero que lo sepáis.
Después del trabajo de campo, y entre medias, hubo también el trabajo de laboratorio. Mucha
gente hizo con que aprendiera mucho y disfrutara del (muchas veces frustrante) trabajo en el labo, gracias a
David, a Sandra, a Nina y a Piluchi. También muchas gracias a Michel, Ivan, Juanes, Samu, David
Osca, Melinda, Violeta, Paula Carolina, Chechu, Rugé, Silvia, Tania, Miriam, Jimena y Andrés. La
más sencilla duda que me habéis solucionado en el laboratorio ha sido muy valioso para mí, serían horas
para encontrar la solución (o el pocillo, la caja, la pipeta, el termociclador, las puntas, etc…) por mí mismo,
también vosotros (y Rock FM, cuyo playlist ya lo sabemos todos de memoria) han sido de gran ayuda para
sobrellevar las horas de laboratorio.
Hablando de horas en el laboratorio, también soy enormemente agradecido a todos los funcionarios
del Museo Nacional de Ciencias Naturales de Madrid, especialmente a los guardias de seguridad de la
noche en aquel tiempo (Pedro y Santi). Muchas gracias por la compañía y las charlas en las noches (y
madrugadas) que me quedé en el laboratorio para sacar adelante este proyecto. Y por abrir el portón de la

AGRADECIMIENTOS PERSONALES
9
entrada una y otra vez sin poner ninguna oposición al hecho de que estuviera en las dependencias del museo
fuera del horario de funcionamiento.
Después del laboratorio (y durante) vino el momento de analizar los datos, y ahí fuisteis
muchísimos los que me ayudasteis. No puedo dejar de agradecer a Isaac, tío ni sé cómo agradecerte por
tantas veces que te he molestado con preguntas de Gis, Joaquin Calatayud, Angel, Cristina Romero y
Chechu sin vosotros R me hubiera devorado; Ruben gracias por clusterizar varios de mis análisis, Chio,
has hecho que Excel fuera mas amable. Muchos otros me ayudasteis quitándome dudas y explicándome
sobre el funcionamiento de ciertas herramientas. Gracias a todos!
También durante el doctorado estuve de estancia durante 3 meses en el Cibio de Porto (Vairão) en
Portugal, me gustaría agradecer al Dr. Nuno Ferrand por la oportunidad. Gracias también a todos que de
cierta forma enriquecieron esta aventura portuguesa, Xavi, Angelica, Eva, Walter, Alice, Zbyzsek,
Raquelina. Pero sin duda lo mejor de la estancia fue haber compartido despacho con Il Signore Marco
Sannolo. Grazie mille amico per invitarmi a fare surf. Casi morimos con aquellas olas, pero sirvió para
repensar muchos aspectos de la vida que todavía hoy sigo buscando comprender. Tu amistad y tu apoyo
durante la estancia y después de ella es lo mejor que me llevo de Portugal.
Tengo que agradecer a todas estos amigos y compañeros que compartimos la investigación durante
estos largos años de tesis en el Museo Nacional de Ciencias Naturales de Madrid, técnicos, estudiantes de
doctorado, postdocs y allegados. Quizás lo más fácil sería resumir agradeciendo a los PESTUZOS, que
quizás sea el nombre que englobe todos los subgrupos (padelfuckers, 1111, 1212, lab, jaketeros, tupperos,
pestugym, pajareros, herpetólogos, futboleros, basqueteros, gentes del ventorrillo). Siempre me acordaré de
la primera cena de navidad en aquella chinosidrería. Y después de eso, las cañas y tintos de verano en el
asador, retinto, el gominolas, 53, etc. Los cafés de los viernes, tras comida jaketera, en la residencia. Los
pacharanes, las pizzas en la 1111, la casa rural, las pachangas. Muchos recuerdos de alegrías, pero también
recuerdos, de los jornal clubs, seminario de los viernes, aquellas charlas en la máquina de café, las
reivindicaciones por un lugar digno para comer de tupper. Los momentos de desespero por el rechazo de un
paper, un deadline, por la compleja relación con los supervisores, una beca perdida, las dudas existenciales.
Estos también son momentos compartidos con vosotros. Por todos estos momentos y por vuestra
inestimable apoyo para conseguir finalizar esta tesis, Gracias a: Juanin (el experto cervecero); Jaime; Jose
Manuel; Carlos Ponce (gran pajarero mor); Paloma Plus; Carol (La padelfucker master del universo y
máxima liante. “La última y nos vamos”.); Eva y Rogga (algún día me gustaría volver a cantar con
vosotros); Elisa y Dani (aquellas noches de cine eran una gota de agua en el desierto); Cantarero (Puro
nervio, gracias pestu); Miguel Peñalver, Merel y Cristina (siempre fuisteis de los mejores oyentes de mis
penas, estoy muy agradecido de haber contado con vuestra amistad); Sergio Alfonso; Iván; Rafa chuchu
(muchas gracias por todos tus consejos); Miguel Matias (Nossas conversas sempre foram uma fonte
inesgotável de motivação), Diego (Gallú, eres un fenómeno); Michael y Melinda (No tengo palabras para
agradecer vuestra amistad y la cantidad de veces que me habéis ayudado, espero encontraros en Ecuador,
Guiana, o donde sea); Marti; Gemmita (mi gemmita siempre fuiste la mejor consejera, aunque yo no
quisiera hacerte caso, gracias también por venirte a las Cíes); Chechu (el mejor amigo indio que cualquiera
puede tener, el integrante frustrado del pestupiso, muchísimas gracias por todo durante la vida en el museo

PERSONAL ACKNOWLEDGMENTS
10
y todavía más por los ánimos en estos últimos meses de la tesis en Vigo, espero que te estés sintiendo un
poquito en casa en Galicia); Octavio (te lo dije ya en persona, fuiste de los únicos que creíste en mi cuando
la mayoría, yo incluido, lo dudaba. Eso fue y es muy importante para mi, espero poder ir a visitarte a
Australia); Laura; Esther; Roberto; Jimena; Lucia, Mireia; Ibañez (pintan bastos); Idiaquez, Jorge y
Gonzalo (Hicisteis del vetorrillo un lugar a recordar); Isaac (cuidado con los cuchillos franceses); Rigo
(Hemos compartido muchas cosas, ideas, papers, proyectos, piso, gracias por tu amistad). Con cada uno de
vosotros he aprendido algo que lo llevaré conmigo para toda la vida y vuestro apoyo, del más pequeño
detalle al más grande, ha sido de ayuda para esta tesis. Y perdonarme si me olvido de alguien, todos sabéis
que escribir la tesis consume demasiadas neuronas.
A mis queridos compañeros de despacho 1212 (doce doce) que han hecho con que el ambiente de
trabajo fuera el más sano y agradable. Algunos ya estaban cuando llegué y fueron terminando sus tesis,
algunos llegaron después y otros simplemente estuvieron una temporada, gracias a Melinda (He cuidado
las plantitas lo mejor que pude cuando te ibas de estancias, muestreos, cursos…), Silvia; Ramón, Maria y
Raul (nunca olvidaré aquel lab retreat en el ventorrillo) , Shirin (gracias por dejarme en herencia la mejor
mesa del despacho), Paco, Guida, Marga, Jorge, Chio, Raquel, Javi, Adelmo, Ángel, Nagore, Marisa,
Valentina, Geize, Fernanda (cunha), Indra, Joaquin y todos los demás que pasasteis por el mejor
despacho de becarios del museo, lo siento 1111, un despacho que tiene una estantería con alcohol y una
cafetera tiene que ser considerado el mejor.
Sin duda no puedo dejar de agradecer de forma especial a la familia VieitesLab, he compartido
mucho con vosotros, no ha sido solo una tesis, han sido momentos de desesperación, de incertidumbres, de
éxtasis, con muchos he compartido despacho, mesa, ordenador. Hemos compartido campo, largos y cortos
recorridos en coche, en metro, viajes y papers. Compartimos ideas, discusiones, congresos, cursos, críticas
y abrazos. Fundamentalmente compartimos director de tesis, y también programas informáticos,
informaciones de la universidad y sus gestiones administrativas. Algunos hemos compartido piso, comida,
silla e incluso lágrimas. Hasta hemos llegado a compartir pensamientos, miedos, frustraciones, alegrías y
fiestas. A todos en general mis gracias por todos estos años y estas experiencias (Raquel, Angel, Carlos,
Javi, Guille, Ana, Salva, Nina, Rubén, Valentina, Thijs, David y Sandra), pero en especial a Raquelina,
sin ti todo hubiera sido muchísimo más difícil, la tesis, el cibio, el doctorado en general y principalmente
esta recta final. Eres una gran persona, gran amiga y gran investigadora, estoy muy orgulloso de haber
hecho la tesis en el mismo laboratorio que tu y mas orgulloso todavía de poder decir que te tengo como
amiga. A Angelín por ayudarme con R, con teamviewer, a esquiar y por tu tesón en la tesis aun sin tener
una beca, me ha servido siempre de gran inspiración. A mi Carlitos, que nada más conocerlo el primer día
en pirineos hemos hablado de todos los temas que normalmente se evitan hablar con un desconocido,
gracias tío, siempre estuviste ahí principalmente en los momentos amargos, siempre tendrás a alguien que
vibra por tus éxitos. A Valentina, ni me puedo creer que solo has estado 4 meses en Madrid, me ha hecho
aprender mucho de genética y me has hecho repensar muchas cosas de la vida, Grazie mille, sempre ti
ricorderò. Gracias Javi, por todos estos años de tesis, empezamos la tesis a la vez y también a la vez la
terminaremos, siempre que te busqué pidiendo ayuda nunca dijiste que no, a pesar de todas nuestras
diferencias. Esto para mi ha significado mucho. Salva, eres un gran ejemplo de perseverancia y fortaleza,

AGRADECIMIENTOS PERSONALES
11
gracias por todos estos momentos de templanza. Y finalmente gracias a Nina, que empezamos
compartiendo conocimiento, me has enseñado muchísimo en el labo, y yo te enseñé de donde venían las
muestras de tejido que analizabas, y acabamos compartiendo mucho más, jamás lo olvidaré, gracias.
Não posso me esquecer de agradecer a meus amigos do Brasil que mesmo longe, sempre foram
uma grande fonte de inspiração e exemplos a seguir para mim. Desculpa por distsanciar-me em muitos
momentos, sempre pude sentir o apoio de vocês através daquela brincadeira, daquele áudio ou de um
simples gesto. Sinto-me afortunado por ter vocês na minha vida e poder-me espelhar nas suas atitudes.
Ganega Lili, Cabelo, Linam, Omar, Davi, João, Felipe, Pedrinho, Mcfly, Ernestão, Tiago, Aline,
Fefeu, Jamile, João Cláudio, Thiago, Diego, Niquinha, Erik. Vocês são foda, sinto muita saudade de
vocês, mas fico muito feliz em sentir como a nossa amizade sofre do mesmo efeito que o vinho, só melhora
com o tempo. Sem vocês essa tese seria muito mais complicada. Especialmente Avid, irmão você foi de
grande apoio antes (para conseguir a bolsa) e durante esse processo, obrigado de coração.
Y mis amigos de vigo, también siempre fuisteis un porto seguro, e incondicional fuente de apoyo.
Gracias a Popi, Markitos, Samu, Noe, Rubas, kely, Iria, Mejo y Javi. Y en especial a Dani, hermano tu
ayuda expresada de diversas formas ha sido fundamental para conseguir concluir esta tesis, no sé si una sola
vida será suficiente para agradecer y devolverte toda esa ayuda. Sería injusto si no agradeciera también a
Bea, viviste y me apoyaste en los pasos previos y en los iniciales de esta tesis. Soy muy agradecido a ti, esta
tesis también es un poco tuya.
En este párrafo mezclaré el castellano y o Português. Porque así me siento, una mezcla entre a
minha familia baiana e mi familia gallega. Esta tesis JAMÁS sería posible sin el apoyo incondicional de
mi familia, no recuerdo ningún momento de cobranzas, de dúvidas. Eles sempre acreditaram, muito mais
do que eu mesmo acreditei em mim. Minha mãe (Mari) , mi padre (Roberto). Obrigado mãe, Gracias pai.
Vocês são minha principal inspiración.Gracias también a mis tíos (Elisa, Mari, Jesús) que han colaborado
con su apoyo muchas veces invisible para algunos (pero yo si lo veía), soy grato también a mi prima Paty y
mi primo (más que político) Alejandro por todo el apoyo que me dieron. Obrigado a minha irmã, que no
final da tese me ajudou de uma forma que nunca pensei que iria precisar, e menos que acudiria a ela por
essa ajuda, Obrigado Marilia. A mi abuela, que pese a su edad y su desconocimiento sobre qué es y para
qué sirve una tesis, también me ha dado toda la ayuda que ha sabido dar. Não deixo para o final meus tios e
padrinhos (Pilar e Luis) Jamais terei suficientes palavras para agradecer tudo o que vocês têm feito por
mim, sou e serei eternamente grato a vocês.
Esta tesis es para todos vosotros y un poco vuestra. Obrigado, gracias, Thanks.

12
INTRODUCTION
13
GENERAL INTRODUCTION
The Quaternary climatic oscillations, with several consecutive periods of cold
glaciations and warm interglacials, had a profound impact on the distribution, spatial
genetic diversity, demography and evolution of extant species (e.g. Hewitt 2004). All
European mountain ranges experienced dramatic changes, both in climatology and
landscapes during this period, as glaciers invaded the valleys during cold periods, and
retreated during interglacials allowing species to recolonize high elevations in a cyclical
process. The Alps and the Pyrenees were basically covered by ice sheets that melted
during interglacials in parallel to global increase of temperatures (Crowley & North 1991,
Ehlers & Gibbard 2004).
The north of the Iberian Peninsula was particularly affected by those Pleistocene
climatic changes (Crowley & North 1991, Arribas 2004). The level of perpetual snow in
the central part of the Cantabrian mountain range remained around 750 m during the last
glaciation, while in the Pyrenees many glacial cirques remained frozen even during
interglacial periods, with the level of perpetual snow around 1400-2000 m a.s.l. during
the last glacial maximum, well below the current one that is around 3000 m (Uzquiano
1995, Arribas 2004, Ehlers & Gibbard 2004). In parallel to this continuous advance and
retreat of the ice, the fauna and flora of these mountain systems have had opportunities to
colonize high mountain areas when conditions were favorable, retreating to lower areas
during the colder periods where they persisted in refugia, such as deep valleys or coastal
areas with more favorable climatic conditions. In consequence, the distribution and
genetic structure of many species that inhabit these areas were shaped by retreat and
posterior re-colonization patterns from the different refugia (Alexandrino et al. 2000,
Guillaume et al. 2000, Gómez & Lunt 2007).
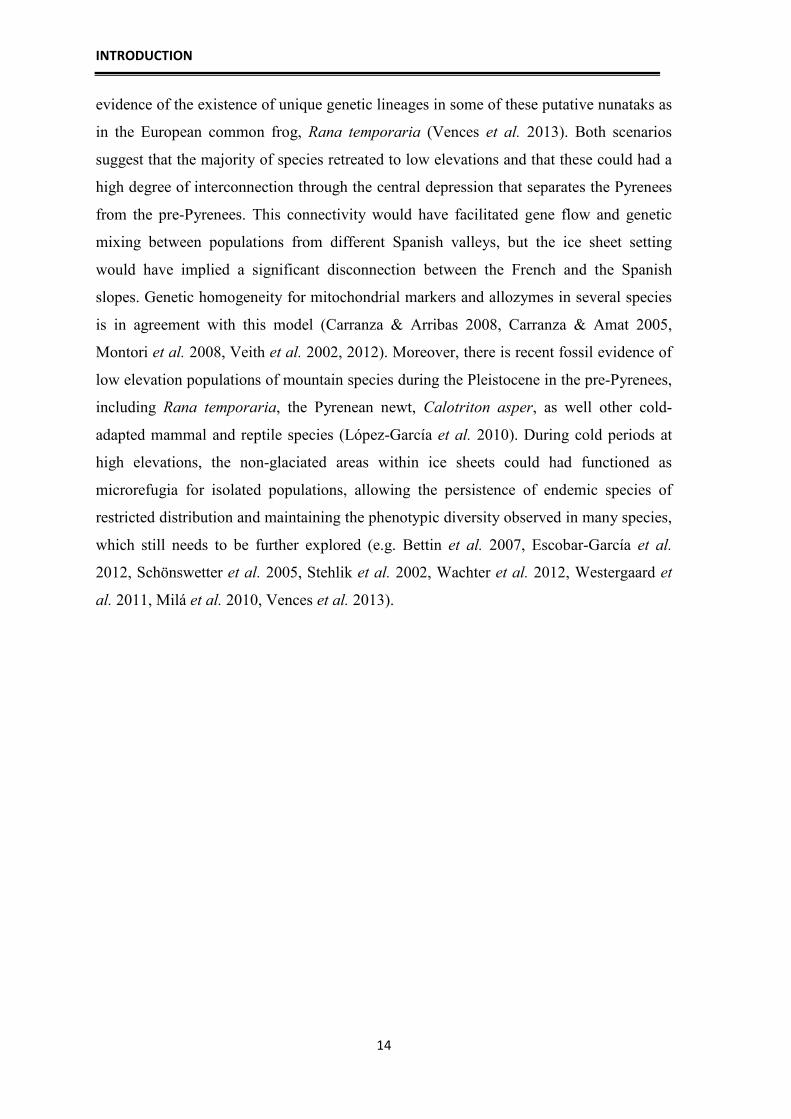
The most recent data on the extent of the glaciers during the last glacial maximum
(Ehlers & Gibbard 2004), suggest that in the Pyrenees the glaciated areas occupied a great
extension, including the majority of valleys up to low elevations (Fig. 1). Two spatial
hypotheses are available from these works, one suggesting a continuous ice sheet
covering the whole mountain range in the West and more fragmented towards the East
(Fig. 1a), and the other showing a larger extent of glacier tongues but many small
unglaciated areas within the Western ice sheets that may have functioned as nunataks,
microrefugia for relict populations of mountain species (Fig. 1b). In fact, there is recent
INTRODUCTION
14
evidence of the existence of unique genetic lineages in some of these putative nunataks as
in the European common frog, Rana temporaria (Vences et al. 2013). Both scenarios
suggest that the majority of species retreated to low elevations and that these could had a
high degree of interconnection through the central depression that separates the Pyrenees
from the pre-Pyrenees. This connectivity would have facilitated gene flow and genetic
mixing between populations from different Spanish valleys, but the ice sheet setting
would have implied a significant disconnection between the French and the Spanish
slopes. Genetic homogeneity for mitochondrial markers and allozymes in several species
is in agreement with this model (Carranza & Arribas 2008, Carranza & Amat 2005,
Montori et al. 2008, Veith et al. 2002, 2012). Moreover, there is recent fossil evidence of
low elevation populations of mountain species during the Pleistocene in the pre-Pyrenees,
including Rana temporaria, the Pyrenean newt, Calotriton asper, as well other cold-
adapted mammal and reptile species (López-García et al. 2010). During cold periods at
high elevations, the non-glaciated areas within ice sheets could had functioned as
microrefugia for isolated populations, allowing the persistence of endemic species of
restricted distribution and maintaining the phenotypic diversity observed in many species,
which still needs to be further explored (e.g. Bettin et al. 2007, Escobar-García et al.
2012, Schönswetter et al. 2005, Stehlik et al. 2002, Wachter et al. 2012, Westergaard et
al. 2011, Milá et al. 2010, Vences et al. 2013).

INTRODUCTION
15
Figure 1. Maps showing different hypotheses on the extent of ice sheets during the last glacial maximum
from Ehlers & Gibbard (2004). Map A suggests a rather uniform ice sheet in the western and central
Pyrenees where R. pyrenaica occurs, and more fragmented in the East, while scenario B suggest that the ice
tongues were much longer in the West, reaching lower elevations, and the existence of many unglaciated
small areas within the ice sheets.the computation of Species Distribution Models (SDMs). Species
occurrence data and environmental data linked with an algorithm predict models such as geographical space
models or environmental space models.
Since the last glacial maximum there has been an overall increase in the
temperature of the planet, which has accelerated since the 1970’s, as well as an important
transformation of the environment linked to human-related activities (Scheffers et al.
2016). This Global Change has allowed many species to (re)colonize high elevations in
the Pyrenees in the last millennia where they have established stable populations. These
altitudinal distribution shifts, causing range contractions and expansions, have led to
considerable demographic changes in many species, sometimes population extinctions,

INTRODUCTION
16
generating spatial genetic structure, and providing opportunities for microevolutionary
adaptations in this mountain range (Dubois 1982, Carranza & Amat 2005, Charrier et al.
2014, Montori et al. 2008, Veith et al. 2002, 2012, Valbuena-Ureña et al. 2018).
Although many temperate species are also found both at low
(Mediterranean/temperate climates) and high elevations (subalpine and alpine climates),
their natural history and phenology are quite different between these two environments.
Among them, several species of amphibians have been widely studied, like the European
common frog (Rana temporaria) (Veith et al. 2002, 2012, Vieites et al. 2004, Vences et
al. 2013), while for others we know less about their biology, distribution and natural
history, like the Endangered Pyrenean frog (Rana pyrenaica) (Vieites & Vences 2003).
These are sister taxa that occur in the Pyrenees, but one of the key differences between
them is that while R. temporaria is a lentic species, R. pyrenaica inhabits in mountain
streams. Both are ectotherms with limited dispersal capacities, distributed between mid to
high elevations in the Pyrenees, as a result of a post-glacial colonization during the
Holocene Global Warming. However, the Pyrenean frog does not reach high elevations
like R. temporaria (2100 vs 2600 m a.s.l.) (Vences et al. 2003). R. temporaria shows
morphological variability in the Pyrenees, which has led several authors to propose
different subspecies and morphotypes creating some taxonomic uncertainty, while the
Pyrenean frog was confused for a long time with Rana iberica, another Iberian endemism
(Dubois 1982, 1983, Veith et al. 2002, 2003, 2012). Although both species of brown
frogs share part of their distribution ranges in the central Pyrenees, there is a strong
contrast between them in terms of their natural history, ecology, morphological and likely
genetic diversity, which suggests that past environmental changes may have affected
them differently. Their distribution, natural history and particular evolution makes them
ideal model organisms to compare the imprint of the glaciations in their distribution,
genetic and phenotypic structure, as well as the connectivity and gene flow between
Pyrenean populations, both between valleys and across altitudinal gradients.
The Pyrenean frog is a medium-sized brown frog endemic to the Pyrenees, which
was discovered and described not long ago (Serra-Cobo 1993), resolving the controversy
of the presence of the Iberian frog in the Pyrenees. R. pyrenaica is an eminently lotic
species, its typical habitat being mountain streams and torrents, with cold and oxygenated
fast waters (Serra-Cobo 1993, 1997). It has also been occasionally found in fountains,
springs and pools where there is continuous water renewal (Serra-Cobo 1997, 2002,

INTRODUCTION
17
Serra-Cobo et al. 1998, 2000). The reproductive period in this species begins after the
thaw, between February and April. The females deposit the clutches under stones,
vegetation, or in areas of the riverbed where the stream current is less rapid (Serra-Cobo
1993, Serra-Cobo et al. 1998). The larvae are found in fast-flowing streams, usually in
small pools, and metamorph during the summer. The juveniles after the metamorphosis
are dispersed around the torrents (Serra-Cobo et al. 1998), as well as adults which have
been found by us ca. 100 m far from the water. These ecological requirements contrast
significantly with those of R. temporaria, which reproduces mainly in ponds and lakes
avoiding fast water torrents.
Rana pyrenaica is distributed on the southern slopes of the central and Western
Pyrenees, from the western slopes of the Mendizar mountain in Navarra to the Ordesa and
Monte Perdido National Park in Aragón. There are several locations in France, in the
forest of Irati, but near the border with Spain (Serra-Cobo 1993, 1997, 2002, Llamas et al.
1994, 1998, Ortega-Martínez & Ferrer-Justes 2000, Duguet & Melki 2003), and it has
been recently found in two French sites further north (Duchateau et al. 2012). It is
generally distributed from 1000 to 1800 meters of altitude (Serra-Cobo 1993, Vences et
al. 1997, Serra-Cobo et al. 1998, 2000), although the altitudinal range spans from 440 m
to 2100 m (Vieites & Vences 2003, Duchateau et al. 2012). By analyzing a few
individuals with mitochondrial DNA, a single mutation in cytochrome b has been
reported, suggesting a very low level of genetic variability in the species (Carranza &
Arribas 2008). However, there are no genetic data for a sufficient number of individuals
and populations, covering the species' distribution area, neither nuclear data to confirm
this low genetic variability and if there is any phylogeographic structure in the species.
Such data would also allow testing several hypotheses on potential barriers to gene flow,
like major rivers or steep slopes.
In the late 1990s and the beginning of the 2000s, Serra-Cobo and collaborators
carried out several studies for the government of Aragon in which they gathered the first
distribution data for the species. Those studies were not published and are available
through the Aragon Government. The same happened in Navarra. Since then, there has
not been a similar study to determine the real distribution of the species, if there have
been changes, or the size of the populations. Punctual observations by herpetologists
suggest that the species is no longer found in some of the localities where it was present
20 years ago, since no adults or larvae have recently been found, which are easily
INTRODUCTION
18
detected in spring-summer. The appearance and expansion of chytridiomycosis, a fungal
disease that is decimating amphibian species throughout the world (Olson et al. 2013),
may be the cause of the possible population decline of this species, but data are lacking
on population sizes or prevalence of chytrid infection. The available data from the 1990s
suggest a higher population density towards the central zone of distribution of the species,
whereas it was low in populations located in the western limit of its distribution
(Navarra), as well as in low altitude areas (Llamas et al. 1994, Serra-Cobo 2002). The
IUCN Red List (Bosch et al. 2009) suggests that the species is Endangered based on a
continuous decline, both in its area of occupation, the extent and quality of its habitat and
in the number of localities, but it is unclear where the data to support these claims came
from. In Spain is catalogued as Vulnerable (VU B1ab+2ab), in Aragón as sensitive to
habitat alteration, in Navarra as a threatened species and in France as Endangered
B2ab(iii,v). However, there are no published data about potential significant changes in
the range of the species, as well as in its population sizes in the last decade. The factors
limiting its geographical distribution are still unclear and the potential impact of changes
in its typical habitats, connectivity between populations, actual population sizes or
phylogeographic structure and genetic diversity have not been assessed. Considering the
lack of such critical information about the species, as well as scarce observations
suggesting that some of its populations may be suffering a significant decline, this project
has focused on collecting data that allow us to assess the current situation of this
Endangered species, and develop the bases for a conservation strategy that will help in
decision-making conservation actions. The National Park of Ordesa and Monte Perdido
plays a fundamental role in the conservation of the species because it is the only one that
houses populations.
INTRODUCTION
19
References
Alexandrino, J., Froufe, E., Arntzen, J.W., & Ferrand, N. (2000) Genetic subdivision,
glacial refugia and postglacial recolonization in the golden-striped salamander,
Chioglossa lusitanica (Amphibia: Urodela). Molecular Ecology, 9: 771-781.
Arribas, O. 2004. Fauna y paisaje de los Pirineos en la Era Glaciar. Lynx Ed.
Bettin, O., Cornejo, C., Edwards, P.J., & Holderegger, R. (2007). Phylogeography of the
high alpine plant Senecio halleri (Asteraceae) in the European Alps: in situ glacial
survival with postglacial stepwise dispersal into peripheral areas. Molecular
Ecology, 16, 2517–2524.
Bosch, J., Tejedo, M., Miaud, C., Martínez-Solano, I., Salvador, A., García-París, M.,
Recuero Gil, E., Marquez, R., Díaz Paniagua, C., Geniez, P. (2009) Rana pyrenaica
Serra-Cobo, 1993. Pyrenean frog. Pp. 510. En: Stuart, S. N., Hoffmann, M.,
Chanson, J. S., Cox, N. A., Berridge, R. J., Ramani, P., & Young, B. E. (eds.).
Threatened Amphibians of the World. IUCN, Conservation International. Lynx,
Barcelona . 758 pp.
Carranza, S., & Amat, F. (2005) Taxonomy, biogeography and evolution of Euproctus
(Amphibia: Salamandridae), with the resurrection of the genus Calotriton and the
description of a new endemic species from the Iberian Peninsula. Zoological
Journal of the Linnean Society, 145: 555-582.
Carranza, S., & Arribas, O. (2008) Genetic uniformity of Rana pyrenaica Serra-Cobo,
1993 across its distribution range: a preliminary study with mtDNA sequences.
Amphibia-Reptilia, 29: 579-582.
Charrier, O., Dupont, P., Pornon, A., & Escaravage, N. (2014). Microsatellite Marker
Analysis Reveals the Complex Phylogeographic History of Rhododendron
ferrugineum (Ericaceae) in the Pyrenees. PLoS ONE, 9(3), 1–9.
https://doi.org/10.1371/journal.pone.0092976
Crowley, T., & North, G.R. (1991) Paleoclimatology. Oxford University Press. New
York.
Dubois, A. (1982) Notes sur les grenouilles brunes (groupe de Rana temporaria Linné,
1758). I. Introduction. Alytes, 1: 56-70.
Dubois, A. (1983) Notes sur les grenouilles brunes (Groupe de Rana temporaria Linné,
1758). II. Les Grenouilles du Mont Canigou (Pyrenees Orientales). Alytes, 2: 19-26.
Duchateau, S., Berroneau, M., Cantegrel, L., Goyeneche, L., de Reinach Hirtzbach, J.,
Tillo, S. (2012) Decouverte de Rana pyrenaica Serra-Cobo, 1993 (Anura, Ranidae)
sur le versant nord des Pyrenees. Bulletin de la Societé Herpetologique de France,
142-143: 51-63.
Duguet, R., & Melki, F. (eds.). (2003) Les Amphibiens de France, Belgique et
Luxemburg. Collection Parthénope, éditions Biotope, Mèze.
Ehlers, J., & Gibbard, P. (eds.) (2004) Quaternary glaciations—extent and chronology.
Part I: Europe. Developments in Quaternary Science no. 2. 488 pp.
Escobar García, P., Winkler, M., Flatscher, R., Sonnleitner, M., Krejčíková, J., Suda, J.,
INTRODUCTION
20
Hülber, K., Schneeweiss, G. M., & Schönswetter P. (2012) Extensive range
persistence in peripheral and interior refugia characterizes Pleistocene range
dynamics in a widespread Alpine plant species (Senecio carniolicus, Asteraceae).
Molecular Ecology, 21, 263 1255-1270.
Gómez, A., Lunt, D.H. (2007) Refugia within refugia: patterns of phylogeographic
concordance in the Iberian Peninsula. En: Phylogeography in Southern European
Refugia. Weiss, S., & Ferrand, N. (eds.), pp. 155-188 Springer. Dordrecht, The
Netherlands.
Guillaume, C.P., Heulin, B., Arrayago, M.J., Bea, A., & Braña, F. (2000) Refuge areas
and suture zones in the Pyrenean and Cantabrian regions: geographic variation of
the female MPI sex-linked alleles among oviparous populations of the lizard
Lacerta (Zootoca) vivipara. Ecography, 23: 3-10.
Hewitt, G.M. (2004) Genetic consequences of climatic oscillations in the Quaternary.
Philosophical Transactions of the Royal Society of London B, 359: 183-195.
Llamas, A., Martínez-Gil, O., Arribas, O. (1994) Estudio de la distribución y hábitat de
Rana pyrenaica Serra-Cobo, 1993. Departamento de Medio Ambiente, Gobierno de
Navarra. Inédito.
Llamas, A., Martínez-Gil, O., Arribas, O. (1998) Rana pyrenaica, a new species for the
French herpetofauna. Boletín de la Sociedad Herpetológica Española 9: 12-13.
López-García, J.M., Blain, H.A., Allué, E., Bañuls, S., Bargalló, A., Martín, P., Morales,
J.I., Pedro, M., Rodríguez, A., Solé, A., & Oms, F. X. (2010) First fossil evidence of
an “interglacial refugium” in the Pyrenean region. Naturwissenschaften, 97(8): 753-
761.
Milá, B., Guillaume, O., Carranza, S. & Clobert, J. (2010) Marked genetic structuring and
extreme dispersal limitation in the Pyrenean brook newt Calotriton asper
(Amphibia: Salamandridae) revealed by genome-wide AFLP but not mtDNA.
Molecular Ecology, 19(1):108-20.
Montori, A., Llorente, G.A. & Garcia-París, M. (2008) Allozyme differentiation among
populations of the Pyrenean newt Calotriton asper (Amphibia: Caudata) does not
mirror their morphological diversification. Zootaxa, 1945: 39–50.
Olson, D. H., Aanensen, D. M., Ronnenberg, K. L., Powell, C. I., Walker, S. F., Bielby,
J., Garner, T. W. J., Weaver, G., The Bd Mapping Group, & Fisher, M. C. (2013)
Mapping the global emergence of Batrachochytrium dendrobatidis, the amphibian
chytrid fungus. PloS one, 8(2), e56802.
Ortega-Martínez, M., Ferrer-Justes, C. (2000) Los anfibios del Alto Aragón. Cuadernos
Altoaragoneses de Trabajo, 23. Instituto de Estudios Altoaragoneses, Huesca.
Scheffers, B. R., De Meester, L., Bridge, T. C. L., Hoffmann, A. A., Pandolfi, J. M.,
Corlett, R. T., Butchart, S. H. M., Pearce-Kelly, P., Kovacs, K. M., Dudgeon, D.,
Pacifici, M., Rondinini, C., Foden, W. B., Martin, T. G., Mora, C., Bickford D., &
Watson, J. E. M. (2016) The broad footprint of climate change from genes to biomes
to people. Science, 354(6313). http://doi.org/10.1126/science.aaf7671
Schönswetter, P., Stehlik, I., Holderegger, R., & Tribsch, A. (2005) Molecular evidence

INTRODUCTION
21
for glacial refugia of mountain plants in the European Alps. Molecular Ecology, 14,
3547–3555.
Serra-Cobo, J. (1993) Descripción de una nueva especie europea de rana parda
(Amphibia, Anura, Ranidae). Alytes, 11: 1-15.
Serra-Cobo, J. (1997) Rana pyenaica Serra-Cobo, 1993. En: Pleguezuelos, J.M. (ed.),
Distribución y biogeografía de los anfibios y reptiles de España y Portugal pp.167-
168. Universidad de Granada-Asociación Herpetológica Española, Granada.
Serra-Cobo, J., Lacroix, G. & White, S. (1998) Comparison between the ecology of the
new European frog Rana pyrenaica and that of four Pyrenean amphibians. Journal
of Zoology London, 246: 147-154.
Serra-Cobo, J., Marques, T., Martínez-Rica, J.P. (2000) Ecological segregation between
Rana pyrenaica and Rana temporaria, and differential predation of Euproctus asper
on their tadpoles. Netherlands Journal of Zoology, 50 (1): 65-73.
Serra-Cobo, J. (2002) Rana pyrenaica Serra-Cobo, 1993. En: Pleguezuelos, J.M.,
Márquez, R., Lizana, M. (eds.). Atlas y libro rojo de los anfibios y reptiles de
España, pp. 129-130.Ministerio de Medio Ambiente- Asociación Herpetológica
Española, Madrid.
Stehlik, I., Blattner, F.R., Holderegger, R., & Bachmann, K. (2002) Nunatak survival of
the high Alpine plant Eritrichium nanum (L.) Gaudin in the central Alps during the
ice ages. Molecular Ecology, 11, 2027–2036.
Uzquiano, P. (1995) The disapperance of Picea at the end of Upper Pleistocene in the
Basque-Cantabrian region: climatic and anthropogenic factors. Comptes rendus de
l'Académie des sciences Serie II Science Terre Plan, 321: 545-551.
Valbuena-Ureña, E. Oromi, N. Soler-Membrives, A. Carranza, S. Amat, F. Camarasa, F.
Denoël, M. Guillaume, O. Sanuy, D. Loyau, A. Schmeller, D. Steinfartz, S. (2018)
Jailed in the mountains: Genetic diversity and structure of an endemic newt species
across the Pyrenees, PLoS ONE, 13(8): e0200214.
https://doi.org/10.1371/journal.pone.0200214
Veith, M., Vences, M., Vieites, D.R., Nieto-Roman, S. & Palanca, A. (2002) Genetic
differentiation and population structure within the Spanish common frogs (Rana
temporaria complex; Ranidae, Amphibia). Folia Zoologica, 51: 307-318.
Veith, M., Kosuch, J. & Vences, M. (2003) Climatic oscillations triggered post-
Messinean speciation of Western Palearctic brown frogs (Amphibia, Anura,
Ranidae). Molecular Phylogenetics and Evolution, 26: 310-327.
Veith, M., Baumgart, A., Dubois, A., Ohler, A., Galán, P., Vieites, D.R., Nieto-Román,
S., Vences, M. (2012) Discordant patterns of nuclear and mitochondrial
introgression in Iberian populations of the common frog, Rana temporaria. Journal
of Heredity;103(2): 240-9.
Vences, M., Kupfer, A., Llorente, G., Montori, A., Carretero, M. (1997) Description of
the larval stages of the Pyrenean frog, Rana pyrenaica Serra-Cobo, 1993
(Amphibia: Ranidae). Bolletino del Museo Regionale di Scienze Naturali, Torino 15
(1): 1-23.
Vences, M., Grossenbacher, K., Puente, M., Palanca, A. & Vieites, D.R. (2003) The
INTRODUCTION
22
Cambalès fairy tale: elevational limits of Rana temporaria (Amphibia: Ranidae) and
other European amphibians revisited. Folia Zoologica, 52(2): 189-202.
Vences, M., Hauswaldt S., Steinfartz S., Rupp, O., Goesmann, A., Künzel, S., Orozco-
terWengel, P., Vieites, D.R., Nieto-Roman, S., Haas, S., Laugsch, C., Gehara, M.,
Bruchmann, S., Pabijan, M., Ludewig, A.K., Rudert, D., Angelini, C., Borkin, L.J.,
Crochet, P.A., Crottini, A., Dubois, A., Ficetola, F., Galán, P., Geniez, P., Hachtel,
M., Jovanovic, O., Litvinchuk, S.N., Lymberakis, P., Ohler, A., Smirnov, N.A.
(2013) Radically different phylogeographies and patterns of genetic variation in two
European brown frogs, genus Rana. Molecular Phylogenetics and Evolution, 68:
657–670
Vieites, D.R., Vences, M. (2003) Rana pirenaica – Rana pyrenaica. En: Enciclopedia
Virtual de los Vertebrados Españoles. Salvador, A., (ed). Museo Nacional de
Ciencias Naturales, Madrid. http://www.vertebradosibericos.org/
Vieites, D. R., Nieto-Román, S., Barluenga, M., Palanca, A., Vences, M., & Meyer, A.
(2004) Post-mating clutch piracy in an amphibian. Nature, 431(7006), 305.
Wachter, G.A., Arthofer, W., Dejaco, T., Rinnhofer, L.J., Steiner, F.M., & Schlick-
Steiner, B.C. (2012) Pleistocene survival on central Alpine nunataks: genetic
evidence from the jumping bristletail Machilis pallida. Molecular Ecology, 21,
4983–4995.
Westergaard, K.B., Alsos, I.G., Popp, M., Engelskjøn, T., Flatberg, K.I., & Brochmann,
C. (2011) Glacial survival may matter after all: nunatak signatures in the rare
European populations of two west-arctic species. Molecular Ecology, 20, 376–393.

OBJECTIVES
23
STRUCTURE OF THE THESIS AND OBJECTIVES
In this thesis we have focused on clarifying the current situation, delimiting the
distribution and estimating the size of the populations, evaluating the genetic variation
and phylogeographic pattern, and potential threats such as chytridiomycosis in the
Pyrenean frog, the only amphibian species in danger of extinction in the Pyrenees. These
data suppose an important advance in the knowledge about the species and are discussed
in the context of a R. pyrenaica conservation strategy and the central role that the Ordesa
and Monte Perdido National Park should play in it.
These objectives are developed in the different chapters of the thesis
Chapter 1: we aimed to clarify and update the distribution range of Rana
pyrenaica, by revisiting all known localities, and based on potential species distribution
models determine its potential distribution and guide fieldwork into new areas where the
species could potentially occur. As there is a lack of data on the population sizes, we also
wanted to have an assessment of the population size for each population, based on
counting clutches and larval groups that will allow us to estimate a minimum number of
reproducing females.
Chapter 2: we wanted to verify the presence of the chytrid fungus,
Batrachochytrium dendrobatidis, a fungus that is killing amphibian species and
populations all over the world, in skin swabs of R. pyrenaica across its range. By doing
this we wanted to determine if the chytrid is located in few areas or it is widespread, as
well as where it does occur across the elevation gradient. By forecasting growth models
of the chytrid into future climatic scenarios we wanted to assess if this fungus will move
upslope an affect high elevation amphibian populations.
Chapter 3: we here describe the complete mitochondrial genome of R. pyrenaica,
which is the base to develop specific mitochondrial primers and detect intraspecific
genetic variation in the mitochondrion.
Chapter 4: we aim to reconstruct the mitochondrial phylogeography of R.
pyrenaica based on nearly complete mitochondrial genomes. Reference genomes were
amplified to determine which loci show genetic variation to further amplify those in a set
OBJECTIVES
24
of specimens across the species range. With those data we wanted to assess the spatial
genetic structure, intraspecific genetic variation and reconstruct the historical demography
to test past population expansions since the last glacial maximum. We integrated genetic
data with paleo-distribution modeling to test whether several refugia arose during glacial
periods.
Chapter 5: in this chapter we expanded the genetic dataset to the nuclear genome
by amplifying a set of single nucleotide polymorphisms (SNPs) for a representation of
individuals across the distribution range of the species. With those we wanted to
reconstruct the fine scale spatial genetic structure, determine the existence of genetic
clusters, develop landscape genetic models and integrate those to detect potential barriers
to gene flow and connectivity. With those analyses we assessed the conservation situation
from a population genetic view.
General discussion: in this final chapter we integrate all the data generated to
discuss the actual conservation situation of the species and propose conservation actions
that can be implemented by managers and authorities.
25
Chapter 1:
Current distribution, population
estimates and conservation status of
the Endangered Pyrenean frog (Rana
pyrenaica)
This chapter reproduce entirely the manuscript:
Peso M., Nieto-Román S., & Vieites D. R. Current distribution, population estimates and
conservation status of the Endangered Pyrenean frog (Rana pyrenaica). Manuscript in
preparation.

CONSERVATION STATUS
26

CHAPTER 1
27
Current distribution, population estimates and conservation status of the Endangered Pyrenean frog (Rana pyrenaica)
Abstract
The Pyrenean frog, Rana pyrenaica, is a narrowly-distributed endemic amphibian,
occurring mainly in the western and central southern Pyrenean slopes of Navarra and
Aragón, with few localities in France. It has been catalogued as Endangered by the IUCN.
Its distribution range and the variables that determined it are not yet clearly known
despite previous efforts on this respect, as well as other key aspects of relevance for its
conservation, including the actual status of its populations, degree of fragmentation or
populations sizes. Here we present new data on the distribution of the species, the size of
its populations and the survival of larval stages in different types of environments. The
species has been found in 170 localities, increasing its range into five new 10x10 UTM
squares in respect to the previous available information. Its range is fragmented, with
most populations having low or very low adult population sizes, and in several historical
localities the species has not been found or is nearly extinct. Fine-scale species
distribution modeling suggests a distribution mainly determined by mean annual
temperature and distance to streams. Monitoring of larval survival in five localities during
two years suggests that droughts and storm floods can be important factors determining
recruitment, mainly in localities where river pools are not deep enough. Our data support
the IUCN conservation status of Endangered and suggest that urgent conservation actions
to manage those small populations are needed to prevent their disappearance in the next
decades.
Keywords: Rana pyrenaica, distribution, population estimates, distribution models,
survival, conservation

CONSERVATION STATUS
28
INTRODUCTION
The Pyrenean frog, Rana pyrenaica, is a medium-sized brown frog endemic to the
Pyrenees, which was discovered and described just twenty five years ago (Serra-Cobo
1993). It has been catalogued as Endangered by the IUCN (www.iucnredlist.org/), but
there is a general lack of information about many aspects of its life history, real
distribution, population sizes, genetic variation or real conservation threats. R. pyrenaica
is an eminently lotic species, inhabiting mountain streams and torrents, with cold and
oxygenated fast waters (Serra-Cobo 1993, 1997). It has also occasionally been found in
fountains, springs and pools where there is continuous water renewal (Serra-Cobo 1997,
2002, Serra-Cobo et al. 1998, 2000). The reproductive period begins after snowmelt
(March–April) and larval development lasts until July when metamorphs leave the
streams (Vieites & Vences 2003). The females attach the clutches under stones,
vegetation, or in areas of the riverbed where the stream current is less rapid, and clutches
can be easily detected (Fig. 1) (Serra-Cobo 1993, Serra-Cobo et al. 1998, Vieites &
Vences 2003). The larvae are usually found in small ponds within the brooks or streams.
After the metamorphosis, the imagos stay nearby or disperse not far from the torrents
(Serra-Cobo et al. 1998). The adults are found near the water but can disperse further
away, being the maximum distance from water detected by us ca. 100m (pers. obs.),
although outside the reproductive period are very hard to detect. The species' ecological
requirements significantly contrast with those of the European common frog, R.
temporaria, the conspecific sister taxon to R. pyrenaica, which reproduces mainly in
pools and lakes avoiding brooks and torrents, and in high elevations they remain at lakes
and nearby areas all year round (Vieites 2003).
Rana pyrenaica is distributed on the southern slopes of the central and western
Pyrenees, from the western slopes of the Mendizar mountain in Navarra to the Ordesa and
Monte Perdido National Park in Aragón. It is very rare on the northern slope of the
Pyrenees. There are several localities in France, near the forest of Irati close to Spanish-
French border (Serra-Cobo 1993, 1997, 2002, Llamas et al. 1994, 1998, Ortega-Martínez
& Ferrer-Justes 2000, Duguet & Melki 2003), and it has recently been found in two
isolated French sites further north (Duchateau et al. 2012). It is generally distributed from
1000 to 1800 meters a.s.l. (Serra-Cobo 1993, Vences et al. 1997, Serra-Cobo et al. 1998,
2000), although the altitudinal range spans from 440 m to 2100 m (Vieites & Vences
2003; Duchateau et al., 2012). In the late 1990s and the beginning of the 2000s, Serra-
CHAPTER 1
29
Cobo and collaborators carried out several studies for the government of Aragon in which
they gathered the first distribution data for the species. Those studies were not published
and are available through the Aragon Government. The same happened in Navarra. The
historical distribution of Pyrenean frog is compiled in the Atlas of Amphibians and
Reptiles of the Iberian Peninsula of the Ministry of the Environment (Pleguezuelos et al.
2002) as UTM mesh of 10x10 kilometers. Since these efforts, there has not been a similar
initiative to determine the real distribution of the species, if there have been distribution
changes, or perform any assessment about the status and populations' size. The lack of
observations of adult and larvae in some historical localities in the recent years, has led to
conclusions of population declines, but no real data are available to confirm these. The
available data from the 1990s suggest a higher population density towards the central
zone of distribution of the species, whereas it was low in populations located in the
western limit of its distribution (Navarra), as well as in low altitude areas (Llamas et al.
1994, Serra-Cobo 2002). The IUCN Red List (Bosch et al. 2009) suggests that the species
is Endangered based on a continuous decline, both in its area of occupation, the extent
and quality of its habitat and in the number of localities, but it is unclear where the data to
support these claims came from. So far, there are no published data about potential
significant changes in the species’ range, as well the actual population sizes or population
trends.
Moreover, spatially explicit distribution models are not available for the species and
the variables and historical processes that have shaped its distribution are unknown.
Considering the lack of such critical information about the species, as well as the scarce
observations suggesting that some of its populations may be suffering a significant
decline, we here wanted to: 1) update and complete the distribution information for this
Endangered species to clarify its real distribution range, 2) gather the first indirect
estimates of population sizes, 3) model its distribution and determine the variables that
better predict it, and finally 4) monitor the survivorship of larvae in different sites with
contrasting characteristics to assess the potential recruitment capacity of the species,
which directly relate to its survival. Under future Global Change scenarios, climatic
instability is a factor of paramount importance (IPCC AR5 2014). In the Pyrenees, a mean
decrease between 10.7% and 14.8% in precipitation, as well as an increase in mean
temperatures between 2.8 and 4ºC have been proposed (López-Moreno et al. 2008).
Moreover, the effects of those changes are expected to be more pronounced in the

CONSERVATION STATUS
30
southern slopes of the Pyrenees (López-Moreno et al. 2008), where R. pyrenaica occurs.
Although a negative historical trend in river flood intensity and duration has been
detected for the Pyrenees, mainly linked to the increase in forest cover at mid-low
elevations (López-Moreno et al. 2006), stochastic events like big storms or heat waves
are expected to be more frequent and intense (Meehl & Tebaldi 2004), that can cause
higher larval mortalities by desiccation before metamorphosis or tadpole dragging to
lower elevations due to mountain storms. By integrating those data we discuss the current
conservation situation of the species as well as its conservation status and potential
management actions.
MATERIALS AND METHODS
Fieldwork
Between the spring of 2010 and the autumn of 2014 intensive fieldwork was carried
out in the Pyrenees covering a territory between Roncesvalles in Navarra to the Aran
Valley in Catalonia, and in the French side from Irati forests to the eastern limit of the
Parc National des Pyrenées. This territory covered the whole known distribution range of
the species as well as other potential areas where it could occur. We sampled 757
localities, including all the historical localities where the species was reported from
several unpublished reports of the Government of Aragon from 1997 to 2004, reports
from the Government of Navarra and the scientific literature. To determine the new zones
to be sampled, potential species distribution models (SDM) were done in Maxent (see
details below) based on the historical distribution data. This was an iterative exercise
repeated every year to improve the model with new presences and absences, which
guided us to potential new areas for the species not reported before. In order to confirm
the presence of the species, we visited all historical localities in 2010, and if the species
was not found in 1 or 2 visits, we revisited the place again in 2011, 2012 and 2013 to
confirm the actual absence of the species in the area. If in none of these visits the species
was not found then we considered the population to be extinct.
The period of activity of the Pyrenean frog begins in March-April and ends in
autumn. The best period to detect the species is in the early spring, when the adults are
breeding, until the month of June when the tadpoles are still in the water. Therefore, we
planned the visits within this period, with a first visit always during or just after the

CHAPTER 1
31
breeding period when clutches are laid, in order to detect not only the presence of the
species but its reproduction and presence of larvae. Sampling consisted on visiting
localities on foot or by 4x4 vehicle whenever possible. Many localities were on steep
slopes and locations far from communication routes so it was necessary to make bivouacs
in that area. Transects were made in rivers, streams, small torrents and springs, locating
adults, clutches and larvae. In these transects were counted the number of clutches, total
number of larvae and larvae groups, juveniles and adults, recording their precise situation
by GPS. The sampling was intensive and included above and underwater photography to
detect spots that are usually under rocks where clutches are laid (Fig. 1). Environmental
data were collected from each location and photographs were taken of the surroundings.
These data included the type of bottom substrate of the stream, the characteristics of the
margins, type of dominant vegetation, geology, presence of algae, trichoptera and other
species of amphibians, presence of fish, human and livestock presence.
Figure 1. Photo of clutches of the Pyrenean frog, which are typically attached under rocks in stream pools
where they can be easily located and counted.
Population estimates
In order to have an approximation to the population sizes by locality, relative
density estimates of breeding adults were made based on observations and counting
clutches, tadpole masses and adults. These estimates allow for the first time an
approximate idea of the number of breeding individuals of the species per each locality.
The application of mark and recapture methods, although more reliable, was not viable at
the scale we aimed to work, since a tagging and recapture program is impossible for the
CONSERVATION STATUS
32
entire distribution area: Hence, an approximation has been used according to the number
of clutches, counted larvae in each sampling and their distribution in the streams. During
the reproductive period, adult frogs and clutches were located, they were counted one by
one in each stream and georeferenced. Since it is likely that we do not detect them all in
one visit, each locality was visited several times during early spring to locate clutches and
masses of tadpoles. During development, when the first Gosner tadpole stages are reached
(when they still do not swim), the small tadpoles fall into the bottom of the pond, but still
form homogeneous masses that correspond to one or two clutches, depending if several
females laid their clutches close to each other. In those cases we assigned each group to a
clutch that corresponds to a reproductive female. Each female deposits a single clutch per
year (pers. obs.), hence the number of clutches parallels the number of reproductive
females. In some cases, directly estimations of the number of clutches were not possible
because the larvae were scattered in the stream, or, after a flood, were concentrated at the
lower sections. Therefore, in 2012 and 2013 we made the effort to revisit such localities
at the beginning of the breeding season to locate the clutches and thus better estimate the
number of breeding females. After these years, we have managed to have a fairly realistic
estimate of the number of clutches per sections of streams sampled and therefore of
breeding females. In order to have an estimate of the total number of adults, we applied a
sex ratio of 1.5 males per female based on unpublished data from Serra-Cobo. By doing
this we can have an approximate estimate of adult population sizes, obtaining an
estimated value of adult breeding individuals per each studied locality. As we usually
sampled between 100 and 200 m per stream, we then extrapolated those numbers to the
total length of the streams towards headwaters, as frogs likely are also present higher up,
to get a rough estimate of the potential population size in all known localities where the
species occurs.
Species distribution modeling
In order to generate a spatial hypothesis for the current distribution of the species,
as well as to determine the variables that could have shapes its current range, we
performed several species distribution models (SDMs) at different scales and with
different datasets. We first generated models using as predictive variables the bioclimatic
layers from the WorldClim database (Hijmans et al. 2005) at 30 arcsec resolution (ca.

CHAPTER 1
33
1km2). Those variables are highly autocorrelated as they all are generated from the
minimum, maximum and mean temperatures and precipitation. Hence, we assessed the
autocorrelation of the bioclimatic layers by generating 8000 random points within the
extent of the sampled area across the Pyreneesm, and performing Pearson pairwise
correlations in SPSS v. 25 (IBM 2017). As most variables are autocorrelated, we removed
from each pair one variable if the correlation was significant and with a Pearson
coefficient value higher than 0.8. The final set of variables showing the least degree of
correlation where annual mean temperature, mean temperature of wettest quarter, mean
temperature of driest quarter, precipitation seasonality (coefficient of variation),
precipitation of the wettest quarter, precipitation of the driest quarter, precipitation of
warmest quarter. We also included slope [derived from the 90x90 m SRTM 90m
elevation model (Jarvis et al. 2006)], distance to rivers and Corine landcover categories
(EEA 2006). Those layers were available both for Spain and France, but they may be too
coarse for a species like R. pyrenaica. Hence, we performed SDMs’ using a different set
of climatic layers from the “Atlas Climático Digital de la Península Ibérica” (Ninyerola et
al. 2005). This Atlas consists on monthly and annual means of radiation, temperature and
precipitation from 40 years of data for the Iberian Peninsula, based on the complete set of
meteorological stations from Spain and a high number from Portugal. As it is a high
resolution layer (200x200 m grid-cell size), it improves significantly other datasets like
Woldclim that uses less stations and provides lower resolutions. We rescaled elevation
(and the derived slope), Corine landcover and distance to rivers to the same resolution as
those climatic layers. Although these Atlas climate layers do not cover France, the
majority of the distribution of R. pyrenaica is in Spain, so the model can be helpful
predicting most of the distribution of the species. We followed a similar approach than
with WorldClim variables to detect autocorrelation, by performing pairwise Pearson
correlations between each pair or variables. From these, we selected six variables that
showed the least correlation values: distance to rivers, spring precipitation (May), annual
radiation, mean annual temperature, Corine landcover and slope. All GIS processing and
final maps were performed in Quantum GIS (QGIS 2018). For the modeling, we used
Maxent v. 3.4.1 (Phillips & Dudik 2008). Final models were done using 170 localities
where the species has beenfound and 581 real absences. We used the 75% of the data to
build the model and the remaining 25% to test it. Performances of the SDMs were
CONSERVATION STATUS
34
evaluated using the AUC (Area Under the Curve) values obtained from the model (Elith
et al. 2006).
Egg and larval survival models
A survival analysis from egg to metamorphosis was performed using the Kaplan-
Meier method implemented in SPSS v. 25 (IBM 2017). This statistic uses population
estimates or counts through time to estimate survival rates for every sampled event in
time, using censored cases to calculate conditional probabilities at each time point at
which an event occurs through the product limit of those probabilities. Monitoring
censuses were used as input for those analyses. We visited five localities where R.
pyrenaica is common: “Pista circular” at the Tena Valley (42.70104 N, 0.35772 W),
which is a small running water stream, flat, surrounded by grass and no forest cover,
shallow pools that dry out during hot and dry summers; “Iguarra” also at the Tena Valley
(42.64116 N, 0.29921 W), a forest locality where the stream form deep permanent pools
usually in the shadow of trees; “Buesa” at the Ara Valley (42.59807 N, 0.10291 W), a
forest locality but with shallow pools that dry out in hot summers; “Barranco Comas” at
the Añisclo Valley (42.66428 N, 0.12169 W), a small stream surrounded by grass and no
forest cover, shallow pools that dry out during hot and dry summers and frequent
presence of cows; and “Pools in Bellós river” (42.64052 N, 0.05964 E), a semi forested
locality with shallow pools next to the Bellós river, where the persistence of the pools
depends on river floods. We visited each locality between four and five times per season,
counting the number of eggs or tadpoles in each visit in a delimited section of the stream.
The year 2012 was very hot and many pools and streams dried out, while 2013 was a
wetter year with major storms in early summer, allowing comparisons of mortality
profiles between a hot and dry and a wet year. Hence, we monitored Pista circular,
Iguarra and Buesa in 2012, and again in 2013 plus the Bellós and Comas localities.
RESULTS
Between 2010 and 2014 we visited 751 localities within the potential distribution
range of the species, including all historical localities. R. pyrenaica was detected in 170

CHAPTER 1
35
localities. Twenty-three new localities have been located in the valleys of Ansó, Tena,
Vió; Acumuer, Bujaruelo and Hecho, as well as a new isolated population in France. This
supposes an extension of the distribution area of the species in five UTM grids in Spain,
compared to the available information from the Atlas of Amphibians and Reptiles of the
Iberian Peninsula (Pleguezuelos et al. 2002) (Fig. 2).
Figure 2. Synthetic distribution map of Rana pyrenaica showing the UTM 10x10 km grid cells from the
Atlas of Amphibians and Reptiles of the Iberian Peninsula, and the five new cells were it was detected in
Spain.
The new localities complete the known distribution area for the species, extending it
to the west and south. In the case of grid cell 30TXN84, corresponding to Valle de
Hecho, the new locality found is of special relevance, as it had never been found in that
valley until now, despite the great effort of sampling in previous years. There is a
discontinuity in its distribution between the eastern and western ranges, and this new
locality shortens that distance between them. The gap between the eastern and western
ranges is confirmed in 30TXN83 and 30TXN93 UTM 10x10 grid cells, where the species
has not been found despite a very intensive sampling in the area. The origin of this Hecho
valley locality is likely a result from a recent expansion from the west rather than a relict
locality since the Pleistocene.
Figure 3 shows the sampling effort made during this study. The species has been
searched in 751 mountain locations, many of them in stream headwaters with difficult

CONSERVATION STATUS
36
access. The distribution of localities clearly shows two cores spatially disconnected from
each other. Between 2012 and 2014 we re-visited again most of the historical localities in
order to confirm absences. It should be noted that in thirty historical localities the species
has not been relocated, and the localities close to Villanúa are of special relevance. The
species was described from specimens from this area, however in the whole valley we did
not find any individual in 2010, one tadpole and one adult after an intense sampling in
2011 at a single place, and again in 2013. Reproduction was confirmed after finding a
single tadpole in the month of June, which indicates that the species is very rare in the
valley of the river Aragón.
Figure 3. Sampled localities between 2010 and 2014, showing the ones where the species was detected
(white) and in which it was absent (yellow).
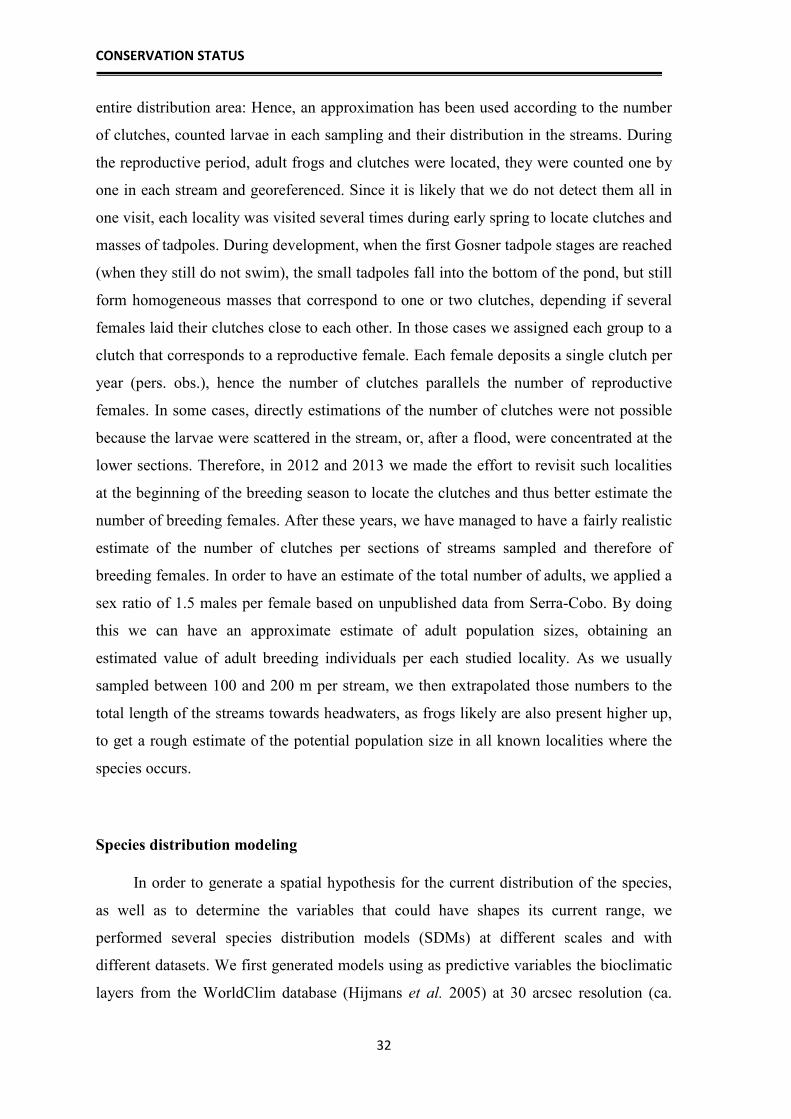
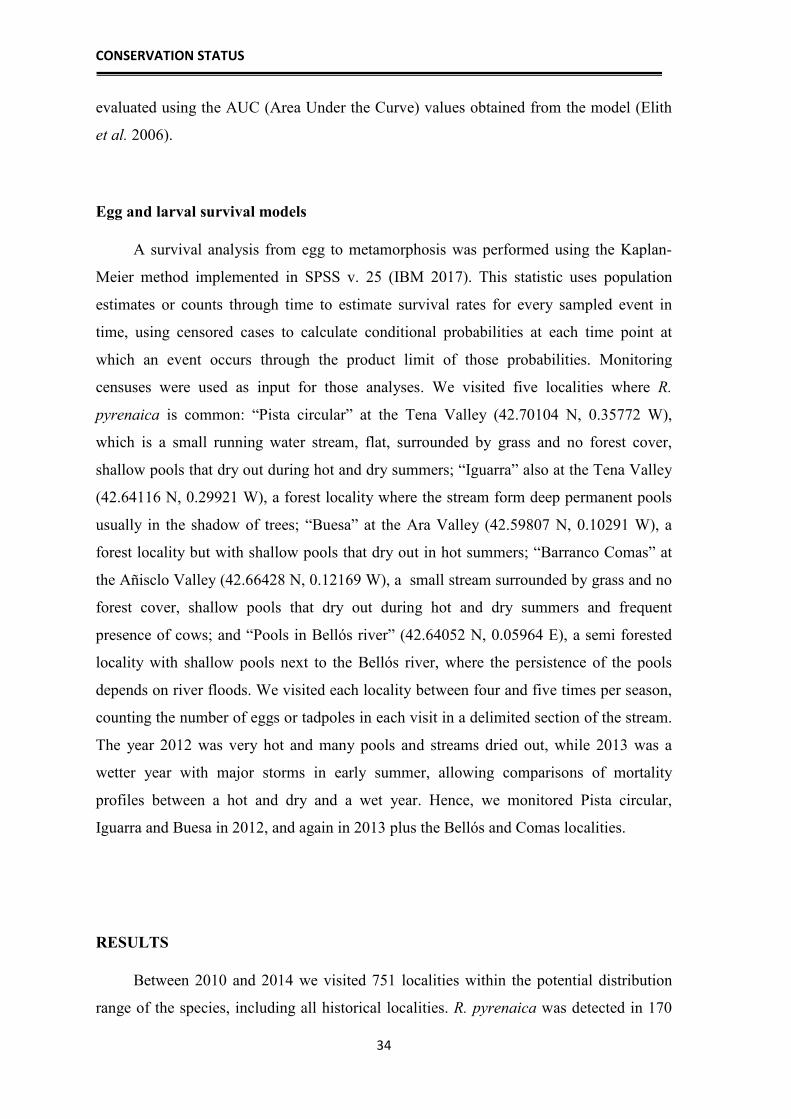
In the Figure 4 is represented the SDM based on 1 km2 layers. The training AUC
was 0.983 and the testing AUC 0.973, suggesting that it is a good model. The variables
that contributed most to the model were: annual mean temperature (43.9%), mean
temperature of the wettest quarter (31.8%), mean temperature of the driest quarter
(11.8%) and precipitation of the warmest quarter (7.1%), contributing all the rest of
variables less than 5% to the model. The model suggests a continuous distribution from
Navarra to Catalonia, including parts of the pre-Pyrenees, most of the French slopes of
the Pyrenees and Catalonia where the species does not occur. Most of the known real
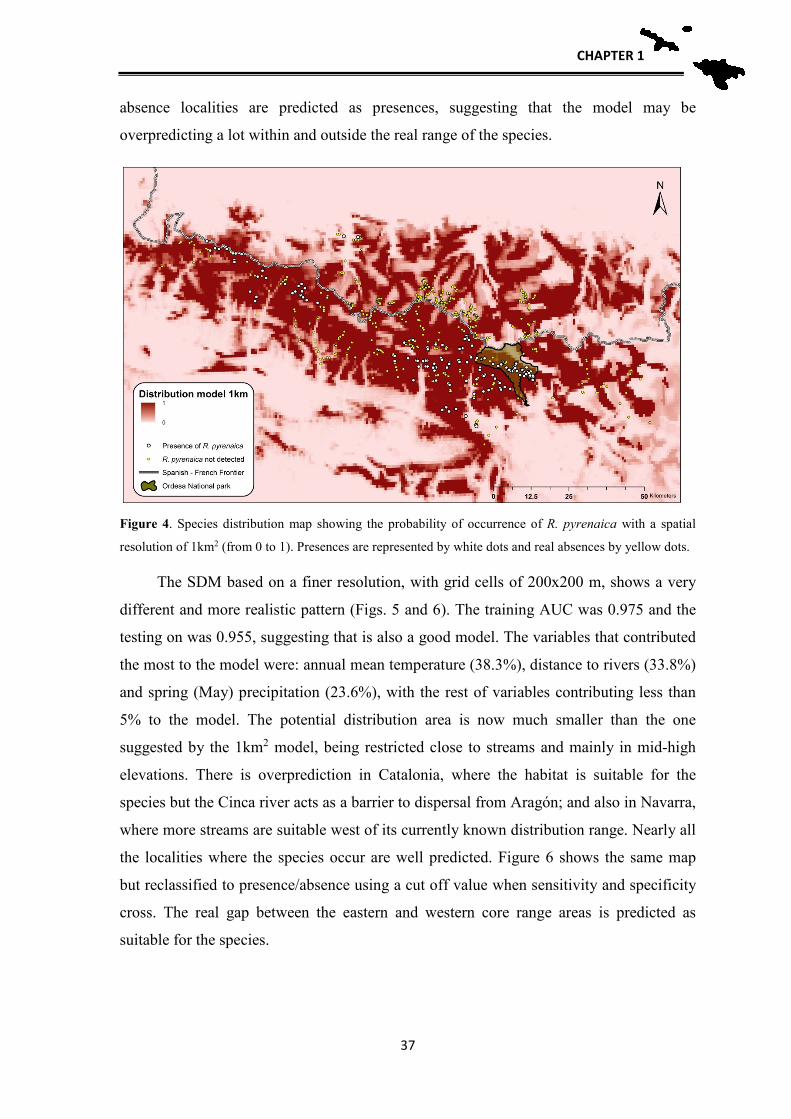
CHAPTER 1
37
absence localities are predicted as presences, suggesting that the model may be
overpredicting a lot within and outside the real range of the species.
Figure 4. Species distribution map showing the probability of occurrence of R. pyrenaica with a spatial
resolution of 1km2 (from 0 to 1). Presences are represented by white dots and real absences by yellow dots.
The SDM based on a finer resolution, with grid cells of 200x200 m, shows a very
different and more realistic pattern (Figs. 5 and 6). The training AUC was 0.975 and the
testing on was 0.955, suggesting that is also a good model. The variables that contributed
the most to the model were: annual mean temperature (38.3%), distance to rivers (33.8%)
and spring (May) precipitation (23.6%), with the rest of variables contributing less than
5% to the model. The potential distribution area is now much smaller than the one
suggested by the 1km2 model, being restricted close to streams and mainly in mid-high
elevations. There is overprediction in Catalonia, where the habitat is suitable for the
species but the Cinca river acts as a barrier to dispersal from Aragón; and also in Navarra,
where more streams are suitable west of its currently known distribution range. Nearly all
the localities where the species occur are well predicted. Figure 6 shows the same map
but reclassified to presence/absence using a cut off value when sensitivity and specificity
cross. The real gap between the eastern and western core range areas is predicted as
suitable for the species.
CONSERVATION STATUS
38
Figure 5. Species distribution map showing the probability of occurrence of R. pyrenaica with a spatial
resolution of 200x200 m (from 0 to 1). Presences are shown by white dots and real absences by yellow dots.
Figure 6. Same map as Figure 5 but reclassified as predicted presence and absence areas.
Our results indicate that the species is more abundant in Aragón, with a general
pattern of small populations with a high degree of fragmentation. The relative density
estimates of Rana pyrenaica suggest that in the localities where the species is present (ca.
31 km of streams out of 140 total sampled kilometers of streams)(see Appendix for more
details) , the breeding adult population ranges between 1166 and 1377 individuals (Fig.
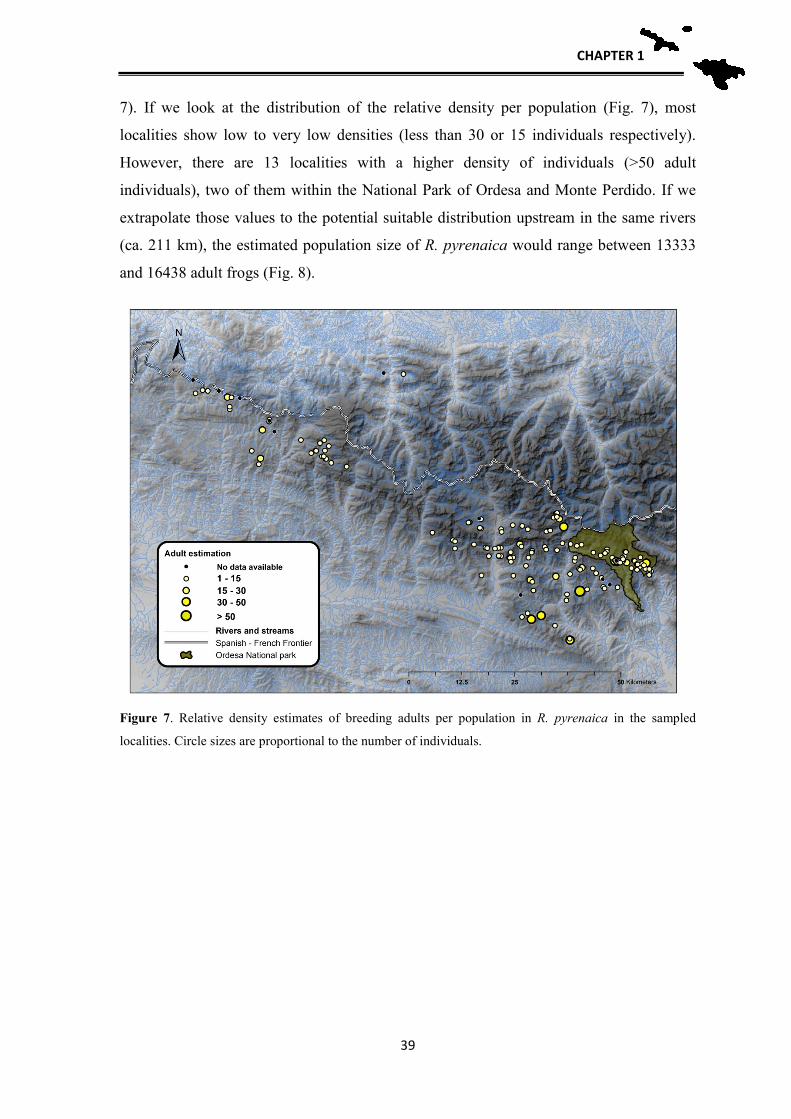
CHAPTER 1
39
7). If we look at the distribution of the relative density per population (Fig. 7), most
localities show low to very low densities (less than 30 or 15 individuals respectively).
However, there are 13 localities with a higher density of individuals (>50 adult
individuals), two of them within the National Park of Ordesa and Monte Perdido. If we
extrapolate those values to the potential suitable distribution upstream in the same rivers
(ca. 211 km), the estimated population size of R. pyrenaica would range between 13333
and 16438 adult frogs (Fig. 8).
Figure 7. Relative density estimates of breeding adults per population in R. pyrenaica in the sampled
localities. Circle sizes are proportional to the number of individuals.
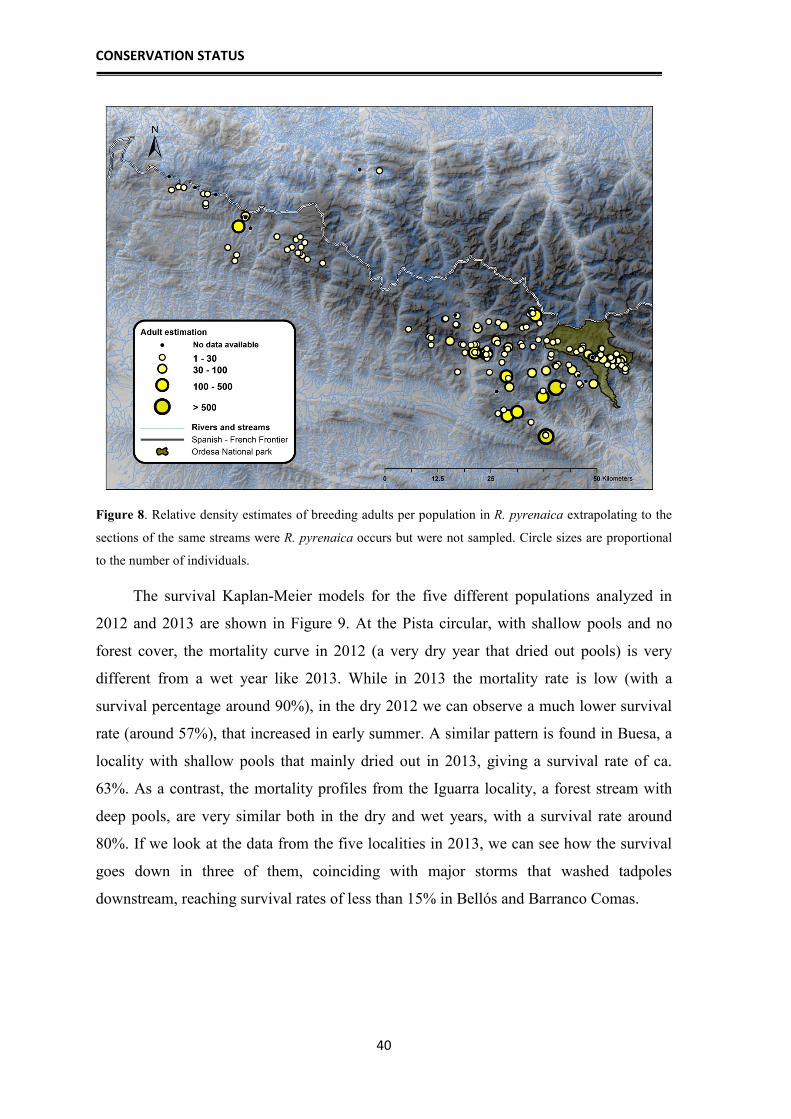
CONSERVATION STATUS
40
Figure 8. Relative density estimates of breeding adults per population in R. pyrenaica extrapolating to the
sections of the same streams were R. pyrenaica occurs but were not sampled. Circle sizes are proportional
to the number of individuals.
The survival Kaplan-Meier models for the five different populations analyzed in
2012 and 2013 are shown in Figure 9. At the Pista circular, with shallow pools and no
forest cover, the mortality curve in 2012 (a very dry year that dried out pools) is very
different from a wet year like 2013. While in 2013 the mortality rate is low (with a
survival percentage around 90%), in the dry 2012 we can observe a much lower survival
rate (around 57%), that increased in early summer. A similar pattern is found in Buesa, a
locality with shallow pools that mainly dried out in 2013, giving a survival rate of ca.
63%. As a contrast, the mortality profiles from the Iguarra locality, a forest stream with
deep pools, are very similar both in the dry and wet years, with a survival rate around
80%. If we look at the data from the five localities in 2013, we can see how the survival
goes down in three of them, coinciding with major storms that washed tadpoles
downstream, reaching survival rates of less than 15% in Bellós and Barranco Comas.

CHAPTER 1
41
DISCUSSION
Conservation actions should be based on data that support them. Despite being one
of the most threatened European amphibian species, the Endangered Pyrenean frog still is
poorly known. There are many gaps of knowledge about its natural history, biology,
genetic variation and phylogeographic structure or barriers to gene flow, despite that
some have been addressed in previous works (Serra-Cobo 1997, 2002, Serra-Cobo et al.
1998, 2000, Vieites & Vences 2003). Moreover, so far, the distribution range, degree of
fragmentation and current population estimates are not clearly defined or not known in
the case of population sizes. Here we provide some of those data that are critical and the
base of sound conservation actions.
We have dedicated many years and effort to visit all the known localities of the
species, as well as sampling a large area in the Pyrenees, both in Spain and France, to try
to locate new populations. We have succeeded by increasing the known distribution range
of the species, as well as confirming real absences across its potential range. We have
used SDMs to guide our fieldwork, by locating potentially suitable areas for the species.
In several of those predicted areas we have found novel populations. The distribution
range of this species is divided in two main core areas: a western one that spans from
Navarra reaching the Hecho valley in Aragón, and an eastern one that goes from the
Aragón River valley to Ordesa and Monte Perdido National Park. Several historical
populations do not harbor this species anymore, and its situation in the Aragón River
Valley in Villanúa seems not good, with very low densities to total absences per site.
The distribution models based on a resolution of 1 km2 and Worldclim data have
been widely used to predict and forecast the distribution of many species including some
close relatives of R. pyrenaica like R. temporaria or R. iberica (Vences et al. 2013,
Teixeira et al. 2018). However, it has been shown that finer layer resolutions can improve
SDMs (Sardá-Palomera & Vieites 2011) as we show here for R. pyrenaica. While the 1
km2 resolution model predicts a wide distribution with a high occupancy of the territory,
it significantly overpredicts both within and outside the range of the species, which was
confirmed by our real absence data. However, at higher resolution (200 m), the pattern is
more realistic, being the distribution mainly determined by annual temperature and
distance to streams, with a smaller influence of spring precipitation. Those variables make
sense when understanding the distribution of the species. This is a lotic species that

CONSERVATION STATUS
42
occurs in and close to streams (Serra Cobo 1997, Vieites & Vences 2003), and we never
have found it more than 100 m far away from streams. Its dispersal capacities are not
known, but there are no observations far from streams. The mean annual temperature is a
good predictor of the elevational temperature gradient in the Pyrenees. The altitudinal
range where the species occurs spans from a few lowland localities to high elevations, but
the species is more common at mid elevations, where the temperature is not too cold
(alpine) or hot (lowlands).
If we compare the models, the one at 200 m resolution presents a more fragmented
distribution linked to streams, and with most of the area of occupancy being much smaller
than the predicted extent of occurrence. Overall, the species presents a very fragmented
distribution, of many isolated populations that seem poorly connected in some areas. We
located the species in 31 km of streams, and if we consider the total length of those
streams where the species is present (including the lengths that we did not sample within
the streams), the area of occupancy for the species would be less than 250 km2. If we
consider the full range, the extent of occurrence will be less than 3100 km2. Within this
area, the estimated population size would be around 13000 to 17000 adult frogs. If we
compare those data with the Pyrenean populations of its sister taxon R. temporaria, we
can see that in a single locality (Ibón de las Ranas, Circo de Piedrafita, Valle de Tena,
Aragón, Spain), the estimated population size at one lake was between 500 to 1100
individuals depending on the year (Vieites 2003), hence the population sizes of R.
pyrenaica in the same area are objectively very small. Despite that they occur in the same
valleys of the Pyrenees, and were subject to the same historical and climatic processes,
both species responded differently to them. While R. temporaria has populations with
high densities in lakes across the Pyrenees, the population size of any R. pyrenaica
locality is far below from the observed values in R. temporaria. A potential hypothesis of
these differences is habitat specializations. Streams are not as stable as lakes and stagnant
pools. They are affected by floods, droughts, and during the glaciations they were covered
by ice, forcing a lowland retreat to any stream species (López-García et al. 2010).
We considered modeling the species potential distribution under future climate
scenarios for the 2050 and 2070 following IPCC RCPs predictions (IPCC 2014). Those
climatic layers are available at 1 km2, and we have shown that at that resolution the model
under current climate is not very realistic, hence, we discarded this option. However,
future climate is predicted to be hotter, with an increase in temperatures at the southern

CHAPTER 1
43
slopes of the Pyrenees, as well as a decrease in precipitation (López-Moreno et al. 2008).
This means an increase of droughts and pool dry outs in areas where R. pyrenaica occurs.
Survival data suggest that the mortality of larval stages and clutches is mainly determined
by two factors: dry out of stream pools and stochastic storm floods that wash away and
kill tadpoles. Both factors can be critical or not depending on the microhabitat structure.
In streams protected by forests and with deep permanent pools, the impact of both floods
and droughts seems non-existent. However, in localities where the is no forest cover, and
especially where the pools are not deep enough, the mortality rates increase significantly
both in hot years because of dry outs, and in wet years because of storm floods that are
frequent in summer. The intensity and frequency of floods seems to be decreasing in the
Pyrenees, especially in forested areas (López-Moreno et al. 2008), but at least half of the
localities where R. pyrenaica occur do not have forest cover, mainly in Aragón. Under
future climatic conditions, it is likely that these two factors will be a main issue for the
local survivorship of the species. However, management actions to solve this issue are
easy to implement, as making pools deeper is a cheap and affordable conservation action.
It would be interesting to perform experiments where the mortality rates in artificially
deepened pools and controls are compared to measure the utility of this action.
Our data support the Endangered status for this species following IUCN criteria, as
it shows a very fragmented distribution, with small populations sizes, an extent of
occurrence <5000 km2, and an area of occupancy <500 km2. This species is not yet
included in the European Habitat's directive as a priority species for conservation, which
should be implemented being a priority for local and state governments.

CONSERVATION STATUS
44
Acknowledgements
We are grateful to many people that made this project possible. Several students
and collaborators helped in fieldwork in the Pyrenees, including Carlos Zaragoza, Javier
Santos, Rubén González, Miguel Vences, Nina Bernard, Guillermo Ponz and Isabel
Perandones. Fernando Carmena and Ignacio Gómez from SARGA in Aragón, and Iosu
Antón in Navarra were extremely helpful in the field, allowing locating many known
populations. Ramon Antor Casterllanau provided logistic help to prepare and carry on
fieldwork. Manuel Alcántara, David Guzmán and Jose Luis Burrel from the Aragón
government showed their total collaboration and help during the whole length of the
project. Forest rangers helped us during the fieldwork, and the public company
Sodemasa, now SARGA, provided logistic support in Ordesa in 2011. MPF was financed
with a grant by CNPq under Science Without Borders program by Brazil Ministry of
Science. We thank the Governments of Aragon and Navarra for collecting permits. This
work was funded by a research project of the Zoo de Barcelona (Ayuntamiento de
Barcelona) as well as by a research project from the Parques Nacionales OPAN –
MMARM to DRV.
References
Bosch, J., Tejedo, M., Miaud, C., Martínez-Solano, I., Salvador, A., García-París, M.,
Recuero Gil, E., Marquez, R., Díaz Paniagua, C., Geniez, P. (2009) Rana pyrenaica
Serra-Cobo, 1993. Pyrenean frog. Pp. 510. En: Stuart, S. N., Hoffmann, M.,
Chanson, J. S., Cox, N. A., Berridge, R. J., Ramani, P., & Young, B. E. (eds.).
Threatened Amphibians of the World. IUCN, Conservation International. Lynx,
Barcelona . 758 pp.
Duchateau, S., Berroneau, M., Cantegrel, L., Goyeneche, L., de Reinach Hirtzbach, J.,
Tillo, S. (2012) Decouverte de Rana pyrenaica Serra-Cobo, 1993 (Anura, Ranidae)
sur le versant nord des Pyrenees. Bulletin de la Societé Herpetologique de France,
142-143: 51-63.
Duguet, R., & Melki, F. (eds.). (2003) Les Amphibiens de France, Belgique et
Luxemburg. Collection Parthénope, éditions Biotope, Mèze.
EEA – European Environment Agency: Corine Land Cover 2006 raster data,
www.eea.europa.eu/data-and-maps/data/corine-land-cover-2006-raster accessed:
August, 2015
Elith, J., Graham, C. H., Anderson, R. P., Dudík, M., Ferrier, S., Guisan, A., Hijmans, R.
J., Huettmann, F., Leathwick, J. R., Lehmann, A., Li, J., Lohmann, L. G., Loiselle,
B. A., Manion, G., Moritz, C., Nakamura, M., Nakazawa, Y., Overton, J. McC.,
Peterson, A. T., Phillips, S. J., Richardson, K., Scachetti‐Pereira, R., Schapire, R. E.,
Soberón, J., Williams, S., Wisz, M. S., Zimmermann, N. E., & Li, J. (2006) Novel
methods improve prediction of species’ distributions from occurrence data.
Ecography, 29(2), 129-151.

CHAPTER 1
45
Hijmans, R. J., Cameron, S. E., Parra, J. L., Jones, P. G., & Jarvis, A. (2005) Very high
resolution interpolated climate surfaces for global land areas. International Journal
of Climatology, 25(15), 1965–1978. http://doi.org/10.1002/joc.1276
IBM Corp. Released (2017) IBM SPSS Statistics for Windows, Version 25.0. Armonk,
NY: IBM Corp.
IPCC AR5 2014. http://www.ipcc.ch/report/ar5/index.shtml
Jarvis A., H.I. Reuter, A. Nelson, E. Guevara, 2006, Hole-filled seamless SRTM data V3,
International Centre for Tropical Agriculture (CIAT), available from
http://srtm.csi.cgiar.org.
Llamas, A., Martínez-Gil, O., Arribas, O. (1994) Estudio de la distribución y hábitat de
Rana pyrenaica Serra-Cobo, 1993. Departamento de Medio Ambiente, Gobierno de
Navarra. Inédito.
Llamas, A., Martínez-Gil, O., Arribas, O. (1998) Rana pyrenaica, a new species for the
French herpetofauna. Boletín de la Sociedad Herpetológica Española 9: 12-13.
López-Moreno, J. I., Goyette, S., & Beniston, M. (2008) Climate change prediction over
complex areas: spatial variability of uncertainties and predictions over the Pyrenees
from a set of regional climate models. International Journal of Climatology, 28,
1535–1550. http://doi.org/10.1002/jocLópez-García, J.M., Blain, H.A., Allué, E.,
Bañuls, S., Bargalló, A., Martín, P., Morales, J.I., Pedro, M., Rodríguez, A., Solé,
A., & Oms, F. X. (2010) First fossil evidence of an “interglacial refugium” in the
Pyrenean region. Naturwissenschaften, 97(8): 753-761.
López-Moreno, J. I., Beniston, M., & Garcia-Ruiz, J. M. (2006) Trends in High flows in
the Central Spanish Pyrenees: response to climatic factors or to land use change?
Hydrological Sciences Journal, 51, 1039–1050.
http://doi.org/10.1623/hysj.51.6.1039
Meehl, G. A., & Tebaldi, C. (2004) More Intense , More Frequent , and Longer Lasting
Heat Waves in the 21st Century. Science, 305, 994–997.
http://doi.org/10.1126/science.1098704
Ninyerola, M., Pons, X., & Roure. J. M. (2005) Atlas climático digital de la Península
Ibérica. Metodología y aplicaciones en bioclimatología y geobotánica. Universidad
Autónoma de Barcelona, Bellaterra, Spain.
Ortega-Martínez, M., Ferrer-Justes, C. (2000) Los anfibios del Alto Aragón. Cuadernos
Altoaragoneses de Trabajo, 23. Instituto de Estudios Altoaragoneses, Huesca.
Phillips, S. J., & Dudík, M. (2008) Modeling of species distributions with Maxent: new
extensions and a comprehensive evaluation. Ecography, 31(2), 161-175.
Pleguezuelos, J. M., Márquez, R., & Lizana, M. (eds.) (2002) Atlas y Libro Rojo de los
Anfibios y Reptiles de España. Dirección General de Conservación de la
Naturaleza-Asociación Herpetologica Española (2ª impresión), Madrid, 587 pp.
QGIS Development Team (2018) QGIS Geographic Information System. Open Source
Geospatial Foundation Project. http://qgis.osgeo.org
CONSERVATION STATUS
46
Sardà-Palomera, F., & Vieites, D. R. (2011) Modelling Species’ Climatic Distributions
Under Habitat Constraints: A Case Study with Coturnix coturnix, 48(3), 147–160.
Serra-Cobo, J. (1993) Descripción de una nueva especie europea de rana parda
(Amphibia, Anura, Ranidae). Alytes, 11: 1-15.
Serra-Cobo, J. (1997) Rana pyenaica Serra-Cobo, 1993. En: Pleguezuelos, J.M. (ed.),
Distribución y biogeografía de los anfibios y reptiles de España y Portugal pp.167-
168. Universidad de Granada-Asociación Herpetológica Española, Granada.
Serra-Cobo, J., Lacroix, G. & White, S. (1998) Comparison between the ecology of the
new European frog Rana pyrenaica and that of four Pyrenean amphibians. Journal
of Zoology London, 246: 147-154.
Serra-Cobo, J., Marques, T., Martínez-Rica, J.P. (2000) Ecological segregation between
Rana pyrenaica and Rana temporaria, and differential predation of Euproctus asper
on their tadpoles. Netherlands Journal of Zoology, 50 (1): 65-73.
Serra-Cobo, J. (2002) Rana pyrenaica Serra-Cobo, 1993. En: Pleguezuelos, J.M.,
Márquez, R., Lizana, M. (eds.). Atlas y libro rojo de los anfibios y reptiles de
España, pp. 129-130.Ministerio de Medio Ambiente- Asociación Herpetológica
Española, Madrid.
Teixeira, J., Gonçalves, H., Ferrand, N., García-París, M., & Recuero, E. (2018)
Mitochondrial phylogeography of the Iberian endemic frog Rana iberica, with
implications for its conservation. Current Zoology, 1–10.
https://doi.org/10.1093/cz/zoy010
Vences, M., Kupfer, A., Llorente, G., Montori, A., Carretero, M. (1997) Description of
the larval stages of the Pyrenean frog, Rana pyrenaica Serra-Cobo, 1993
(Amphibia: Ranidae). Bolletino del Museo Regionale di Scienze Naturali, Torino 15
(1): 1-23.
Vences, M., Hauswaldt S., Steinfartz S., Rupp, O., Goesmann, A., Künzel, S., Orozco-
Terwengel, P., Vieites, D.R., Nieto-Roman, S., Haas, S., Laugsch, C., Gehara, M.,
Bruchmann, S., Pabijan, M., Ludewig, A.K., Rudert, D., Angelini, C., Borkin, L.J.,
Crochet, P.A., Crottini, A., Dubois, A., Ficetola, F., Galán, P., Geniez, P., Hachtel,
M., Jovanovic, O., Litvinchuk, S.N., Lymberakis, P., Ohler, A., Smirnov, N.A.
(2013) Radically different phylogeographies and patterns of genetic variation in two
European brown frogs, genus Rana. Molecular Phylogenetics and Evolution, 68:
657–670.
Vieites, D.R., Vences, M. (2003) Rana pirenaica – Rana pyrenaica. En: Enciclopedia
Virtual de los Vertebrados Españoles. Salvador, A., (ed). Museo Nacional de
Ciencias Naturales, Madrid. http://www.vertebradosibericos.org/
Vieites, D.R. (2003) Temporal and spatial dynamics of a high mountain metapopulation
of Rana temporaria. Ph.D. Thesis. Universidade de Vigo.

APPENDIX CHAPTER 1
47
Appendix As this is an endangered species we decided not to publish coordinates for all
localities to prevent potential conservation problems. These locality information has been
provided only to the pertinent authorities in Aragón and Navarra governments.
Tables
Table A.1. Sampled river length and estimated number of adults (minimum and maximum) for each
locality.
Locality Sampled river length
(m)
Minimum population
estimated
Maximum population
estimated
Kontrasario 290 10 10
Afluente Kontrasario 100 3 3
Errekabeltza 100 No data No data
Erlán 404 13 13
Errekaundia 363 23 23
Landatxikina 338 3 3
Ibarrondoa 100 No data No data
Gonostierreka 323 3 3
Koitxa 262 5 5
Kumuxiloa 100 13 13
Burguiarte 201 No data No data
Iriola 108 3 3
Arroyo 174 23 23
Olerrea 100 No data No data
Maze (pool) 1 3 3
Petrechema (pool) 1 3 3
Maz 86 3 5
Gamueta 336 3 5
As Eras (pool) 1 5 8
La Contienda 171 3 3
La Contienda 2 88 5 5
Manantial de Estebe 100 3 3
Belabarze 350 3 3
Pinaré (pool) 1 5 8
Fuen Fria 183 5 5
Birriés 85 25 25
Baldagrás 400 10 13
Paralelo al Baldagras 269 8 10
Mazandú 771 3 3
Vidangoz 276 5 5

CONSERVATION STATUS
48
Locality Sampled river length
(m)
Minimum population
estimated
Maximum population
estimated
Tortiellas 748 3 3
Cardal 100 5 5
Anterior al Cardal (pool) 1 5 8
Embalse lado puente (pool) 1 3 3
Turbera Ordiso (pool) 1 3 3
Ordiso tras 1 caida 100 3 3
Bajo Rocín Veriza 110 No data No data
Salto Pitx 100 25 25
Parpalo 146 3 3
Cuneta1 (pool) 1 5 5
Afluente As Vacas 195 15 15
As Vacas 568 3 3
Trabenosa 978 3 3
Afluente Ripera 131 3 3
Cuneta pista Bujaruelo
(pool) 1 38 38
Pista circular f (pool) 1 3 3
Pista circular e 315 3 3
Pista circular sv 105 8 8
San Lorenzo 78 3 3
Afluente Ripera 2 276 8 8
Afluente del Ordiso 1 224 3 3
Afluente del Ordiso 2 344 10 10
Río Ordiso 353 8 8
Coronazo 73 3 3
Aljibe Pista Collarada (pool) 1 3 3
Manantiales Costera 100 3 3
Cantal 68 1 3
Comas 683 3 3
Infierno 284 30 30
Sopeliana 100 3 3
Puerto Biescas 100 3 5
Carriata 100 3 5
Canal (pool) 1 3 3
Artica 375 3 3
Suaso 530 3 3
Planas de Abozo 100 3 3
Afluente Lasieso 82 5 5
Lasieso (pool) 1 5 5
Cuneta2 100 3 3
Cecutar 100 3 3
Afluente Lasieso 2 1376 3 3

APPENDIX CHAPTER 1
49
Locality Sampled river length
(m)
Minimum population
estimated
Maximum population
estimated
Fuen Mochera (pool) 1 5 8
Sarieso (pool) 1 3 3
San Antón 500 10 13
Puerto Yésero 155 8 8
Afluente Arazas 1 569 3 3
Afluente Arazas 2 113 3 3
Afluente Arazas3 223 10 10
Pozas Bellós (pool) 1 3 3
Fuen deros Baños 100 3 3
Cuneta3 (pool) 1 3 3
Cascata (pool) 1 3 3
Ollas 100 5 5
Afluente Arazas 4 100 5 5
Praderas Ordesa 734 3 3
Canal del Señor 100 3 3
Cuneta Estabuen (pool) 1 3 3
Estabuen 100 10 10
Capradiza 100 3 5
Iguarra 100 10 10
Aljibe Puerto Biescas (pool) 1 5 5
Bartolomé de Gavin 88 8 8
Lapayón 100 3 3
Aljibe (pool) 1 3 3
Caprariza 62 3 3
Embalse Diazas (pool) 1 5 5
Afl. Puerto Yesero (pool) 1 3 3
Afluente Arazas5 100 3 13
San Bartolomé (pool) 1 3 3
Fuen Carduso 100 3 3
Paralelo a Fuen Carduso 300 5 8
Yaba 300 20 25
Afluente Pardina 100 5 10
Paralelo Refoba 300 3 5
Afluente Berná 2 400 5 28
Afluente Fuen Berná 1 385 No data No data
Bco Diaza 261 5 8
Fuen Berná 400 No data No data
Refoba 300 3 3
Coma 119 35 45
Afluente Bartolomé Gavín 300 8 20
Artica Torre 200 1 3

CONSERVATION STATUS
50
Locality Sampled river length
(m)
Minimum population
estimated
Maximum population
estimated
Afluente Comas 400 8 10
San Vicenda 351 30 30
Afluente Yaga 2 150 1 3
Afluente Fuen Berná 2 156 20 25
Garganta Escuaín 132 28 38
Calzil 200 3 3
La Ralla 300 3 3
Brocal 300 3 3
Yaga 100 3 3
Charca 100 1 3
Gurrundué 1 97 8 8
Gurrundué 2 52 5 5
Piñal 490 20 20
Mallo Sasé 375 3 3
Borrué 100 3 3
Chate 371 5 8
Afluente Yaga 3 161 8 8
Furcos 291 3 3
Rosico 100 3 3
Del Lugar (pool) 1 5 8
Afluente Lugar (pool) 1 5 8
As Gloces 100 3 3
Val de Jalle 100 13 13
La Fuen 100 5 8
Afluente la Fuen 100 5 8
Manabí 100 3 5
Escuer alto 100 3 3
Dos Lucas 600 5 5
Labate bajo 254 23 23
La Grada 200 10 10
Guampe 71 No data No data
Otal 165 13 18
Artosa 205 3 3
Aso (pool) 1 No data No data
Fuen del Obispo 100 3 3
Espierlo 100 3 3
La Valle (pool) 1 3 3
Otal 2 118 3 5
Pista Rosada 100 78 105
Pardinas 308 5 5
Escuer 82 13 13

APPENDIX CHAPTER 1
51
Locality Sampled river length
(m)
Minimum population
estimated
Maximum population
estimated
Anterior al Lata 100 3 3
Sasa 100 25 33
La Valle Fiscal 762 3 5
La Lata 100 25 33
Fiscal 304 5 5
San Juste (pool) 1 3 3
Camino (pool) 1 3 3
Afluente San Juste 82 38 50
Fuen de Olivan (pool) 1 3 5
AfluenteYaga 4 430 5 5
Biandisco Aso 92 10 10
Mosquera 71 8 8
Cuneta San Barotomé (pool) 1 5 5
Cabecera Yaga (pool) 1 3 3
Arpeko Oihaneko no data No data No data
Francia 1 no data No data No data
Saillen 100 3 3
TOTAL 31232 1166 1377
Table A.2. Upstream river length not sampled at localities with R. pyrenaica presence and minimum and
maximum extrapolated adult population size.
Locality Upstream river
lenght (m)
Minimum population
estimated
Maximum population
estimated
Kontrasario 1494 53 53
Afluente Kontrasario 2293 58 58
Errekabeltza 1115 No data No data
Erlán 872 28 28
Errekaundia 363 25 25
Landatxikina 739 8 8
Ibarrondoa 2272 No data No data
Gonostierreka 1593 13 13
Koitxa 1280 25 25
Kumuxiloa 1017 128 128
Burguiarte 869 No data No data
Iriola 1465 35 35
Arroyo 2312 300 300
Olerrea 1229 0 0
Maze (pool) 0 0 0
Petrechema (pool) 0 0 0
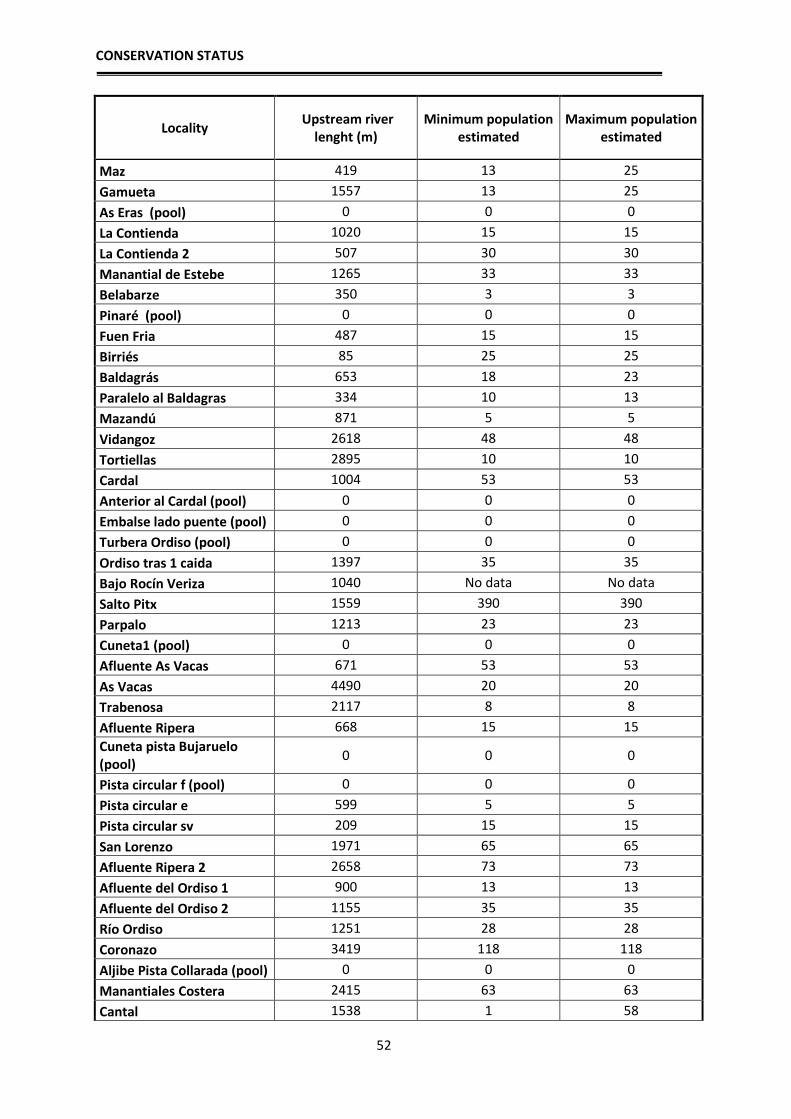
CONSERVATION STATUS
52
Locality Upstream river
lenght (m)
Minimum population
estimated
Maximum population
estimated
Maz 419 13 25
Gamueta 1557 13 25
As Eras (pool) 0 0 0
La Contienda 1020 15 15
La Contienda 2 507 30 30
Manantial de Estebe 1265 33 33
Belabarze 350 3 3
Pinaré (pool) 0 0 0
Fuen Fria 487 15 15
Birriés 85 25 25
Baldagrás 653 18 23
Paralelo al Baldagras 334 10 13
Mazandú 871 5 5
Vidangoz 2618 48 48
Tortiellas 2895 10 10
Cardal 1004 53 53
Anterior al Cardal (pool) 0 0 0
Embalse lado puente (pool) 0 0 0
Turbera Ordiso (pool) 0 0 0
Ordiso tras 1 caida 1397 35 35
Bajo Rocín Veriza 1040 No data No data
Salto Pitx 1559 390 390
Parpalo 1213 23 23
Cuneta1 (pool) 0 0 0
Afluente As Vacas 671 53 53
As Vacas 4490 20 20
Trabenosa 2117 8 8
Afluente Ripera 668 15 15
Cuneta pista Bujaruelo
(pool) 0 0 0
Pista circular f (pool) 0 0 0
Pista circular e 599 5 5
Pista circular sv 209 15 15
San Lorenzo 1971 65 65
Afluente Ripera 2 2658 73 73
Afluente del Ordiso 1 900 13 13
Afluente del Ordiso 2 1155 35 35
Río Ordiso 1251 28 28
Coronazo 3419 118 118
Aljibe Pista Collarada (pool) 0 0 0
Manantiales Costera 2415 63 63
Cantal 1538 1 58
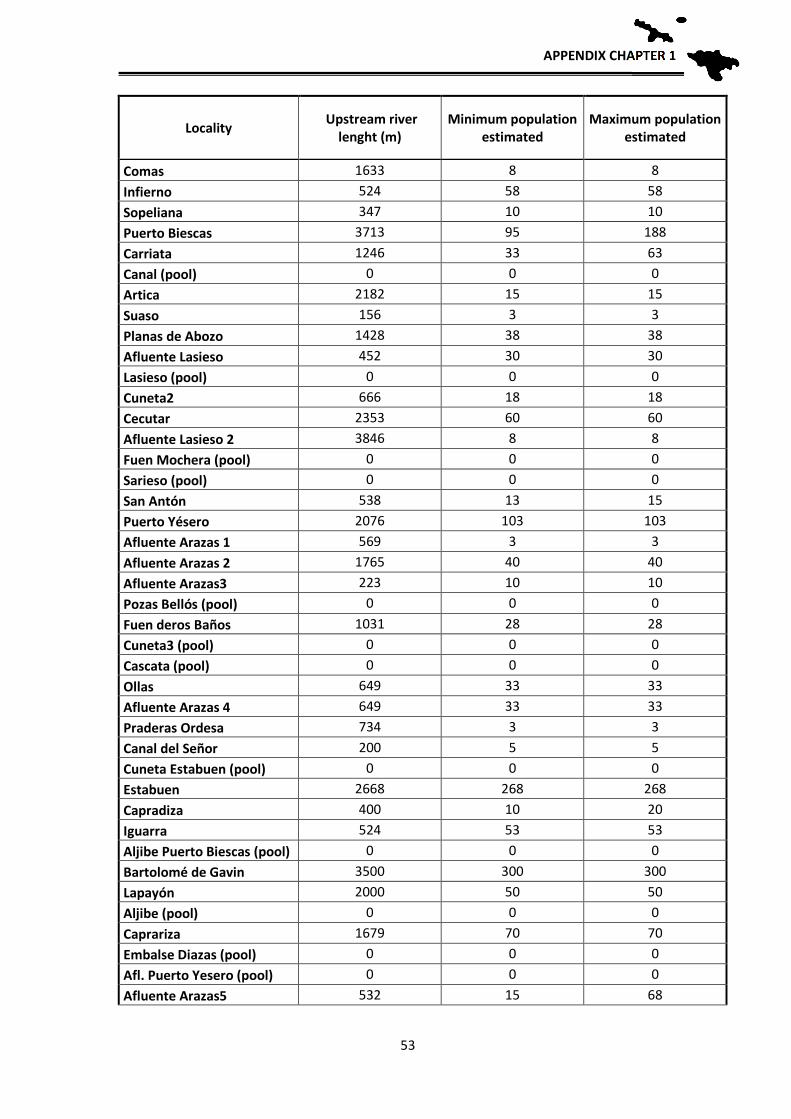
APPENDIX CHAPTER 1
53
Locality Upstream river
lenght (m)
Minimum population
estimated
Maximum population
estimated
Comas 1633 8 8
Infierno 524 58 58
Sopeliana 347 10 10
Puerto Biescas 3713 95 188
Carriata 1246 33 63
Canal (pool) 0 0 0
Artica 2182 15 15
Suaso 156 3 3
Planas de Abozo 1428 38 38
Afluente Lasieso 452 30 30
Lasieso (pool) 0 0 0
Cuneta2 666 18 18
Cecutar 2353 60 60
Afluente Lasieso 2 3846 8 8
Fuen Mochera (pool) 0 0 0
Sarieso (pool) 0 0 0
San Antón 538 13 15
Puerto Yésero 2076 103 103
Afluente Arazas 1 569 3 3
Afluente Arazas 2 1765 40 40
Afluente Arazas3 223 10 10
Pozas Bellós (pool) 0 0 0
Fuen deros Baños 1031 28 28
Cuneta3 (pool) 0 0 0
Cascata (pool) 0 0 0
Ollas 649 33 33
Afluente Arazas 4 649 33 33
Praderas Ordesa 734 3 3
Canal del Señor 200 5 5
Cuneta Estabuen (pool) 0 0 0
Estabuen 2668 268 268
Capradiza 400 10 20
Iguarra 524 53 53
Aljibe Puerto Biescas (pool) 0 0 0
Bartolomé de Gavin 3500 300 300
Lapayón 2000 50 50
Aljibe (pool) 0 0 0
Caprariza 1679 70 70
Embalse Diazas (pool) 0 0 0
Afl. Puerto Yesero (pool) 0 0 0
Afluente Arazas5 532 15 68
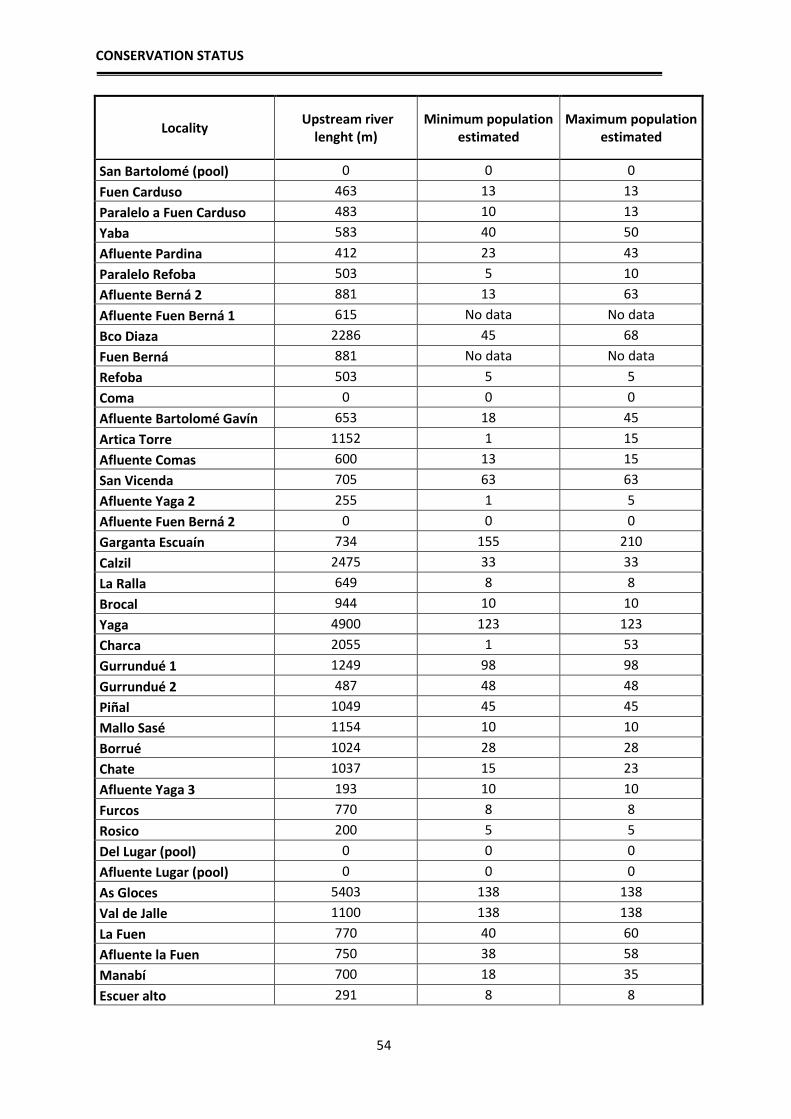
CONSERVATION STATUS
54
Locality Upstream river
lenght (m)
Minimum population
estimated
Maximum population
estimated
San Bartolomé (pool) 0 0 0
Fuen Carduso 463 13 13
Paralelo a Fuen Carduso 483 10 13
Yaba 583 40 50
Afluente Pardina 412 23 43
Paralelo Refoba 503 5 10
Afluente Berná 2 881 13 63
Afluente Fuen Berná 1 615 No data No data
Bco Diaza 2286 45 68
Fuen Berná 881 No data No data
Refoba 503 5 5
Coma 0 0 0
Afluente Bartolomé Gavín 653 18 45
Artica Torre 1152 1 15
Afluente Comas 600 13 15
San Vicenda 705 63 63
Afluente Yaga 2 255 1 5
Afluente Fuen Berná 2 0 0 0
Garganta Escuaín 734 155 210
Calzil 2475 33 33
La Ralla 649 8 8
Brocal 944 10 10
Yaga 4900 123 123
Charca 2055 1 53
Gurrundué 1 1249 98 98
Gurrundué 2 487 48 48
Piñal 1049 45 45
Mallo Sasé 1154 10 10
Borrué 1024 28 28
Chate 1037 15 23
Afluente Yaga 3 193 10 10
Furcos 770 8 8
Rosico 200 5 5
Del Lugar (pool) 0 0 0
Afluente Lugar (pool) 0 0 0
As Gloces 5403 138 138
Val de Jalle 1100 138 138
La Fuen 770 40 60
Afluente la Fuen 750 38 58
Manabí 700 18 35
Escuer alto 291 8 8
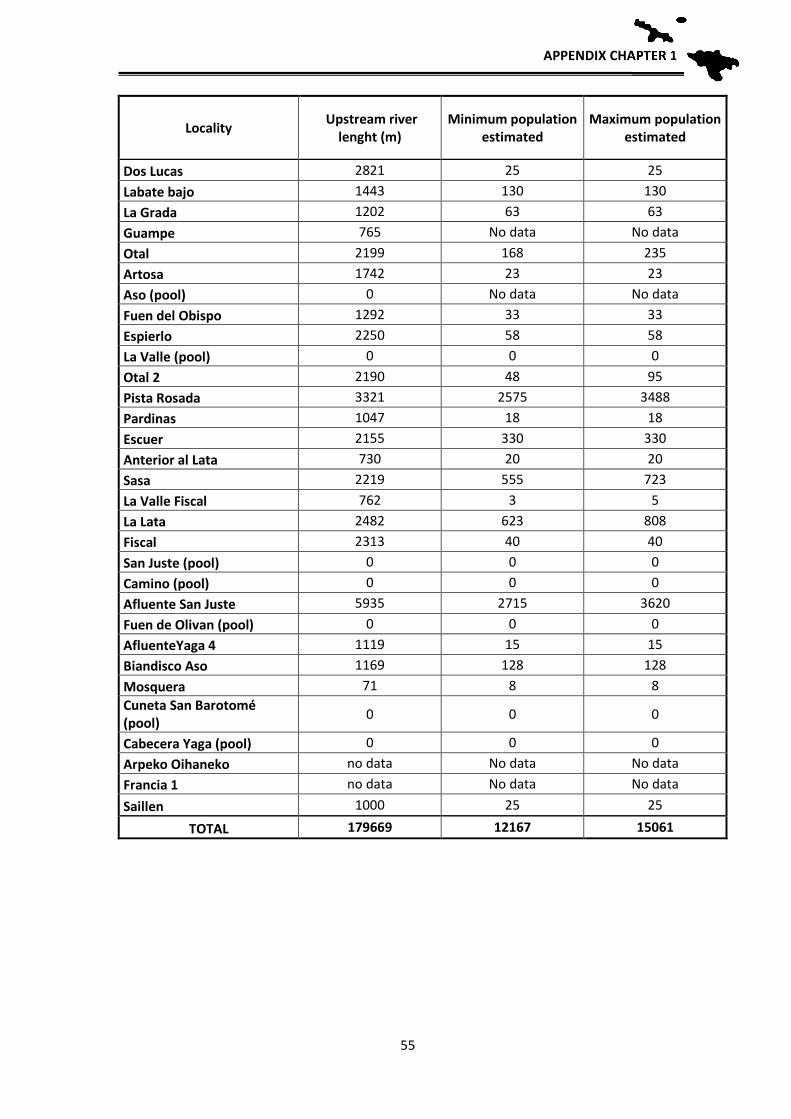
APPENDIX CHAPTER 1
55
Locality Upstream river
lenght (m)
Minimum population
estimated
Maximum population
estimated
Dos Lucas 2821 25 25
Labate bajo 1443 130 130
La Grada 1202 63 63
Guampe 765 No data No data
Otal 2199 168 235
Artosa 1742 23 23
Aso (pool) 0 No data No data
Fuen del Obispo 1292 33 33
Espierlo 2250 58 58
La Valle (pool) 0 0 0
Otal 2 2190 48 95
Pista Rosada 3321 2575 3488
Pardinas 1047 18 18
Escuer 2155 330 330
Anterior al Lata 730 20 20
Sasa 2219 555 723
La Valle Fiscal 762 3 5
La Lata 2482 623 808
Fiscal 2313 40 40
San Juste (pool) 0 0 0
Camino (pool) 0 0 0
Afluente San Juste 5935 2715 3620
Fuen de Olivan (pool) 0 0 0
AfluenteYaga 4 1119 15 15
Biandisco Aso 1169 128 128
Mosquera 71 8 8
Cuneta San Barotomé
(pool) 0 0 0
Cabecera Yaga (pool) 0 0 0
Arpeko Oihaneko no data No data No data
Francia 1 no data No data No data
Saillen 1000 25 25
TOTAL 179669 12167 15061

CONSERVATION STATUS
56
Table A.3. Total stream length at R. pyrenaica populations and total minimum and maximum population
estimated.
Locality
Total river lenght
(sampled + potential)
(m)
Minimum Total
population (Sampled
+ Potential)
Maximum Total
population (Sampled
+ Potential)
Kontrasario 1784 63 63
Afluente Kontrasario 2393 61 61
Errekabeltza 1215 No data No data
Erlán 1276 41 41
Errekaundia 726 48 48
Landatxikina 1077 11 11
Ibarrondoa 2372 No data No data
Gonostierreka 1916 16 16
Koitxa 1542 30 30
Kumuxiloa 1117 141 141
Burguiarte 1070 No data No data
Iriola 1573 38 38
Arroyo 2486 323 323
Olerrea 1329 No data No data
Maze (pool) 1 3 3
Petrechema (pool) 1 3 3
Maz 505 16 30
Gamueta 1893 16 30
As Eras (pool) 1 5 8
La Contienda 1191 18 18
La Contienda 2 595 35 35
Manantial de Estebe 1365 36 36
Belabarze 700 6 6
Pinaré (pool) 1 5 8
Fuen Fria 670 20 20
Birriés 170 50 50
Baldagrás 1053 28 36
Paralelo al Baldagras 603 18 23
Mazandú 1642 8 8
Vidangoz 2894 53 53
Tortiellas 3643 13 13
Cardal 1104 58 58
Anterior al Cardal (pool) 1 5 8
Embalse lado puente (pool) 1 3 3
Turbera Ordiso (pool) 1 3 3
Ordiso tras 1 caida 1497 38 38
Bajo Rocín Veriza 1150 No data No data
Salto Pitx 1659 415 415
Parpalo 1359 26 26
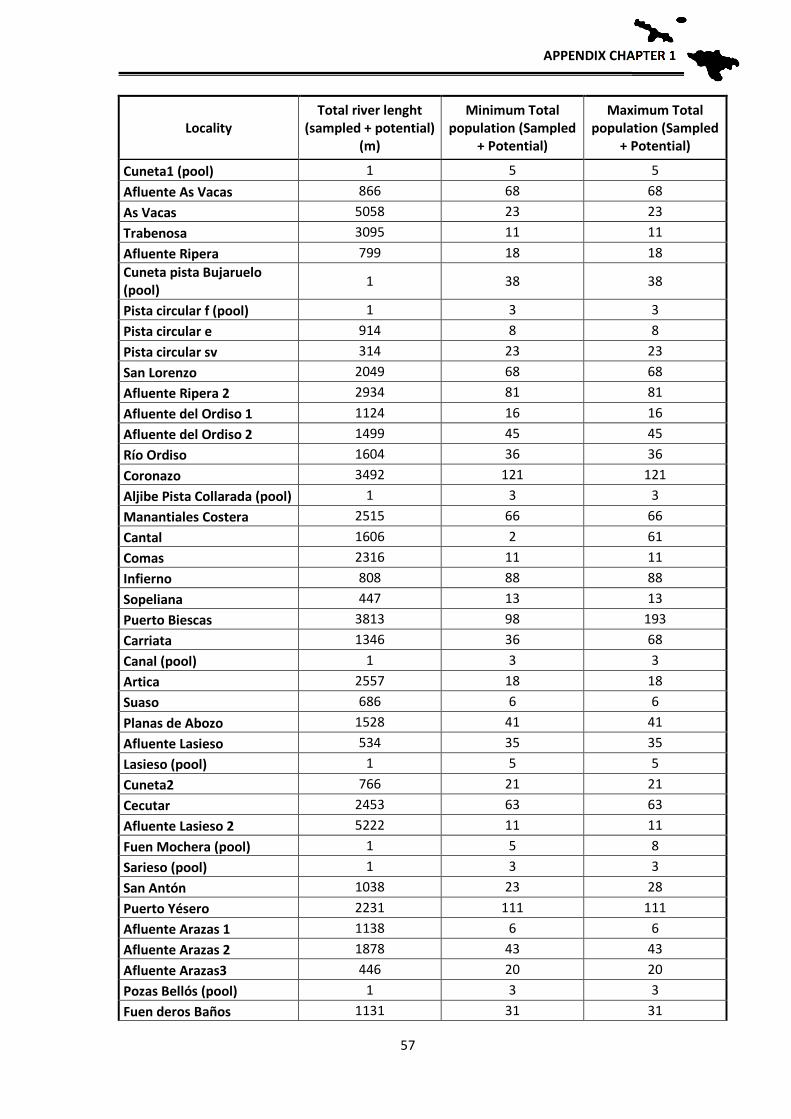
APPENDIX CHAPTER 1
57
Locality
Total river lenght
(sampled + potential)
(m)
Minimum Total
population (Sampled
+ Potential)
Maximum Total
population (Sampled
+ Potential)
Cuneta1 (pool) 1 5 5
Afluente As Vacas 866 68 68
As Vacas 5058 23 23
Trabenosa 3095 11 11
Afluente Ripera 799 18 18
Cuneta pista Bujaruelo
(pool) 1 38 38
Pista circular f (pool) 1 3 3
Pista circular e 914 8 8
Pista circular sv 314 23 23
San Lorenzo 2049 68 68
Afluente Ripera 2 2934 81 81
Afluente del Ordiso 1 1124 16 16
Afluente del Ordiso 2 1499 45 45
Río Ordiso 1604 36 36
Coronazo 3492 121 121
Aljibe Pista Collarada (pool) 1 3 3
Manantiales Costera 2515 66 66
Cantal 1606 2 61
Comas 2316 11 11
Infierno 808 88 88
Sopeliana 447 13 13
Puerto Biescas 3813 98 193
Carriata 1346 36 68
Canal (pool) 1 3 3
Artica 2557 18 18
Suaso 686 6 6
Planas de Abozo 1528 41 41
Afluente Lasieso 534 35 35
Lasieso (pool) 1 5 5
Cuneta2 766 21 21
Cecutar 2453 63 63
Afluente Lasieso 2 5222 11 11
Fuen Mochera (pool) 1 5 8
Sarieso (pool) 1 3 3
San Antón 1038 23 28
Puerto Yésero 2231 111 111
Afluente Arazas 1 1138 6 6
Afluente Arazas 2 1878 43 43
Afluente Arazas3 446 20 20
Pozas Bellós (pool) 1 3 3
Fuen deros Baños 1131 31 31
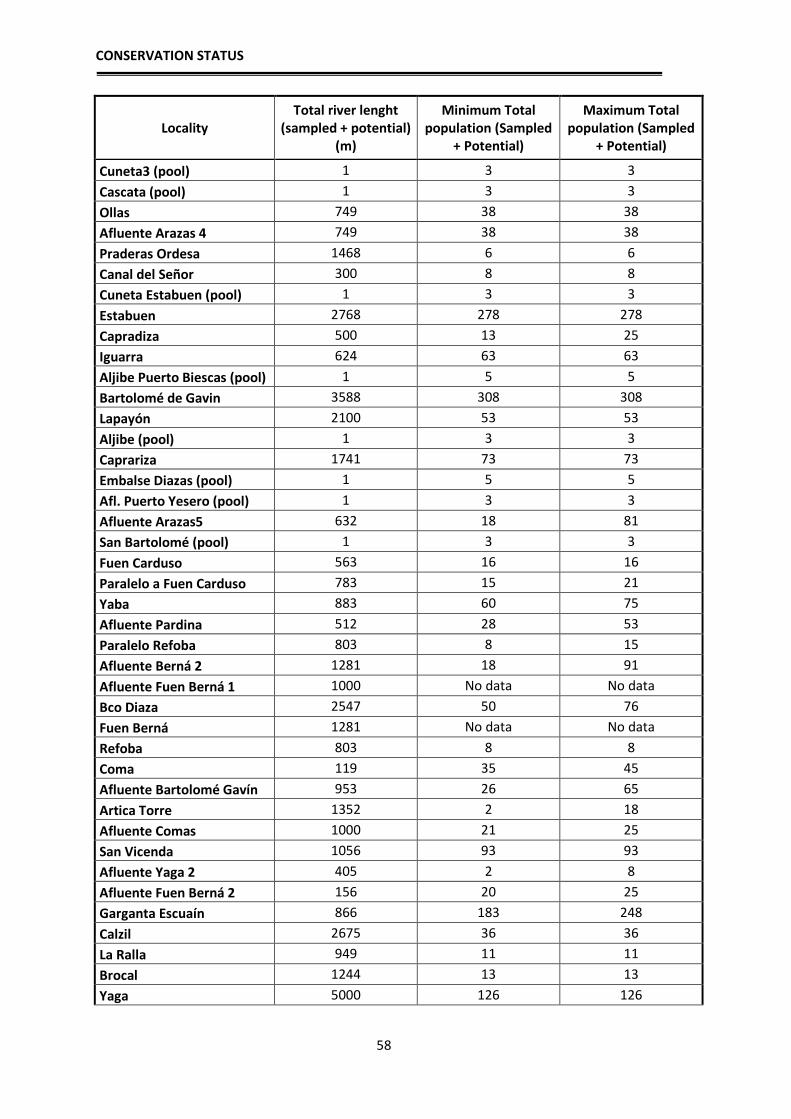
CONSERVATION STATUS
58
Locality
Total river lenght
(sampled + potential)
(m)
Minimum Total
population (Sampled
+ Potential)
Maximum Total
population (Sampled
+ Potential)
Cuneta3 (pool) 1 3 3
Cascata (pool) 1 3 3
Ollas 749 38 38
Afluente Arazas 4 749 38 38
Praderas Ordesa 1468 6 6
Canal del Señor 300 8 8
Cuneta Estabuen (pool) 1 3 3
Estabuen 2768 278 278
Capradiza 500 13 25
Iguarra 624 63 63
Aljibe Puerto Biescas (pool) 1 5 5
Bartolomé de Gavin 3588 308 308
Lapayón 2100 53 53
Aljibe (pool) 1 3 3
Caprariza 1741 73 73
Embalse Diazas (pool) 1 5 5
Afl. Puerto Yesero (pool) 1 3 3
Afluente Arazas5 632 18 81
San Bartolomé (pool) 1 3 3
Fuen Carduso 563 16 16
Paralelo a Fuen Carduso 783 15 21
Yaba 883 60 75
Afluente Pardina 512 28 53
Paralelo Refoba 803 8 15
Afluente Berná 2 1281 18 91
Afluente Fuen Berná 1 1000 No data No data
Bco Diaza 2547 50 76
Fuen Berná 1281 No data No data
Refoba 803 8 8
Coma 119 35 45
Afluente Bartolomé Gavín 953 26 65
Artica Torre 1352 2 18
Afluente Comas 1000 21 25
San Vicenda 1056 93 93
Afluente Yaga 2 405 2 8
Afluente Fuen Berná 2 156 20 25
Garganta Escuaín 866 183 248
Calzil 2675 36 36
La Ralla 949 11 11
Brocal 1244 13 13
Yaga 5000 126 126
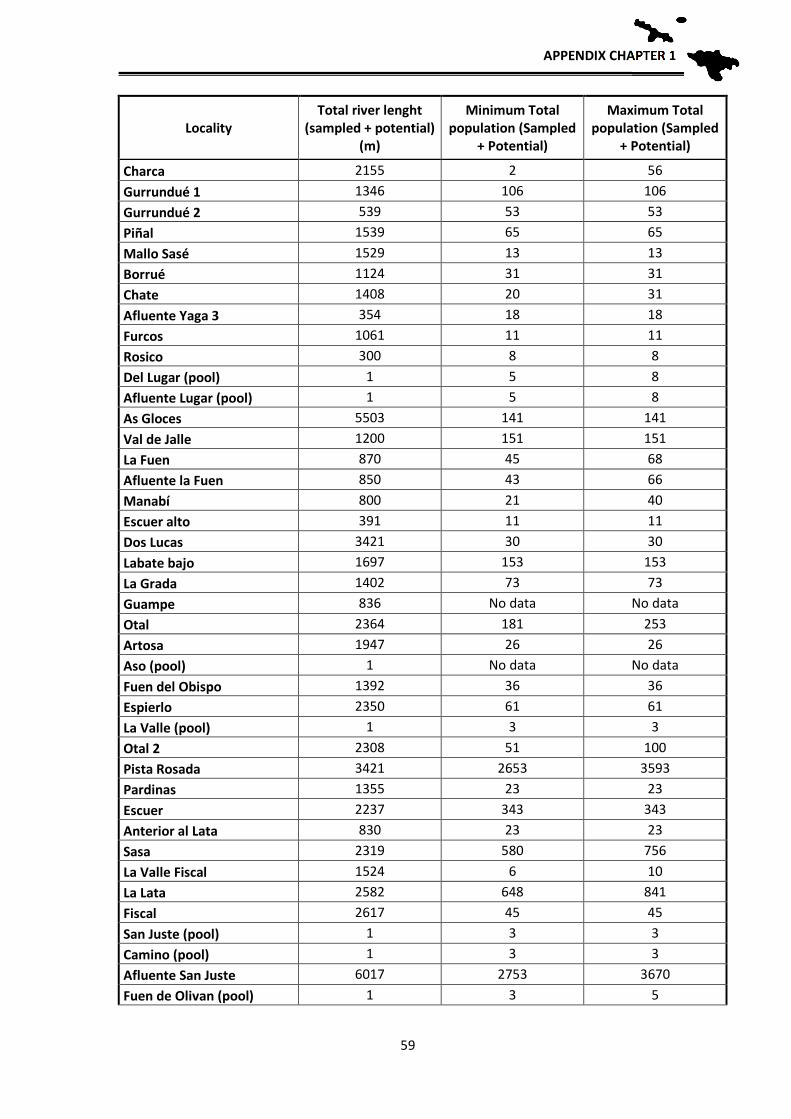
APPENDIX CHAPTER 1
59
Locality
Total river lenght
(sampled + potential)
(m)
Minimum Total
population (Sampled
+ Potential)
Maximum Total
population (Sampled
+ Potential)
Charca 2155 2 56
Gurrundué 1 1346 106 106
Gurrundué 2 539 53 53
Piñal 1539 65 65
Mallo Sasé 1529 13 13
Borrué 1124 31 31
Chate 1408 20 31
Afluente Yaga 3 354 18 18
Furcos 1061 11 11
Rosico 300 8 8
Del Lugar (pool) 1 5 8
Afluente Lugar (pool) 1 5 8
As Gloces 5503 141 141
Val de Jalle 1200 151 151
La Fuen 870 45 68
Afluente la Fuen 850 43 66
Manabí 800 21 40
Escuer alto 391 11 11
Dos Lucas 3421 30 30
Labate bajo 1697 153 153
La Grada 1402 73 73
Guampe 836 No data No data
Otal 2364 181 253
Artosa 1947 26 26
Aso (pool) 1 No data No data
Fuen del Obispo 1392 36 36
Espierlo 2350 61 61
La Valle (pool) 1 3 3
Otal 2 2308 51 100
Pista Rosada 3421 2653 3593
Pardinas 1355 23 23
Escuer 2237 343 343
Anterior al Lata 830 23 23
Sasa 2319 580 756
La Valle Fiscal 1524 6 10
La Lata 2582 648 841
Fiscal 2617 45 45
San Juste (pool) 1 3 3
Camino (pool) 1 3 3
Afluente San Juste 6017 2753 3670
Fuen de Olivan (pool) 1 3 5

CONSERVATION STATUS
60
Locality
Total river lenght
(sampled + potential)
(m)
Minimum Total
population (Sampled
+ Potential)
Maximum Total
population (Sampled
+ Potential)
AfluenteYaga 4 1549 20 20
Biandisco Aso 1261 138 138
Mosquera 142 16 16
Cuneta San Barotomé
(pool) 1 5 5
Cabecera Yaga (pool) 1 3 3
Arpeko Oihaneko No data No data No data
Francia 1 No data No data No data
Saillen 1100 28 28
TOTAL 210901 13333 16438
61
Chapter 2:
Widespread presence of
Batrachochytrium dendrobatidis across the
full geographic range of the Endangered
Pyrenean frog.
This chapter reproduce entirely the manuscript:
Peso M, Bernard N, Nieto-Roman S and Vieites DR. Widespread presence of Batrachochytrium
dendrobatidis across the full geographic range of the Endangered Pyrenean frog. Manuscript in
preparation.

CHYTRID DISTRIBUTION
62
CHAPTER 2
63
Widespread presence of Batrachochytrium dendrobatidis across the full geographic range of the Endangered Pyrenean frog.
Abstract
Chytridiomycosis is a disease decimating amphibian populations and species worldwide.
It has been recently found in the Pyrenean mountain range where a genetic study suggests
a recent colonization based on the genetic homogeneity from different sites. According to
this scenario, endemic Pyrenean amphibian species like the Pyrenean frog, Rana
pyrenaica, or the Pyrenean newt, Calotriton asper, should have been in contact with the
chytrid fungus that causes this disease only in recent times. Here, we assessed the
prevalence of the fungus Batrachochytrium dendrobatidis (Bd) in R. pyrenaica across its
full distribution range, finding that Bd is widespread. Low and mid elevation populations
show higher percentage of infected individuals in respect to higher elevations. Growth
models for Bd, based on temperature profiles, suggest that its optimum growing range
centers at mid elevations, while forecasts under future climate scenarios suggest that the
optimum growing conditions for Bd will reach high elevation lakes in few decades, with a
potential impact on alpine populations that are less affected today. It is unknown the
effect that Bd could have had on R. pyrenaica populations, and it could be one of the
agents explaining the low populations sizes observed in the species. The high prevalence
of Bd across the range of this Endangered species raises concerns about the future
viability of R. pyrenaica populations as well as for other mountain amphibians.
Keywords: Rana pyrenaica, Chytridiomycosis, Conservation, Batrachochytrium
dendrobatidis, Pyrenees.
CHYTRID DISTRIBUTION
64
INTRODUCTION
During the last three decades, overwhelming data have been accumulated to
confirm that amphibian populations and species are declining worldwide, being one of the
groups with the highest extinction risk among vertebrates (Stuart et al. 2004, Wake &
Vredenburg 2008). In the late 20th century, population declines were reported from many
species, mainly mountain amphibians, caused by increasing UV-B radiation exposure
(Kiesecker et al. 2001, Vieites 2003), as well as other human-related causes mainly
involving habitat transformation (e.g. deforestation of tropical forests, urbanization, etc.)
and climate change (Blaustein & Kiesecker 2002, Stuart et al. 2004, Wake & Vredenburg
2008). In parallel to those impacts, emerging infectious diseases started to appear in the
equation of amphibian losses, now being one of the main focus of research in amphibian
declines for its global occurrence and impact on populations and species (e.g. Rödder et
al. 2009, Olson et al. 2013, Lips 2016, O’hanlon et al. 2018). Among those, the relatively
recent discovery of several species of chytrid fungi that kill frogs and salamanders,
Batrachochytrium dendrobatidis (Bd) (Longcore et al. 1999) and B. salamandrivorans
(Martel et al. 2013), is of paramount importance. Chytrid fungi have been at the core of
the disappearance of many amphibian populations across the Planet (Rödder et al. 2009,
Olson et al. 2013, O’hanlon et al. 2018), as well as the putative extinction of many
species (Fisher et al. 2009, Cheng et al. 2011). They are expanding, being reported from
areas that where chytrid free just few years ago (e.g. Vredenburg et al. 2012 vs. Bletz et
al. 2015), with pet trade as an important factor for its continuous spread (Fisher & Garner
2007, Fisher et al. 2009, Schloegel et al. 2009, Martel et al. 2013), threating with
extinction many populations and species that were never exposed to these fungi before.
Chytridiomycosis, the disease caused by these fungi, has been reported both in
tropical and temperate amphibian species (Fisher et al. 2009), being Bd introduced in
many places by humans where it persists. This is in part because B. dendrobatidis shows
a relatively wide thermal tolerance. Its thermal physiology has been studied in the lab,
showing that it has an optimum growth between 10oC and 25oC with a suitability
temperature range between 5oC and 28oC (Piotrowski et al. 2004). Although its growth
can be different in the field influenced by other factors or the different strains of Bd, this
temperature range overlaps with the distribution of many amphibian temperate-latitude
species. Mountains seem a particularly suitable environment for these fungi. In fact,
massive die offs have been reported for many mountain frog species (Rachowicz et al.
CHAPTER 2
65
2006, Catenazzi et al. 2013, Gillespie et al. 2015) across different continents and
mountain ranges.
In the Pyrenees, a mountain range that separates France from Spain, there have
been reports of Bd presence in several species, including Calotriton asper, Salamandra
salamandra, Triturus helveticus, Alytes obstetricans, Bufo bufo, Pelophylax perezi, Rana
temporaria and the Pyrenean frog, Rana pyrenaica (Global Bd-Mapping Project 2018,
Walker et al. 2010, Clare et al. 2016). And recent colonization of the Pyrenees by Bd,
based on the finding of identical genotypes from different sites, has been proposed
(Walker et al. 2010). This scenario implies that whatever effects Bd has on Pyrenean
amphibians should be recent and that endemic Pyrenean amphibian species were only
recently exposed to the pathogen. Two species of amphibians are endemic of these
mountains: R. pyrenaica and the Pyrenean newt Calotriton asper, both with fast flowing
mountain streams as their typical habitat. The Pyrenean frog has one of the smallest
ranges for an European amphibian and has been catalogued as Endangered according to
IUCN criteria (Bosch et al. 2009). It is a mountain frog that inhabits mainly headwater
streams, with a fragmented distribution with most populations of reduced size (Chapter
1). Together with the small population sizes, the genetic variation of the species is very
small (Chapters 4, 5) with low effective population sizes. This makes this species prone to
decline. Among the major threats for the species are the presence of fishes that were
introduced in all streams for fishing, and stochastic events like storm floods that in the
mountains can cause the sweep of all the tadpoles (Chapter 1). So far, massive die offs
have not been reported for this species, but yes for Rana temporaria, Alytes obstetricans
or Lissotriton helveticus in this area (obs pers.). However, as a stream species if there
were any die offs the corpses could be washed again with the current. It is not known why
the populations of this species are so small, but chytridiomicosis could have been a recent
potential cause. Here we wanted to assess if the presence of Bd is common or not in this
species, and what is the prevalence in the populations across the full distribution range of
the species. As an Endangered species of special conservation concern, gathering the first
data on the presence of Bd across its range will be very helpful to make management
decisions and identify which areas may be affected by Bd to monitor them and plan
applied conservation actions. We also used the thermal profile of Bd to model its
presence in the Pyrenees under current climate and future climatic scenarios. These
forecasts provide a spatial hypothesis of Bd's future distribution at a local scale, including
CHYTRID DISTRIBUTION
66
potential changes in its altitudinal range that may affect high elevation amphibian
populations that are now outside the optimum of chytrid growth.
MATERIAL AND METHODS
Fieldwork
We visited all the 170 known localities where Rana pyrenaica occurs, covering
the full distribution range of the species. Sampling was performed from 2010 to 2014,
including several visits to localities to detect the species as population densities are low.
The Pyrenean frog inhabits in high mountain stream headwaters, hence long hiking to
remote localities was necessary in most cases. We collected swabs for chytrid analyses in
108 localities. At each locality we located adults and tadpoles, which were collected by
hand or net. Each specimen was placed in an independent plastic bag before collecting
swab and in some cases tissue samples. We changed gloves with every specimen to avoid
potential cross-contaminations. We swabbed the skin of adults following Boyle et al.
(2007) using MW113 2mm sterile synthetic cotton swabs (Medical Wire & Equipment).
We swabbed each individual with 30 strokes: five times each hind foot on the toe
webbing, each thigh was swabbed five times, and the sides of the ventral skin of the frogs
five times each. Swab tips were stored into a sterile Nalgene tube filled with Ethanol
99%. For tadpoles, we swabbed both mouth and skin. Between each site, we sterilized all
field equipment using 10% bleach.
PCR Bd detection
Genomic DNA was extracted from swabs preserved in ethanol, using the Qiagen
DNeasy 96 Tissue Kit (Qiagen, Valencia, CA, USA), following the protocol provided by
the manufacturer. We performed a nested double PCR of the ITS regions between 18S-
28S fragment of the chytrid genome. A first PCR was done with specific primers
Bd18SF1 (5´-TTTGTACACACCGCCCGTCGC-3´) and Bd28SR1 (5´-
ATATGCTTAAGTTCAGCGGG-3´) (Goka et al. 2009). A second PCR was performed
using as template the PCR product from the first PCR, and using the internal Bd primers
Bd1a (5´-CAGTGTGCCATATGTCACG-3´) and Bd2a (5´-
CATGGTTCATATCTGTCCAG-3´) (Annis et al. 2004). PCRs where repeated twice
with positive and negative controls to confirm results.
CHAPTER 2
67
PCR conditions for the first PCR included an initial denaturation at 95 oC for 9
min, 35 cycles at 94 oC for 30 sec, annealing at 50 oC for 30 sec, extension at 72 oC for 2
min; and a final extension of 7 min at 72 oC. The conditions for the second PCR included
an initial denaturation at 95 oC for 10 min, 35 cycles at 94 oC for 30 sec, annealing at 58
oC for 30 sec, extension at 72 oC for 30 sec; and a final extension of 7 min at 72 oC. PCR
products were loaded onto 1% agarose gels, stained with GelStar gel stain (Cambrex),
and visualized in a Dark reader transilluminator (Clare Chemical). We considered that the
sample was positive if in two independent PCRs there was a clear band in electrophoresis
gels.
Bd distribution and forecast under IPCC scenarios
Two approaches can be done to model the distribution of Bd in the area where R.
pyrenaica occurs: a correlative species distribution model (with Maxent or any other
popular modeling software), or a mechanistic approach using the available thermal
growth profiles of Bd. When modeling only the positive records of Bd known for R.
pyrenaica using Maxent, we obtained a similar predictive map as in Chapter 1, as it is
based on R. pyrenaica distribution records. Hence, we here followed a different approach
by using one of the available Bd's thermal growth models (Piotrowski et al. 2004).
Piotrowski's growth model suggests that the optimum Bd growth is reached between 10oC
and 25oC and the suitability temperature is within the range of 5oC to 28oC. Based on
those data, we calculated the number of months in which Bd has an optimum or suitable
growth, and summarized them for the whole year. For doing that, we applied the growth
model to the maximum and minimum monthly temperature maps available from
WorldClim at ca. 1 Km2 resolution (Hijmans et al. 2005) under current climate (based on
the period 1950-2000). For each month, optimum growth maps were created for the
minimum and maximum temperatures, and the same was done for the suitable growth.
We reclassified the values of minimum or maximum temperature from all climatic layers
to one (1) if the temperature was within optimum or suitable Bd's growth ranges
respectively, and zero (0) if the temperature was outside those ranges. Then we summed
all months to create maps in which each pixel represents how many months Bd has
optimum or suitable growth conditions.
To forecast the future distribution of Bd under IPCC's RCP Coupled Model
Intercomparison Project Phase 5 (CMIP5) scenarios (IPCC AR5 2014), we applied the

CHYTRID DISTRIBUTION
68
same approach for the years 2050 and 2070, using an ensemble of five climatic models:
CCSM4, Miroc 5, CSIRO MK3-6-0, CNRM-CM5 and BCC-CSM1-1 (Karger et al.
2017). Those models were selected based on their differences according to their output in
model comparison analyses (Knutti & Sedláček 2013, Sanderson et al. 2015). For each
model we used a Representative Concentration Pathway (RCP) of 4.5 as an intermediate
scenario, and a RCP 8.5 as a high warming scenario. We used functions from diverse
libraries in R (raster, rgdal, adehabitat and SDMTools) for operations with raster layers.
In order to explore the relationship between elevation and the number of optimum
or suitable months for Bd growth within the range of R. pyrenaica, we generated one
thousand random points within this range and extracted the altitude as well as every
growth map model values using ARCMap 10.1. We then explored different regression´s
models that best explain the relationship between altitude and the number of months
available for Bd's optimum or suitable growth, under present and future climatic
conditions in SPSS v23. We finally gathered all available Bd positive (presences) and Bd
negative (absences) distribution records for all Pyrenean amphibians [mainly from the
Global Bd-Mapping Project (2018) and our own data], to plot the altitudinal distributions
of positive and negative tested samples.
RESULTS
Presence of Bd in Rana pyrenaica skins
We analysed 666 samples from 106 localities throughout the whole distribution
range of R. pyrenaica (Fig. 1). No swabs were available from the two French isolated
populations. Bd was detected in 184 frog swab samples (27.6%) from 46 localities
(43.4%), distributed in elevations between 857 m a.s.l. and 2079 m a.s.l. The distribution
of positive localities suggests that Bd is present across the full range of the species and it
is widespread in the Pyrenees. Most of the populations that yielded negative results
correspond to sites from which one or few samples were available due to low population
sizes and the difficulty to find the species. In localities with higher sample sizes Bd was
always detected. The proportion of Bd positive samples within each locality is variable,
with some areas with prevalence of Bd negative (Eastern Navarra to Hecho valley, or
localities south of Ordesa – Monte Perdido National Park) and other areas with
prevalence of Bd+ independently of sample size (Añisclo or Tena valleys, Fig. 1). Only in

CHAPTER 2
69
two main valleys Bd was not detected, but those have few R. pyrenaica localities and low
population sizes, hence few samples could be collected and analyzed from there. It is
remarkable that Bd was found in the three main valleys within the Ordesa – Monte
Perdido National Park.
Figure 1. Map showing the distribution of the sampled localities for Batrachochytrium dendrobatidis in
swabs from Rana pyrenaica, and the sample size per locality. Samples cover the whole distribution range of
the Pyrenean frog. In each pie, the percentage of samples that yielded Bd positive (Bd+) is shown in black,
and Bd- in white.
The growth models under current climate show that for the minimum temperature
climate layer, Bd has an optimum growth during one month in most of the western
Pyrenees; although if we consider the other extreme, under the maximum temperature
layer, it has between 3 to 5 months of optimum growth, mainly in the valleys (Fig. 2). In
both models the chytrid does not grow well in high elevations. If we consider the suitable
growth range of temperatures, under the minimum temperature climate layer, the suitable
Bd growth spans between 2 to 6 months, while under the maximum temperatures it spans
throughout the whole year at mid and lower elevations but in the highest elevations
(above 2200 m a.s.l.) Bd cannot grow well. Considering as a reference elevations of 1500
m and 2200 m a.sl., at 1500 m the chytrid cannot grow under its optimum temperature if
we conssider the minimum temperature layers, but it can during seven months under the

CHYTRID DISTRIBUTION
70
maximum ones (hereafter: number of suitable months considering the minimum
temperature – suitable months considering the maximum temperature). At 2200 m a.s.l.
Bd can grow in its optimum between 2 and 4 months. If we consider the suitable climate,
at 1500 m a.s.l. spans from 4-10 months and at 2200 m a.s.l between 2 and 6 months.
Under future climate scenarios for the year 2050, climatic conditions using a
moderate mitigation scenario (RCP 4.5) show that both optimum growth models under
minimum and maximum environmental temperatures predict an increase in the number of
months suitable for the chytrid when compared to current climatic conditions (Fig. 3). Bd
will be able to grow optimally in higher elevations during 2-4 months per year at 1500 m
a.s.l. and between 0 to 4 months at 2200 m a.s.l. The suitable growth maps show a similar
pattern, with an increase to 3-6 months of suitable grow at 1500 m a.s.l. and between 3
and 6 at 2200 m a.s.l. (Fig. 3).
Figure 2. Map representing the total number of months of optimum growth temperature (17-25 ºC) and
suitable growth temperature (4-25 ºC, sensu Piotrowski et al. 2004) of Bd under current climatic conditions.
Maps above are built under the minimum monthly temperature layers which were aggregated to get a yearly
value, while bottom maps are based on the maximum monthly temperature. Black dots represent Bd+
localities and white dots are the localities where Bd was not detected in any R. pyrenaica sample.

CHAPTER 2
71
Figure 3. Map representing the total number of months of optimum growth temperature (17-25 ºC) and
suitable growth temperature (4-25 ºC, sensu Piotrowski et al. 2004) of Bd under 2050 climatic conditions
and RCP 4.5 scenario. Maps above are built under the minimum monthly temperature layers which were
aggregated to get a yearly value, while bottom maps are based on the maximum monthly temperature.
Black dots represent Bd+ localities and white dots are the localities where Bd was not detected in any R.
pyrenaica sample.
The same approach under a high emission and low mitigation scenario (RCP 8.5)
for the year 2050, provides a pattern that is similar to the results from the RCP 4.5 for the
same period (Fig. 4). The maps for the year 2070 under a RCP 4.5 (Fig. 5) and RCP 8.5
(Fig. 6) scenarios show also an increase in the number of suitable months for chytrid
growth in respect to current climate. RCP 4.5 models for 2070 are almost identical to
RCP 4.5 models from 2050, however, in the RCP 8.5 models for 2070 the optimum
growth is ca. one month longer at high elevations than in the same models in 2050, and
two months longer than under current climate. All future scenarios suggest that high
elevation areas where the chytrid has a limited growth period now will switch to a climate
where the chytrid can grow optimally for 3 to 6 months at 2200 m a.sl..
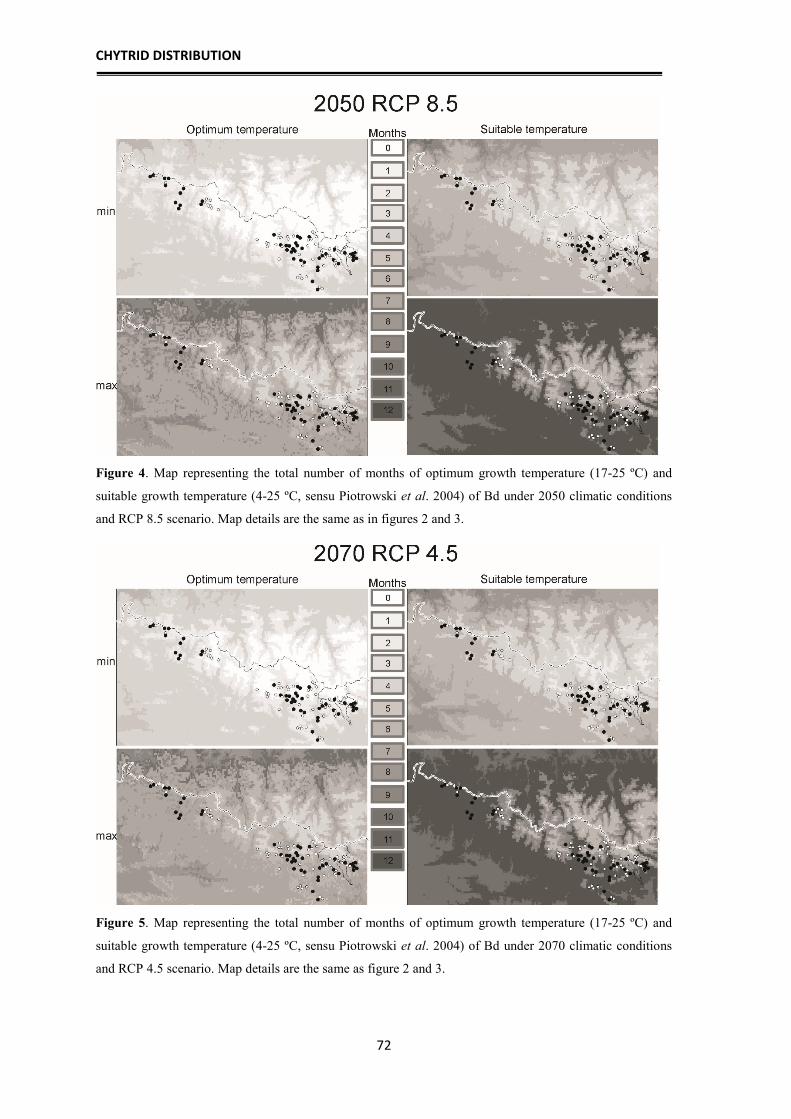
CHYTRID DISTRIBUTION
72
Figure 4. Map representing the total number of months of optimum growth temperature (17-25 ºC) and
suitable growth temperature (4-25 ºC, sensu Piotrowski et al. 2004) of Bd under 2050 climatic conditions
and RCP 8.5 scenario. Map details are the same as in figures 2 and 3.
Figure 5. Map representing the total number of months of optimum growth temperature (17-25 ºC) and
suitable growth temperature (4-25 ºC, sensu Piotrowski et al. 2004) of Bd under 2070 climatic conditions
and RCP 4.5 scenario. Map details are the same as figure 2 and 3.

CHAPTER 2
73
Figure 6. Map representing the total number of months of optimum growth temperature (17-25 ºC) and
suitable growth temperature (4-25 ºC, sensu Piotrowski et al. 2004) of Bd under 2070 climatic conditions
and RCP 8.5 scenario. Map details are the same as in figures 2 and 3.
The relationships between Bd's optimum and suitable growth temperatures and
elevation are shown in figure 7, both under aggregated monthly minimum and maximum
temperature climate. Quadratic regressions better explain this relationship. Under current
minimum monthly temperature climate there is a significant negative relationship (Fig.
7a, p<0.001, R2=0.841) between Bd optimum growth and elevation, reaching zero value
at ca. 1800 m a.s.l.; while under future climate models the slopes increase reaching zero
the optimum at ca. 2400 m a.s.l., save the 2070 RCP 8.5 scenario in which the optimum
reaches zero ca. at 2900 m a.s.l. If we consider the monthly maximum temperatures for
optimum growth, the relationship is also negative and significant (Fig. 7c, p<0.001,
R2=0.773 ), but under current climate the optimum crosses zero at ca. 2800 m a.s.l,
basically including every water body suitable for amphibians in the Pyrenees. If we look
at suitable temperatures for chytrid growth, both under current minimum (Fig. 7b,
p<0.001, R2=0.889) and maximum (Fig. 7d, p<0.001, R2=0.89) monthly temperature
climate, the relationships are negative with elevation in all cases, reaching zero at ca.
3000 m, hence including all Pyrenean water bodies. Future climate scenarios also show
this relationship when increasing elevation. In the insets are shown the frequency
distributions of Bd+ records (grey) and Bd- records (white) for all Pyrenean amphibians,
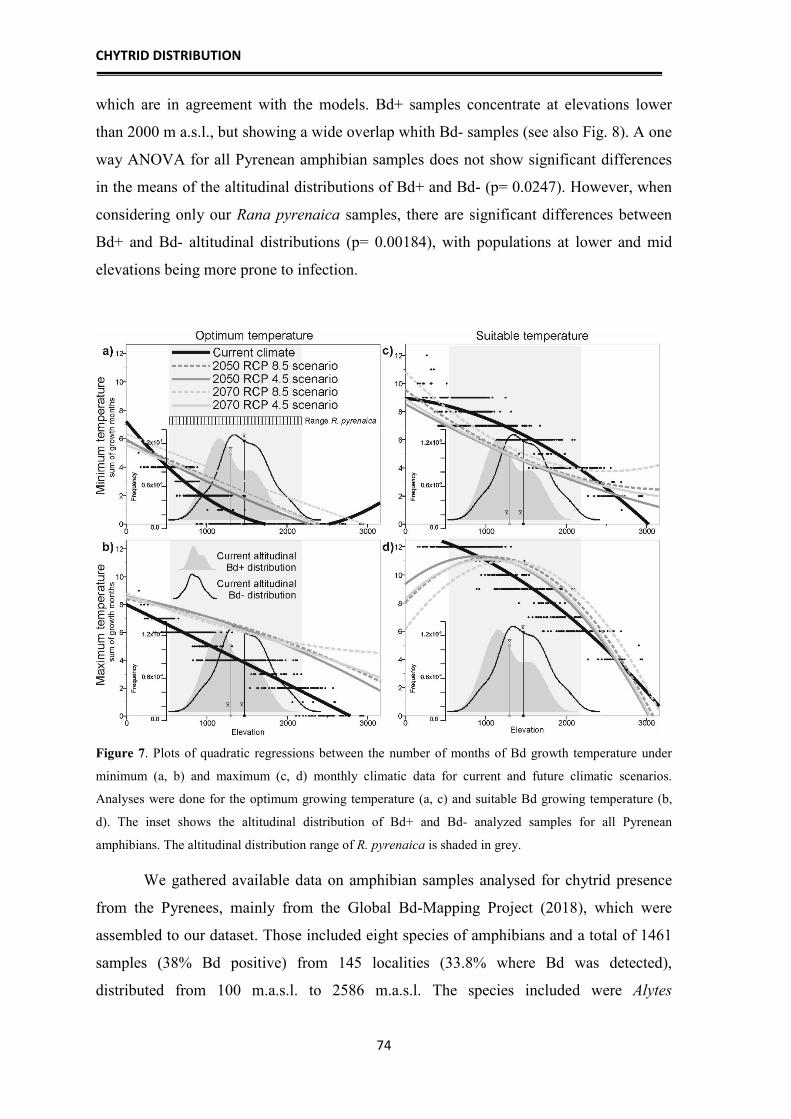
CHYTRID DISTRIBUTION
74
which are in agreement with the models. Bd+ samples concentrate at elevations lower
than 2000 m a.s.l., but showing a wide overlap whith Bd- samples (see also Fig. 8). A one
way ANOVA for all Pyrenean amphibian samples does not show significant differences
in the means of the altitudinal distributions of Bd+ and Bd- (p= 0.0247). However, when
considering only our Rana pyrenaica samples, there are significant differences between
Bd+ and Bd- altitudinal distributions (p= 0.00184), with populations at lower and mid
elevations being more prone to infection.
Figure 7. Plots of quadratic regressions between the number of months of Bd growth temperature under
minimum (a, b) and maximum (c, d) monthly climatic data for current and future climatic scenarios.
Analyses were done for the optimum growing temperature (a, c) and suitable Bd growing temperature (b,
d). The inset shows the altitudinal distribution of Bd+ and Bd- analyzed samples for all Pyrenean
amphibians. The altitudinal distribution range of R. pyrenaica is shaded in grey.
We gathered available data on amphibian samples analysed for chytrid presence
from the Pyrenees, mainly from the Global Bd-Mapping Project (2018), which were
assembled to our dataset. Those included eight species of amphibians and a total of 1461
samples (38% Bd positive) from 145 localities (33.8% where Bd was detected),
distributed from 100 m.a.s.l. to 2586 m.a.s.l. The species included were Alytes

CHAPTER 2
75
obstetricans, Rana temporaria, Triturus helveticus, Pleurodeles waltl, Pelophylax perezi,
Bufo spinosus, Salamandra salamandra and Calotriton asper. For Rana pyrenaica there
were only 9 samples available from 3 localities in these Atlas project. In figure 8 is
represented the elevation pattern of chytrid positive and negative samples for all Pyrenean
amphibians in the elevation gradient. Although there is an overlap between Bd+ and Bd-
analyzed samples, a clear drop in the frequency of Bd+ samples is evident at 2000
m.a.s.l., which is also in agreement with the regression models of chytrid growth versus
elevation.
Figure 8. Bar plots of Bd positive and Bd negative analysed samples for all amphibian species in the
Pyrenees. Top scale is in percentages. Bd positive samples are rare above 2000 m a.s.l.
DISCUSSION
Our results demonstrate that Batrachochytrium dendrobatidis is widespread across
the whole distribution range of R. pyrenaica. The presence of Bd in the Pyrenees has been
detected not long time ago, and genetic studies suggest a single recent introduction event
and subsequent spread of a unique haplotype in the Pyrenees (Walker et al. 2010). This
scenario implies that Pyrenean amphibians had been in contact with Bd for just a short
period of time, hence the consequences of Bd's expansion in this area and its amphibian
CHYTRID DISTRIBUTION
76
fauna are not yet fully explored. Die-offs caused by Bd in the Pyrenees have been
reported for Rana temporaria or Alytes obstetricans (Walker et al. 2010, Clare et al.
2016), as well as for Lissotriton helveticus (pers. obs.). However, there are no extensive
data for the two key amphibian Pyrenean endemisms, the Pyrenean newt, Calotriton
asper, and frog Rana pyrenaica.
Our data show that Bd is already present in most of the localities where the
Pyrenean frog occurs, with higher presence at mid and high elevations, being detected in
their skins. The elevation range of Bd presence in the Pyrenees spans across the
altitudinal gradient, from lowlands to high elevations, but its presence in amphibian skins
above 2000 m a.s.l. is anecdotal. This observation fits well with the available growth
models (Piotrowski et al. 2004) that applied to the landscape suggest an upper elevation
limit close to 2000 m a.s.l. under current climate. Climate models for the Pyrenees
suggest a continuous warming in the next decades (López-Moreno et al. 2008) and a
reduction of precipitation. Those models as well as our forecasted growth models, suggest
an increase in the number of suitable and optimal growth months for the chytrid, and this
is in part a consequence of earlier springs and later winters. This situation is not good for
amphibians, as it has been shown that earlier springs increment frog mortality infected by
Bd in these mountains (Clare et al. 2016). In high elevations, Alytes obstetricans spends
one to two years as tadpole before leaving the water, acting as a reservoir of the chytrid
(Clare et al. 2016), hence our growth models not only imply a Bd distribution uplift but
also an increase in the probability of infection for the whole community at higher
elevations. Other species, like crayfishes have been confirmed as host species for Bd
(McMahon et al. 2013), and in the Pyrenees conservation of autochthonous crayfishes its
being promoted in headwater streams.
It is possible that in the last decade, with a continuous warming and very hot
years, Bd was already moving uplift towards higher elevations. Forecasted models to
2050 and 2070 suggest in all analysed scenarios that the optimal conditions for chytrid
growth will move to higher elevations. We hypothesize that this is already happening and
that the chytrid presence will be more frequent at alpine lakes in the next years, affecting
alpine amphibian communities to an unknown extent. So far, massive die offs have not
been reported for R. pyrenaica. However, other species with which it coexists, like Alytes
obstetricans or eventually R. temporaria, are already experiencing population declines
(Walker et al. 2010, Clare et al. 2016). If there is any die off in a lotic species like this, it
CHAPTER 2
77
will be hard to detect, as dead corpses will likely be washed away by the fast spring
currents. In fact, population declines did not parallel the finding of corpses in closely
related stream species like Rana iberica (Bosch et al. 2018). It is pure speculation to
relate the small population sizes found across the whole distribution range of R. pyrenaica
with a potential Bd cause, however considering that the whole range of this frog is
affected by Bd and that the population sizes are so small (Chapter 1), the incidence of Bd
and its evolution needs to be closely monitored. Small population sizes, patchy
distributions that difficult gene flow and low genetic diversity (see Chapters 4 and 5) are
key ingredients for population declines and extinctions by themselves. If we add a disease
that is causing massive mortalities across the planet, leading species to extinction and
global warming that will make the growth conditions better for the fungus, the cocktail
put this species in danger of population declines or even extinction in the next few years.
It has been shown that some populations of anurans can survive the chytrid infection
while others collapse, and these intraspecific differences can happen at different
developmental stages, being sometimes related to skin microbiota that may protect frogs
or tadpoles (Blaustein et al. 2005, Briggs et al. 2005, Woodhams et al. 2007). We do not
have data on R. pyrenaica to expect any kind of resistence to Bd. We urge the authorities
to not take the chance and implement a monitoring scheme to assess the extent of the
problem, if there are any die offs, and in the case of a beginning of population collapses
consider a captive breeding program. It is remarkable that within the Ordesa and Monte
Perdido National park the presence of Bd is widespread, so having the highest protection
in Europe there, conservation and management actions should focus on this national park
as a first test to try to prevent amphibian declines in the next few years.

CHYTRID DISTRIBUTION
78
Acknowledgements
We are grateful to many people that made this project possible. Several students
and collaborators helped in fieldwork in the Pyrenees, including Carlos Zaragoza, Javier
Santos, Rubén González, Miguel Vences, Nina Bernard, Guillermo Ponz and Isabel
Perandones. Angelica Crottini provided advice on PCR conditions. Fernando Carmena
and Ignacio Gómez from SARGA in Aragón, and Iosu Antón in Navarra were extremely
helpful in the field, allowing locating many known populations. Ramon Antor
Casterllanau provided logistic help to prepare and carry on fieldwork. Manuel Alcántara,
David Guzmán and Jose Luis Burrel from the Aragón government showed their total
collaboration and help during the whole length of the project. Forest rangers helped us
during the fieldwork, and the public company Sodemasa, now SARGA, provided logistic
support in Ordesa in 2011. MPF was financed with a grant by CNPq under Science
Without Borders program by Brazil Ministry of Science. We thank the Governments of
Aragon and Navarra for collecting permits. This work was funded by a research project of
the Zoo de Barcelona (Ayuntamiento de Barcelona) as well as by a research project from
the Parques Nacionales OPAN – MMARM to DRV.
References
Annis S. L., Dastoor F. P., Ziel H., Daszak P., & Longcore J. E. (2004) A DNA-based
assay identifies Batrachochytrium dendrobatidis in amphibians. Journal of Wildlife
Diseases, 40, 420–428.
Blaustein, A. R., Romansic, J. M., Scheessele, E. A., Han, B. A., Pessier, A. P., &
Longcore, J. E. (2005). Interspecific variation in susceptibility of frog tadpoles to the
pathogenic fungus Batrachochytrium dendrobatidis. Conservation Biology, 19(5),
1460-1468.
Blaustein, A. R., & Kiesecker, J. M. (2002). Complexity in conservation: lessons from the
global decline of amphibian populations. Ecology letters, 5(4), 597-608.
Bletz, M. C., Rosa, G. M., Andreone, F., Courtois, E. A., Schmeller, D. S., Rabibisoa, N.
H., Rabemananjara, F. C. E., Raharivololoniaina, L., Vences, M., Weldon, C., ,
Edmonds, D. Raxworthy, C. J., Harris, R. N., Fisher M. C., & Crottini A. (2015).
Widespread presence of the pathogenic fungus Batrachochytrium dendrobatidis in
wild amphibian communities in Madagascar. Scientific reports, 5, 8633.
Boyle, A. H. D., Olsen, V., Boyle, D. B., Berger, L., Obendorf, D., Dalton, Kriger, A., K.,
Hero, M., Hines, H., Phillott, R., Campbell, R., Marantelli, G., Gleason, F., &
Colling A. (2007). Diagnostic assays and sampling protocols for the detection of
Batrachochytrium dendrobatidis. Diseases of aquatic organisms, 73(3), 175-192.
Bosch, J., Tejedo, M., Miaud, C., Martínez-Solano, I., Salvador, A., García-París, M.,
Recuero Gil, E., Marquez, R., Díaz Paniagua, C., Geniez, P. (2009) Rana pyrenaica
Serra-Cobo, 1993. Pyrenean frog. Pp. 510. En: Stuart, S. N., Hoffmann, M.,
Chanson, J. S., Cox, N. A., Berridge, R. J., Ramani, P., & Young, B. E. (eds.).
Threatened Amphibians of the World. IUCN, Conservation International. Lynx,

CHAPTER 2
79
Barcelona . 758 pp.
Bosch, J., Fernández-Beaskoetxea, S., Garner, T. W. J., & Carrascal, L. M. (2018). Long-
term monitoring of an amphibian community after a climate change- and infectious
disease-driven species extirpation. Global Change Biology, pp. 1–10.
http://doi.org/10.1111/gcb.14092
Briggs, C. J., Vredenburg, V. T., Knapp, R. A., & Rachowicz, L. J. (2005). Investigating
the population‐level effects of chytridiomycosis: an emerging infectious disease of
amphibians. Ecology, 86(12), 3149-3159.
Catenazzi, A., von May, R., & Vredenburg, V. T. (2013). High prevalence of infection in
tadpoles increases vulnerability to fungal pathogen in high-Andean amphibians.
Biological Conservation, 159, 413-421.
Cheng, T. L., Rovito, S. M., Wake, D. B., & Vredenburg, V. T. (2011). Coincident mass
extirpation of neotropical amphibians with the emergence of the infectious fungal
pathogen Batrachochytrium dendrobatidis. Proceedings of the National Academy of
Sciences, 108(23), 9502-9507.
Clare, F. C., Halder, J. B., Daniel, O., Bielby, J., Semenov, M. A., Jombart, T., Loyau, A.,
Schmeller, D. S., Cunningham, A. A., Rowcliffe, M,. Garner, T. W. J., Bosch, J:, &
Fisher M. C. (2016). Climate forcing of an emerging pathogenic fungus across a
montane multi-host community. Philosophical Transactions of the Royal Society B,
371(1709), 20150454.
Fisher, M. C., & Garner, T. W. (2007). The relationship between the emergence of
Batrachochytrium dendrobatidis, the international trade in amphibians and
introduced amphibian species. Fungal Biology Reviews, 21(1), 2-9.
Fisher, M. C., Garner, T. W., & Walker, S. F. (2009). Global emergence of
Batrachochytrium dendrobatidis and amphibian chytridiomycosis in space, time,
and host. Annual review of microbiology, 63, 291-310.
Gillespie, G. R., Hunter, D., Berger, L., & Marantelli, G. (2015). Rapid decline and
extinction of a montane frog population in southern Australia follows detection of
the amphibian pathogen Batrachochytrium dendrobatidis. Animal Conservation,
18(3), 295-302.
Goka, K., Yokoyama, J. U. N., Une, Y., Kuroki, T., Suzuki, K., Nakahara, M.,
Kobayashi, A., Inaba, S., Mizutani, T., & Hyatt, A. D. (2009). Amphibian
chytridiomycosis in Japan: distribution, haplotypes and possible route of entry into
Japan. Molecular Ecology, 18(23), 4757-4774.
Global Bd-Mapping Project. http://www.bd-maps.net/ Acessed: April, 2018.
Hijmans, R. J., Cameron, S. E., Parra, J. L., Jones, P. G., & Jarvis, A. (2005). Very high
resolution interpolated climate surfaces for global land areas. International Journal
of Climatology, 25(15), 1965–1978. http://doi.org/10.1002/joc.1276
IPCC AR5 2014. http://www.ipcc.ch/report/ar5/index.shtml
Karger, D.N., Conrad, O., Böhner, J., Kawohl, T., Kreft, H., Soria-Auza, R.W.,
Zimmermann, N.E., Linder, H.P. & Kessler, M. (2017) Climatologies at high
resolution for the earth’s land surface areas. Scientific Data, 4, 170122.
CHYTRID DISTRIBUTION
80
Kiesecker, J. M., Blaustein, A. R., & Belden, L. K. (2001). Complex causes of amphibian
population declines. Nature, 410(6829), 681.
Knutti, R., & Sedláček, J. (2013). Robustness and uncertainties in the new CMIP5 climate
model projections. Nature Climate Change, 3(4), 369.
Knutti R., Masson D., & Gettelman A. (2013) Climate model genealogy: Generation
CMIP5 and how we got there. Geophysical Research Letters, 40, 1194–1199
Lips, K. R. (2016) Overview of chytrid emergence and impacts on amphibians.
Philosophical Transactions of the Royal Society B, 371(1709), 20150465.
Longcore, J. E., Pessier, A. P., & Nichols, D. K. (1999) Batrachochytrium dendrobatidis
gen. et sp. nov., a chytrid pathogenic to amphibians. Mycologia, 219-227.
López-Moreno, J. I., Goyette, S., & Beniston, M. (2008) Climate change prediction over
complex areas: spatial variability of uncertainties and predictions over the Pyrenees
from a set of regional climate models. International Journal of Climatology, 28,
1535–1550. http://doi.org/10.1002/joc
Martel, A., Spitzen-van der Sluijs, A., Blooi, M., Bert, W., Ducatelle, R., Fisher, M. C.,
… Pasmans, F. (2013) Batrachochytrium salamandrivorans sp. nov. causes lethal
chytridiomycosis in amphibians. Proceedings of the National Academy of Sciences,
110(38), 15325–15329. http://doi.org/10.1073/pnas.1307356110
McMahon, T. a, Brannelly, L. a, Chatfield, M. W. H., Johnson, P. T. J., Joseph, M. B.,
McKenzie, V. J., … Rohr, J. R. (2013) Chytrid fungus Batrachochytrium
dendrobatidis has nonamphibian hosts and releases chemicals that cause pathology
in the absence of infection. Proceedings of the National Academy of Sciences of the
United States of America, 110(1), 210–5. http://doi.org/10.1073/pnas.1200592110
O’hanlon, S. J., Rieux, A., Farrer, R. A., Rosa, G. M., Waldman, B., Bataille, A., Kosch,
T. A., Murray, K. A., Brankovics, B., Fumagalli, M., Martin, M. D., Wales, N.,
Alvarado-Rybak, M. Bates, K. A., Berger, L., Böll, S., Brookes, L., Clare, F.,
Courtois, E. A., Cunningham, A. A., Doherty-Bone, T. M., Ghosh, P., Gower, D. J.,
Hintz, W. E., Höglund, J., Jenkinson, T. S., Lin, C., Laurila, A., Loyau, A., Martel,
A., Meurling, S., Miaud, C., Minting, P., Pasmans, F., Schmeller, D. S., Schmidt, B.
R., Shelton, J. M. G., Skerratt, L. F., Smith, F., Soto-Azat, C., Spagnoletti, M.,
Tessa, G., Toledo, L. F., Valenzuela-Sánchez, A., Verster, R., Vörös, J., Webb, R.
J., Wierzbicki, C., Wombwell, E., Zamudio, K. R., Aanensen, D. M., James, T. Y.,
Gilbert, M. T. P., Weldon, C., Bosch, J., Balloux, F., Garner, T. W. J., & Fisher M.
C. (2018) Recent Asian origin of chytrid fungi causing global amphibian declines.
Science, 360(6389), 621-627.
Olson, D. H., Aanensen, D. M., Ronnenberg, K. L., Powell, C. I., Walker, S. F., Bielby,
J., Garner, T. W. J., Weaver, G., The Bd Mapping Group, & Fisher, M. C. (2013)
Mapping the Global Emergence of Batrachochytrium dendrobatidis, the Amphibian
Chytrid Fungus. PLoS ONE, 8(2). http://doi.org/10.1371/journal.pone.0056802
Piotrowski, J. S., Annis, S. L., & Longcore, J. E. (2004) Physiology of Batrachochytrium
dendrobatidis, a chytrid pathogen of amphibians. Mycologia, 96(1), 9–15.
http://doi.org/10.2307/3761981
Rachowicz, L. J., Knapp, R. A., Morgan, J. A., Stice, M. J., Vredenburg, V. T., Parker, J.
M., & Briggs, C. J. (2006) Emerging infectious disease as a proximate cause of
CHAPTER 2
81
amphibian mass mortality. Ecology, 87(7), 1671-1683.
Rödder, D., Kielgast, J., Bielby, J., Schmidtlein, S., Bosch, J., Garner, T. W., Veith, M.,
Walker, S., Fisher M. C., & Lötters S. (2009) Global amphibian extinction risk
assessment for the panzootic chytrid fungus. Diversity, 1(1), 52-66.
Sanderson, B.M., Knutti, R., & Caldwell, P. (2015) A Representative Democracy to
Reduce Interdependency in a Multimodel Ensemble. Journal of Climate, 28, 5171–
5194
Schloegel, L. M., Picco, A. M., Kilpatrick, A. M., Davies, A. J., Hyatt, A. D., & Daszak,
P. (2009) Magnitude of the US trade in amphibians and presence of
Batrachochytrium dendrobatidis and ranavirus infection in imported North
American bullfrogs (Rana catesbeiana) Biological Conservation, 142(7), 1420-
1426.
Stuart, S. N., Chanson, J. S., Cox, N. A., Young, B. E., Rodrigues, A. S., Fischman, D. L.,
& Waller, R. W. (2004) Status and trends of amphibian declines and extinctions
worldwide. Science, 306(5702), 1783-1786.
Vences, M., Hauswaldt S., Steinfartz S., Rupp, O., Goesmann, A., Künzel, S., Orozco-
Terwengel, P., Vieites, D.R., Nieto-Roman, S., Haas, S., Laugsch, C., Gehara, M.,
Bruchmann, S., Pabijan, M., Ludewig, A.K., Rudert, D., Angelini, C., Borkin, L.J.,
Crochet, P.A., Crottini, A., Dubois, A., Ficetola, F., Galán, P., Geniez, P., Hachtel,
M., Jovanovic, O., Litvinchuk, S.N., Lymberakis, P., Ohler, A., Smirnov, N.A.
(2013) Radically different phylogeographies and patterns of genetic variation in two
European brown frogs, genus Rana. Molecular Phylogenetics and Evolution, 68:
657–670.
Vieites, D.R. (2003) Temporal and spatial dynamics of a high mountain metapopulation
of Rana temporaria. Ph.D. Thesis. Universidade de Vigo.
Vredenburg, V. T., du Preez, L., Raharivololoniaina, L., Vieites, D. R., Vences, M., &
Weldon, C. (2012) A molecular survey across Madagascar does not yield positive
records of the amphibian chytrid fungus Batrachochytrium dendrobatidis. Herpetol
Notes, 5, 507-517.
Wake, D. B., & Vredenburg, V. T. (2008) Are we in the midst of the sixth mass
extinction? A view from the world of amphibians. Proceedings of the National
Academy of Sciences.
Walker, S. F., Bosch, J., Gomez, V., Garner, T. W. J., Cunningham, A. A., Schmeller, D.
S., Ninyerola, M., Henk, D. A., Ginestet, C., Arthur C. P., & Fisher, M. C. (2010)
Factors driving pathogenicity vs. prevalence of amphibian panzootic
chytridiomycosis in Iberia. Ecology Letters, 13(3), 372–382.
http://doi.org/10.1111/j.1461-0248.2009.01434.x
Woodhams, D. C., Vredenburg, V. T., Simon, M. A., Billheimer, D., Shakhtour, B., Shyr,
Y., Briggs, C. J., Rollins-Smith L. A., & Harris, R. N. (2007) Symbiotic bacteria
contribute to innate immune defenses of the threatened mountain yellow-legged
frog, Rana muscosa. Biological conservation, 138(3-4), 390-398.

82

83
Chapter 3:
The complete mitochondrial genome of
the Endangered European brown frog
Rana pyrenaica through RNAseq.
This chapter reproduce entirely the manuscript:
Peso-Fernandez. M, Ponti. R., Pons. G, Gonzalez. R Arcones, A. and Vieites D.R. (2016) The
complete mitochondrial genome of the Endangered European brown frog Rana pyrenaica through
RNAseq, Mitochondrial DNA Part B, 1:1, 394-396, DOI:10.1080/23802359.2016.1174087

COMPLETE MITOCHONDRIAL GENOME
84
CHAPTER 3
85
The complete mitochondrial genome of the Endangered European brown frog Rana pyrenaica through RNAseq.
Abstract:
We sequenced the complete mitogenome of the Pyrenean frog Rana pyrenaica,
which was determined from an Illumina Hi-seq RNAseq run. The genome is 17,213 bp in
size, including 13 protein-coding genes, 21 transfer RNAs, 2 ribosomal RNAs and a
control region. It shows the typical gene order of previously available frog mitogenomes,
although it lacks the tRNAPhe. This is the first complete mitogenome described for a
Western Palearctic brown frog species.
Keywords: Amphibia, mitogenome, RNAseq, Pyrenees, Rana pyrenaica.
INTRODUCTION
The Pyrenean frog (Rana pyrenaica) is an endangered narrowly-distributed
European endemism (Sillero et al. 2014). Despite that its sister species Rana temporaria
shows a considerable degree of mtDNA genetic variation across its range, including
several divergent lineages in the Pyrenees (Vences et al. 2013), a preliminary mtDNA
study across the range of R. pyrenaica showed a single mutation difference using three
mitochondrial genes (Carranza & Arribas 2008). This potential lack of genetic variation
has important conservation implications for this endangered species.
RNAseq is becoming a common approach for gathering transcriptome data using
Next Generation Sequencing, being complete mitogenomes a potential output. We
explored the use of RNAseq to describe the complete mitogenome of R. pyrenaica, which
will benefit future phylogeographic, population genetic and conservation studies.
MATERIALS AND METHODS
An adult R. pyrenaica (Museo Nacional de Ciencias Naturales, Madrid, collection
number MNCN 46671, Fieldnumber DRV7602) was collected in Uztárroz (42º35´38´´N,
0º59´27´´W), NE Spain. We extracted RNA from several tissues, which were quantified
COMPLETE MITOCHONDRIAL GENOME
86
with Qubit HS and normalized. A RNAseq library was prepared using the NEBNext Ultra
RNA kit for Illumina. Quantification and size estimation were performed on a
Bioanalyzer 2100 High Sensitivity DNA chip, and sequenced on half lane on a Illumina
HiSeq (2x100 bp pair-end reads). After quality control and trimming with Trimmomatic
(v 0.32.2) (Bolger et al. 2014), assembly was done with Trinity (v 2.0.6) (Haas et al.
2013). Trinity recovered the mitogenome except part of the control region; hence we used
this assembly as input for MITObim (Hahn et al. 2013) to complete the reconstruction.
Genome annotation was done through nucleotide sequence alignments with other ranids.
The genome is deposited in GenBank (KU720300).
RESULTS
The complete mitogenome of R. pyrenaica is 17,213 bp in length, including 13
protein-coding genes, 2 rRNAs, 21 tRNAs and a control region. Gene order, lengths and
codon compositions are shown in Table 1. The overall base composition of the heavy
strand is 27.7% for A, 28.3% for T, 14.9% for G and 29.1% for C, with an A+T bias of
59.9%, similar to other ranid species (eg. Hofman et al. 2014, Li et al. 2014 a,b, Ni et al.
2015). The genome shows a similar gene organization as other ranids (eg. Kurabayashi et
al. 2010, Xia et al. 2014), but it is the only anuran known so far lacking the tRNAPhe.

CHAPTER 3
87
Figure 1. Phylogenetic reconstruction of the relationships between ranid frogs, based on available complete
mitochondrial genomes except control regions. Maximum-likelihood analyses using a partitioned dataset by
codon and gene were performed in RaxML, running for 1000 generations. ML support values are provided
above branches. Genbank accession numbers are provided after the species names.
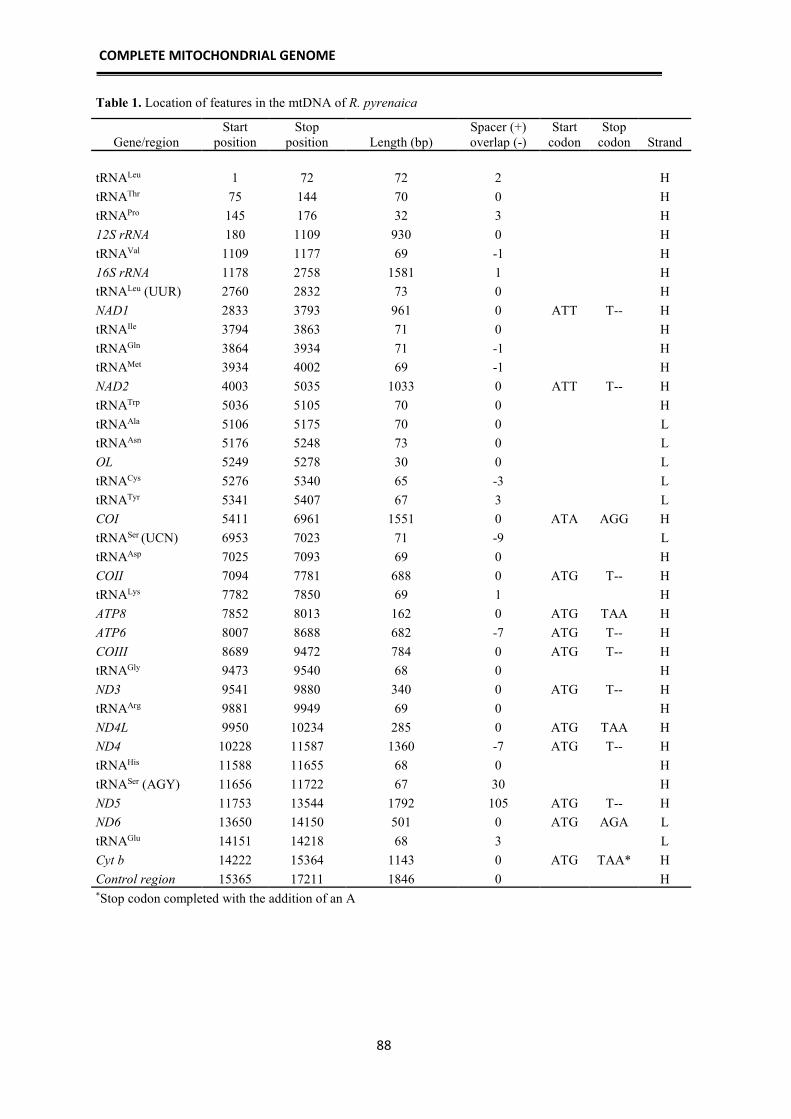
COMPLETE MITOCHONDRIAL GENOME
88
Table 1. Location of features in the mtDNA of R. pyrenaica
Gene/region
Start
position
Stop
position Length (bp)
Spacer (+)
overlap (-)
Start
codon
Stop
codon
Strand
tRNALeu 1 72 72 2 H
tRNAThr 75 144 70 0 H
tRNAPro 145 176 32 3 H
12S rRNA 180 1109 930 0 H
tRNAVal 1109 1177 69 -1 H
16S rRNA 1178 2758 1581 1 H
tRNALeu (UUR) 2760 2832 73 0 H
NAD1 2833 3793 961 0 ATT T-- H
tRNAIle 3794 3863 71 0 H
tRNAGln 3864 3934 71 -1 H
tRNAMet 3934 4002 69 -1 H
NAD2 4003 5035 1033 0 ATT T-- H
tRNATrp 5036 5105 70 0 H
tRNAAla 5106 5175 70 0 L
tRNAAsn 5176 5248 73 0 L
OL 5249 5278 30 0 L
tRNACys 5276 5340 65 -3 L
tRNATyr 5341 5407 67 3 L
COI 5411 6961 1551 0 ATA AGG H
tRNASer (UCN) 6953 7023 71 -9 L
tRNAAsp 7025 7093 69 0 H
COII 7094 7781 688 0 ATG T-- H
tRNALys 7782 7850 69 1 H
ATP8 7852 8013 162 0 ATG TAA H
ATP6 8007 8688 682 -7 ATG T-- H
COIII 8689 9472 784 0 ATG T-- H
tRNAGly 9473 9540 68 0 H
ND3 9541 9880 340 0 ATG T-- H
tRNAArg 9881 9949 69 0 H
ND4L 9950 10234 285 0 ATG TAA H
ND4 10228 11587 1360 -7 ATG T-- H
tRNAHis 11588 11655 68 0 H
tRNASer (AGY) 11656 11722 67 30 H
ND5 11753 13544 1792 105 ATG T-- H
ND6 13650 14150 501 0 ATG AGA L
tRNAGlu 14151 14218 68 3 L
Cyt b 14222 15364 1143 0 ATG TAA* H
Control region 15365 17211 1846 0 H *Stop codon completed with the addition of an A
CHAPTER 3
89
CONCLUSION
The number of available complete mitochondrial genomes is increasing but
surprisingly there are very few available for European frogs. A maximum likelihood
phylogenetic analysis of ranid frogs based on available complete mitogenomes (Fig. 1)
recovers the European R. pyrenaica as the sister taxon to the clade of Asian brown frogs.
RNAseq has proven to be a very fast and useful approach to gather complete
mitogenomes. Although using common assembly tools like Trinity was not enough to
gather the full genome, the combination with MITOBim has performed well to fill the
assembly gaps. This approach can be routinely used to gather mitogenomes as a
byproduct of transcriptome sequencing.
COMPLETE MITOCHONDRIAL GENOME
90
Acknowledgments
This work was supported by the Spanish OAPN- Ministry of Environment under
Grant 206/2010; Zoo de Barcelona (Ayuntamiento de Barcelona); and the Spanish
Ministry of Economy under Grant CGL2013-40924-P. MP was supported by a CNPQ
fellowship. We thank the CETA/CIEMAT for the use of their infrastructures, and the
Navarra authorities for collecting permits.
References
Bolger, A. M., Lohse, M., & Usadel, B. (2014) Trimmomatic: a flexible trimmer for
Illumina sequence data. Bioinformatics, btu170.
Carranza, S., & Arribas, O. 2008. Genetic uniformity of Rana pyrenaica Serra-Cobo,
(1993) across its distribution range: a preliminary study with mtDNA sequences.
Amphibia-Reptilia, 29:579-582.
Haas, B. J., Papanicolaou, A., Yassour, M., Grabherr, M., Blood, P. D., Bowden, J.,
Couger, M. B., Eccles, D., Li, B., Lieber, M., MacManes, M. D., Ott, M., Orvis, J.,
pochet, N., Strozzi, F., Weeks, N., Westerman, R., William, T., Dewey, C. N.,
Henschel, R., leDuc, R. D., Friedman, N., & Regev, A. (2013) De novo transcript
sequence reconstruction from RNA-seq using the Trinity platform for reference
generation and analysis. Nature protocols, 8(8), 1494-1512.
Hahn, C., Bachmann, L., & Chevreux, B. (2013) Reconstructing mitochondrial genomes
directly from genomic next-generation sequencing reads—a baiting and iterative
mapping approach. Nucleic Acids Research, 41(13):e129-e129.
Hofman, S., Pabijan, M., Osikowski, A., & Szymura, J. M. (2014) Complete
mitochondrial genome of the Greek marsh frog Pelophylax cretensis (Anura,
Ranidae). Mitochondrial DNA, 0:1-2.
Kurabayashi, A., Yoshikawa, N., Sato, N., Hayashi, Y., Oumi, S., Fujii, T., & Sumida, M.
(2010) Complete mitochondrial DNA sequence of the endangered frog Odorrana
ishikawae (family Ranidae) and unexpected diversity of mt gene arrangements in
ranids. Molecular Phylogenetics and Evolution, 56:543–53.
Li, J., Lei, G., & Fu, C. (2014a) Complete mitochondrial genomes of two brown frogs,
Rana dybowskii and Rana cf. chensinensis (Anura: Ranidae). Mitochondiral DNA,
0:1-2.
Li, J., Yin, W., Xia, R., Lei, G., & Fu, C. (2014b) Complete mitochondrial genome of a
brown frog, Rana kunyuensis (Anura: Ranidae). Mitochondiral DNA, 0:1-2.
Ni, N., Yu, D., Storey, K. B., Zheng, R., & Zhang, J. (2015) The complete mitochondrial
genome of Lithobates sylvaticus (Anura: Ranidae). Mitochondiral DNA, 0:1-2.
Sillero, N., Campos, J., Bonardi, A., Corti, C., Creemers, R., Crochet, P. A., Isailović, J.
C., Denoël, M., Ficetola, G. F., Gonçalves, J., Kuzmin, S., Lymberakis, P., de Pous,
P., Rodríguez, A., Sindaco, R., Speybroeck, J., Toxopeus, B., Vieites, D. R., &

CHAPTER 3
91
Vences, M. (2014) Updated distribution and biogeography of amphibians and
reptiles of Europe. Amphibia-Reptilia, 35(1):1-31.
Vences, M., Hauswaldt, S., Steinfartz, S., Rupp, O., Goesmann, A., Künzel, S., Orozco-
terWengel, P., Vieites, D. R., Nieto-Román, S., Haas, S., Laugsch, C., Gehara, M.,
Bruchmann, S., Pabijan, M., Ludewig, A. K., Rudert, D., Angelini, C., Borkin, L. J.,
Crochet, P. A., Crottini, A., Dubois, A., Ficetola, F., Galán, P., Geniez, P., Hachtel,
M., Jovanovic, O., Litvinchuk, S. N., Lymberakis, P., Ohler, A., & Smirnov, N.
(2013) Radically different phylogeographies and patterns of genetic variation in two
European brown frogs, genus Rana. Molecular Phylogenetics and Evolution,
68:657–670.
Xia, Y., Zheng, Y., Miura, I., Wong, P. B., Murphy, R. W., & Zeng, X. (2014) The
evolution of mitochondrial genomes in modern frogs (Neobatrachia): nonadaptive
evolution of mitochondrial genome reorganization. BMC Genomics, 15(1):691.

92

93
Chapter 4:
Mitogenomic phylogeography of the
endangered Pyrenean frog reveals
a lack of genetic variation
and a recent Holocene expansion

MITOGENOMIC PHYLOGEOGRAPHY
94
CHAPTER 4
95
Mitogenomic phylogeography of the endangered
Pyrenean frog reveals a lack of genetic variation and a
recent Holocene expansion.
Abstract:
The Pyrenean frog, Rana pyrenaica, is narrow range endemic species mainly
distributed in northern Aragón and part of Navarra (Spain), with few isolated populations
in France. It is one of the species of European amphibians with the smallest distribution
range. A distribution gap divides its range in two unconnected areas, which lead to the
hypothesis that this gap originated during Pleistocene glaciations, and that the two areas
of occurrence correspond to postglacial expansions from two putative isolated refugia.
Here, we reconstructed the phylogeography of the Pyrenean frog across its full
distribution range using nearly complete mitochondrial genomes to test this hypothesis,
which should be reflected in the genetic data by showing spatial genetic geographic
structure. By sequencing mitochondrial genomes we were able to assess the degree of
genetic variation across the full genome in the species. We amplified the most variable
regions in a set of individuals covering its full distribution range finding 17 haplotypes
with no clear geographic structure, suggesting recent gene flow and population
connectivity. The reconstructed demography suggested small effective population sizes
and a recent geographic expansion. Hindcasted species distribution models show in fact
that during present times and glacial periods the gap persisted in the mountains,
separating two main areas, but those were likely connected in the south across the pre-
Pyrenean mountain range and the central valley. The small effective and estimated adult
population sizes, together with very low genetic diversity in comparison with other
species and a patchy distribution range, raise concerns about the capacity of the species to
face current and future threats.
Keywords: Rana pyrenaica, Pleistocene, Mitochondrial genome, Phylogeography,
genetic variation.

MITOGENOMIC PHYLOGEOGRAPHY
96
INTRODUCTION
The current distribution ranges and genetic architecture of species reflect historical
processes that shaped them, mainly since the Pleistocene. In the northern hemisphere,
Pleistocene glacial and interglacial periods are known to have reduced species'
distribution ranges at high latitudes and altitudes by the expansion of ice sheets and
glaciers, which turned into a genetic pattern of lower genetic variation in those areas after
being recolonized in interglacial periods, and higher genetic diversity in the so-called
refugia were species retreated during cold periods (Taberlet et al. 1998; Hewitt 1999,
2000, 2004, Weiss & Ferrand 2007). Being the switch between glacial and interglacial
periods an intermittent process, the actual distribution ranges and phylogeographic
structure should reflect the pattern originated since the last glacial maximum up to today,
both across latitudinal gradients at a continental scale, and altitudinal gradients in
mountain ranges (Hewitt 1999, 2000, Schmitt et al. 2006, Canestrelli et al. 2008, Schmitt
2009). However, the genetic variation and origin of lineages present in refugia can
predate Pleistocene times (e.g. Recuero & García-París 2011)
Identifying refugia has received a lot of attention, with the phylogeographic
structure of many species being studied in the last decades. One of the predictions of the
refugium theory is that refugia showed more stable climatic and ecological conditions that
allowed species to persist during cold and interglacial periods, hence in those areas
persisted most of the genetic legacy of species and they should have higher genetic
diversity than recolonized areas (Schneider et al. 1998, Carnaval et al. 2009). At the
European scale, continental patterns in widely distributed species have shown postglacial
recolonizations at higher latitudes reflecting low genetic variation (Hewitt 2000, 2004),
with main refugia located in the Mediterranean Peninsulas (Iberian, Italic and Balcanic)
(Hewitt 1999, Weiss & Ferrand 2007). Within the European Peninsulas there is also
spatial genetic structure which has been proposed as a “refugia within refugia” model
(Gómez & Lunt 2007, Abellán & Svenning 2014) linked to long-term climatic stability,
which may have arose by allopatric differentiation related to climatic and/or geographic
barriers to gene flow and posterior secondary contacts.
At smaller geographical scales, like in mountain ranges, and especially with cold-
adapted species, this refugia theory does not necessarily fits well in space. During
glaciations, many northern hemisphere species where present far south, with fossil

CHAPTER 4
97
evidence of bison (Bison bison), snowy owls (Bubo scandicus) or black grouses (Tetrao
tetrix) present in the Pyrenees (Arribas 2004). These species now retreated to northern
latitudes with no remaining populations in the southern European refugia where the
climate is not suitable anymore for them. A similar pattern likely happened with many
mountain species that are now present at high elevations but absent in lowlands, while
there is fossil evidence of their lowland presence during glaciations (eg. Arribas 2004,
López-García et al. 2010). Hence, in high mountain ranges with steep elevational
gradients like the Alps and the Pyrenees, there likely were not many ecologically and
climatically stable areas through time, and species went up and down tracking climatic
changes. Interestingly, within this overall pattern, there is increasing evidence of the
existence of nunataks, small areas that remained unglaciated in the mountains (Ehlers &
Gibbard 2004), that promoted genetic differentiation (Bettin et al. 2007, Escobar-García
et al. 2012, Schönswetter et al. 2005, Stehlik et al. 2002, Wachter et al. 2012,
Westergaard et al. 2011). This could explain the persistence of divergent and isolated
lineages in some amphibian species, including a basal divergent lineage of the European
common frog (Rana temporaria) in the Pyrenees and Cantabrian mountains (Vences et al.
2013).
Species with low dispersal capacities like Rana temporaria or R. pyrenaica will
likely be more affected by climate changes, as their ability to track their preferred climate
is lower than more mobile species. This is the case of most amphibians, and their spatial
genetic structure is likely to reflect fine scale effects related to past climatic events as well
as barriers. In mountain areas like the Pyrenees, the interaction of past climatic changes
and the appearance and disappearance of barriers (like glaciers that covered many valleys
with ice), may have lead an imprint in species' current phylogeographic structure. Recent
works have recovered two main genetic clusters in several species (plants, invertebrates
and vertebrates), corresponding to the western and eastern Pyrenees (considering the full
mountain range from Cataluña to Navarra), and those are interpreted as the result of two
main Pleistocene refugia in the Pyrenees, one in the eastern Pyrenees, and the other in the
west-central area (Schmitt et al. 2006, Mouret et al. 2011, Valbuena-Ureña et al. 2013,
2018, Charrier et al. 2014, Bidegaray-Batista et al. 2016). From these works strong
glacial bottlenecks during the Plesitocene were hypothesized, followed by demographic
and population expansions during interglacials. R. pyrenaica is not distributed in the
eastern Pyrenees, so its full range fits within the putative western-central refugium.

MITOGENOMIC PHYLOGEOGRAPHY
98
The Pyrenean frog, Rana pyrenaica, is an endangered species that is endemic to
the Pyrenees, being distributed in a relatively small area with many small fragmented and
unconnected populations (Chapter 1). Its current range spans 440 m to 2.100 m a.s.l.
(Serra-Cobo 2002, Duchateau et al. 2012), not being present at higher elevations like its
sister taxon Rana temporaria that reaches ca. 2500 m a.s.l. in these mountains (Vences et
al. 2003). Most of its range is below the distribution range of ice sheets during the last
glacial maximum (LGM) (Ehlers & Gibbard 2004), with some areas being recolonized
during the Holocene warming. Its distribution range is also at the western part of the
extent of Pyrenean glaciated areas, and likely was affected by potential barriers like the
large glaciers that covered the Gállego or Ara rivers, as being a stream species its habitat
had to retreat to lower unglaciated elevations. There is no fossil evidence of Pyrenean
frogs at lowlands during glaciations, but there is of Rana temporaria and Calotriton asper
at the Colomera cave (670 m a.s.l.) in the pre-Pyrenees, as well as other cold adapted
mammals and reptiles species (López-García et al. 2010), which probes a glacial retreat
of now mountain species to lower elevations. The Pyrenean frog shows an actual
distribution gap that splits its range in two (Chapter 1). If this gap was a consequence of
an allopatric split caused by glaciations, we can hypothesize that the species may have
persisted in two microrefugia and there should be some phylogeographic structure related
to this. However, the only genetic data available for few individuals and markers show a
very low genetic variation in the species from both areas (Carranza & Arribas 2008).
Most phylogeographic studies have focused on mitochondrial loci that have universal
primers that allow a PCR amplification across amphibian species (Vences et al. 2005),
but those loci may not always reflect the real degree of genetic variation within species.
In mitochondrial genomes there are conserved and variable regions, hence, considering
the technological advances in next generation sequencing, it is feasible to sequence full
mitochondrial genomes in order to really assess the mitogenomic genetic variation within
species (Peso et al. 2016). This is of outmost relevance in species with likely low genetic
variation like small range endemics.
Here, we first wanted to reconstruct the phylogeographic pattern of Rana
pyrenaica, covering its full range and all the areas that were potentially affected by
barriers in the past and the present; by doing so we aim to test the two refugia hypothesis
by integrating molecular analyses with hincasted species distribution modeling. And
second, we wanted to assess the degree of genetic variation and diversity within the
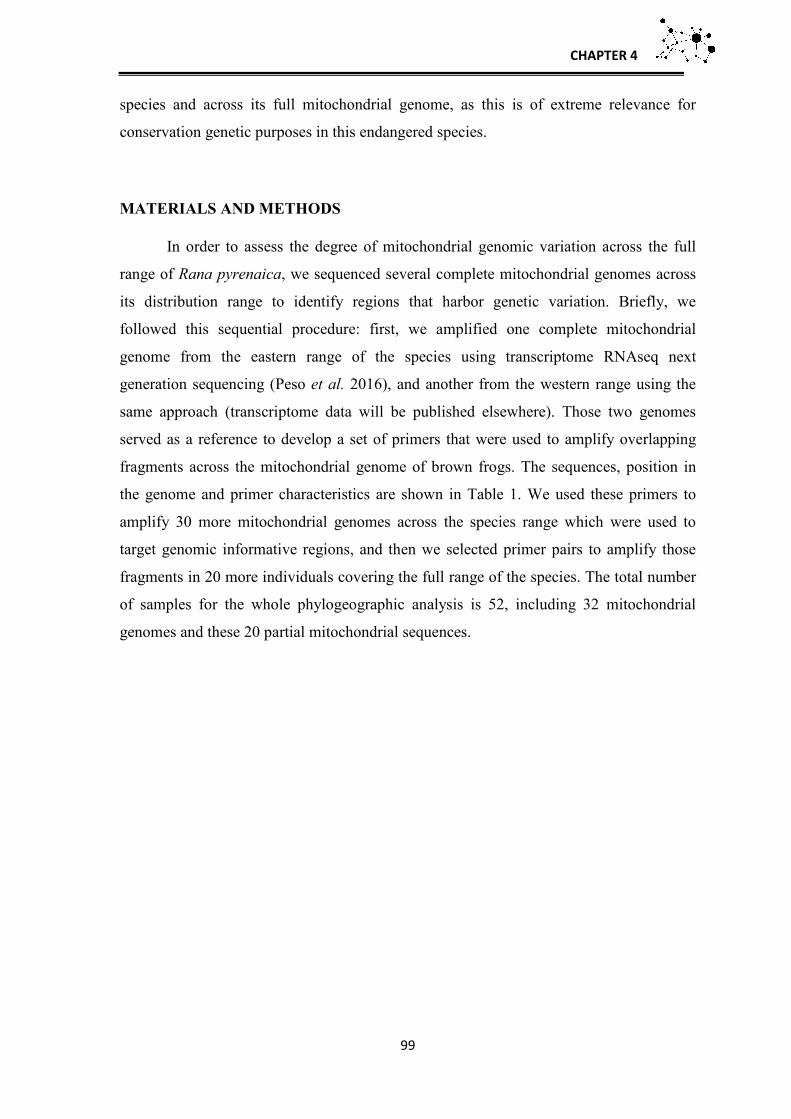
CHAPTER 4
99
species and across its full mitochondrial genome, as this is of extreme relevance for
conservation genetic purposes in this endangered species.
MATERIALS AND METHODS
In order to assess the degree of mitochondrial genomic variation across the full
range of Rana pyrenaica, we sequenced several complete mitochondrial genomes across
its distribution range to identify regions that harbor genetic variation. Briefly, we
followed this sequential procedure: first, we amplified one complete mitochondrial
genome from the eastern range of the species using transcriptome RNAseq next
generation sequencing (Peso et al. 2016), and another from the western range using the
same approach (transcriptome data will be published elsewhere). Those two genomes
served as a reference to develop a set of primers that were used to amplify overlapping
fragments across the mitochondrial genome of brown frogs. The sequences, position in
the genome and primer characteristics are shown in Table 1. We used these primers to
amplify 30 more mitochondrial genomes across the species range which were used to
target genomic informative regions, and then we selected primer pairs to amplify those
fragments in 20 more individuals covering the full range of the species. The total number
of samples for the whole phylogeographic analysis is 52, including 32 mitochondrial
genomes and these 20 partial mitochondrial sequences.
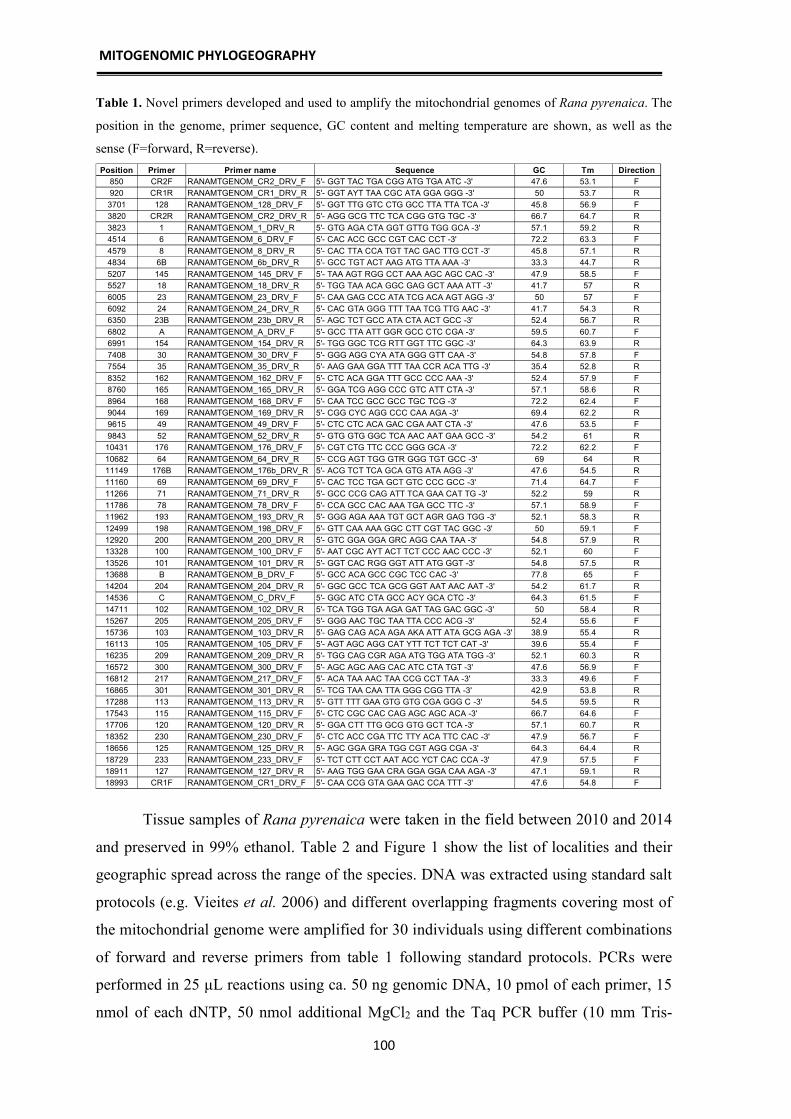
MITOGENOMIC PHYLOGEOGRAPHY
100
Table 1. Novel primers developed and used to amplify the mitochondrial genomes of Rana pyrenaica. The
position in the genome, primer sequence, GC content and melting temperature are shown, as well as the
sense (F=forward, R=reverse).
Tissue samples of Rana pyrenaica were taken in the field between 2010 and 2014
and preserved in 99% ethanol. Table 2 and Figure 1 show the list of localities and their
geographic spread across the range of the species. DNA was extracted using standard salt
protocols (e.g. Vieites et al. 2006) and different overlapping fragments covering most of
the mitochondrial genome were amplified for 30 individuals using different combinations
of forward and reverse primers from table 1 following standard protocols. PCRs were
performed in 25 µL reactions using ca. 50 ng genomic DNA, 10 pmol of each primer, 15
nmol of each dNTP, 50 nmol additional MgCl2 and the Taq PCR buffer (10 mm Tris-
Position Primer Primer name Sequence GC Tm Direction
850 CR2F RANAMTGENOM_CR2_DRV_F 5'- GGT TAC TGA CGG ATG TGA ATC -3' 47.6 53.1 F
920 CR1R RANAMTGENOM_CR1_DRV_R 5'- GGT AYT TAA CGC ATA GGA GGG -3' 50 53.7 R
3701 128 RANAMTGENOM_128_DRV_F 5'- GGT TTG GTC CTG GCC TTA TTA TCA -3' 45.8 56.9 F
3820 CR2R RANAMTGENOM_CR2_DRV_R 5'- AGG GCG TTC TCA CGG GTG TGC -3' 66.7 64.7 R
3823 1 RANAMTGENOM_1_DRV_R 5'- GTG AGA CTA GGT GTTG TGG GCA -3' 57.1 59.2 R
4514 6 RANAMTGENOM_6_DRV_F 5'- CAC ACC GCC CGT CAC CCT -3' 72.2 63.3 F
4579 8 RANAMTGENOM_8_DRV_R 5'- CAC TTA CCA TGT TAC GAC TTG CCT -3' 45.8 57.1 R
4834 6B RANAMTGENOM_6b_DRV_R 5'- GCC TGT ACT AAG ATG TTA AAA -3' 33.3 44.7 R
5207 145 RANAMTGENOM_145_DRV_F 5'- TAA AGT RGG CCT AAA AGC AGC CAC -3' 47.9 58.5 F
5527 18 RANAMTGENOM_18_DRV_R 5'- TGG TAA ACA GGC GAG GCT AAA ATT -3' 41.7 57 R
6005 23 RANAMTGENOM_23_DRV_F 5'- CAA GAG CCC ATA TCG ACA AGT AGG -3' 50 57 F
6092 24 RANAMTGENOM_24_DRV_R 5'- CAC GTA GGG TTT TAA TCG TTG AAC -3' 41.7 54.3 R
6350 23B RANAMTGENOM_23b_DRV_R 5'- AGC TCT GCC ATA CTA ACT GCC -3' 52.4 56.7 R
6802 A RANAMTGENOM_A_DRV_F 5'- GCC TTA ATT GGR GCC CTC CGA -3' 59.5 60.7 F
6991 154 RANAMTGENOM_154_DRV_R 5'- TGG GGC TCG RTT GGT TTC GGC -3' 64.3 63.9 R
7408 30 RANAMTGENOM_30_DRV_F 5'- GGG AGG CYA ATA GGG GTT CAA -3' 54.8 57.8 F
7554 35 RANAMTGENOM_35_DRV_R 5'- AAG GAA GGA TTT TAA CCR ACA TTG -3' 35.4 52.8 R
8352 162 RANAMTGENOM_162_DRV_F 5'- CTC ACA GGA TTT GCC CCC AAA -3' 52.4 57.9 F
8760 165 RANAMTGENOM_165_DRV_R 5'- GGA TCG AGG CCC GTC ATT CTA -3' 57.1 58.6 R
8964 168 RANAMTGENOM_168_DRV_F 5'- CAA TCC GCC GCC TGC TCG -3' 72.2 62.4 F
9044 169 RANAMTGENOM_169_DRV_R 5'- CGG CYC AGG CCC CAA AGA -3' 69.4 62.2 R
9615 49 RANAMTGENOM_49_DRV_F 5'- CTC CTC ACA GAC CGA AAT CTA -3' 47.6 53.5 F
9843 52 RANAMTGENOM_52_DRV_R 5'- GTG GTG GGC TCA AAC AAT GAA GCC -3' 54.2 61 R
10431 176 RANAMTGENOM_176_DRV_F 5'- CGT CTG TTC CCC GGG GCA -3' 72.2 62.2 F
10682 64 RANAMTGENOM_64_DRV_R 5'- CCG AGT TGG GTR GGG TGT GCC -3' 69 64 R
11149 176B RANAMTGENOM_176b_DRV_R 5'- ACG TCT TCA GCA GTG ATA AGG -3' 47.6 54.5 R
11160 69 RANAMTGENOM_69_DRV_F 5'- CAC TCC TGA GCT GTC CCC GCC -3' 71.4 64.7 F
11266 71 RANAMTGENOM_71_DRV_R 5'- GCC CCG CAG ATT TCA GAA CAT TG -3' 52.2 59 R
11786 78 RANAMTGENOM_78_DRV_F 5'- CCA GCC CAC AAA TGA GCC TTC -3' 57.1 58.9 F
11962 193 RANAMTGENOM_193_DRV_R 5'- GGG AGA AAA TGT GCT AGR GAG TGG -3' 52.1 58.3 R
12499 198 RANAMTGENOM_198_DRV_F 5'- GTT CAA AAA GGC CTT CGT TAC GGC -3' 50 59.1 F
12920 200 RANAMTGENOM_200_DRV_R 5'- GTC GGA GGA GRC AGG CAA TAA -3' 54.8 57.9 R
13328 100 RANAMTGENOM_100_DRV_F 5'- AAT CGC AYT ACT TCT CCC AAC CCC -3' 52.1 60 F
13526 101 RANAMTGENOM_101_DRV_R 5'- GGT CAC RGG GGT ATT ATG GGT -3' 54.8 57.5 R
13688 B RANAMTGENOM_B_DRV_F 5'- GCC ACA GCC CGC TCC CAC -3' 77.8 65 F
14204 204 RANAMTGENOM_204_DRV_R 5'- GGC GCC TCA GCG GGT AAT AAC AAT -3' 54.2 61.7 R
14536 C RANAMTGENOM_C_DRV_F 5'- GGC ATC CTA GCC ACY GCA CTC -3' 64.3 61.5 F
14711 102 RANAMTGENOM_102_DRV_R 5'- TCA TGG TGA AGA GAT TAG GAC GGC -3' 50 58.4 R
15267 205 RANAMTGENOM_205_DRV_F 5'- GGG AAC TGC TAA TTA CCC ACG -3' 52.4 55.6 F
15736 103 RANAMTGENOM_103_DRV_R 5'- GAG CAG ACA AGA AKA ATT ATA GCG AGA -3' 38.9 55.4 R
16113 105 RANAMTGENOM_105_DRV_F 5'- AGT AGC AGG CAT YTT TCT TCT CAT -3' 39.6 55.4 F
16235 209 RANAMTGENOM_209_DRV_R 5'- TGG CAG CGR AGA ATG TGG ATA TGG -3' 52.1 60.3 R
16572 300 RANAMTGENOM_300_DRV_F 5'- AGC AGC AAG CAC ATC CTA TGT -3' 47.6 56.9 F
16812 217 RANAMTGENOM_217_DRV_F 5'- ACA TAA AAC TAA CCG CCT TAA -3' 33.3 49.6 F
16865 301 RANAMTGENOM_301_DRV_R 5'- TCG TAA CAA TTA GGG CGG TTA -3' 42.9 53.8 R
17288 113 RANAMTGENOM_113_DRV_R 5'- GTT TTT GAA GTG GTG CGA GGG C -3' 54.5 59.5 R
17543 115 RANAMTGENOM_115_DRV_F 5'- CTC CGC CAC CAG AGC AGC ACA -3' 66.7 64.6 F
17706 120 RANAMTGENOM_120_DRV_R 5'- GGA CTT TTG GCG GTG GCT TCA -3' 57.1 60.7 R
18352 230 RANAMTGENOM_230_DRV_F 5'- CTC ACC CGA TTC TTY ACA TTC CAC -3' 47.9 56.7 F
18656 125 RANAMTGENOM_125_DRV_R 5'- AGC GGA GRA TGG CGT AGG CGA -3' 64.3 64.4 R
18729 233 RANAMTGENOM_233_DRV_F 5'- TCT CTT CCT AAT ACC YCT CAC CCA -3' 47.9 57.5 F
18911 127 RANAMTGENOM_127_DRV_R 5'- AAG TGG GAA CRA GGA GGA CAA AGA -3' 47.1 59.1 R
18993 CR1F RANAMTGENOM_CR1_DRV_F 5'- CAA CCG GTA GAA GAC CCA TTT -3' 47.6 54.8 F
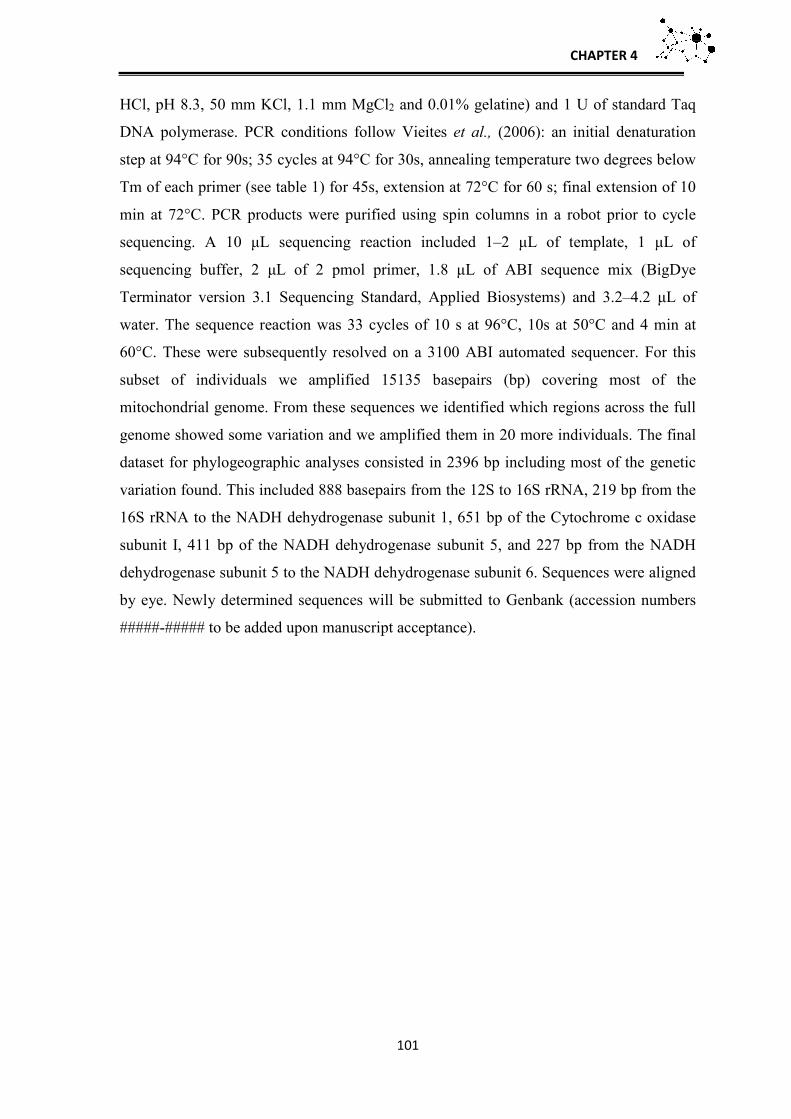
CHAPTER 4
101
HCl, pH 8.3, 50 mm KCl, 1.1 mm MgCl2 and 0.01% gelatine) and 1 U of standard Taq
DNA polymerase. PCR conditions follow Vieites et al., (2006): an initial denaturation
step at 94°C for 90s; 35 cycles at 94°C for 30s, annealing temperature two degrees below
Tm of each primer (see table 1) for 45s, extension at 72°C for 60 s; final extension of 10
min at 72°C. PCR products were purified using spin columns in a robot prior to cycle
sequencing. A 10 µL sequencing reaction included 1–2 µL of template, 1 µL of
sequencing buffer, 2 µL of 2 pmol primer, 1.8 µL of ABI sequence mix (BigDye
Terminator version 3.1 Sequencing Standard, Applied Biosystems) and 3.2–4.2 µL of
water. The sequence reaction was 33 cycles of 10 s at 96°C, 10s at 50°C and 4 min at
60°C. These were subsequently resolved on a 3100 ABI automated sequencer. For this
subset of individuals we amplified 15135 basepairs (bp) covering most of the
mitochondrial genome. From these sequences we identified which regions across the full
genome showed some variation and we amplified them in 20 more individuals. The final
dataset for phylogeographic analyses consisted in 2396 bp including most of the genetic
variation found. This included 888 basepairs from the 12S to 16S rRNA, 219 bp from the
16S rRNA to the NADH dehydrogenase subunit 1, 651 bp of the Cytochrome c oxidase
subunit I, 411 bp of the NADH dehydrogenase subunit 5, and 227 bp from the NADH
dehydrogenase subunit 5 to the NADH dehydrogenase subunit 6. Sequences were aligned
by eye. Newly determined sequences will be submitted to Genbank (accession numbers
#####-##### to be added upon manuscript acceptance).
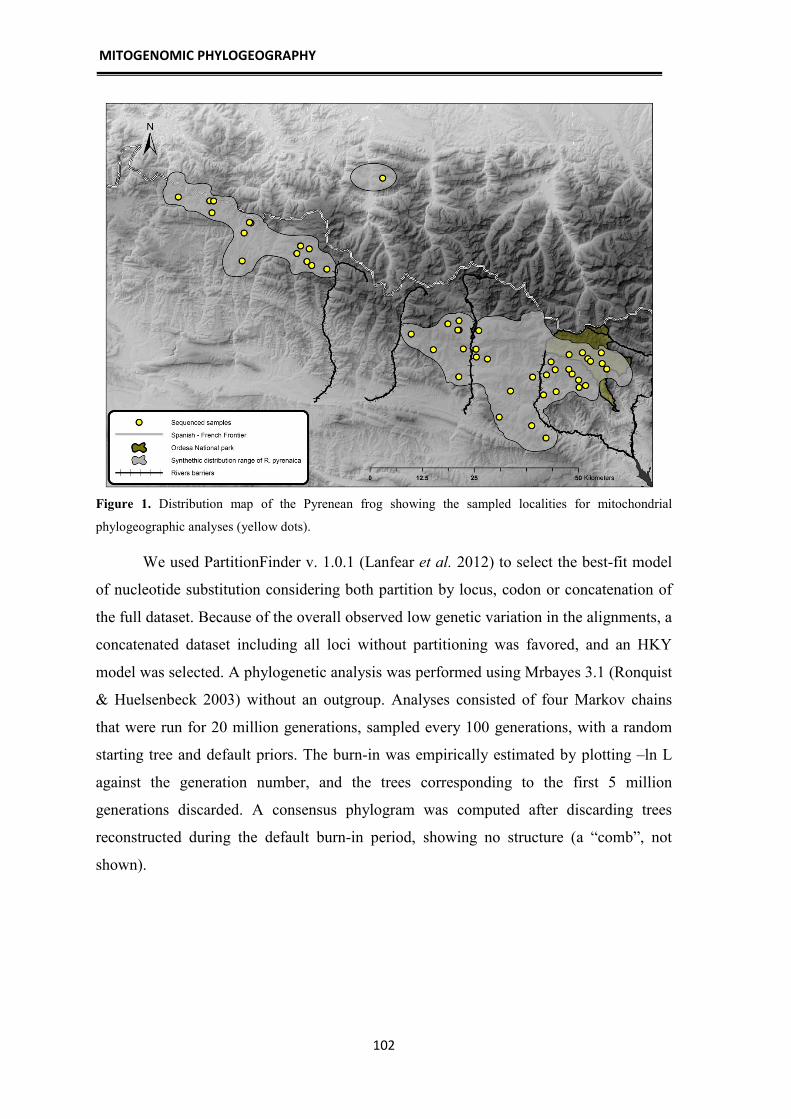
MITOGENOMIC PHYLOGEOGRAPHY
102
Figure 1. Distribution map of the Pyrenean frog showing the sampled localities for mitochondrial
phylogeographic analyses (yellow dots).
We used PartitionFinder v. 1.0.1 (Lanfear et al. 2012) to select the best-fit model
of nucleotide substitution considering both partition by locus, codon or concatenation of
the full dataset. Because of the overall observed low genetic variation in the alignments, a
concatenated dataset including all loci without partitioning was favored, and an HKY
model was selected. A phylogenetic analysis was performed using Mrbayes 3.1 (Ronquist
& Huelsenbeck 2003) without an outgroup. Analyses consisted of four Markov chains
that were run for 20 million generations, sampled every 100 generations, with a random
starting tree and default priors. The burn-in was empirically estimated by plotting –ln L
against the generation number, and the trees corresponding to the first 5 million
generations discarded. A consensus phylogram was computed after discarding trees
reconstructed during the default burn-in period, showing no structure (a “comb”, not
shown).

CHAPTER 4
103
Table 2. Fieldnumbers and locality information of sequenced tissue samples. The different areas considered
are explained in the text..
Sample Locality Latitude Longitude Area
2012/458 Altos Ordesa 42.629942 0.019567 Añisclo-Escuaín
2012/474 Altos Ordesa 42.624038 0.027156 Añisclo-Escuaín
2012/934 Rio Bellós 42.64153 0.059703 Añisclo-Escuaín
2012/750 Barranco de San Vicenda 42.618325 0.061162 Añisclo-Escuaín
2012/751 Barranco de San Vicenda 42.618325 0.061162 Añisclo-Escuaín
2012/812 Barranco Mallo Sasé 42.606182 0.073771 Añisclo-Escuaín
2012/824 Ordesa 42.643361 0.004639 Ordesa
2012/849 Ordesa 42.640007 -0.03466 Ordesa
2010/481 Fuen Obispo 42.56867 -0.00891 Ara East
2011/862 Rio Aso 42.58447 -0.00951 Ara East
2011/865 Barranco Biandico Aso 42.572207 0.010119 Ara East
2010/510 As Gloces 42.59803 -0.02803 Ara East
2010/466 Borrué 42.60863 -0.03706 Ara East
2010/595 Pista Rosada 42.56117 -0.07635 Ara East
2011/744 Barranco de Chate 42.60868 -0.07687 Ara East
2010/544 Diaza 42.62574 -0.08838 Ara East
2011/738 Barranco de Arán tributario 42.59807 -0.10291 Ara East
2011/759 Bco. pista de las pardinas 42.55518 -0.11377 Ara East
2011/818 Bco. San Juste 42.46208 -0.11059 Ara West
2010/123 Labate bajo 42.59437 -0.14353 Ara West
2011/806 Barranco de San Salvador 42.48965 -0.15124 Ara West
2011/1107 Otal 42.56586 -0.20962 Ara West
2011/1119 Otal 42.56586 -0.20962 Ara West
2011/926 Barranco de san Bartolomé 42.6367 -0.2738 Tena East
2011/707 Barranco de San Lorenzo 42.69851 -0.29662 Tena East
2011/852 Barranco Estabuen 42.64165 -0.30625 Tena East
2011/946 Bco del asieso 42.65861 -0.30628 Tena East
2010/317 La valle (Fiscal) 42.51044 -0.24505 Tena East
2012/434 Afluente Barranco puerto de Biescas 42.66004 -0.343496 Tena West
2011/509 Pista circular 42.72098 -0.35339 Tena West
2010/259 Pista circular E 42.70111 -0.35407 Tena West
DRV7601 Buesa 42.701043 -0.357721 Tena West
2012/973 Barranco Escuer 42.600116 -0.359002 Tena West
2011/542 Pista circular 42.71506 -0.3863 Tena West
2010/286 Cecutar 42.66037 -0.43111 Tena West
2011/002 Aljibe Pista:del Collarada 42.69545 -0.49456 Villanúa
2010/613 Tortiellas 42.84079 -0.73636 Hecho
2010/235 Mazandú 42.84956 -0.78031 Zuriza
2010/211 Gamueta 42.8855 -0.78634 Zuriza
2010/187 Paralelo al Baldagrás 42.8584 -0.79434 Zuriza
2011/151 Río Erlán 43.00433 -1.16753 Navarra
2011/352 Regata Errekaundia 42.99479 -1.07513 Navarra
2011/372 Regato de Koitxa 42.96873 -1.06941 Navarra
2011/343 Regata de Landatxikina 42.99402 -1.0638 Navarra
2010/227 Maz 42.89225 -0.81149 Navarra
2011/637 Barranco de la Contienda 42.87625 -0.82316 Navarra
2011/574 Barranco Kumuxiloa 42.94481 -0.95567 Navarra
DRV7602 Barranco de Burgiarte 42.945946 -0.960102 Navarra
2011/470 Barranco de Tropo 42.9234 -0.97649 Navarra
2011/422 Aroyo Birriés 42.86309 -0.98405 Navarra
DRV2014/1 Ruisseau de Saillen 43.03397 -0.56489 France
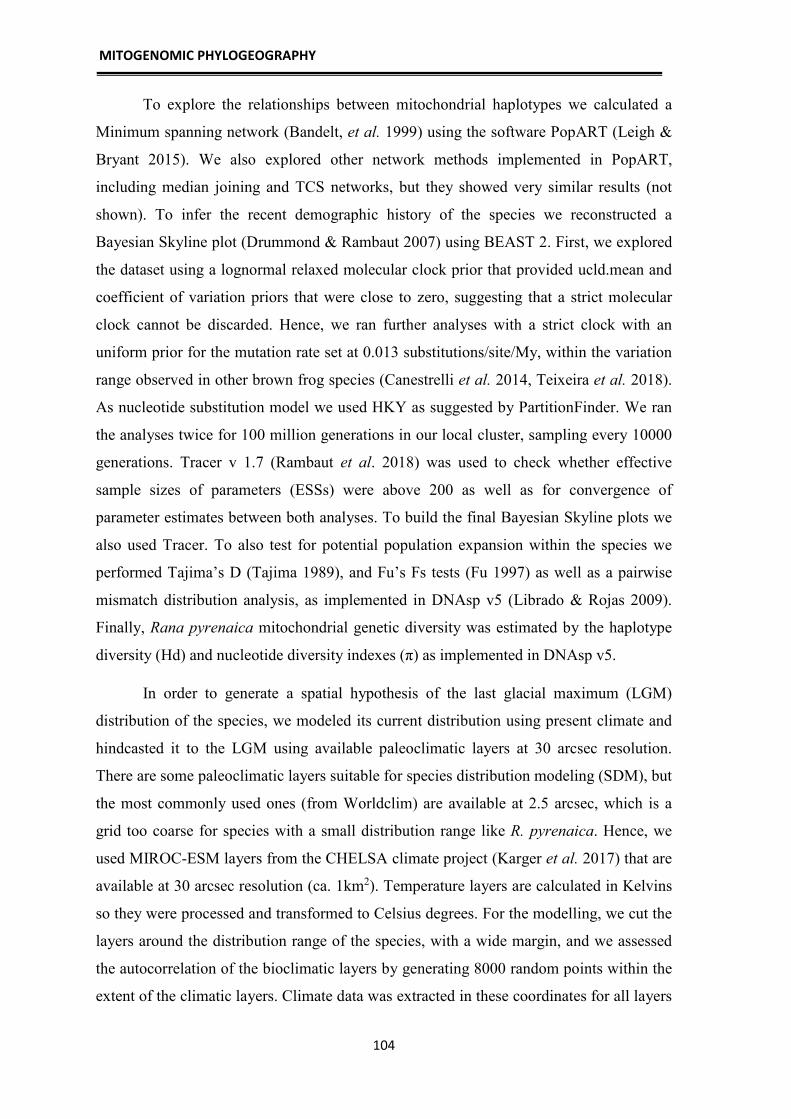
MITOGENOMIC PHYLOGEOGRAPHY
104
To explore the relationships between mitochondrial haplotypes we calculated a
Minimum spanning network (Bandelt, et al. 1999) using the software PopART (Leigh &
Bryant 2015). We also explored other network methods implemented in PopART,
including median joining and TCS networks, but they showed very similar results (not
shown). To infer the recent demographic history of the species we reconstructed a
Bayesian Skyline plot (Drummond & Rambaut 2007) using BEAST 2. First, we explored
the dataset using a lognormal relaxed molecular clock prior that provided ucld.mean and
coefficient of variation priors that were close to zero, suggesting that a strict molecular
clock cannot be discarded. Hence, we ran further analyses with a strict clock with an
uniform prior for the mutation rate set at 0.013 substitutions/site/My, within the variation
range observed in other brown frog species (Canestrelli et al. 2014, Teixeira et al. 2018).
As nucleotide substitution model we used HKY as suggested by PartitionFinder. We ran
the analyses twice for 100 million generations in our local cluster, sampling every 10000
generations. Tracer v 1.7 (Rambaut et al. 2018) was used to check whether effective
sample sizes of parameters (ESSs) were above 200 as well as for convergence of
parameter estimates between both analyses. To build the final Bayesian Skyline plots we
also used Tracer. To also test for potential population expansion within the species we
performed Tajima’s D (Tajima 1989), and Fu’s Fs tests (Fu 1997) as well as a pairwise
mismatch distribution analysis, as implemented in DNAsp v5 (Librado & Rojas 2009).
Finally, Rana pyrenaica mitochondrial genetic diversity was estimated by the haplotype
diversity (Hd) and nucleotide diversity indexes (π) as implemented in DNAsp v5.
In order to generate a spatial hypothesis of the last glacial maximum (LGM)
distribution of the species, we modeled its current distribution using present climate and
hindcasted it to the LGM using available paleoclimatic layers at 30 arcsec resolution.
There are some paleoclimatic layers suitable for species distribution modeling (SDM), but
the most commonly used ones (from Worldclim) are available at 2.5 arcsec, which is a
grid too coarse for species with a small distribution range like R. pyrenaica. Hence, we
used MIROC-ESM layers from the CHELSA climate project (Karger et al. 2017) that are
available at 30 arcsec resolution (ca. 1km2). Temperature layers are calculated in Kelvins
so they were processed and transformed to Celsius degrees. For the modelling, we cut the
layers around the distribution range of the species, with a wide margin, and we assessed
the autocorrelation of the bioclimatic layers by generating 8000 random points within the
extent of the climatic layers. Climate data was extracted in these coordinates for all layers
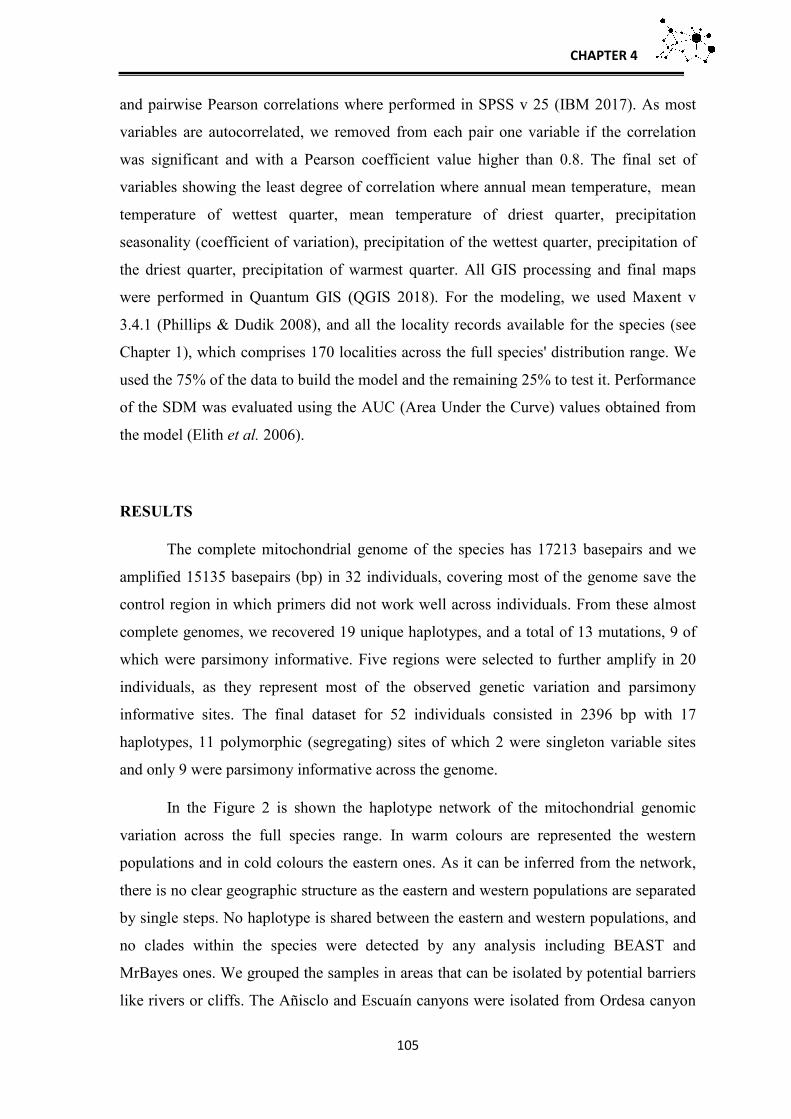
CHAPTER 4
105
and pairwise Pearson correlations where performed in SPSS v 25 (IBM 2017). As most
variables are autocorrelated, we removed from each pair one variable if the correlation
was significant and with a Pearson coefficient value higher than 0.8. The final set of
variables showing the least degree of correlation where annual mean temperature, mean
temperature of wettest quarter, mean temperature of driest quarter, precipitation
seasonality (coefficient of variation), precipitation of the wettest quarter, precipitation of
the driest quarter, precipitation of warmest quarter. All GIS processing and final maps
were performed in Quantum GIS (QGIS 2018). For the modeling, we used Maxent v
3.4.1 (Phillips & Dudik 2008), and all the locality records available for the species (see
Chapter 1), which comprises 170 localities across the full species' distribution range. We
used the 75% of the data to build the model and the remaining 25% to test it. Performance
of the SDM was evaluated using the AUC (Area Under the Curve) values obtained from
the model (Elith et al. 2006).
RESULTS
The complete mitochondrial genome of the species has 17213 basepairs and we
amplified 15135 basepairs (bp) in 32 individuals, covering most of the genome save the
control region in which primers did not work well across individuals. From these almost
complete genomes, we recovered 19 unique haplotypes, and a total of 13 mutations, 9 of
which were parsimony informative. Five regions were selected to further amplify in 20
individuals, as they represent most of the observed genetic variation and parsimony
informative sites. The final dataset for 52 individuals consisted in 2396 bp with 17
haplotypes, 11 polymorphic (segregating) sites of which 2 were singleton variable sites
and only 9 were parsimony informative across the genome.
In the Figure 2 is shown the haplotype network of the mitochondrial genomic
variation across the full species range. In warm colours are represented the western
populations and in cold colours the eastern ones. As it can be inferred from the network,
there is no clear geographic structure as the eastern and western populations are separated
by single steps. No haplotype is shared between the eastern and western populations, and
no clades within the species were detected by any analysis including BEAST and
MrBayes ones. We grouped the samples in areas that can be isolated by potential barriers
like rivers or cliffs. The Añisclo and Escuaín canyons were isolated from Ordesa canyon
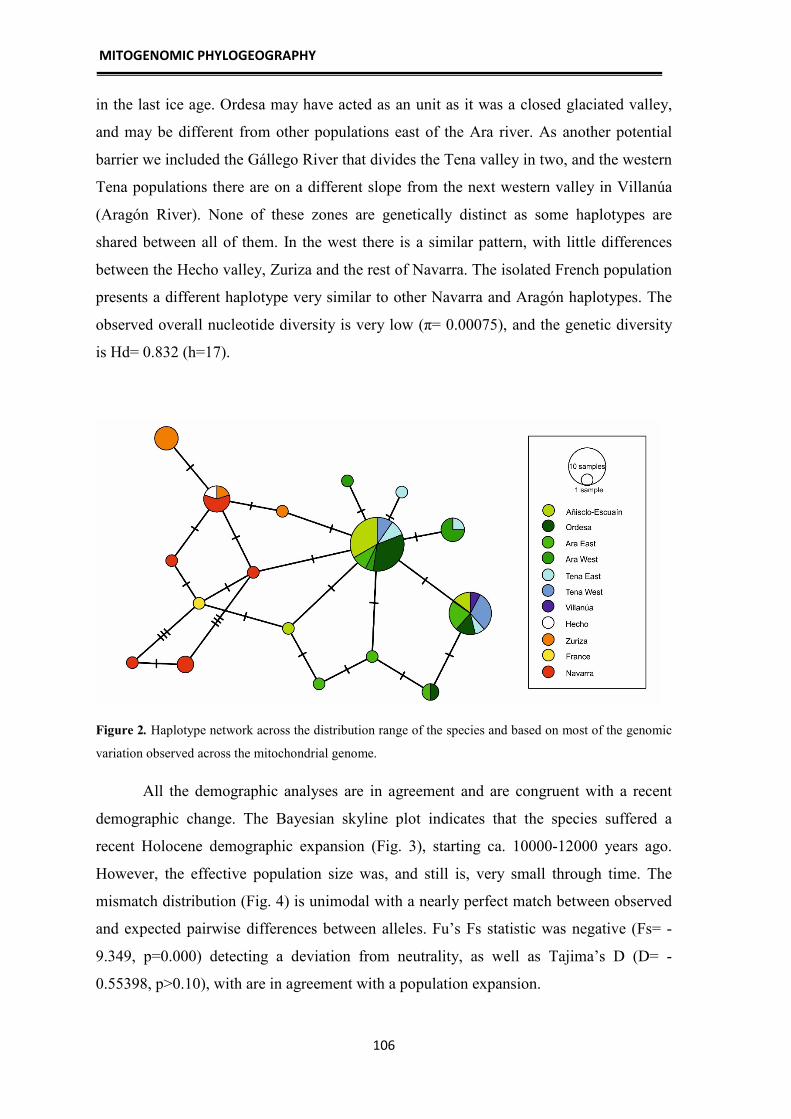
MITOGENOMIC PHYLOGEOGRAPHY
106
in the last ice age. Ordesa may have acted as an unit as it was a closed glaciated valley,
and may be different from other populations east of the Ara river. As another potential
barrier we included the Gállego River that divides the Tena valley in two, and the western
Tena populations there are on a different slope from the next western valley in Villanúa
(Aragón River). None of these zones are genetically distinct as some haplotypes are
shared between all of them. In the west there is a similar pattern, with little differences
between the Hecho valley, Zuriza and the rest of Navarra. The isolated French population
presents a different haplotype very similar to other Navarra and Aragón haplotypes. The
observed overall nucleotide diversity is very low (π= 0.00075), and the genetic diversity
is Hd= 0.832 (h=17).
Figure 2. Haplotype network across the distribution range of the species and based on most of the genomic
variation observed across the mitochondrial genome.
All the demographic analyses are in agreement and are congruent with a recent
demographic change. The Bayesian skyline plot indicates that the species suffered a
recent Holocene demographic expansion (Fig. 3), starting ca. 10000-12000 years ago.
However, the effective population size was, and still is, very small through time. The
mismatch distribution (Fig. 4) is unimodal with a nearly perfect match between observed
and expected pairwise differences between alleles. Fu’s Fs statistic was negative (Fs= -
9.349, p=0.000) detecting a deviation from neutrality, as well as Tajima’s D (D= -
0.55398, p>0.10), with are in agreement with a population expansion.
CHAPTER 4
107
Figure 3. Bayesian Skyline plot (BSP) showing the recent demographic history of Rana pyrenaica. The
estimated population size through time (y axis) is shown as Net units resulting from the log transformed
product of the effective population size (EPS) and generation length in years. Time is shown in scientific
annotation in thousands of years before present (X axis). Note the very small population size through time.
In the Figure 5 is represented the SDM for R. pyrenaica under the last glacial
maximum climate, which was hindcasted from a current climate distribution model. This
model is presented in Chapter 1, having an AUC of 0.973 for testing data. The model
suggests a retreat to lower elevations and the central Pyrenean valley in the axis
Sabiñanigo-Jaca-Navarra, as well as in the pre-Pyrenees. There are no pixels of 90-100%
probability of occurrence and few areas are above 0.6 to 0.85 probability range. The
model suggests that the eastern and western parts of the range persisted in two different
and separated areas in the mountains, with a clear gap in the distribution coincident with
the current gap in the distribution range of the species (from the Hecho valley to the
Aragón river valley). However, the model also suggests that these eastern and western
areas could have been connected across the central southern valley, as it can be seen in
the probability distribution model. The French isolated populations are predicted to occur
in a stable area through time, non-glaciated during the LGM, and outside the ice-sheet
extent, which may have been connected to Navarra populations through a narrow territory
close to the ice sheet border in the French side.
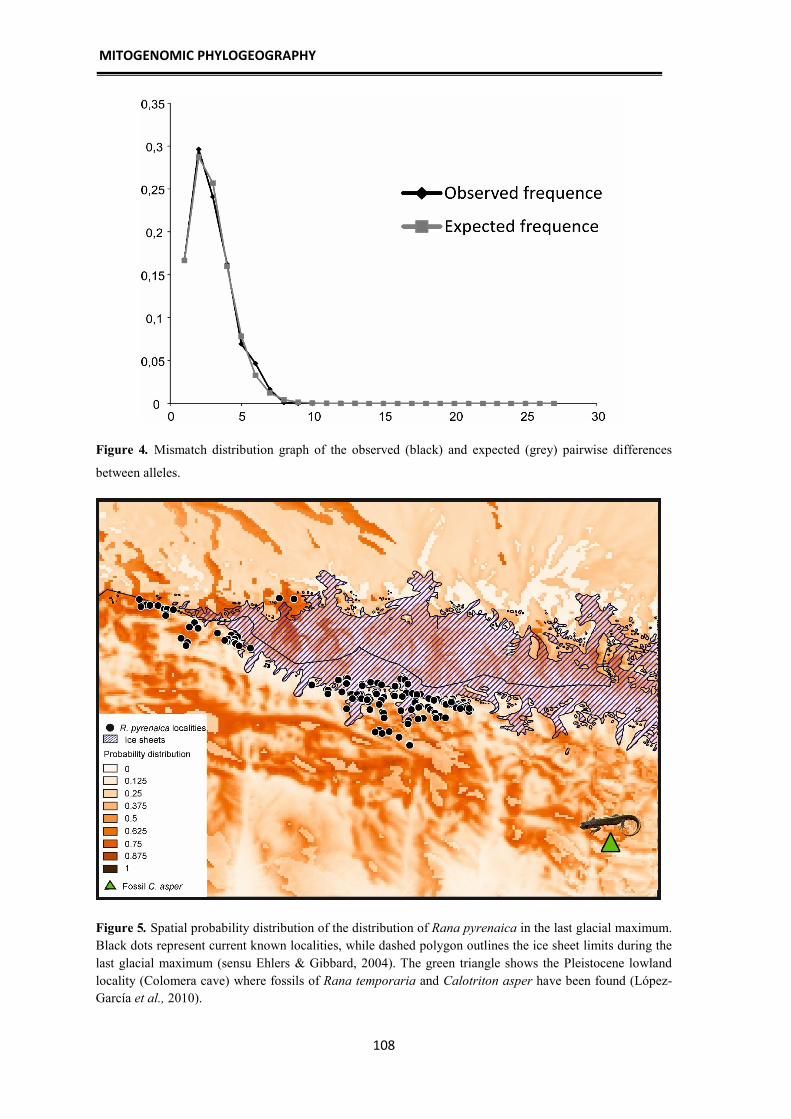
MITOGENOMIC PHYLOGEOGRAPHY
108
Figure 4. Mismatch distribution graph of the observed (black) and expected (grey) pairwise differences
between alleles.
Figure 5. Spatial probability distribution of the distribution of Rana pyrenaica in the last glacial maximum.
Black dots represent current known localities, while dashed polygon outlines the ice sheet limits during the
last glacial maximum (sensu Ehlers & Gibbard, 2004). The green triangle shows the Pleistocene lowland
locality (Colomera cave) where fossils of Rana temporaria and Calotriton asper have been found (López-
García et al., 2010).

CHAPTER 4
109
DISCUSSION
The only previous work looking at the genetic variation of the Pyrenean frog
sequenced eleven individuals from four localities for three mitochondrial DNA fragments
of Cytochrome B, Cytochrome oxidase I and 12S (Carranza & Arribas 2008), and finding
a single mutation in 1423 bp. This mutation was close to the priming site of the
cytochrome b and we have not found it in any of our complete mitochondrial genomes,
but in any case that dataset suggested that the species has a low genetic variation. In order
to really assess the genetic diversity, phylogeographic structure and genetic variation of
the species, we assembled a much larger dataset covering the full range of the species,
sampled populations across all potential barriers to gene flow, and sequenced the whole
mitochondria.
In mitochondrial phylogeographic studies, and especially in species with low
genetic variation, our sequential sequencing approach has clear advantages over using
available general primers for few mtDNA fragments. Now, when the price of NGS
sequencing is low and long fragment sequencing is becoming more reliable, it is possible
to sequence full mitochondrial genomes in a rapid and effective way. By doing so for
several individuals we were able to target the regions across the genome that actually
show genetic variation and develop specific primers for the loci of interest, which
supposes a clear advantage to the use of general primers for short random mtDNA
mitochondrial fragments. In the particular case of species with low genetic variation this
is critical as otherwise we would not be able to assess the real degree of genetic diversity
and where it does occur across the genome. In the next years it will be possible to
massively and routinely sequence full mitochondrial genomes without the development of
any primers (Liu et al. 2016).
Our dataset shows that Rana pyrenaica has a very low mitogenomic genetic
diversity, being the lowest of all European brown frogs (e.g. Canestrelli et al. 2008,
Vences et al. 2013, Teixeira et al. 2018). From a biogeographical perspective, it seems
clear that Rana pyrenaica suffered a range contraction during the Pleistocene when a
likely population bottleneck caused an important decrease in genetic variation and
haplotype diversity in the species. When compared to its conspecific and sister taxon, the
European common grass frog Rana temporaria, the differences are striking. Rana
temporaria has a much wider distribution range, but more interestingly it shows very

MITOGENOMIC PHYLOGEOGRAPHY
110
divergent mitochondrial and nuclear lineages, some of which occur in the Iberian
Peninsula, including one in the Pyrenees (Vences et al. 2013). This Pyrenean lineage
likely persisted in a high altitude refugium near Benasque that was not glaciated (nunatak,
pers. obs.), and it is surrounded by the most common central Pyrenean haplotype (Vences
et al. 2013). Both species overlap in the Pyrenees but there are two main differences
between them: the distribution range of the Pyrenean frog is much smaller and mostly
circumscribed to the Spanish side of the Pyrenees, and R. temporaria is a pond breeding
species while R. pyrenaica breeds mainly in streams (Vieites & Vences 2003). During the
glaciations, the main rivers in the Pyrenees where frozen and the valleys covered by
glaciers. Although some common frog populations could have persisted in ponds close to
the ice that melted during summer, it is likely that the Pyrenean frog had to retreat to
lower reaches of the rivers and streams that were not frozen. This likely forced a retreat of
its distribution range to the pre-Pyrenean central valleys. This range contraction occurred
likely in parallel to a population demographic collapse, leading to the small effective
population sizes observed in the present and reconstructed in the BSP analysis. In
agreement with the paleo-range reconstructed by the hindcasted SDM, our data suggest a
recent Holocene range and demographic expansion to higher altitudes, although the actual
distribution range overlaps with many ice-free areas during the LGM, with little high
altitude colonization if we compared it with the rather common presence of Rana
temporaria in high Pyrenean habitats (Vences et al., 2003). Fossil evidence support this
range retreat into the pre-Pyrenean lowlands and small mountains, as fossils of the two
mountain amphibians Rana temporaria and Calotriton asper have been found there, as
well as many other mammal and reptile species now occurring at higher elevations
(López-García et al. 2010).
The actual distribution range of the species shows a gap between eastern and
western populations in the Hecho valley. In fact, we were able to find the first Hecho
valley population in the last few years (Chapter 1), and confirmed that the distribution
gap is real. This lead to the hypothesis that two main refugia could have occur during the
Pleistocene, one in the drainages that go to the west (Navarra and western Aragón), and
the other in the drainages that drain to the South from the Aragón and Tena rivers to the
Ara river and west of the Cinca river. The paleo-distribution model shows a clear gap
during the LGM in the area where today's gap exists, with a suitable climatic zone south
of this gap in the central valley. This suggests that the species was never able to
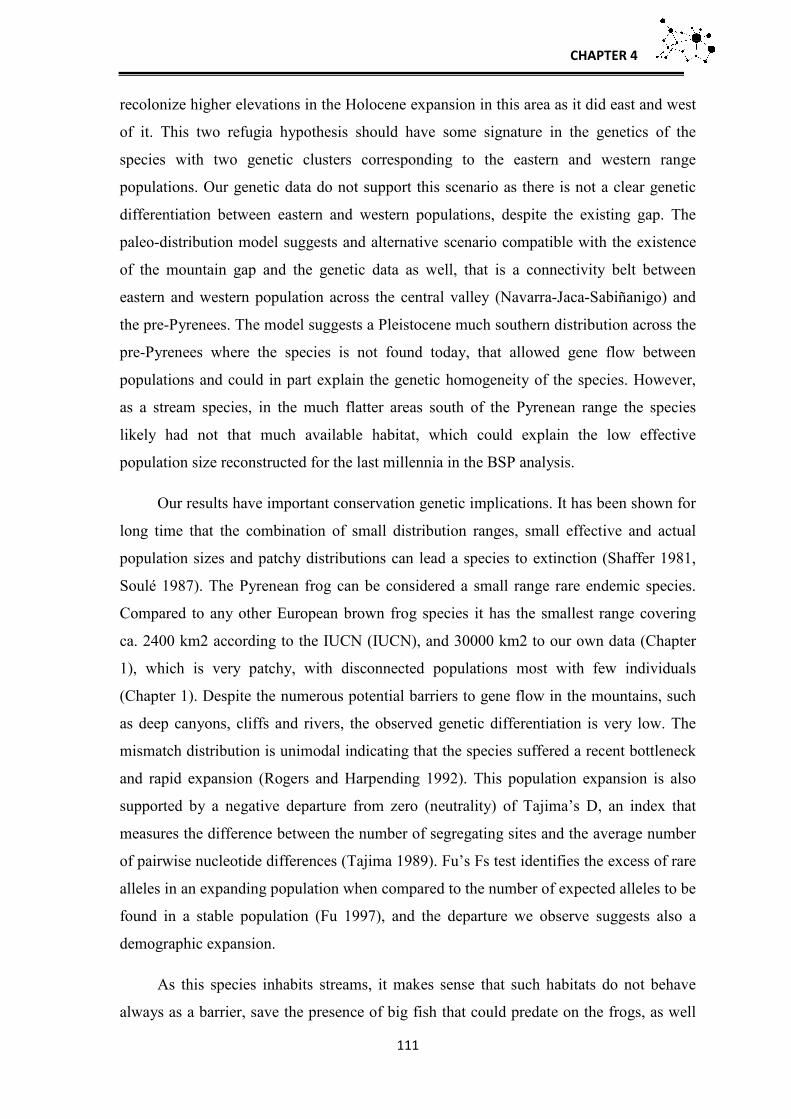
CHAPTER 4
111
recolonize higher elevations in the Holocene expansion in this area as it did east and west
of it. This two refugia hypothesis should have some signature in the genetics of the
species with two genetic clusters corresponding to the eastern and western range
populations. Our genetic data do not support this scenario as there is not a clear genetic
differentiation between eastern and western populations, despite the existing gap. The
paleo-distribution model suggests and alternative scenario compatible with the existence
of the mountain gap and the genetic data as well, that is a connectivity belt between
eastern and western population across the central valley (Navarra-Jaca-Sabiñanigo) and
the pre-Pyrenees. The model suggests a Pleistocene much southern distribution across the
pre-Pyrenees where the species is not found today, that allowed gene flow between
populations and could in part explain the genetic homogeneity of the species. However,
as a stream species, in the much flatter areas south of the Pyrenean range the species
likely had not that much available habitat, which could explain the low effective
population size reconstructed for the last millennia in the BSP analysis.
Our results have important conservation genetic implications. It has been shown for
long time that the combination of small distribution ranges, small effective and actual
population sizes and patchy distributions can lead a species to extinction (Shaffer 1981,
Soulé 1987). The Pyrenean frog can be considered a small range rare endemic species.
Compared to any other European brown frog species it has the smallest range covering
ca. 2400 km2 according to the IUCN (IUCN), and 30000 km2 to our own data (Chapter
1), which is very patchy, with disconnected populations most with few individuals
(Chapter 1). Despite the numerous potential barriers to gene flow in the mountains, such
as deep canyons, cliffs and rivers, the observed genetic differentiation is very low. The
mismatch distribution is unimodal indicating that the species suffered a recent bottleneck
and rapid expansion (Rogers and Harpending 1992). This population expansion is also
supported by a negative departure from zero (neutrality) of Tajima’s D, an index that
measures the difference between the number of segregating sites and the average number
of pairwise nucleotide differences (Tajima 1989). Fu’s Fs test identifies the excess of rare
alleles in an expanding population when compared to the number of expected alleles to be
found in a stable population (Fu 1997), and the departure we observe suggests also a
demographic expansion.
As this species inhabits streams, it makes sense that such habitats do not behave
always as a barrier, save the presence of big fish that could predate on the frogs, as well
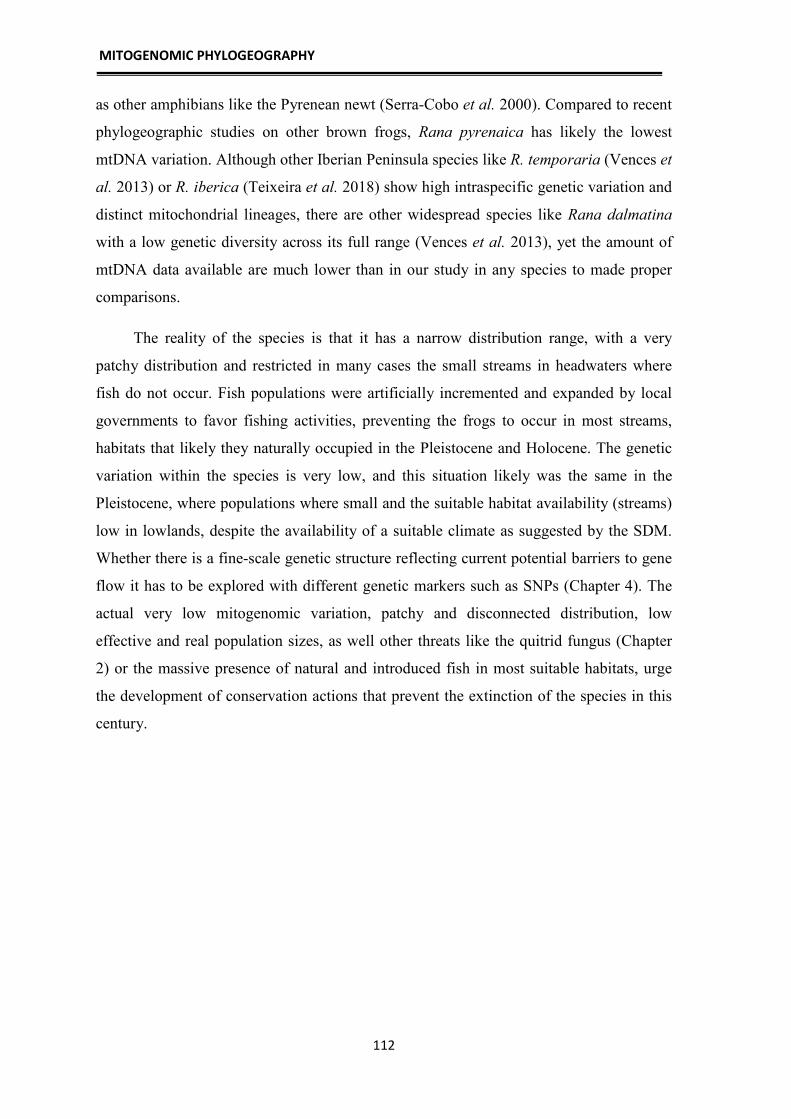
MITOGENOMIC PHYLOGEOGRAPHY
112
as other amphibians like the Pyrenean newt (Serra-Cobo et al. 2000). Compared to recent
phylogeographic studies on other brown frogs, Rana pyrenaica has likely the lowest
mtDNA variation. Although other Iberian Peninsula species like R. temporaria (Vences et
al. 2013) or R. iberica (Teixeira et al. 2018) show high intraspecific genetic variation and
distinct mitochondrial lineages, there are other widespread species like Rana dalmatina
with a low genetic diversity across its full range (Vences et al. 2013), yet the amount of
mtDNA data available are much lower than in our study in any species to made proper
comparisons.
The reality of the species is that it has a narrow distribution range, with a very
patchy distribution and restricted in many cases the small streams in headwaters where
fish do not occur. Fish populations were artificially incremented and expanded by local
governments to favor fishing activities, preventing the frogs to occur in most streams,
habitats that likely they naturally occupied in the Pleistocene and Holocene. The genetic
variation within the species is very low, and this situation likely was the same in the
Pleistocene, where populations where small and the suitable habitat availability (streams)
low in lowlands, despite the availability of a suitable climate as suggested by the SDM.
Whether there is a fine-scale genetic structure reflecting current potential barriers to gene
flow it has to be explored with different genetic markers such as SNPs (Chapter 4). The
actual very low mitogenomic variation, patchy and disconnected distribution, low
effective and real population sizes, as well other threats like the quitrid fungus (Chapter
2) or the massive presence of natural and introduced fish in most suitable habitats, urge
the development of conservation actions that prevent the extinction of the species in this
century.

CHAPTER 4
113
Acknowledgements
We are grateful to many people that made this project possible. Several students
and collaborators helped in fieldwork in the Pyrenees, including Carlos Zaragoza, Javier
Santos, Rubén González, Miguel Vences, Nina Bernard, Guillermo Ponz and Isabel
Perandones. Fernando Carmena and Ignacio Gómez from SARGA in Aragón, and Iosu
Antón in Navarra were extremely helpful in the field, allowing locating many known
populations. Ramon Antor Casterllanau provided logistic help to prepare and carry on
fieldwork. Manuel Alcántara, David Guzmán and Jose Luis Burrel from the Aragón
government showed their total collaboration and help during the whole length of the
project. Forest rangers helped us during the fieldwork, and the public company
Sodemasa, now SARGA, provided logistic support in Ordesa in 2011. MPF was financed
with a grant by CNPq under Science Without Borders program by Brazil Ministry of
Science. We thank the Governments of Aragon and Navarra for collecting permits. This
work was funded by a research project of the Zoo de Barcelona (Ayuntamiento de
Barcelona) as well as by a research project from the Parques Nacionales OPAN –
MMARM to DRV.
References
Abellán, P., & Svenning, J. C. (2014) Refugia within refugia–patterns in endemism and
genetic divergence are linked to Late Quaternary climate stability in the Iberian
Peninsula. Biological Journal of the Linnean Society, 113(1), 13-28.
Arribas, O. (2004) Fauna y paisaje de los Pirineos en la Era Glaciar. Lynx Ed.
Bandelt, H., Forster, P., & Röhl, A. (1999) Median-joining networks for inferring
intraspecific phylogenies. Molecular Biology and Evolution, 16(1), 37–48
Bettin, O., Cornejo, C., Edwards, P.J., and Holderegger, R. (2007) Phylogeography of the
high alpine plant Senecio halleri (Asteraceae) in the European Alps: in situ glacial
survival with postglacial stepwise dispersal into peripheral areas. Molecular
Ecology, 16, 2517–2524.
Bidegaray-Batista, L., Sánchez-Gracia, A., Santulli, G., Maiorano, L., Guisan, A., Vogler,
A. P., & Arnedo, M. A. (2016) Imprints of multiple glacial refugia in the Pyrenees

MITOGENOMIC PHYLOGEOGRAPHY
114
revealed by phylogeography and palaeodistribution modelling of an endemic spider.
Molecular Ecology, 25(9), 2046–2064. https://doi.org/10.1111/mec.13585
Canestrelli, D., Cimmaruta, R., & Nascetti, G. (2008) Population genetic structure and
diversity of the Apennine endemic stream frog , Rana italica – insights on the
Pleistocene evolutionary history of the Italian peninsular biota. Molecular Ecology,
17, 3856–3872. https://doi.org/10.1111/j.1365-294X.2008.03870.x
Carnaval, A. C., Hickerson, M. J., Haddad, C. F., Rodrigues, M. T., & Moritz, C. (2009)
Stability predicts genetic diversity in the Brazilian Atlantic forest hotspot. Science,
323(5915), 785-789.
Carranza, S., & Arribas, O. (2008) Genetic uniformity of Rana pyrenaica Serra-Cobo,
1993 across its distribution range: a preliminary study with mtDNA sequences.
Amphibia-Reptilia, 29(4), 579–582. https://doi.org/10.1163/156853808786230389.
Charrier, O., Dupont, P., Pornon, A., & Escaravage, N. (2014) Microsatellite Marker
Analysis Reveals the Complex Phylogeographic History of Rhododendron
ferrugineum (Ericaceae) in the Pyrenees. PLoS ONE, 9(3), 1–9.
https://doi.org/10.1371/journal.pone.0092976
Drummond A. J., & Rambaut, A. (2007) BEAST: Bayesian evolutionary analysis by
sampling trees. BMC Evol Biol 7:214.
Duchateau, S., Berroneau, M., Cantegrel, L., Goyeneche, L., de Reinach Hirtzbach, J.,
Tillo, S. (2012) Decouverte de Rana pyrenaica Serra-Cobo, 1993 (Anura, Ranidae)
sur le versant nord des Pyrenees. Bulletin de la Societé Herpetologique de France,
142-143: 51-63.
Ehlers, J., Gibbard, P.L. (2004) Quaternary glaciations-extent and chronology: part I:
Europe (Vol. 2). Elsevier.
Elith, J., Graham, C. H., Anderson, R. P., Dudík, M., Ferrier, S., Guisan, A., Hijmans, R.
J., Huettmann, F., Leathwick, J. R., Lehmann, A., Li, J., Lohmann, L. G., Loiselle,
B. A., Manion, G., Moritz, C., Nakamura, M., Nakazawa, Y., Overton, J. McC.,
Peterson, A. T., Phillips, S. J., Richardson, K., Scachetti‐Pereira, R., Schapire, R. E.,
Soberón, J., Williams, S., Wisz, M. S., Zimmermann, N. E., & Li, J. (2006) Novel
methods improve prediction of species’ distributions from occurrence data.

CHAPTER 4
115
Ecography, 29(2), 129-151.
Escobar-García, P., Winkler, M., Flatscher, R., Sonnleitner, M., Krejčíková, J., Suda, J.,
Hülber, K., Schneeweiss, G. M., & Schönswetter P. (2012) Extensive range
persistence in peripheral and interior refugia characterizes Pleistocene range
dynamics in a widespread Alpine plant species (Senecio carniolicus, Asteraceae).
Molecular Ecology, 21, 263 1255-1270.
Fu YX, (1997) Statistical tests of neutrality of mutations against population growth,
hitchhiking and background selection. Genetics, 147:915–25.
Gómez, A., & Lunt, D. H. (2007) Refugia within refugia: patterns of phylogeographic
concordance in the Iberian Peninsula. In Phylogeography of southern European
refugia (pp. 155-188). Springer, Dordrecht.
Hewitt, G. M. (1999) Postglacial re-colonisation of European biota. Biological Journal of
the Linnean Society, 68(May), 87–112.
Hewitt, G. M. (2000) The genetic legacy of the Quaternary ice ages. Nature. 405, pages
907–913.
Hewitt, G. M. (2004) Genetic consequences of climatic oscillations in the Quaternary.
Philosophical Transactions of the Royal Society B: Biological Sciences, 359(1442),
183–195. https://doi.org/10.1098/rstb.2003.1388.
IBM Corp. Released (2017) IBM SPSS Statistics for Windows, Version 25.0. Armonk,
NY: IBM Corp.
Karger, D.N., Conrad, O., Böhner, J., Kawohl, T., Kreft, H., Soria-Auza, R.W.,
Zimmermann, N.E., Linder, H.P. & Kessler, M. (2017) Climatologies at high
resolution for the earth’s land surface areas. Scientific Data, 4, 170122.
Lanfear R, Calcott B, Ho SYW, Guindon S, (2012) PartitionFinder: combined selection
of partitioning schemes and substitution models for phylogenetic analyses.
Molecular Biology and Evolution, 29:169
Leigh, J. W., & Bryant, D. (2015) popart: full‐feature software for haplotype network
construction. Methods in Ecology and Evolution, 6(9), 1110-1116.5–701.
Librado, P. and Rozas, J. (2009) DnaSP v5: A software for comprehensive analysis of

MITOGENOMIC PHYLOGEOGRAPHY
116
DNA polymorphism data. Bioinformatics, 25: 1451-1452.
Liu, S., Wang, X., Xie, L., Tan, M., Li, Z., Su, X., Zhang, H., Misof, B., Kjer, K.M.,
Tang, M., Niehuis, O., Jiang, H., & Niehuis, O. (2016) Mitochondrial capture
enriches mito‐DNA 100 fold, enabling PCR‐free mitogenomics biodiversity
analysis. Molecular ecology resources, 16(2), 470-479.
López-García, J.M., Blain, H.A., Allué, E., Bañuls, S., Bargalló, A., Martín, P., Morales,
J.I., Pedro, M., Rodríguez, A., Solé, A., & Oms, F. X. (2010) First fossil evidence of
an “interglacial refugium” in the Pyrenean region. Naturwissenschaften, 97(8): 753-
761.
Mouret V, Guillaumet A, Cheylan M, Pottier G, Ferchaud AL, Crochet PA (2011) The
legacy of ice ages in mountain species: post-glacial colonization of mountain tops
rather than current range fragmentation determines mitochondrial genetic diversity
in an endemic Pyrenean rock lizard. Journal of Biogeography, 38: 1717-1731.
Peso, M., Ponti de la Iglesia, R., Ponz Segrelles, G., González Martínez, R., Arcones
Segovia, A., & Vieites, D. R. (2016) The complete mitochondrial genome of the
Endangered European brown frog Rana pyrenaica through RNAseq. Mitochondrial
DNA Part B, 1(1), 394–396. https://doi.org/10.1080/23802359.2016.1174087.
Phillips, S. J., & Dudík, M. (2008) Modeling of species distributions with Maxent: new
extensions and a comprehensive evaluation. Ecography, 31(2), 161-175.
QGIS Development Team (2018) QGIS Geographic Information System. Open Source
Geospatial Foundation Project. http://qgis.osgeo.org
Rambaut, A., Drummond, A. J., Xie, D., Baele, G., & Suchard, M. A. (2018) Posterior
summarisation in Bayesian phylogenetics using Tracer 1.7. Systematic Biology, 10.
Recuero, E., & García-París, M. (2011) Evolutionary history of Lissotriton helveticus:
multilocus assessment of ancestral vs. recent colonization of the Iberian Peninsula.
Molecular phylogenetics and evolution, 60(1), 170-182.
Rogers, A. R., & Harpending, H. C. (1992) Population growth makes waves in the
distribution of pairwise genetic differences. Molecular Biology and Evolution,
9:552–69.
Ronquist, F., & Huelsenbeck, J. P. (2003) MrBayes 3: Bayesian phylogenetic inference

CHAPTER 4
117
under mixed models. Bioinformatics, 19(12), 1572-1574.
Schmitt, T., Hewitt, G. M., & Müller, P. (2006) Disjunct distributions during glacial and
interglacial periods in mountain butterflies: Erebia epiphron as an example. Journal
of Evolutionary Biology, 19(1), 108–113. https://doi.org/10.1111/j.1420-
9101.2005.00980.x
Schmitt, T. (2009) Biogeographical and evolutionary importance of the European high
mountain systems. Frontiers in Zoology, 6(1), 1–10. https://doi.org/10.1186/1742-
9994-6-9.
Schneider, C. J., Cunningham, M., & Moritz, C. (1998) Comparative phylogeography and
the history of endemic vertebrates in the Wet Tropics rainforests of Australia.
Molecular Ecology, 7(4), 487-498.
Schönswetter, P., Stehlik, I., Holderegger, R., and Tribsch, A. (2005) Molecular evidence
for glacial refugia of mountain plants in the European Alps. Mol. Ecol. 14, 3547–
3555.
Serra-Cobo, J., Marques-Bonet, T., & Martinez-Rica, J. P. (2000) Ecological segregation
between Rana pyrenaica and Rana temporaria, and differential predation of
Euproctus asper on their tadpoles. Netherlands Journal of Zoology, 50(1), 65-73.
Serra-Cobo, J. (2002) Rana pyrenaica Serra-Cobo, 1993. En: Pleguezuelos, J.M.,
Márquez, R., Lizana, M. (eds.). Atlas y libro rojo de los anfibios y reptiles de
España, pp. 129-130.Ministerio de Medio Ambiente- Asociación Herpetológica
Española, Madrid.
Shaffer, M. L. (1981) Minimum population sizes for species conservation. BioScience,
31(2), 131-134.
Soulé, M. E. (Ed.). (1987) Viable populations for conservation. Cambridge university
press.
Stehlik, I., Blattner, F.R., Holderegger, R., and Bachmann, K. (2002) Nunatak survival of
the high Alpine plant Eritrichium nanum (L.) Gaudin in the central Alps during the
ice ages. Molecular Ecology, 11, 2027–2036.
Taberlet, P., Fumagalli, L., Wust-Saucy, A.-G., & Cosson, J.-F. (1998) Comparative
phylogeography and postglacial colonization routes in Europe. Molecular Ecology,
MITOGENOMIC PHYLOGEOGRAPHY
118
7, 453–464.
Tajima, F. (1989) Statistical method for testing the neutral mutation hypothesis. Genetics,
123:585–95.
Teixeira, J., Gonçalves, H., Ferrand, N., García-París, M., & Recuero, E. (2018)
Mitochondrial phylogeography of the Iberian endemic frog Rana iberica, with
implications for its conservation. Current Zoology, 1–10.
https://doi.org/10.1093/cz/zoy010
Valbuena-Ureña E, Amat F, Carranza S (2013) Integrative phylogeography of Calotriton
newts (Amphibia, Salamandridae), with special remarks on the conservation of the
endangered Montseny brook newt (Calotriton arnoldi). PLoS ONE, 8: e62542.
https://doi.org/10.1371/journal.pone.0062542
Valbuena-Ureña, E. Oromi, N. Soler-Membrives, A. Carranza, S. Amat, F. Camarasa, F.
Denoël, M. Guillaume, O. Sanuy, D. Loyau, A. Schmeller, D. Steinfartz, S. (2018)
Jailed in the mountains: Genetic diversity and structure of an endemic newt species
across the Pyrenees, PLoS ONE, 13(8): e0200214.
https://doi.org/10.1371/journal.pone.0200214
Vences, M., Grossenbacher, K., Puente, M., Palanca, A., & Vieites, D. R. (2003) The
Cambales fairy tale: elevational limits of Rana temporaria (Amphibia: Ranidae) and
other European amphibians revisited. Folia Zoologica-Praha, 52(2), 189-202.
Vences, M., Thomas, M., Van der Meijden, A., Chiari, Y., & Vieites, D. R. (2005)
Comparative performance of the 16S rRNA gene in DNA barcoding of amphibians.
Frontiers in zoology, 2(1), 5.
Vences, M., Hauswaldt S., Steinfartz S., Rupp, O., Goesmann, A., Künzel, S., Orozco-
Terwengel, P., Vieites, D.R., Nieto-Roman, S., Haas, S., Laugsch, C., Gehara, M.,
Bruchmann, S., Pabijan, M., Ludewig, A.K., Rudert, D., Angelini, C., Borkin, L.J.,
Crochet, P.A., Crottini, A., Dubois, A., Ficetola, F., Galán, P., Geniez, P., Hachtel,
M., Jovanovic, O., Litvinchuk, S.N., Lymberakis, P., Ohler, A., Smirnov, N.A.
(2013) Radically different phylogeographies and patterns of genetic variation in two
European brown frogs, genus Rana. Molecular Phylogenetics and Evolution, 68:
657–670.

CHAPTER 4
119
Vieites, D.R., & Vences, M. (2003) Rana pirenaica – Rana pyrenaica. En: Enciclopedia
Virtual de los Vertebrados Españoles. Salvador, A., (ed). Museo Nacional de
Ciencias Naturales, Madrid. http://www.vertebradosibericos.org/
Vieites, D. R., Chiari, Y., Vences, M., Andreone, F., Rabemananjara, F., Bora, P., Nieto-
Román S., & Meyer, A. (2006) Mitochondrial evidence for distinct phylogeographic
units in the endangered Malagasy poison frog Mantella bernhardi. Molecular
Ecology, 15(6), 1617-1625.
Wachter, G.A., Arthofer, W., Dejaco, T., Rinnhofer, L.J., Steiner, F.M., & Schlick-
Steiner, B.C. (2012) Pleistocene survival on central Alpine nunataks: genetic
evidence from the jumping bristletail Machilis pallida. Molecular Ecology, 21,
4983–4995.
Weiss, S., & Ferrand, N. (2007) Phylogeography of southern European refugia.
Dordrecht: springer.
Westergaard, K.B., Alsos, I.G., Popp, M., Engelskjøn, T., Flatberg, K.I., & Brochmann,
C. (2011) Glacial survival may matter after all: nunatak signatures in the rare
European populations of two west-arctic species. Molecular Ecology, 20, 376–393.

120

121
Chapter 5:
Conservation genomics, historical demography and landscape genetics of the
Endangered Pyrenean frog
This chapter reproduce most of the manuscripts:
Vieites D.R., Van den Burg, M. P., Peso, M., Nieto-Román, S., Elmer, K., Jacobs, A., Genomic
phylogeography and biogeographic history of a small-range endemic mountain species.
Manuscript in preparation.
And
Peso, M., Van den Burg, M. P., Nieto-Román, S. & Vieites DR. Whole range landscape genomic
analysis of an endemic mountain species. Manuscript in preparation.

CONSERVATION GENOMICS
122

CHAPTER 5
123
Conservation genomics, historical demography and
landscape genetics of the Endangered Pyrenean frog
Abstract
Conservation genetic studies aim to assess the diversity and geographic
differentiation of one of the most essential biodiversity variables, intraspecific genetic
diversity. This field is starting to incorporate novel genomic approaches to study species
and populations of conservation concern; however their implementation in amphibians
remains rare. Here, we utilize next-generation sequencing to study population genomics
of the Endangered Pyrenean frog, Rana pyrenaica a narrowly distributed Pyrenean
endemism. Using a distribution-wide dataset, we explored population structure and gene
flow barriers using three different methods, and used approximate Bayesian computations
to test different scenarios of divergence among identified genetic clusters. We assessed
the genetic diversity at different scales, explored the presence of inbreeding and used a
conservation and landscape genetic approach to identify conservation units. Our results
show significant genetic differentiation suggesting that current population structure was
shaped by the Pyrenean river drainage system (including valley glaciers), with the main
river valleys as well as steep slopes acting as gene flow barriers among genetic clusters.
Based on demographic-scenario probabilities, major-clade divergence occurred during the
middle-Pleistocene, with subsequent divergence among eastern populations during the
late-Pleistocene. Overall, R. pyrenaica shows very low levels of genetic diversity, with
extremely low levels in isolated populations. In addition, we identified weak evidence of
inbreeding. Besides inbreeding, the low genetic diversity and most populations having
small effective population sizes, together with a fragmented distribution and low number
of adults per population, suggest that the long-term survival of R. pyrenaica is severely
threatened. We conclude that this species is of major conservation concern and identify
six management units to aid future research and conservation-management actions.
Keywords: Pyrenean frog, Rana pyrenaica, genomics, conservation genetics,
phylogeography, endemism.
CONSERVATION GENOMICS
124
INTRODUCTION
The field of conservation biology and the importance of conservation genetics
both have their origin around the 1980s (Frankel 1974; Frankel & Soulé 1981).
Advancing techniques and an increasing implementation of the genetic methodology to
guide conservation biology and management have strongly embedded conservation
genetics within biological research (Allendorf et al. 2010, 2013). However, for most
species, the availability of genetic data is still minor or lacking; especially important are
data on their genetic diversity, population structure, landscape genetics, genetic
adaptation and demographic history. Many endangered species in need of conservation
management are mostly non-model organisms for which such data are usually lacking.
Intraspecific genetic diversity has been regarded as one of the most essential
biodiversity variables (May & Godfrey 1994). In conservation biology and management,
the variation and structure of intraspecific genetics and local adaptation can be used to
guide conservation priorities and eventually decision-making (Avise 1989, Moritz 2002);
however, in practice such data are rarely used by conservation planners (Pierson et al.
2016). To facilitate this, geneticists identified concepts along the individual-to-species
continuum, other than subspecies or populations, which capture intraspecific variation
and local adaption (Moritz 1994). Of these, two conservation management units have
most commonly been used to categorize genetic and adaptive variation: evolutionary
significant units (ESU) and management units (MU) (Moritz 1994). Although the
assignment of both type of units is based on demographic isolation, ESU’s should also be
reciprocally monophyletic for mitochondrial markers, evolve independently, show
differences in nuclear loci and preferably have adaptive differences (Moritz 1994, for an
overview of ESU definitions see Funk et al. 2012). On a smaller scale, MUs should be
regulated by local population processes and dynamics only, thus in general MUs are
smaller than ESUs and several MUs can make up one ESU (Moritz 1994). Both ESUs
and MUs are conservation units that should ideally capture all adaptive variation present
within a species; knowledge that is important for conservation management practices
(Fraser & Bernatchez 2001, Funk et al. 2012), especially information on the magnitude
and distribution of adaptive variation within a species. High throughput sequencing now
allows conservation geneticists to acquire large genomic datasets necessary to identify
genetic regions under selection (Funk et al. 2012).

CHAPTER 5
125
The genomic era has led to the development of multiple reduced representation
genome (RRG) techniques that allow the cheap generation of genome-wide datasets for
non-model organisms; restriction site-associated DNA sequencing (RADseq) (Baird et al.
2008), double digest RADseq (ddRAD) (Peterson et al. 2012) and Genotyping-By-
Sequencing (GBS) (Elshire et al. 2011); see Andrews et al. (2016) for an overview.
Therefore, the usage of these RRG techniques has great potential to apply to endangered
species to help guiding conservation management (Funk et al. 2012, Twyford & Ennos
2012, Reitzel et al. 2013). In addition, RRG techniques are especially interesting for
species with low genetic diversity identified by previous works using traditional markers
given the larger number of loci in RRG datasets (but see Dimens 2016). Besides larger
datasets, major advantages of RRG methods are the low cost-to-data ratio and their
implementation without a priori genetic reference, using de novo assembly. However,
although de novo assembly is a major advantage, reference-based studies are still
recommended and are less prone to challenges (Alkan et al. 2011, Shafer et al. 2016).
Similar to other emerging techniques, RRG methods and downstream bioinformatics have
childhood limitations that still need to be overcome (Davey et al. 2013, Puritz et al.
2014b). For an overview of genotyping errors see Mastretta-Yanes et al. (2015).
Besides genotyping errors caused by methodological limitations or human-caused
errors, the genomic architecture of study species can also hamper the successful
generation of genomic data (Christensen et al. 2013). This is especially evident for taxa
that underwent whole genome duplication events (WGD) and became polyploid (Mable
et al. 2011). Here, the obvious problem is the increase in highly similar but paralogous
sequences that, depending on the selective pressures or mutation rates affecting these
genomic regions, can be hard to distinguish from homologous loci bioinformatically
(Christensen et al. 2013), this is mainly because very small DNA fragments are usually
sequenced, although new methods are being developed to better deal with paralogous loci
(Willis et al. 2017). Next to fishes, amphibians underwent WGD events and are known
for their large genome sizes (average 4.99pg for Anura, 35.30pg for Urodela; Gregory
2018), having the second largest average genome size among eukaryotes, after lungfishes
(Gregory et al. 2007). These features could explain why RRG methods and complete
genome sequencing have only sparsely been applied to amphibians (but see e.g. Hellsten
et al. 2010, Streicher et al. 2014, Nunziata et al. 2017, Roland et al. 2017, Reyes-Velasco
et al. 2018).

CONSERVATION GENOMICS
126
Patterns of intraspecific genetic variation are commonly used in phylogeography
to help understand historic biogeographical processes including retreat to refugia and
population expansions. A major area of research has focused on the influence of
Pleistocene climatic oscillations on distribution changes and patterns of genetic diversity
in European taxa (Taberlet et al. 1998, Hewitt 2000, 2004, Weiss & Ferrand 2007).
Effects of these oscillations on species distribution and occurrence were especially
evident around and due to mountain ranges given the small-scale latitudinal differences
and complex topography (Hewitt 2004), particularly for terrestrial fauna. There, large
temperature oscillations including associated expansions and subtractions of ice sheets
(Ehlers & Gibbard 2004) lead to diverse distribution patterns driven by reoccurring range
shifts, extinctions and retreat to refugia (Hewitt 1999, 2000, Schmitt et al. 2006, Weiss &
Ferrand 2007, Canestrelli et al. 2008, Schmitt 2009). Across a broad range of taxa these
oscillations thus had pronounced effects on patterns of distribution and genetic diversity
through e.g. vicariance, subsequent secondary contact, and adaptive responses (Hewitt
2000, Davis & Shaw 2001). However main research focus has been on temperate species
while these responses in cold-adapted species have been less studied and are presumed to
differ from temperate species (Schönswetter et al. 2005, Schmitt et al. 2006, Schmitt
2009).
Besides (high-) Arctic systems, the Pyrenean and Alps mountain ranges in lower
latitudes harbor many cold-adapted species. Since these species inhabit climatic niches
along sharp altitudinal gradients, temperature oscillations likely had large impacts on their
past and current distribution. Moreover, narrow climatic niches combined with
geographical complexity of mountain systems suggest strong differentiation within
distributions of cold-adapted species, although the time for differentiation build-up was
shorter during interglacial periods compared to glacial periods. Phylogeographic studies
on responses of cold-adapted Pyrenean species are especially limited (but see Mouret et
al. 2011, Liberal et al. 2014, Bidegaray-Batista et al. 2016, Valbuena et al. 2018).
The closely-related Western Palearctic brown frogs (Amphibia; Ranidae) form a
well-studied group of European frogs for most of which the phylogeographic and
demographic history of some species have been studied (Veith et al. 2003, Canestrelli et
al. 2008, Vences et al. 2013, 2017, Teixeira et al. 2018). Comparison of these features
shows large differences in historic and current patterns of genetic variation among these
European frogs (Veith et al. 2003, Vences et al. 2013). The widespread Rana temporaria
CHAPTER 5
127
has many divergent lineages, with additional high genetic diversity at smaller scales
(Vences et al. 2013, 2017), a pattern that is presumably the result of an initial large range
with several range contractions during glacial periods with several glacial refugia and
subsequent admixture between them during interglacial periods (Vences et al. 2013).
Contrastingly, another widespread species, R. dalmatina, shows distribution-wide low
genetic variation and evidence of few glacial refugia and rapid range expansion, which is
comparable to brown frogs with smaller ranges (Vences et al. 2013). Among those
smaller-ranged species are R. iberica and R. italica, which both show genetic signatures
of multiple glacial refugia, low genetic diversity throughout their range and patterns of
intraspecific post-glacial admixture (Canestrelli et al. 2008, Teixeira et al. 2018). For R.
pyrenaica, these characteristics have not been assessed using a comprehensive range-
wide dataset. However, mitochondrial DNA data suggest genetic homogeneity with
connectivity between glacial refugia (Chapter 4). Interestingly, this species inhabits mid
to high elevations in the Pyrenees that underwent dramatic changes during the Pleistocene
cycles, with a current divided distribution range separated by a distribution gap in
Aragón. These separated regions may be a consequence of the existence of at least two
glacial refugia which should have a hitherto unknown genetic signature, although
paleoclimatic modelling suggests connectivity across the central valley (Navarra-Jaca-
Sabiñánigo) and the pre-Pyrenees.
The Pyrenean frog (Rana pyrenaica, Serra-Cobo 1993) is an endemic amphibian
of the western and central Pyrenees where it is restricted to mountain streams with cold,
fast-flowing and oxygen-rich water between 440-2100m a.s.l. (Vieites & Vences 2003,
Vieites et al. 2016, Chapter 1). Due to the region’s geography, infrastructure and water
bodies with fish, the distribution of R. pyrenaica is extremely fragmented (Chapter 1).
Given its limited extent of occurrence (<3,000 km2), range-wide fragmentation, habitat
loss and degradation, and decreasing number of locations, R. pyrenaica is listed as
Endangered following the International Union for Conservation of Nature (IUCN) Red
List guidelines (Bosch et al. 2009, IUCN 2017). Besides these threats, we identified that
most localities consist of small populations and widespread presence of chytrid fungus
(Batrachochytrium dendrobatidis; Bd) (Chapter 2), although the impact of the latter on R.
pyrenaica remains unknown (Vieites et al. 2016).
Given these threats and its conservation status, R. pyrenaica has been a target
species of genetic studies, which mainly aimed to identify and help guide conservation

CONSERVATION GENOMICS
128
efforts (Carranza & Arribas 2008, Chapter 4, Peso et al. 2016). First, a preliminary
genetic assessment of few mitochondrial DNA (mtDNA) samples reported only a single
mutation within a 1423bp region (Carranza & Arribas 2008). Hereafter, we sequenced 32
mitochondrial genomes finding very low genetic variation compared to other brown frog
species (Chapter 4). This lack of genetic diversity and seeming absence of genetic clusters
within R. pyrenaica stands in high contrast to its sister species as aforementioned.
Combining these data, the restricted and endemic R. pyrenaica shows a reduced
mitochondrial genetic variation, which, together with numerous threats to its survival,
highlights the need to generate genomic data using RRG methods in order to guide
conservation efforts at a fine scale.
In recent years much progress has been made in the theoretical framework of
landscape ecology, especially in spatial connectivity and isolation, which has been
enriched by the incorporation of new programs and genetic analyses. Since Wright (1943)
proposed the idea that at greater geographic distances less connectivity between
populations and therefore greater genetic differentiation (known as "isolation by
distance"), this hypothesis has been tested in numerous organisms, demonstrating that it is
a common phenomenon. In the field of landscape genetics, the concept of "isolation by
resistance" has been recently introduced (McRae & Beier 2007), which is defined as the
correlation between genetic distances and "resistance" distances. A resistance matrix is
simply a classification of the landscape in a function of probability of use of the different
components of the landscape. For example, one species can be able to cross the landscape
without problems (0 resistance) while for others the same landscape features can behave
as total barriers (100% resistance). This relationship does not have to be related to
geographical distance, since many barriers are specific and are located in specific places.
In the case of mountains with steep gradients this becomes more relevant, as for example
cliffs can be barriers for frogs, despite that the geographic distance between both sides of
the cliff is very small. Another new concept has been recently introduced that is "isolation
by the environment" (IBE). It is defined as the pattern in which genetic differentiation
between populations increases in relation to environmental differences, regardless of
geographical distance (Wang & Summers 2010, Bradburd et al. 2013, Sexton et al. 2014,
Wang & Bradburd 2014). In the recent review by Wang & Bradburd (2014), the
processes that can generate IBE are identified, which include examples of clinal
temperature variation, natural or sexual selection against immigrants, reduction of hybrid
CHAPTER 5
129
fitness or biased dispersion among habitats. This opens new possibilities for testing
different hypotheses on spatial connectivity based on pure distance, resistances and
environment, which can be tested with genetic distance data from population genomic
studies.
This project utilizes RADseq data to assess the conservation genomics and fine-
scale phylogeography of R. pyrenaica. We also want to assess the degree of connectivity
(or lack thereof) between populations and test different connectivity scenarios under a
landscape genetics approach. Specifically, we aim to identify: 1) the genetic diversity at
the species- and population levels; 2) assess its genetic population structure and compare
that to the previously proposed population structure based on different methods; 3)
identify historical barriers to gene flow and connectivity areas; 4) assess the genetic
diversity and confirm signatures of inbreeding; 5) reconstruct the biogeographic and
phylogeographic history of R. pyrenaica and the occurrence of glacial refugia. Findings
provided through this project are of great importance from a conservation perspective as
these can aid future conservation programs, both in- and ex-situ, aimed at securing the
long-term survival for one of the most endangered European vertebrates.
MATERIAL AND METHODS
Sampling
Rana pyrenaica tissue samples (tail or finger-tip samples, or whole specimens)
from 178 individuals were collected during a range-wide sampling effort in the Pyrenees
between 2010 and 2014 (see previous chapters). During this multi-year effort, fieldwork
was conducted from February to July. To prevent bias caused by sibling-sibling relation
in our analyses, we only sampled one tadpole per clutch. In addition, we included one
Rana temporaria tissue sample. This dataset compiles individuals from all life stages, but
with a strong bias towards individuals in the larval stage (n=129, 72.5%) (Appendix),
which are more detectable than adults.
DNA sample and optimization
We extracted DNA using DNAeasy kits (QIAGEN, Germany) and assessed all
concentrations prior to library preparation. For all samples DNA concentrations were
measured with a Qubit spectrophotometer. As tadpole tail tips yielded low DNA
CONSERVATION GENOMICS
130
concentrations (<10 ng/µl), and that for RADseq higher concentrations are required, we
applied a novel technique to increase DNA concentration per sample, which uses
bacterial DNA ligasepolymerase that performs without supplemented primers and is able
to bind to any site, identify the sequence and recruit complement nucleotides to construct
a primer (Sygnis TruePrime WGA Kit). This treatment led to a median increase in DNA
concentration of 312%.
Library preparation and sequencing
Library preparation and Illumina ddRAD sequencing were performed using a
modified protocol by Peterson et al. (2012) to discover and genotype SNPs. Here,
optimized DNA samples were digested using PstI-HF and MspI enzymes where after
barcodes were ligated using a cost-effective method. Samples were then pooled into two
paired-end libraries including controls within and between these two libraries: each
library consisted of 85 unique individuals, with 5 duplicates per library, and 10
individuals shared by both libraries. Samples were randomized both within and between
libraries based on sample locality (Meirmans 2015). Thereafter, these libraries were PCR
amplified and sequenced on 2 lanes using an Illumina HiSeq 2500 (Illumina Inc., San
Diego, CA).
De novo assembly and SNP calling
All bioinformatic analyses were run using the dDocent v2 pipeline (Puritz et al.
2014a) on our local cluster at the Natural History Museum of Madrid (MNCN). First, raw
sequences were demultiplexed and trimmed for each library separately. Then, as de novo
assembly and SNP output might be influenced by low-quality data, we implemented a
preliminary data exploration step to assess data quality as SNP output using default
dDocent settings. This step revealed a high variation in SNP presence, both between
libraries and individuals, especially within the first library (Fig. 1A). Thereafter, we
optimized our dataset by excluding samples with low quality with more than 23% of the
SNPs missing; Fig. 1B), removing 89 individuals (library 1: 76; library 2: 13). This step
also greatly reduced subsequently necessary computational power and duration. The
remaining 111 samples were combined into one dataset for subsequent analyses.
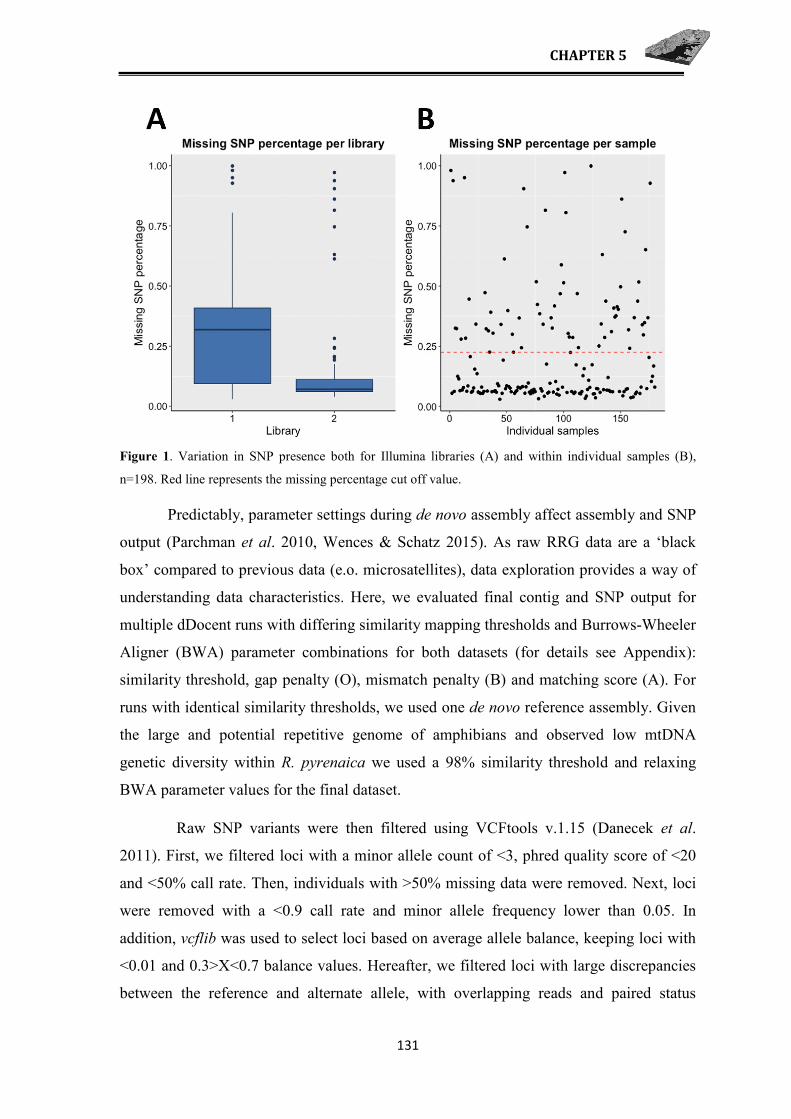
CHAPTER 5
131
Figure 1. Variation in SNP presence both for Illumina libraries (A) and within individual samples (B),
n=198. Red line represents the missing percentage cut off value.
Predictably, parameter settings during de novo assembly affect assembly and SNP
output (Parchman et al. 2010, Wences & Schatz 2015). As raw RRG data are a ‘black
box’ compared to previous data (e.o. microsatellites), data exploration provides a way of
understanding data characteristics. Here, we evaluated final contig and SNP output for
multiple dDocent runs with differing similarity mapping thresholds and Burrows-Wheeler
Aligner (BWA) parameter combinations for both datasets (for details see Appendix):
similarity threshold, gap penalty (O), mismatch penalty (B) and matching score (A). For
runs with identical similarity thresholds, we used one de novo reference assembly. Given
the large and potential repetitive genome of amphibians and observed low mtDNA
genetic diversity within R. pyrenaica we used a 98% similarity threshold and relaxing
BWA parameter values for the final dataset.
Raw SNP variants were then filtered using VCFtools v.1.15 (Danecek et al.
2011). First, we filtered loci with a minor allele count of <3, phred quality score of <20
and <50% call rate. Then, individuals with >50% missing data were removed. Next, loci
were removed with a <0.9 call rate and minor allele frequency lower than 0.05. In
addition, vcflib was used to select loci based on average allele balance, keeping loci with
<0.01 and 0.3>X<0.7 balance values. Hereafter, we filtered loci with large discrepancies
between the reference and alternate allele, with overlapping reads and paired status
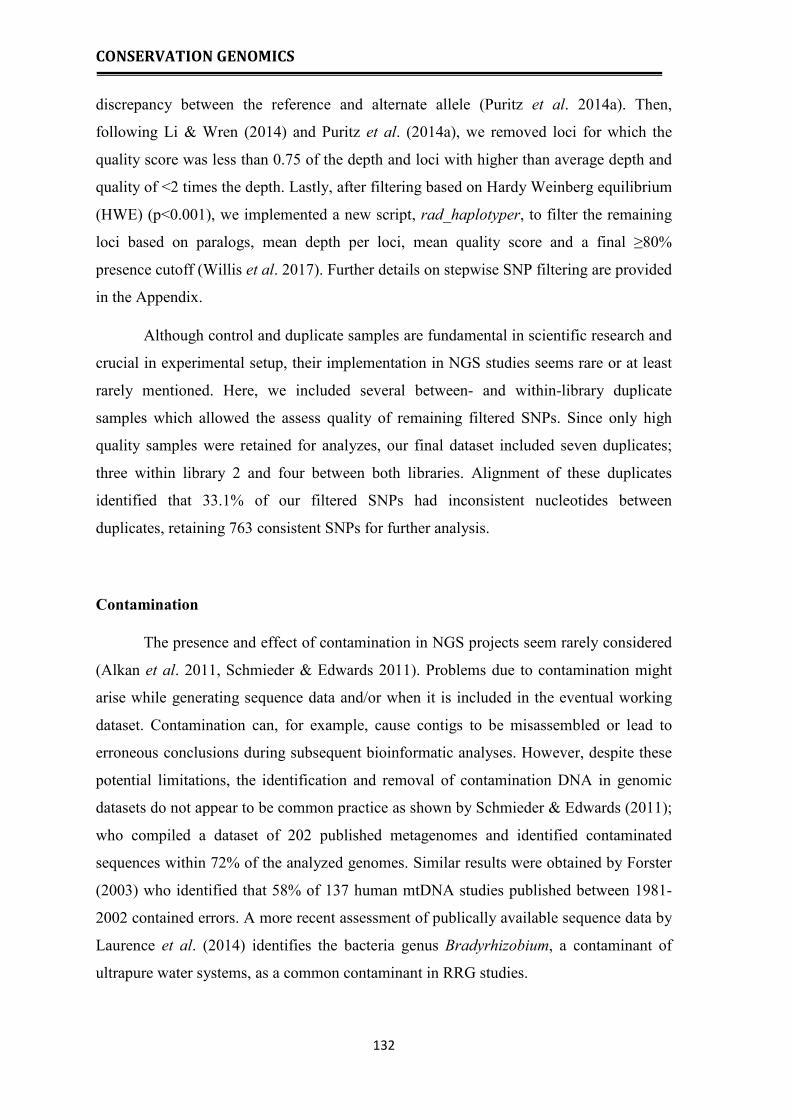
CONSERVATION GENOMICS
132
discrepancy between the reference and alternate allele (Puritz et al. 2014a). Then,
following Li & Wren (2014) and Puritz et al. (2014a), we removed loci for which the
quality score was less than 0.75 of the depth and loci with higher than average depth and
quality of <2 times the depth. Lastly, after filtering based on Hardy Weinberg equilibrium
(HWE) (p<0.001), we implemented a new script, rad_haplotyper, to filter the remaining
loci based on paralogs, mean depth per loci, mean quality score and a final ≥80%
presence cutoff (Willis et al. 2017). Further details on stepwise SNP filtering are provided
in the Appendix.
Although control and duplicate samples are fundamental in scientific research and
crucial in experimental setup, their implementation in NGS studies seems rare or at least
rarely mentioned. Here, we included several between- and within-library duplicate
samples which allowed the assess quality of remaining filtered SNPs. Since only high
quality samples were retained for analyzes, our final dataset included seven duplicates;
three within library 2 and four between both libraries. Alignment of these duplicates
identified that 33.1% of our filtered SNPs had inconsistent nucleotides between
duplicates, retaining 763 consistent SNPs for further analysis.
Contamination
The presence and effect of contamination in NGS projects seem rarely considered
(Alkan et al. 2011, Schmieder & Edwards 2011). Problems due to contamination might
arise while generating sequence data and/or when it is included in the eventual working
dataset. Contamination can, for example, cause contigs to be misassembled or lead to
erroneous conclusions during subsequent bioinformatic analyses. However, despite these
potential limitations, the identification and removal of contamination DNA in genomic
datasets do not appear to be common practice as shown by Schmieder & Edwards (2011);
who compiled a dataset of 202 published metagenomes and identified contaminated
sequences within 72% of the analyzed genomes. Similar results were obtained by Forster
(2003) who identified that 58% of 137 human mtDNA studies published between 1981-
2002 contained errors. A more recent assessment of publically available sequence data by
Laurence et al. (2014) identifies the bacteria genus Bradyrhizobium, a contaminant of
ultrapure water systems, as a common contaminant in RRG studies.

CHAPTER 5
133
Here, we assessed the presence of contaminated reads in 10% of raw sequence
data (10 individuals) by blast searches against the National Center for Biotechnology
Information (NCBI) database. Also, raw Illumina reads were mapped against the
Escherichia coli and Bradyrhizobium (sp. DFCI-1) genome in Geneious using
Medium/Low sensitivity and 5 iterations. In addition, both final de novo assemblies were
mapped against the E. coli, Bradyrhizobium and Homo sapiens genomes using identical
settings in Geneious v11.0.5. These analyses showed no contamination of E. coli,
Bradyrhizobium or H. sapiens in either of the de novo assemblies. However, minor
contamination was found since raw Illumina reads from 82 of the 111 high-quality
samples mapped against the E. coli and/or Bradyrhizobium (sp. DFCI-1) genomes.
Specifically, with an average of 3.4 million Illumina reads per sample, an average of 42
and 29 reads mapped against the E. coli or Bradyrhizobium genome respectively, and
were removed.
Identification of SNPs under selection
Loci, or regions, under selection are of interest for their insights into possible
selective and adaptive processes (Nosil et al. 2009, Moore et al. 2014). Such loci show
higher expected FST values than under neutrality, which can be identified using genome
outlier scans. Caution should be taken to assign these loci as such, however, if presence of
spatial population structure is suspected (Excoffier et al. 2009). Using simulated data,
Narum & Hess (2011) assessed robustness of three outlier scan methods and found
BayeScan v2.1 (Foll & Gaggiotti 2008) to have the lowest number of type I and II errors.
We followed the recommendations by Narum & Hess (2011) and use both BayeScan and
FDist, only assigning and excluding outlier loci when both results are in agreement.
BayeScan v2.1 was ran twice using 100K burn-in with differing priors odds of 10 and 100
(Foll & Gaggiotti 2008). For FDist (Beaumont & Nichols 1996), we used 100K
simulations in a hierarchical island model as implemented in Arlequin v3.5 (Excoffier &
Lischer 2010). Both programs were run using the two East and West areas as populations,
corresponding to the distribution areas separated by a gap in the range of R. pyrenaica.
CONSERVATION GENOMICS
134
Genetic diversity
We identified observed and expected heterozygosity (HO and HS) and fixation
index (GIS) on the species and population level using GenoDive (Meirmans & Van
Tienderen 2004). Hereafter we implemented a new R package biotools to visualize the
spatial distribution of genetic diversity (as HE) for the complete distribution range of R.
pyrenaica (da Silva et al., 2017; R Core Team, 2018), using a 4 kilometer (km) radius and
a minimum of two samples per pixel to calculate HE. Furthermore, we calculated three
multilocus heterozygosity (mlh) parameters, internal relatedness (IR; Amos et al. 2001),
homozygosity by locus (HL; Aparicio et al. 2006) and standardized heterozygosity (SH;
Coltman et al. 1999), using the R package Rhh (Alho et al. 2010).
Range-wide population structure
We assessed the genetic structure within the entire species range of R. pyrenaica
using Structure v2.3.4 (Pritchard et al. 2010). First, we ran an admixture model with
correlated frequencies and no prior location info to identify major genetic clusters.
Hereafter, since Structure identifies the uppermost hierarchical structure (Evanno et al.
2005), we ran a similar model within the east cluster to investigate more fine-scale
structure. All runs consisted of 10 replicates for K values between 1-10, using 106 MCMC
iterations with 105 burn-in repeats. Hereafter the most probable value of K was inferred
using the ∆K parameter in Structure-Harvester (Evanno et al. 2005, Earl & vonHoldt
2012, Welch et al. 2017). We visualized Structure results using Distruct v1.1 (Rosenberg
2004).
Given the potential bias of Structure results due to possible violations of
assumptions (Pritchard et al. 2010), the lacking ability to detect isolation by distance
(Frantz et al. 2009, Meirmans 2012) and uneven sample sizes (Puechmaille 2016), we
compared our results to additional methods. First, we identified clusters of genetically-
related individuals with a maximum between-group variation using a discriminant
analysis of principal components (DAPC) using the R package adegenet (Jombart &
Ahmed 2011). Additionally, we inferred the optimal range of genetic clusters that best
explain genetic variation in our dataset based on Bayesian Information Criterion (BIC)
values obtained from sequential clustering (Jombart & Ahmed 2011). Secondly, we
implemented a method that uses non-negative matrix factorization algorithms to assess
CHAPTER 5
135
population structure using the R package LEA (Frichot & François 2015) that we compare
to Structure and adegenet results. Similar parameters to the Structure analyses were
chosen with 10 repeats per value of K (1-10) using the snmf command and clustering
based on cross-entropy criterion (MCE). Lastly, since spatial clustering can be explained
by Isolation-By-Distance (IBD) (Meirmans 2012), we examined the effect of IBD and
genetic clustering on calculated FST values (van den Burg et al. 2018). Specifically, we
used GPS coordinates and assigned population data to assess variation in allele
frequencies using redundancy analyses (RDA) in the R package vegan (Oksanen et al.
2014).
We used the obtained clusters as input to group individuals into smaller clusters:
western clade (Navarra), Valle de Tena, Yésero, Bujaruelo, Ordesa and Añisclo. Then, we
assessed the partitioning of genetic variation between all clusters using Analysis of
Molecular Variance (AMOVA) and by calculating pairwise FST values in Arlequin v3.5
(Excoffier & Lischer 2010) and GenoDive (Meirmans & Van Tienderen 2004). We
performed two AMOVAs using 99,999 permutations: 1) between the hypothesized
western and eastern clades, 2) among all identified clusters.
Landscape genetics
To analyze the spatial connectivity between populations, dispersal cost matrices
were first elaborated from five main data sets, from which we derived several more: 1)
Map of vegetation and land cover occupation with a resolution of 100x100 meters from
the European program Corine Land Cover (EEA 2006); 2) Digital terrain model with a
resolution of 90x90 meters from the Shuttle Radar Topography Mission of NASA (Jarvis
et al. 2006); from which we derived an elevation map, and from this one a slope map was
generated; 3) Map of water bodies and streams including fish; 4) Map of reservoirs and
dams from the IGN (National Geographic Institute); and a “distance to streams” map was
generated from the previous ones. 5) We used the equations relating beginning of the
breeding period in function of elevation in Pyrenean R. temporaria from Vieites (2003),
and the end of the activity period to estimate the length of the period of activity in
Pyrenean brown frogs in function of elevation. Both R. pyrenaica and R. temporary are
explosive breeders that have a similar phenological pattern, so we assumed that the

CONSERVATION GENOMICS
136
available pattern for R. temporaria can be applied to R. pyrenaica in absence of other data
from this species. All maps were rescaled to 100x100 meters resolution in raster format.
To reclassify the Corine layer into a cost matrix, we calculated from the
distribution records of R. pyrenaica the observed frequencies in all sampled localities
(presences and absences, see chapter 1). This reclassification was made on a percentage
scale, in which 100% represent a high conductance or total permissiveness in the matrix
for the movement of individuals, while 0% representing the areas of no conductance, that
is to say, zero permissiveness to the movement of the individuals and an effective barrier.
The altitude layer was re-classified according to the real altitudinal range of the species in
the Pyrenees, with values of zero dispersion outside the altitudinal range, and 100%
within it. The slope and climate layers were reclassified in the same way based on the
data obtained from all the sampled localities. The fish are large aquatic predators that
make almost impossible frog reproduction, as well as frog’s dispersion through them,
therefore the bodies of water with the presence of fish were reclassified as 0, acting as
barriers. Following Dudaniec et al, 2013, global cost matrices were made with
permutations of these parameters, to measure the potential impact of all possible
combinations of variables in spatial connectivity between populations. In total we created
370 different conductance matrices combining elevation, climate, distance to rivers, fish
presence, slope and landcover. During fieldwork we recorded different environmental and
habitat variables from the localities where R. pyrenaica occurs which helped to assess
these reclassifications.
These conductance (inverse of resistance) matrices, were used as input in
Circuitscape v 4.0 (Shah & MacRae 2008), to perform landscape connectivity analyses.
This approach builds upon electronic circuit theory to predict connectivity in
heterogeneous landscapes and gene flow (McRae 2006, McRae et al. 2007, 2008). We ran
the analyses with the 370 different conductance matrices and presence localities for the
species. We then tested which one of these 370 spatial hypotheses correlated better with
Fst distances between localities using partial Mantel tests with 1000 permutations,
correlating the resistance with the genetic distances and considering the Euclidean
distance. We then performed another correlation to test of “isolation by barriers” where
we defined the main potential barriers based on the genetic clustering (main rivers and
steep slopes) and tested it with a mantel test correlating it with genetic distance. Mantel
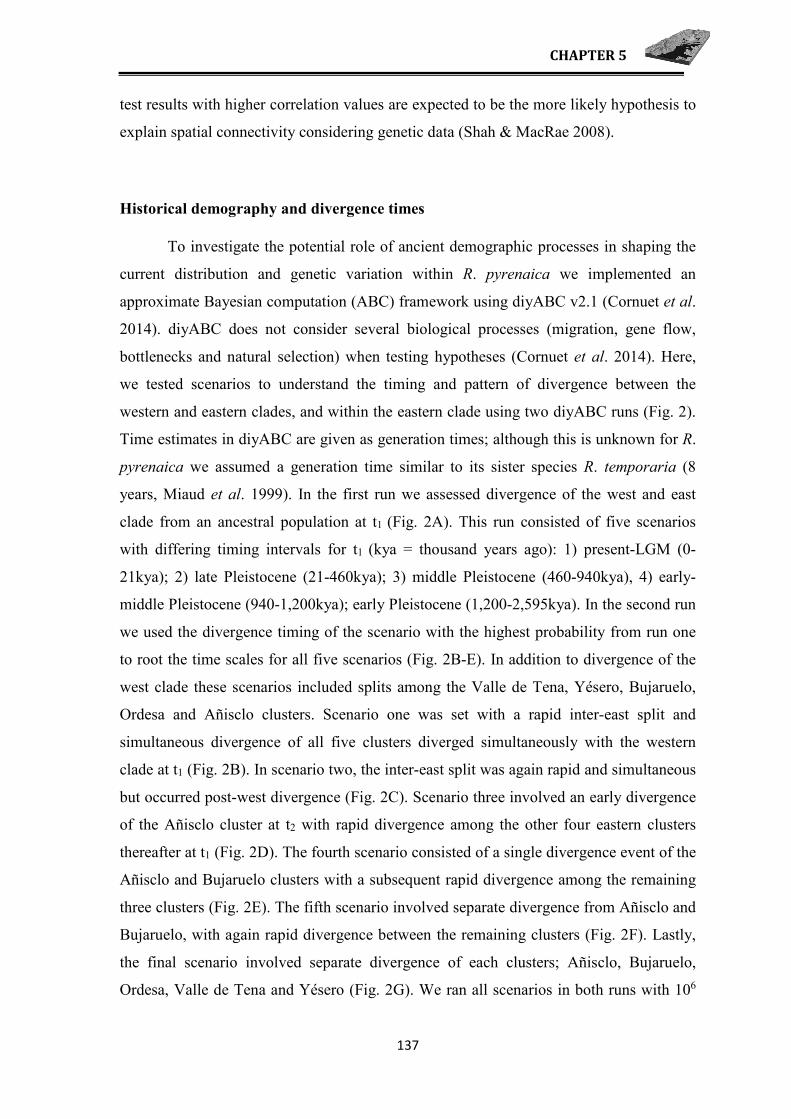
CHAPTER 5
137
test results with higher correlation values are expected to be the more likely hypothesis to
explain spatial connectivity considering genetic data (Shah & MacRae 2008).
Historical demography and divergence times
To investigate the potential role of ancient demographic processes in shaping the
current distribution and genetic variation within R. pyrenaica we implemented an
approximate Bayesian computation (ABC) framework using diyABC v2.1 (Cornuet et al.
2014). diyABC does not consider several biological processes (migration, gene flow,
bottlenecks and natural selection) when testing hypotheses (Cornuet et al. 2014). Here,
we tested scenarios to understand the timing and pattern of divergence between the
western and eastern clades, and within the eastern clade using two diyABC runs (Fig. 2).
Time estimates in diyABC are given as generation times; although this is unknown for R.
pyrenaica we assumed a generation time similar to its sister species R. temporaria (8
years, Miaud et al. 1999). In the first run we assessed divergence of the west and east
clade from an ancestral population at t1 (Fig. 2A). This run consisted of five scenarios
with differing timing intervals for t1 (kya = thousand years ago): 1) present-LGM (0-
21kya); 2) late Pleistocene (21-460kya); 3) middle Pleistocene (460-940kya), 4) early-
middle Pleistocene (940-1,200kya); early Pleistocene (1,200-2,595kya). In the second run
we used the divergence timing of the scenario with the highest probability from run one
to root the time scales for all five scenarios (Fig. 2B-E). In addition to divergence of the
west clade these scenarios included splits among the Valle de Tena, Yésero, Bujaruelo,
Ordesa and Añisclo clusters. Scenario one was set with a rapid inter-east split and
simultaneous divergence of all five clusters diverged simultaneously with the western
clade at t1 (Fig. 2B). In scenario two, the inter-east split was again rapid and simultaneous
but occurred post-west divergence (Fig. 2C). Scenario three involved an early divergence
of the Añisclo cluster at t2 with rapid divergence among the other four eastern clusters
thereafter at t1 (Fig. 2D). The fourth scenario consisted of a single divergence event of the
Añisclo and Bujaruelo clusters with a subsequent rapid divergence among the remaining
three clusters (Fig. 2E). The fifth scenario involved separate divergence from Añisclo and
Bujaruelo, with again rapid divergence between the remaining clusters (Fig. 2F). Lastly,
the final scenario involved separate divergence of each clusters; Añisclo, Bujaruelo,
Ordesa, Valle de Tena and Yésero (Fig. 2G). We ran all scenarios in both runs with 106
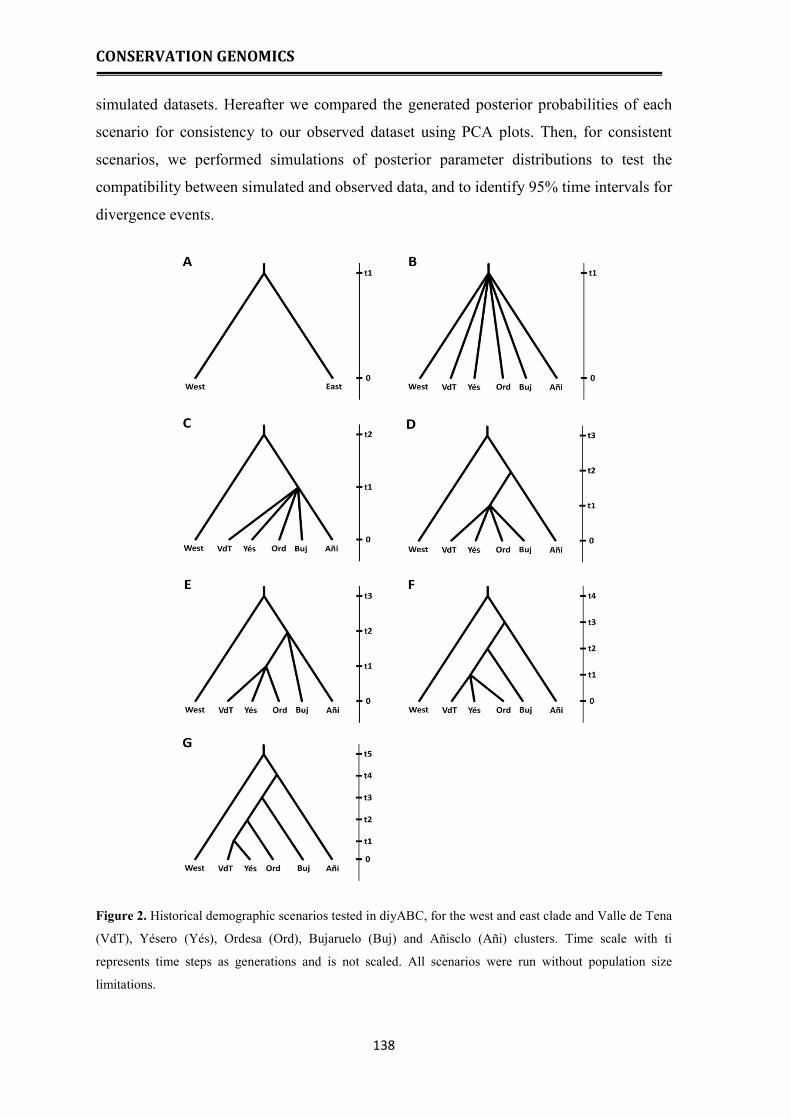
CONSERVATION GENOMICS
138
simulated datasets. Hereafter we compared the generated posterior probabilities of each
scenario for consistency to our observed dataset using PCA plots. Then, for consistent
scenarios, we performed simulations of posterior parameter distributions to test the
compatibility between simulated and observed data, and to identify 95% time intervals for
divergence events.
Figure 2. Historical demographic scenarios tested in diyABC, for the west and east clade and Valle de Tena
(VdT), Yésero (Yés), Ordesa (Ord), Bujaruelo (Buj) and Añisclo (Añi) clusters. Time scale with ti
represents time steps as generations and is not scaled. All scenarios were run without population size
limitations.

CHAPTER 5
139
RESULTS
After excluding duplicates, individuals and loci with >20% missing data, and two
samples with erroneous GPS data, 93 individuals and 763 SNPs were retained. Additional
assessment of HWE violations indicated that 101 SNPs deviated from HWE after
Bonferroni correction. Furthermore, 2% of 75,078 pairwise comparisons were significant
at p<0.05, although results were inconsistent between populations we removed another 23
loci with high numbers (≥10) of significant comparisons. Then, after sequential removal
of 274 SNPs that showed signatures of possible paralogs (HO>0.8), 365 SNPs were
retained for subsequent analyses. From this dataset, FDist and BayeScan identified 55 and
0 SNPs respectively as being under selection, however as no locus was flagged by both
methods none were excluded from further analyses. FDist results using Bonferonni
correction identified 21 SNPs as outliers. Samples sizes (n) for each analyzed cluster
were: Navarra, 19; Valle de Tena, 10; Yésero, 17; Bujaruelo, 6; Ordesa, 24; Añisclo, 17.
Genetic structure
The global FST was 0.514 (p>0.001) with genetic variation in R. pyrenaica best
explained for K=2-6 as indicated by summary statistics generated by Structure, snmf and
DAPC software (∆K, MCE and BIC, respectively) (Appendix). First, Bayesian analysis
in Structure with number of populations set to K=2 separated all western from eastern
individuals, with n = 19 and 74 respectively (Fig. 3A). This was strengthened by a
pairwise differentiation of FST = 0.538. Consistently both DAPC and snmf results were
identical, assigning similar individuals to a western or eastern cluster (Fig. 3C and
Appendix). Secondly, the assessment of genetic clusters within eastern populations
showed a presence of 2-5 clusters (Fig. 3A). Again, all three methods (∆K, MCE and
BIC) were in agreement showing K=2-5 as the likely number of genetic clusters within
the eastern range. Discriminant PCA analysis, excluding the Navarra cluster, separated
individuals into five clusters: Valle de Tena, Yésero, Bujaruelo, Ordesa and Añisclo (Fig.
3D); although the genetic clustering is less clear between the Yésero, Bujaruelo and
Ordesa populations. Indeed, pairwise FST between adjacent populations of Añisclo-
Ordesa, Valle de Tena-Yésero, Yésero-Bujaruelo, Bujaruelo-Ordesa and Yésero-Ordesa
were 0.313, 0.200, 0.194, 0.286 and 0.166 respectively (Table 1). Results of pairwise FST
calculated using GenoDive (Meirmans & Van Tienderen 2004) and Arlequin (Excoffier
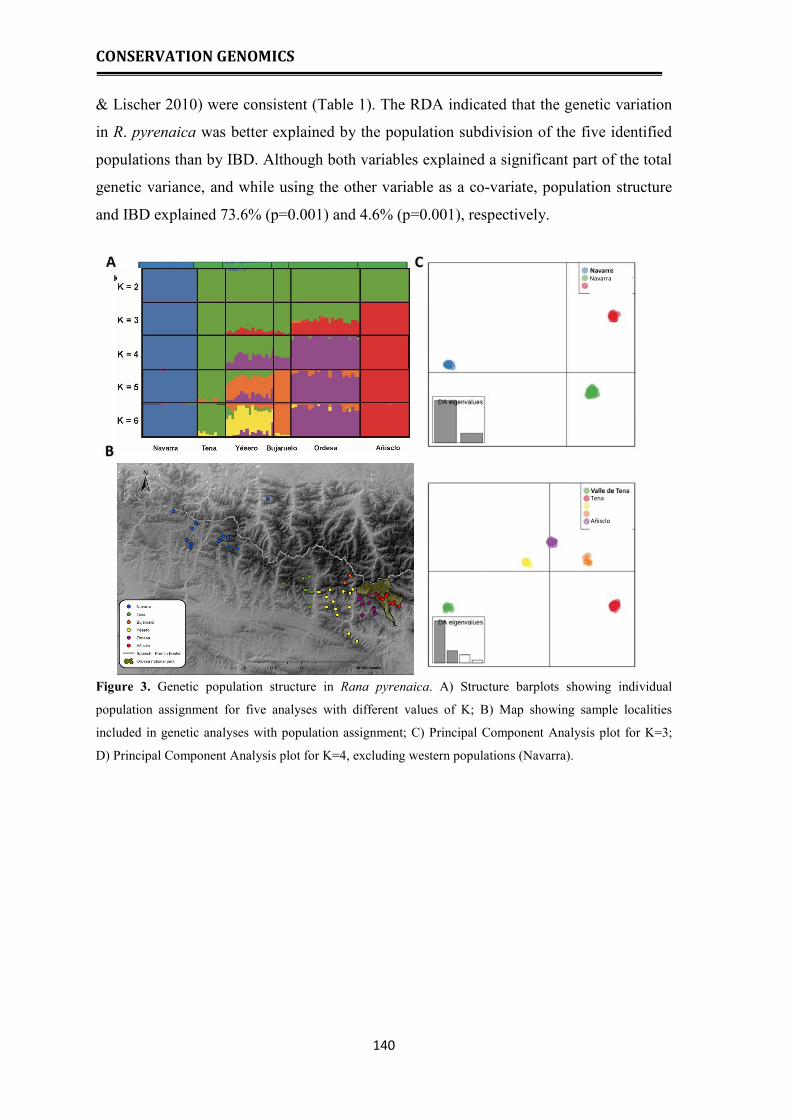
CONSERVATION GENOMICS
140
& Lischer 2010) were consistent (Table 1). The RDA indicated that the genetic variation
in R. pyrenaica was better explained by the population subdivision of the five identified
populations than by IBD. Although both variables explained a significant part of the total
genetic variance, and while using the other variable as a co-variate, population structure
and IBD explained 73.6% (p=0.001) and 4.6% (p=0.001), respectively.
Figure 3. Genetic population structure in Rana pyrenaica. A) Structure barplots showing individual
population assignment for five analyses with different values of K; B) Map showing sample localities
included in genetic analyses with population assignment; C) Principal Component Analysis plot for K=3;
D) Principal Component Analysis plot for K=4, excluding western populations (Navarra).
Navarra
Tena
Añisclo
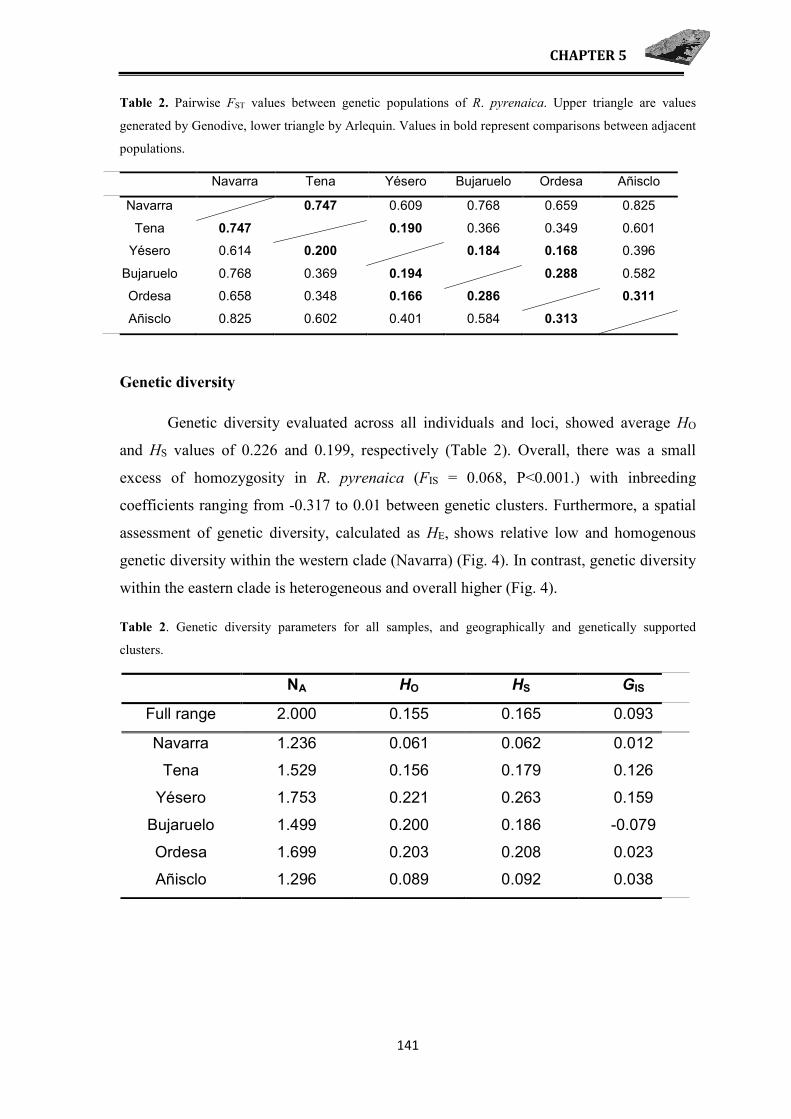
CHAPTER 5
141
Table 2. Pairwise FST values between genetic populations of R. pyrenaica. Upper triangle are values
generated by Genodive, lower triangle by Arlequin. Values in bold represent comparisons between adjacent
populations.
Genetic diversity
Genetic diversity evaluated across all individuals and loci, showed average HO
and HS values of 0.226 and 0.199, respectively (Table 2). Overall, there was a small
excess of homozygosity in R. pyrenaica (FIS = 0.068, P<0.001.) with inbreeding
coefficients ranging from -0.317 to 0.01 between genetic clusters. Furthermore, a spatial
assessment of genetic diversity, calculated as HE, shows relative low and homogenous
genetic diversity within the western clade (Navarra) (Fig. 4). In contrast, genetic diversity
within the eastern clade is heterogeneous and overall higher (Fig. 4).
Table 2. Genetic diversity parameters for all samples, and geographically and genetically supported
clusters.
Navarra Tena Yésero Bujaruelo Ordesa Añisclo
Navarra 0.747 0.609 0.768 0.659 0.825
Tena 0.747 0.190 0.366 0.349 0.601
Yésero 0.614 0.200 0.184 0.168 0.396
Bujaruelo 0.768 0.369 0.194 0.288 0.582
Ordesa 0.658 0.348 0.166 0.286 0.311
Añisclo 0.825 0.602 0.401 0.584 0.313
NA HO HS GIS
Full range 2.000 0.155 0.165 0.093
Navarra 1.236 0.061 0.062 0.012
Tena 1.529 0.156 0.179 0.126
Yésero 1.753 0.221 0.263 0.159
Bujaruelo 1.499 0.200 0.186 -0.079
Ordesa 1.699 0.203 0.208 0.023
Añisclo 1.296 0.089 0.092 0.038

CONSERVATION GENOMICS
142
Figure 4. Spatial genetic diversity (HE) heat map of Rana pyrenaica. Black dots represent known localities
for this species, purple dots represent localities included in our SNP dataset.
Mean estimates of mlh parameters, including standard deviations, are summarized
in Table 3. Overall, species-wide Internal Relatedness (IR) was 0.48, the eastern cluster
showed an identical positive IR (0.32) and the western cluster (Navarra) a negative IR of -
0.07. Populations within the eastern cluster also showed lower IR values ranging between
-0.29 (Bujaruelo) and 0.11 (Yésero). A similar pattern was found for estimates of
Homozygosity by Locus (HL), which was lower for the western compared to the eastern
cluster. Again, within the eastern cluster, values ranged from 0.54 for Bujaruelo to 0.66 in
Yésero. For Standardized Heterozygosity (SH), estimates for each clustering scale were
similar.

CHAPTER 5
143
Table 3. Multilocus heterozygosity values for R. pyrenaica populations. Mean values in bold, and 2.5% and
97.5% quantiles between parentheses.
Results for historical demographic analyses are shown in Fig. 5, and Appendix.
The west-east divergence occurred pre-LGM, however highest probability calculated by
two estimation methods was inconsistent for scenarios two (21-460kya; late Pleistocene)
and three (460-940kya; middle Pleistocene) (Fig. 5A). Therefore, a 21-940kya-divergence
interval was included in the second run. For this run probability estimates consistently
identified scenario six (Fig. 2G) as the most probable divergence scenario (Fig. 5B). Time
divergence estimates for scenario 6 (run 2), including 95% intervals, indicated that west-
east divergence occurred 578 thousand years ago (kya) (200-920kya). Thereafter, within
the east clade, populations diverged separately; Añisclo 310kya (102-646kya); Bujaruelo
264kya (106-501kya); Ordesa 141kya (48-282kya); Valle de Tena and Yésero 168kya
(24-350kya). All supported scenarios showed a good model fit as observed data fell
within simulated data distribution (Appendix).
Internal Relatedness Standardized
Heterozygosity
Homozygosity by
locus
All data 0.48 (0.09, 0.86) 1 (0.31, 1.75) 0.82 (0.67, 0.96)
Navarra -0.07 (-0.33, 0.38) 1 (0.58, 1.44) 0.61 (0.51, 0.82)
East cluster 0.32 (-0.00, 0.69) 1 (0.41, 1.54) 0.76 (0.63, 0.90)
Tena 0.01 (-0.16, 0.30) 1 (0.66, 1.19) 0.65 (0.57, 0.75)
Yésero 0.11 (-0.07, 0.28) 1 (0.83, 1.25) 0.66 (0.57, 0.73)
Bujaruelo -0.29 (-0.41, -0.03) 1 (0.74, 1.16) 0.54 (0.47, 0.64)
Ordesa -0.03 (-0.32, 0.19) 1 (0.77, 1.39) 0.62 (0.50, 0.71)
Añisclo -0.03 (-0.33, -0.24) 1 (0.70, 1.30) 0.62 (0.49, 0.73)

CONSERVATION GENOMICS
144
Figure 5. diyABC direct and logistic regression probability results for two approximate Bayesian
computation runs. A) results for west-east divergence estimate, B) results for divergence estimate including
all six populations. Figures show direct and logistic estimates of posterior probability, y-axis is probability
(P), x-axis is number of simulated data sets (Sd).
Partial Mantel tests suggest that the best spatial hypotheses of landscape
connectivity, considering isolation by resistance, are the ones involving the variables:
distance to rivers and streams, elevation, slope and landcover (Mantel statistic r=0.4402,
p=0.0001). There are resistance matrices combining some of those variables that show
also significant results. The best analysis resulted in a connectivity map that is shown in
Figures 6 and 7.
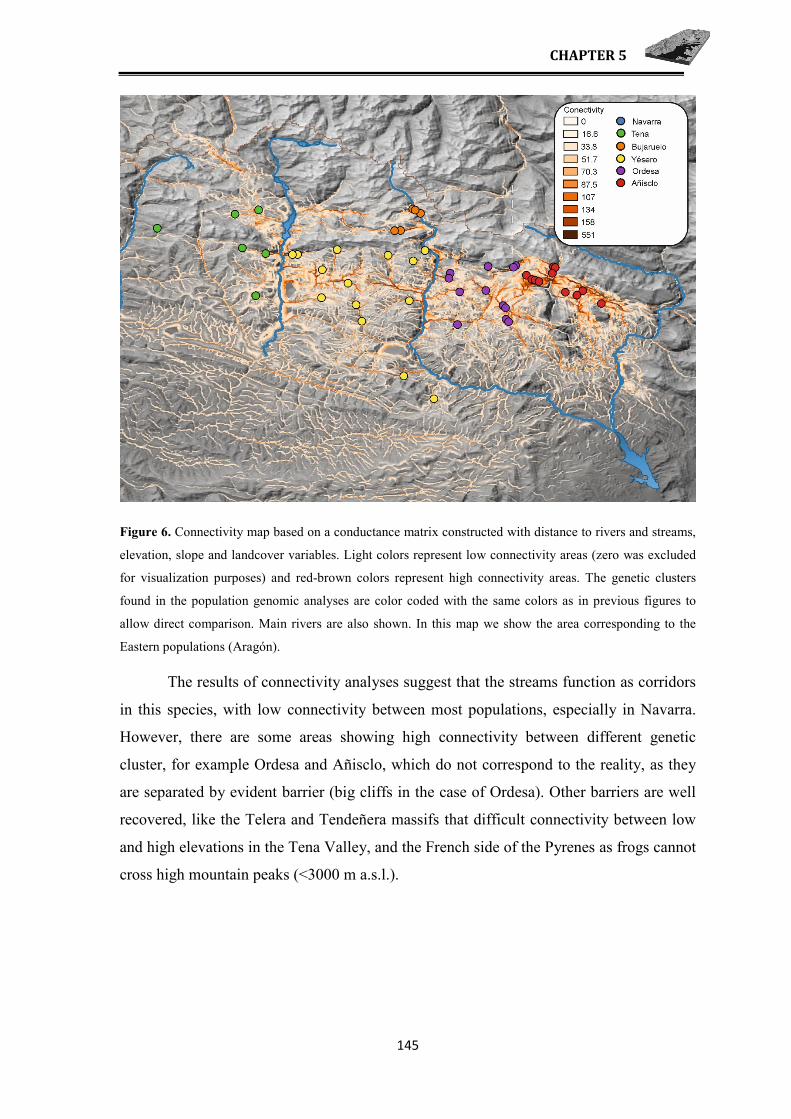
CHAPTER 5
145
Figure 6. Connectivity map based on a conductance matrix constructed with distance to rivers and streams,
elevation, slope and landcover variables. Light colors represent low connectivity areas (zero was excluded
for visualization purposes) and red-brown colors represent high connectivity areas. The genetic clusters
found in the population genomic analyses are color coded with the same colors as in previous figures to
allow direct comparison. Main rivers are also shown. In this map we show the area corresponding to the
Eastern populations (Aragón).
The results of connectivity analyses suggest that the streams function as corridors
in this species, with low connectivity between most populations, especially in Navarra.
However, there are some areas showing high connectivity between different genetic
cluster, for example Ordesa and Añisclo, which do not correspond to the reality, as they
are separated by evident barrier (big cliffs in the case of Ordesa). Other barriers are well
recovered, like the Telera and Tendeñera massifs that difficult connectivity between low
and high elevations in the Tena Valley, and the French side of the Pyrenes as frogs cannot
cross high mountain peaks (<3000 m a.s.l.).

CONSERVATION GENOMICS
146
Figure 7. Connectivity map based on a conductance matrix constructed with distance to rivers and streams,
elevation, slope and landcover variables. Light colors represent low connectivity areas (zero was excluded
for visualization purposes) and red-brown colors represent high connectivity areas. The genetic clusters
found in the population genomic analyses are color coded with the same colors as in previous figures to
allow direct comparison. Main rivers are also shown. In this map we show the area corresponding to the
Western populations (Navarra and part of Aragón).
We also tested the hypothesis of isolation by barrier with partial Mantel tests
correlating with genetic distances. Those were done by pairwise comparisons between
each pair of genetic clusters: eastern vs. western populations (r=0.7733, p=0.0001), Tena
vs. Yésero (r=0.5328, p=0.0001), Ordesa-Yésero (r=0.3516, p=0.0001), Ordesa-Añisclo
(r=0.5279, p=0.0001).
DISCUSSION
Here we utilized high-throughput SNP data to study the spatial genetic structure of
an endemic European amphibian that is of conservation concern, being listed as
Endangered by the IUCN. Analyses of genetic parameters within Rana pyrenaica show
that there are substantial differences in genetic diversity and occurrence of moderate
CHAPTER 5
147
inbreeding among sampled localities. In contrary to previous studies (Carranza & Arribas
2008, Chapter 4), our results show the presence of multiple genetically differentiated
population clusters within R. pyrenaica that diverged in the middle-to-late Pleistocene.
These results suggest a presence of several potential management units within this
species.
Phylogeography and population structure
Our study is the first to identify a geographic signature in genetic variation within
R. pyrenaica. Previous studies found an absence of geographic structure for mtDNA
genes and genomes, several non-coding nuclear markers and protein-coding genes
(Carranza & Arribas, 2008, Chapter 4). Although the two major clades lack mtDNA
monophyly (Carranza & Arribas 2008, Chapter 4), our DAPC results indicate the largest
genetic variation within R. pyrenaica indeed separates western and eastern populations
(Fig. 3A and C). Similarly, both Structure and snmf assignments of individuals for K=2
separate the west and east clade individuals (Fig. 3A, Appendix). Based on simulations of
the demographic history, East-West divergence occurred ~578kya, during the middle
Pleistocene. The middle Pleistocene, 460-940kya, is known for stronger glacial cycles
and ice accumulation compared to the early Pleistocene (1,200-2,595kya), hence
presumably caused longer periods of isolation between subpopulations. Interestingly, this
geographical separation between both clades is identical to major haplotype groups in
species of plants, spiders and other species of amphibians (Van Dijk & Bakx‐Schotman
1997, Charrier et al. 2014, Liberal et al. 2014, Gonçalves et al. 2015, Bidegaray-Batista
et al. 2016). Moreover, although divergence estimates were not always performed in
these studies, Alytes obstetricans and Harpactocrates ravastellus divergence predates
those found here for R. pyrenaica and occurred during the early Pleistocene (Gonçalves et
al. 2015, Bidegaray-Batista et al. 2016). Alternatively, the lack of mtDNA divergence
between both major clades, despite their relatively recent origin, could suggest an
additional recent origin of the distribution gap after earlier gene flow occurred among
different populations. Divergence among populations in the eastern clade (141-310kya)
occurred within the late Pleistocene (21-460kya), during which glacial periods intensified
and prolonged to ~100kya. These estimates therefore indicate that all six populations
inhabited their own local LGM refugia, which especially for Bujaruelo was likely very

CONSERVATION GENOMICS
148
small given the glacial extent and distribution during the LGM (Fig. 6). In addition to the
multiple-species boundary around the Valle de Tena, the Ainsa valley also constitutes a
gene flow or distribution barrier for multiple species. Besides the eastern distribution
boundary for R. pyrenaica, the Bielsa-Ainsa valley seems to be a widely occurring barrier
in other species (Muster & Berendonk 2006, Valtueña et al. 2012, Vences et al. 2013,
Charrier et al. 2014, Gonçalves et al. 2015, Bidegaray-Batista et al. 2016). Even though
the phylogeographic history of R. pyrenaica shows similarities to that of other species,
still little is known as to how Pyrenean species and ecosystems responded to Quaternary
glacial cycles, which is surprising given the high level of endemism. These questions
should be addressed by comparative phylogeographic studies.
Although diyABC is a regularly implemented program to reconstruct species
historical demographic history based on genetic data (e.g. Portnoy et al. 2014), a notable
limitation of this methodology is the assumption of migration absence (Cornuet et al.
2008). Inclusion of migration might lead to more recent divergence estimates between
populations in R. pyrenaica. However, our results suggest a lack of migration between
these clusters because river and mountain barriers have been present in their actual
configuration since the LGM. It is possible that migration only occurs in this system
when these barriers weaken, possible during glacial periods throughout the lowlands (see
Chapter 4). Future additional analyses should perform R. pyrenaica divergence
computations using more robust programs, preferably using complete contigs instead of
SNPs.
In addition to both clades, our results indicate previously undescribed genetic
diversity within the eastern clade. High genetic differentiation and, consequently, low
levels of gene flow between adjacent populations suggest that the eastern clade of R.
pyrenaica constitutes of five physically separated populations (Fig. 3A, D). Our analyses
of pairwise differentiation identified both moderate (>0.15) to high (>0.2) FST values,
similar to values for populations in other amphibian species (Rowe et al. 2000, Palo et al.
2003, Arens et al. 2007, Knopp et al. 2007). Geographic assessment of these proposed
populations and their distribution suggest that the river drainage system acts as a strong
gene flow barrier between the Valle de Tena-Yésero, and Yésero-Ordesa populations.
Similar results were found in distribution ranges of other high-elevation amphibians (Li et
al. 2009, Yan et al. 2012), separating divergent mtDNA lineages. However, in R.
pyrenaica, gene flow seems not to only be restricted by river systems but also by steep
CHAPTER 5
149
elevation changes, specifically the southern slopes of the Ordesa valley and the
northeastern slope of Valle de Jalle that separates the Ordesa from Añisclo populations.
Although additional localities occur closer to the southern Añisclo canyon, from which no
genetic samples were sequenced, it is sound to assign the narrow and altitudinally steep
Añisclo canyon as another strong gene flow barrier. Landscape genetic analyses using
Circuitscape failed to recover this barrier, likely because the slope values we used as
limiting value for the frog (42⁰ slope) may need to be revised as the frogs could be able to
climb upon higher slopes as long as there is water. Although the isolation by resistance
models came significant, a pure barrier model in pairwise correlations using partial
Mantel test showed that for all comparisons between genetic clusters the barriers explain
the observed genetic distances, hence it is likely that big rivers and steep slopes are real
barriers to gene flow. Big streams were frozen with glaciers during cold Pleistocene
periods, resulting in long ice tongues covering the rivers (Ehlers & Gibbard 2004), and
hence the habitat of the frogs, but more importantly those were barriers then that isolated
populations at both sides. The estimated divergence times between genetic clusters
suggest that their origin occurred during the Pleistocene, and it could be the result of these
ice barriers that isolated populations, rather than during the actual streams and rivers
where the main potential cause that prevent frogs to cross them are big fish. It is
interesting that all landscape genetic analyses recover a low connectivity between
Navarra populations where there are no evident geographic or climatic barriers, there
were no big glaciers and they are genetically homogeneous. The observed pattern of
genetic variation, high eastern and low western, could have several reasons; 1) founder
effect resulting from an eastern origin range expansion (Comps et al. 2001), 2) western
isolation with subsequent genetic drift and inbreeding, and 3) increased eastern habitat
heterogeneity and geographic complexity (deep valleysm higher altitudinal gradients,
more rivers and steep slopes).
Each of three clustering methods used assigned the small isolated population in
France to the Navarra cluster (Fig. 3A and C; Appendix). The complete absence of R.
pyrenaica between the French and geographically closest localities, even though suitable
habitat seems available, can have two potential explanations: or it is a relict isolate of the
last glacial ice expansion, as suggested by the ice-sheet maps (see chapter 4) that show
that the area where it occurs today was ice-free in the LGM; or it was recently introduced
there from Navarra, as we could expect some degree of genetic differentiation as
CONSERVATION GENOMICS
150
observed in the eastern populations but they are genetically the same, and landscape
genetic analyses do not support connectivity between those isolated French and the
Navarra populations.
It remains unclear why the Navarra population cluster is confined to its current
distribution, mainly Spain and the close French frontier, and not dispersing further into
France. It could (partially) be explained by several hypotheses: migration limitation due
to e.g. the orientation of local river systems and low species dispersal rate combined with
recent extirpation of populations within the current distribution gap; larger effect of Bd on
the Navarra populations. Although we showed here that river systems seem to act as
migration and gene flow barriers for R. pyrenaica, no study has so far assessed this
species’ annual dispersal rate. It is likely to be lower than of its sister species R.
temporaria (>2000m; Kovar et al. 2009, Decout et al. 2012), given its fragmented and
patchy distribution, and smaller body size. A low dispersal rate is also strengthened by the
occurrence of only one population in a northward flowing river drainage system (Manenti
& Bianchi 2011). The distribution range could also be limited through low reproductive
success, which is dependent on water temperature, predatory fish, and oxygen and acidity
levels (Serra-Cobo et al. 1998).

CHAPTER 5
151
Figure 6. Current genetic population structure in Rana pyrenaica with ice extent during the Last Glacial
Maximum. and Putative river Barriers (Cinca, Ara, Gállego, Aragón and Aragón-Subordón rivers).
Genetic diversity and conservation
Our results suggest caution must be taken when assessing population trends and
identifying conservation efforts aimed to protect R. pyrenaica. Namely, in addition to the
formerly proposed western and eastern clades, we identified multiple previously unknown
genetic clusters within the eastern clade; implying that their inconsideration in
management efforts could lead to local extirpation and loss of genetic diversity. Although
this genetic structure is higher than previously anticipated by the results of complete
mitochondrial genomes (Chapter 4), still is low, with overall very low genetic diversity
(HS=0.165), and higher genetic diversity within the eastern compared to the western
clade, which shows the lowest genetic diversity (HS=0.062). This pattern is presumably a
combination of higher genetic variation within the eastern LGM refugia, a strong
historical population size bottleneck within the western clade and presence of multiple
isolated eastern populations prone to mechanisms that increase differentiation among
them. Luckily, two of the eastern clusters occur within the Parque Nacional de Ordesa y
CONSERVATION GENOMICS
152
Monte Perdido, and hence already have the highest degree of protection possible in the
European Union.
Amphibians in general are believed to be more prone to low genetic diversity and
its decrease than other vertebrates (Allentoft & O’Brien 2010). This is due to several
factors: 1) generally low effective population sizes in amphibians (Funk et al. 1999) 2)
combined with clutch reproduction and potential of entire clutch mortality, and 3) low
dispersal rate (Allentoft & O’Brien 2010). However similar low levels of genetic
diversity are rarely reported in the amphibian literature and to our knowledge not from a
species-wide dataset. For example, Seppa & Laurila (1999) found low diversity within
Finnish island populations of R. temporaria (HE<0.2) and B. bufo (HE<0.1). Other
vertebrate groups present identical low genetic diversity (HE<0.1) in island populations of
species of lizard and wallaby (Lennon et al. 2011, van den Burg et al. 2018).
Furthermore, although this low genetic diversity might be caused by local population
declines, which have mainly been recorded from the valley of the type locality (Serra-
Cobo 1993, Vieites et al. 2016), another explanation could be collection for pet trade. In
the digital age, locality information of endangered and protected species should be treated
as sensitive, and each study should assess whether sharing specific localities in scientific
publications is justified (Lindenmayer & Scheele 2017).
An additional line of evidence that points to low genetic diversity within R.
pyrenaica is the SNP dataset (n=365) presented here, which is well below the final
filtered number of SNPs in datasets that implemented ddRAD (Peterson et al. 2012,
Wang et al. 2013, Kai et al. 2014, Portnoy et al. 2015). However, we cannot assess the
potential loss of SNPs caused by sequencing issues during Illumina sequencing, which
led to low quality and genetic data for 87 individuals divided over both Illumina libraries.
Similarly, sequencing issues might have caused the high presence of control sample
discrepancies, further decreasing our SNP dataset. As bioinformatics pipelines and SNP
calling perform better with a reference genome (Alkan et al. 2011, Shafer et al. 2016), we
recommend repeating these steps whenever a high quality R. pyrenaica genome becomes
available.
A negative effect of inbreeding and low genetic diversity is a potential elevated
expression of deleterious alleles. The occurrence of such alleles is presumably higher in
populations following recent bottlenecks compared to populations that went through

CHAPTER 5
153
historic bottlenecks experiencing lower fitness and subsequent selection against
deleterious alleles (purging). Therefore, from a conservation standpoint, the pre-LGM
origin of all six populations of R. pyrenaica suggests that currently, negative risks
associated with inbreeding and low genetic diversity are expected to be low.
The high number of loci that significantly deviated from HWE equilibrium
suggests non-random mating in R. pyrenaica or strong inbreeding, which might be caused
by one or several violated HWE assumptions e.g. migration, selection, population size.
The occurrence of moderate and high FST values, and the inability to detect loci under
selection suggest that assumptions of migration and selection are not violated. Instead, the
assumption of infinite population size is violated as shown in chapter 3, where we recover
very low population sizes. Hence, we propose continuing population size monitoring and
a viability assessment for implementation of methods to increase local population size.
Although genetic diversity is low across the entire range of R. pyrenaica, from a
conservation perspective, two populations deserve major attention given the combination
of geographic and genetic isolation and extremely low genetic diversity (HS<0.1). The
Añisclo and Navarra populations are therefore relatively more vulnerable to negative
consequences associated with low genetic diversity and low effective population size,
such as inbreeding depression and limited adaptive ability to changing environmental
variables (Charlesworth & Willis 2009, Allendorf et al. 2013). Indeed summer
temperatures and droughts are projected to increase in southern Europe (Gao et al. 2006).
Presence of inbreeding depression within genetically low diverse populations could be
assessed in future studies, similar to previous heterozygosity-fitness correlation studies on
other amphibian species (see review in Allentoft & O’Brien 2010). However, given the
long history of isolation and small effective population size, most genetic load must have
been purged, otherwise the species would have become extinct a long time ago
Several lines of evidence suggest that the six populations function independently
(Moritz 1994): physical separation, presence of strong gene flow barriers and medium to
high genetic differentiation. Therefore we recommend that all identified populations are
considered as separate management units (MU’s), should be considered during planning
and implementation of conservation actions. The isolated nature of these, mostly small,
populations suggests genetic diversity could quickly deplete further due to inbreeding and
genetic drift (Frankham 1996). Moreover, especially amphibians are prone to potential
CONSERVATION GENOMICS
154
large effects of genetic drift given their reproduction strategy and the potential of whole
clutch mortality (Dubois 2004). In addition, preliminary data suggests that tadpole
survival decreases during warm years as water in shallow pools evaporates during warm
summer conditions, as well as with storm floods (see chapter 1). With projected
temperature and drought increase (Gao et al. 2006) and stochastic events like stronger
storms and floods, tadpole survival is expected to decrease further leading to even smaller
population sizes and further increase in fragmentation. These features and significant but
weak inbreeding in R. pyrenaica highlight the need of continued monitoring and
conservation management of all MU’s.
Following the IUCN guidelines, the conservation status of each species is ideally
reassessed every five years (IUCN 2017), which is overdue for R. pyrenaica (Bosch et al.
2009). Since 2009, and in addition to this work, a large amount of data on this species has
been generated and analyzed (Vieites et al. 2016, in prep, Peso et al. 2016; the current
study). Therefore we propose a reassessment of the Red List status for R. pyrenaica that
summarizes the current knowledge and guides both future research and conservation
efforts.
As main conclusions, we here utilized a RRG method to infer the phylogeographic
and demographic history, spatial connectivity and conservation genetic parameters to
guide conservation management for an endemic endangered European brown frog.
Population subdivision is formed by the river drainage system leading to high population
differentiation. Rana pyrenaica shows weak inbreeding and very low levels of genetic
diversity, which is in line with its isolated small populations. We identify six management
units within the species range that deserve separate conservation management and
evaluation. Because there is strong evidence for a long history of evolution in isolation
for this species of poorly connected populations, conservation priority lies on reducing
environmental change and stochasticity in its habitat. Before further studies have been
performed on the effects of interbreeding among different populations on population
viability (outbreeding depression), genetic management such as translocating individuals
among populations or even clusters to increase genetic diversity is not recommended.
CHAPTER 5
155
Acknowledgements
We are grateful to many people that made this project possible. Several students
and collaborators helped in fieldwork in the Pyrenees, including Carlos Zaragoza, Javier
Santos, Rubén González, Miguel Vences, Nina Bernard, Guillermo Ponz and Isabel
Perandones. Fernando Carmena and Ignacio Gómez from SARGA in Aragón, and Iosu
Antón in Navarra were extremely helpful in the field, allowing locating many known
populations. Ramon Antor Casterllanau provided logistic help to prepare and carry on
fieldwork. Manuel Alcántara, David Guzmán and Jose Luis Burrel from the Aragón
government showed their total collaboration and help during the whole length of the
project. Forest rangers helped us during the fieldwork, and the public company
Sodemasa, now SARGA, provided logistic support in Ordesa in 2011. MPF was financed
with a grant by CNPq under Science Without Borders program by Brazil Ministry of
Science. We thank the Governments of Aragon and Navarra for collecting permits. This
work was funded by a research project of the Zoo de Barcelona (Ayuntamiento de
Barcelona) as well as by a research project from the Parques Nacionales OPAN –
MMARM to DRV.
References
Alho, J. S., Välimäki, K., & Merilä, J. (2010) Rhh: An R extension for estimating
multilocus heterozygosity and heterozygosity-heterozygosity correlation. Molecular
Ecology Resources, 10(4), 720–722. https://doi.org/10.1111/j.1755-
0998.2010.02830.x
Alkan, C., Sajjadian, S., & Eichler, E. E. (2011) Limitations of next-generation genome
sequence assembly. Nature Methods, 8(1), 61–65.
https://doi.org/10.1038/nmeth.1527
Allendorf, F. W., Hohenlohe, P. A., & Luikart, G. (2010) Genomics and the future of
conservation genetics. Nature Reviews Genetics, 11, 697–710.
https://doi.org/10.1038/nrg2844
Allendorf, F.W., Luikart, G.H., Aitken, S.N. (2013) Conservation and the Genetics of
Populations, 2nd Edition. Wiley-Blackwell.
Allentoft, M. E., & O’Brien, J. (2010) Global amphibian declines, loss of genetic
diversity and fitness: A review. Diversity, 2(1), 47–71.
https://doi.org/10.3390/d2010047
Amos, W., Worthington Wilmer, J., Fullard, K., Burg, T. M., Croxall, J. P., Bloch, D., &
Coulson, T. (2001) The influence of parental relatedness on reproductive success.
CONSERVATION GENOMICS
156
Proceedings of the Royal Society B: Biological Sciences, 268(1480), 2021–2027.
https://doi.org/10.1098/rspb.2001.1751
Andrews, K. R., Good, J. M., Miller, M. R., Luikart, G., & Hohenlohe, P. A. (2016)
Harnessing the power of RADseq for ecological and evolutionary genomics. Nature
Reviews Genetics, 17(2), 81–92. https://doi.org/10.1038/nrg.2015.28
Aparicio, J. M., Ortego, J., & Cordero, P. J. (2006) What should we weigh to estimate
heterozygosity, alleles or loci? Molecular Ecology, 15(14), 4659–4665.
https://doi.org/10.1111/j.1365-294X.2006.03111.x
Arens, P., Van Der Sluis, T., Van’t Westende, W. P. C., Vosman, B., Vos, C. C., &
Smulders, M. J. M. (2007) Genetic population differentiation and connectivity
among fragmented Moor frog (Rana arvalis) populations in the Netherlands.
Landscape Ecology, 22(10), 1489–1500. https://doi.org/10.1007/s10980-007-9132-4
Avise, J. C. (1989) A role for molecular genetics in the recognition and conservation of
endangered species. Trends in Ecology & Evolution, 4(9), 279–81.
https://doi.org/10.1016/0169-5347(89)90203-6
Baird, N. A., Etter, P. D., Atwood, T. S., Currey, M. C., Shiver, A. L., Lewis, Z. A.,
Selker E.U., Cresko, W.A., & Johnson, E. A. (2008) Rapid SNP discovery and
genetic mapping using sequenced RAD markers. PLoS ONE, 3(10), 1–7.
https://doi.org/10.1371/journal.pone.0003376
Beaumont, M. A., & Nichols, R. A. (1996) Evaluating loci for use in the genetic analysis
of population structure. Proc. R. Soc. London, 263, 1619–1626.
Bidegaray-Batista, L., Sánchez-Gracia, A., Santulli, G., Maiorano, L., Guisan, A., Vogler,
A. P., & Arnedo, M. A. (2016) Imprints of multiple glacial refugia in the Pyrenees
revealed by phylogeography and palaeodistribution modelling of an endemic spider.
Molecular Ecology, 25(9), 2046–2064. https://doi.org/10.1111/mec.13585
Bosch, J., Tejedo, M., Miaud, C., Martínez-Solano, I., Salvador, A., García-París, M., Gil,
E.R., Marquez, R., Diaz-Paniagua, C., & Geniez, P. (2009) Rana pyrenaica. The
IUCN Red List of Threatened Species.
https://doi.org/10.2305/IUCN.UK.2009.RLTS.T19183A8849239.en
Bradburd, G.S., Ralph, P.L., & Coop, G.M. (2013) Disentangling the effects of
geographic and ecological isolation on genetic differentiation. Evolution 67: 3258-
3273.
Canestrelli, D., Cimmaruta, R., & Nascetti, G. (2008) Population genetic structure and
diversity of the Apennine endemic stream frog , Rana italica – insights on the
Pleistocene evolutionary history of the Italian peninsular biota. Molecular Ecology,
17, 3856–3872. https://doi.org/10.1111/j.1365-294X.2008.03870.x
Carranza, S., & Arribas, O. (2008) Genetic uniformity of Rana pyrenaica Serra-Cobo,
1993 across its distribution range: a preliminary study with mtDNA sequences.
Amphibia-Reptilia, 29(4), 579–582. https://doi.org/10.1163/156853808786230389
CHAPTER 5
157
Charlesworth, D., & Willis, J. H. (2009) The genetics of inbreeding depression. Nature
Reviews Genetics, 10, 783. Retrieved from http://dx.doi.org/10.1038/nrg2664
Charrier, O., Dupont, P., Pornon, A., & Escaravage, N. (2014) Microsatellite Marker
Analysis Reveals the Complex Phylogeographic History of Rhododendron
ferrugineum (Ericaceae) in the Pyrenees. PLoS ONE, 9(3), 1–9.
https://doi.org/10.1371/journal.pone.0092976
Christensen, K. A., Brunelli, J. P., Lambert, M. J., Dekoning, J., Phillips, R. B., &
Thorgaard, G. H. (2013) Identification of single nucleotide polymorphisms from the
transcriptome of an organism with a whole genome duplication. BMC
Bioinformatics 14:325 https://doi.org/10.1186/1471-2105-14-325
Coltman, D. W., Pilkington, J. G., Smith, J. A., & Pemberton, J. M. (1999) Parasite-
mediated selection against inbred soay sheep in a free-living, island population.
Evolution, 53(4), 1259–1267.
Comps, B., Gömöry, D., Letouzey, J., Thiébaut, B., & Petit, R. J. (2001) Diverging
Trends Between Heterozygosity and Allelic Richness During Postglacial
Colonization in the European Beech. Genetics, 157(1), 389 LP-397. Retrieved from
http://www.genetics.org/content/157/1/389.abstract
Cornuet, J.-M., Santos, F., Beaumont, M. A., Robert, C. P., Marin, J.-M., Balding, D. J.,
Guillemaud, T., Estoup, A. (2008) Inferring population history with DIY ABC: a
user-friendly approach to approximate Bayesian computation. Bioinformatics,
24(23), 2713–2719. https://doi.org/10.1093/bioinformatics/btn514
Cornuet, J. M., Pudlo, P., Veyssier, J., Dehne-Garcia, A., Gautier, M., Leblois, R., …
Estoup, A. (2014) DIYABC v2.0: A software to make approximate Bayesian
computation inferences about population history using single nucleotide
polymorphism, DNA sequence and microsatellite data. Bioinformatics, 30(8), 1187–
1189. https://doi.org/10.1093/bioinformatics/btt763
Da Silva, A. R., Malafaia, G., & Menezes, I. P. P. (2017) Biotools: An R function to
predict spatial gene diversity via an individual-based approach. Genetics and
Molecular Research, 16(2), 1–6. https://doi.org/10.4238/gmr16029655
Danecek, P., Auton, A., Abecasis, G., Albers, C. A., Banks, E., DePristo, M. A., …
Durbin, R. (2011) The variant call format and VCFtools. Bioinformatics, 27(15),
2156–2158. https://doi.org/10.1093/bioinformatics/btr330
Davey, J. W., Cezard, T., Fuentes-Utrilla, P., Eland, C., Gharbi, K., & Blaxter, M. L.
(2013) Special features of RAD Sequencing data: Implications for genotyping.
Molecular Ecology, 22(11), 3151–3164. https://doi.org/10.1111/mec.12084
Davis, M. B., & Shaw, R. G. (2001) Range shifts and adaptive responses to Quaternary
climate change. Science, 292(April), 673–679.
https://doi.org/10.1126/science.292.5517.673
Decout, S., Manel, S., Miaud, C., & Luque, S. (2012) Integrative approach for landscape-
based graph connectivity analysis: A case study with the common frog (Rana
CONSERVATION GENOMICS
158
temporaria) in human-dominated landscapes. Landscape Ecology, 27(2), 267–279.
https://doi.org/10.1007/s10980-011-9694-z
Dimens, P. (2016) Population structure of a migratory small coastal shark, the blacknose
shark Carcharhinus acronotus, across cryptic barriers to gene flow. MSc
dissertation, Texas A&M University.
Dubois, A. (2004) Developmental pathway, speciation and supraspecific taxonomy in
amphibians. 1. Why are there so many frog species in Sri Lanka? Alytes, 22, 19-37.
Dudaniec, R Y. Rhodes, J R. Wilmer, J W. Lyons, M. Lee, K E. McAlpine, C A. Carrick,
F. N. 2013. Using multilevel models to identify drivers of landscape-genetic
structure among management areas. Molecular Ecology, 22, 3752–3765.
https://doi.org/10.1111/mec.12359
Earl, D. A., & vonHoldt, B. M. (2012) STRUCTURE HARVESTER: A website and
program for visualizing STRUCTURE output and implementing the Evanno
method. Conservation Genetics Resources, 4(2), 359–361.
https://doi.org/10.1007/s12686-011-9548-7
EEA – European Environment Agency: Corine Land Cover 2006 raster data,
www.eea.europa.eu/data-and-maps/data/corine-land-cover-2006-raster accessed:
August, 2015
Ehlers, J., Gibbard, P.L. (2004) Quaternary glaciations-extent and chronology: part I:
Europe (Vol. 2). Elsevier.
Elshire, R. J., Glaubitz, J. C., Sun, Q., Poland, J. A., Kawamoto, K., Buckler, E. S., &
Mitchell, S. E. (2011) A robust, simple genotyping-by-sequencing (GBS) approach
for high diversity species. PLoS ONE, 6(5), 1–10.
https://doi.org/10.1371/journal.pone.0019379
Evanno, G., Regnaut, S., & Goudet, J. (2005) Detecting the number of clusters of
individuals using the software STRUCTURE: A simulation study. Molecular
Ecology, 14(8), 2611–2620. https://doi.org/10.1111/j.1365-294X.2005.02553.x
Excoffier, L., Hofer, T., & Foll, M. (2009) Detecting loci under selection in a
hierarchically structured population. Heredity, 103(4), 285–298.
https://doi.org/10.1038/hdy.2009.74
Excoffier, L. & Lischer, H. E. L. (2010) Arlequin suite ver 3 . 5 : a new series of
programs to perform population genetics analyses under Linux and Windows.
Molecular Ecology Resources, 564–567. https://doi.org/10.1111/j.1755-
0998.2010.02847.x
Foll, M., & Gaggiotti, O. (2008) A Genome-Scan Method to Identify Selected Loci
Appropriate for Both Dominant and Codominant Markers: A Bayesian Perspective.
Genetics, 993(October), 977–993. https://doi.org/10.1534/genetics.108.092221
Forster, P. (2003) To Err is Human. Annals of Human Genetics, 2–4.
CHAPTER 5
159
Frankel, O. H. (1974) Genetic conservation: our evolutionary responsibility. Genetics,
78(1), 53–65. https://doi.org/Genetic Considerations in Ecological Restoration
Frankel, O. H., & Soulé, M. E. (1981) Conservation and Evolution. Oryx. Cambridge
University Press. https://doi.org/10.1017/S0030605300017853
Frankham, R. (1996) Relationship of Genetic Variation to Population Size in Wildlife.
Conservation Biology, 10(6), 1500–1508. https://doi.org/10.1046/j.1523-
1739.1996.10061500.x
Frantz, A. C., Cellina, S., Krier, A., Schley, L., & Burke, T. (2009) Using spatial
Bayesian methods to determine the genetic structure of a continuously distributed
population: Clusters or isolation by distance? Journal of Applied Ecology, 46(2),
493–505. https://doi.org/10.1111/j.1365-2664.2008.01606.x
Fraser, D. J., & Bernatchez, L. (2001) Adaptive evolutionary conservation: Towards a
unified concept for defining conservation units. Molecular Ecology, 10(12), 2741–
2752. https://doi.org/10.1046/j.1365-294X.2001.t01-1-01411.x
Frichot, E., & François, O. (2015) LEA: An R package for landscape and ecological
association studies. Methods in Ecology and Evolution, 6(8), 925–929.
https://doi.org/10.1111/2041-210X.12382
Funk, C. W., Tallmon, D. A., & Allendorf, F. W. (1999) Small effective population size
in the long‐toed salamander. Molecular Ecology, 8(10), 1633–1640.
https://doi.org/10.1046/j.1365-294x.1999.00748.x
Funk, W. C., McKay, J. K., Hohenlohe, P. A., & Allendorf, F. W. (2012) Harnessing
genomics for delineating conservation units. Trends in Ecology and Evolution,
27(9), 489–496. https://doi.org/10.1016/j.tree.2012.05.012
Gao, X., Pal, J. S., & Giorgi, F. (2006) Projected changes in mean and extreme
precipitation over the Mediterranean region from a high resolution double nested
RCM simulation. Geophysical Research Letters, 33(3), 2–5.
https://doi.org/10.1029/2005GL024954
Gonçalves, H., Maia-Carvalho, B., Sousa-Neves, T., García-París, M., Sequeira, F.,
Ferrand, N., & Martínez-Solano, I. (2015) Multilocus phylogeography of the
common midwife toad, Alytes obstetricans (Anura, Alytidae): Contrasting patterns
of lineage diversification and genetic structure in the Iberian refugium. Molecular
Phylogenetics and Evolution, 93, 363–379.
https://doi.org/10.1016/j.ympev.2015.08.009
Gregory, T.R. (2018) Animal Genome Size Database. http://www.genomesize.com,
accessed on 3 May 2018.
Gregory, T. R., Nicol, J. A., Tamm, H., Kullman, B., Kullman, K., Leitch, I. J., Murray,
B. G., Kapraun, D. F., Greilhuber, J., & Bennett, M. D. (2007) Eukaryotic genome
size databases. Nucleic Acids Research, 35(SUPPL. 1), 332–338.
https://doi.org/10.1093/nar/gkl828
CONSERVATION GENOMICS
160
Hellsten, U., Harland, R., Gilchrist, M., Hendrix, D., Jurka, J., V, K., … Rokhsar, D.
(2010) charge recombination reaction, it was proposed that structural changes
occur- ring in response to electron transfer decrease the free energy gap between P +
and Q. Science (New York, N.Y.), 328(April), 633–636.
Hewitt, G. M. (1999) Postglacial re-colonisation of European biota. Biological Journal of
the Linnean Society, 68(May), 87–112.
Hewitt, G. M. (2000) The genetic legacy of the Quaternary ice ages. Nature. 405, pages
907–913.
Hewitt, G. M. (2004) Genetic consequences of climatic oscillations in the Quaternary.
Philosophical Transactions of the Royal Society B: Biological Sciences, 359(1442),
183–195. https://doi.org/10.1098/rstb.2003.1388.
IUCN 2017. The IUCN Red List of Threatened Species. Version 2017-3.
<http://www.iucnredlist.org/about/overiew>. Downloaded on 07 May 2018.
Jarvis A., H.I. Reuter, A. Nelson, E. Guevara, 2006, Hole-filled seamless SRTM data V3,
International Centre for Tropical Agriculture (CIAT), available from
http://srtm.csi.cgiar.org.
Jombart, T., & Ahmed, I. (2011) adegenet 1.3-1: New tools for the analysis of genome-
wide SNP data. Bioinformatics, 27(21), 3070–3071.
https://doi.org/10.1093/bioinformatics/btr521
Kai, W., Nomura, K., Fujiwara, A., Nakamura, Y., Yasuike, M., Ojima, N., Masaoka, T.,
Ozaki, A., Kazeto, Y., Gen, K., Nagao, J., Tanaka, H., Kobayashi , T., & Ototake,
M. (2014) A ddRAD-based genetic map and its integration with the genome
assembly of Japanese eel (Anguilla japonica) provides insights into genome
evolution after the teleost-specific genome duplication. BMC Genomics, 15(1), 233.
https://doi.org/10.1186/1471-2164-15-233
Knopp, T., Cano, J. M., Crochet, P. A., & Merilä, J. (2007) Contrasting levels of variation
in neutral and quantitative genetic loci on island populations of moor frogs (Rana
arvalis). Conservation Genetics, 8(1), 45–56. https://doi.org/10.1007/s10592-006-
9147-4
Kovar, R., Marek, B., Vita, R., & Bocek, R. (2009) Spring migration distances of some
Central European amphibian species Spring migration distances of some Central
European. Amphibia-Reptilia, 30(June 2014), 367–378.
https://doi.org/10.1163/156853809788795236
Laurence, M., Hatzis, C., & Brash, D. E. (2014) Common contaminants in next-
generation sequencing that hinder discovery of low-abundance microbes. PLoS
ONE, 9(5), 1–8. https://doi.org/10.1371/journal.pone.0097876
Lennon, M., Taggart, D. A., Temple-Smith, P. D., & Eldridge, M. D. B. (2011) The
impact of isolation and bottlenecks on genetic diversity in the Pearson Island
population of the black-footed rock-wallaby (Petrogale lateralis pearsoni;
Marsupialia:Macropodidae). Australian Mammalogy, 33(2), 152–161.
https://doi.org/10.1071/AM11011
CHAPTER 5
161
Li, H., & Wren, J. (2014) Toward better understanding of artifacts in variant calling from
high-coverage samples. Bioinformatics, 30(20), 2843–2851.
https://doi.org/10.1093/bioinformatics/btu356
Li, R., Chen, W., Tu, L., & Fu, J. (2009) Rivers as barriers for high elevation amphibians:
a phylogeographic analysis of the alpine stream frog of the Hengduan Mountains.
Journal of Zoology, 277(4), 309–316. https://doi.org/10.1111/j.1469-
7998.2008.00543.x
Liberal, I. M., Burrus, M., Suchet, C., Thébaud, C., & Vargas, P. (2014) The evolutionary
history of Antirrhinum in the Pyrenees inferred from phylogeographic analyses.
BMC Evolutionary Biology, 14(1), 1–14. https://doi.org/10.1186/1471-2148-14-146
Lindenmayer, B. D., & Scheele, B. (n.d.) Do not publish. Science.
Mable, B. K., Alexandrou, M. A., & Taylor, M. I. (2011) Genome duplication in
amphibians and fish: An extended synthesis. Journal of Zoology, 284(3), 151–182.
https://doi.org/10.1111/j.1469-7998.2011.00829.x
Manenti, R., & Bianchi, B. (2011) A new western limit for Rana pyrenaica Serra-Cobo
1993 in the Irati region ( Pyrenees ), Herpetology notes, vol4, 403–404.
Mastretta-Yanes, A., Arrigo, N., Alvarez, N., Jorgensen, T. H., Pinero, D., & Emerson, B.
C. (2015) Restriction site-associated DNA sequencing , genotyping error estimation
and de novo assembly optimization for population genetic inference. Molecular
Ecology Resources, 15, 28–41. https://doi.org/10.1111/1755-0998.12291
May, R., & Godfrey, J. (1994) Biological Diversity: Differences between Land and Sea
[and Discussion]. Phil. Trans. R. Soc. Lond. B, 343(1303).
McRae, B.H. (2006) Isolation by resistance. Evolution 60:1551-1561.
McRae, B.H. and P. Beier. (2007) Circuit theory predicts Gene flow in plant and animal
populations. Proceedings of the National Academy of Sciences of the USA
104:19885-19890.
McRae, B.H., B.G. Dickson, T.H. Keitt, and V.B. Shah. (2008) Using circuit theory to
model connectivity in ecology and conservation. Ecology 10: 2712-2724.
Meirmans, P. G., & Van Tienderen, P. H. (2004) GENOTYPE and GENODIVE: Two
programs for the analysis of genetic diversity of asexual organisms. Molecular
Ecology Notes, 4(4), 792–794. https://doi.org/10.1111/j.1471-8286.2004.00770.x
Meirmans, P. G. (2012) The trouble with isolation by distance. Molecular Ecology, 2839–
2846.
Meirmans, P. G. (2015) Seven common mistakes in population genetics and how to avoid
them. Molecular Ecology, 24(13), 3223–3231. https://doi.org/10.1111/mec.13243
Miaud, C., Guyétant, R., & Elmberg, J. (1999) Variations in life-history traits in the
common frog Rana temporaria (Amphibia: Anura): a literature review and new data
from the French Alps. Journal of Zoology, 249(1), 61–73.

CONSERVATION GENOMICS
162
Moore, B., Bourret, V., Dionne, L., Bradbury, I. A. N., Reilly, P. O., & Kent, M. (2014)
Conservation genomics of anadromous Atlantic salmon across its North American
range : outlier loci identify the same patterns of population structure as neutral loci.
Molecular Ecology, 5680–5697. https://doi.org/10.1111/mec.12972
Moritz, C. (1994) Defining ‘Evolutionarily Significant Units’ for conservation. Trends in
Ecology and Evolution, 9, 373–375.
Moritz, C. (2002) Strategies to Protect Biological Diversity and the Evolutionary.
Systematic Biology, Vol51, 2:1, 238–254,
https://doi.org/10.1080/10635150252899752.
Mouret, V., Guillaumet, A., Cheylan, M., Pottier, G., Ferchaud, A. L., & Crochet, P. A.
(2011) The legacy of ice ages in mountain species: Post-glacial colonization of
mountain tops rather than current range fragmentation determines mitochondrial
genetic diversity in an endemic Pyrenean rock lizard. Journal of Biogeography,
38(9), 1717–1731. https://doi.org/10.1111/j.1365-2699.2011.02514.x
Muster, C., & Berendonk, T. U. (2006) Divergence and diversity: lessons from an arctic–
alpine distribution (Pardosa saltuaria group, Lycosidae) Molecular Ecology, 15(10),
2921–2933. https://doi.org/10.1111/j.1365-294X.2006.02989.x
Narum, S. R., & Hess, J. E. (2011) Comparison of F ST outlier tests for SNP loci under
selection. Molecular Ecology Resources, 11, 184–194.
https://doi.org/10.1111/j.1755-0998.2011.02987.x
Nosil, P., Funk, D. J., & Ortiz-Barrientos, D. (2009) Divergent selection and
heterogeneous genomic divergence. Molecular Ecology, 375–402.
https://doi.org/10.1111/j.1365-294X.2008.03946.x
Nunziata, S. O., Lance, S. L., Scott, D. E., Lemmon, E. M., & Weisrock, D. W. (2017)
Genomic data detect corresponding signatures of population size change on an
ecological time scale in two salamander species. Molecular Ecology, 26(4), 1060–
1074. https://doi.org/10.1111/mec.13988
Oksanen, J., Blanchet, F. G., Kindt, R., Legendre, P., Minchin, P.R., O’Hara, R. B.,
Simpson, G. L., Solymos, P., Stevens, M. H. H. & Wagner, H. (2014) Vegan:
Community Ecology Package. R package version 2.2-0. http://CRAN.R-
project.org/package=vegan.
Palo, J. U., O’Hara, R. B., Laugen, A. T., Laurila, A., Primmer, C. R., & Merilä, J. (2003)
Latitudinal divergence of common frog (Rana temporaria) life history traits by
natural selection: Evidence from a comparison of molecular and quantitative genetic
data. Molecular Ecology, 12(7), 1963–1978. https://doi.org/10.1046/j.1365-
294X.2003.01865.x
Parchman, T. L., Geist, K. S., Grahnen, J. A., Benkman, C. W., & Buerkle, C. A. (2010)
Transcriptome sequencing in an ecologically important tree species: assembly,
annotation, and marker discovery. BMC Genomics, 11(1), 180.
https://doi.org/10.1186/1471-2164-11-180
CHAPTER 5
163
Peso, M., Ponti de la Iglesia, R., Ponz Segrelles, G., González Martínez, R., Arcones
Segovia, A., & Vieites, D. R. (2016) The complete mitochondrial genome of the
Endangered European brown frog Rana pyrenaica through RNAseq. Mitochondrial
DNA Part B, 1(1), 394–396. https://doi.org/10.1080/23802359.2016.1174087
Peterson, B. K., Weber, J. N., Kay, E. H., Fisher, H. S., & Hoekstra, H. E. (2012) Double
digest RADseq: An inexpensive method for de novo SNP discovery and genotyping
in model and non-model species. PLoS ONE, 7(5).
https://doi.org/10.1371/journal.pone.0037135
Pierson, J.C., Coates, D. J., Oostermeijer, J. G. B., Beissinger, S. R., Bragg, J. G.,
Sunnucks, P., Schumaker, N. H., & Young, A. G. (2016) Genetic factors in
threatened species recovery plans on three continents. Frontiers in Ecology and the
Environment. 14(8): 433–440, https://doi.org/10.1002/fee.1323
Portnoy, D. S., Hollenbeck, C. M., Belcher, C. N., Driggers, W. B., Frazier, B. S.,
Gelsleichter, J., Grubs, R.D., & Gold, J. R. (2014) Contemporary population
structure and post-glacial genetic demography in a migratory marine species, the
blacknose shark, Carcharhinus acronotus. Molecular Ecology, 23(22), 5480–5495.
https://doi.org/10.1111/mec.12954
Portnoy, D. S., Puritz, J. B., Hollenbeck, C. M., Gelsleichter, J., Chapman, D., & Gold, J.
R. (2015) Selection and sex-biased dispersal in a coastal shark: The influence of
philopatry on adaptive variation. Molecular Ecology, 24(23), 5877–5885.
https://doi.org/10.1111/mec.13441
Pritchard, J. K., Wen, X., & Falush, D. (2010) Documentation for structure software :
Version 2 . 3. University of Chicago. IL, 6(3), 321–326.
https://doi.org/10.1002/spe.4380060305
Puechmaille, S. J. (2016) The program structure does not reliably recover the correct
population structure when sampling is uneven: Subsampling and new estimators
alleviate the problem. Molecular Ecology Resources, 16(3), 608–627.
https://doi.org/10.1111/1755-0998.12512
Puritz, J. B., Hollenbeck, C. M., & Gold, J. R. (2014a) dDocent : a RADseq, variant-
calling pipeline designed for population genomics of non-model organisms. PeerJ,
2, e431. https://doi.org/10.7717/peerj.431
Puritz, J. B., Matz, M. V., Toonen, R. J., Weber, J. N., Bolnick, D. I., & Bird, C. E.
(2014b) Demystifying the RAD fad. Molecular Ecology, 23(24), 5937–5942.
https://doi.org/10.1111/mec.12965
R Core Team (2018) R: A language and environment for statistical computing. R
Foundation for Statistical Computing, Vienna, Austria. URL https://www.R-
project.org/.
Reitzel, A. M., Herrera, S., Layden, M. J., Martindale, M. Q., & Shank, T. M. (2013)
Going where traditional markers have not gone before: Utility of and promise for
RAD sequencing in marine invertebrate phylogeography and population genomics.
Molecular Ecology, 22(11), 2953–2970. https://doi.org/10.1111/mec.12228

CONSERVATION GENOMICS
164
Reyes-Velasco, J., Manthey, J. D., Freilich, X., & Boissinot, S. (2018) Diversification of
African Tree Frogs (Genus Leptopelis ) in the Highlands of Ethiopia. Molecular
Ecology, (30 March 2018). https://doi.org/10.1111/mec.14573
Roland, A. B., Santos, J. C., Carriker, B. C., Caty, S. N., Tapia, E. E., Coloma, L. A., &
O’Connell, L. A. (2017) Radiation of the polymorphic Little Devil poison frog
(Oophaga sylvatica) in Ecuador. Ecology and Evolution, 7(22), 9750–9762.
https://doi.org/10.1002/ece3.3503
Rosenberg, N. A. (2004) DISTRUCT:a program for the graphical display of population
structure. Mol Ecol Notes, 4, 137–138.
Rowe, G., Beebee, T. J. C., Burke, T., & A, T. (2000) A microsatellite analysis of
natterjack toad , Bufo calamita, metapopulations. Oikos, 641–651.
Schmieder, R., & Edwards, R. (2011) Fast identification and removal of sequence
contamination from genomic and metagenomic datasets. PLoS ONE, 6(3).
https://doi.org/10.1371/journal.pone.0017288
Schmitt, T., Hewitt, G. M., & Müller, P. (2006) Disjunct distributions during glacial and
interglacial periods in mountain butterflies: Erebia epiphron as an example. Journal
of Evolutionary Biology, 19(1), 108–113. https://doi.org/10.1111/j.1420-
9101.2005.00980.x
Schmitt, T. (2009) Biogeographical and evolutionary importance of the European high
mountain systems. Frontiers in Zoology, 6(1), 1–10. https://doi.org/10.1186/1742-
9994-6-9
Schönswetter, P., Stehlik, I., Holderegger, R., & Tribsch, A. (2005) Molecular evidence
for glacial refugia of mountain plants in the European Alps. Molecular Ecology,
14(11), 3547–3555. https://doi.org/10.1111/j.1365-294X.2005.02683.x
Seppa, P., & Laurila, A. (1999) Genetic structure of island populations of the anurans
Rana temporaria and Bufo bufo. Heredity, 82(Pt. 3), 309–317.
Serra-Cobo, J. (1993) Description of a new european species of brown frog (Amphibia,
Anura, Ranidae). Alytes (Vol. 11). [Société batrachologique de France]. Retrieved
from http://cat.inist.fr/?aModele=afficheN&cpsidt=4701791
Serra-Cobo, J., Lacroix, G., & White, S. (1998) Comparison between the ecology of the
new European frog Rana pyrenaica and that of four Pyrenean amphibians. Journal
of Zoology, 246(2), 147–154. Retrieved from http://dx.doi.org/10.1111/j.1469-
7998.1998.tb00143.x
Sexton, J.P., Hangartner, S.B. & Hoffmann, A.A. (2014) Genetic isolation by
environment or distance: which pattern of gene flow is most common? Evolution
68: 1-15.
Shafer, A. B. A., Peart, C. R., Tusso, S., Maayan, I., Brelsford, A., Wheat, C. W., &
Wolf, J. B. W. (2016) Bioinformatic processing of RAD-seq data dramatically
impacts downstream population genetic inference. Methods in Ecology and
Evolution. https://doi.org/10.1111/2041-210X.12700

CHAPTER 5
165
Shah,V.B. and B.H. McRae. (2008) Circuitscape: a tool for landscape ecology. In: G.
Varoquaux, T. Vaught, J. Millman (Eds.). Proceedings of the 7th Python in Science
Conference (SciPy 2008), pp. 62-66.
Streicher, J. W., Devitt, T. J., Goldberg, C. S., Malone, J. H., Blackmon, H., & Fujita, M.
K. (2014) Diversification and asymmetrical gene flow across time and space:
Lineage sorting and hybridization in polytypic barking frogs. Molecular Ecology,
23(13), 3273–3291. https://doi.org/10.1111/mec.12814
Taberlet, P., Fumagalli, L., Wust-Saucy, A.-G., & Cosson, J.-F. (1998) Comparative
phylogeography and postglacial colonization routes in Europe. Molecular Ecology,
7, 453–464.
Teixeira, J., Gonçalves, H., Ferrand, N., García-París, M., & Recuero, E. (2018)
Mitochondrial phylogeography of the Iberian endemic frog Rana iberica, with
implications for its conservation. Current Zoology, 1–10.
https://doi.org/10.1093/cz/zoy010
Twyford, A. D., & Ennos, R. A. (2012) Next-generation hybridization and introgression.
Heredity, 108(3), 179–189. https://doi.org/10.1038/hdy.2011.68
Valbuena-Ureña, E., Oromi, N., Soler-Membrives, A., Carranza, S., Amat, F., Camarasa,
S., Denoël, M., Guillaume, O., Sanuy, D., Loyau, A., Schmeller, D. S., & Steinfartz,
S. (2018) Jailed in the mountains: Genetic diversity and structure of an endemic
newt species across the Pyrenees. PloS one, 13(8), e0200214.
Valtueña, F. J., Preston, C. D., & Kadereit, J. W. (2012) Phylogeography of a Tertiary
relict plant, Meconopsis cambrica (Papaveraceae), implies the existence of northern
refugia for a temperate herb. Molecular Ecology, 21(6), 1423–1437.
https://doi.org/10.1111/j.1365-294X.2012.05473.x
Van den Burg, M. P., Meirmans, P. G., Wagensveld, T. van, Kluskens, B., Madden, H.,
Welch, M. E., & Breeuwer, J. A. J. (2018) The Lesser Antillean Iguana (Iguana
delicatissima) on St. Eustatius: genetically depauperate and threatened by ongoing
hybridization. Journal of Heredity, 109:4, 426–437.
https://doi.org/10.1093/jhered/esy008
Van Dijk, P., & Bakx‐Schotman, T. B. (1997) Chloroplast DNA phylogeography and
cytotype geography in autopolyploid Plantago media. Molecular Ecology, 6(4),
345–352. https://doi.org/10.1046/j.1365-294X.1997.00199.x
Veith, M., Kosuch, J., & Vences, M. (2003) Climatic oscillations triggered post-
Messinian speciation of Western Palearctic brown frogs (Amphibia, Ranidae).
Molecular Phylogenetics and Evolution, 26(2), 310–327.
https://doi.org/10.1016/S1055-7903(02)00324-X
Vences, M., Hauswaldt S., Steinfartz S., Rupp, O., Goesmann, A., Künzel, S., Orozco-
terWengel, P., Vieites, D.R., Nieto-Roman, S., Haas, S., Laugsch, C., Gehara, M.,
Bruchmann, S., Pabijan, M., Ludewig, A.K., Rudert, D., Angelini, C., Borkin, L.J.,
Crochet, P.A., Crottini, A., Dubois, A., Ficetola, F., Galán, P., Geniez, P., Hachtel,
M., Jovanovic, O., Litvinchuk, S.N., Lymberakis, P., Ohler, A., & Smirnov, N.A.
CONSERVATION GENOMICS
166
(2013) Molecular Phylogenetics and Evolution Radically different
phylogeographies and patterns of genetic variation in two European brown frogs ,
genus Rana. Molecular Phylogenetics and Evolution, 68(3), 657–670.
https://doi.org/10.1016/j.ympev.2013.04.014
Vences, M., Sarasola-Puente, V., Sanchez, E., Amat, F., & Hauswaldt, J. S. (2017)
Diversity and distribution of deep mitochondrial lineages of the common frog, Rana
temporaria, in northern Spain. Salamandra, 53(1), 25–33.
Vieites, D.R. (2003) Temporal and spatial dynamics of a high mountain metapopulation
of Rana temporaria. Ph.D. Thesis. Universidade de Vigo.
Vieites, D. R., Peso, M., & Nieto Román, S. (2016) Bases para la conservacíon de las
ranas pardas, Rana pyrenaica and Rana temporaria, en el pirineo, Proyectos de
investigación en parques nacionales: 2011-2014.
Wang, Q. X., Zhao, L., Eaton, D. A. R., Li, D. Z., & Guo, Z. H. (2013) Identification of
SNP markers for inferring phylogeny in temperate bamboos (Poaceae:
Bambusoideae) using RAD sequencing. Molecular Ecology Resources, 13(5), 938–
945. https://doi.org/10.1111/1755-0998.12136
Wang, I. J. & Summers, K. (2010) Genetic structure is correlated with phenotypic
divergence rather than geographic isolation in the highly polymorphic strawberry
poison-dart frog. Molecular Ecology 19: 447-458.
Wang, I. J., & Bradburd, G.S. (2014) Isolation by environment. Molecular Ecology 23
(23): 5649-5662.
Weiss, S., & Ferrand, N. (2007) Phylogeohraphy of Southern European Refugia.
Welch, M. E., Colosimo, G., Pasachnik, S. A., Malone, C. L., Hilton, J., Long, J., Getz,
A. H., Alberts, A. C., & Gerber, G. P. (2017) Molecular variation and population
structure in critically endangered Turks and Caicos Rock Iguanas: identifying
intraspecific conservation units and revising subspecific taxonomy. Conservation
Genetics, 18(2), 479–493. https://doi.org/10.1007/s10592-016-0922-6
Wences, A. H., & Schatz, M. C. (2015) Metassembler: merging and optimizing de novo
genome assemblies. Genome Biology, 16(1), 207. https://doi.org/10.1186/s13059-
015-0764-4
Willis, S. C., Hollenbeck, C. M., Puritz, J. B., Gold, J. R., & Portnoy, D. S. (2017)
Haplotyping RAD loci : an efficient method to filter paralogs and account for
physical linkage. Molecular Ecology Resources, 17, 955–965.
https://doi.org/10.1111/1755-0998.12647
Wright, S. (1943) Isolation by Distance. Genetics 28(2):114-38.
Yan, F., Zhou, W., Zhao, H., Yuan, Z., Wang, Y., Jiang, K., Jin, J., Murphy, R. W., Che,
J.,& Yaping, Z. (2012) Geological events play a larger role than Pleistocene
climatic fluctuations in driving the genetic structure of Quasipaa boulengeri (Anura:
Dicroglossidae). Molecular Ecology, 22(4), 1120–1133.
https://doi.org/10.1111/mec.12153
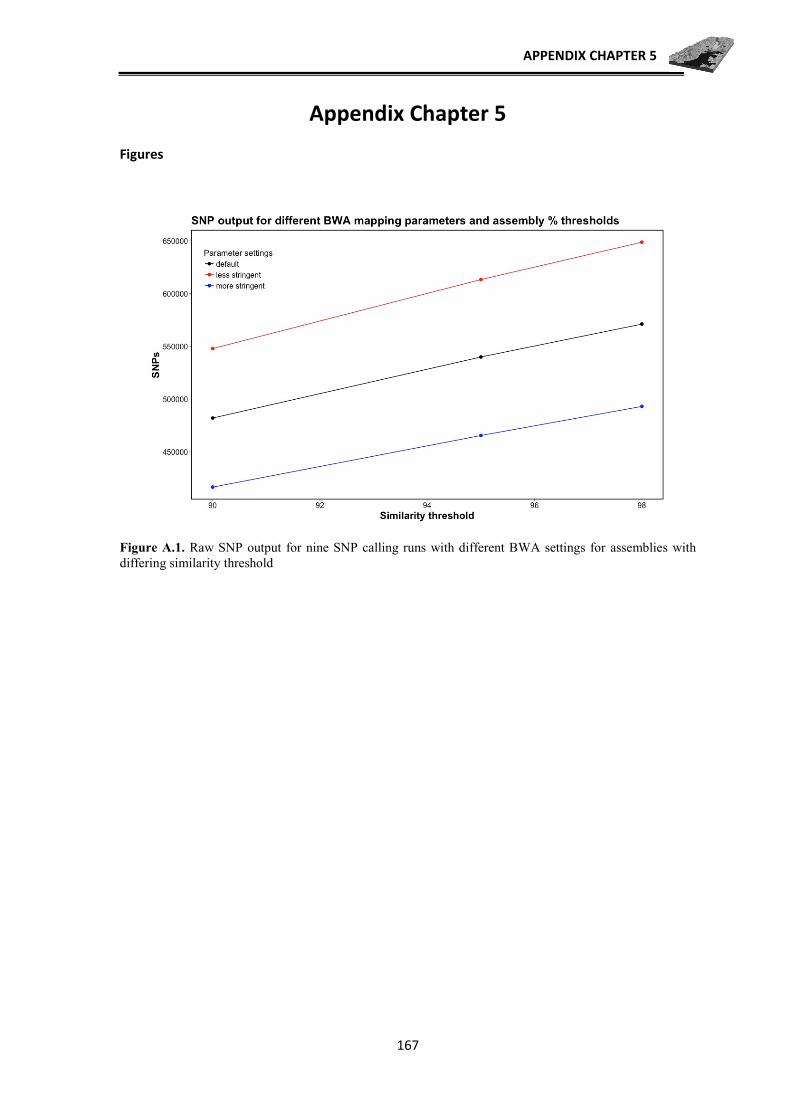
APPENDIX CHAPTER 5
167
Appendix Chapter 5
Figures
Figure A.1. Raw SNP output for nine SNP calling runs with different BWA settings for assemblies with
differing similarity threshold

CONSERVATION GENOMICS
168
Figure A.2. Number of genetic clusters as assessed by different software programs: adegenet (A), Structure
(B) and snmf (C).

APPENDIX CHAPTER 5
169
Figure A.3. snmf barplots showing individual probability assignments for numbers of populations (K=2-4)
within R. pyrenaica.

CONSERVATION GENOMICS
170
Figure A.4. Fit of prior and posterior data to scenarios with highest probability. Open and closed circles
represent simulated dataset from parameters generated using prior and posterior datasets. A) Run 1,
scenario 2; B) Run 1, scenario 3; C) Run 2, scenario 6. Large yellow datapoint represents R. pyrenaica
dataset.

APPENDIX CHAPTER 5
171
Tables
Table A.3. Life stage of SNPs sequenced samples of the Rana pyrenaica specimens.
Life Stage Count
Larvae 129
Juvenile 13
Subadult 7
Adult 19
Imago 1
Missing 9
Total 178
Table A.2. Parameter settings and SNP output from nine assembly runs. BWA Mapping parameters A, B,
O; Default: 1, 4, 6; Less stringent: 1, 3, 5; More stringent: 1, 5, 7.
Contig similarity
Mapping parameters
RAW SNPs Contigs
90%
Default 482085
Less stringent 547898 103954
More stringent 416645
95%
Default 539942
Less stringent 613256 114820
More stringent 465557
98%
Default 571084
Less stringent 646996 121067
More stringent 493107
Table A.3. Number of raw SNPs and remaining SNPs after filtering steps using the dDocent pipeline.
Raw SNPs and applied filters SNPs
TotalRawSNPs 646996
--max-missing 0.5 --mac 3
--minQ 30 --minDP 3
325694
--max-missing 0.9 --maf 0.03
--min-meanDP 20
72716
"AB > 0.3 & AB < 0.7 | AB < 0.01" 21514
"SAF / SAR > 100 & SRF / SRR > 100 | SAR / SAF
> 100 & SRR / SRF > 100"
16980
MQM / MQMR > 0.93 & MQM / MQMR < 1.03 5870
"PAIRED > 0.05 & PAIREDR > 0.05 & PAIREDR /
PAIRED
4961
QUAL / DP > 0.75 4875
<2 * mean depth 4682
Hardy Weinberg p>0.001 1628
rad_haplotyper filter 1140
Filtering control and duplicate sample discrepancies 763

172

DISCUSSION
173
DISCUSSION
This thesis is the result of a long-term project on Pyrenean amphibians, in which
we wanted to better understand different subjects related to the presence, diversification,
adaptation and threats of the amphibian species present in the Pyrenees. One of the least
known but very interesting species is the Pyrenean frog, Rana pyrenaica, an Endangered
endemism of the Pyrenees. We here wanted to generate data on several poorly known or
directly unknown aspects of the species to help management and conservation actions.
Our goal is that the results obtained in this project lay the foundations for the
management and conservation strategy of R. pyrenaica.
Previous works laid the foundations on determining its distribution range, but its
distribution limits were not clearly known (Serra-Cobo 1997, Vieites &Vences 2003).
This, together with the finding of new isolated populations in France, far from the main
distribution range (Duchateau et al. 2012), suggested that the species may have a wider
distribution being present in the Northern Slope of the Central Pyrenees in France. Also,
there was a lack of recent information on the current situation of the known populations,
and if the species persisted in all of them and their current population sizes. For these
reasons, we carried out a long-term and intense fieldwork program mainly between 2010
and 2014.
The newly generated distribution data for the species show that the area of
historical occupation is maintained to a great extent, although there are localities that have
disappeared. It is worth noting the practical disappearance of the species in the Aragón
River valley localities including Villanúa, where the population size is less than 5
individuals. The species was described from specimens from this area, and the reasons for
its local strong decline are not clear. In total, the species has disappeared from 30
historical locations, although it persists in the rest. As expected, we increased the
distribution range of the species in new five Spanish UTM 10x10km squares where it was
not known. In chapter 1 we present all the localities where the species is present but also
the large number of visited suitable localities (according to potential distribution models)
where it was not found. After intense fieldwork we have not found the species in other
places in France, neither other herpetologists did, so we can assume that the isolated
French localities are a relic of its past distribution or a recent introduction due their
genetic similarity to the Navarra populations (see below). We anticipate that, based on our
DISCUSSION
174
fine-scale predictive model, the species will appear in new localities within its range, a
small population can be located en few pools of remote streams.
Perhaps the most relevant factor in terms of conservation is the small population
size of most localities, as well as the apparent high degree of fragmentation of the range.
Although there are a number of localities with high densities for the species (although
much lower when compared to Rana temporaria), most of them harbor a small number of
breeding adults. Our relative estimate of the number of adults is the first and only attempt
so far to get an estimate of the total population size of the species. Other approaches, like
mark and recapture programs, can provide precise population size estimates, but they
could never be applied to such a large whole-range scale. Our approach, although time
consuming, provided a direct estimation of the number of reproductive females in a
section of each stream, and by extrapolation to the rest of the stream a rough estimate of
potential population sizes. Even if these numbers are slightly underestimating the total
population of the species, the observed densities are very low in direct comparison with
its sister taxon R. temporaria, which in a single lake can have more than a thousand
reproductive individuals. In any case, the estimated population size is far below the limits
to be considered an Endangered species by the IUCN.
Species distribution ranges are shaped by current and historical processes. The
existence of a gap within the distribution range has led to hypothesize that it could be a
consequence of a recent extinction or a legacy of Quaternary ice ages. During the
Pleistocene, the extent and intensity of glaciations was important in the Pyrenees, with
most of the main rivers frozen and harbouring long glaciers that extended way to the
south in the Spanish slope (Ehlers & Gibbard 2004). As a lotic species, R. pyrenaica was
likely severly affected, as well as many other cold vertebrates that are known to have
retreated to lower elevations (López-García et al. 2010). This distribution break lead to
hypothesize that, if it is a legacy from the ice ages, the actual range is the result of a
postglacial colonization from two independent refugia, which should be reflected in the
spatial genetics of the species. In chapter 4 we explored the mitochondrial filogeography
of the species based on the genetic variation observed in nearly complete mitochondrial
genomes. We integrated those data with hindcasted paleoclimatic models to reconstruct
the biogeographic and spatial genetic variation history of the species. The models suggest
that the gap existed already during the ice ages, but there was potential connectivity
between these two core areas across the lowlands and the pre-Pyrenees. This agrees with
DISCUSSION
175
the observed lack of spatial genetic structure in mtDNA. The isolated French populations
occur in an area that was not glaciated, hence they could be a relict of the past distribution
of the species; if so they should show genetic differences from other R. pyrenaica
populations, but this is not the case as they are rather similar to the Navarra populations.
Considering this, or they were connected somehow during the Pleistocene glacial and
interglacial periods to Navarra´s population, or they were recently introduced by humans
there.
Demographic reconstructions and analyses suggested a recent population
expansion towards higher elevations, although most of the current distribution range is
within unglaciated areas, and few places within the range of the last glacial maximum ice
were recolonized. This contrasts with R. temporaria who was able to recolonize high
elevations where it is abundant. Those data also show that the species has a very low
genetic intraspecific diversity, and that the effective population sizes have been low since
the Pleistocene. In fact, R. pyrenaica has less genetic variation in the entire mitochondrial
genome than in 150 pairs of R. temporaria mtDNA. In order to further explore this, and
to try to recover spatial genetic structure related to potential barriers, we generated a
nuclear genomic dataset to provide us with SNPs. This nuclear dataset allowed us to
reconstruct the fine-scale spatial genetic structure of the species, which now shows spatial
differences between some areas. Two main clusters were recovered, one constituted by
the Navarra and western Aragón populations plus the isolated populations in France, and
the other including the eastern range localities. However, within the eastern cluster, we
found further genetic structure recovering five small clusters delimited by big rivers and
steep slopes. We tested several divergence hypotheses with approximate Bayesian
statistics, which suggested that the main east-west divergence originated ca. 600000 y. a.,
during the Pleistocene.
Those data also allowed to explore the potential role as a barrier of big rivers and
steep slopes using a landscape genetics approximation. Our analyses favor an isolation by
barrier model, where these rivers and cliffs limit the distribution of the species. According
to the nuclear genomic data, those are not recent barriers but behaved like that already
during the Pleistocene, where those valleys harbored large glaciers that extended far south
covering the valleys (Ehlers & Gibbard 2004). The combination of landscape genetics,
population genetics and species distribution modelling, lead to generate a map of
potential conservation units for the species (Fig. 1).

DISCUSSION
176
Figure 1. Proposed conservation units for R. pyrenaica based on the data generated in this thesis.
Those units are: the isolated French populations, the western core area including
all Navarra populations to the Hecho Valley in Aragón; the populations between the
aragón River and the Gállego River in the Tena Valley; the populations between the
Gállego River and the Ara River (Yésero); the Bujaruelo Valley that is separated from the
previous one by the Tendeñera massif; and the Ordesa and Añisclo clusters, both of which
harbor populations within the Ordesa – Monte Perdido National park. It is very relevant
that two of the most divergent genetic clusters occur already within a National park,
which should help applying proper conservation actions to maintain their populations.
Together with the small and fragmented range, small populations sizes and lack of
genetic variation, there other factors that can affect the survival of this species. The
presence of large trout limits the presence of the frog, not being present in streams with
certain entity with fish. Tadpole survival analyses suggested that the type of habitat
greatly influences survival as well as the climate of each year. The highest mortality
observed occurs in streams with shallow pools with no or little forest cover, that can dry
out before metamorphosis or suffer intense floods during storms that kill all larvae. Many
of these pools are clogged with sediments, so the available water volume to tadpoles is

DISCUSSION
177
very limited. Our data suggest that in areas where the pools are deep, and have water all
the time, the survivorship is greater, serving as refugia against floods. Another related
factor is the impact of the summer storm floods that wash down the tadpoles and produce
rapid mass mortalities. There are places with less slope in which the flood effects are
small although in others they can be very significant. Global Change models indicate that
in the coming years we will experience winters with less snow and precipitation and dry
summers, with seasonal storms, which is not a very hopeful scenario for the species. To
remedy, in part, the problem the most effective management measure for the species right
now is to decouple the pools, by removing the sediments and increasing their depth. This
could ensure that there will be enough water for the tadpoles to complete the
metamorphosis and reinforce recruitment for the next few years, especially taking into
account predictions of prevalence of dry years in the future.
The presence of the fungus Batrachochytrium dendrobatidis throughout the
Pyrenean frog distribution area is very worrying. The area with the greatest presence of
the fungus is inside the National Park. Although the presence of the fungus has not been
detected in three zones, the number of samples available from these valleys is small, and
in the rest of the valleys the proportion of samples with negative BD is greater. This
fungus is killing amphibian populations throughout the world, although the effects on R.
pyrenaica are yet unknown. Our models suggest that we can expect a spread of the fungus
towards high elevation water bodies in the next few years if warming continues as
expected. It is necessary to monitor the affected populations to see the degree of
incidence, if it affects more species, and track its potential expansion. We have not
observed mass mortalities of adults or tadpoles, although chytridiomycosis perhaps is one
of the causes that explain the small population size observed in many localities. The
phenology of reproduction in brown frogs in the Pyrenees is directly related to snow thaw
in the breeding localities. Both the historical (Ballcells 1975) and more recent (Vieites
2003) show a clear correlation between the altitude and onset of breeding period in Rana
temporaria, which happens when snow melts. A similar pattern is expected for R.
pyrenaica. Earlier springs, will suppose higher incidence of chytrid infections when frogs
reproduce (Clare et al. 2016), as well as expansion of the Bd towards higher elevations.
Considering our findings, a series of management measures can be implemented
to help maintain frog populations. In situ, it would help to improve connectivity and
manage their habitat, for example through decoupling of sediments in stream pools. In

DISCUSSION
178
this sense, the maintenance and proper management of Ordesa's National park
populations, the only area with the maximum protection for the species, is critical. Some
measures can be taken to increase spatial connectivity and reinforce populations with the
incorporation of new individuals, like translocating genetically similar specimens (for
example larvae from desiccating pools) to places where they can develop and survive.
The reinforcement of populations with low density but with suitable habitat can be
effective to improve the situation of the species. For the moment we do not recommend
mixing individuals from different genetic clusters to increase genetic variation.
There are also arguments for an ex situ captive breeding program. The low genetic
diversity and low population density, as well as the presence of a lethal pathogen for
amphibians such as the chytrid, are important arguments to consider the reproduction in
captivity of the species in order to ensure its future survival. This strategy is already being
done in the Peninsula with other species, it would be compatible with in situ conservation,
and it would allow repopulating areas where the species has disappeared, reinforcing
populations and improving spatial connectivity.
Our data suggest that the current threat category of the species should be
maintained. Rana pyrenaica is cataloged by the IUCN as an Endangered species, in
category B1ab (II, III, IV), in which the limited extent of the geographical area of the
species is used as a classification criterion. The low density of breeding individuals, small
extent of occurrence and area of occupancy justify this category. However, given that the
Habitats Directive was made before the species was described, R. pyrenaica is not
included on it. Therefore, it is necessary that the Ministry for the Energetic Transition
(Former Ministry of Environment) requests the inclusion of this species in a new annex to
that European Community Directive. In this way, it would be given the degree of official
protection that it deserves as a priority species. In any case, both national (Spain and
France) and regional governments (Aragón and Navarra) should develop conservation
programs that need to be implemented as soon as possible to prevent the potential
extinction of the species in this century.
DISCUSSION
179
References
Balcells, E. (1975) Observaciones en el ciclo biológico de anfíbios de alta montaña y su
interés en la detección del início de la estación vegetativa. P. Centr. Pir. Biol. Exp.
7(2): 55-153
Clare, F. C., Halder, J. B., Daniel, O., Bielby, J., Semenov, M. A., Jombart, T., Loyau, A.,
Schmeller, D. S., Cunningham, A. A., Rowcliffe, M,. Garner, T. W. J., Bosch, J:, &
Fisher M. C. (2016). Climate forcing of an emerging pathogenic fungus across a
montane multi-host community. Philosophical Transactions of the Royal Society B,
371(1709), 20150454.
Duchateau, S., Berroneau, M., Cantegrel, L., Goyeneche, L., de Reinach Hirtzbach, J.,
Tillo, S. (2012) Decouverte de Rana pyrenaica Serra-Cobo, 1993 (Anura, Ranidae)
sur le versant nord des Pyrenees. Bulletin de la Societé Herpetologique de France,
142-143: 51-63.
Ehlers, J., Gibbard, P.L. (2004) Quaternary glaciations-extent and chronology: part I:
Europe (Vol. 2). Elsevier.
López-García, J.M., Blain, H.A., Allué, E., Bañuls, S., Bargalló, A., Martín, P., Morales,
J.I., Pedro, M., Rodríguez, A., Solé, A., & Oms, F. X. (2010) First fossil evidence
of an “interglacial refugium” in the Pyrenean region. Naturwissenschaften, 97(8):
753-761.
Serra-Cobo, J. (1997) Rana pyenaica Serra-Cobo, 1993. En: Pleguezuelos, J.M. (ed.),
Distribución y biogeografía de los anfibios y reptiles de España y Portugal pp.167-
168. Universidad de Granada-Asociación Herpetológica Española, Granada.
Vieites, D.R., Vences, M. (2003). Rana pirenaica – Rana pyrenaica. En: Enciclopedia
Virtual de los Vertebrados Españoles. Salvador, A., (ed). Museo Nacional de
Ciencias Naturales, Madrid. http://www.vertebradosibericos.org/
Vieites, D.R. (2003) Temporal and spatial dynamics of a high mountain metapopulation
of Rana temporaria. Ph.D. Thesis. Universidade de Vigo.

180

CONCLUSIONS
181
CONCLUSIONS
1.- The Pyrenean frog, Rana pyrenaica, is a narrow range endemic Pyrenean species, with
a conservation status of Endangered according to IUCN criteria.
2.-We increased the known distribution range of the species to 170 localities, distributed
within 30 10x10 UTM grid cells in Spain and 2 in France. Its estimated area of occupancy
would be less than 250 km2, and the extent of occurrence is less than 3100 km2.
3.- The species was not relocated in thirty historical localities after several visits during
four years, suggesting that it is likely extinct there.
4.- The estimated population size within the area of occupancy ranges between 13000 and
17000 adult frogs, which is low when compared to other brown frog species.
5.- The microhabitat where tadpoles develop, especially pools, is key to their survival,
which increases in streams with deep ponds and forest cover. Dry years that desiccate
pools or storm floods that cause tadpole downstream washing, can be alleviated by
managing the habitat and increasing pool depth.
6.- The chytrid fungus, Batrachochytrium dendrobatidis, is widespread across the range
of the species. Infection is rare above 2000 m a.s.l. but forecasts under future cliamtes of
chytrid optimum and suitable growths suggest that it will affect high elevation
populations as well in few decades. It is not known if Bd is causing massive die-offs in
this species.
7.- The mitogenomic genetic variation of the species, as well as its genetic diversity, are
very low, with 17 unique haplotypes detected. No phylogeographic structure was detected
with mtDNA. The reconstructed demography suggest a small effective population sizes
since the Pleistocene, and a plostglacial recolonization of higher elevations in the
Holocene.
8.- The distribution gap between the eastern and western range is confirmed, and
hindcasted paleoclimatic models suggest that it was already present in the Pleistocene, but
the two range core areas were likely connected through the lowlands and the pre-
Pyrenees.
CONCLUSIONS
182
9.- Radseq nuclear data (SNPs) support the existence of 2 to 6 genetic clusters. The
eastern and western populations split ca. 600000 years ago. Within the eastern range,
there are five small clusters that correspond to the areas of Añisclo, Ordea, Yésero and
East Tena Valley, Bujaruelo valley and west Tena valley. We propose these areas as
conservation units for management purposes.
10.- The origin of the observed genetic structure can be explained by river and steep slope
barriers that prevent gene flow and connectivity.
11.- Nuclear genomic data also suggest low genetic intraspecific diversity in the species.
12.- The integration of these data support maintaining the category of Endangered for the
species according to IUCN criteria.