modelling drug use: methods to quantify and understand
TRANSCRIPT

E M C D D A S C I E N T I F I C M O N O G R A P H S E R I E S No 6
Modelling drug use: methods to quantify and understand hidden processes
E.M.C.D.D.A. European Monitoring Crnlrc
for Drug* and Drug Addiction

E M C D D A S C I E N T I F I C M O N O G R A P H S É R I E S N o 6
Modelling drug use: methods to quantify and understand hidden processes
PLANNING GROUP Lucas Wiessing Christine Godfrey Richard Hartnoll Matthew Sutton Philip Young
SCIENTIFIC EDITORS Christine Godfrey Lucas Wiessing Richard Hartnoll
EDITORS Frances Sharp Rachel Neaman
E.M.C.D.D.A. European Monitoring Centre
(or 1 Uni·., and Drug Addiction

Detailed information on the EMCDDA and its work can be found on its website (http://www.emcdda.org)
A great deal of additional information on the European Union is available on the Internet. It can be accessed through the Europa server (http://europa.eu.int).
Cataloguing data can be found at the end of this publication.
Luxembourg: Office for Official Publications of the European Communities, 2001
ISBN 92-9168-056-7
© European Monitoring Centre for Drugs and Drug Addiction, 2001 Reproduction is authorised provided the source is acknowledged.
Printed in the United Kingdom

CONTENTS
FOREWORD Georges Estievenart
GENERAL INTRODUCTION Lucas Wiessing and Richard Hartnoll 11
PART I: WHAT IS MODELLING AND HOW CAN IT BE USED?
INTRODUCTION 17
CHAPTER 1 Epidemiology of drug use at macro level: indicators, models and policy-making Lucas Wiessing, Richard Hartnoll and Carla Rossi 19
CHAPTER 2 What are dynamic models and how can they be used? Christine Godfrey, Steve Parrott, Matthew Sutton, Vanessa Waby, Philip Young with Catherine Comiskey, Martin Frischer, Gordon Hay, Matthew Hickman, Johannes Jager, James Kahan, Ludwig Kraus, Roberto Mollica, Maarten Postma, Roland Simon, Colin Taylor and Lucas Wiessing 33
P A R T II: M O D E L L I N G D R U G U S E W I T H AVAILABLE DATA
INTRODUCTION 53
CHAPTER 3 Modelling drug misuse in Europe using geographic information systems Martin Frischer and Heath Heatlie 55
CHAPTER 4 Using available data with dynamic models to estimate the extent of problem drug use Carla Rossi 67
CHAPTER 5 Multiple-indicator models Roberto Mollica and Fabio Mariani 91
CONTENTS
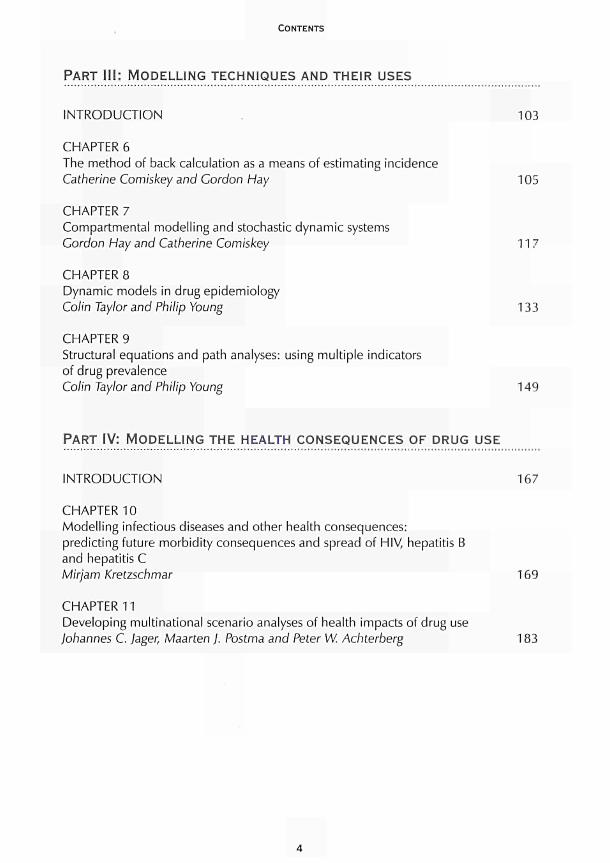
PART III: MODELLING TECHNIQUES AND THEIR USES
INTRODUCTION 103
CHAPTER 6 The method of back calculation as a means of estimating incidence Catherine Comiskey and Gordon Hay 105
CHAPTER 7 Compartimentai modelling and stochastic dynamic systems Gordon Hay and Catherine Comiskey 117
CHAPTER 8 Dynamic models in drug epidemiology Colin Taylor and Philip Young 133
CHAPTER 9 Structural equations and path analyses: using multiple indicators of drug prevalence Colin Taylor and Philip Young 149
PART IV: M O D E L L I N G T H E HEALTH CONSEQUENCES OF D R U G USE
INTRODUCTION 167
CHAPTER 10 Modelling infectious diseases and other health consequences: predicting future morbidity consequences and spread of HIV, hepatitis Β and hepatitis C Mirjam Kretzschmar 169
CHAPTER 11 Developing multinational scenario analyses of health impacts of drug use Johannes C. Jager, Maarten J. Postma and Peter W. Achterberg 183
CONTENTS
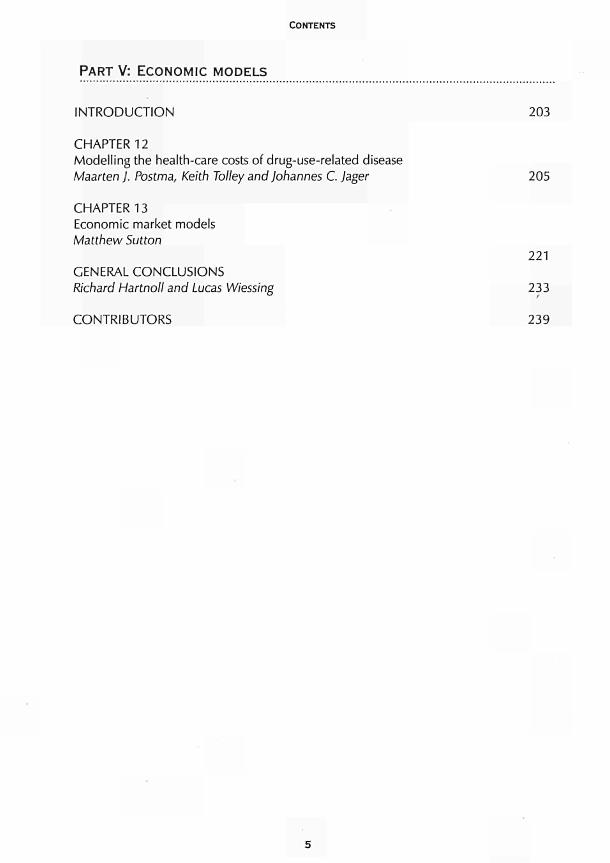
PART V: ECONOMIC MODELS
INTRODUCTION 203
CHAPTER 12 Modelling the health-care costs of drug-use-related disease Maarten J. Postma, Keith Tolley and Johannes C. Jager 205
CHAPTER 13 Economic market models Matthew Sutton
221 GENERAL CONCLUSIONS Richard Hartnoll and Lucas Wiessing 233
CONTRIBUTORS 239

FOREWORD
/
t is with great pleasure that I present this scientific monograph on the dynamic modelling of drug use. This publication provides a rich overview of the application of mathematical and statistical techniques in the field of drug use and it clearly
points to the further potential for using models for analysing and understanding drug data. The monograph reveals a growing interest on the European and international stages for adding such complementary quantitative approaches to the already wide array of tools in the social and life sciences. In a field that is quickly moving and changing appearance, within the no-less dynamic European context, I believe that dynamic modelling will help decision-makers and scientists to better understand hidden processes of drug use, epidemiological trends and their relationships, and thus will contribute to sound decision-making on policies and interventions.
This monograph reflects the efforts and expertise of many people. Above all, I want to thank the experts who committed their time and work to discuss the future of modelling drug use at two meetings in York, UK, in May and November 1997, and at a seminar in Lisbon, Portugal, in May 1998. In particular I would like to thank: Azzedine Boumghar Sandeep Chawla; Catherine Comiskey; Almudena De Silva Rivera; Martin Donoghoe Martin Frischer; Christine Godfrey; Richard Hartnoll; Gordon Hay; Mathew Hickman Johannes Jager; James Kahan; Ludwig Kraus; Mirjam Kretzschmar; Leif Lenke; Ed Leuw Roberto Mollica; Steve Parrot; Maarten Postma; Peter Reuter; Carla Rossi; Gianpaolo Scalia Tomba; Roland Simon; Matthew Sutton; Colin Taylor; Gernot Tragler; Lucas Wiessing; and Philip Young. Special thanks are due to: Vanessa Waby; Monica Blum; Sonia Collaço; and Manuela Gomes for their organisational help.
Georges Estievenart Executive Director
EMCDDA


GENERAL INTRODUCTION

G E N E R A L I N T R O D U C T I O N
Lucas Wiessing and Richard Hartnoll
One of the central tasks of the European Monitoring Centre for Drugs and Drug Addiction (EMCDDA) is to analyse and make sense of data on drug use and its consequences in the European Union. This is a basic prerequisite for developing rational interventions and policies in response to drug problems. In this monograph, the potential role of modelling in this task is explored. Modelling is a way to simplify and understand complex processes or structures and is usually performed using mathematical and statistical techniques. It can increase the value of available data, for example by analysing key dimensions of large or complicated data sets. Modelling can also be used to estimate missing data, to forecast trends and to carry out virtual experiments on the likely outcomes of different scenarios. Drug use and problems involve complex information, and modelling may also help to enhance the interpretation of available but scarce data and to increase the understanding of unobservable processes and relationships. It can serve especially to describe the dynamics of drug use at a more abstract or aggregated (local, national, international) level.
It is this high level of abstraction that may make modelling somewhat difficult to 'sell', especially to those professionals who are nearer to the individual drug user, as the results of modelling studies seldom relate to individual experiences. It is exactly this abstraction, however, that gives modelling a strength of its own, by detecting common features within available data sets or by clarifying the relationships between more abstract concepts such as 'law enforcement', 'price' and 'demand for drugs'. This often results in more generalisable knowledge than can be achieved through direct observation, although of course data collected through direct observation form an indispensable basis for building any useful models.
Several problems arise when trying to analyse data in a way that is relevant to policy questions. Where there is a large amount of data covering different aspects of a complex situation it is hard to identify and analyse the key dimensions and relationships within the data. In other situations, despite a lack of data, there are a number of alternative scenarios of how different policy options may affect drug problems, and policy decisions will anyway be taken even if not well grounded on empirical knowledge. Modelling techniques, such as scenario analysis, can then at least give some formal guidance.
To explore the potential for using modelling approaches in the drugs field, the EMCDDA organised two meetings of modellers and a larger seminar with other European drug experts during 1997 and 1998. This monograph contains a number of reviews of different aspects of modelling work in the drugs field written by the participating experts. It aims to provide a broad overview of quantitative approaches to understanding drug data as a knowledge base and a first step towards more focused modelling projects.
11
G E N E R A L I N T R O D U C T I O N
Structure of the monograph
Part I of the monograph is introductory in nature. In Chapter 1, the use of modelling is discussed for macro-level, rather than individually based, epidemiology, and models are presented as complementary tools to direct empirical observation of data or indicators. A distinction is made between statistical models that are inductive and rely heavily on data, and mathematical models that are more deductive and serve to explore potential relationships in a more theoretical manner. It is stressed that the interpretation of modelling results is not straightforward and should take careful account of the validity of the model and its assumptions. A number of broader issues are discussed that either can be investigated with models or should be taken into account before modelling can be useful, notably a common understanding of policy objectives and case definitions. In Chapter 2, an overview is provided of the discussions and conclusions of the modelling experts who contributed to the monograph. The chapter starts with an overview of different policy questions. Varying ways of categorising models are then discussed, and the chapter concludes with an account of discussions about different priorities for future developments in modelling across Europe based on the seminar held in Lisbon in May 1998.
Three examples are given in Part II of models that integrate available data sources or indicators at macro level to describe and predict the spread of problem drug use in time and space. In Chapter 3, a geographic model is presented designed to predict the spread of drug use at macro level from larger cities to smaller towns. It is based on a small number of parameters such as those used in models of the spread of infectious diseases (length of epidemic cycle, probability of infection as a function of distance) and linked to a geographic information system (GIS) to enable the results to be visualised in maps. In Chapter 4, the use of data on trends is discussed in an interactive way, allowing for interdependences between production processes of the observed data. The importance is stressed of using simple aggregate models for studying policy options rather than complex models of individual spread. An overview is provided of classical and new mathematical models that use routine data, and examples of their application, to estimate the extent of problem drug use in different countries. Chapter 5 follows a similar approach to estimate trends and interdependences in indicators based on routine drug data. The model is simultaneously validated by new data while estimating and forecasting variations in problemsand need for services over time. Illustrative examples are set out for describing how such a model could be used to assess the effectiveness and efficiency of new drug laws and therapeutic approaches.
The chapters in Part III take as their starting point available standard modelling techniques rather than available drug data sources or indicators. In Chapter 6, there is discussion of a method that has been very useful in generating predictions of AIDS and HIV, the back-calculation method. Based on discussions in the expert meetings held in York, it is proposed to use back calculation to estimate incidence or rates of initiation of heroin use from routine drug-treatment data. Knowing incidence rates would enable more direct evaluation of activities that aim to prevent drug users from starting to use heroin than is possible with prevalence estimates. In Chapter 7, compartmental models are discussed. As an example, a classical compartmental model for the spread of measles is
12
G E N E R A L I N T R O D U C T I O N
presented, illustrating the basic concepts of the infectious spread of a phenomenon which can be described quite satisfactorily with only a few parameters. The use of compartmental models is recommended for analysing drug careers, as has been done for several diseases, as well as for studying the processes that lead young people to initiate drug use. In Chapter 8, different dynamic models are discussed to estimate prevalence of drug use by describing the unobservable underlying processes. A series of basic issues are highlighted, among others the time frame and geographic boundaries of a prevalence-estimation exercise, the types and amounts of drugs used and the relation between definitions of drug use and the use of data sources. System-dynamic models are also presented, which have mostly been used to describe macro-scale drug phenomena and national policy scenarios, such as drug imports, drug treatments and law enforcement. They are relatively well suited for macro-level analysis as they model flows as aggregate measures rather than keeping track of individual persons or events. In Chapter 9, the use of factor analysis is discussed to confirm or explore underlying latent variables from observed variables. Four classes of observable variables are presented: frequency of use; amount used; amount of disruptive use (e.g. use at school or at work); and subjective perception of problems with use. It is argued that working with composite latent variables is often nearer to reality than interpreting use of each drug separately, as most drug users are poly-drug users and there are different and combined ways of using (e.g. moderate or heavy alcohol use in combination with other drugs). Structural equation modelsand linear structural relationship (LISREL) models that allow more flexibility but also introduce more complexity are also reviewed. The authors conclude that these models are difficult to manage and of lesser practical value, although they are potentially very useful to fit underlying theoretical concepts into models of drug prevalence.
Part IV centres around modelling health consequences of drug use rather than types of models. In Chapter 10, the main disease parameters needed to model infectious diseases in injecting drug users are discussed. Concepts from modelling studies are introduced, such as 'core groups' and 'mixing patterns', that have proved crucial to understanding the spread of disease and that might prove equally important in understanding the spread of drug use. A picture of the historical development of sexual-transmission models is given and several classic models of infectious diseases among drug users are reviewed. In Chapter 11, a structured overview of how to develop multinational scenario analyses is given together with an example for AIDS. In this approach, different disciplines, including mathematical modelling, are integrated to develop insight and a basic description of a problem, as well as to forecast the most probable future course and alternative scenarios including the estimated effect of interventions. It is argued that scenario analysis is well suited to analysing drug problems, as these are serious and important, complex, multinational, multidisciplinar/ and in need of (quantified) policy decisions. Scenario analyses are closely related to cost-effectiveness analyses for the allocation of health-care resources and both types of analysis can be performed jointly.
Part V of the monograph addresses economic aspects and modelling, starting with a focus on estimating drug-related health-care costs (Chapter 12). In general, a costing model aims to assess current and to project future health-care needs and financial requirements. The main step is to link an epidemiological sub-model which describes
13
G E N E R A L I N T R O D U C T I O N
the future development of disease to specifically formatted information on health-care needs (e.g. lifetime patient costs). The approach can be incidence- or prevalence-based. The former links estimated lifetime health-care needs and their costs (a staged-disease model of natural history is necessary) to epidemiological estimates of incidence in a certain year. This gives the potential future costs that can still be averted by prevention. The latter links current health-care needs and costs per patient (estimates of the prevalent patient mix are needed according to the stage of disease) to estimates of prevalence. This gives the health-care needs and costs of current disease with its immediate budgetary implications. It is recommended to extend the extensive existing work on HIV/AIDS to hepatitis as a first step, and subsequently to include other relevant drug-related diseases and consequences. In Chapter 13, the potential for modelling economic drug markets is described. It is argued that studies at individual level have the greatest potential, but the macro level is what policy-makers are most interested in and where most data are available. Studies at macro level (e.g. effect of enforcement), however, have not resulted in relevant outcomes so far, most probably due to a too-high level of aggregation. For a good markets study, it is recommended that sufficient resources be available for collecting high-quality data on consumption, prices and purities.
It is hoped that this monograph, and the newly formed European network of modellers behind it, will prove to be significant in stimulating the application of quantitative techniques to drug data. As good and comparable data on drugs are still rather scarce in Europe, progress is not expected to be very rapid. However, with increasing work on improving data sources and growing understanding of the basic knowledge needed for sound policy-making, mathematical and statistical modelling form an indispensable part of the set of tools that are available to understand and prevent the problems caused by the use of drugs.
14

WHAT IS MODELLING AND HOW CAN IT BE
USED?

INTRODUCTION
M odelling can be a valuable complementary tool for policy decisions and can be especially useful at levels of larger aggregation (national, international). It is often, however, not well understood, both because non-modellers may have
little understanding or interest in the mathematical presentations of modellers, and because modellers may have little understanding or interest in the practical consequences of their work and its relation to other disciplines, often being more interested in theoretical mathematical advances. Part I aims to discuss the potential for modelling in drug epidemiology in a manner accessible to non-modellers.
In Chapter 7, the authors discuss modelling approaches together with empirical data collection or in other words 'indicators' of drug use and problems. The-emphasis is on the use of modelling and indicators as complementary tools for developing evidence-based policy decisions. Working at the macro level adds further complexity as data quality is often low. This affects both the use of indicators, which permit only limited interpretation and need to be complemented with studies, and modelling, of which the validity of results often crucially depends on the quality of data. Some general aspects of modelling are discussed, such as the differences in interpreting results from data-driven and more theoretical models. Models and indicators can generate knowledge for decisionmaking, but some general problems remain. These include lack of clarity in case definition and in the objectives of drug policies, particularly the distinction between non-problem and problem drug use. Lack of knowledge of the basic mechanisms of the spread and progression of drug use and problem drug use hinders and challenges modelling. Legal and moral dimensions also strongly hamper the formulation of clear scientific theory in several ways, of which the most obvious is their influence on basic data availability and quality
Chapter 2 presents the discussions held at two meetings in York, UK, in 1997 and at a larger seminar in Lisbon, Portugal, in May 1998. A central issue when discussing the use of modelling is to start from the questions that should be answered rather than from the methods and techniques used. Questions by policy-makers tend to be simple and straightforward ('how many drug users are there?', 'what works?') but are not always easily answered. To be policy-relevant, questions and study objectives should in general relate to interventions or policy options, for example, what is the cost-effectiveness of one intervention compared to another? However, basic descriptive data must be available and may sometimes be generated with other types of models. Models have two broad types of application: the more quantitative estimations; and the more qualitative understanding of dynamic processes and relationships.
17

CHAPTER 1
EPIDEMIOLOGY OF DRUG USE AT MACRO LEVEL:
INDICATORS, MODELS AND POLICY-MAKING
Lucas Wiessing, Richard Hartnoll and Carla Rossi
Indicators and models may help in studying and understanding the epidemiology of drug use at macro level. Indicators of drug use are mostly based on available routine data and give indirect information on prevalence and trends over time. They can be used to cover large geographic areas with a limited budget; however, they are usually limited in quality and scope. Modelling is based on mathematical theory and can be used to integrate data from different indicators and other sources. It can be used to estimate prevalence and incidence or to increase understanding of drug processes by simulating experiments that are not possible in real life. The interpretation of modelling results, however, crucially depends on sufficient understanding of their basic assumptions and limitations. A whole continuum of modelling may exist, depending on the availability and use of data, from empirical analyses with high applicability to real life to theoretical hypothesis-generating exercises based on many assumptions.
Compared to other areas, drug-use epidemiology has still made little use of modelling, partly because good-quality data are still scarce, but work on improving indicators and other data is in progress. In the drugs field, the application of evidence-based approaches is still hampered by the lack of a common understanding of priorities for study and intervention, a lack of knowledge of mechanisms of spread and progression to drug problems, and legal and moral discourses. Indicators and models are complementary and increasingly important tools for epidemiology at macro level and may help to clarify some of these issues. Although quality of data and thus possible inferences are often much more limited than in in-depth empirical studies, macro-level assessments are necessary to guide national and international policy decisions.
One problem of drug epidemiology at national or international (macro) level is the sheer scale of activities undertaken. While data on drug use can be collected directly within a city or small region, no funding is usually available for massive studies covering large areas or a number of countries. Even if it were possible, setting up such a study would not be straightforward, given important background differences between countries and regions and the many stakeholders involved. Data available at macro level are often aggregated rather than individual-level data, based on routine sources, with all their limitations of analysis and interpretation. The question is therefore (how) can valid inferences still be made at macro level? This chapter briefly introduces indicators
19
WHAT IS MODELLING AND HOW CAN IT BE USED?
and modelling, two different but complementary tools that are receiving increasing attention for policy-making at macro level, and points to some still unresolved problems in the drugs field that interfere with such evidence-based approaches.
Indicators
Epidemiologists aim at describing the spread of disease in a population to provide evidence for public-health-oriented interventions and policies. Basic epidemiological measures are prevalence (all existing cases at a certain moment in time) and incidence (all newly occurring cases in a certain time period). To understand causal factors that lead to disease, a risk-factor analysis is usually performed by comparing individual cases with non-cases. In drug epidemiology it is usually difficult to determine prevalence and incidence, due to the 'hidden' nature of drug use. Normal sources of data such as medical services may be incomplete while standard tools such as household surveys may give biased results, due to social stigma and low social integration of heavy drug users. Working at macro level adds to these problems the difficulty of collecting comparable, quality data from a large number of sources and countries. As a result, additional methods are necessary to estimate or at least give some idea of prevalence, incidence and trends in drug use over time.
In domains like public health and the economy, the concept of indicators has been developed for large-scale data collection and fordifficult-to-measure phenomena. Rather than aiming at exact prevalence and incidence figures, indicators are based on available or routine data on disease, risk factors or consequences, and may provide indirect information on the exact magnitude of and trends in the disease. Public-health indicators rely on data sources such as mortality registers, population censuses, routine health-service records, epidemiological surveillance data, sample surveys or disease registers. The idea is to select from these sources those variables that fulfil certain quality requirements (such as validity, reliability, etc.) to measure health and changes in health (WHO, 1999).
In the field of drug use, work on indicators was started in London in the early 1970s, taken to European multi-city level by the Pompidou Group of the Council of Europe, further developed at European multinational level by the EMCDDA and is currently being implemented at global level by the United Nations International Drug Control Programme (UNDCP) (Hartnoll, 1991; Hartnoll et al., 1989; EMCDDA, 2000). There is not much choice in available data on drug use, and pragmatic reasons have played an important role in the choice of indicators. Currently five so-called 'key indicators' are being implemented in the European Union. These are 'general population and school surveys', 'estimates of problem drug use', 'data from drug-treatment services', 'drug-related deaths' and 'drug-related infections' (HIV and hepatitis Β and C). Standards have been developed and current work is focused on collecting the data and overcoming practical problems in data quality and comparability. Other indicators are at an earlier stage of development, such as indicators of social problemsand crime, data from hospital and emergency rooms and data from the youth and dance scenes.
20
CHAPTER 1
How to interpret drug-indicator data is not always straightforward. Sometimes it is simply assumed that the combined information from a set of indirect indicators reflects trends in the prevalence of problem drug use. However, indicator data may show fluctuations unrelated to prevalence, for example, due to changes in heroin supply or decreases in risk behaviour. Therefore indicators such as drug-treatment data, drug-related mortality and drug-related infectious diseases are also very important for their own sake and for evaluating interventions directed at each of the specific sub-populations at risk, rather than simply for following trends in 'problem drug use'.
Indicator data are often also of limited quality, due to their large coverage and routine nature, and it is dangerous to rely solely on indicators. Most routine data are not suitable for giving rapid insight into changing trends in problem use. For instance, the average latency time of five to eight years between first heroin use and first demand for treatment implies that treatment indicators are little suited to monitoring drug use in the non-treated population (Rossi, 1999; Wiessing et al., submitted). To interpret trends such as an increase in drug-related deaths at national level, and to take appropriate measures, indicators should be complemented and validated by smaller in-depth studies. Regularly repeated, small-scale studies are also important for gaining insight into possible (changing) causes or risk factors and confounding factors of the observed trends, as in such studies much more background information can usually be gathered. Routine indicators and one-off studies might together give a more complete picture of a phenomenon such as problem drug use. Indicators provide lower-quality data but at low costs and with high geographical coverage, while local studies provide high-quality data from a more limited (often high-risk) area.
Dynamic models
Dynamic modelling originated from biology and infectious-diseases epidemiology (Anderson and May, 1992). Many of its more recent advances were also made in the infectious-diseases field, especially within AIDS research (Pasqualucci et al., 1998). Over the last 15 years, modelling developments have closely paralleled the increasing knowledge of the etiology and transmission of AIDS and other sexually transmitted diseases. During that period, modelling studies moved from very simple AIDS data extrapolations to highly complex transmission models with large sets of parameters. Modelling and empirical research on AIDS have also mutually informed each other on important concepts. While patient characteristics pointed to the existence of specific groups at increased risk, such as homosexual men and injecting drug users, dynamic modelling clarified the potential role of core groups (with high-risk behaviour and/or assortative - 'like-with-like' - mixing patterns and consequently high infection levels) in the overall transmission dynamics within a susceptible population (Kretzschmar et al., 1996). While the natural history of HIV infection was becoming clearer from cohort studies, modelling provided a means of clarification and simplification (e.g. by determining a number of discrete disease stages) and a basis for policy decisions (e.g. on treatment needs per stage) (Longini et al., 1989). The effect of possibly important biological parameters which could not easily be studied empirically were often postulated
21
WHAT IS MODELLING AND HOW CAN IT BE USED?
from dynamic modelling work. For example, a simulation model could show that the very high level of infectiousness during the first weeks of HIV infection may determine most new infections in the population, putting the effectiveness of HIV screening as a prevention tool into question (Daar et al., 1991; Kretzschmar and Wiessing, 1998).
For epidemiology at macro level, dynamic modelling can be a valuable complementary tool to following trends in indicators and other direct data analysis. Besides the more usual inductive or empirical methods of data collection and interpretation, where new insights follow from observation, dynamic modelling may often be nearer to a deductive approach, where new insights follow from theory. The use of the outcomes in real-life situations is sometimes quite limited and validation of the model assumptions to data can be very difficult. However, the importance of most types of dynamic modelling lies in the generation of theory that may provide a framework for practical decisions.
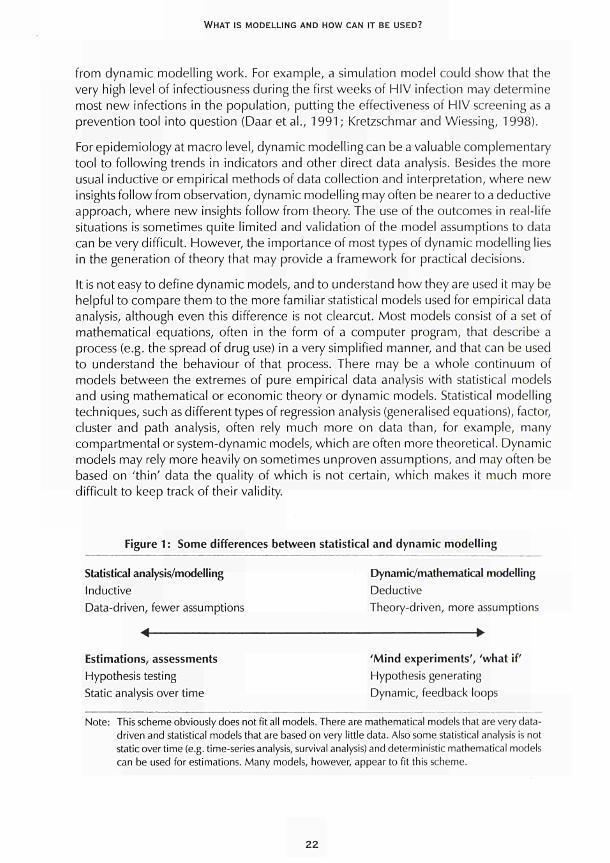
It is not easy to define dynamic models, and to understand how they are used it may be helpful to compare them to the more familiar statistical models used for empirical data analysis, although even this difference is not clearcut. Most models consist of a set of mathematical equations, often in the form of a computer program, that describe a process (e.g. the spread of drug use) in a very simplified manner, and that can be used to understand the behaviour of that process. There may be a whole continuum of models between the extremes of pure empirical data analysis with statistical models and using mathematical or economic theory or dynamic models. Statistical modelling techniques, such as different types of regression analysis (generalised equations), factor, cluster and path analysis, often rely much more on data than, for example, many compartmental or system-dynamic models, which are often more theoretical. Dynamic models may rely more heavily on sometimes unproven assumptions, and may often be based on 'thin' data the quality of which is not certain, which makes it much more difficult to keep track of their validity.
Figure 1: Some differences between statistical and dynamic modelling
Statistical analysis/modelling Dynamic/mathematical modelling Inductive Deductive Data-driven, fewer assumptions Theory-driven, more assumptions
<« ►
Estimations, assessments 'Mind experiments', 'what if' Hypothesis testing Hypothesis generating Static analysis over time Dynamic, feedback loops
Note: This scheme obviously does not fit all models. There are mathematical models that are very data-driven and statistical models that are based on very little data. Also some statistical analysis is not static over time (e.g. time-series analysis, survival analysis) and deterministic mathematical models can be used for estimations. Many models, however, appear to fit this scheme.
22

CHAPTER 1
Both extremes of the continuum are useful in, for example, drug epidemiology, but their use may be very different. Rigorous statistical data analysis, such as regression analysis based on individual data, is mostly not possible at macro level, but statistical models can often still suggest useful answers when there are gaps in data of a certain type. This can, for example, happen by imputing prevalence data (extra- or interpolation) from other moments in time or locations where more data are available, or by using other data sources and, if possible, adjusting for potential biases. This makes it possible to generate a result where no data were available, although again the interpretation must be undertaken with care. There is a clear need for this type of modelling at macro level, where good data often do not exist, at least in the drugs field.
At the other end of the continuum, dynamic models can help in understanding a phenomenon, even if almost totally based on assumptions and with little or no data input. If the model is assumed to describe a process in real life sufficiently well, the behaviour of this process can be studied under different circumstances by varying parameter values and seeing the variation in outcomes. This semi-experimental situation is sometimes called 'what if' modelling, in other words, the question is what could happen under what circumstances if it is assumed that the process under study is well captured by the model. Modelling can thus provide a tool to simulate experiments that are not possible in real life for practical or ethical reasons.
It is important to understand the differences between the various types of modelling and to interpret the results accordingly, either as 'scientific facts', 'theoretical hypotheses' or something in between, depending on the certainty of parameters and the validity of the basic model chosen. Modelling results may involve many unproven assumptions, may be based on data of unknown quality and the true scope for bias may be much larger than, for example, suggested by calculated confidence intervals. To understand the results and correctly interpret them it is indispensable to have at least some understanding of the assumptions behind the model. The limitations of the model should always be clearly stated and presented together with the results. However, even for specialists this is often difficult, and non-specialists may have no way of distinguishing valid results with important direct implications from academically interesting theory with little direct practical meaning. To prevent this type of problem it is important for modellers and other scientists to work together in multi-disciplinary teams. This is, however, only possible if the different disciplines have some understanding of each other's approaches and are prepared to acquire at least some knowledge of the other field. If such a collaboration exists, the modeller may generate 'meaning' from scarce data, and the topic expert (e.g. epidemiologist) can help interpret the validity of the results against his or her knowledge of real-life situations and data-quality issues.
Within dynamic modelling different approaches are again possible. The starting point is often a relatively simple model that reflects the main elements and their relationships. However, the results are often criticised for not taking into account a possibly important variable. This may then subsequently be incorporated into the model and the model becomes more complex. This process may repeat itself resulting in highly complex models. Although these may resemble reality better than the simple models, it is often hard to keep track of what exactly happens and in practice they may not lead to better
23
WHAT IS MODELLING AND HOW CAN IT BE USED?
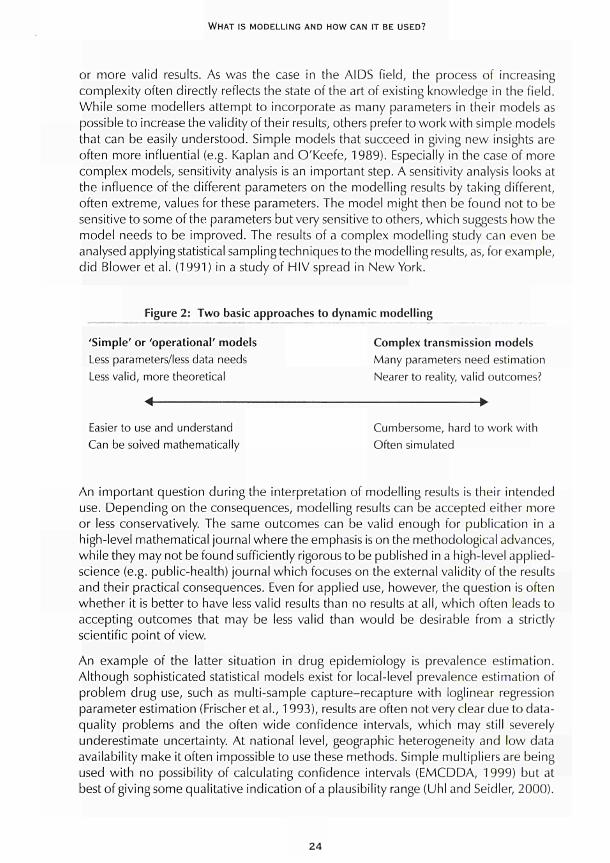
or more valid results. As was the case in the AIDS field, the process of increasing complexity often directly reflects the state of the art of existing knowledge in the field. While some modellers attempt to incorporate as many parameters in their models as possible to increase the validity of their results, others prefer to work with simple models that can be easily understood. Simple models that succeed in giving new insights are often more influential (e.g. Kaplan and O'Keefe, 1989). Especially in the case of more complex models, sensitivity analysis is an important step. A sensitivity analysis looks at the influence of the different parameters on the modelling results by taking different, often extreme, values for these parameters. The model might then be found not to be sensitive to some of the parameters but very sensitive to others, which suggests how the model needs to be improved. The results of a complex modelling study can even be analysed applying statistical sampling techniques to the modelling results, as, for example, did Blower et al. (1991 ) in a study of HIV spread in New York.
Figure 2: Two basic approaches to dynamic modelling
'Simple' or Operational' models Less parameters/less data needs Less valid, more theoretical
Complex transmission models Many parameters need estimation Nearer to reality, valid outcomes?
Easier to use and understand Can be soived mathematically
Cumbersome, hard to work with Often simulated
An important question during the interpretation of modelling results is their intended use. Depending on the consequences, modelling results can be accepted either more or less conservatively. The same outcomes can be valid enough for publication in a high-level mathematical journal where the emphasis is on the methodological advances, while they may not be found sufficiently rigorous to be published in a high-level applied-science (e.g. public-health) journal which focuses on the external validity of the results and their practical consequences. Even for applied use, however, the question is often whether it is better to have less valid results than no results at all, which often leads to accepting outcomes that may be less valid than would be desirable from a strictly scientific point of view.
An example of the latter situation in drug epidemiology is prevalence estimation. Although sophisticated statistical models exist for local-level prevalence estimation of problem drug use, such as multi-sample capture-recapture with loglinear regression parameter estimation (Frischer et al., 1993), results are often not very clear due to data-quality problems and the often wide confidence intervals, which may still severely underestimate uncertainty. At national level, geographic heterogeneity and low data availability make it often impossible to use these methods. Simple multipliers are being used with no possibility of calculating confidence intervals (EMCDDA, 1999) but at best of giving some qualitative indication of a plausibility range (Uhi and Seidler, 2000).
24
CHAPTER 1
Still it is very important to have prevalence estimates at local and national level, which form a basis for a large variety of policy choices, and these low-quality estimates are in general accepted as the state of the art. Other examples can be found in forecasts of future developments and in scenario analyses, which by definition are unreliable and may prove wrong in time, but are still of such high value for policy-makers that they are widely used.
Policy needs and problems using indicators and models
Epidemiology is mostly an applied or problem-driven science, where much emphasis is placed on the policy relevance of new knowledge and studies. It may therefore be useful here to discuss briefly what are the possible needs of policy-makers. This is especially important for epidemiology at macro level, where the link with the needs of individual drug users may be much less obvious than, for instance, in specific treatment or outreach settings.
The needs of a policy-maker may seem remarkably clear in general terms: to describe and understand a problem and follow trends over time; to design proper interventions; and to evaluate the results of interventions. In the case of drug use and its consequences, indicators and models may contribute to both a description and an understanding of the problem, while indicators are specifically suited to follow trends over time. Models may even help in designing and choosing proper interventions, for example, by assessing the cost-effectiveness of alternative options, although the basic knowledge of 'what works' (efficacy) needs to be assessed in carefully designed studies. Reality, however, seems harder than practice, and there is still little consensus among and between scientists, service providers and policy-makers about the most effective and relevant interventions, with opinions ranging from a total 'war on drugs' at one extreme to complete legalisation on the other. What is it that makes the drugs field seem so much more complex than would initially be assumed? The answer may partly be purely scientific/methodological, and partly lie in the interplay between science and policy. Some of the more methodological problems may also be a consequence of working at a high level of aggregation. Other problems relate to the lack of a clear case definition of a 'drug user', to lack of knowledge of the basic mechanisms of the spread of drug use, and lack of knowledge of progression into drug problems.
First, using indicators at a macro scale, it is often not possible to use a clear case definition of addiction or dependence such as the Diagnostic and statistical manual (DSM) IV, or to use disease codes such as the international classification of diseases (ICD) due to the quality and limitations of routine data. Indicators such as survey data may give good-quality information on lighter forms of drug use, but usually not on heavier patterns of drug use which cause most drug problems. Modelling techniques for prevalence estimation of problem drug use, such as capture-recapture, often rely on non-specialised data sources which have little information on drug use and thus do not permit using clear case definitions. A pragmatic solution may in that case be found by defining problem drug users as drug users that are in contact or in need of contact with health or social services, which, for example, in most European countries is mostly limited to
25
WHAT IS MODELLING AND HOW CAN IT BE USED?
frequent heroin or amphetamine users. However, it is hard if not impossible to obtain more detail on the prevalence and patterns of problem drug use (e.g. breakdowns by type of drug) from these techniques and it is important that they are complemented by (expensive) local studies based on, for example, out-of-treatment recruitment of drug users.
Second, much more knowledge is needed of the basic mechanisms of the spread of drug use and problem drug use or addiction. As long as no general consensus exists among scientists on what risk factors are the most influential, from the wide range of social, psychosocial and biological factors identified in different studies (Rhodes et al., 1999), no good interventions can be expected. This lack of common understanding of a basic mechanism for the epidemiology of drug use also makes it difficult to reach consensus on results from modelling studies, contrary to more established fields as, for example, infectious-diseases epidemiology or the economy. Models of spread are often based on weak assumptions but can help to suggest the underlying processes. For instance, there is evidence that drug use often spreads as an infectious disease, in other words that the rate of new cases depends on the number of existing cases and the number of susceptible cases (Mackintosh and Stewart, 1979; De Alarcón, 1969). This may be understood in terms of each new drug user having a constant rate of initiating others. However, the role of supply factors (price of drugs, availability) and, unlike in the case of infectious diseases, the intentional marketing activities of drug dealers, are not well understood. Also, infectiousness (the probability of 'infecting' another person) may not be as constant as in a biological context and may depend on a range of unknown social factors. Unlike an infectious agent, the spread of drug use may be influenced by mass media, for example through developments in the music and fashion industries which may have contributed to the recent spread of ecstasy and other new synthetic drugs.
Third, more work is still needed to clarify the natural history of progression to problem drug use. It may be less important to study what leads young people to experiment with illegal drugs, as this mechanism seems no different from experimenting with alcohol or tobacco at earlier ages (Kandel and Faust, 1975; Bauman and Phongsavan, 1999). It is, however, crucial to understand why some young people progress into frequent use of heroin while others never go beyond experimenting with cannabis. It may well be that this is mainly due to social factors, such as 'meeting the wrong friends'. It may also be that some people are genetically prone to addiction (Nestler, 2000) or continue using in order to 'self-medicate' negative moods and mental problems (Leshner, 1999). An infectious-disease type of modelling might again help in predicting the spread of heavy use and, for example, in estimating the cost-effectiveness of interventions. Concepts could then be used from infectious-diseases epidemiology, such as 'infecteds', 'susceptibles', 'basic reproductive rate', 'herd immunity'. Key issues would be to distinguish 'susceptibles' from 'immunes' or to find a type of 'vaccination' that could turn 'susceptibles' into 'immunes', for example by detecting and treating depressive symptoms in young adults. If the epidemiology of illegal drug use would more resemble chronic-diseases epidemiology, models would focus on demographic or social developments that would lead to higher or lower prevalence/incidence of the predisposing genetic or mental-health factors in the general population. It would then
26
CHAPTER 1
be important to identify those with a genetic or mental risk profile at an early stage and to find ways to protect these persons from addiction to any substance or behaviour (including, e.g., gambling) later on in life.
Other problems in the study of drug use may be less purely scientific or methodological but rather illustrate the complex interface between science and policy. Possibly the clearest example is the illegal status of drug use. There are few epidemiological areas in which disease is viewed as illegal. This legal and often moral aspect complicates public-health-oriented work on drug problems in different ways.
First, methodologically sound studies on interventions are very difficult to set up, not only due to the difficult type and illegal habit of patients, but also because some of the potential interventions themselves are illegal. This complicates collecting hard evidence on policy options and the debate often continues in a vicious circle. This is obvious regarding a controversial intervention such as controlled heroin provision (Van den Brink et al., 1999; Uchtenhagen et al., 1999), but even substitution treatment, which has been well accepted in the scientific field (Des Jaríais and Hubbard, 1999), cannot always be provided easily everywhere. Patients are often treated within law-enforcement environments (prisons), which do not always allow a confidential doctor-patient relationship. Patients may also be in and out of treatment and prisons, continuously interrupting therapy, making positive effects difficult to sustain and thereby increasing the risk of adverse consequences such as HIV infection or overdose (Metzger et al., 1998; Turnbull, 1997; Wiessing et al., 1996; van Ameijden et al., 1999). Moreover, the legal restrictions and stigma surrounding drug use in most countries lead to difficulties in obtaining reliable routine data or indicators (Hughes and Rieche, 1995). Drug users will try to keep away from any registries as much as possible, and even doctors might give a drug-related death a less stigmatised code on the death certificate in order to protect the relatives of the deceased. Legal restrictions might even affect scientific work in a more general manner, by influencing funding priorities or pressuring scientists to select 'politically correct' results.
Second, the legal and moral perspectives often lead to much confusion about case definition in policy debates. Rather than talking about 'illegal drug use' in general, as is often done, it is important clearly to distinguish problem drug use from non-problem drug use. Even if in many countries (usually non-problem) cannabis use does not differ from (often problem) heroin use in legal terms, public-health consequences are vastly different. Many forms of drug use, even if illegal, do not lead to more problems for the individual or society than moderate smoking or alcohol use (Nicholson et al., 1999; Marwick, 1999). It is problem drug use, such as injecting or frequent use of heroin, crack and other hard drugs, that incurs most costs to society in the form of infections, deaths, addiction and crime (EMCDDA, 2000; Amaro, 1999). A policy-maker in general tries to minimise the social costs of drug use and these should therefore be directly targeted by interventions. Drug policies that do not distinguish between different modes of drug use may not be efficient and may even be counter-productive. Differentiating between lighter and heavier forms of drug use in policy objectives, using case definitions based on clear diagnostic rather than legal criteria, could greatly help progress in the drugs field.
27
WHAT IS MODELLING AND HOW CAN IT BE USED?
Third, the lack of clarity in the definition of the problem and the lack of (possibilities to gather) scientific evidence have resulted in a lack of common objectives to reduce drug problems. While no one discusses whether HIV infection or cancer should be prevented or not, this consensus does not exist with regard to drug use. It is important to reach evidence-based agreement on general objectives and on an optimal balance of intervention priorities to reach these objectives (Hartnoll, 1990). Some scientists believe that reducing all drug use (if at all possible by law enforcement) will lead to less problem use as well, while others think that this is not possible and that law enforcement actually increases drug problems, having no or only small effects on the prevalence of non-problem use (Uhi, 2000). Both approaches, however, imply totally different interventions, legal and preventive in one case and public-health-oriented in the other. It is interesting to note that usually little effect is found of changes in law enforcement on levels of problem drug use (MacCoun and Reuter, 1997; Lenke et al., 1996), and that countries with totally different policies may show very similar prevalence (EMCDDA, 2000). It may therefore be more useful to aim at preventing problem drug use and its secondary consequences, such as overdose and HIV transmission (Stimson, 1996; Wodak, 1995), as do most policies regarding alcohol abuse, rather than to attempt to eliminate all forms of drug use altogether.
Where are we?
As discussed above, five key indicators are currently being implemented in the European Union and others are still in development, but data quality and comparability issues have not yet been solved and data collection has only recently started. Many models of drug use exist but consensus on a basic mechanism to monitor the spread and progression of problem drug use is still lacking, while legal issues around drug use severely complicate the data collection and monitoring of problem drug use, and the development and evaluation of effective interventions.
Improving the quality of problem drug-use monitoring is of great importance. While non-problem use can be followed through general population and school surveys, prevalence estimation of problem use with modelling approaches is still in its infancy. Prevalence and incidence are fundamental measures of the spread of problem drug use and the effects of policy interventions. While prevalence among sub-groups can provide information on exit rates from the drug-user population (e.g. through treatment), detailed information on incidence is important for assessing entry rates and evaluating preventive measures.
At present, data quality does not permit the precise measurement of prevalence and incidence in most countries, even if important methodological advances are being made. It is necessary to obtain more commitment for quality data collection for such statistical estimation modelling as well as for developing dynamic models to investigate policy choices. Legal barriers (data-protection laws) have to be removed to facilitate scientific work on all potentially useful interventions, but also to improve data availability.
28
CHAPTER 1
More multi-disciplinary work is necessary to clarify and describe the spread of problem drug use in space and time. Economic models need to be further developed to better estimate the costs to society of different consequences of drug use and to estimate the cost-effectiveness of policy options. The role of supply factors (drug-markets research) and how these interact with demand in general, but especially with progression to problem drug use, need to be clarified. Understanding of the spread of drug-related infectious diseases is more advanced than other areas of drug use. While practical work is needed on HIV prevention (such as increasing the coverage of interventions) prevention of hepatitis C infection still needs to be improved by better understanding the transmission among injecting drug users. As effectiveness of interventions cannot easily be assessed at macro level, the monitoring of disease should at least include monitoring coverage of the target population by those interventions (Habicht et al., 1999).
In conclusion, indicators and models form important and complementary tools for the epidemiology of drug use at macro level. Although quality of data and thus possible inferences are much weaker than in local studies, macro-level assessments are indispensable for guiding policy decisions. However, interpretation of results at macro level should be even more careful than in general, which conflicts with the fact that policy decisions have to be taken. There is still a range of problems specific to the field of drugs that needs to be solved before effective measures can be widely adopted.
Acknowledgements
This chapter benefited from the EU-funded European network to develop policy-relevant models and socio-economic analyses of drug use, consequences and interventions (TSER/DGXII project ERB 4141 PL980030). The authors are grateful for the critical and constructive comments of Dr Alfred Uhi.
References
Amaro, H. (1999). 'An expensive policy: the impact of inadequate funding for substance abuse treatment'. (Editorial). American Journal of Public Health 89: 657-9.
Anderson, R. M., May, R. M. (1992). Infectious diseases of humans - dynamics and control. Oxford: Oxford University Press.
Bauman, Α., Phongsavan, R (1999). 'Epidemiology of substance abuse in adolescence: prevalence, trends and policy implications'. Drug and Alcohol Dependence 55: 187-207.
Blower, S. M., Hartel, D., Dowlatabadi, H., Anderson, R. M., May, R. M. (1991 ). 'Drugs, sex and HIV: a mathematical model for New York City'. Philosophical Transactions of the Royal Society of London. Series B: Biological Sciences 331 (1260): 171-87.
Daar, E. S., Moudgil, T., Meyer, R. D., Ho, D. D. (1991). 'Transient high levels of viremia in patients with primary human immunodeficiency virus type 1 infection'. The New England Journal of Medicine 324 (14): 961-4.
29
WHAT IS MODELLING AND HOW CAN IT BE USED?
De Alarcón, R. (1969). 'The spread of heroin abuse in a community'. Bulletin on Narcotics 21 :
1722.
Des Jarlais, D. C , Hubbard, R. (1999). 'Treatment for drug dependence'. Proceedings of the
Association of American Physicians 111:12630.
European Monitoring Centre for Drugs and Drug Addiction (EMCDDA) (2000). Annual report on
the state of the drugs problem in the European Union. Lisbon: European Monitoring Centre for
Drugsand Drug Addiction.
European Monitoring Centre for Drugs and Drug Addiction (EMCDDA) (1999). 'Study to obtain
comparable national estimates of problem drug use prevalence for all EU Member States'.
(EMCDDA report CT.97.ER04). Lisbon: European Monitoring Centre for Drugs and Drug Addiction.
Frischer, M., Leyland, Α., Cormack, R., Goldberg, D. J., Bloor, M., Green, S. T, Taylor, Α., Covell,
R., McKeganey, N., Platt, S. (1993). 'Estimating the population prevalence of injecting drug use
and infection with human immunodeficiency virus among injecting drug users in Glasgow,
Scotland'. American Journal of Epidemiology 138 (3): 1 7081.
Habicht, J. P., Victora, C. G., Vaughan, J. R (1999). 'Evaluation designs for adequacy, plausibility
and probability of public health programme performance and impact'. International Journal of
Epidemiology 2&: 1018.
Hartnoll, R. (1991 ). 'Epidemiological approaches to drug misuse in Britain'. Journal of Addictive
Diseases 11 (1): 3345.
Hartnoll, R. (1990). 'A framework for evaluating activities to reduce the demand for drugs in
Europe'. Caceta Sanitaria 4 (21): 23951.
Hartnoll, R., Avico, U., Ingold, F. R., Lange, K., Lenke, L., O'Hare, Α., de RoijMotshagen, Α.
(1989). 'A multicity study of drug misuse in Europe'. Bulletin on Narcotics 4 1 : 12, 327.
Hughes, R H., Rieche, O. (1995). 'Heroin epidemics revisited'. Epidemiologic Reviews 17: 66
73.
Kandel, D., Faust, R. (1975). 'Sequence and stages in patterns of adolescent drug use'. Archives
of General Psychiatry 32: 92332.
Kaplan, E. H., O'Keefe, E. (1989). 'Needles that kill: modelling HIV transmission via shared drug
injection equipment in shooting galleries'. Review of Infectious Diseases 11 : 28998.
Kretzschmar, M., Wiessing, L. G. (1998). 'Modelling the spread of HIV in social networks of
injecting drug users'. AIDS 12 (7): 80111.
Kretzschmar, M., van Duynhoven, Y. T., Severijnen, A. J. (1996). 'Modelling prevention strategies
for gonorrhea and chlamydia using stochastic network simulations'. American Journal of
Epidemiology'Ì 44 (3): 30617
Lenke, L., Olsson, O. (1996). 'Sweden: zero tolerance wins the argument?', in Dorn, N., Jepsen,
J., Savona, E. (eds) European drug policies and enforcement. London: Macmillan Press.
Leshner, A. I. (1999). 'Sciencebased views of drug addiction and its treatment'. Journal of the
American Medical Association 282: 131416.
Longini, I. M. Jr, Clark, W. S., Byers, R. H., Ward, J. W., Darrow, W. W., Lemp, G. F., Hethcote, H.
W. (1989). 'Statistical analysis of the stages of HIV infection using a Markov model'. Statistics in
Medicine 8 (7): 83143.
30
CHAPTER I
MacCoun, R., Reuter, R (1997). 'Interpreting Dutch cannabis policy: reasoning by analogy in the
legalization debate'. Science 278: 4752.
Mackintosh, D. R., Stewart, G. T. (1979). 'A mathematical model of a heroin epidemic: implications
for control policies'. Journal of Epidemiology and Community Health 33: 299304.
Marwick, C. (1999). 'Illicit drug users not idle; report says 70 % go to work'. Journal of the
American Medical Association 282: 13201.
Metzger, D. S., Navaline, H., Woody, G. E. (1998). 'Drug abuse treatment as AIDS prevention'.
Public Health Reports 113 (suppl. 1): 97106.
Nestler, E. J. (2000). 'Genes and addiction'. Nature Genetics 26: 27781.
Nicholson, T, White, J., Duncan, D. F. (1999). 'A survey of adult recreational drug use via the
world wide web: the Drugnet study'. Journal of Psychoactive Drugs 31 : 41522.
Pasqualucci, C , Ravà, L., Rossi, C , Schinaia, C. (1998). 'Estimating the size of the HIV/AIDS
epidemic: complementary use of the Empirical Bayesian BackCalculation and the MoverStayer
model for gathering the largest amount of information'. Simulation 71 : 21327.
Rhodes, T., Lilly, R., Fernández, C , Giorgino, E., Kemmesis, U. E., Ossebaard, H. C , Lalam, N.,
Faasen, I., Spannow, K. E. (1999). 'Risk factors associated with drug use: the importance of "risk
environment"'. (EMCDDA report CT.97.ER12). Lisbon: European Monitoring Centre for Drugs
and Drug Addiction.
Rossi, C. (1999). 'Monitoring drug control strategies: hidden phenomena, observable events,
observable times'. International Journal of Drug Policy 10: 13144.
Stimson, G. V. (1996). 'Has the United Kingdom averted an epidemic of HIV1 infection among
drug injectors?'Add/ct/on 91 (8): 10858.
Turnbull, R (1997). 'Prisons. Vancouver conference review'. AIDS Care 9: 925.
Uchtenhagen, Α., DoblerMikola, Α., Steffen, T., Gutzwiller, F., Blättler, R., Pfeifer, S. (1999).
Prescription of narcotics for heroin addicts. Main results of the Swiss National Cohort Study. Basel:
Karger.
Uhi, Α. (2000). 'Nonproblematic use problematic use: a paradox', in Springer, Α., Uhi, A. (eds)
Illicit drugs: patterns of use patterns of response. Proceedings of the 10th Annual European
Society on Social Drug Research (ESSD) Conference on drug use and drug policy in Europe.
Innsbruck: Studienverlag.
Uhi, Α., Seidler, D. (2000). Prevalence estimate of problematic opiate consumption in Austria.
Vienna: LBISucht.
van Ameijden, E. J., Langendam, M. W , Coutinho, R. Α. (1999). 'Doseeffect relationship between
overdose mortality and prescribed methadone dosage in lowthreshold maintenance programs'.
Addictive Behaviors 24: 55963.
van den Brink, W , Hendriks, V M., van Ree, J. M. (1999). 'Medical coprescription of heroin to
chronic, treatmentresistant methadone patients in the Netherlands'. Journal of Drug Issues 29:
587608.
Wiessing, L. G., Calvan, M. G., Ravà, L., van Ameijden, E., Buster, M., Hickman, M., Ribeiro, J.,
Rossi, C. (submitted). 'Analysis of the latency period from onset of heroin use to first treatment;
comparisons among four European sites, possible implications for treatment services and for
understanding the natural history of problematic heroin use'.
31

WHAT IS MODELLING AND HOW CAN IT BE USED?
Wiessing, L. G., Toet, J., Houweling, H., Koedijk, R M., van den Akker, R., Sprenger, M. J. W (1996). 'Prevalence and risk factors for HIV infection among drug users in Rotterdam, the Netherlands'. Xlth International Conference on Aids, Vancouver, 7-11 July 1996. Abstract Tu.C. 2548.
Wodak, A. (1995). 'Harm reduction: Australia as a case study'. Bulletin of the New York Academy of Medicine 72: 339-47.
World Health Organization (WHO) (1999). Teaching health statistics. Geneva: WHO.
32
CHAPTER 2
WHAT ARE DYNAMIC MODELS AND HOW CAN
THEY BE USED?
Christine Godfrey, Steve Parrott, Matthew Sutton, Vanessa Waby, Philip Young with Catherine Comiskey, Martin Frischer, Gordon Hay, Matthew Hickman, Johannes Jager, James Kahan, Ludwig Kraus, Roberto Mollica, Maarten Postma, Gianpaolo Scalia Tomba, Roland Simon, Colin Taylor and Lucas Wiessing
Drug use and problems vary across the countries of Europe, within each country and over time. Through the work of the European Monitoring Centre for Drugs and Drug Addiction (EMCDDA) and other European bodies, an increasing amount of data (both qualitative and quantitative) is being collated on drug use and problems. Knowledge of the current situation is important for policy-makers, but there is also a need to plan for the future. What sense can be made of the data available? Can trends in use or problems be predicted? Can simulations be made of different policy instruments to examine their potential consequences?
Researchers use a number of tools to investigate these questions. A model is defined as a simplified description of a system or phenomena in order to assist in calculations and predictions. As may be expected, however, researchers from different areas of study have developed different models and used different statistical and mathematical techniques in order to attempt to put some of their models into practice. Which approach yields the most useful result? While some models may seem a gross simplification of a complex problem, others are so intricate and technical, denying the general reader's ability to understand the logic used, that the model becomes a 'black box'.
During 1997, a group of experts drawn from across Europe met twice in York to consider the feasibility of developing dynamic models of drug use and related problems. Review papers were commissioned from this expert group and the extended and revised reviews form the main contents of this monograph (see full report, Godfrey et al., 1997). A further seminar, which included the original group of modelling experts, drug researchers and other drug specialists, was held in Lisbon in 1998. The aim of this seminar was to explore which policy questions could be addressed by which type of models and how the results of such modelling could be disseminated to policy-makers across Europe (Godfrey et al., 1998).
This chapter contains a synthesis of the discussions and conclusions from these three different meetings. The potential policy questions are considered in the first section. The various types of models and a summary of their advantages and disadvantages is
33
WHAT IS MODELLING AND HOW CAN IT BE USED?
given in the second section. How modelling techniques could be used to address policy questions and the potential for further research is explored in the third section. The chapter concludes with a discussion on the role of dynamic modelling.
What are the policy questions?
Drug issues span a vast array of policy areas at different levels and are of enormous international concern with some policies being addressed at this level. There are also national, local and community issues, which often cross cut traditional policy divisions. Policy-makers include not just politicians, but also bureaucrats. Developing relationships between researchers and the large number of different decision-makers may be problematic, but this does not necessarily imply that research cannot be fed into the policy-making process.
Thè questions posed by policy-makers of all sorts tend to be easy to comprehend and beyond dispute. They centre on issues such as: how many people use drugs? How much do they consume? What are the consequences of this use? Which policies work? What are the costs of these policies? These questions can obviously be extended and one important role of modelling is to outline the dimensions of drug use and problems and their interactions. Part of the researcher's role is to demonstrate the impact of drug use and problems not just on physical consequences such as disease rates and healthcare systems, but also on social impacts. This extends to the effects on the community, the economy and the judicial system.
Many policy concerns are of a comparable nature. Why is drug use in the policymaker's area higher or lower than in another? As more national and regional data become available policy-makers may be tempted to make invalid and inappropriate conclusions about the efficacy of their policies. Modelling data by formulating and testing hypotheses is one means of informing the policy debate. For example, research may be able to help explain why some countries have lower prevalence of cannabis use than others. Further collection of data, particularly over time, raises other policy-driven questions, particularly why do use and patterns of drug use change? Why does some drug use become problematic? Can the results of policy changes be observed?
While these questions are simple, the answers have proved difficult to find. Partly, research has been hampered by the lack of data. Modelling techniques have an important part to play in enabling researchers to make the best use of the limited available data. Bodies such as the EMCDDA, which are playing a major role in collating comparable data, are clearly important. Partly, there is a lack of research and researchers, with many modellers working in isolation and without major funding. However, these are not the only issues.
One of the recurring themes of the discussions in this project was the link between researchers and policy-makers. In seeking funding researchers have been encouraged to stress the practical relevance of their work. However, the motivation and interests of researchers in a complex area may not be the same as those of the policy-maker. Researchers can become very frustrated if clear policy recommendations arising from research are not enacted. In contrast, policy-makers can become disillusioned if model
34
CHAPTER 2
predictions prove false. Examples of the inaccuracy of the initial HIV/AIDS models in predicting the spread of HIV and consequent health-care resources from data were frequently quoted in discussions. Similarly, decision-makers can be discouraged from considering research if the model is not transparent and is masked in technicalities. There can be a long time lag between the policy-maker posing a question and researchers being able to provide an answer. Disputes between researchers can also alarm policymakers but be one of the main driving forces behind the development of research techniques and results.
Continuing dialogue between researchers and policy-makers is clearly required. There is considerable variation across countries in how research is used in the policy-making process. In some countries there are bodies which act to synthesise research and bring researchers and decision-makers together. However, research also has to be timely and politically acceptable. The impact of research varies considerably, as was demonstrated by some of the case-study material used in the project. The first important aspect is the availability of data about policies. In the 1997 York seminar, Pierre Kopp presented analysis about the expenditure of the French government on different drug policies (Godfrey et al., 1998). These data are not readily available and as such they provide some background against which policy statements can be checked, for example, the balance between enforcement and treatment expenditures. Peter Reuter, at the same meeting, provided two examples of drug modelling work with different impacts on policy-making (Godfrey et al., 1998). In the first example, simple models were constructed to demonstrate the impact of various ways of restricting the supply of drugs. The policy background was a move to 'seal the borders' by using a military solution. This policy change was not fully supported by the military authorities and the model was able to demonstrate how the costs of smuggling varied by routes and the impact of alternative interdiction policies. The study, despite its limitations, did have an impact and this was also helped by general concern about the amount of expenditure on interdiction by the United States Congress.
The second example, quoted by Reuter, involved the work of Rydell and Everingham (1994). This was a simulation model of the cost-effectiveness of treatment compared to enforcement policies to reduce cocaine consumption. This work has been favourably reviewed by other researchers and frequently quoted. It failed, however, to have any political impact, with no change in the proportions spent on enforcement compared to treatment despite the clear conclusions that treatment was more cost-effective. There can only be speculation about why this study failed to have a major policy impact. It could be simply that the budgets for interdiction are set centrally while those for treatment are set locally and that there was therefore no clear policy decision-making body to act on the results. It may be that the research was not timely because the US federal budget at that time was not the focus of a strong political debate. It may be that such research findings take a lot longer to be acted upon with the need for more fundamental shifts of opinion as the research results are disseminated more broadly.
To summarise, researchers can contribute to the debate about drug use, problems and the effectiveness of alternative policy instruments. Modelling, with available data, is an important part of this research contribution. Policy questions and concerns are relatively
35
WHAT IS MODELLING AND HOW CAN IT BE USED?
straightforward. However, drug problems themselves are complex and the lack of available data means that answers to these questions are not necessarily readily available. The next step is to explore the modelling techniques available and how they can be used to address policy questions.
Types of model
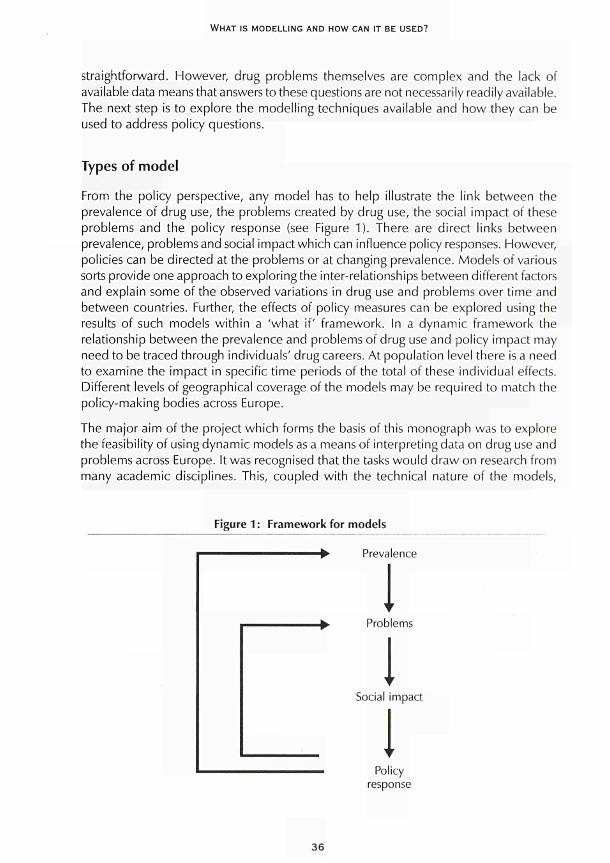
From the policy perspective, any model has to help illustrate the link between the prevalence of drug use, the problems created by drug use/the social impact of these problems and the policy response (see Figure 1). There are direct links between prevalence, problems and social impact which can influence policy responses. However, policies can be directed at the problems or at changing prevalence. Models of various sorts provide one approach to exploring the inter-relationships between different factors and explain some of the observed variations in drug use and problems over time and between countries. Further, the effects of policy measures can be explored using the results of such models within a 'what if' framework. In a dynamic framework the relationship between the prevalence and problems of drug use and policy impact may need to be traced through individuals' drug careers. At population level there is a need to examine the impact in specific time periods of the total of these individual effects. Different levels of geographical coverage of the models may be required to match the policy-making bodies across Europe.
The major aim of the project which forms the basis of this monograph was to explore the feasibility of using dynamic models as a means of interpreting data on drug use and problems across Europe. It was recognised that the tasks would draw on research from many academic disciplines. This, coupled with the technical nature of the models,
Figure 1 : Framework for models
-► Prevalence
I ■>■ Problems
I Social impact
I Policy
response
36
CHAPTER 2
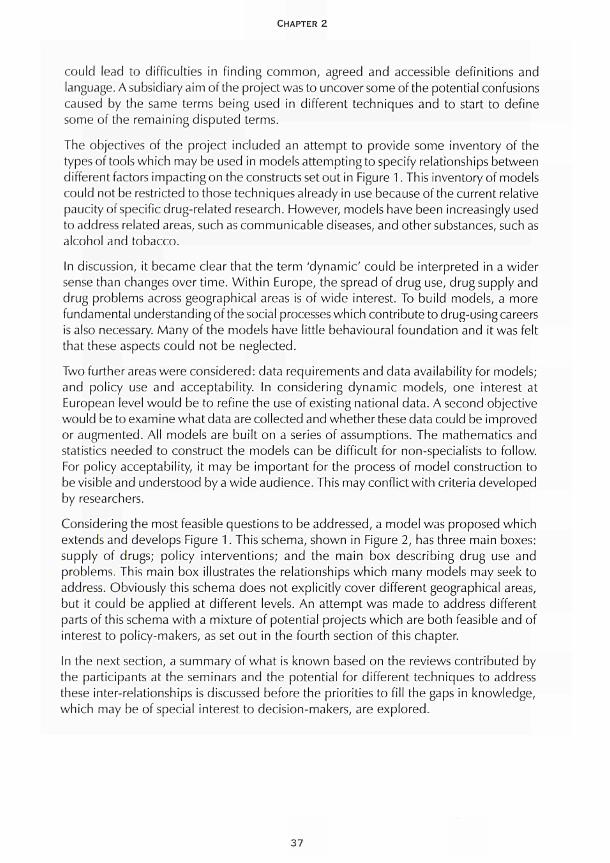
could lead to difficulties in finding common, agreed and accessible definitions and language. A subsidiary aim of the project was to uncover some of the potential confusions caused by the same terms being used in different techniques and to start to define some of the remaining disputed terms.
The objectives of the project included an attempt to provide some inventory of the types of tools which may be used in models attempting to specify relationships between different factors impacting on the constructs set out in Figure 1. This inventory of models could not be restricted to those techniques already in use because of the current relative paucity of specific drug-related research. However, modeishave been increasingly used to address related areas, such as communicable diseases, and other substances, such as alcohol and tobacco.
In discussion, it became clear that the term 'dynamic' could be interpreted in a wider sense than changes over time. Within Europe, the spread of drug use, drug supply and drug problems across geographical areas is of wide interest. To build models, a more fundamental understanding of the social processes which contribute to drug-using careers is also necessary. Many of the models have little behavioural foundation and it was felt that these aspects could not be neglected.
Two further areas were considered: data requirements and data availability for models; and policy use and acceptability. In considering dynamic models, one interest at European level would be to refine the use of existing national data. A second objective would be to examine what data are collected and whether these data could be improved or augmented. All models are built on a series of assumptions. The mathematics and statistics needed to construct the models can be difficult for non-specialists to follow. For policy acceptability, it may be important for the process of model construction to be visible and understood by a wide audience. This may conflict with criteria developed by researchers.
Considering the most feasible questions to be addressed, a model was proposed which extends and develops Figure 1. This schema, shown in Figure 2, has three main boxes: supply of drugs; policy interventions; and the main box describing drug use and problems. This main box illustrates the relationships which many models may seek to address. Obviously this schema does not explicitly cover different geographical areas, but it could be applied at different levels. An attempt was made to address different parts of this schema with a mixture of potential projects which are both feasible and of interest to policy-makers, as set out in the fourth section of this chapter.
In the next section, a summary of what is known based on the reviews contributed by the participants at the seminars and the potential for different techniques to address these inter-relationships is discussed before the priorities to fill the gaps in knowledge, which may be of special interest to decision-makers, are explored.
37
WHAT IS MODELLING AND HOW CAN IT BE USED?
Figure 2: Schema for research and policy questions
Supply
and
supply
systems
Risk factors
ι r
Social problems
1 '
Drug-using careers
y r
Levels of use
1 r Problems
and costs
Policy interventions
Prevention
Treatment
Enforcement
Findings from review papers and case studies
In this section, a short summary of each review topic is presented based on the discussions at the second expert meeting. Where appropriate, references are made to the chapters below but the discussions at the expert meeting were based on earlier versions of these reviews. The discussion of each technique was framed around the following questions:
• What are the outputs of the model? • To what extent are existing examples of these models applicable in Europe? • What geographic areas do the models consider? 9 What are the data demands of the model?
• Why have the models not been applied? • What would be the added value of further research?
Geographic information systems
Geographic information can be seen in two parts. These geographic information system (GIS) models have been mainly used as a means of displaying spatially referenced data
38
CHAPTER 2
(see Chapter 3). This can be important in itself in identifying routes of the spread of diseases or socially related behaviour such as drug use. However, such systems can also be augmented by linking the spatial framework with relational databases and epidemiological functions. This could be applied to examining, for example, deprivation and town size in relation to the spread of drug use or to drug-supply routes.
The technique was thought to have great potential at many levels and especially for the EMCDDA. The main advantage is the visibility of the output and its appeal to policymakers. However, the process may need considerable initial investments and more research is needed to develop some of the underlying functions of the spread of drug use.
Dynamic models of data-production processes
Chapter 4 contains a number of illustrations of the application of different techniques based on available data in various countries and addressing a range of research questions. This chapter illustrates how modelling techniques may be successfully applied.
The advantage of the approach adopted in the original review paper was its pragmatism and the speed with which some results could be obtained. It had the advantage of making optimal use of available data to examine some important aspects of the impact of illicit drugs. However, one of the reasons the approach may not be widely adopted was that it was seen as over-simplistic. Collating data across Europe if comparability is required can also be very time-consuming.
The discussion also highlighted the importance of not using one single methodology or set of data to model. Rather, there was a need to apply several approaches to reduce the uncertainties of modelling drug use and problems.
Multiple-indicator models
Multiple-indicator models use time series of indicators and statistical techniques to explore the links or correlations between the different indicators (see Chapter 5). These indicators are likely to be in three major groups: medical and treatment indicators; social indicators; and legal indicators. The relationships are also likely to be in the form of time lags. For example, the numbers in treatment in the current period may be linked to indicators of drug use several years earlier.
The main advantage of this technique is that it uses available data. However, it would require time series of the 'same' indicator. These data may exist, but experience suggests that even collating data can be a time-consuming and resource-intensive process. However, the data-monitoring systems of different groups across Europe are addressing this problem.
One disadvantage of the technique is that the correlations found do not imply causality. Changes in the social processes, which generate the indicators, are likely to invalidate the model predictions. Only by examining individual processes can some understanding be gained of the factors influencing the trends in different patterns of drug use and problems.
39
WHAT IS MODELLING AND HOW CAN IT BE USED?
Back-calculation methodology
This methodology has been applied and developed mainly to provide estimates of the total numbers of the population infected with HIV (see Chapter 6). The technique involves using the known or identified population of those with a disease with some 'incubation rate' to back calculate the total number of infected persons. The purpose of this technique is to generate estimates of the 'hidden' population, which is clearly of policy interest as well as providing potential input into other modelling techniques.
The back-calculation method has been applied extensively throughout Europe to the problem of estimating the numbers infected with HIV. It may have applications in other diseases linked to drug use. The expert group also discussed ways of applying the technique to measuring the hidden population of drug users. The proposal was that it may be possible to use data on the numbers presenting for treatment for drug problems with data on the time delay between drug initiation and treatment to estimate the hidden pool of users. This may be appropriate for some type of drug use, for example opiate use, but not for others. However, not all opiate users will present for treatment and hence using the back-calculation method could be seen as providing a minimum estimate. This proportion attending for treatment may also vary with the supply of treatment over time. It was not clear whether different behavioural aspects could be incorporated easily within an essentially mechanistic model, although different statistical techniques could be used to simulate the importance of different assumptions. Despite these issues, this technique appeared promising for addressing some questions.
The mathematical and statistical techniques used to perform the back calculation vary. While such technicalities may be difficult to describe in full, the concept of the model can be described in relatively simple terms. There is a pool of expertise across Europe in applying this model, although it may need refining on a country-by-country basis. One disadvantage of the model is its sensitivity to small changes in the input data.
Compartmental modelling and stochastic dynamic systems
The basis of these types of models is the division of the population into two or more groups (see Chapter 7). The models then explore how individuals move from one compartment to another. In some circumstances, the rate at which individuals transfer through the compartments is known and in other models different probability rates can be tested. The technique provides a means of combining data from different sources in a systematic way to offer insights into drug use and related problems. An example was given of how such models may be used to explore how individuals move through a drug-using career. It also provides a framework in which different scenarios can be explored.
These types of models have been used across Europe in the study of the spread of HIV. They have also been used to estimate the spread of HIV among injecting drug users. One possible disadvantage is that estimates depend heavily on the parameters employed and the realism of the structure of the underlying compartmental model. The models
40
CHAPTER 2
(depending on the complexity) are demanding of data, but building conceptual frameworks may help refine existing data-collection methods.
Discussion of the models highlighted the basic need to understand the social process affecting an individual's drug-using career or the process of initiating drug use. This points to the need for multidisciplinar/ approaches to the development of models.
System-dynamic models
This term caused some confusion as it referred to a group of models that contained some of the techniques used elsewhere. The distinguishing feature of a system-dynamic model is the attempt to examine the flows between different parts of a system (see Chapter 8). Generally, some sort of feedback mechanism is generated between the different parts of the system, rather than being a form of progression as in some of the compartmental models. However, parallels were noted between system-dynamic models and the compartmental and scenario models described in other chapters.
System-dynamic models have also been applied to more aggregated data than compartmental models. Examples are provided in the research generated by RAND (Rydell and Everingham, 1994), where such models have been used to simulate policy changes such as switches of expenditure between enforcement and treatment. More aggregated models frequently use a combination of methods and techniques to generate data for their simulations. More individually based models may have applications in examining problem drug use, treatment take-up and consequences through time.
Discussion suggests that these types of model have the potential to address very important policy questions. However, some models are very complex and may not be sustainable given current data availability. The more complex the model, the more useful it could be. The critical question remains, however, how to pre-judge the benefits associated with extending the complexity of the model of each stage.
Structural equations and path analysis
The aim of these techniques is to examine the relationships between known variables to examine the underlying (latent) concepts (see Chapter 9). These are generally exploratory tools rather than ones leading to predictions, although they have been applied to explore aspects such as the concepts that may lead individuals through different pathways of drug use. The models generally use individually based data.
One advantage of the techniques discussed by the group was the ability to explore data to find previously unknown relationships. This may be a useful technique to apply to survey data. Unobservable constructs are used widely in some disciplines such as psychology, but may not be so acceptable to a broader audience. It is perhaps the 'black box' nature of the models which limits their acceptability to policy-makers. Such models may be of much wider use to the research community.
41
WHAT IS MODELLING AND HOW CAN IT BE USED?
Modelling infectious diseases and other health consequences of drug use
This is clearly an important area of application of different modelling techniques (see Chapter 10). These models have the primary aim of examining the factors that influence the spread of different health consequences and predicting that spread. There is a body of work on the spread of HIV and the issue is how the models can be extended to other diseases. The expert group expressed particular concern about the spread of the hepatitis C virus (HCV) among the drug-using population.
The objective of the different models is to understand the quantitative relationships between the characteristics of a specific disease, the contact patterns in the population within which it is transmitted and the resulting incidence and prevalence. The models can also be used to simulate the effects of prevention programmes and provide data for modelling cost consequences.
In some of the examples presented, behavioural aspects, such as the dynamics of social networks, were combined with some of the more mechanistic models of disease spread. These behavioural models are more difficult to develop and require additional data, especially on drug-using careers and behaviours. Because of the differences between areas these models are generally applied at local level.
There may be advantages in starting exploratory work with simple models. This may be seen as a priority given the consequences to individuals of the spread of these diseases.
Scenario analysis
This was another term which caused some confusion. Chapter 11 focuses on one specific type of analysis and aims to set out a conceptual model for exploring the health impact of drug use at multinational level. As the main model is conceptual rather than mathematical, it is necessary to build conceptual boxes and draw out the main relationships between the boxes. In the model for the European Commission Concerted action on multinational AIDS scenarios, for example, the main 'boxes' were: policy; demography; determinants of behaviour; health status; health-care system and associated costs; and autonomous developments such as medical technology, macro-economic factors and socio-cultural factors. Some links can be seen between this area and compartmental models and system-dynamic models. The next step is collecting data and examining all the impact factors. Once the data have been collated this usually forces some simplification of the conceptual model. Different techniques are then combined to 'solve' the model and its consequences. The next step is then to set a reference scenario given certain conditions and simulate changes from the reference scenario by altering some of the model's policy parameters.
The advantage of this type of scenario analysis is that it explores the links between different policy developments and consequences. Many other techniques are used in constructing the models. It does, however, demand considerable resources. It could be seen as a useful framework within which to develop more detailed research work. As such it may provide a link between the models exploring the factors influencing drug use and those tracing consequences.
4 2
CHAPTER 2
There are other more qualitative approaches to scenario analysis and these involve a different combination of approaches. Policy-makers may, for example, be asked about which states they would most desire in the future and what they would most wish to avoid. The modellers then attempt to trace back from these outcomes the processes which affect them. This allows insights into what steps have to be taken in the present to get to some desired outcome in future. This type of approach may well have applications in the drugs field and could provide useful insights into the policy-making process not covered by other more mathematical and statistically based models.
Modelling cost consequences
This is a form of economic modelling which takes the results of many other models to consider the resource impact of different patterns of drug use and their consequences (see Chapter 12). Its advantage is the policy interest. However, to apply this approach across Europe, some standardisation of data-collection methods is required and this may be very resource intensive. The benefits of standardisation are that comparisons can be made across countries on a like-for-like basis.
The basis of most health-care-cost consequences models is the use of an appropriate epidemiological sub-model, a model for the health-care needs and then one for estimating the costs. The details of the model required vary with the disease and the treatment needs at different stages of development of the disease. The reliability of the results of the model depends on the quality and representativeness of the data used for estimation. Health-care-cost data across Europe are of varied quality. Several possible developments were considered by the expert group, including examining the cost consequences of the hepatitis Β virus (HBV) and HCV
While health consequences were seen as a starting point and would link with other modelling work, there are a number of additional consequences of particular policy concern. The expert group considered some of the other consequences that may need modelling, especially crime costs.
Economic-market models
Economic-market models examine the interaction between the behaviour of those supplying drugs and those consuming drugs (see Chapter 13). The purpose is to generate estimates of the determinants of dynamic patterns of drug prevalence or incidence. They can be applied both at the population (macro) level and at the individual (micro) level.
Population-level models can be applied using some of the data currently available across Europe. Such models are generally applied to time series of data across the same geographic area. However, developments using individual-level data illustrate some uses of this technique to demonstrate the potential importance of economic factors in influencing drug-using behaviour and its associated consequences.
43
WHAT IS MODELLING AND HOW CAN IT BE USED?
Some studies have been undertaken across Europe to examine the economic determinants of drug use, but few have been conducted on the factors influencing the supply of drugs. Because aggregate-level data are already collected, it was thought by the experts that well-founded economic models had the potential directly to inform policies, for example by identifying where to concentrate enforcement activities. At individual level, the disadvantages of these models were the demands on data and expertise. As within other areas, progress may be made if a multi-disciplinary approach were to be adopted.
Chaos models
An additional paper was presented at the second expert meeting. This was not an identified area for review, but rather an innovative area of research which was reported by a Spanish team of researchers. The potential for chaos models is to explore the spread of drug use and simulate within the model how different factors may alter the spread of drug use and its consequences. One disadvantage of the technique is the sensitivity to initial starting conditions. Another potential problem is explaining the model to policy-makers. However, the proof of the model will come with its application, as is being pursued within the Spanish group. There is scope for testing the basic model in other areas of Europe, although this is likely to be seen as a specific research task needing national research funding rather than being suitable for more general application at European level.
Where next? Research priorities
The reviews conducted for this project yielded a long list of potential research projects which are detailed in the following chapters of this monograph. Some areas are more developed than others and new work could be undertaken relatively quickly. Rather than prioritising research needs from the review papers, however, the expert group considered the potential questions that could be addressed and matched techniques to these questions. Six questions were identified by the group. These questions were seen as being of interest in themselves, and as fitting into different areas of the schema set out in Figure 2, above:
What are the levels of drug use and problems? This could be considered over time, area and drug type. Geographic information systems maybe useful for filling in gaps in information across Europe. Applications of back calculations, compartmental models and system-dynamic models could also be appropriate.
• How can the spread of new drugs be predicted? This was a potential area for conceptual scenario analysis using a variety of methods to understand social phenomena.
• What is the current drug-using career? Changes in drug-using behaviour and the interaction with treatment were seen as areas to which compartmental modelling could be applied. With data it may be possible to model gateways into drug use.
44
CHAPTER 2
How can social processes be modelled? These processes were seen as vital components of various modelling techniques. This is an area where there were gaps in techniques within the expert group. There was potential for considering different quantitative and qualitative data on risk factors, social networks and processes. As well as epidemiological, sociological and economic models, chaos theory may have some potential here.
What are the current costs of drug use and the cost-effectiveness of policies designed to reduce these costs? The need to model the cost consequences of HCV and HBV was seen as a high priority.
How can the impact of interventions be modelled? Again a variety of approaches could be used including compartmental modelling, system-dynamic models, cost and cost-effectiveness models and scenario analysis.
These questions fit different boxes or combinations of boxes set out in Figure 2, above. A multi-disciplinary team is required to develop many of the models and to begin to answer these questions. There may also be added value in developing similar approaches across a number of European countries. Pursuing modelling in each of these areas would provide inputs into more comprehensive models of the whole supply, demand and policy system.
The questions were considered further with additional experts in the seminar held in 1998 in Lisbon. A summary of the group discussion is given below. The aim of each workshop was to identify practical and feasible ideas for new research projects. In some areas projects were already under way and more work is being developed.
Modelling the health consequences of drug use - HBV/HCV/HIV
Of immediate concern was understanding the spread of these diseases. It was also seen as important to compare interventions in order to predict the future consequences and estimate the costs. There was a role for using infection rates as an indicator. A further area of work was to improve the quality of the treatment data on HIV/hepatitis.
Breaking this down into its component parts, the first issue is to estimate or model the size of the problem in terms of prevalence, consequences and risk in the general population. On interventions it was necessary to consider the effect of reporting delay, the potential to reach new injecting drug users and the issue of whether such interventions should be targeted towards risky behaviours. There is also a considerable dynamic component and a need to model the incubation period and the effects on different birth cohorts.
The data needed include the incubation time, the risk of infection, and the interaction of hepatitis with HIV. There are also requirements for data on treatment options, the proportion offered treatment, rates of success, the interaction of interferon and opiate use, and the different stages of the symptomatic phase of the disease. There are data from HIV cohorts and from behaviour surveys. Comparisons could be made between countries, but there are doubts about the reliability of some data, for example, on the proportion sharing needles.
45
WHAT IS MODELLING AND HOW CAN IT BE USED?
Some modelling work has been undertaken on, and there is potential for considerable areas of new research into, preventing the spread of HIV from drug users to the general population. Further data could be input into models of transmission to the general population, partner studies and vertical transmission from mother to child. It was also necessary to build in interventions which acted on behaviour both before and after transmission. One option was to work with local prevalence projects and look at mortality, treatment, the import and export from the locality, and the hidden population that could be reached through outreach work. Costs could be considered but only after clarifying the dynamics of the disease. More specifically there were studies that could be undertaken on hepatitis Β and the impact of vaccination and better treatment as well as the potential effects for the general population. Finally, there is a need to consider the routine data collected at European level and there may be some support for this type of research from former Directorate-General V, now the Health and Consumer Protection Directorate-General.
The priorities identified by the seminar were:
• modelling the spread of HIV; • modelling interventions.
Geographically based models
Geographically based models like CIS are capable of capturing, analysing and displaying spatially referenced data. These models have been facilitated by the availability of digital map data which provide a spatial framework in which to attach the attributable data. They can be used to study the associations between location, environment and disease. Drug use is a dynamic process and spreads through a population both through micro diffusion (the spread of drug use among individuals within groups) and macro diffusion (where drug use spreads across geographic boundaries). The major current impediment is the lack of empirical data although both GIS maps and relational databases are becoming more readily available. The other data need is for the epidemiological functions, which would be part of wider GIS models.
The main outputs from GIS models are spatial-temporal maps. The models can, with dynamic models of forecasting, provide a means of visualising trends in drug diffusion and provide information for identifying populations at risk. For example, the Community epidemiology working group in the United States has provided simple maps for 25 cities displaying data, but has not in this case linked the maps and data to epidemiological functions which could be used for prediction.
To proceed there is a need to decide at which geographic level to start the analysis: city; region; or country. It was considered best to start at city level and then to extend the work. The requirements are for as much information about the city and the socioeconomic and demographic data as possible. Finding epidemiological functions for these systems needs to be developed.
4 6
CHAPTER 2
The group discussed the work already being undertaken in Spain, Italy, the Netherlands and the UK. In most cases these were mapping exercises and therefore the priority questions were the feasibility of incorporating models into GIS systems. The attraction of the maps for policy-makers and their important role especially in studying the spread of drug use and problems was recognised.
There was discussion about the best way to proceed with the EMCDDA on the work. Should researchers in individual countries work separately and then link up? Or should a common format be followed? It was considered important, at least, for a common decision to be made on the choice of appropriate software.
The first need was to conduct surveys of what data were available and it was considered sensible to send questionnaires to national focal points. It was also important to check the availability of suitable maps, data on drugs, and socio-economic information. The feasibility of the modelling work was the hardest component. The group's priorities were to ensure that some projects took place, possibly in pilot areas such as Amsterdam, Glasgow and Slovakia.
The two priorities for this group were identified as:
• undertaking some pilot mapping exercises; • developing the analytic framework.
Economic modelling of markets
The group brought a number of different perspectives on the analysis of drug markets. Available data were discussed, as was whether these data could explain effects such as large changes in prices. A number of complex hypotheses relating market factors to drug use and drug-related consequences, such as deaths, were discussed by the group. The relationship between individual behaviour and how that translates into market aggregates, as displayed in some of the data presented by Leif Lenke on the impact of price changes on drug-use patterns, was also considered. The conclusion from this discussion was that there was a need for data and analysis in the following areas:
« the framework of markets across Europe; • how individuals behave - micro-economics; • using the first two areas to inform macro models.
There was further discussion about understanding the markets in Europe and how they may differ from those in the US. There were also some differences within Europe. Variations across drugs and types of users and the interactions between markets may well be more fluid in Europe than in the US. There was a need to gather information and to model the supplying organisations and the role of users/dealers.
47

WHAT IS MODELLING AND HOW CAN IT BE USED?
From this discussion three areas of research were identified:
a qualitative study of the individuals involved in the organisation of drug markets across Europe;
a review and analysis of studies of the micro-economic behaviour to set out potential models which could be developed and tested within the European market;
• an examination of the potential for building macro-level models. This would consider the implications of control and other policies on markets and be capable of examining the role of other factors such as demographics.
Costs and cost-benefit studies
It is clear that the social costs of drug use and the cost-effectiveness of different policy options are of great public and policy interest, although the results of cost-benefit studies will not always directly influence the policy process. There was considerable discussion on what areas would form the priority of any research. Data and research methods were well tried within the health area. It was agreed that evaluating criminal-justice interventions was more difficult but of vital policy interest, especially given the proportion of public expenditure in that area.
Three broad areas of work were identified and discussed further:
' social-cost studies; * cost-benefit or cost-effectiveness studies;
public-expenditure analysis.
Social-cost studies have considerable public impact and the results of a study of the costs of illicit drugs In Canada (Single et al., 1996) were discussed. There was considerable debate about the methodology adopted. The international guidelines developed under the aegis of the Canadian Centre on Substance Abuse provide a review and a starting point for cross-European studies (Single et al., 1995). There is still some development required in a number of areas, especially the estimates of lost productivity.
Any research in this area would be best undertaken within a common framework and it is clear that a multi-disciplinary approach is required. There is also a case for a number of sub-studies, for example on specific health-care issues. In addition, other studies, for example looking at public-expenditure implications, are important.
In terms of economic evaluation there is a need for a similar set of linked activities. Work is required to develop the application of economic techniques to illicit drug interventions, for example in identifying, measuring and valuing many of the multiple outcomes from drug programmes. The most obvious place to start is to conduct evaluations within each sector, for example comparing different treatment approaches; enforcement; prevention; public nuisance; and harm-reduction interventions. The next step is to consider between-programme evaluation, for example the balance of public spending on enforcement and treatment.
48
CHAPTER 2
The group considered the priorities from this long list to be:
developing guidelines for social cost for Europe and undertaking a number of
applications;
developing a framework for the cost-benefit analysis of drug interventions.
Social processes and initiation of drug use
This is a key area but is still relatively under-researched. The group discussed data on
the onset of drug use and came to the following conclusions. While there can be models,
they have to be interpreted with care, as drug use is not the same as addiction. It is
therefore important to develop measures which reflect health and social processes.
This suggests a need to analyse drug careers, not the onset of drug use. However, this
requires richer data sets.
Even if models are developed, care needs to be taken that results are not over-
generalised. The same model would not apply to all drugs, cultures or time periods.
There was also a need to recognise the role of social, environmental and policy variables.
The group prioritised the following areas:
modelling risk factors across countries;
■ measuring risk behaviours and developing methods to analyse these data.
Time trends and incidence
The participants in the Lisbon seminar came from very varied backgrounds including
treatment centres, epidemiology, criminology, geography and mathematics and statistical
modelling. There was a brief discussion of the review papers from the 1997 York meetings
and then the group concentrated on the potential use of the back-calculation method.
There was debate about the feasibility of using the method and the parallel use of
survey data. There were some questions about the reliability of information and the
impact of changes over time, for example in services available. It was thought, however,
that there was potential for application to the analysis of first treatment and first police
arrest.
The group also considered the link with policy. Why is it necessary to know incidence
and time trends of heroin use? Clearly there is a need to consider the future demand
for treatment services and to predict consequences such as those of hepatitis C. There
is also a need to know how to chart the evaluation of overall drug strategies and policies.
The group went on to consider the study of other drugs, perhaps through the use of
survey data. However, it was thought important not to dilute effort and concentrating
initially on one drug may be more practical. A further extension was to consider the
model with cessation rates, which again is of prime policy concern.
The first step was to consider the time lags involved and the appropriate distribution to
employ. There was potential to learn from other countries outside Europe. The group
49
WHAT IS MODELLING AND HOW CAN IT BE USED?
concluded that there were sufficient data and expertise, but some resources were needed to bring these together.
The main priorities were:
* developing and testing the model for heroin; * considering the application to other drugs.
Conclusions
A number of important policy questions could be addressed by the different modelling techniques described in this monograph. Some techniques are based on complex mathematics or theories, while others can be presented in simpler terms for wider audiences. The debates at the two expert meetings in York and the later seminar in Lisbon were lively and generated many ideas for future work. It was clear that a wide agenda for research has been set out and while there was some purpose to maintaining the mechanisms to keep the wider group in contact, there was also a need for subgroups to take some areas forward to test the practicalities of model building. Cooperation is required both across academic disciplines and between researchers and policy-makers throughout Europe. Several projects are currently under way to test some of the ideas set out in the following chapters.
References
Godfrey, C, Waby, V, Wiessing, L., Hartnoll, R. (1998). Report of the seminar 'Drug use research, policy and dynamic modelling', EMCDDA, Lisbon, 7-9 May 1998, CT.97.ER1 O.York and Lisbon: Centre for Health Economics and European Monitoring Centre for Drugs and Drug Addiction.
Rydell, C. R, Everingham, S. S. (1994). Controlling cocaine: supply versus demand programs. Santa Monica, CA: Drug Policy Research Center, RAND.
Single, E., Easton, B., Collins, D., Harwood, H., Lapsley, H., Maynard, A. (1995). International guidelines for estimating the costs of substance misuse. Ottawa: Canadian Centre on Substance Abuse.
Single, E., Robson, L., Xie, X., Rhem, J. (1996). The costs of substance misuse in Canada. Ottawa: Canadian Centre on Substance Abuse.
50
MODELLING DRUG USE WITH AVAILABLE DATA

INTRODUCTION
T he models discussed in Part II attempt to integrate different indicators to provide meaningful interpretations of trends in problem drug use. The models vary in their assumptions and uses and are relatively data-demanding, but also may
provide information that remains fairly close to direct observations, thereby increasing reliability.
In Chapter 3, Frischer and Heatlie explore the potential of linking geographic information systems to a drug-forecasting model. They envisage integrating different sources of data to produce predictions of geographic spread that can be mapped. They argue that increased mobility and increased availability of data in Europe would make such a system useful at European level. Their model is based on a limited number of parameters, but it is able to describe adequately the spread of drug use over larger geographic areas (micro-diffusion), similar to infectious-disease models.
Carla Rossi concentrates on the different sources of available data that might give information about the 'hidden' drug phenomenon in Chapter 4. She stresses the importance of a systematic approach to understanding and describing the data-production processes that result in observable records in agencies. Rossi argues that models describing observable macro-data in a simple manner are more useful for policy purposes than complex models that attempt to mimic the micro-phenomenon of the spread of drug use among individuals. Rossi discusses indicators available in different countries and suggests that appropriate mathematical and statistical functions should be used to describe the indicators taking account of their interdependences.
In Chapter 5, Mollica and Mariani follow a similar line of thinking as Rossi by proposing the use of a multiple-indicator model for monitoring prevalence and risk of drug addiction. By combining time series of drug-related data from different sources the authors suggest that the relationships between the observed phenomena can be studied. In the proposed model, different indicators can in turn be seen as dependent or independent variables, depending on the aim of the analysis, while interactions and inter-correlations can be taken into account.
53

CHAPTER 3
MODELLING DRUG MISUSE IN EUROPE USING GEOGRAPHIC INFORMATION SYSTEMS
Martin Frischer and Heath Heatlie
Current methods for estimating incidence and prevalence of drug misuse tend to be retrospective and are not capable of forecasting spatio-temporal trends. Mapping of drug misuse is restricted to displays of incidence and prevalence rates. In contrast, various disciplines (e.g. ecology and environmental health) are increasingly using geographic information systems (GIS) to study associations between location, environment and behaviour. Advances in computing and graphical technology enable spatially referenced data to be linked to relational databases and epidemiological functions. GIS thus provide a powerful tool for analysing the spread of phenomena over time and space and GIS models have been used to predict disease spread from infected to susceptible populations. The development of a European drug-misuse GIS would be a logical progression in view of improvements in drug-misuse surveillance in Europe. It would provide: spatio-temporal maps of drug incidence and prevalence; dynamic methods of forecasting and visualising trends in drug diffusion; and information for identifying populations at risk and prioritising resource allocation.
Increasing personal freedom and scope for travel within Europe have led to speculation that opportunities will arise for new forms of drug trafficking and drug use (Dorn and White, 1994). This has already occurred in the European part of the former Soviet Union (Lee, 1992) as a consequence of the social and economic changes which have taken place since the mid-1980s. However, there are few data from this region with which to paint a reliable picture of current prevalence of drug misuse. In Europe there is increasing recognition that reliable epidemiological information is important for prevention and treatment activities. In recent years there have been renewed efforts to ascertain the level of drug misuse in several countries using a range of methodologies (e.g. IFT, 1994; Sandwijk et al., 1995; ISDD, 1997). In general, methods such as population surveys and capture-recapture analyses provide period prevalence figures and sometimes incidence, but lack any intrinsic mechanism for forecasting trends.
In order to predict drug-use trends it is necessary to understand the factors that influence an individual's decision to use drugs. Concepts like personal freedom are not easily quantified, but, on the other hand, drug use has been linked to a range of intrapersonal, interpersonal and environmental factors (Ramsey and Percy, 1996). To the extent that these factors vary, consequent changes in drug use can be predicted.
55
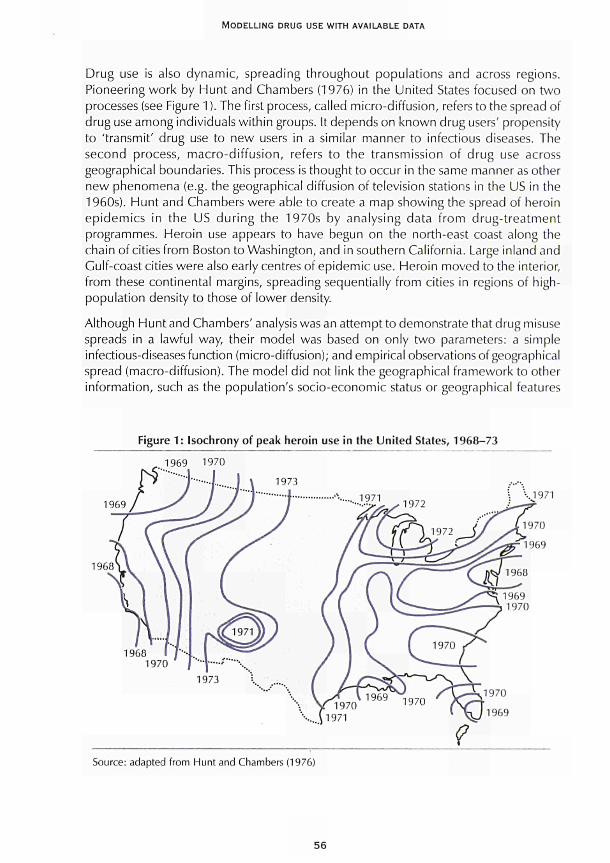
MODELLING DRUG USE WITH AVAILABLE DATA
Drug use is also dynamic, spreading throughout populations and across regions. Pioneering work by Hunt and Chambers (1976) in the United States focused on two processes (see Figure 1 ). The first process, called micro-diffusion, refers to the spread of drug use among individuals within groups. It depends on known drug users' propensity to 'transmit' drug use to new users in a similar manner to infectious diseases. The second process, macro-diffusion, refers to the transmission of drug use across geographical boundaries. This process is thought to occur in the same manner as other new phenomena (e.g. the geographical diffusion of television stations in the US in the 1960s). Hunt and Chambers were able to create a map showing the spread of heroin epidemics in the US during the 1970s by analysing data from drug-treatment programmes. Heroin use appears to have begun on the north-east coast along the chain of cities from Boston to Washington, and in southern California. Large inland and Gulf-coast cities were also early centres of epidemic use. Heroin moved to the interior, from these continental margins, spreading sequentially from cities in regions of high-population density to those of lower density.
Although Hunt and Chambers' analysis was an attempt to demonstrate that drug misuse spreads in a lawful way, their model was based on only two parameters: a simple infectious-diseases function (micro-diffusion); and empirical observations of geographical spread (macro-diffusion). The model did not link the geographical framework to other information, such as the population's socio-economic status or geographical features
Figure 1: Isochrony of peak heroin use in the United States, 1968-73
1969 1970
1969 •..1971
1968
Source: adapted from Hunt and Chambers (1976)
56
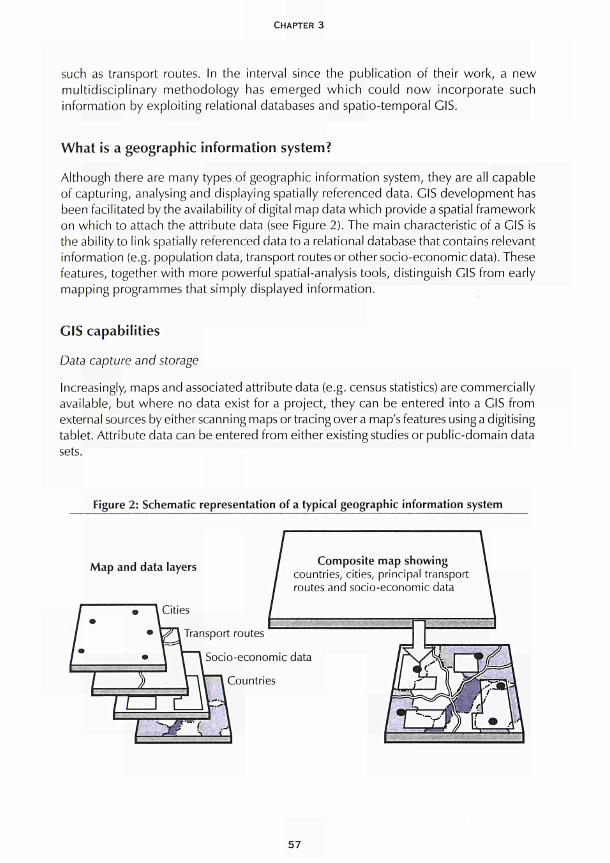
CHAPTER 3
such as transport routes. In the interval since the publication of their work, a new multidisciplinary methodology has emerged which could now incorporate such information by exploiting relational databases and spatio-temporal GIS.
What is a geographic information system?
Although there are many types of geographic information system, they are all capable of capturing, analysing and displaying spatially referenced data. GIS development has been facilitated by the availability of digital map data which provide a spatial framework on which to attach the attribute data (see Figure 2). The main characteristic of a GIS is the ability to link spatially referenced data to a relational database that contains relevant information (e.g. population data, transport routes or other socio-economic data). These features, together with more powerful spatial-analysis tools, distinguish GIS from early mapping programmes that simply displayed information.
GIS capabilities
Data capture and storage
Increasingly, maps and associated attribute data (e.g. census statistics) are commercially available, but where no data exist for a project, they can be entered into a GIS from external sources by either scanning maps or tracing over a map's features using a digitising tablet. Attribute data can be entered from either existing studies or public-domain data sets.
Figure 2: Schematic representation of a typical geographic information system
Map and data layers Composite map showing countries, cities, principal transport routes and socio-economic data
Transport routes
Socio-economic data
Countries
57
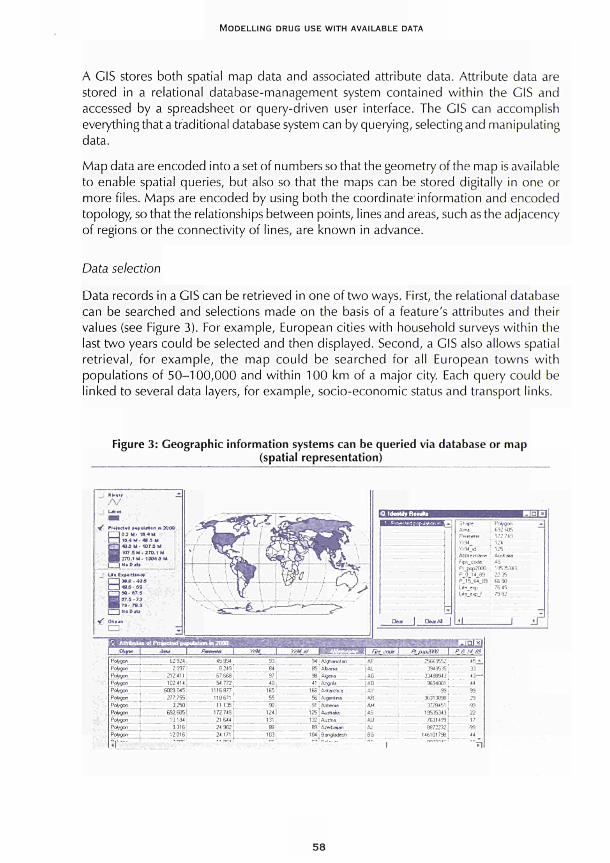
MODELLING DRUG USE WITH AVAILABLE DATA
A GIS stores both spatial map data and associated attribute data. Attribute data are
stored in a relational databasemanagement system contained within the GIS and
accessed by a spreadsheet or querydriven user interface. The GIS can accomplish
everything that a traditional database system can by querying, selecting and manipulating
data.
Map data are encoded into a set of numbers so that the geometry of the map is available
to enable spatial queries, but also so that the maps can be stored digitally in one or
more files. Maps are encoded by using both the coordinate information and encoded
topology, so that the relationships between points, lines and areas, such as the adjacency
of regions or the connectivity of lines, are known in advance.
Data selection
Data records in a GIS can be retrieved in one of two ways. First, the relational database
can be searched and selections made on the basis of a feature's attributes and their
values (see Figure 3). For example, European cities with household surveys within the
last two years could be selected and then displayed. Second, a GIS also allows spatial
retrieval, for example, the map could be searched for all European towns with
populations of 50100,000 and within 100 km of a major city. Each query could be
linked to several data layers, for example, socioeconomic status and transport links.
Figure 3: Geographic information systems can be queried via database or map (spatial representation)
·/ r iol tuf.d M»utM.n » ?
I l O J U · 16.4 M
l^J 10.4 M 41.5 M
Γ~| 49Λ U . «J7.B M
WÊ 107.5M27Q.1 M
WmTTO.iU- 19049 M
r ~ ~ } » u t m *
«16 M
Β90 07.5
67.3 · 73
7». 78.J
I l *« t>JU
" / O«·ja
CD &*AI ¡
Shape
Peirnele«
YiM
Yr94 »1
■"■!;--·■ ι --
Ffi s code r . j . . . ' i :
Ρ 0 H 89
Ρ 15 S4 89
: ' · ι
L ' Ï . S K P J
FutrøC»!
692 HS
172 749
124
125
' . , Γ . Ι Ι Ι Ι Ι
AS
19535343
22 35
66 90
76 45
79 82
& MU**nta of Pn^BCtral (» |>ubt»n <n 2000
i A t v | Ame A M W
P t *W"
Pi*»°»
Ί*ν°·< '.·*/¥? ΨΛφ« Pengon 'drøcr.
O to in
Pcíygon
Pengon
H W »
î|'"
62.924, 45 934
2 997
212*11
I D : Í H
6009 045
8 249
67 668
54 772
1115877
277 755 118 671
3250i 11135
632.6051 1727«
10184 21644
G 316 2*902
12 016 24171
"~'
war
G]
B4
97
40
165
55
90
124
131
æ 103
τ
. ^^rrrwm JAWI«.
94 AJghaniitati
95 Abama
96 Aia«w
' 1 : Angola
166 : Antectca
56
91
125
A; fjert »w
Armena
A u * ala
132 ! Auttna
89 ■'■;:.ni
104,Bangtadcih r -
"·'" "
Fht. coM
. . ■
ftfk\\.im | /■
AF 25669552
AL 3949535
AG 33488943 :
Δ0 9694001 !
AV 99
AR
AM
AS
AU
AJ
BG o r
1
3631389Θ
3728451
19535343
7631439
»72232
146101798
wrn" '
i G l x f
Õ . ' / Ä*
45 *
33
43—
44
99
29
■99
22
17
99
'"■n
J ¡Γ
58
CHAPTER 3
Spatial analysis and GIS
There are generally three phases in applying GIS: visualisation; exploratory data analysis; and model building (Gatrell and Bailey, 1995).
Visualisation
Visualisation is an important tool for showing the change in disease patterns over time. Animation, embedded within a GIS, is highly effective in depicting the spread or retreat of disease over space and time. The spread of the AIDS epidemic in the United States as it moved from and within major cities was illustrated using animated maps (Openshaw et al., 1987). Figure 1, above, shows a similar process for drug misuse. Visualisation can also be used in novel ways to explore the results of traditional statistical analysis. Displaying the locations of outlier and influential values on maps and showing variation in values over space can add a great deal to epidemiologic research. Although such tools are still being developed, they would benefit greatly from a closer and more seamless link between statistical packages and GIS (Gatrell and Bailey, 1995).
Exploratory data analysis
The quantity and diversity of spatial data in a GIS can be overwhelming and exploratory methods can help the analyst make sense of data to address 'what if' questions. Advances in computing and graphics technology have made this one of the most active areas in GIS/spatial-analysis research. Among the most important exploratory methods for epidemiology and public health are methods for identifying space-time clusters or 'hot spots'of disease. For example, Marshall (1991) produced maps displaying the proximity of significant disease clusters to environmental hazards such as nuclear facilities.
Spatial-diffusion models analyse and predict the spread of phenomena over space and time and have been widely used in understanding the spatial diffusion of disease spread (Thomas, 1990). Such models are quite similar to spatial-interaction models except that they have an explicit temporal dimension. The models can predict how diseases spread, spatially and temporally, from infected to susceptible people in an area by incorporating time and space, along with basic epidemiological concepts (Haggett, 1994) and aid in understanding the emergence of infectious disease.
Spatial auto-correlation methods and space-time correlograms can be used to explore spatial and temporal patterns. These methods provide a general sense of the speed and geographic pattern of diffusion. Although the methods have not typically been incorporated into GIS, there is great potential for doing so, especially with recent advances in computer animation.
Model building
Modelling includes procedures for testing hypotheses about the causes of disease and the nature of disease transmission. In general, modelling involves the integration of GIS
59

MODELLING DRUG USE WITH AVAILABLE DATA
with statistical and epidemiological methods. GIS can generate data for epidemiological models, display the results of statistical analysis, and model processes that occur over space. The first two points are evident in recent, regression-based analyses of disease risk, such as the study of Lyme disease (Glass et al., 1995). In this study, a GIS was used not only to integrate diverse data sets and calculate new variables, such as slope and distance from forest, but also to map geographic variation in disease risk, as predicted from a logistic-regression model.
Other GIS models are more explicitly spatial, expressing relationships or flows between people and places. Spatial-interaction and spatial-diffusion models are of particular relevance to the study of emerging diseases. Spatial-interaction models analyse and predict the movement of people, information and goods from place to place (Ding and Fotheringham, 1992). The flows of people between rural areas, villages, cities and countries are all forms of spatial interaction that are central to disease transmission. It is possible to identify areas most at risk for disease transmission by accurately modelling these flows and thus target intervention efforts. Spatial-interaction models reflect two principles: that interaction decreases with distance; and that it increases with population size or 'attractiveness'. Given actual flow data, values can be estimated that show the effects of distance and population size (or other 'attractiveness' factors) on interaction. The models can then be used to predict spatial-interaction patterns elsewhere. Although spatial-interaction models and GIS developed separately, some GIS now have spatial-interaction-modelling capabilities.
Applications of GIS in epidemiology
GIS have already been used to study associations between location, environment and disease. Recent applications include the surveillance and monitoring of vector-borne diseases (Glass et al., 1995; Beck et al., 1995; Richards, 1993); water-borne diseases (Clarke et al., 1991 ); environmental health hazards (Braddock, 1994); exposure to electromagnetic fields (Wartenberg et al., 1993); predicting child pedestrian injuries (Barnes and Peck, 1994); and prescribing patterns in primary and secondary care (Pryce et al., 1996).
In a recent study in Baltimore County, Maryland, GIS and epidemiologic methods were combined to identify and locate environmental risk factors associated with Lyme disease (Glass et al., 1995). Ecological data such as watershed, land use, soil type, geology and forest distribution were collected at the residences of Lyme disease patients and compared with data collected at a randomly selected set of addresses. A risk model was generated combining both GIS and logistic-regression analysis to locate areas where Lyme disease is most likely to occur.
GIS are being used to identify locations of high prevalence and monitor intervention and control programmes in areas of Guatemala for onchocerciasis (Richards, 1993) and in Africa for trypanosomiasis (WHO, 1989). Spatial and ecological data are combined with epidemiological data to enable analysis of variables that play important roles in disease transmission. This integration of data is essential for health-policy planning, decision-making and ongoing surveillance efforts. For example, as part of the Guinea worm eradication effort, the United Nation's Children's Emergency Fund placed pumps
60
CHAPTER 3
in villages most infected with the disease to ensure access to a safe water supply (Kitron et al., 1994). GIS enabled researchers to locate high-prevalence areas and populations at risk, identify areas in need of resources and make decisions on resource allocation (Roger et al., 1993). Epidemiological data showed a marked reduction in prevalence in villages where pumps were introduced.
GIS and drug misuse
GIS have already been shown to be useful in epidemiological research and for facilitating interventions. While mapping of drug prevalence is currently rudimentary, the pioneering work of Hunt and Chambers provides a basic framework for developing GIS in relation to drug misuse. However, developing a practical GIS system will require careful consideration of several issues.
Scope
The main aim of a GIS drug-misuse system is to create a dynamic model for forecasting and displaying spatio-temporal trends. As mentioned at the start of this chapter, drug misuse is dependent on a wide range of factors, only some of which are likely to be successfully modelled. Previous research indicates that standard variables such as socioeconomic status are generally not very good predictors. This is probably because diffusion of drug use is a dynamic process. Such processes have not been modelled, although there has been some interesting qualitative work on peer groups and social networks (Neagius et al., 1994). Available data on diffusion indicate that drug epidemics tend not to be indigenous, but are dependent on a variety of economic, social and political factors. The extent of diffusion also depends on individuals' predisposition to experiment with psychoactive substances. In Western Europe, increasing levels of post-war drug use have been attributed to greater individualism and consumerism. Psychological factors may also play an important role with the weakening of family relationships and lengthening periods of adolescence (Rutter and Smith, 1995).
One of the main impediments to applying GIS to drug misuse has been the lack of empirical data to include in a GIS database. However, during the 1990s there have been numerous studies and considerable improvement in European surveillance data (see EMCDDA, 1997). Furthermore, as mentioned above, GIS maps and relational databases can now be created or purchased. These developments have created a climate whereby a GIS for drug misuse can now be realistically considered. Figure 4 highlights the conceptual framework underpinning the proposed GIS for drug misuse.
Steps in creating a drug-misuse GIS
Although drug use can diffuse at various levels (micro, macro, international), the common link is a function that specifies how drug use spreads among individuals in a population. Two pilot computer programs have been developed based on deprivation status and town size. Both programs were developed for the Strathclyde region of Scotland.
61
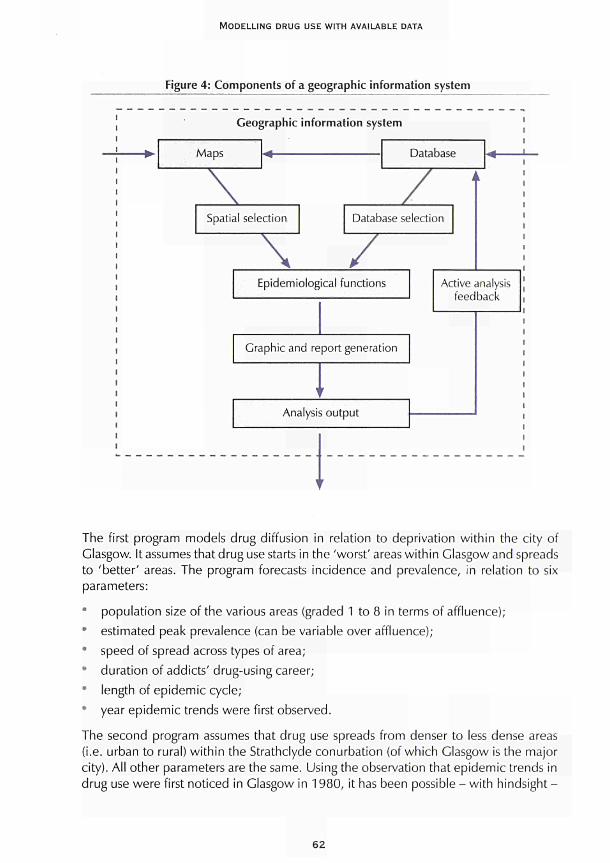
MODELLING DRUG USE WITH AVAILABLE DATA
Figure 4: Components of a geographic information system
Geographic information system
Maps Database
Spatial selection Database selection
\ 7 Epidemiological functions Active analysis
feedback
Graphic and report generation
Analysis output
The first program models drug diffusion in relation to deprivation within the city of Glasgow. It assumes that drug use starts in the 'worst' areas within Glasgow and spreads to 'better' areas. The program forecasts incidence and prevalence, in relation to six parameters:
* population size of the various areas (graded 1 to 8 in terms of affluence); • estimated peak prevalence (can be variable over affluence); • speed of spread across types of area; • duration of addicts' drug-using career; * length of epidemic cycle; * year epidemic trends were first observed.
The second program assumes that drug use spreads from denser to less dense areas (i.e. urban to rural) within the Strathclyde conurbation (of which Glasgow is the major city). All other parameters are the same. Using the observation that epidemic trends in drug use were first noticed in Glasgow in 1980, it has been possible - with hindsight-
62
CHAPTER 3
to generate Incidence and prevalence estimates which correspond to capture-recapture estimates of injecting drug use in Glasgow in 1990.
These programs represent a preliminary attempt to model drug diffusion. Although they do not constitute a GIS, they do include rudimentary relational and geographical components. In order to create a GIS for drug-misuse forecasting, the following would have to take place to develop relational, epidemiological and mapping capabilities:
obtaining digital data to construct the spatial framework for the study area (digital maps); selecting appropriate attribute data to help explain the diffusion of drug misuse (census data, national surveys, transport flows, major import routes); developing new models to predict the rate of diffusion (e.g. allow modelling for the effect of policy/intervention (analogy with vaccination campaign for infectious disease); creating an output interface to allow dynamic user interaction and temporal displays of predicted diffusion rates given a 'what if' scenario.
Conclusions
In many areas of Europe, patterns of drug use are changing. The mechanisms of diffusion are diverse: introduction of new practices by new users; tourism and migration; cross-border contact; drug transportation; and increasing opportunities for economic and international contact. GIS offer a dynamic and flexible approach to visualising the diffusion of drug use in Europe.
What are the model outputs?
The creation of a drug-misuse GIS would produce:
* spatio-temporal maps of drug incidence and prevalence; dynamic methods of forecasting and visualising trends in drug diffusion; information for identifying populations at risk and areas requiring resources for prevention and treatment.
To what extent are existing applications of these models applicable in Europe?
GIS have been used to address diverse topics in the fields of ecology, infectious diseases and environmental health.
What are the data demands of the model?
The GIS requires:
digital maps of Europe which can be focused at city, region, country and international level;
63
MODELLING DRUG USE WITH AVAILABLE DATA
relational databases of socio-demographic data, population statistics, known drug-use statistics (e.g. surveys, prevalence-estimation studies);
epidemiological functions for estimating drug incidence and prevalence.
Why have the models not been applied more extensively in Europe?
Although drug-use trends are increasingly being mapped, GIS development has been slow for a number of reasons including lack of knowledge regarding GIS capabilities, inadequate relational data and rudimentary epidemiological knowledge of drug diffusion. GIS development will require a multi-disciplinary team.
Should there be a research project to develop and apply these models in Europe?
The development of a drug-misuse GIS would create a powerful visualisation and forecasting tool with easily understandable outcomes. A drug-misuse GIS could also be a focal point for integrating and developing epidemiological understanding of trends in drug use within and across Europe.
What geographic areas do the models consider?
A flexible GIS system would be capable of modelling drug use at city, regional, country and international levels.
References
Barnes, S., Peck, A. (1994). 'Mapping the future of health care: GIS applications in health care analysis'. Geographic Information Systems 4: 31-3.
Beck, L. R., Rodrigues, M. H., Dister, S.W., Rodrigues, A. D., Rejmankova, E., Ulloa, A. et al. (1995). 'Remote sensing as a landscape epidemiological tool to identify villages at high risk for malaria transmission'. The American Journal of Tropical Medicine and Hygiene 51:71 -80.
Braddock, M., Lapidus, G., Cromley, E., Cromley, R., Burke, G., Branco, L. (1994). 'Using a geographic information system to understand child pedestrian injury'. American Journal of Public Health 84: 1158-61.
Clarke, K. C, Oslee, J. R., Sherry, J. M., Meert, J. P., Larsson, R. W. (1991). 'The use of remote sensing and geographic information systems in UNICEF's dracunculiasis (Guinea worm) eradication effort'. Preventive Veterinary Medicine 11: 229-35.
Ding, Y, Fotheringham, A. S. (1992). 'The integration of spatial analysis and GIS'. Computers in Environmental and Urban Systems 3-19.
Dorn, Ν., White, S. (1994). 'European free movement, drug users and access to health services'. International Journal of Drug Policy 5: 35-44.
European Monitoring Centre for Drugs and Drug Addiction (EMCDDA) (1997). 7996 Annual report on the state of the drugs problem in Europe. Lisbon: EMCDDA.
64
CHAPTER 3
Gatrell, Α., Bailey, T. (1995). 'Can GIS be made to sing and dance to an epidemiological tune?'.
Paper presented at the International Symposium on Computer Mapping and Environmental Health,
Tampa, FL, February.
Glass, G. E., Schwartz, B. S., Morgan, J., Johnson, D. T., Noy, R M., Israel, E. (1995). 'Environmental
risk factors for Lyme disease identified with geographic information systems'. American Journal of
Public Health 85: 944-8.
Haggett, R (1994). 'Geographical aspects of the emergence of infectious diseases'. Geografiska
Annaler B 76: 91-104.
Hunt, L. G., Chambers, C. D. (1976). The heroin epidemics: a study of heroin use in the United
States, 1965-1975. New York: Spectrum Books.
Institut für Therapieforschung (IFT) (1994). Report on the methods of estimating the extent of the
drug problems in Germany. Munich: IFT.
Institute for the Study of Drug Dependence (ISDD) (1997). Drug misuse in Britain 1996. London:
ISDD.
Kitron, U., Pener, H., Costin, C , Orshan, L., Greenberg, Ζ., Shalom, U. (1994). 'Geographic
information system in malaria surveillance: mosquito breeding and imported cases in Israel,
1992'. The American Journal of Tropical Medicine and Hygiene 50: 550-6.
Lee, R. W. (1992). 'Dynamics of the Soviet illicit drug market'. Crime, Law and Social Change 1 7
(3): 177-233.
Marshall, R. (1991). 'A review of methods for the statistical analysis of spatial patterns of disease'.
Journal of the Royal Statistics Society 154: 421-41.
Neagius, Α., Friedman, S. R., Curtis, R. et al. (1994). 'The relevance of drug injectors' social and
risk networks for understanding and preventing HIV infection'. Social Science and Medicine 38
(1): 67-78.
Openshaw, S., Charlton, M., Wymer, C , Craft, A. (1987). 'A mark 1 geographical analysis machine
for the automated analysis of point data sets'. International Journal of Geographical Information
Systems 1: 335-58.
Pryce, Α., Heatlie, Η. F., Chapman, S. R. (1996). 'Buccaling under the pressure: influences of
secondary care establishments on the prescribing of glyceryl trinitrate buccal tablets in primary
care'. British Medical Journal 313: 1621—4.
Ramsey, M., Percy, A. (1996). Drug misuse declared: results of the 1994 British Crime Survey.
London: Home Office.
Richards, F. O. (1993). 'Use of geographic information systems in control programs for
onchocerciasis in Guatemala'. Bulletin of Pan American Health Organisations 27: 52-5.
Roger, D. J., Williams, B. G. (1993). 'Monitoring trypanosomiasis in space and time'. Parasitology
106(SuppL): 277-92.
Rutter, M., Smith, D. (1995). Psychosocial disorders in young people. London: Academia Europaea.
Sandwijk, J., Cohen, R, Musterd, S., Langemeijer, M. (1995). Licit and illicit drug use in Amsterdam
II: report on a household survey in 1994 on the prevalence of drug use among the population of
12 years and over. Amsterdam: University of Amsterdam.
65

MODELLING DRUG USE WITH AVAILABLE DATA
Thomas, R. (1990). Geomedicai systems: intervention and control. New York: Routledge.
Wartenberg, D., Greenberg, M., Lathrop, R. (1993). 'Identification and characterisation of populations living near high-voltage transmission lines: a pilot study'. Environmental Health Perspectives 101: 626-32.
World Health Organization (WHO) (1989). 'Dracunculiasis: global surveillance summary'. World Health Organization Bulletin 68: 797-8.
66
CHAPTER 4
USING AVAILABLE DATA WITH DYNAMIC MODELS TO ESTIMATE THE EXTENT OF PROBLEM DRUG USE
Carla Rossi
Problem drug use is a hidden phenomenon that can only be studied by indirect indicators linked to its observable consequences, such as crime, health problems, infectious diseases and death. This chapter begins with a description of possible indicators available in different countries. One of the major problems in monitoring problem drug use and in evaluating control strategies is determining the extent of the problem, that is, the size of the drug-using population. To this end, various mathematical models have been used. Specifically, these models are based on the production processes of the observable data, which produce the observable indicators. Such models allow the data collected by social agencies to be used for estimating the size of the hidden population of interest and for making inferences. Several examples are reported to show how to implement the various methods, and potentialities and problems are discussed. The models taken into account are essentially dynamic models, such as Poisson models, multiple capture-recapture models and infectious-disease models. The sources of available data are also discussed and various existing data from different sources and countries are used in the examples of application.
Models, data and indicators for hidden processes
In developing policies and evaluating interventions for controlling the use and abuse of illicit drugs, it is necessary clearly to define the objectives to be reached, the means of achieving those objectives and, most importantly, the measurements (i.e. data) to be used for monitoring interventions. To analyse a complex phenomenon like drug abuse, a systematic approach must be adopted, including the use of statistical methodologies for both describing and interpreting the current situation and proper mathematical and statistical models for making inferences and predicting trends. However, to perform these types of analyses on the collective phenomenon of the illicit drug market, it is necessary to have reliable data on the various critical events that constitute the visible part of the phenomenon and to use suitable mathematical models of the production processes of such observational data (Rossi, 1999a).
In fact, observational data, which are already available in various countries, should play an important role in developing and monitoring national and international drug policies
67
MODELLING DRUG USE WITH AVAILABLE DATA
and in developing suitable mathematical and statistical models to support decisionmaking. Mathematical models describing currently available macro-data are much more useful than complex mathematical models for mirroring micro-phenomena, which require different kinds of experimental processes of data collection and would be difficult to implement. These complex models would also be very costly and time consuming, as shown for ad hoc population surveys for measuring the extent of illegal substance use and abuse among the general population or particular subgroups.
In any case, one of the primary concerns is to determine the nature and the extent of the problem so that appropriate objectives and strategies can be developed; thus the first step is to estimate the size of the population of drug users and, more specifically, of 'problem' drug users. However, since the use of psychoactive drugs is restricted or considered illicit in most countries, drug consumers and dealers are forced to conceal their habits. As a consequence, the extent of illicit drug use and abuse and the size of the drug market can only be measured by indirect methods based on mathematical models that mirror the behaviours of various measures or indicators, such as those developed to estimate 'hidden' phenomena (NIDA, 1990). Table 1 lists a set of indirect indicators developed within the World drug report project of the United Nations International Drug Control Programme (UNDCP). These indicators refer to some observable aspects of drug abuse, known as 'drug-related phenomena'. Indeed, it is quite difficult to identify epidemiological aspects related solely to the use of illegal drugs, particularly if such substances are not considered to represent serious health hazards (e.g. cannabis, whose use does not seem to cause any major detectable problems).
All of the indicators listed in Table 1 are relative measures obtained by dividing the absolute frequencies by the sizes of the corresponding reference populations. Statistics on drug seizures can be simply expressed in per capita units with respect to the general population. Although these statistics are of little use in analyses of a single country where absolute figures can also be used, they are extremely useful for cross-sectional analyses.
Some of the indicators consist of directly observed data recorded by social agencies, for instance data on drug seizures, which are recorded by the police, or data on persons detained, which are recorded by justice departments. Other indicators are based on different records kept by social agencies or on survey data. Since a variety of data sources are used, the quality and accuracy of the indicators are not comparable. In particular, data from surveys conducted in different countries with the aim of estimating the prevalence of drug use cannot generally be compared because of major differences in the basic methodology.
Many indicators are indirect measures of several phenomena simultaneously, in particular, most indicators of drug-related phenomena are linked to both health consequences and law enforcement and are indirect measures of the extent of the illicit drug market and, consequently, of illicit drug use as well. Thus these indicators cannot be used independently, and appropriate mathematical and statistical models are required. For instance, the absolute frequency of persons detained for drug-related offences, denoted by 'nd', can be supposed to be a function of law-enforcement policies,
68
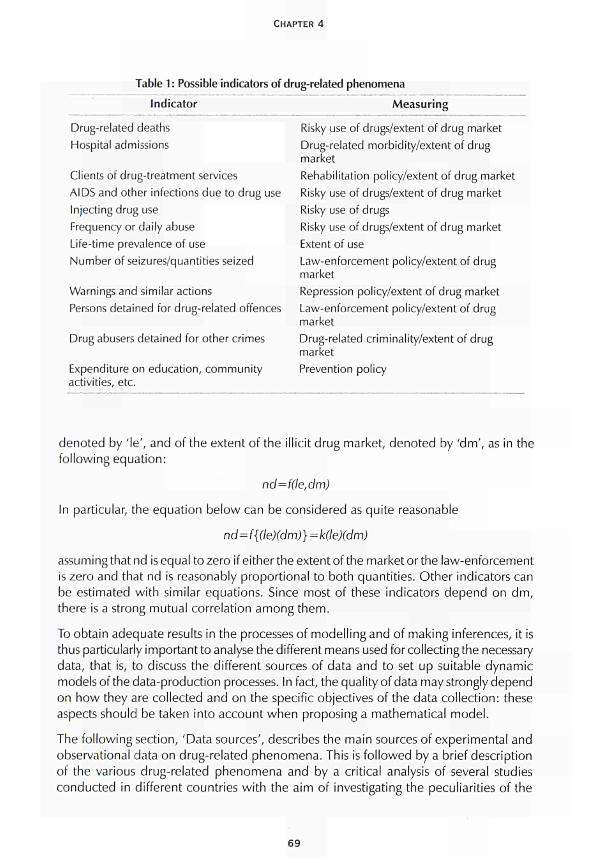
CHAPTER 4
Table 1 : Possible indicators of Indicator
drug-related phenomena
Measuring
Drug-related deaths Hospital admissions
Clients of drug-treatment services AIDS and other infections due to drug use Injecting drug use Frequency or daily abuse Life-time prevalence of use Number of seizures/quantities seized
Warnings and similar actions Persons detained for drug-related offences
Drug abusers detained for other crimes
Expenditure on education, community activities, etc.
Risky use of drugs/extent of drug market Drug-related morbidity/extent of drug market Rehabilitation policy/extent of drug market Risky use of drugs/extent of drug market Risky use of drugs Risky use of drugs/extent of drug market Extent of use Law-enforcement policy/extent of drug market Repression policy/extent of drug market Law-enforcement policy/extent of drug market Drug-related criminality/extent of drug market Prevention policy
denoted by 'le', and of the extent of the illicit drug market, denoted by 'dm', as in the following equation:
nd=f(le,dm)
In particular, the equation below can be considered as quite reasonable
nd=f{(le)(dm)}=k(le)(dm)
assuming that nd is equal to zero if either the extent of the market or the law-enforcement is zero and that nd is reasonably proportional to both quantities. Other indicators can be estimated with similar equations. Since most of these indicators depend on dm, there is a strong mutual correlation among them.
To obtain adequate results in the processes of modelling and of making inferences, it is thus particularly important to analyse the different means used for collecting the necessary data, that is, to discuss the different sources of data and to set up suitable dynamic models of the data-production processes. In fact, the quality of data may strongly depend on how they are collected and on the specific objectives of the data collection: these aspects should be taken into account when proposing a mathematical model.
The following section, 'Data sources', describes the main sources of experimental and observational data on drug-related phenomena. This is followed by a brief description of the various drug-related phenomena and by a critical analysis of several studies conducted in different countries with the aim of investigating the peculiarities of the
69
MODELLING DRUG USE WITH AVAILABLE DATA
various approaches and the different assumptions that are needed to develop sound inferential procedures. The final section of this chapter describes certain mathematical models, both classical and original, and evaluates their application to existing data sets from different countries, thus allowing for a better understanding of the advantages and limitations of these models.
Data sources
There are two main sources of data on drug-related phenomena: records from social agencies such as the police, hospitals or prisons, which produce observational data; and anonymous surveys for studying the different phenomena (e.g. prevalence among high-school seniors), which produce experimental data. Both sources have their advantages and limitations. Data from social agencies are usually recorded for administrative purposes rather than for monitoring the phenomena. As a result, the format of the records is not ideal for making quantitative socio-economic analyses or for easily choosing mathematical models and making inferences. Furthermore, such data can only be released in an aggregated form via statistical tables, and the aggregation often only serves some bureaucratic purpose (e.g. reporting data to the national parliament or to the United Nations). Consequently, the most useful information (i.e. correlations among different phenomena) is usually lost. Surveys can be used to gather more complete and complex information on the phenomena via an appropriate questionnaire. However, if the questionnaire is too complex and/or the questions on illicit drug use are too direct, some respondents may have difficulties in understanding the questions or they may try to conceal their illegal habits, even when anonymity is guaranteed. Other respondents may simply decide not to answer certain questions, thus creating the problem of missing data, which cannot be addressed using straightforward statistical methods. Moreover, surveys are costly and time-consuming.
Examples of both sources of data (i.e. social agencies and surveys) are provided below in order to explain how these sources can best be used and to suggest how the data-gathering process can be improved and modelled to make inferences on the various hidden processes of interest.
Surveys (experimental data)
Surveys constitute a means of systematically gathering information on a given population. Those conducted on all members of the population are referred to as 'census surveys', whereas those targeting specific sub-populations or groups are known as 'sample surveys'. Determining which of these two types of surveys is most appropriate is generally based on the specific objectives to be reached and the resources that are available: for studying the phenomenon of drug use and abuse, sample surveys are in most cases the only reasonable choice.
When designing a sample survey, particular care must be taken in choosing the sampling technique. Only random sampling allows results to be generalised to the entire population, keeping the estimation error under control. Unfortunately, random sampling
70
CHAPTER 4
is not feasible for the hidden populations considered here. Thus, to minimise errors, the only alternative is to make suitable prior assumptions and to properly model, mathematically, the data-generating process.
Records from social agencies (observational data)
Many different agencies collect data related to illegal drug use and abuse. Data collected in connection with the process of law enforcement can be distinguished from those collected in connection with the process of health care. Unfortunately, the collection of data by social agencies is strictly related to the given country's regulations, laws and policies on drug-related phenomena, and available information only refers to the visible part of the hidden processes. In particular, for drug use and abuse, some inference can be made based on data collected on the health consequences of drug abuse, whereas for aspects linked to the illegal market or crime, data on different aspects of law enforcement can be used. In any case, for this source of data, as for data from surveys, it is crucial to make suitable assumptions and to set up proper models for the data-production processes.
Furthermore, more reliable results can be obtained by pooling data from different sources (e.g. different social agencies and sample surveys) in order to overcome problems related to the existing correlations of the indicators. Finally, to gain an understanding of the overall issue, both observable and hidden drug-related phenomena must be analysed.
Drug-related phenomena
The drug problem involves not only those phenomena linked to addiction in the strict sense - such as morbidity due to infectious and chronic diseases, drug-related deaths (caused by overdose, infectious diseases, endocarditis and cirrhosis), and the medical assistance offered to drug abusers (assistance from the national health service and periods spent in live-in rehabilitation centres) - but also many other aspects that have a considerable impact on individuals who have no connection whatsoever with drug addiction (e.g. victims of petty crimes linked to drug addiction). The potential effects of these specific aspects are considered below.
Health consequences of illegal drug abuse
The health consequences of drug abuse include all aspects of the phenomenon that have an impact on health services: illnesses linked to drug addiction (e.g. hepatitis, endocarditis, septicaemia and AIDS); hospital admissions due to intoxication or other causes strictly related to drug use; initiatives undertaken by health services to rehabilitate drug abusers (e.g. out-patient and inpatient facilities and mobile units); and juvenile mortality linked to drug addiction (overdose, AIDS, violent deaths and deaths caused by infections and other drug-related syndromes). It must be stressed that these processes, which can be modelled to make inferences about the hidden phenomenon of drug use and abuse that cause them, greatly depend on the specific drug used and on existing policies. In fact, the type of drug most commonly injected varies by country: heroin and opiates in the European Union; cocaine in the United States; and central nervous
71
MODELLING DRUG USE WITH AVAILABLE DATA
system stimulants in Sweden. This must be taken into account when proposing models. The different drug laws, policies and therapeutic treatments for drug addicts should also be taken into account. For example, in countries where hepatitis Β prevention programmes targeting intravenous drug users (IDUs) were implemented in the early 1980s, the spread of HIV and AIDS seems to be limited among IDUs.
Law enforcement
Addressing the issue of law enforcement entails analysing the following aspects: police operations for controlling money laundering or the consumption of and trafficking in substances defined by legislation as narcotic drugs or psychoactive substances; people detained for drug-related crimes (i.e. for breaking drug laws or for being drug users who have committed serious or petty crimes connected with the drug market); and relative administrative or penal proceedings.
The illegal drug market
The illegal drug market can be quantified by determining or estimating the number of people working in this economic sector. Data for making inferences about this phenomenon using appropriate models can be obtained from records of drug seizures, incarcerations and proceedings for drug-related offences.
Organised and petty crime
'Petty crime' includes those crimes linked to the drug-using lifestyle of abusers (e.g. petty larceny, bag-snatching and pick-pocketing); 'organised crime' refers to the illegal drug market (e.g. production of and trafficking in drugs, and crimes committed by criminal organisations against persons belonging to rival 'cartels'). Based on the data concerning these drug-related phenomena and on the corresponding mathematical models, it is possible to perform the following types of analyses:
• analysis of an individual country for monitoring national drug policies and conducting cost-effectiveness analyses;
• panel studies for analysing and forecasting trends; and • cross-sectional analyses for comparing regional or national policies or monitoring
international policies.
Again, it must be stressed that the statistics available from social agencies and, at times, those from surveys, are strictly related to the given country's specific drug-control regulations, which greatly determine the specific categories used to disaggregate data.
Study examples
The examples provided below include descriptions of various methodologies and of the problems encountered when modelling processes of data production and collection to estimate the size of hidden populations and monitor drug-related phenomena. These
72
CHAPTER 4
examples highlight the fact that, in order for a model to be useful, it must include empirical data on specific laws and policies. The data used for the examples were taken from the Core Countries database (see UNDCF; 1977).
A panel study: the military conscript survey in Sweden
This study is a census survey conducted among military conscripts using a specific questionnaire. One of the questions included in the questionnaire is whether or not the individual has used illegal substances. Given that this is a direct question that requires a direct answer, it is necessary to consider the degree of reliability of the information collected (i.e. the observed frequency of use based on the number of self-reported affirmative responses) and the potential to generalise this information (i.e. to estimate the prevalence among the population based on this observed frequency).
It is clear that simple reporting of use would be misleading, as there were many missing answers and the proportion of missing data increased sharply fol lowing the implementation of stricter drug regulations in Sweden in 1980: in 1980 there was a 4 % rate of missing data, increasing to 17 % in 1994. Specifically, this increase may reflect the passing of a law in 1992 on coercive care of adult drug abusers, as well as the criminalisation of drug use in 1988 and the introduction in 1993 of a maximum sentence of six months' imprisonment for drug use. Despite the fact that the conscripts were guaranteed anonymity, these laws may have influenced their decision of whether or not to answer the question.
To increase the reliability of this kind of survey, randomised response models (RRM) can be used, even when questionnaires include questions on the use of illegal substances. Though RRM entails additional costs and time, the results obtained (observed prevalences) are more reliable and can generally be used as unbiased estimates of the population prevalences. When using RRM, an appropriate (i.e. simple) stochastic model is needed to mirror the data-production mechanism. Selected results from an experiment based both on direct answers and on answers using RRM are reported in the country profile for Italy in the UNDCP World drug report (1997) and in Stovali (1993).
The RRM method is aimed at reassuring the respondent that affirmative answers to questions on illicit behaviour cannot be imputed to him or her. Specifically, the question is answered indirectly by the respondent, using the following procedure:
* When designing the questionnaire, the 'problematic' question is paired with a 'neutral' question, for instance:
1. 'Have you used illicit drugs in the past month?' 1 '. 'Were you born in the first quarter of the year?'
* The respondent is requested to use a random mechanism with two outputs to choose which question to answer. The probabilities of the outputs of the random mechanism are known by the interviewer. For instance, the respondent is asked to toss dice, without the interviewer seeing the outcome, and to answer the first question if the result is 1 or 2 and the second question otherwise.
73

MODELLING DRUG USE WITH AVAILABLE DATA
The respondent simply answers 'yes' or 'no' and the specific question answered is known only to him or her.
If the unknown prevalence of the illicit behaviour is denoted by p, the probability of the first output in the random mechanism (in this case 1/3) denoted by q, the probability of an affirmative answer to the second question (in this case 1/4) by m, and the relative frequency of the affirmative answers by f, then ρ can be estimated using the following equation:
p = {f-m(l-q)}/q if the result is greater than zero
p=0 otherwise
The resulting estimate has been shown to be correct and consistent. In a study performed in Perugia, Italy, a large number of university students were interviewed to study the performance of the procedure using 'problematic' questions on drug use and racist behaviour. The results (Stovali, 1993) were quite satisfactory and show that the estimated prevalences obtained using direct questions were consistently lower than those obtained when using RRM.
• One question was: 'Has anyone offered you illicit drugs in the past year?' The observed prevalence based on the direct method was 1 0 % , whereas it was 15.8 % using RRM.
• Another question was: 'Have you used cannabis or derivatives in the past year?' The observed prevalence was 5.3 % with the direct method and 24.6 % with RRM.
• A further interesting question was: 'Have you used amphetamines or similar drugs in the past year?' The observed prevalences were 1.6 % and 5.9 %, respectively.
The procedure was also applied by the city of Verona, Italy, in 1981 and again at the end of the 1980s to estimate the prevalence of illicit drug use, of drug-offering near schools, and of other types of behaviour linked to the illicit drug market and to drug use among high-school students.
The three questions on drug use were as follows:
• 'Have you used any kind of drug in the past year?' (one-year prevalence); • 'Have you used any hard drug (i.e. injected) in the past year?'; • 'Has anyone offered you illicit drugs in the past year?'
Panel analyses based on records from social agencies
Two similar panel analyses performed in Italy and Sweden are described and compared below.
As an example of an analysis based on panel data from social agencies, time trends of incarceration in Italy are examined, including an assessment of the impact on the Italian population and the possible influence of different laws on the frequency of detention of IDUs (Table 2). In brief, a 1990 law on drug abuse seems to have resulted in an
74
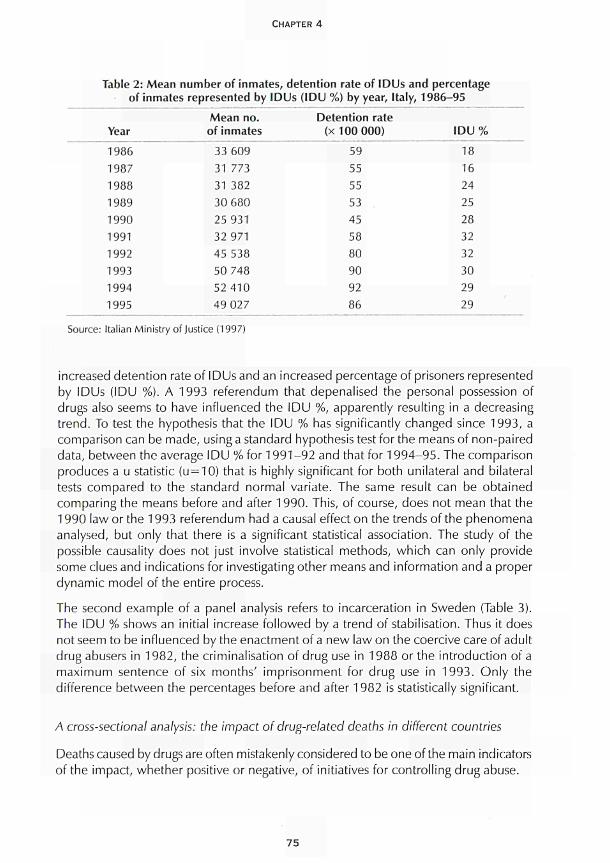
CHAPTER 4
Table 2: Mean number of inmates, detention rate of IDUs and percentage of inmates represented by IDUs (IDU %) by year, Italy, 1986-95
Mean no. Detention rate Year of inmates (x 100 000) IDU %
1986 33 609 59 18 1987 31 773 55 16 1988 31 382 55 24 1989 30 680 53 25 1990 25 931 45 28 1991 32 971 58 32 1992 45 538 80 32 1993 50 748 90 30 1994 52 410 92 29 1995 49 027 86 29
Source: Italian Ministry of Justice (1997)
increased detention rate of IDUs and an increased percentage of prisoners represented by IDUs (IDU %). A 1993 referendum that depenalised the personal possession of drugs also seems to have influenced the IDU %, apparently resulting in a decreasing trend. To test the hypothesis that the IDU % has significantly changed since 1993, a comparison can be made, using a standard hypothesis test for the means of non-paired data, between the average IDU % for 1991-92 and that for 1994-95. The comparison produces a u statistic (u = 10) that is highly significant for both unilateral and bilateral tests compared to the standard normal variate. The same result can be obtained comparing the means before and after 1990. This, of course, does not mean that the 1990 law or the 1993 referendum had a causal effect on the trends of the phenomena analysed, but only that there is a significant statistical association. The study of the possible causality does not just involve statistical methods, which can only provide some clues and indications for investigating other means and information and a proper dynamic model of the entire process.
The second example of a panel analysis refers to incarceration in Sweden (Table 3). The IDU % shows an initial increase followed by a trend of stabilisation. Thus it does not seem to be influenced by the enactment of a new law on the coercive care of adult drug abusers in 1982, the criminalisation of drug use in 1988 or the introduction of a maximum sentence of six months' imprisonment for drug use in 1993. Only the difference between the percentages before and after 1982 is statistically significant.
A cross-sectional analysis: the impact of drug-related deaths in different countries
Deaths caused by drugs are often mistakenly considered to be one of the main indicators of the impact, whether positive or negative, of initiatives for controlling drug abuse.
75
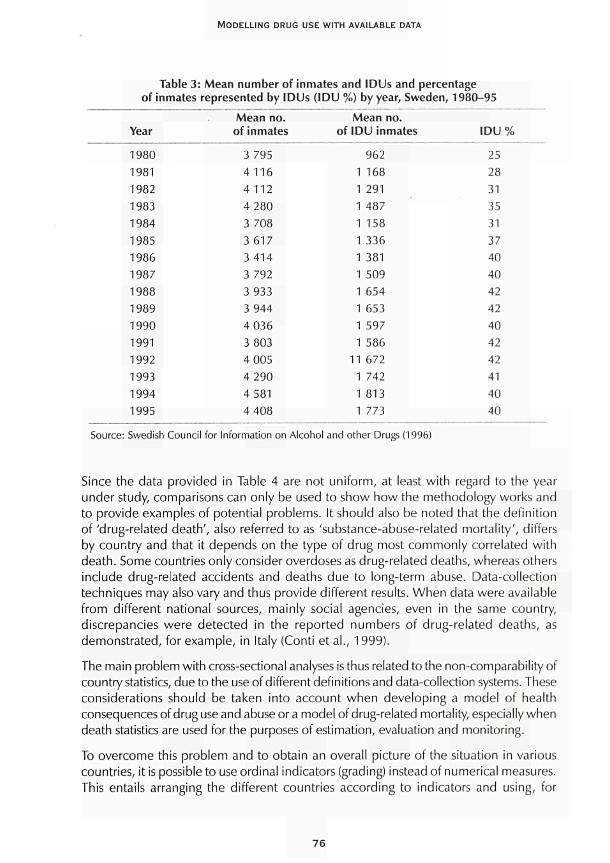
MODELLING DRUG USE WITH AVAILABLE DATA
Table 3: Mean number of inmates and IDUs and percentage of inmates represented by IDUs (IDU %) by year, Sweden, 1980-95
Year
1980 1981 1982 1983 1984 1985 1986 1987 1988 1989 1990 1991 1992 1993 1994 1995
Mean no. of inmates
3 795 4116 4112 4 280 3 708 3 617 3 414 3 792 3 933 3 944 4 036 3 803 4 005 4 290 4 581 4 408
Mean no. of IDU inmates
962 1 168 1 291 1 487 1 158 1 336 1 381 1 509 1 654 1 653 1 597 1 586
11 672 1 742 1 813 1 773
IDU % 25 28 31 35 31 37 40 40 42 42 40 42 42 41 40 40
Source: Swedish Council for Information on Alcohol and other Drugs (1996)
Since the data provided in Table 4 are not uniform, at least with regard to the year under study, comparisons can only be used to show how the methodology works and to provide examples of potential problems. It should also be noted that the definition of 'drug-related death', also referred to as 'substance-abuse-related mortality', differs by country and that it depends on the type of drug most commonly correlated with death. Some countries only consider overdoses as drug-related deaths, whereas others include drug-related accidents and deaths due to long-term abuse. Data-collection techniques may also vary and thus provide different results. When data were available from different national sources, mainly social agencies, even in the same country, discrepancies were detected in the reported numbers of drug-related deaths, as demonstrated, for example, in Italy (Conti et al., 1999).
The main problem with cross-sectional analyses is thus related to the non-comparability of country statistics, due to the use of different definitions and data-collection systems. These considerations should be taken into account when developing a model of health consequences of drug use and abuse or a model of drug-related mortality, especially when death statistics are used for the purposes of estimation, evaluation and monitoring.
To overcome this problem and to obtain an overall picture of the situation in various countries, it is possible to use ordinal indicators (grading) instead of numerical measures. This entails arranging the different countries according to indicators and using, for
76
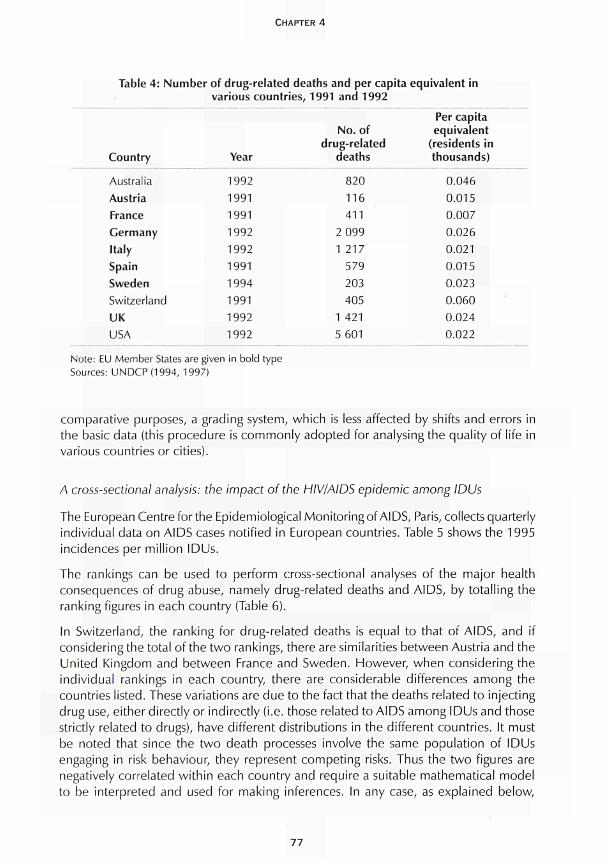
CHAPTER 4
Table 4: Number of drug-related deaths and per capita equivalent in various countries, 1991 and 1992
Country Year
Australia Austria France Germany Italy Spain Sweden Switzerland UK USA
1992 1991 1991 1992 1992 1991 1994 1991 1992 1992
No. of drug-related
deaths
820 116 411
2 099 1 217
579
203
405 1 421
5 601
Per capita equivalent
(residents in thousands)
0.046
0.015 0.007
0.026 0.021 0.015 0.023 0.060 0.024 0.022
Note: EU Member States are given in bold type Sources: UNDCP(1994, 1997)
comparative purposes, a grading system, which is less affected by shifts and errors in the basic data (this procedure is commonly adopted for analysing the quality of life in various countries or cities).
A cross-sectional analysis: the impact of the HIV/AIDS epidemic among IDUs
The European Centre for the Epidemiological Monitoring of AIDS, Paris, collects quarterly individual data on AIDS cases notified in European countries. Table 5 shows the 1995 incidences per million IDUs.
The rankings can be used to perform cross-sectional analyses of the major health consequences of drug abuse, namely drug-related deaths and AIDS, by totalling the ranking figures in each country (Table 6).
In Switzerland, the ranking for drug-related deaths is equal to that of AIDS, and if considering the total of the two rankings, there are similarities between Austria and the United Kingdom and between France and Sweden. However, when considering the individual rankings in each country, there are considerable differences among the countries listed. These variations are due to the fact that the deaths related to injecting drug use, either directly or indirectly (i.e. those related to AIDS among IDUs and those strictly related to drugs), have different distributions in the different countries. It must be noted that since the two death processes involve the same population of IDUs engaging in risk behaviour, they represent competing risks. Thus the two figures are negatively correlated within each country and require a suitable mathematical model to be interpreted and used for making inferences. In any case, as explained below,
77
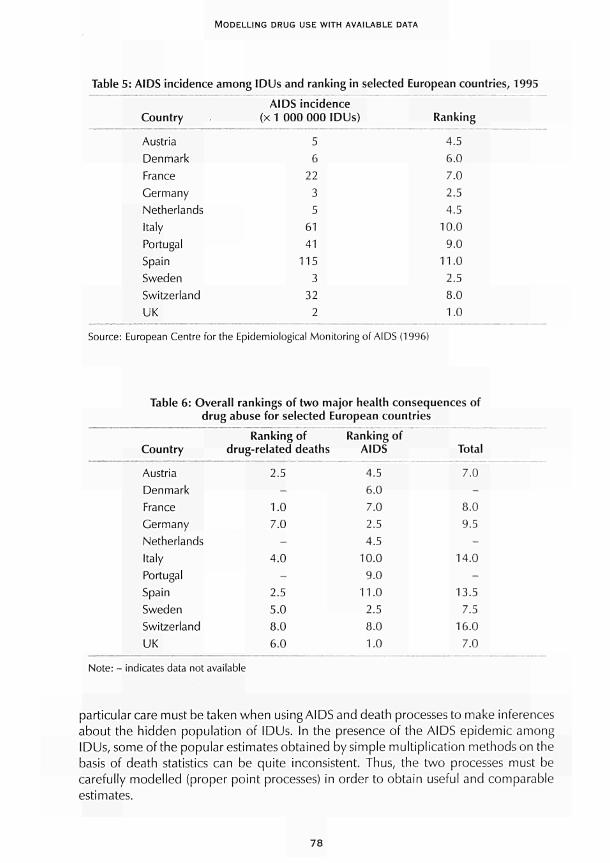
MODELLING DRUG USE WITH AVAILABLE DATA
Table 5: AIDS incidence among IDUs and ranking in selected European countries, 1995
AIDS incidence Country (x 1 000 000 IDUs) Ranking
Austria 5 4.5 Denmark 6 6.0 France 22 7.0 Germany 3 2.5 Netherlands 5 4.5 Italy 61 10.0 Portugal 41 9.0 Spain 115 11.0 Sweden 3 2.5 Switzerland 32 8.0 UK 2 1.0
Source: European Centre for the Epidemiological Monitoring of AIDS (1996)
Table 6: Overall rankings of two major health consequences of drug abuse for selected European countries
Country
Austria Denmark France Germany Netherlands Italy Portugal Spain Sweden Switzerland UK
Ranking of drug-related deaths
2.5 -
1.0 7.0
-4.0
-2.5 5.0 8.0 6.0
Ranking of AIDS
4.5 6.0 7.0 2.5 4.5
10.0 9.0
11.0 2.5 8.0 1.0
Total
7.0 -
8.0 9.5
-14.0
-13.5
7.r> 16.0
7.0
Note: - indicates data not available
particular care must be taken when using AIDS and death processesto make inferences about the hidden population of IDUs. In the presence of the AIDS epidemic among IDUs, some of the popular estimates obtained by simple multiplication methods on the basis of death statistics can be quite inconsistent. Thus, the two processes must be carefully modelled (proper point processes) in order to obtain useful and comparable estimates.
78
CHAPTER 4
Multiple sources: improving inferences on drug-related phenomena
As mentioned above, one of the crucial aspects of monitoring drug-related phenomena is estimating the extent of drug use and abuse, which can only be done using indirect methods. Provided below is a description of how to use some of these methods, which depend on the type of data available from social-agency records and, in some cases, from surveys.
Estimates obtained by stratified calibration samples
This methodology can be used when a calibration population is available and the prevalence of the hidden attribute of interest (e.g. illicit drug use) can be observed or estimated among this population. For example, for a calibration sample stratified by variables such as gender, age and employment status, among others, with single strata denoted byS1, S2,... Sk, the corresponding observed prevalences of the hidden attribute denoted by p1, p2, . . . pk, and the sub-populations corresponding to the strata denoted by N1, N2, . . . Nk individuals, the size of the hidden population can be estimated using the following equation:
Nh = Nlpl+N2p2 + ...+Nkpk
This method provides good estimates only if the strata and the sub-populations are homogeneous; in other words, the hypothesis that the data observed in the various sub-samples are randomly chosen (simple random-sampling model) must be assumed to be true. This is the crucial hypothesis of this method and it should always be verified before the method is applied.
Estimates obtained by probabilistic modelling
As pointed out, it is crucial to develop suitable basic hypotheses on the data-production process and on the structure and properties of the available sample data. It is also important properly to integrate data and information from different sources in order to obtain better estimates of the size of the hidden populations.
In the following examples, data from different sources are used to make inferences about the prevalence of 'heavy' (HU) and 'non-heavy' (NHU) drug use in different countries. 'Heavy use' is defined as daily or injecting use.
Estimating prevalence using data modelled by truncated Poisson processes
Table 7 presents data on the total number of drug users notified to the different social agencies in Sweden during 1992, disaggregated with respect to the number of notifications per person during the period and with respect to the type of drug use (i.e. heavy use and non-heavy use).
79
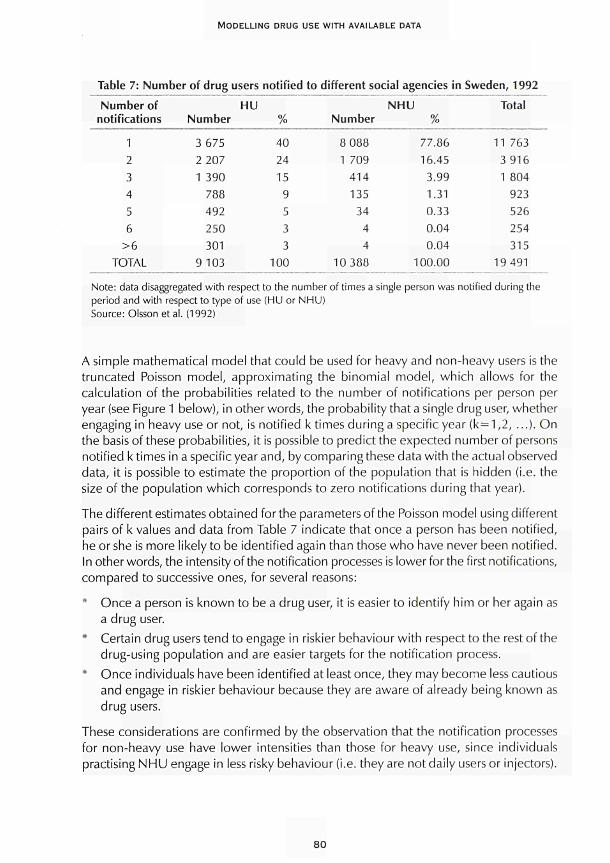
MODELLING DRUG USE WITH AVAILABLE DATA
Table 7: Number of drug users notified to different social agencies in Sweden, 1992
Number of notifications
1 2 3 4 5 6
>6 TOTAL
HU Number
3 675 2 207 1 390
788 492 250 301
9 103
% 40 24 15
9 5 3 3
100
Number
8 088 1 709
414 135
34 4 4
10 388
NHU %
77.86 16.45
3.99 1.31 0.33 0.04 0.04
100.00
Total
11 763 3 916 1 804
923 526 254 315
19 491
Note: data disaggregated with respect to the number of times a single person was notified during the period and with respect to type of use (HU or NHU) Source: Olsson et al. (1992)
A simple mathematical model that could be used for heavy and non-heavy users is the truncated Poisson model, approximating the binomial model, which allows for the calculation of the probabilities related to the number of notifications per person per year (see Figure 1 below), in other words, the probability that a single drug user, whether engaging in heavy use or not, is notified k times during a specific year (k = 1,2, ...). On the basis of these probabilities, it is possible to predict the expected number of persons notified k times in a specific year and, by comparing these data with the actual observed data, it is possible to estimate the proportion of the population that is hidden (i.e. the size of the population which corresponds to zero notifications during that year).
The different estimates obtained for the parameters of the Poisson model using different pairs of k values and data from Table 7 indicate that once a person has been notified, he or she is more likely to be identified again than those who have never been notified. In other words, the intensity of the notification processes is lower for the first notifications, compared to successive ones, for several reasons:
Once a person is known to be a drug user, it is easier to identify him or her again as a drug user.
* Certain drug users tend to engage in riskier behaviour with respect to the rest of the drug-using population and are easier targets for the notification process.
* Once individuals have been identified at least once, they may become less cautious and engage in riskier behaviour because they are aware of already being known as drug users.
These considerations are confirmed by the observation that the notification processes for non-heavy use have lower intensities than those for heavy use, since individuals practising NHU engage in less risky behaviour (i.e. they are not daily users or injectors).
80
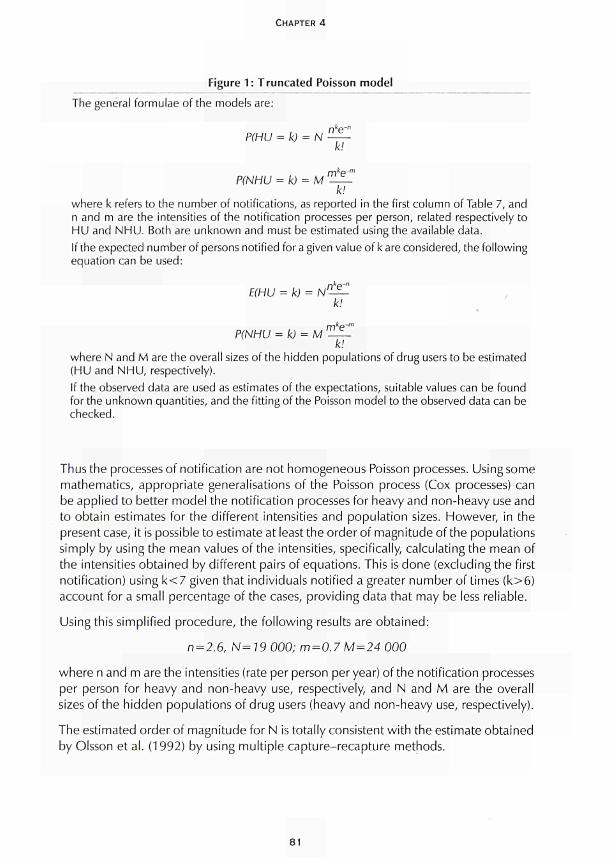
CHAPTER 4
Figure 1: Truncated Poisson model The general formulae of the models are:
nke~n
P(HU = k) = N k!
mke~r" P(NHU = k) = M ——
k! where k refers to the number of notifications, as reported in the first column of Table 7, and n and m are the intensities of the notification processes per person, related respectively to HU and NHU. Both are unknown and must be estimated using the available data. If the expected number of persons notified for a given value of k are considered, the following equation can be used:
E(HU = k) = N — k!
mke~l" P(NHU = k) = M ——
k! where N and M are the overall sizes of the hidden populations of drug users to be estimated (HU and NHU, respectively). If the observed data are used as estimates of the expectations, suitable values can be found for the unknown quantities, and the fitting of the Poisson model to the observed data can be checked.
Thus the processes of notification are not homogeneous Poisson processes. Using some mathematics, appropriate generalisations of the Poisson process (Cox processes) can be applied to better model the notification processes for heavy and non-heavy use and to obtain estimates for the different intensities and population sizes. However, in the present case, it is possible to estimate at least the order of magnitude of the populations simply by using the mean values of the intensities, specifically, calculating the mean of the intensities obtained by different pairs of equations. This is done (excluding the first notification) using k<7 given that individuals notified a greater number of times (k>6) account for a small percentage of the cases, providing data that may be less reliable.
Using this simplified procedure, the following results are obtained:
n=2.6, N=19 000; m = 0.7 M=24 000
where n and m are the intensities (rate per person per year) of the notification processes per person for heavy and non-heavy use, respectively, and N and M are the overall sizes of the hidden populations of drug users (heavy and non-heavy use, respectively).
The estimated order of magnitude for N is totally consistent with the estimate obtained by Olsson et al. (1992) by using multiple capture-recapture methods.
81
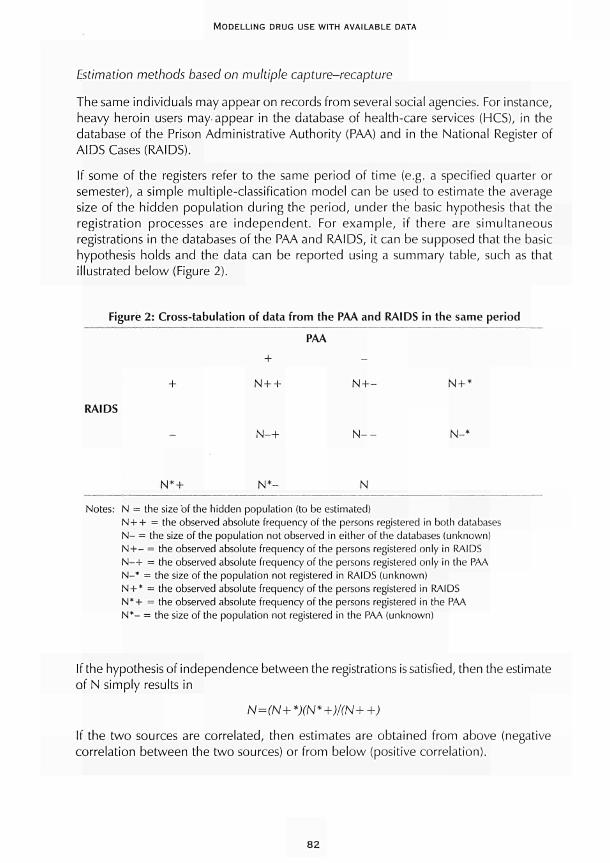
MODELLING DRUG USE WITH AVAILABLE DATA
Estimation methods based on multiple capture-recapture
The same individuals may appear on records from several social agencies. For instance, heavy heroin users may appear in the database of health-care services (HCS), in the database of the Prison Administrative Authority (PAA) and in the National Register of AIDS Cases (RAIDS).
If some of the registers refer to the same period of time (e.g. a specified quarter or semester), a simple multiple-classification model can be used to estimate the average size of the hidden population during the period, under the basic hypothesis that the registration processes are independent. For example, if there are simultaneous registrations in the databases of the PAA and RAIDS, it can be supposed that the basic hypothesis holds and the data can be reported using a summary table, such as that illustrated below (Figure 2).
Figure 2: Cross-tabulation of data from the PAA and RAIDS in the same period
RAIDS
PAA
+
N4-+ N + - N + *
N -+
N*+ N * - N
Notes: N = the size 'of the hidden population (to be estimated) N + + = the observed absolute frequency of the persons registered in both databases N- = the size of the population not observed in either of the databases (unknown) NH— = the observed absolute frequency of the persons registered only in RAIDS N-+ = the observed absolute frequency of the persons registered only in the PAA N-* = the size of the population not registered in RAIDS (unknown) N + * = the observed absolute frequency of the persons registered in RAIDS N*+ = the observed absolute frequency of the persons registered in the PAA N*- = the size of the population not registered in the PAA (unknown)
If the hypothesis of independence between the registrations is satisfied, then the estimate of N simply results in
N=(N+*)(N*+)/(N++)
If the two sources are correlated, then estimates are obtained from above (negative correlation between the two sources) or from below (positive correlation).
82
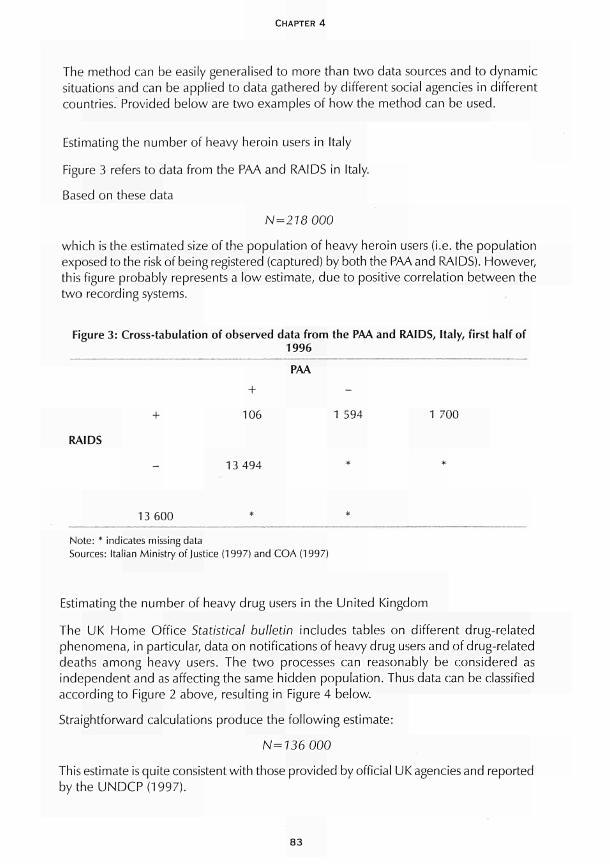
CHAPTER 4
The method can be easily generalised to more than two data sources and to dynamic situations and can be applied to data gathered by different social agencies in different countries. Provided below are two examples of how the method can be used.
Estimating the number of heavy heroin users in Italy
Figure 3 refers to data from the PAA and RAIDS in Italy.
Based on these data
N=218000
which is the estimated size of the population of heavy heroin users (i.e. the population exposed to the risk of being registered (captured) by both the PAA and RAIDS). However, this figure probably represents a low estimate, due to positive correlation between the two recording systems.
Figure 3: Cross-tabulation of observed data from the PAA and RAIDS, Italy, first half of 1996
PAA
+ 106 1 594 1 700
RAIDS
13 494
13 600
Note: * indicates missing data Sources: Italian Ministry of Justice (1997) and COA (1997)
Estimating the number of heavy drug users in the United Kingdom
The UK Home Office Statistical bulletin includes tables on different drug-related phenomena, in particular, data on notifications of heavy drug users and of drug-related deaths among heavy users. The two processes can reasonably be considered as independent and as affecting the same hidden population. Thus data can be classified according to Figure 2 above, resulting in Figure 4 below.
Straightforward calculations produce the following estimate:
N=136 000
This estimate is quite consistent with those provided by official UK agencies and reported bytheUNDCP(1997).
83
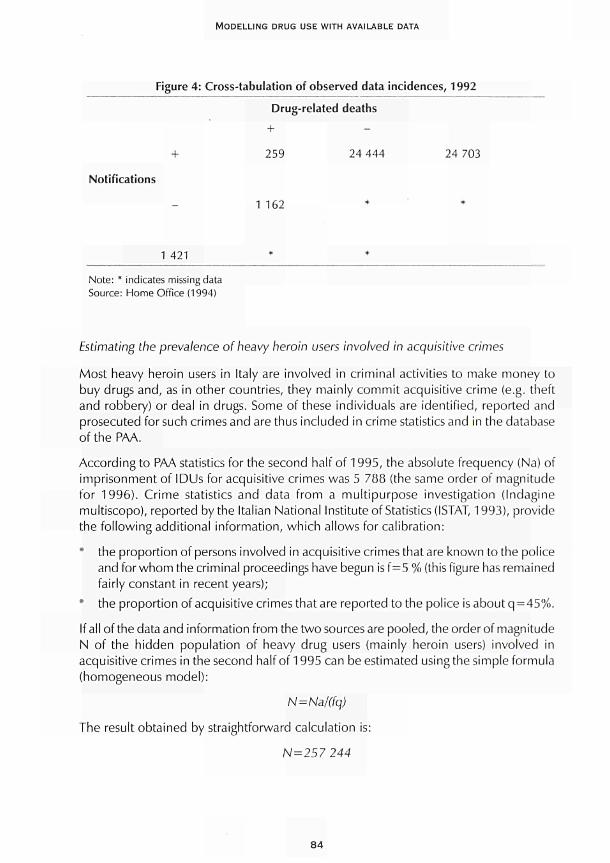
MODELLING DRUG USE WITH AVAILABLE DATA
Figure 4: Cross-tabulation of observed data incidences, 1992
Drug-related deaths
+ + 259 24 444 24 703
Notifications
1 162 *
1 421
Note: * indicates missing data Source: Home Office (1994)
Estimating the prevalence of heavy heroin users involved in acquisitive crimes
Most heavy heroin users in Italy are involved in criminal activities to make money to buy drugs and, as in other countries, they mainly commit acquisitive crime (e.g. theft and robbery) or deal in drugs. Some of these individuals are identified, reported and prosecuted for such crimes and are thus included in crime statistics and in the database of the PAA.
According to PAA statistics for the second half of 1995, the absolute frequency (Na) of imprisonment of IDUs for acquisitive crimes was 5 788 (the same order of magnitude for 1996). Crime statistics and data from a multipurpose investigation (Indagine multiscopo), reported by the Italian National Institute of Statistics (ISTAT, 1993), provide the following additional information, which allows for calibration:
the proportion of persons involved in acquisitive crimes that are known to the police and for whom the criminal proceedings have begun isf=5 % (this figure has remained fairly constant in recent years); the proportion of acquisitive crimes that are reported to the police is about q=45%.
If all of the data and information from the two sources are pooled, the order of magnitude N of the hidden population of heavy drug users (mainly heroin users) involved in acquisitive crimes in the second half of 1995 can be estimated using the simple formula (homogeneous model):
N = Na/(fq)
The result obtained by straightforward calculation is:
N=257 244
84
CHAPTER 4
However, this is presumably a high estimate because of the positive correlation of the events A={an IDU committing an acquisitive crime} and B = {being reported to the police and prosecuted}, due to possible previous notifications.
The order of magnitude obtained is extremely consistent with the estimated size of the hidden population of heavy users, obtained previously on the basis of AIDS and PAA data. It must also be pointed out that the present estimation does not include IDUs who do not commit acquisitive crimes but who nonetheless deal in drugs. It also excludes those not involved in any criminal activity. Indeed, the number of drug users imprisoned for dealing in drugs in the same period is quite high: 6 353. Unfortunately, the same information cannot be used on the proportion of dealers who are reported and prosecuted. Thus data on imprisonment of drug dealers cannot be used as above to improve the estimates. It must also be taken into account that an unknown, and possibly high, proportion of IDUs are involved in both criminal activities.
All of the estimation methods reported above can also be used to estimate the time trends of problem drug use when applied in different time periods. For this purpose, more suitable dynamic models can be used, as shown below.
Estimating the prevalence of heavy heroin users using a Markov mode!
Markov and semi-Markov models can be used to make projections for various phenomena related to drug use. In particular, they can be used to model the spread of the HIV/AIDS epidemic among IDUs and to make inferences about the prevalence of heavy injecting drug users. In the following example, one of the 'simple' dynamic models for the HIV/AIDS epidemic, developed within the EU Concerted action (PL 931723) multinational scenario analysis concerning epidemiological, social and economic aspects of HIV-AIDS on society, is used to estimate the trend of this prevalence in Italy in the period 1990-96, using data from the Italian Ministry of Justice and the PAA. The relationship between the two competitive processes of death (i.e. deaths directly related to drugs and deaths from AIDS) is also addressed (for details on the model and the estimation methods, see Rossi and Schinaia, 1998, and Pasqualucci et al., 1998).
The rationale behind this kind of simple dynamic model is:
* to use only macro parameters that can be mostly estimated using epidemiological data and studies reported in the literature in order to obtain robust forecasting and estimation results;
* to generate projections for available data (in the present case, AIDS-incidence data and mortality data, reported quarterly) also taking into account the processes of under-reporting and reporting delay that affect actual observed data;
* to base the model on only a few internal parameters that mirror different kinds of behaviour affecting the infectivity process, to be estimated by comparing projections and observed data, using suitable statistical methods (e.g. maximum likelihood and minimum χ2).
85
MODELLING DRUG USE WITH AVAILABLE DATA
The rationale for using such models to make inferences on the dynamics of the IDU is:
to use external information to model the relations between injecting drug use and HIV infection, in order to estimate the prevalence of injecting use on the basis of the evaluated HIV/AIDS prevalence;
• to compare the results with those obtained by other sources or methods, in order to validate the estimates and to increase accuracy and robustness.
Some similar ideas can be found in Kaplan and Soloshatz (1993).
As an example, the case of an epidemic mode! which provides the overall prevalence of HIV and AIDS cases separately can be used. By using external information on the proportion of IDUs among HIV-infected individuals, denoted by P(IDU/HIV) = p(HIV) and provided by the HIV surveillance system, and the proportion of HIV-infected individuals among IDUs, denoted by P(HIV/IDU) = q(HIV) and provided by various sources (sample surveys among incarcerated IDUs or IDUs in treatment), the model can provide an estimate of the total number of IDUs, denoted by N(IDU), using the following simple calibration formula based on the total number of HIV-infected individuals, denoted by N(HIV), projected by whichever epidemic model is used:
N(IDU)= N(HIV)P(HIV)
q(HIV)
Similarly, AIDS prevalence can be used in place of HIV prevalence:
N(IDU)= N(AIDS)p(A,DS) q(AIDS)
Unfortunately, the denominators q(HIV) (i.e. the estimated proportion of HIV-infected individuals among IDUs) and q(AIDS) are not always available from routine statistics. For example, neither of the sources available in Italy (i.e. sample surveys of IDUs in the health-care services and surveys of those in prison) distinguish between cases of HIV and AIDS in their official published reports. Thus, only the denominator q(HIV or AIDS) can be used, modifying the above formula as follows:
= N(HIV)p(HIV) + N(AIDS)p(AIDS) q(HIV or AIDS)
In simple terms, the formula divides the current numbers of HIV-infected life-time IDUs, obtained by an epidemic model of the HIV/AIDS epidemic from AIDS cases, by the estimated current rate of infection in IDUs. It must be noted that the results of the estimation method are based only on the projections of the absolute prevalence (number of cases) of HIV and AIDS, obtained by whichever epidemic model is used (numerator of the calibration formula), and on the estimate of the proportion of individuals with HIV or AIDS among IDUs (denominator of the calibration formula), coming from official statistics, which are easily obtainable. It must be noted that the results are sensitive to uncertainties both in the numerator and the denominator, and these uncertainties become particularly important when present in the denominator. For example, if the estimated denominator is 2 % and the country's actual denominator is 4 %, the error of
86
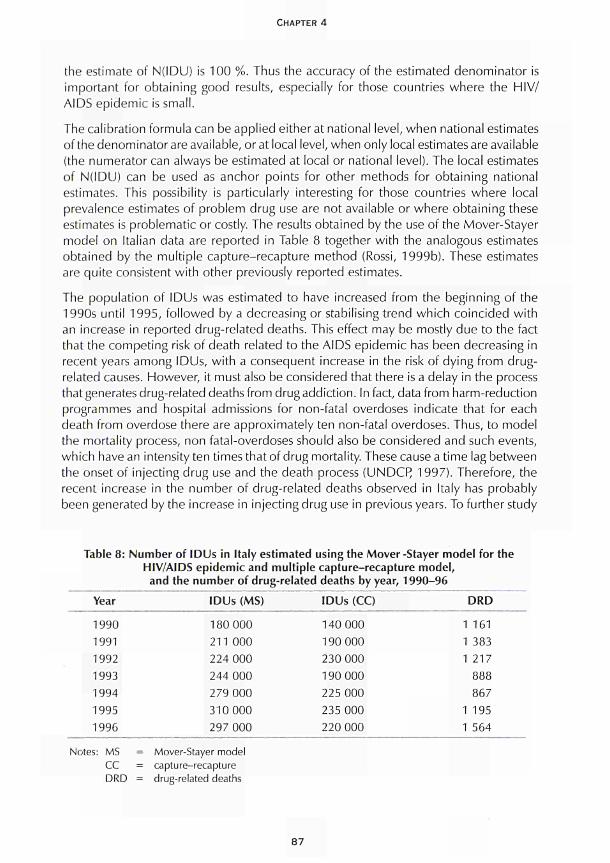
CHAPTER 4
the estimate of N(IDU) is 100 %. Thus the accuracy of the estimated denominator is important for obtaining good results, especially for those countries where the HIV/ AIDS epidemic is small.
The calibration formula can be applied either at national level, when national estimates of the denominator are available, or at local level, when only local estimates are available (the numerator can always be estimated at local or national level). The local estimates of N(IDU) can be used as anchor points for other methods for obtaining national estimates. This possibility is particularly interesting for those countries where local prevalence estimates of problem drug use are not available or where obtaining these estimates is problematic or costly. The results obtained by the use of the Mover-Stayer model on Italian data are reported in Table 8 together with the analogous estimates obtained by the multiple capture-recapture method (Rossi, 1999b). These estimates are quite consistent with other previously reported estimates.
The population of IDUs was estimated to have increased from the beginning of the 1990s until 1995, followed by a decreasing or stabilising trend which coincided with an increase in reported drug-related deaths. This effect may be mostly due to the fact that the competing risk of death related to the AIDS epidemic has been decreasing in recent years among IDUs, with a consequent increase in the risk of dying from drug-related causes. However, it must also be considered that there is a delay in the process that generates drug-related deaths from drug addiction. In fact, data from harm-reduction programmes and hospital admissions for non-fatal overdoses indicate that for each death from overdose there are approximately ten non-fatal overdoses. Thus, to model the mortality process, non fatal-overdoses should also be considered and such events, which have an intensity ten times that of drug mortality. These cause a time lag between the onset of injecting drug use and the death process (UNDCF) 1997). Therefore, the recent increase in the number of drug-related deaths observed in Italy has probably been generated by the increase in injecting drug use in previous years. To further study
Table 8: Number of IDUs in Italy estimated using the Mover -Stayer model for the HIV/AIDS epidemic and multiple capture-recapture model, and the number of drug-related deaths by year, 1990-96
Year
1990 1991 1992 1993 1994 1995 1996
Notes: MS = CC = DRD =
= Mover-= capture = drug-re
IDUs (MS)
180 000 211 000 224 000 244 000 279 000 310 000 297 000
Stayer model :-recapture lated deaths
IDUs (CC)
140 000 190 000 230 000 190 000 225 000 235 000 220 000
DRD
1 161 1 383 1 217
888 867
1 195 1 564
87
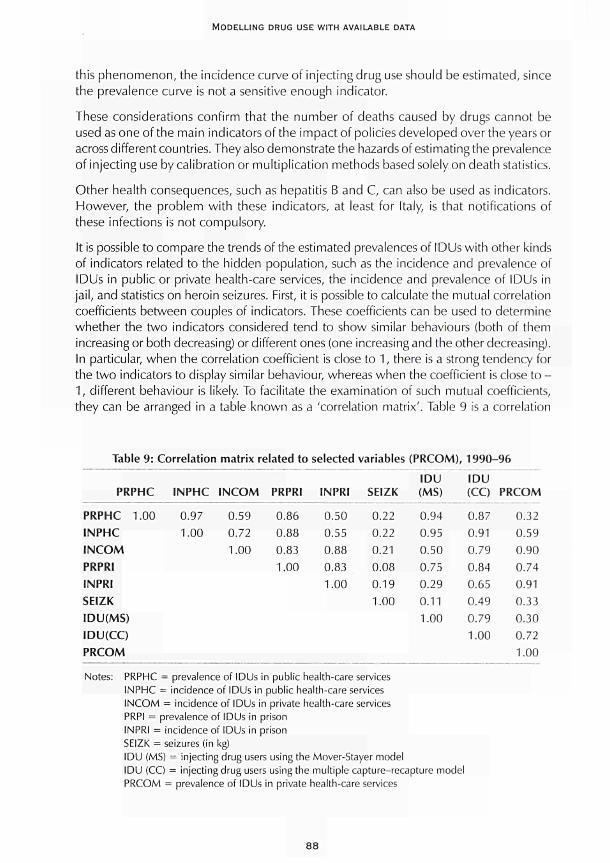
MODELLING DRUG USE WITH AVAILABLE DATA
this phenomenon, the incidence curve of injecting drug use should be estimated, since the prevalence curve is not a sensitive enough indicator.
These considerations confirm that the number of deaths caused by drugs cannot be used as one of the main indicators of the impact of policies developed over the years or across different countries. They also demonstrate the hazards of estimating the prevalence of injecting use by calibration or multiplication methods based solely on death statistics.
Other health consequences, such as hepatitis Β and C, can also be used as indicators. However, the problem with these indicators, at least for Italy, is that notifications of these infections is not compulsory.
It is possible to compare the trends of the estimated prevalences of IDUs with other kinds of indicators related to the hidden population, such as the incidence and prevalence of IDUs in public or private health-care services, the incidence and prevalence of IDUs in jail, and statistics on heroin seizures. First, it is possible to calculate the mutual correlation coefficients between couples of indicators. These coefficients can be used to determine whether the two indicators considered tend to show similar behaviours (both of them increasing or both decreasing) or different ones (one increasing and the other decreasing). In particular, when the correlation coefficient is close to 1, there is a strong tendency for the two indicators to display similar behaviour, whereas when the coefficient is close to -1, different behaviour is likely. To facilitate the examination of such mutual coefficients, they can be arranged in a table known as a 'correlation matrix'. Table 9 is a correlation
Table 9: Correlation matrix related to selected variables (PRCOM) , 1 9 9 0 - 9 6
PRPHC
PRPHC 1.00 1NPHC INCOM PRPRI INPRI SEIZK IDU(MS) IDU(CC) PRCOM
INPHC
0.97 1.00
INCOM
0.59 0.72 1.00
PRPRI
0.86 0.88 0.83 1.00
INPRI
0.50 0.55 0.88 0.83 1.00
SEIZK
0.22 0.22 0.21 0.08 0.19 1.00
IDU (MS)
0.94 0.95 0.50 0.75 0.29 0.11 1.00
IDU (CC)
0.87 0.91 0.79 0.84 0.65 0.49 0.79 1.00
PRCOM
0.32 0.59 0.90 0.74 0.91 0.33 0.30 0.72 1.00
Notes: PRPHC = prevalence of IDUs in public health-care services INPHC = incidence of IDUs in public health-care services INCOM = incidence of IDUs in private health-care services PRPI = prevalence of IDUs in prison INPRI = incidence of IDUs in prison SEIZK = seizures (in kg) IDU (MS) = injecting drug users using the Mover-Stayer model IDU (CC) = injecting drug users using the multiple capture-recapture model PRCOM = prevalence of IDUs in private health-care services
88
CHAPTER 4
matrix that allows a straightforward comparison to be made among the estimated prevalences of injecting drug use and the other indicators of interest.
All of the values of the correlation coefficients between the statistics directly related to the extent of injecting heroin use and the prevalence estimates are significantly high, except those related to seizure statistics, which strongly depend on repression policies and the type of police interventions. These high values of the correlation constitute an indirect validation of the estimation procedures used. This confirms the agreement between some important indicators of drug-related phenomena and the prevalence estimates reported above.
Conclusions
The main purpose of this chapter was to demonstrate the use of available routine data and of dynamic models for estimating the number of problem drug users. With respect to other methods which can be applied to estimate the same hidden population, the models presented here allow for the use of data that are generally available in most Western countries.
In any case, due to the various uncertainties, related both to data and models, several models and methods should be applied whenever possible in order to obtain the best description of the hidden population of interest. In the previous sections, this joint use of different methods allowed some conclusions to be drawn, at least regarding trends and the order of magnitude of the population.
The observed agreement in the prevalence trends estimated by different methods allows some indicators to be used for monitoring different control interventions, at least from a qualitative point of view. It must again be stressed that better analysis could be performed to monitor interventions on the basis of the incidence curve of injecting drug use.
References
Centro Operativo AIDS (COA), Istituto Superiore di Sanità (1997). Sindrome da Immunodeficienza acquisita in Italia, aggiornamento dei casi notificati al 31 dicembre 1996. Rome: COA.
Conti, S., Farchi, G., Masocco, M., Rezza, G., Toccaceli, V., Rossi, C. (1999) 'Mortality from overdose in Italy: 1984-1993'. Statistica applicata 11: 515-23.
European Centre for the Epidemiological Monitoring of AIDS (1996). HIV/AIDS surveillance in Europe 1994-1996. Paris: European Centre for the Epidemiological Monitoring of AIDS.
Home Office (1994). 'Home Office Research and Statistics Department "Statistics of drug addicts notified to the Home Office", United Kingdom, 1993'. Statistical Bulletin 10.
Istituto Nazionale di Statistica (ISTAT) (1993). 'I fatti delittuosi: caratteristiche degli eventi e delle vittime'. Indagine multiscopo sulle famiglie, anni 1987-91 5.
89
MODELLING DRUG USE WITH AVAILABLE DATA
Ministero di Grazia e Giustizia, Dipartimento per l'amministrazione penitenziaria, Ufficio studi, ricerche, legislazione e automazione, Divisione II - Statistica (1997). Indagine nazionale sui soggetti tossicodipendenti e affetti da virus HIV negli istituti di pena al 31/12/96. Rome: Italian Ministry of Justice.
Kaplan, E., Soloshatz, D. (1993). 'How many drug injectors are there in New Haven? Answers from AIDS data'. Mathematical and Computer Modelling 1 7: 109-1 5.
National Instituteon Drug Abuse (NI DA) (1990). Collection and interpretation of data (rom hidden populations. Research Monograph No. 98. Rockville, MD: NIDA.
Olsson, O., Byqvist, S., Gomer, G. (1992). Del tunga narkotika-missbrikets omfattning i Sverige 1992. Report no. 28. Stockholm: Swedish Council for Information on Alcohol and Other Drugs (CAN).
Pasqualucci, C , Ravà, L., Rossi, C , Schinaia, G. (1998). 'Estimating the size of the HIV/AIDS epidemic: complementary use of empirical bayesian back calculation and the mover-stayer model for gathering the largest amount of information'. Simulation 71 (4): 213-27.
Rossi, C. (1999a). 'Monitoring drug control strategies: hidden phenomena, observable events, observable times'. International Journal of Drug Policy 10: 131-44.
Rossi, C. (1999b ). 'Estimating the prevalence of injecting drug users on the basis of Markov models of the HIV/AIDS epidemic: applications to Italian data'. Health Care Management Science 2: 173-9.
Rossi, C , Schinaia, G. (1998). 'The mover stayer model for HIV/AIDS epidemic in action'. Interfaces 28 (3): 127-43.
Stovali, M. (1993). 'Un esempio di applicazione della tecnica delle risposte casualizzate'. Induzioni 7: 49-57.
Swedish Council for Information on Alcohol and Other Drugs (CAN) (1996). On the alcohol and drug situation in Sweden. Report no. 96. Stockholm: CAN.
United Nations International Drug Control Programme (UNDCP) (1997). World drug report. Oxford: Oxford University Press.
United Nations International Drug Control Programme (UNDCP) (1994). Substance abuse related mortality: a worldwide review. Vienna: UNDCR
90
CHAPTER 5
MULTIPLE-INDICATOR MODELS
Roberto Mollica and Fabio Mariani
Dynamic multiple-indicator models start from the choice of indicators and data available. However, drug-related problems are related to the context in which they occur. Dynamic evolution of drug use, markets and consumption may vary among countries, and in each country among different local and geographic areas, such as rural, suburban or urban sites. For the rest of this chapter, the geographic area understudy is referred toas the'location'. The target and risk-exposed population is only a part of the total population of the considered geographic area. Law enforcement and penalties, addiction treatment and care availability, diseases related to illicit drug use and consequent social costs also vary across and within countries.
These general considerations show that working on a multiple-indicator model involves being aware of the overlapping aspects which contribute to defining the model and its outputs. In this chapter, a monitoring model is proposed which could predict changes in the main aspects of drug use and related diseases over time. To pursue this aim the use of cause-effect relationships among some indicators is hypothesised. Because of the delay between the effect to be observed and the factors which cause that effect, a dynamic model capable of providing predictions can be created. Starting from these concepts, the model building and its difficulties are discussed in turn.
As known, every 'location' will have its own approach to drug use and related problems. A common model which could be applied to different locations would not necessarily emerge from individual studies. Specific sets of indicators relevant to the study location may be developed. This would, however, complicate the data-collection requirements of such models. If comparisons are being made across large geographic areas, then there may be considerable differences between the models.
The other main characteristic of dynamic models is the collection of data over time. The chosen indicators have also to be real and timely to give up-to-date information.
How the model works
In this chapter, a simple but effective definition of indicators is proposed to allow the same collection for different populations and/or different 'locations' at different times.
To make model applicability easier, the following indicators are suggested as shared characteristics which can be collected in every context. They are classified into three
91
MODELLING DRUG USE WITH AVAILABLE DATA
main groups: social (S); legal (L); and medical (M). It is then demonstrated how the defined indicators could be combined in a dynamic model.
Social indicators
This group involves the most meaningful parameters for social data and situations commonly observed in an addict's life. They are considered as risk factors and can also be used as predictor factors. The data for these indicators can be acquired from national data sources on the general population and can be considered as indicators of social disruption.
51 disaggregate familiar nuclei: separation and divorce can be linked to this item as indirect demonstrations of life stress. 52 total unemployed people: this reflects social general entity of welfare. Lack of welfare generally leads to crime and illicit activities. 53 interruption after primary school: this is akin to a condition that reflects an early predisposition to anti-social behaviour.
Legal indicators
This second group of indicators includes detected offences related to drug problems. Such indicators may be very sensitive to context changes like the spread of new drugs and new kinds of addiction. It may be possible to use such indicators as early-warning measures of emerging trends.
LI drug-related law offences: easy and simple evidence about the size and characteristics of the black market and major crimes concerning drug use and problems. In the case of seizures, the type of drug seized may be indicative of market/consumer orientation.
L2 minor offences: generally these indicate how great is the use of illicit drugs as street addicts are involved in this kind of offence to maintain their drug needs. L3 under-age arrests: this item could address the 'at risk' population which will still be present in the future.
Medical indicators
While the social and legal indicators are probably easy to acquire from national and/or local reports, not all locations may currently have the proposed health and treatment data. However, it is hypothesised that these would match the aims of developing dynamic models.
M7 treated drug users: in particular, this item is valid in the locations where treatments are offered to addicts. Some kinds of treatment define the population, as methadone treatment does for heroin addicts. For these reasons, the variable could not be considered for the analysis of some drug issues.
9 2
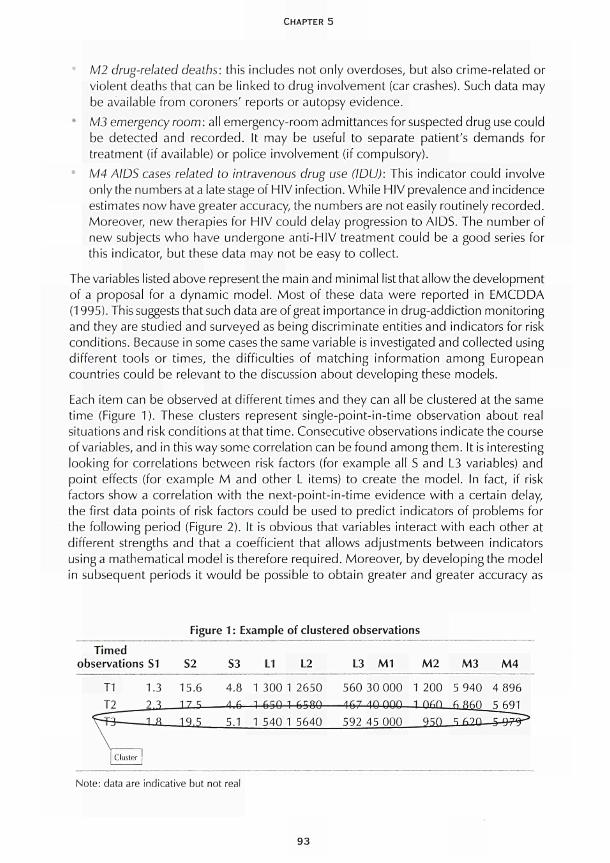
CHAPTER 5
M2 drug-related deaths: this includes not only overdoses, but also crime-related or violent deaths that can be linked to drug involvement (car crashes). Such data may be available from coroners' reports or autopsy evidence.
* M3 emergency room: all emergency-room admittances for suspected drug use could be detected and recorded. It may be useful to separate patient's demands for treatment (if available) or police involvement (if compulsory). M4 AIDS cases related to intravenous drug use (IDU): This indicator could involve only the numbers at a late stage of HIV infection. While HIV prevalence and incidence estimates now have greater accuracy, the numbers are not easily routinely recorded. Moreover, new therapies for HIV could delay progression to AIDS. The number of new subjects who have undergone anti-HIV treatment could be a good series for this indicator, but these data may not be easy to collect.
The variables listed above represent the main and minimal list that allow the development of a proposal for a dynamic model. Most of these data were reported in EMCDDA (1995). This suggests that such data are of great importance in drug-addiction monitoring and they are studied and surveyed as being discriminate entities and indicators for risk conditions. Because in some cases the same variable is investigated and collected using different tools or times, the difficulties of matching information among European countries could be relevant to the discussion about developing these models.
Each item can be observed at different times and they can all be clustered at the same time (Figure 1). These clusters represent single-point-in-time observation about real situations and risk conditions at that time. Consecutive observations indicate the course of variables, and in this way some correlation can be found among them. It is interesting looking for correlations between risk factors (for example all S and L3 variables) and point effects (for example M and other L items) to create the model. In fact, if risk factors show a correlation with the next-point-in-time evidence with a certain delay, the first data points of risk factors could be used to predict indicators of problems for the following period (Figure 2). It is obvious that variables interact with each other at different strengths and that a coefficient that allows adjustments between indicators using a mathematical model is therefore required. Moreover, by developing the model In subsequent periods it would be possible to obtain greater and greater accuracy as
Figure 1: Example of clustered observations
Timed observations S1
T1 1.3 T2 7.3
frri^lZZã_ vT_ Cluster
S2
15.6 17 ς
19.5
S3
4.8
4 6
5.1
L1 L2
1 300 1 2650
1 650 1 6580
1 540 1 5640
L3 M1
560 30 000 /|fi-7 /\n OQ0
592 45 000
M2
1 200 1 nsn
950
M3
5 940 6 860
M4
4 896 5 691
Note: data are indicative but not real
93
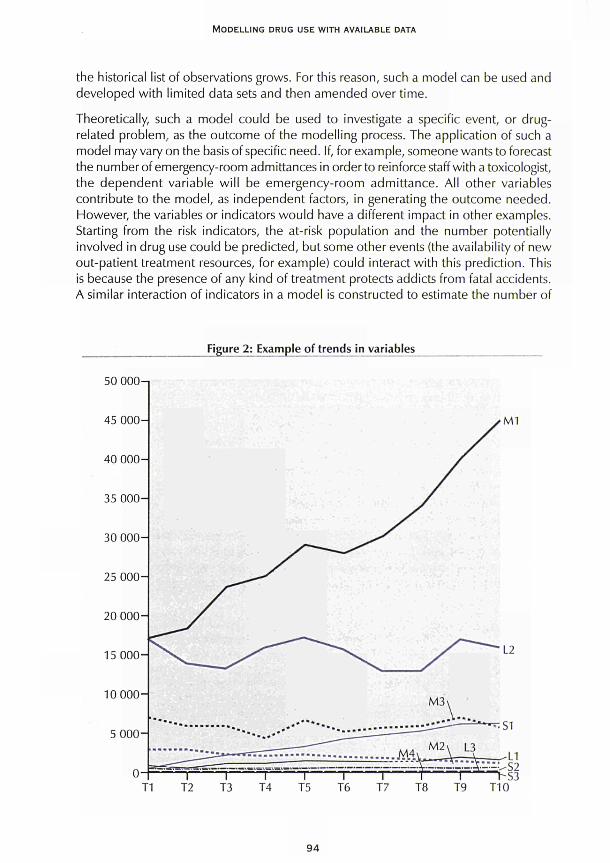
MODELLING DRUG USE WITH AVAILABLE DATA
the historical list of observations grows. For this reason, such a model can be used and developed with limited data sets and then amended over time.
Theoretically, such a model could be used to investigate a specific event, or drug-related problem, as the outcome of the modelling process. The application of such a model may vary on the basis of specific need. If, for example, someone wants to forecast the number of emergency-room admittances in order to reinforce staff with a toxicologist, the dependent variable will be emergency-room admittance. All other variables contribute to the model, as independent factors, in generating the outcome needed. However, the variables or indicators would have a different impact in other examples. Starting from the risk indicators, the at-risk population and the number potentially involved in drug use could be predicted, but some other events (the availability of new out-patient treatment resources, for example) could interact with this prediction. This is because the presence of any kind of treatment protects addicts from fatal accidents. A similar interaction of indicators in a model is constructed to estimate the number of
Figure 2: Example of trends in variables
50 OOO-i
9 4
CHAPTER 5
drug-related deaths. The introduction of methadone treatment protects from street opiate overdoses but not deaths from car crashes or those due to the abuse of other substances. On the basis of their involvement in the model, variables can be independent factors or co-factors and, moreover, both multiple correlation and multiple collinearity may apply in the model. Another example concerns predicting minor offences. The number of minor offences recorded is related to the number of people involved in illicit drug use, especially the number of street users, to the rate of unemployment and to the presence/absence of treatment units. Moreover, the model could address the effectiveness and efficiency of new laws regarding addicts or new therapeutic approaches.
Two Italian experiences illustrate the potential. The first example is from a study in Sardinia into methadone take-home prohibited by a new law at the beginning of the 1990s. It was seen from a time series of indicators that the application of the new law resulted in a dramatic reduction in the treated population. In fact, many addicts preferred to quit treatment hoping to abstain from any drug use rather than lose the job they were able to preserve or had found during treatment. The second example is from Milan and was a study performed by one of the authors of this paper. It was seen that low-threshold methadone intervention at a public out-patient unit located in city suburbs resulted in a growth in the treated population (ten-fold in three years), a reduction in unemployment rates, low HIV incidence and improvements in welfare through monitoring indicators.
The model suggested shows flexibility and can be personalised to suit specific needs. For example (how many people will attend treatment units...) in 'locations' (...in Italy...) over time (...in next two years?).
Some weak points to these data-driven models must, however, be underlined. For example, people presenting risk factors could be already involved in drug problems which cannot be recorded at that time. They can only be recorded when there is the evidence of involvement and when variables (estimates at a point in time) demonstrate what is the known situation of the drug use. The sense of the model, however, is not to fit a drug-addict population estimate, even if a capture-recapture model could implement these data, but rather to investigate dynamic relationships.
Other issues emerge if a specific population, such as those aged 15 to 44, is considered, and if how great is the phenomenon to be observed is defined. A selected population will have limited variations over a long time and small average changes from one time period to the next. Absolute observation could be recorded and used in the model, but this would not reflect the prevalence rate.
Another bias is delay between causes and effects. Time intervals may vary in these models from months to years. In a study of a population of addicts, it took an average of ten years (with low standard deviation) between the onset of addiction and enrolment in a therapeutic programme. This means that the course of addiction follows some general rules: onset during adolescence and youth; continuous use until young adult age; and treatment attempts. The first period corresponds to the S1, S3 and L3 variables, the second to S2, L1, L2, M2 and M3, and the last one to M1 and M4. It could not be
95
MODELLING DRUG USE WITH AVAILABLE DATA
the same for other countries where prevention strategies allow early admittance to treatment or where law-enforcement agencies impose increasingly severe penalties or, again, where HIV/AIDS has a low impact on social health (for example the north to south gradient of prevalence and incidence in Italy). As generally a small 'location' will keep the same characteristics over several years, it is possible to predict the future situation of a requested target outcome. If the number of minor offences or unemployment are found to follow primary-school interruption over a one-year period it will then be possible to hypothesise the importance of next year's minor offences or unemployment predicted by other co-factors or collinearities if the number of last year's school interruptions is known. As has been reported, the ten years' gap between illicit drug-use onset and admittance to treatment could give an accurate idea of how many people will be treated within the coming years. This would allow for planning the development of new units or, conversely, the closure of opened ones.
The dynamic model controls itself every time data are updated. Unexpected results can be used to allow the model to verify its accuracy and correct contingent trends. As observations can be scheduled differently (every month, every year or every week), it is also possible to develop a short-, medium- or long-period forecast when cause-effect relationships are linked by different time periods. The figures below explain model construction and development with hypothetical data. Each cell represents a value, each column a variable and each row a cluster. In Figure 3, a 15-period observation is simulated and each cell is labelled by variable name and registration time to make it recognisable at the next step.
In Figure 4, the delay periods which link the cause-effect relationships among the variables are hypothesised.
At this point there are both tabled data and delay times. Moving columns (variables) by the time of their delay gives a new figure (Figure 5); each row shows the situation arranged by variable time links, and new clusters are now generated. Linked clusters would match the real temporal relationships between variables.
Blue labels are data which could be estimated if variables show correlations with each other. In other words, these are the target indicators the dynamic multiple-indicator model is intended to predict. Simple bivariate correlations allow a first indication about how variables are coupled and related, and it could be the first meaningful target to reach. To understand how much a variable is influenced by others, regression models have to be applied. The evidence gained in such analysis gives the strength of the relationship between the independent factors and the dependent one. If any relationship is observed, blue-labelled cells can be estimated as there is a forecast for each of them. In this hypothetical example, most of the variables have long delay periods in reference to M1 and M4 factors making possible a long-term forecast about these two variables which are 'well controlled' by real data; M1/T25 cell hypothesis will be less precise because they depend on other derived values (all blue ones).
96
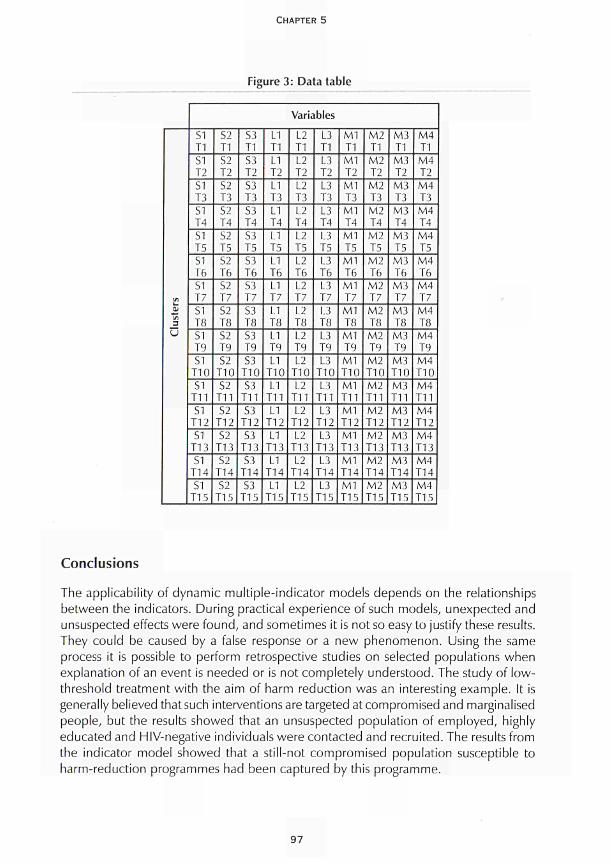
CHAPTER 5
Figure 3: Data table
(rt Ol tn 3
υ
Variables
S1 T1 S1 T2 S1 T3 S1 T4 S1 T5 S1 T6 S1 T7 S1 T8 SI T9 S1
T10 S1
T11 SI
T12 S1
T13 S1
TI 4 S1
T15
S2 T1 S 2 T2 S2 T3 S2 T4 S2 T5 S2 T6 S2 T7 S2 T8 S2 T9 S2
T10 S2
T11 S2
T12 S2
T13 S2
T14 S2
T15
S3 T1 S3 T2 S3 T3 S3 T4 S3 T5 S3 T6 S3 T7 S3 T8 S3 T9 S3
T10 S3
T11 S3
T12 S3
T I 3 S3
T14 S3
T15
L1 T1 L1 T2 L1 T3 L1 T4 L1 T5 LI T6 L1 T7 L1 Τ8 L1 Τ9 L1
Τ10 L1
Τ11 L1
Τ12 L1
Τ13 L1
Τ14 L1
Τ15
L2 Τ1 L2 Τ2 L2 Τ3 L2 Τ4 L2 Τ5 L2 Τ6 L2 Τ7 L2 Τ8 L2 Τ9 L2
Τ10 L2
Τ11 L2
Τ12 L2
Τ13 L2
Τ14 L2
Τ15
L3 Τ1 L3 Τ2 L3 Τ3 L3 Τ4 L3 Τ 5 L3 Τ6 L3 Τ7 L3 Τ8 L3 Τ9 L3
Τ10 L3
Τ11 L3
Τ12 L3
Τ13 L3
Τ14 L3
Τ15
Μ1 ΓΙ
Μ1 Τ2 Μ1 Τ 3 Μ1 Τ4 Μ1 Τ 5 Μ1 Τ6 Μ1 Τ7 Μ1 Τ8 Μ1 Τ9 Μ1 Τ10 ΜΙ Τ11 Μ1 ΤΙ 2 Μ1 ΤΙ 3 ΜΙ ΤΙ 4 Μ1 Τ15
Μ2 Τ1 Μ2 Τ2 Μ2 Τ 3 Μ2 Τ4 Μ2 Τ5 Μ2 Τ6 Μ2 Τ7 Μ2 Τ8 Μ2 Τ9 Μ2 Τ10 Μ2 Τ11 Μ2 Τ12 Μ2 Τ13 Μ2 Τ14 Μ2 Τ15
Μ3 Τ1 Μ3 Τ2 Μ3 Τ3 Μ3 Τ4 Μ3 Τ5 Μ3 Τ6 Μ3 Τ7 Μ3 Τ8 Μ3 Τ9 Μ3 Τ10 Μ3 Τ11 Μ3 Τ12 Μ3 Τ13 Μ3 Τ14 Μ3 Τ15
Μ4 ΤΙ Μ4 Τ2 Μ4 Τ3 Μ4 Τ4 Μ4 Τ5 Μ4 Τ6 Μ4 Τ7 Μ4 Τ8 Μ4 Τ9 Μ4 Τ10 Μ4 Τ11 Μ4 Τ12 Μ 4 ΤΙ 3 Μ4 Τ14 Μ4 Τ15
Conclusions
The applicability of dynamic multiple-indicator models depends on the relationships between the indicators. During practical experience of such models, unexpected and unsuspected effects were found, and sometimes it is not so easy to justify these results. They could be caused by a false response or a new phenomenon. Using the same process it is possible to perform retrospective studies on selected populations when explanation of an event is needed or is not completely understood. The study of low-threshold treatment with the aim of harm reduction was an interesting example. It is generally believed that such interventions are targeted at compromised and marginalised people, but the results showed that an unsuspected population of employed, highly educated and HIV-negative individuals were contacted and recruited. The results from the indicator model showed that a still-not compromised population susceptible to harm-reduction programmes had been captured by this programme.
97
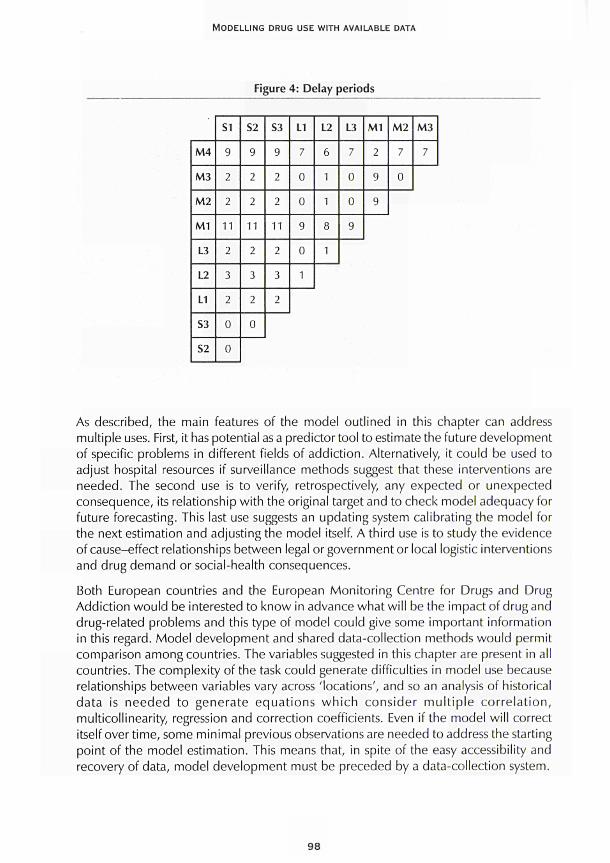
MODELLING DRUG USE WITH AVAILABLE DATA
Figure 4: Delay periods
M4
M3
M2
M1
L3
L2
L1
S3
S2
S1
9
2
2
11
2
3
2
0
0
S2
9
2
2
11
2
3
2
0
S3
9
2
2
11
2
3
2
L1
7
0
0
9
0
1
L2
6
1
1
8
1
L3
7
0
0
9
M1
2
9
9
M2
7
0
M 3
_
As described, the main features of the model outlined in this chapter can address multiple uses. First, it has potential as a predictor tool to estimate the future development of specific problems in different fields of addiction. Alternatively, it could be used to adjust hospital resources if surveillance methods suggest that these interventions are needed. The second use is to verify, retrospectively, any expected or unexpected consequence, its relationship with the original target and to check model adequacy for future forecasting. This last use suggests an updating system calibrating the model for the next estimation and adjusting the model itself. A third use is to study the evidence of cause-effect relationships between legal or government or local logistic interventions and drug demand or social-health consequences.
Both European countries and the European Monitoring Centre for Drugs and Drug Addiction would be interested to know in advance what will be the impact of drug and drug-related problems and this type of model could give some important information in this regard. Model development and shared data-collection methods would permit comparison among countries. The variables suggested in this chapter are present in all countries. The complexity of the task could generate difficulties in model use because relationships between variables vary across 'locations', and so an analysis of historical data is needed to generate equations which consider mult iple correlation, multicollinearity, regression and correction coefficients. Even if the model will correct itself over time, some minimal previous observations are needed to address the starting point of the model estimation. This means that, in spite of the easy accessibility and recovery of data, model development must be preceded by a data-collection system.
98
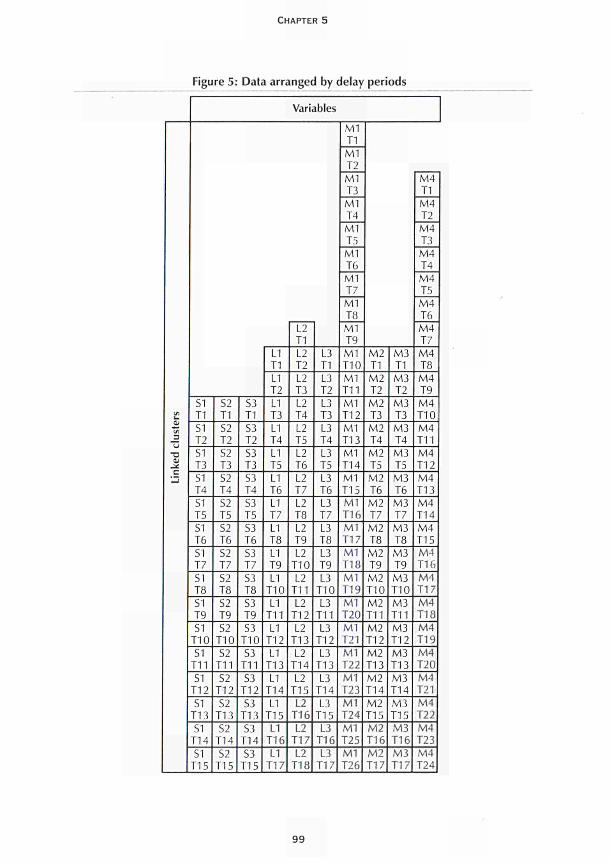
CHAPTER 5
Figure 5: Data arranged by delay periods
L. 01 (Λ
J3 U
•a _¿
Variables
SI T1
SI T2
S1 T3
SI T4
S1 T5
S1 T6
S1 T7
SI T8
SI T9
S1 T10
S1 T11
S1 T12
SI TI 3
SI T14
SI T15
S2 T1
S2 T2
S2 T3
S2 T4
S2 T5
S2 T6
S2 T7
S2 T8
S2 T9
S2 T10
S2 T11
S2 T12
S2 TI 3
S2 T14
S2 T15
S3 T1
S3 T2
S3 Τ 3
S3
T4
S3
T5
S3
T6
S3
T7
S3
T8
S3
T9
S3
T10
S3
T11
S3
T12
S3
T13
S3
T14
S3
T15
L1
T1
L1
T2
L1
T3
L1
T4
L1
T5
LI T6
L1 T7
L1 T8
L1 T9
L1 T10
L1 T11
L1 T12
L1 T13
L1 T14
L1 T15 LI
T16
L1 TI 7
L2 T1
L2 T2
L2 T3
L2 T4
L2 T5
L2 T6
L2 T7
L2 T8
L2 T9
L2 T10
L2 T11
L2 T12
L2 T13
L2 T14
L2 T15
L2 T16
L2 T17
L2 T18
L3 T1
L3 T2
L3 T3
L3 T4
L3 T5
L3 T6
L3 T7
L3 T8
L3 T9
L3 T10
L3 T11
L3 T12
L3 T13
L3 T14
L3 T15
L3 T16
L3 TI 7
M l T1
M1 T2
M l T3
M1 T4
M1 T5
M1 T6
M1 T7
M1 T8
M1 T9
M1 T10
M1 T11
M1 T12
M1 T13
M1 T14
M1 T15 M1 T16
M1 T17
M l T18
M1 T19
M l T20
M l T21
M1 T22
Ml T23
M1 T24
M1 T25
M1 T26
M2 T1
M2 T2
M2 T3
M2 T4
M2 T5
M 2 T6
M2 T7
M2 T8
M2 T9
M2 T10
M2 T11
M2 T12
M2 T13
M2 T14
M2 T15 M2 T16
M2 T17
M3 T1
M3 T2
M3 T3
M3 T4
M3 T5
M3 T6
M3 T7
M3 T8
M3 T9
M 3 T10
M3 T11
M3 T12
M3 T13
M3 T14
M3 T15 M3 TI 6
M3 T17
M4 T1
Μ4 Τ2
Μ4 Τ3
Μ4 Τ4
Μ4 Τ5
Μ4 Τ6
Μ4 Τ7
Μ4 Τ8
Μ4 Τ9
Μ4 Τ10
Μ4 Τ11
Μ4 Τ12
Μ4 Τ13
Μ4 Τ14
Μ4 Τ15 Μ4 Τ16
Μ4 Τ17
Μ4 Τ18 Μ4 Τ19
Μ4 Τ20
Μ4 Τ21
Μ4 Τ22
Μ4 Τ23
Μ4 Τ24
9 9
MODELLING DRUG USE WITH AVAILABLE DATA
Finally, developing these types of models involves a shared and simple monitoring activity with predictor characteristics. Many institutions involved in drug problems would like to know in advance how many people will use illicit drugs or will be HIV positive in the AIDS phase or will be exposed to risk of death or, again, will have legal problems as a drug consumer. Moreover, the model has built in the possibility of verifying its own forecasts and developments in model effectiveness and efficiency. The opportunity of retrospective clinical and social studies will allow the acquisition of experiences which lead to increasingly helpful suggestions to reduce drug demand.
References
European Monitoring Centre for Drugs and Drug Addiction (EMCDDA) (1995). Annual report on the state of the drugs problem in the European Union. Lisbon: EMCDDA.
100
MODELLING TECHNIQUES AND
THEIR USES

INTRODUCTION
/
n Chapter 6, Comiskey and Hay present the back-calculation (BC) method as a tool to estimate unobserved incidence of a disease from observed data and to account for a latency time to onset of disease. This method has been extensively used and
further developed to estimate HIV incidence from observed AIDS data. The authors discuss the application of BC models to drugs data, for example, for estimating onset incidence of problem use from observed treatment data and the need for research into the 'incubation time' or latency time from first drug use to first treatment.
Hay and Comiskey discuss in Chapter 7 the application of compartmental models in different fields, notably infectious-diseases epidemiology, and their usefulness for estimating drug use. They introduce the concept of deterministic and stochastic models with their different implications for results (existence or not of random variation) and method of analysis (mathematical versus computational). The authors raise relevant questions about the applicability of models to describe the spread of drug use, given the basic uncertainty and lack of consensus about underlying mechanisms and definitions and lack of adequate data.
In Chapter 8, Taylor and Young distinguish static and dynamic models, defining the latter as those in which a population is traced over time. A series of basic issues concerning dynamic modelling are discussed, including time frame and geographic boundaries of a prevalence-estimation exercise, types and levels of drugs used and the relationship between definitions of drug use and the use of data sources. The authors also describe and evaluate a number of modelling techniques adopted in this class of model. Finally, system-dynamic modelling is discussed, which describes an interconnected set of endogenous feedback mechanisms (time movements and accumulations of people, materials and information), most of which are not observable but which generate observable output over time.
In their following chapter, Taylor and Young describe the use of factor analysis to either confirm or explore underlying latent variables from observed variables. The authors argue that working with composite latent variables is often nearer to reality than interpreting use of each drug separately, as most drug users are polydrug users and there are different and combined ways of using (e.g. moderate or heavy alcohol use in combination with other drugs). Taylor and Young then discuss structural-equation modelling and conclude that these highly complex models are difficult to manage and are of less practical value, but are a potentially very useful explorative tool to understand how underlying theoretical concepts can be fitted into models of drug prevalence.
103

CHAPTER 6
THE METHOD OF BACK CALCULATION AS A MEANS
OF ESTIMATING INCIDENCE
Catherine Comiskey and Gordon Hay
The method of back calculation uses knowledge of the numbers of AIDS cases (after adjustment for reporting delays) and information on the incubation period distribution to derive estimates of those previously infected with the HIV virus. This method has been widely adopted by statisticians and mathematicians working in the United States and in Europe as a means of providing essential estimates of the unknown numbers who are HIV infectious and short-term predictions of future numbers with AIDS. This chapter provides a detailed, non-technical description of the method. Working with the first estimates based on Irish AIDS cases, the anomalies in the method with respect to the Irish data are illustrated. They are then confirmed by comparing the results with those derived in the UK and US and highlighting the limitations inherent in the approach. It is discussed where the method has been applied in the past and suggestions are made for future model developments and applications within drug research. A critical assessment of the model type is given for future use as well as recommendations on its use and feasibility.
Model description
Knowledge of the numbers infected with the HIV virus and of the incubation period distribution allows the number of AIDS cases which can be expected in the future from these HIV patients to be predicted. Conversely, if the number of AIDS cases (after adjustment for reporting delays) is known and information on the incubation period distribution is available, estimates for those previously infected with the HIV virus may be derived. The numbers previously infected can then be projected forward to obtain short-term predictions for the number of AIDS cases. This method is known as back calculation. It must be stressed, however, that since the proportion of those infected who eventually go on to develop AIDS is unknown, and as the number of diagnosed AIDS cases is being used, this method provides estimates only for those infected who will eventually go on to develop the disease. It is these disease numbers, however, that health authorities and policy-makers have to finance and plan for.
105
MODELLING TECHNIQUES AND THEIR USES
This relationship between the incidence of AIDS cases, the incidence of HIV infections and the distribution of the incubation period ¡swell documented and may be expressed in the form
a(t) = j h(t - u) f(u) du
where a(t) is the rate of new diagnoses of AIDS cases, h(t) is the rate of acquiring HIV infection and fifí.) is the distribution of the incubation period. The method of back calculation is based on the premise that if any two of these three quantities are known then the third can be derived. With the current AIDS epidemic both a(t), the rate of new diagnoses of AIDS cases, and f(t), the distribution of the incubation period, can be observed and measured, hence h(t), the unknown number of HIV cases, at time t can also be derived. The choice of distribution for both a(t) and f(t) is, however, very varied and depends upon the stage of the epidemic and the availability of data. Estimates of HIV incidence derived from the back-calculation method will vary depending on the distributions used. This is discussed further in later sections.
It is important to remember that the number of diagnosed AIDS cases are adjusted for reporting delays. Reporting delays in countries vary and arise when a department of health acts as the centre for the collation of national data on AIDS, with diagnosed cases being reported directly to an AIDS coordinator. A considerable time lag may occur between the time that a case is diagnosed and the time at which it is recorded in the national AIDS figures (the difference between these times being known as the reporting delay). It is at the time of diagnosis and not the time of reporting that the patient will need treatment and it is therefore necessary to plan for and work with the number of diagnosed cases.
Where has the model been applied?
This approach to estimating the incidence of HIV infection and projections for the number of AIDS cases was first proposed in the United States (Brookmeyer and Gail, 1986) and in the United Kingdom (Isham, 1988; Day and Core, 1988). Further discussions on the method applied to the US epidemic appeared in the late 1980s (Brookmeyer and Damiano, 1989). Back calculation as a means of predicting the incidence of HIV infection in the UK was discussed again in a review of mathematical and statistical studies of HIV (Anderson, 1989). More recently, this method was adapted to provide further predictions of the AIDS epidemic in the UK (Day et al., 1989). For application to the sparse Irish data the method was adapted further (Comiskey and Ruskin, 1992).
Similarly, the method has been applied across Europe, for example to reported AIDS cases in Amsterdam (Hendricks et al., 1992). The authors, like Comiskey and Ruskin, found that the choice of the exact model greatly influenced the predictions. In Italy, the method is also implemented to estimate the incidence and prevalence of HIV (Mariotto and Cascioli, 1996). Authors found that the choice of one particular back-calculation model over another among three different models considered seemed to be a minor component of the uncertainty when compared to the uncertainty due to all other
106
CHAPTER 6
sources. Variations in model choice are also addressed in the literature (Cooley et al., 1996). These authors combine information from 12 different studies in an effort to estimate the AIDS incubation distribution with greater precision than is possible from a single study. In their conclusions they stress that back-calculation approaches should allow the incubation distribution to take several forms to adequately represent HIV estimation uncertainty.
The method has also been applied to the prediction of the HIV/AIDS epidemic in the low-prevalence countries of Central and Eastern Europe (Downs et al., 1997). This study included the Asian republics of the former Soviet Union. The authors found that recent reports of rapidly increasing HIV infection rates suggest that back calculation may seriously underestimate the size of the epidemic in low-prevalence countries. The application of the method has not been confined to Europe and the United States, but has also been used in Australia (Becker and Chao, 1994) and in the city of Perth in Western Australia (Comiskey, 1996). Becker and Chao (1994) improve the results from the method by assuming that quarterly HIV incidences are not independent.
To summarise, the back-calculation method has been applied globally and under diverse conditions. The core idea of the method remains unchanged in that the back-calculation is from known AIDS incidence, through the incubation-period distribution in order to estimate the unknown or hidden pool of HIV carriers. The implementation of the method, however, varies considerably between authors and its technical details are continually being refined. A key factor in the implementation of the method is the choice of the incubation-period distribution. Estimates of HIV incidence and prevalence derived from the method will vary considerably depending on the mathematical or statistical nature of the distribution used by the researcher. In spite of these reservations, the method continues to be employed and receives considerable attention in the academic press.
The method used for the example illustrated here is based upon the knowledge of the distribution of AIDS cases and the distribution of the incubation period (Brookmeyer and Gail, 1986; Brookmeyer and Damiano, 1989; Anderson, 1989). The sensitivity of this method to parameter estimates has been discussed in the literature (Wilson et al., 1992) and many authors have sLudied ways of improving the method by using either age-specific incidence rates or more accurate estimates of the incubation-period distribution by using dates of first positive HIV test (Rosenburg, 1994; Dietz et al., 1994; Marschner, 1994). In the United Kingdom, work has been carried out on the study of the incubation-period distribution (Anderson and Medley, 1988). The authors fit a gamma distribution with a mean of 14.3 years with approximately 4 0 % of all those infected progressing to AIDS within ten years. In this example, this choice of incubation distribution is implemented. The method is illustrated with data on Irish AIDS cases from 1982 to 1992. In the light of comments on the necessity for validation of HIV predictions (Bailey, 1994) the results from the improved back-projection method compare favourably with HIV predictions arising from transmission models of HIV and AIDS in Ireland.
107
MODELLING TECHNIQUES AND THEIR USES
Adjusting the number of diagnosed AIDS cases for reporting delays
For every AIDS case reported in Ireland, data are supplied on the risk group (and other
demographic features) of the patient and the date that he or she was diagnosed as
falling within the Centres for Disease Control (CDC) definition of an AIDS case. At the
time the model was applied, the CDC classified those with the HIV virus into four
groups: Croup I, seroconversion; Group II, asymptomatic; Group III, progressive
generalised lymphadenopathy; and Group IV, patients with clinical manifestations of
HIV infection designated by assignment to one or more sub-groups (A-Ε). Within Group
IV, sub-group classification is independent of the presence or absence of
lymphadenopath. Sub-group IV C1 defined an AIDS case. It consisted of patients with
secondary infectious diseases defined as the diagnosis of an infectious disease associated
with HIV infection and/or at least moderately indicative of a defect in cell-mediated
immunity. Included are patients with symptomatic or invasive disease due to one of a
number of specified secondary infectious diseases.
The problem of reporting delays in the number of AIDS cases is discussed (Brookmeyer
and Damiano, 1989). These authors base their method on a conditional likelihood for
estimating the reporting delay distribution. Their method has been adapted to adjust
the reported numbers of Irish AIDS cases (Comiskey and Ruskin, 1992).
Methods
The integral equation model arising in back projection is a linear Volterra equation of
the first kind with a difference kernel
a(l)=\h(t-u)f(u)du (1)
where aft) is the rate of new diagnoses of AIDS cases (adjusted for reporting delays), h(t)
is the rate of acquiring HIV infection and /"CO is the distribution of the incubation period.
Although equation 1 may be viewed as the convolution of h(t) and f(t), it is difficult to
find a solution by means of inverse Laplace transforms when f(t) is given by a gamma
distribution with parameter α eR. However equation 1 can be changed into a generalised
Abel integral equation by differentiation. The solution is then given in terms of an
integral in the two known functions a(t) and f(t). The resulting integral can then be
solved in terms of incomplete and complete gamma functions and error bounds for all
solutions can be provided (Comiskey, 1992).
Three different mathematical forms for the growth in the annual incidence of AIDS
cases, a(t), are considered here. It has been shown that in Europe the numbers of new
AIDS cases grew rapidly in the early years of the epidemic (Downs et al., 1987). This
has since been followed by a period of slower growth with doubling times increasing.
Three forms for a(t) are considered to describe the rate of new diagnosis of AIDS cases:
a(t) = a0exp(a1t-a2t2) (2)
a(t) = (b0 + b fi I exp(l-t) + b2 (3)
aft) = c0 + c¿ + c2t2 <4'
108
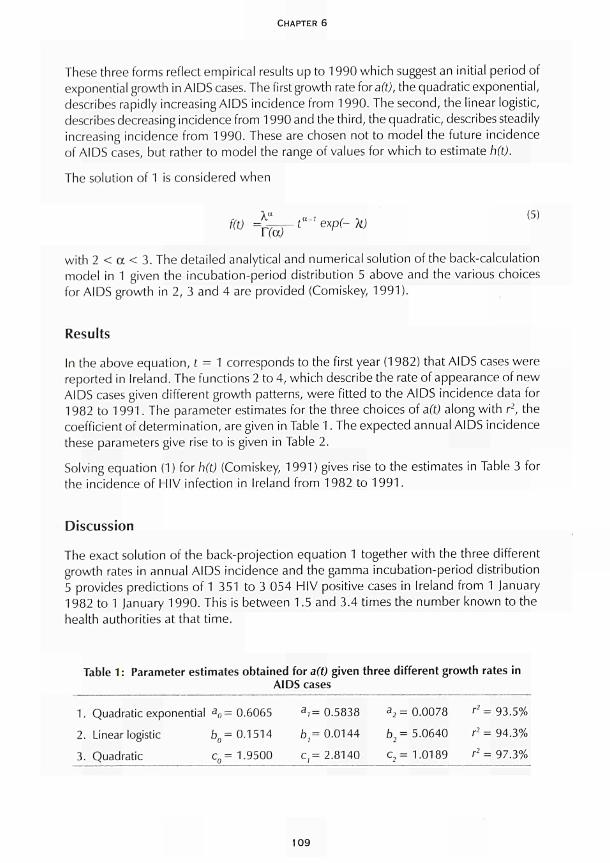
CHAPTER 6
These three forms reflect empirical results up to 1990 which suggest an initial period of
exponential growth in AIDS cases. The first growth rate for aft), the quadratic exponential,
describes rapidly increasing AIDS incidence from 1990. The second, the linear logistic,
describes decreasing incidence from 1990 and the third, the quadratic, describes steadily
increasing incidence from 1990. These are chosen not to model the future incidence
of AIDS cases, but rather to model the range of values for which to estimate h(t).
The solution of 1 is considered when
f(0=%^t«->exp(-X)
with 2 < α < 3. The detailed analytical and numerical solution of the backcalculation
model in 1 given the incubationperiod distribution 5 above and the various choices
for AIDS growth in 2, 3 and 4 are provided (Comiskey, 1991).
Results
In the above equation, t = 1 corresponds to the first year (1982) that AIDS cases were
reported in Ireland. The functions 2 to 4, which describe the rate of appearance of new
AIDS cases given different growth patterns, were fitted to the AIDS incidence data for
1982 to 1991. The parameter estimates for the three choices of a(t) along with r', the
coefficient of determination, are given in Table 1. The expected annual AIDS incidence
these parameters give rise to is given in Table 2.
Solving equation (1 ) for h(t) (Comiskey, 1991 ) gives rise to the estimates in Table 3 for
the incidence of HIV infection in Ireland from 1982 to 1991.
Discussion
The exact solution of the backprojection equation 1 together with the three different
growth rates in annual AIDS incidence and the gamma incubationperiod distribution
5 provides predictions of 1 351 to 3 054 HIV positive cases in Ireland from 1 January
1982 to 1 January 1990. This is between 1.5 and 3.4 times the number known to the
health authorities at that time.
Table 1 : Parameter estimates obtained for a(t) given three different growth rates in AIDS cases
1. Quadratic exponential ¿0 = 0.6065 a
. = 0.5838 a2 = 0.0078 r2 = 93.5·%
2. Linear logistic b0= 0.1514 b,= 0.0144 b2 = 5.0640 r2 = 94.3%
3. Quadratic c0= 1.9500 c,= 2.8140 c2= 1.0189 r2 = 97.3%
109
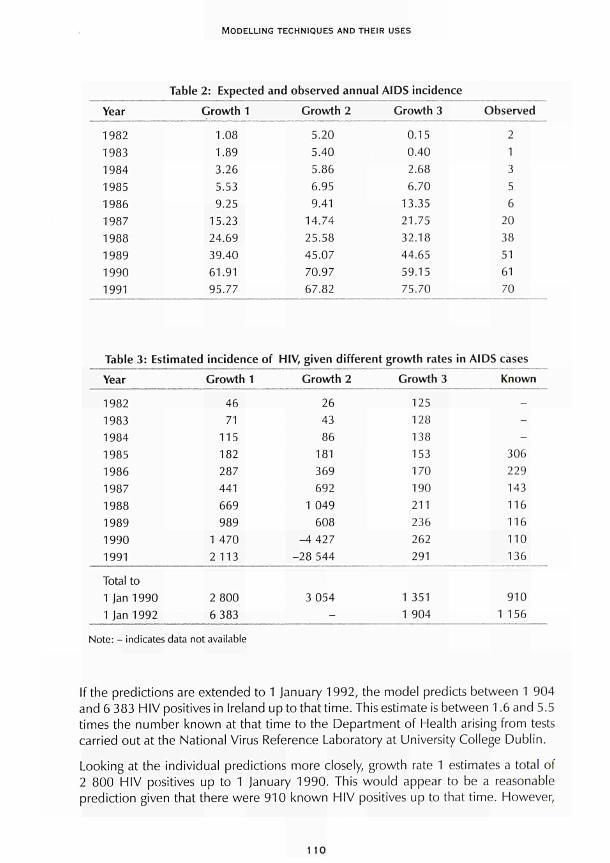
MODELLING TECHNIQUES AND THEIR USES
Table 2: Expected and observed annual AIDS incidence Year
1982 1983 1984 1985 1986 1987 1988 1989 1990 1991
Growth 1
1.08 1.89 3.26 5.53 9.25
15.23 24.69 39.40 61.91 95.77
Growth 2
5.20 5.40 5.86 6.95 9.41
14.74 25.58 45.07 70.97 67.82
Growth 3
0.15 0.40 2.68 6.70
13.35 21.75 32.18 44.65 59.15 75.70
Observed
2 1 3 5 6
20 38 51 61 70
Table 3: Estimated incidence of HIV, given different growth rates in AIDS cases Year
1982 1983 1984 1985 1986 1987 1988 1989 1990 1991
Total to 1 Jan 1990 1 Jan 1992
Growth 1
46 71
115 182 287 441 669 989
1 470 2113
2 800 6 383
Growth 2
26 43 86
181 369 692
1 049 608
-4 427 -28 544
3 054
-
Growth 3
125 128 138 153 170 190 211 236 262 291
1 351 1 904
Known
---
306 229 143 116 116 110 136
910 1 156
Note: - indicates data not available
If the predictions are extended to 1 January 1992, the model predicts between 1 904 and 6 383 HIV positives in Ireland up to that time. This estimate is between 1.6 and 5.5 times the number known at that time to the Department of Health arising from tests carried out at the National Virus Reference Laboratory at University College Dublin.
Looking at the individual predictions more closely, growth rate 1 estimates a total of 2 800 HIV positives up to 1 January 1990. This would appear to be a reasonable prediction given that there were 910 known HIV positives up to that time. However,
110
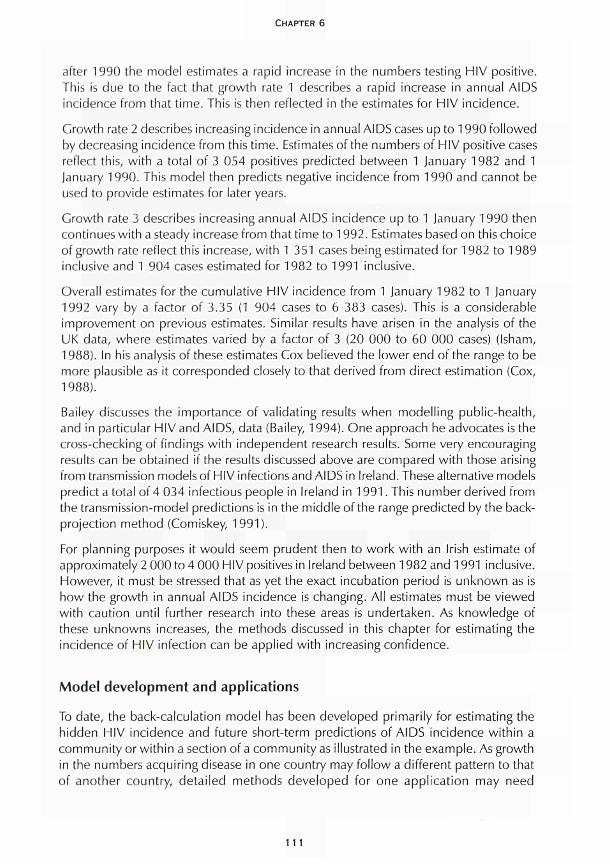
CHAPTER 6
after 1990 the model estimates a rapid increase in the numbers testing HIV positive. This is due to the fact that growth rate 1 describes a rapid increase in annual AIDS incidence from that time. This is then reflected in the estimates for HIV incidence.
Growth rate 2 describes increasing incidence in annual AIDS cases up to 1990 followed by decreasing incidence from this time. Estimates of the numbers of HIV positive cases reflect this, with a total of 3 054 positives predicted between 1 January 1982 and 1 January 1990. This model then predicts negative incidence from 1990 and cannot be used to provide estimates for later years.
Growth rate 3 describes increasing annual AIDS incidence up to 1 January 1990 then continues with a steady increase from that time to 1992. Estimates based on this choice of growth rate reflect this increase, with 1 351 cases being estimated for 1982 to 1989 inclusive and 1 904 cases estimated for 1982 to 1991 inclusive.
Overall estimates for the cumulative HIV incidence from 1 January 1982 to 1 January 1992 vary by a factor of 3.35 (1 904 cases to 6 383 cases). This is a considerable improvement on previous estimates. Similar results have arisen in the analysis of the UK data, where estimates varied by a factor of 3 (20 000 to 60 000 cases) (Isham, 1988). In his analysis of these estimates Cox believed the lower end of the range to be more plausible as it corresponded closely to that derived from direct estimation (Cox, 1988).
Bailey discusses the importance of validating results when modelling public-health, and in particular HIV and AIDS, data (Bailey, 1994). One approach he advocates is the cross-checking of findings with independent research results. Some very encouraging results can be obtained if the results discussed above are compared with those arising from transmission models of HIV infections and AIDS in Ireland. These alternative models predict a total of 4 034 infectious people in Ireland in 1991. This number derived from the transmission-model predictions is in the middle of the range predicted by the back-projection method (Comiskey, 1991).
For planning purposes it would seem prudent then to work with an Irish estimate of approximately 2 000 to 4 000 HIV positives in Ireland between 1982 and 1991 inclusive. However, it must be stressed that as yet the exact incubation period is unknown as is how the growth in annual AIDS incidence is changing. All estimates must be viewed with caution until further research into these areas is undertaken. As knowledge of these unknowns increases, the methods discussed in this chapter for estimating the incidence of HIV infection can be applied with increasing confidence.
Model development and applications
To date, the back-calculation model has been developed primarily for estimating the hidden HIV incidence and future short-term predictions of AIDS incidence within a community or within a section of a community as illustrated in the example. As growth in the numbers acquiring disease in one country may follow a different pattern to that of another country, detailed methods developed for one application may need
111
MODELLING TECHNIQUES AND THEIR USES
considerable technical refinement and alteration when applied in a different setting. Research has shown that estimates derived by the back-calculation method are highly sensitive to the choice of AIDS incubation-period distribution used and, as such, much work has been and is still being carried out on improving and refining knowledge of this incubation period.
It is the opinion of the authors that advantage should be taken of the extensive European and global research that has been conducted on the back-calculation method.
These models have not to the authors' knowledge been used in other drug-related areas, in particular to the problem of estimating incidence of drug use within a community. To provide a range of estimates of the prevalence of intravenous drug use in Los Angeles, CA, a combination of methods including multiple capture-recapture, synthetic estimation and back-calculation of AIDS incidence has been used (Hser, 1993). Hser, who is based at the Drug Abuse Research Centre at the University of California, Los Angeles, advocates the employment of complementary methods and data sources.
The back-calculation model has been widely used by the applied statistical and mathematical profession. It has not, however, been widely embraced by the general medical, epidemiological and health professions. This is not due to a lack of data, but more perhaps to the technical nature of the method. Research publications tend to stress developments in the technicalities of the method rather than the relevance of the method to policy-makers. The application of the method to disease prediction was also relatively novel prior to the rapid growth in the number of AIDS cases in the mid-to-late 1980s. There are some interesting exceptions to this: Cox (1988) and Day (1996) both provide predictions of the number of new AIDS cases for the Department of Health in England and Wales based on the back-calculation method. Whether the predictions provided in their reports directly affected and influenced government health policy and resource allocation is a question beyond the scope of this chapter.
Critical assessment of the method for future research
The back-calculation model for estimating the hidden HIV population and AIDS prediction has been applied throughout Europe. The technicalities of the method have been extensively researched and published. It has not to date been used as a means for estimating the hidden drug-using population. Advantage should be taken of developments in the method which uses the known number of AIDS cases (adjusted for reporting delays) to estimate the unknown number of HIV cases. This is accomplished by back calculating from the AIDS cases through the use of the incubation-period distribution to estimate the pool of HIV cases these AIDS cases must have come from.
The same approach may be used to back calculate from the known number of drug users to estimate the larger pool of unknown drug users these known users came from. Consider the case where information is known about opiate users first attending for treatment. (These are analogous to AIDS cases who attend for treatment.) Information is sought from the opiate user on when they first started taking opiate drugs. From this information, the distribution of times from first opiate use to first attending treatment
112
CHAPTER 6
may be estimated. (This idea is analogous to the distribution of incubation times from first acquiring HIV to developing AIDS.) It is now possible to back calculate from the known numbers of opiate users through the use of the so-called incubation period to estimate the pool of hidden opiate users the known users came from. (This is directly analogous to back calculating from AIDS cases to HIV cases.) The data demands for such research to be conducted are not extensive and in many cases the data exist and are already in place. Many cities have been collecting survey questions on the nature of primary and secondary drug use, age of first use and dates of first treatment for this drug use. The data derived from the answers to all of these epidemiological questions are perhaps under-used at present. Further use of these and other epidemiological studies across Europe would benefit all.
The added value of using the back-calculation method is that within many of the European cities with which the European Monitoring Centre for Drugs and Drug Addiction (EMCDDA) has existing links for either capture-recapture or dynamic-modelling studies there already exists the back-calculation technical expertise. In addition, the EMCDDA has access to the relevant drug-treatment data.
Conclusions
In order to apply this method to the problem of estimating drug incidence it is first essential that research into the nature of distribution of times from first misusing drugs to first seeking treatment is carried out. This is analogous to a disease-incubation-period distribution, that is, times from first acquiring infection to first presenting for disease treatment. The data for this study may be drawn from existing local surveys on drug use and first treatment. Very little is known about this so-called incubation-period distribution, yet the back-calculation literature demonstrates that it is precisely the choice of this distribution that will affect future predicted estimates. Depending on the priorities of the research, this study could concentrate on one type or one mode of drug misuse, for example opiate misuse or injecting drug use. One such study is currently being piloted in several European countries under the direction of the EMCDDA (private communication). In addition, a study of the distribution of incubation times or times to first treatment and a subsequent application of the back-calculation method to estimating incidence of opiate use in Dublin, Ireland, has been conducted (Hand, 1999).
Second, a pilot study to assess the feasibility of applying the back-calculation method to estimating the hidden prevalence of drug misuse is being undertaken. This second objective will follow on from and implement the findings on distribution of times to first treatment. To determine the usefulness and reliability of the back-calculation estimates the results should be compared with estimates derived from other methods previously applied. The authors and many other researchers collaborating with the EMCDDA are currently working on prevalence estimates from the multiple capture-recapture method. Given time and economic resource constraints it would seem obvious therefore to compare estimates derived from back calculation with estimates from these soon-to-be-completed studies.
113
MODELLING TECHNIQUES AND THEIR USES
Over a longer time frame, if the results of a back-calculation feasibility study proved worthwhile, the method may be developed further for use with a range of drug-related problems other than HIV and AIDS. If the EMCDDA's back-calculation feasibility study did not produce worthwhile estimates when compared with other methods, then the reports to the EMCDDA will highlight why this was the case, be it deficiencies in the primary data collection or in the variability of the method, and improvements can be recommended. Future surveys and data collection can then take note of these recommendations.
With regard to the resource needs of such a feasibility study, many of the data structures are already in place. The technicalities of the method are also well documented. There would be requirements for access to the necessary epidemiological data and their appropriate collation. Finally, for such a study to be of benefit to the wider community, it is essential that the implications of the research and estimates derived be placed within the context of relevance and implication for health professionals, policy-makers and those with the responsibility of scarce and valuable resource allocation.
In conclusion, to quote the pioneering biomathematician Ν. Τ J. Bailey (1975):
In the face of misery and suffering on a monumental scale, epidemic theory is a luxury mankind can ill afford. The world must not only be interpreted: it must be changed.
References
Anderson, R. M. (1989). 'Mathematical and statistical studies of HIV'. AIDS 3: 333-46.
Anderson, R. M., Medley, G. (1988). 'Epidemiology, HIV infection and AIDS: the incubation and infection periods, survival and vertical transmission'. AIDS 2 (suppl. 1): S57-S64.
Bailey, Ν. Τ J. (1994). 'Estimating HIV incidence and AIDS projections. Prediction and validation in the public health modelling of HIV/AIDS'. Statistics in Medicine 13: 1933-43.
Bailey, Ν. T. ]. (1975). The mathematical theory of infectious diseases and its applications. London: Griffin and Co. Ltd. Second edition (first edition 1957).
Becker, N. G., Chao, X. (1994). 'Dependent HIV incidences in back projection of AIDS incidence data'. Statistics in Medicine 13:1945-58.
Brookmeyer, R., Damiano, A. (1989). 'Statistical methods for short-term projections of AIDS incidence'. Statistics in Medicine 8: 23-34.
Brookmeyer, R., Gail, M. (1986). 'Minimum size of the acquired immunodeficiency syndrome (AIDS) epidemic in the United States'. Lancet 2: 1320-22.
Comiskey, C. M. (1996). 'Integral equations and estimating the incidence of HIV infection'. Zeitschrift Fur Angewandte Mathematik Und Mechanik 76 (S2): 505-6.
Comiskey, C. M. (1992). 'Improvements in integral equation models for estimates of the level of HIV infection in Ireland'. The Statistician 41: 329.
Comiskey, C. M. (1991). 'Modelling the transmission dynamics of HIV and its progression to AIDS in Ireland'. PhD thesis, Dublin City University, Ireland.
114
CHAPTER 6
Comiskey, C. M., Ruskin, H. (1992). 'AIDS in Ireland. The reporting delay distribution and the
implementation of integral equation models'. Computer Application in the Biosciences 8 (6):
57981.
Cooley, P C , Myers, L. E., Hamill, D. N. (1996). 'A meta analysis of estimates of the AIDS incubation
distribution'. European Journal of Epidemiology 12: 2935.
Cox, D. (1988) Short-term prediction of HIV infection and AIDS in England and Wales. London:
Her Majesty's Stationery Office.
Day, N. E. (1996). 'The incidence and prevalence of AIDS and prevalence of other severe HIV
disease in England and Wales for 1995 to 1999: projections using data to the end of 1994'.
Communicable Disease Report Review 6 (1): 18.
Day, N. E., Gore, S. M. (1988). 'Predictions of the number of new AIDS casesand the number of
new persons infected with HIV up to 1992: the results of "backprojection" methods', in Cox, D.
Short-term prediction of HIV infection and AIDS in England and Wales, 748.
Day, N. E., Gore, S. M., McGee, Μ. Α., South, M. (1989). 'Predictions of the AIDS epidemic in
the UK: the use of the backprojection method'. Philosophical Transactions of the Royal Society
of London. Series B: Biological Sciences 325: 12334.
Dietz, K., Seydel, J., Schwartländer, Β. (1994). 'Backprojection of German AIDS data using
information on dates of tests'. Statistics in Medicine 13: 19912008.
Downs, A. M., Ancelle, R. Α., Jager, Η. J. C , Brunet, J. Β. (1987). 'AIDS in Europe: current trends
and shortterm predictions estimated from surveillance data'. AIDS 1: 537.
Downs, A. M., Heisterkamp, S. H., Brunet, J. Β., Hamers, F. F. (1997). 'Reconstruction and
prediction of the HIV/AIDS epidemic among adults in the European Union and in the low
prevalence countries of central and eastern Europe'. AIDS 11 : 64962.
Hand, E. (1999) 'Estimating the prevalence and the latency period of opiate use in Dublin'.
Thesis (MSc), National University of Ireland, Maynooth.
Hendricks, J. C. M., Medley, G. F., Heisterkamp, S. H., Vangriensven, G. J. R, Bindels, R J. E.,
Coutino, R. Α., Vandruten, J. Α. M. (1992). 'Shortterm predictions of HIV prevalence and AIDS
incidence'. Epidemiology and Infection 109: 14960.
Hser, Y. I. (1993). 'Population estimates of intravenous drug users and HIV infection in Los Angeles
County'. International Journal of the Addictions 28: 695709.
Isham, V. (1988). 'Estimation of the incidence of HIV infection the backprojection method', in
Cox, D. Short-term prediction of HIV infection and AIDS in England and Wales, 5355.
Mariotti, S., Cascioli, R. (1996). 'Sources of uncertainty in estimating HIV infection rates by back
calculation. An application to Italian data'. Statistics in Medicine 15: 266787.
Marschner, I. C. (1994 ). 'Using time of first positive HIV test and other auxiliary data in back
projection of AIDS incidence'. Statistics in Medicine 13: 195974.
Rosenburg, R S. (1994). 'Backcalculation models of agespecific HIV incidence rates'. Statistics
in Medicine 13: 197590.
Wilson, S. R., Fazekas de St. Groth, C , Solomon, R J. (1992). 'Sensitivity analyses for the back
calculation method of AIDS projections'. Journal of Acquired Immune Deficiency Syndrome 5:
5237.
1 15

CHAPTER 7
C O M P A R T M E N T A L M O D E L L I N G A N D S T O C H A S T I C
DYNAMIC SYSTEMS
Gordon Hay and Catherine Comiskey
Many quantities are of interest to drug-misuse researchers, such as the number of people that inject heroin or the number of children that begin using drugs at a particular age. These two quantifiable 'groups' are examples of compartments. The number of people in each of these groups, or compartments, may be dependent on the number in others, for example the number of people that inject heroin may be related to the number that smoke the drug, whereas the number of children who begin using drugs may be related to the number that smoke or drink alcohol.
Compartmental models provide a framework in which numbers of people in different compartments, and the relationships between different compartments, can be described analytically. Two different types of compartmental models are described in this chapter: deterministic models in which the numbers in each category are completely determined by the model; and stochastic models in which random effects can result in different outcomes.
Compartmental models are well established in modelling the spread of diseases, including HIV/AIDS. Recent models which examine the spread of HIV in drug-using populations split those populations into different compartments. Although these compartments are created to make disease-spread models more realistic, for example by assigning drug injectors into groups that share needles daily, weekly or monthly, drug-using populations can be described in other ways, by examining drug-using careers or levels of drug use. Drug-related consequences can be added into compartmental models, such as social problems or health-care-related costs.
Some other examples of compartmental models, in particular some of the few applications to drug-related problems, are considered in this chapter. The use of these modelling techniques is then assessed and recommendations are made on the feasibility of the future use of these models by the European Monitoring Centre for Drugs and Drug Addiction (EMCDDA).
117
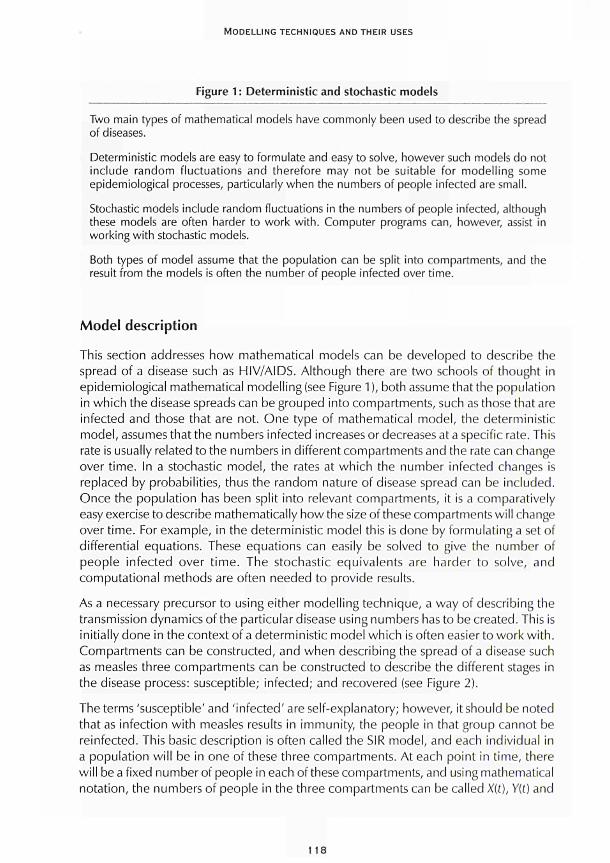
MODELLING TECHNIQUES AND THEIR USES
Figure 1 : Deterministic and stochastic models
Two main types of mathematical models have commonly been used to describe the spread of diseases.
Deterministic models are easy to formulate and easy to solve, however such models do not include random fluctuations and therefore may not be suitable for modelling some epidemiological processes, particularly when the numbers of people infected are small.
Stochastic models include random fluctuations in the numbers of people infected, although these models are often harder to work with. Computer programs can, however, assist in working with stochastic models.
Both types of model assume that the population can be split into compartments, and the result from the models is often the number of people infected over time.
Model description
This section addresses how mathematical models can be developed to describe the spread of a disease such as HIV/AIDS. Although there are two schools of thought in epidemiological mathematical modelling (see Figure 1 ), both assume that the population in which the disease spreads can be grouped into compartments, such as those that are infected and those that are not. One type of mathematical model, the deterministic model, assumes that the numbers infected increases or decreases at a specific rate. This rate is usually related to the numbers in different compartments and the rate can change over time. In a stochastic model, the rates at which the number infected changes is replaced by probabilities, thus the random nature of disease spread can be included. Once the population has been split into relevant compartments, it is a comparatively easy exercise to describe mathematically how the size of these compartments will change over time. For example, in the deterministic model this is done by formulating a set of differential equations. These equations can easily be solved to give the number of people infected over time. The stochastic equivalents are harder to solve, and computational methods are often needed to provide results.
As a necessary precursor to using either modelling technique, a way of describing the transmission dynamics of the particular disease using numbers has to be created. This is initially done in the context of a deterministic model which ¡soften easier to work with. Compartments can be constructed, and when describing the spread of a disease such as measles three compartments can be constructed to describe the different stages in the disease process: susceptible; infected; and recovered (see Figure 2).
The terms 'susceptible' and 'infected' are self-explanatory; however, it should be noted that as infection with measles results in immunity, the people in that group cannot be reinfected. This basic description is often called the SIR model, and each individual in a population will be in one of these three compartments. At each point in time, there will be a fixed number of people in each of these compartments, and using mathematical notation, the numbers of people in the three compartments can be called X(t), Y(t) and
1 18
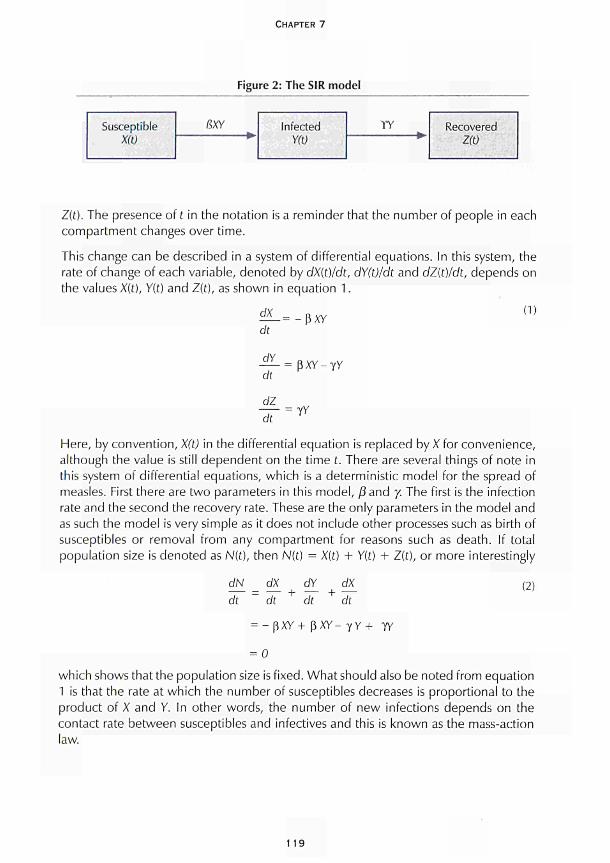
CHAPTER 7
Figure 2: The SIR model
Susceptible
X(0
ßXY Infected Y(t)
ΤΎ Recovered Z(t)
Z(i). The presence of t in the notation is a reminder that the number of people in each compartment changes over time.
This change can be described in a system of differential equations. In this system, the rate of change of each variable, denoted by dX(t)/dt, dY(t)/dt and dZ{t)/dt, depends on the values X(t), Y(t) and Z(t), as shown in equation 1.
^L=ßxv (1)
dt
dY
dt
dZ
dt
= ßXY-yy
γΥ
Here, by convention, X(t) In the differential equation is replaced by X for convenience,
although the value is still dependent on the time t. There are several things of note in
this system of differential equations, which is a deterministic model for the spread of
measles. First there are two parameters in this model, β and y. The first is the infection
rate and the second the recovery rate. These are the only parameters in the model and
as such the model is very simple as it does not include other processes such as birth of
susceptibles or removal from any compartment for reasons such as death. If total
population size is denoted as N(t), then N(t) = X(t) + Y(t) + Z{t), or more interestingly
dN dX dY_ dX_
dt ~ dt dt dt (2)
ßXY + ßXY yY + ΎΥ
0
which shows that the population size is fixed. What should also be noted from equation 1 is that the rate at which the number of susceptibles decreases is proportional to the product of X and Y. In other words, the number of new infections depends on the contact rate between susceptibles and infectives and this is known as the mass-action law.
1 19
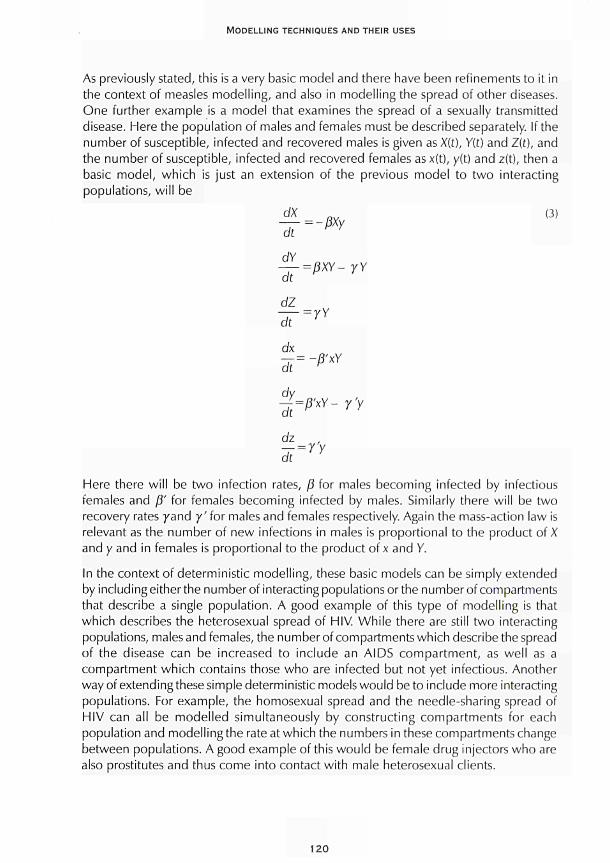
MODELLING TECHNIQUES AND THEIR USES
As previously stated, this is a very basic model and there have been refinements to it in
the context of measles modelling, and also in modelling the spread of other diseases.
One further example is a model that examines the spread of a sexually transmitted
disease. Here the population of males and females must be described separately. If the
number of susceptible, infected and recovered males is given as X(t), Y(t) and Z(t), and
the number of susceptible, infected and recovered females asx(t), y(t) and z(t), then a
basic model, which is just an extension of the previous model to two interacting
populations, will be
^=~ßxy (3)
dt H y
dY =βΧΥ- γΥ
dt
dZ
dt
dx
Jt~~
=γΥ
-β'χΥ
dy ■j=ß'*Y- Y y
dz ,
d-rYy
Here there will be two infection rates, β for males becoming infected by infectious
females and β' for females becoming infected by males. Similarly there will be two
recovery rates yand γ' for males and females respectively. Again the massaction law is
relevant as the number of new infections in males is proportional to the product of X
and y and in females is proportional to the product of χ and Y.
In the context of deterministic modelling, these basic models can be simply extended
by including either the number of interacting populations or the number of compartments
that describe a single population. A good example of this type of modelling is that
which describes the heterosexual spread of HIV. While there are still two interacting
populations, males and females, the number of compartments which describe the spread
of the disease can be increased to include an AIDS compartment, as well as a
compartment which contains those who are infected but not yet infectious. Another
way of extending these simple deterministic models would be to include more interacting
populations. For example, the homosexual spread and the needlesharing spread of
HIV can all be modelled simultaneously by constructing compartments for each
population and modelling the rate at which the numbers in these compartments change
between populations. A good example of this would be female drug injectors who are
also prostitutes and thus come into contact with male heterosexual clients.
120
CHAPTER 7
These deterministic models are quite simple to construct and computational methods have been developed to solve the differential equations to show how the number of infected people changes over time. However, as the name suggests, the spread of the disease is determined at the start of the epidemic in that there is no randomness in the disease process. Thus deterministic models can be seen as an approximation to more realistic stochastic models in which randomness is included. Unless the populations that are being examined are small, or the numbers in some of the compartments as described above become small, then deterministic models are often adequate.
To include randomness, stochastic models examine the probability that a person changes from one compartment to another, instead of assuming that the numbers change at a determined rate. Equation 1 can be converted into a corresponding stochastic model as in equation 3 where, only looking at the numbers of susceptibles and infectives, in a small time period At
Pr{(X,V0->(X-1,Y+1)}=j3XYAt (4)
Pr{(X,Y)-^(X,Y-1)} = yYAt
In other words, the probability that one susceptible becomes infected within the small time period Δί \s ßXYAt and, if this happens, the number of susceptibles decreases from
X to X1 and correspondingly the number of infectives increases from Y to Y+1. In
constructing these probabilities it is assumed that only one event can happen in the
small time interval Δί. As in the deterministic model, the probability is proportional to the product of the number of susceptibles and infectives.
Stochastic models can also be extended by including more compartments and interacting populations, but the theory behind stochastic models is far more complicated than that behind deterministic models and thus stochastic models in which solutions to these types of equations are examined are rare.
A more common form of stochastic modelling which employs compartments is the use of Monte Carlo simulation models. In these the probability of an event, such as a susceptible becoming infected, is evaluated within a computer program and a random number generator is used to decide whether or not this event should be simulated. Thus approximations to stochastic models can be readily evaluated and stochastic simulation languages are becoming more and more popular to simulate processes within science and engineering.
While the examples above, like most compartmental models, describe a time-dependent process, this does not always have to be the case. In some diseases, the age of a person is important, therefore the number of susceptibles, infectives and recovereds may be better described as X{a,t), Y(a,t) and Z(a,t) where age is denoted by a. The numbers in these compartments can vary over time and over age groups and differential equations can be constructed to describe the process. The parameters in these models are often age-dependent. These differential equations are more complex than equations 1 and 2 as they involve the rate of change over time and over age and are more correctly known as partial differential equations. They can be solved easily using numerical
121
MODELLING TECHNIQUES AND THEIR USES
methods and the numbers of people infected at different times and at different ages can be calculated.
Just as the models which only examine the rate of change over time can be extended to model the rate of change between ages, deterministic models can also be extended to include spatial effects. As previously described, there can be two interacting populations such as males and females in which compartments can be created to describe the sexual spread of a disease. This is similar to a situation in which there are two or more towns with the disease spreading between them. Here, a compartmental structure with differential equations can be created including both disease spread within towns and between towns.
Where have the models been applied?
Compartmental models, and the deterministic or stochastic methods used in conjunction with them, have many uses, in particular biological population dynamics and epidemiology. The use of mathematics in describing social processes such as the spread of disease has been well established since the start of the twentieth century when Hamer (1906) examined the spread of measles and Ross (1911) examined the spread of malaria. Although the fields of epidemiology and mathematical modelling have advanced rapidly since then, some assumptions and principles are basic to subsequent research. Advances in modelling sexually transmitted diseases have been made, for example Hethcote and Yorke (1984). Anderson and May (1991) provide an excellent review of mathematical modelling of infectious diseases. The growth of animal populations and the interaction between different populations have been studied extensively, including predator-prey models in which the population dynamics of one animal depend on the numbers of another animal on which they prey. Renshaw (1991 ) provides a review of these fields, in which he also examines spatial population dynamics.
Kaplan (1989) used a deterministic model to describe the spread of HIV among drug injectors. In this basic model he assumed a constant population size and that the disease spread through drug injectors sharing needles in shooting galleries. As such, this model was not very realistic in predicting the future course of the disease; however, the use of control strategies, such as needle exchanges, was evaluated. Indeed, it was a condition of the legalisation of needle exchanges in the US state of Connecticut that some kind of evaluation of a needle exchange was undertaken. Caulkins and Kaplan (1991 ) extended this model to allow for a varying population size of drug injectors. In this model they showed the population dynamics of the intravenous (IV) drug-using population as
^=€Ν(ϋ>-μΝ(ϋ (5)
dt
Here they assume that the rate at which people join the population of IV drug users is proportional to the number of current users raised to some power v, where ν is non-negative and strictly less than one. They present two arguments about the potential value of v. If the new users begin injecting because of other people injecting then the
122
CHAPTER 7
number of new injectors increases with the number of current injectors and hence ν
would be close to one. If, however, injectable drugs are freely available such that any
person who is predisposed to inject drugs will and the recruitment rate is determined
by social factors then ν could be quite small. At the extreme, if ν is zero then people
would begin injecting drugs at a constant rate c. Caulkins and Kaplan also assume that
current injectors cease injecting at a constant rate μ. They go on to estimate some of
the parameters used in the model, both before and after the introduction of AIDS, and
show that due to AIDS, the number of drug injectors will decrease.
This populationsize model is combined with a diseasespread model in which a
population of drug injectors shares possibly infected needles. Thus three compartments
are modelled, ß(t), the fraction of needles that are infected, l(t) the number of infected
injectors and U(t) the number of uninfected injectors at time t. Differential equations
which describe the transmission dynamics are constructed and employ the parameters
related to population size and to the infection process.
Billard and Dayananda (1993) look closer at the rate at which people begin using drugs
in their eloquently titled paper 'Drug addiction pushers generated from the addicts'.
They combine a populationsize deterministic model with a previous model of
Hoppensteadt and Murray (1981) who considered the concentration of a drug in the
blood of drug users. Billard and Dayananda use the massaction law in that the rate of
change of the number of addicts is proportional to the product of the number of addicts
and nonaddicts. They also assume that pushers are normally hardcore drug users
such that the number of pushers will be proportional to the number of addicts. This
highly mathematical paper is not at all realistic in the context of predicting how many
people will begin using drugs, but demonstrates some of the theory behind deterministic
and stochastic modelling.
Some models that examine the spread of HIV among drug injectors provide basic
attempts at describing the population dynamics of drug use. Peterson et al. (1990) use
Monte Carlo simulation methods to model the spread of HIV among drug users. They
use six compartments to model the progression of HIV, ranging from susceptible to
death from AIDS. They also create a parallel system which describes the career
progression of drug injectors. Figure 3, which is adapted from Peterson's paper, presents
the compartments that are used to describe the career progression of drug users.
Several things are worth noting from this diagram. Although Peterson goes on to model
this scenario with stochastic methods, his compartmental framework can quite easily
be modelled using deterministic methods. In the figure, he and his colleagues chose to
present values for the probabilities instead of working with parameters such as β or γ.
In the 'Daily IV user' compartment, the mean duration in months assumed for this
compartment is 44.0. In other words, once a person begins injecting daily, they will, on
average, remain injecting daily for 44 months. Certain events can happen to a daily
drug injector: they can end up in jail; end up in a community treatment programme;
cease injecting completely and therefore go back to being a member of the general
population; or die from something unrelated to HIV. It should be remembered that a
parallel compartmental modelling system describes the disease progression and this
123
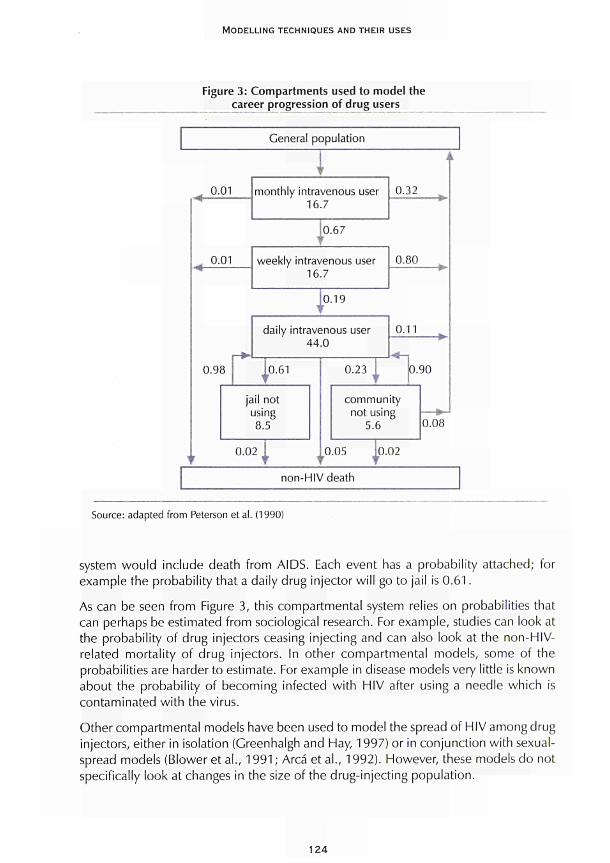
MODELLING TECHNIQUES AND THEIR USES
Figure 3: Compartments used to model the career progression of drug users
General population
0.01
1 monthly intravenous user
16.7 0.32
0.67
0.01 weekly intravenous user 16.7
0.80
0 .19
daily Intravenous user 44.0
0.98
0.02 10.05 0.02 Τ T T T
0.11
community not using
5.6 0.08
non-HIV death
Source: adapted from Peterson et al. (1990)
system wou ld include death f rom AIDS. Each event has a probabil i ty attached; for example the probabil i ty that a daily drug injector wi l l go to jail is 0 . 6 1 .
As can be seen f rom Figure 3, this compartmental system relies on probabilit ies that can perhaps be estimated f rom sociological research. For example, studies can look at the probabil i ty of drug injectors ceasing injecting and can also look at the non-HIV-related mortal i ty of d rug injectors. In other compar tmenta l models, some of the probabil it ies are harder to estimate. For example in disease models very little is known about the probabil i ty of becoming infected w i th HIV after using a needle which is contaminated w i th the virus.
Other compartmental models have been used to model the spread of HIV among drug injectors, either in isolation (Greenhalgh and Hay, 1997) or in conjunct ion wi th sexual-spread models (Blower et al . , 1991 ; Arca et al., 1992). However, these models do not specifically look at changes in the size of the drug-inject ing populat ion.
124
CHAPTER 7
Another type of stochastic model which has been used to model the spread of disease is the chain-binomial model. In this type of model, the number of new infections caused by an infected person is assumed to follow a binomial distribution. For example, an infective will infect one or more people with different probability and these people will then go on to form the next link in the chain by infecting other susceptibles. Mackintosh and Stewart (1979) use this technique to model a heroin epidemic, as did de Alarcón (1969), who demonstrated this technique using data collected from a community. This type of modelling assumes that heroin use follows contact with other users and can model the scenario in which drug use is introduced fairly rapidly into a community.
Model development
A good example of model development is that of the models to describe the homosexual spread of HIV. The initial models did not differ much from those which described the spread of diseases such as measles except that there was not a 'recovered' class in HIV models. However, it soon became clear that the transmission dynamics of this disease are more complex, particularly because a new infection results from a sexual act, and this could not be modelled in the same way as a disease like measles which is airborne. The probability of becoming infected would depend on how sexually active an individual was and thus the mass-action law may not be strictly relevant. The selection of sexual partners can also be included in these models as the probability of becoming infected would be greater for someone who has intercourse with many people than a person who is in a monogamous relationship. The use of condoms will also affect the spread of the disease, as would biological parameters such as the infectivity of the virus at different stages of the disease progression. Thus what originated as a very simple model quickly became a complex model which realistically described the transmission dynamics of a particular disease.
It may therefore be possible to develop the basic SIR model to make it relevant to drug-related areas. In order to model non-drug users as a susceptible compartment and drug users as an infective compartment, the process that makes someone begin using drugs must be examined. A rate which describes people starting to use drugs can be assigned, and this rate may depend on the number of others in the population using drugs as in the mass-action law, or it may depend on other factors. As in AIDS models, drug use can also be split into more than one compartment, either by severity of drug use or by type of drug use.
It may be possible to develop models to describe the start of drug use by young people. Research by Barnard et al. (1996) shows increasing numbers of children smoking, drinking and abusing solvents as they progress through school. What is of interest from that research is that the number of children smokingatage 12 is similar to those drinking at 13, those using solvents at 14 and those using drugs at 15. Whether or not these activities are related is an exercise in sociological research; however, these different events and the processes linking them would be ¡deal to describe as a compartmental model, especially as research involving young people often examines the age at which children begin using licit or illicit substances.
125
MODELLING TECHNIQUES AND THEIR USES
Critical assessment of model types for future use
Various types of mathematical models have been presented above which attempt to describe a sociologicalor medical process, such as the transmission dynamics of HIV in a population of drug injectors, by creating compartments. Some processes are more amenable to being described by compartments, such as the 'susceptible', 'infected' and 'removed' compartments which describe the spread of measles. Other processes, such as the more sociological process of a drug-using career, may be less suited to these techniques.
For example, does the probability that someone begins using drugs depend on the number of others within the population who are using drugs, or is drug use a consequence of growing up such that a certain proportion of young people will begin using drugs regardless of others? Is drug use such a rare occurrence that it can only begin after contact with another drug user, thus making a chain-binomial model more relevant?
There could be other influences on the number of people using drugs, such as the relative success or failure of a drug-prevention campaign, or the availability of drugs. The latter could be modelled as a separate compartmental system and this would raise questions relating to what factors affect availability, such as supply and demand or law-enforcement activities. This type of modelling would perhaps then be more akin to economic models. Even if it was concluded that the number of people using drugs, or the number of people who begin using drugs, depends on availability, what would be the parameters in a compartmental system that would describe them and how would these values be measured?
The perennial question of definitions may need to be raised in creating compartments to describe, for example, a drug-using career. It would be difficult to model the progression from user to problem user to addict without a clear consensus about these definitions. In assigning an 'addict' compartment it is easy to model some transitions out of this compartment such as death, but what would be the process undertaken by a person to move from 'addict' back to 'user'? An issue related to definitions would be the different drugs used. In some areas and at different times the use of stimulants may be seen as a serious problem and modelling the use of these drugs may be of interest, whereas in other areas or at other times the use of these drugs may be seen as a stage in a process that results in opiate addiction.
Although compartmental models may be better thought of as tools to examine 'what if' scenarios, there is still a need to employ realistic data where available. Blower and Medley (1992) describe the application of mathematical modelling techniques, including compartmental models, to examining the spread of HIV among drug injectors. Instead of examining the advances in the methodology, they discuss the more relevant issue of the availability of data that would be of use in creating models and the usefulness of this data. They detail problems with existing data, for example questionnaires that code parameters of interest such as the number of people who have shared injecting equipment within the last six months into categories such as 0-5, 5-10. Such questions would not be sensitive to small behavioural changes, and as the responses to such
126
CHAPTER 7
variables are usually very skewed, it would be of more use to have single numbers as categories at the lower end of the scale.
Unlike mathematical models of infectious-disease spread which employ biological parameters, the sociological parameters that would be needed to model drug-related problems may be more transient. For example, the length of time that someone remains infectious with a certain disease can be documented and this infectious period, or even an age-specific infectious period, would be common throughout Europe. This would be in contrast to, for example the reasons for a person stopping using drugs in Athens or Rome which may be very different to those for someone in Helsinki or Stockholm.
Recommendations
Although existing research which does not specifically focus on disease spread is limited, compartmental models have an exciting potential for future development. Two main areas of future research are proposed. The first is one in which the 'drug-using career' is quantified and assessed, for example by looking at existing data sources which report the time between a drug user beginning to use drugs and presenting at services. The other main area of research would be to examine children's drug use, based on studies that show that young people may begin using drugs after they begin smoking or drinking. More specifically, the following is recommended.
Examining the feasibility of using epidemic models to model drug use as a disease
While it is relatively easy to create compartments with which to describe different stages, the more pertinent questions relate to the processes that link the compartments, such as the reason for someone who already uses drugs to begin injecting, and the estimation of such parameters. It may be possible to answer these questions by undertaking research into these processes; however, another approach would be to review the available data, such as those collected by the Pompidou Group of the Council of Europe, and seek to adapt them for inclusion in a mathematical model. Such a review may identify problems with the existing data, or with data that are not routinely collected but may be readily available. It may be possible to glean data from the existing literature; for example, models which describe the spread of HIV through shared injecting equipment require an estimate for the probability that injecting with an infected needle will result in a new infection. This probability is often estimated from studies of needle-stick injuries; however, Kaplan (1992) demonstrated an interesting use of his mathematical models in which he estimated this parameter.
Within the context of other drug-related problems, research may be able to provide an insight into parameters such as the average time people use drugs before contacting services. Such information would have a dual use in developing back-calculation methods (see Chapter 6) as well as in compartmental models. A review of the literature may also seek to answer some of the questions presented above, for example the progression from one type of drug use to another and the increasing severity of drug use. Where
127

MODELLING TECHNIQUES AND THEIR USES
available, it would be preferable to use comparable data from throughout Europe to ascertain which processes are common to different areas in the same way that biological processes would be, and which processes vary over space and time.
Feasibility of modelling the processes leading up to young people using drugs
The academic literature often suggests a link between young people's licit substance use, such as smoking or drinking, and their drug use such that those who begin drinking or smoking at a young age are more likely to take drugs at a later age. Thus there are at least four compartments with which the underlying processes could be modelled: drinking; smoking; solvent abuse; and drug misuse. The use of drugs other than cannabis may be assigned another compartment, as can a parallel system such as the availability of drugs or alcohol.
As in the models that describe the spread of diseases, the propensity to begin using drugs may be related to the number of the children's peers that use drugs; however, sociological research is yet to confirm that this is a relevant factor. It may then be preferable to model the uptake of drug use as something that happens to a proportion of young people, unrelated to the number of other young people that are using drugs. The previous two scenarios can both be modelled using the formula proposed by Caulkins and Kaplan and, while it may not seem sensible to attempt to estimate the parameters employed in this formula by commissioning sociological research, it may be prudent to adapt the existing knowledge about the factors relating to someone's inititation into drug use to indicate the likely values of these parameters.
Both these recommendations seek to explore sociological processes that have already been Identified and examined, and this is reflected in the academic literature, particularly in relation to longitudinal studies. Pertinent questions can therefore be raised about both the applicability and the 'added value' of these methods. To answer these questions requires a definition of epidemiological mathematical modelling, such as that offered by Blower and Medley (1992). Compartmental models, regardless of which theory is used to analyse them, cannot at this time give precise answers to some of the more pressing questions in the field of drug misuse. What they can do is to increase the understanding of the processes and, perhaps more interestingly, illustrate the interactions between processes which may previously have been examined separately. Commenting on some of the longitudinal studies which have examined the social processes described above, namely the factors which determine a young person's uptake of drugs and the switch from smoking to injecting, can demonstrate this point.
In both these situations, examining people over a period of time can, for example, offer great insight into the reasons why that individual has changed their route of administration from smoking or 'chasing the dragon' to injecting. A good example of this research would be the drug transitions study at the UK National Addiction Centre (Strang et al., 1997). As part of this study, the reasons why individuals switch from smoking to injecting was examined and valuable information gathered on an individual's reasons for behavioural change. Similarly, longitudinal studies have proposed reasons why young
128
CHAPTER 7
people begin using drugs, particularly in the United States (see Newcomb and Bentler, 1986). While these and other studies explore the reasons why individuals make choices related to their drug or substance use, their generality at population level has yet to be evaluated. Within a stochastic compartmental model the variability of a population can be assigned by attaching a distributional form to a parameter or process, although this is still in an attempt to improve the generalisation at population level rather than implicitly to describe each individual. Deterministic models seek to describe these processes by a parameter such as a rate. Moreover, compartmental models seek to simplify the individual's processes, perhaps even to over-simplify these processes. This, however, does not contradict the definitions of Blower and Medley. By describing these processes either by a rate, as in the deterministic models, or a distribution, as in the case of stochastic models, the advantage of compartmental models is their ability to understand the interaction between the different ongoing processes. Thus compartmental models use basic mathematical modelling techniques to describe, or simplify, the individual processes relating to drug misuse. However, the benefits of such simplifications are to enable the different processes to be joined together within a logical framework of compartments, to give an insight into the complete picture. This complete picture may then be the result of a 'thought experiment' as described by Blower and Medley (1992).
Conclusions
To conclude, compartmental models use mathematics to describe not only individual processes, but also how these processes join together or interact to present a more complete picture. The step from examining individual processes to examining the complete picture necessitates some simplification, and this is reflected in the difficulties in using compartmental models to provide precise predictions. Compartmental models can, however, offer great insights into the interaction between these processes, and indeed into situations which are often described as one process, such as the reasons why a young person would begin using drugs, but which may be better attributable to several underlying processes.
Epidemiological drug researchers are aware that the science is necessarily vague. It may never be able to answer precisely questions such as how many people use drugs or how long a person will smoke heroin before moving on to injecting. This does not detract from researchers' interests in these questions; however, it should be recognised that compartmental models may be the best way to explore some of the underlying processes. Of course, compartmental models may not answer all questions about drug misuse as there can never be a single methodology which answers all questions. The uses of this methodology in the situations described above and also in the study of other drug-related problems, should, however, be explored thoroughly.
129
MODELLING TECHNIQUES AND THEIR USES
References
Anderson, R. M., May, R. M. (1991). Infectious diseases of humans. Oxford: Oxford University
Press.
Area, M., Perucci, C. Α., Spadea, T. (1992). 'The epidemic dynamics of HIV-1 in Italy: modelling
the interaction between intravenous drug users and heterosexual population'. Statistics in Medicine
11 : 1657-84.
Barnard, Μ. Α., Forsyth, A. J. M., McKeganey, N. (1996). 'Levels of drug use among a sample of
Scottish school children'. Drugs: Education, Prevention and Policy 3: 81-9.
Billard, L., Dayananda, R W. A. (1993). 'Drug addiction - pushers generated from the addicts'.
Biometricai Journal 35: 227-44.
Blower, S., Medley, G. (1992). 'Epidemiology, HIV and drugs: mathematical models and data'.
British Journal of Addiction 87: 371-9.
Blower, S. M., Hartel, D., Dowlatabadi, H., May, R. M., Anderson, R. M. (1991). 'Drugs, sex and
HIV: a mathematical model for New York City'. Philosophical Transactions of the Royal Society
Series B: Biological Sciences 321: 171-87.
Caulkins, J. R, Kaplan, Ε. H. (1991). 'AIDS impact on the number of intravenous drug users'.
Interfaces 2 1 : 50-63.
de Alarcón, R. (1969). 'The spread of heroin abuse in a community'. Bulletin of Narcotics 21 :
17-21.
Greenhalgh, D., Hay, G. (1997). 'Mathematical modelling of the spread of HIV/AIDS amongst
injecting drug users'. IMA Journal of Mathematics Applied in Medicine and Biology 14: 11-38.
Hamer, W. H. (1906). 'Epidemic disease in England'. Lancet i: 733-9.
Hethcote, H. W , Yorke, J. A. (1984). 'Gonorrhea: transmission dynamics and control'. Lecture
Notes in Biomathematics 56: 1-105.
Hoppensteadt, F. C , Murray, J. D. (1981). 'Threshold analysis of a drug use epidemic model'.
Mathematical Biosciences 53: 79-87.
Kaplan, E. H. (1992). 'A model-based estimate of HIV infectivity via needle sharing'. Journal of
Acquired Immune Deficiency Syndromes 5:1116-18.
Kaplan, E. H. (1989). 'Needles that kill: modelling human immunodeficiency virus transmission
via shared drug injection equipment in shooting galleries'. Reviews of Infectious Diseases 11 :
289-98.
Mackintosh, D. R., Stewart, G. T. (1979). 'A mathematical model of a heroin epidemic: implications
for control policies'. Journal of Epidemiology and Community Health 33: 299-304.
Newcomb, M., Bentler, R (1986). 'Frequency and sequence of drug use. A longitudinal study
from early adolescence to young adulthood'. Journal of Drug Education 2: 101-20.
Peterson, D., Willard, K., Altmann, M., Gatewood, L., Davidson, G. (1990). 'Monte-Carlo
simulation of HIV infection in an intravenous drug user community'. Journal of Acquired Immune
Deficiency Syndromes 3: 1086-95.
Renshaw, E. (1991). Modelling biological populations in space and time. Cambridge: Cambridge
University Press.
130

CHAPTER 7
Ross, R. (1911). The prevention of malaria. London: Murray.
Strang, J., Griffiths, R, Powis, Β., Abbey J., Gossop, M. (1997). 'How constant is an individual's route of heroin administration? Data from treatment and non-treatment samples'. Drug and Alcohol Dependence 46: 115-18.
131

CHAPTER 8
DYNAMIC MODELS IN DRUG EPIDEMIOLOGY
Colin Taylor and Philip Young
In this chapter the term 'dynamic model' is used to cover methods from system analysis and time-series modelling which are applied to drug-prevalence estimation, but which do not simply attempt to chart or measure prevalence, but rather attempt to model the underlying processes. A useful distinction among such methods is to categorise them as either dynamic or static models. Static methods evaluate a population at a single point in time, while dynamic methods are appropriate when a population is traced over time.
Because of their simplicity, static models have found favour in prevalence estimation. The simplest static-estimation techniques are the synthetic-estimation techniques. These methods develop prevalence estimates for new populations using readily available data sources, or indicators, from known populations by matching various predictor variables, usually demographic characteristics (e.g. ethnicity, gender, age and regional location) and determining appropriate weighting schemes. The appropriate weights are typically determined by either projection models or principal-component analysis.
Dynamic models differ from the static models in that they describe processes over time. The process examined may be the states of individual drug users via multiple-capture models. Multiple-capture models are divided into two classes: open-population; and closed-population models. In a closed-population model it is assumed that the population remains the same throughout the time period, while in an open model adjustments are made for the fact that members of the original population may leave and new members may enter. Techniques for closed-population methods are much simpler, such as the truncated Poisson model, and other than the closed-population assumption make fewer additional assumptions. However, if the time period is sufficient, then closed-population methods will be biased and the more complex open-population models may provide a better estimate of prevalence.
If only aggregate data are available, then a system-dynamic model may be used. Although such models only use aggregate data, they can provide fairly sensitive estimates of prevalence because they typically employ additional economic and social data in a feedback mechanism to adjust the crude aggregate data.
The choice of model selected is largely dictated by the data that are available, and their interrelationships are summarised below in Figure 1.
133
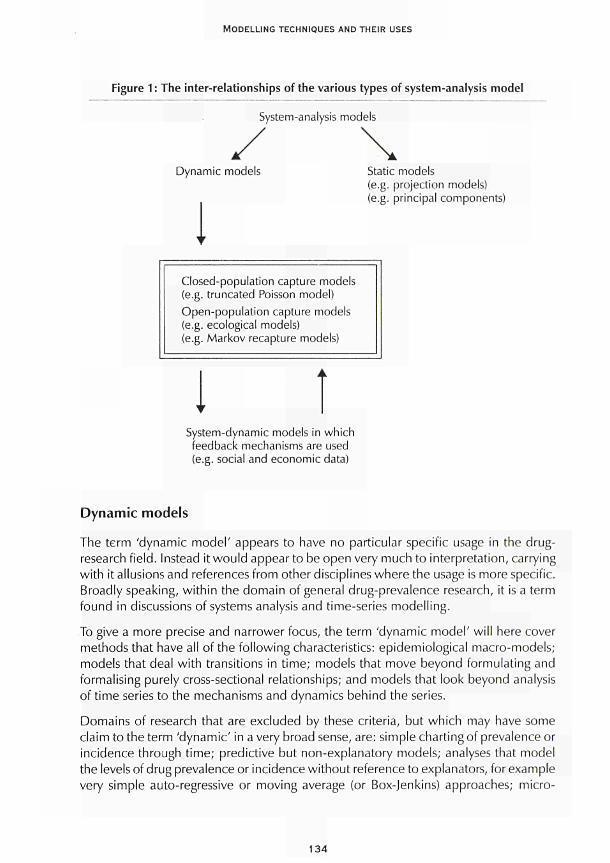
MODELLING TECHNIQUES AND THEIR USES
Figure 1 : The inter-relationships of the various types of system-analysis model
System-analysis models
Dynamic models
I Static models (e.g. projection models) (e.g. principal components)
Closed-population capture models (e.g. truncated Poisson model) Open-population capture models (e.g. ecological models) (e.g. Markov recapture models)
t System-dynamic models in which feedback mechanisms are used (e.g. social and economic data)
Dynamic models
The term 'dynamic model' appears to have no particular specific usage in the drug-research field. Instead it would appear to be open very much to interpretation, carrying with it allusions and references from other disciplines where the usage is more specific. Broadly speaking, within the domain of general drug-prevalence research, it is a term found in discussions of systems analysis and time-series modelling.
To give a more precise and narrower focus, the term 'dynamic model' will here cover methods that have all of the following characteristics: epidemiological macro-models; models that deal with transitions in time; models that move beyond formulating and formalising purely cross-sectional relationships; and models that look beyond analysis of time series to the mechanisms and dynamics behind the series.
Domains of research that are excluded by these criteria, but which may have some claim to the term 'dynamic' in a very broad sense, are: simple charting of prevalence or incidence through time; predictive but non-explanatory models; analyses that model the levels of drug prevalence or incidence without reference to explanators, for example very simple auto-regressive or moving average (or Box-Jenkins) approaches; micro-
134
CHAPTER 8
models that study the progression of individual drug users through various stages of their drug careers, and the process of becoming addicted; micro-models that look at the psycho-dynamics within individuals and their motivations and structures in relation to changes in their drug-taking behaviours; and transmission models of the spread of infection amongst drug users
Issues concerning dynamic modelling
A central reference worth consulting for an overview of dynamic models of prevalence, which includes comparisons with static prevalence-estimation techniques, is the papers contained within the special issue of the Journal of Drug Issues on prevalence estimation (Hser and Anglin, 1993). There are, however, several issues concerning dynamic modelling that are worth mentioning specifically.
First, on issues relating to measuring population coverage and classification it should be noted that such methods are mostly directly concerned with simply counting people. Prevalence estimation must also consider the time frame and geographic boundaries because drug use is a dynamic process. Non-users move into the actively using population while current users may cease use; or drug users sometimes move in and out of geographic areas.
The types of drug used and levels of use often need to be considered for several reasons. First, multiple-drug use is common and estimates of users therefore need to take into consideration this overlap of individuals and multiple-consumption occasions in order to avoid repeated counts of the same people. Second, because of the associated severe social and health consequences, some prevalence estimation may focus on a particular type of drug user (e.g. intravenous drug users) or more severe levels of use (e.g. addicts). However, when prevalence estimation is approached from a view of total drug consumption, all categories of drug users must be considered since all levels of drug use contribute. Definitions are necessary to identify appropriate data sources and to provide valid prevalence estimates.
The second point relates to the use of data from national surveys to estimate prevalence. Several national surveys and special-purpose federal data systems containing drug-related information have been conventionally used for prevalence estimation. Major surveys in the United States include the National Household Survey on Drug Abuse, the High School Senior Survey, the National Ambulatory Medical Care Survey and the National Hospital Discharge Survey. Examples of federal data systems include the Drug Abuse Warning Network, the System to Retrieve Drug Evidence, the Uniform Crime Reports, the Drug Use Forecasting Program and the Client-Oriented Data Acquisition Process. These data sources have both strengths and weaknesses and several issues must be considered in assessing the utility of a particular data system for prevalence-estimation purposes. In particular, all of the above data sets are American, and this may reduce generalisability of the published results for EU countries. However, recent initiatives by the European Monitoring Centre for Drugs and Drug Addiction (EMCDDA) may provide alternative European data sets which are suitable for these types of analyses.
135
MODELLING TECHNIQUES AND THEIR USES
Particular care should be taken over the issue of sampling. Most large-scale surveys of drug use are based on probability-sampling techniques. However, general surveys often undersample certain lower-risk groups because of non-response or non-coverage. If drug users are disproportionately over-represented among the sample population used in the survey then this will overestimate the prevalence of drug use.
It is also worth noting whether the data-storage system is event-based or person-based. Event-based systems are those in which each record arises from a single event, such as emergency-room admission. Person-based systems are those that provide records corresponding to individuals or allow ways to link an individual's multiple records. Except for survey data, most federal monitoring systems are event-based recording systems. It is often the case that several records belong to one individual who has multiple treatment admissions or emergency-room episodes. Thus, the number of people actually responsible for the number of records in these data needs to be determined if the person-based prevalence estimate is desired.
In addition to the availability of data, the description of trends in use over time also requires consistency in the reporting panel, a goal which is not often achieved in continuously reporting indicator systems over long periods of time, especially when reporting by the contributing agencies is voluntary. Inconsistencies in reporting standards and practices must also be considered. The various data systems may also not share standardised methods of data collection, so that the comparison of indicators and their interpretation must be carefully attended.
Finally it should be well understood that prevalence-estimation methods differ in their data requirements and statistical properties and thus in their utility for providing certain types of prevalence estimates. Each of these methods has strengths and limitations, and none can provide estimates without knowledgeable and careful application. Some of these limitations are due to the necessary simplicity of the assumptions of the model, others are due to the demands for specific data of a certain quality. Therefore, in selecting a model, the user must consider the appropriate use of the data that are available and interpret estimates derived from these methods within the appropriate context.
Types of prevalence-estimation methods
The comments in this chapter describe several prevalence-estimation methods with either historical importance or promising future applications. These methods include: synthetic estimation (population-projection models and principal-component approaches); closed-population capture models (specifically the truncated Poisson estimation model); open-population models (specifically the ecological models and the Markov-based dynamic-recapture models); and system-dynamic modelling.
The useful distinction among these methods is to categorise them as primarily dynamic versus static approaches. Static methods such as synthetic estimation or closed-population models evaluate a population at a single point in time. Dynamic methods such as open-population models or system-dynamic models are appropriate when a population is traced over time. The choice of model is largely dictated by the data that are available.
136
CHAPTER 8
To highlight the contrast between these two broad approaches some brief description of the static approaches is appropriate. These are the least complex of the prevalence-estimation models, describing the system at a single point in time. Because of their convenience, these models have been the most popular in drug-use-prevalence estimation.
Synthetic estimation is the simplest of the static-estimation techniques and is the main category of static models that is used in practice. These methods develop prevalence estimates for new populations using readily available data sources or indicators from known populations by matching various predictor variables, usually demographic characteristics, and determining appropriate weighting schemes. The following two methods are used to determine the proper weights to be applied.
Projection models are based on the logic that if the drug-use prevalence rates are known in a population with a known demographic distribution, then the relationships between prevalence and demographic characteristics can be transferred or projected to another population, either smaller or larger than the first.
Principal-component-based approaches assess the relationships observed among multiple indicators in several geographic areas in an attempt to obtain a single composite and common indicator of drug use. By combining several indicators into a single composite index with the weights determined by the principal-components analysis, an index that is more reliable than any single indicator alone may be derived.
Dynamic models differ from the static models in that they describe processes over time. The process examined may be the states of individual drug users, as in the open-population multiple-capture models, or it may be a collection of aggregate societal states, as in system-dynamic models. Because these models can represent processes more accurately than static models, and because they typically incorporate more information, these models potentially result in more accurate estimates of prevalence.
Synthetic-estimation techniques are clearly not dynamic and will not be discussed further. Yet, although closed-population capture models are strictly static models, they are of historical interest and will be considered further in the next section. The following sections will then respectively cover the open-population capture models and the system-dynamic models.
Closed-population capture models
A major heading for prevalence estimation is closed-population multiple-capture methods. These techniques are not usually framed as dynamic models, in that they estimate a population at a single point in time, or at least a closed population assumed closed over a fixed time interval; as such they are usually categorised as a variety of static estimation. In these techniques, two or more surveys of different data sources, such as emergency-room and arrest records, are used to probe the given population during a single time frame. Each survey must be able to identify specific cases and determine which individuals have been detected in both of the surveys. Using the
137
MODELLING TECHNIQUES AND THEIR USES
information about the relative sizes of the samples and their overlaps, the number of individuals that have not been detected can be estimated. This procedure has also been referred to as dual-system estimation (Chandra-Sekar and Deming, 1949; Ericssen and Kadane, 1985).
The population whose size is to be estimated here is said to be closed because the single sampling time implies necessarily that it cannot change and gives the appearance of a simple cross-sectional study. It is, however, likely that the capture points cannot all be considered as generating a sample simultaneously with unfettered potential for overlaps between these samples. In reality, a person appearing at one capture point can only appear at another after a time lag of a length that is dependent on the precise nature, physical or administrative, of the capture points. This consideration throws the multiple-capture process immediately into a dynamic framework even when the population being estimated is closed to change over a time period. It would appear, however, that no studies or methods have specifically focused on this structured capture process to date. This topic is not pursued further here.
The truncated Poisson model
The truncated Poisson estimation model is the simplest version of the multiple-observation models. It can be applied in situations where only the frequency with which an individual appears in a data system is recorded. In this procedure, events, such as arrests for drug possession, that occur one or more times to individuals in a population during a specific interval of time are examined. The distribution of people experiencing various numbers of events is used to extrapolate the size of the population. In the population whose size is to be estimated, some individuals have no events and are never observed, some have one event, some have two, and so forth. The problem is that although the number of people with one, two, three or more events can be observed, the number with no events cannot be directly observed. However, by assuming a probability model, this can be used to extrapolate what the number of people with no events is, and hence estimate the total population.
Now when the events are rare, as they usually are for drug-use incidents, then under the following two assumptions it can be deduced that a plausible distribution for the number of events ¡sa Poisson form, leading to truncated Poisson estimates (Blumenthal et al., 1978). The two assumptions about the events needed for it to be a Poisson distribution are: that they occur randomly over both individuals and times; and that their rate is homogeneous across the population. To estimate the size of the population, an incomplete Poisson distribution is fitted to the frequencies of the observed events, and the single-rate parameter of the distribution is estimated. Knowing this parameter, the size of the unobserved category is estimated and added to the observed count to obtain the final estimate. Once the data have been fitted to the Poisson distribution, the observed and expected frequencies for each number of events can then be compared via a chi-squared test, which will facilitate validation of these assumptions, or not, as the case may be.
138
CHAPTER 8
The truncated Poisson models have been used for estimating the size of the criminal population from arrest history records (Greene and Stollmack, 1981) and the number of persons engaged in using or selling drugs from drug-related arrest data (Woodward et al., 1987). In these applications, an arrest distribution was constructed from the number of observed arrests and the number of arrestees responsible for them, then the truncated Poisson estimation procedure was applied to derive the population estimates. Based on a similar rationale, the Research Triangle Institute (1988) applied the model to estimate the size of the treatment-susceptible heroin population. Their model was unusual in that two separate sources of data were used to estimate the Poisson rate. The number of treatment admissions was available from one data source, while the distributional information was derived from a separate, non-linked source. In this two-source implementation, the comparability of the two populations is critical to ensure that the assumed Poisson distribution is applicable.
The strength of the truncated Poisson method lies in the simplicity of its data requirements and its straightforward statistical formulation. As long as the data can be consolidated into a frequency distribution of the number of people at each level of the repeated observation, an estimate is easily obtained. However, the quality of the estimates depends on the degree to which the Poisson model is an adequate description of the underlying distribution. In particular, the counts must be independent Poisson events. This assumption is frequently violated. For example, criminals are strongly motivated to avoid re-arrest and are, to some extent, quite successful in doing so. On the other hand, risk of arrest may increase as the offender becomes known to the police. The effects of such violations of independence on the truncated Poisson-derived estimates are often not calculable.
Open-population capture models
Data that are drawn from identifiable individuals in a system of successive surveys or censuses using the open-population multiple-capture method are similar to those obtained in the closed-population multiple-capture situation described above. These data also form an incomplete contingency table. The similarity is superficial, however, for the processes to which the models are applicable are quite different. In the closed-population situation, every individual is at risk for every census, while in most longitudinal repeated censuses, some individuals leave the population before the final census while others enter after the first census is complete. Therefore, closed-population models trace and estimate the size of a single population, while open-population models keep track of population changes and provide estimates reflecting such time-related changes of in and out flows. The data from a longitudinal dynamic process thus require a different type of statistical model, based on some assumptions about the open population under consideration.
Most applications of the multiple-capture methodology to longitudinally repeated drug-use samples have used closed-population models (e.g. Doscher and Woodward, 1983; French, 1977; Greenwood, 1971 ; Woodward et al., 1985). Such estimates are potentially biased because some individuals may not be available throughout the entire sequence
139
MODELLING TECHNIQUES AND THEIR USES
of time sampling and the degree of bias may increase with longer intervals between samplings. The nature and magnitude of these biases have not been studied. However, the magnitude of the standard errors in these closed-population applications is usually quite large, ranging from 10 % to 80 % of the estimated population sizes. Such poor estimation is especially serious within geographical areas representing relatively small populations. Models that accommodate the more realistic open-population dynamics may be generally more appropriate for estimation purposes.
A more sophisticated approach using repeated sampling that builds on the truncated Poisson model described above may provide a better estimation methodology. Ecological open-population models, which assess the size and character of a biological population based on repeated marked samples, have been developed and extensively analysed (for reviews see Seber, 1982, 1986). The most common class of ecological sampling models that are applicable to the estimation of the number of drug users is the capture-recapture type. For an open population, the most recent models are the Jolly-Seber model Golly, 1965, 1982; Seber, 1965, 1982) and a related model by Cormack (1981, 1985). However, a number of the assumptions of these models are unrealistic for drug-using populations, and none of these models has yet been applied to drug-use prevalence estimation. For example, the Jolly-Seber model assumes that: all samples are of independent and identical capture probability and survival probability; samples are instantaneous and release is made immediately after each sampling; the drug user's behaviour is unaffected by the capture history; and there is no temporary emigration from the population. These assumptions can hardly be satisfied by existing data or by the population characteristics of drug abusers.
Markov dynamic-recapture models
Another variety of the open-population multiple-capture approach developed recently is a Markov-based dynamic-recapture model. Instead of counting the individuals captured in each sample, a longitudinal model is based on the variety of capture histories. The model characterises capture probabilities by a two-step sampling process. The initial sampling probability is governed by a stochastic process in which users are drawn from a large population of non-users. After this first observation, the balance of the process is governed by the dynamics of a state structure that represents the evolution of drug-consumption patterns and their repeated observations by some indicator system (e.g. treatment admissions). This process forms a Markov chain (Wickens, 1993). The full history probabilities are therefore the product of three terms: the size of the sample in which an individual is first observed; the probability of that observation; and the probability of the observation history subsequent to the initial observation, characterised by the full variety of such histories. This procedure generates estimates of the size of the population from which the observations are drawn.
In this procedure, the data from a repeatedly observed population are treated as sampling histories of individuals. As in the closed-population multiple-capture models, a probabilistic model is fitted to the observed histories, then extrapolated to count the unobserved members of the population. The Markov and semi-Markov models describe
140
CHAPTER 8
the way the individuals change between observations as transitions among a small set of discrete states. Individuals enter into the target population, pass through various states of observation and non-observation, and possibly may leave the target population. In a semi-Markov process, the individual's passage among the states is modelled in continuous time by a homogeneous transition process. For data from a series of samples, the transitions are only observed at the times of sampling, and a simpler discrete-step Markov chain is used.
The essential feature of a Markovian process is the assumption that the current state of an individual provides all available information about his or her future behaviour. How the individual initially reached that state is irrelevant. This independence of history means that the properties of the process are summarised by a set of transition rules pertaining to the specific states. For example, individuals in the observed state are characterised by the three probabilities (or rates) that indicate how likely they are to pass to each of the three states to which the observed state is connected.
The transition probabilities among the observation and post-observation states can be estimated from the observed histories and are used to infer the target population size. The crucial assumption underlying these methods is that the dynamics of unseen individuals match those of the individuals who have been observed. Moreover, the transition structure must adequately approximate the dynamics of real individuals. It should be recognised that these models impose a considerable structure on the data and cannot be accurately used without a history sequence of some length.
The Markov estimation technique has the advantage of being able to provide a somewhat more realistic dynamic description of the drug-using process. Its weakness is that the model comes with some strong intrinsic statistical assumptions of homogeneity and independence of history. In addition, to be practically applied, the model can have only a minimal dynamic structure. The limitation on the complexity of the model is necessary if its parameters are to be identifiable and estimated. A rich data source is needed to identify any complex structure, and such comprehensive data are not usually available.
Although the open-population models potentially allow a more realistic picture of drug-using populations as they evolve over time than do closed-population models, such models still require certain restrictive assumptions. Some of these assumptions are particular to the specific models developed in ecological situations, and others serve to simplify the required statistical models so that parameters can be adequately estimated. The latter assumptions include the requirements that individuals behave independently of each other and that the model's parameters are homogeneous throughout the population. A number of applications have shown that these assumptions are often violated in biology and health sciences (e.g. Huber, 1962; Manly, 1971 ; Wittes, 1974), and simulation studies have shown potentially large biases in population estimates under such conditions (e.g. Carothers, 1973; Gilbert, 1973).
Theoretically, surveys or other data sources used by multiple-capture methods (either closed or open) should be comprehensive in population coverage. In reality, data suitable for this type of application have been limited to treatment-admission records that do
141
MODELLING TECHNIQUES AND THEIR USES
not provide such comprehensive coverage, thus limiting the generalisability of the estimation results. One common difficulty in applying multiple-capture models is the necessity of matching individuals across observations. The data source must ensure that an individual captured in one sample is identifiable as the same person if captured in another sample. However, such information is usually difficult to obtain.
Because the multiple-recapture models attempt only to estimate the number of unobserved individuals from the observed sample, they cannot extrapolate to completely unobserved sub-populations. Like any of the statistical methods, they cannot solve the hidden-population problem. However, open-population models generally are based on probability theory and have better-known statistical properties that allow estimates to be evaluated by standard methods such as confidence intervals. In addition, boundaries of generalisability can usually be inferred by data coverage and model specifications.
System-dynamic modelling
System dynamics is a general methodology, first developed in the late 1950s, for analysing dynamic phenomena through the use of simulation models based on information-feedback-control theory. A system-dynamic model consists of an interconnected set of difference equations representing continuous time movement and accumulations of people, materials and information. After being assigned initial conditions consistent with historical data, this set of equations is used to generate output over time. If the model is a valid one, this output will closely mimic the true course of events, and the model may be used for prevalence estimation and for making conditional forecasts.
An example of system-dynamic modelling studies of illicit drug use include the 'Persistent Poppy' model of Levin et al. (1975). The Persistent Poppy model examined heroin use in New York City from the standpoint of policy rather than prevalence estimation. Although the model contains several interesting endogenous factors, such as law-enforcement activity and treatment programmes, it was developed at a time when the numerical data needed for its calibration and validation were lacking.
Another example of a system-dynamic model was developed by Gardiner and Shreckengost (1985, 1987; Shreckengost, 1984, 1985). The models developed by Gardiner and Shreckengost address drug supply and demand on a national level, with specific application to heroin and cocaine. They have been used primarily to make inferences about drug-import levels, thus focusing on quantity measures rather than persons or events. The model developed for heroin was adapted to estimate the number of users, but such estimates were shown to be rather sensitive to uncertain assumptions about the number and type of drug-user categories (Shreckengost, 1984). The models of Gardiner and Shreckengost may also lack sufficient feedback structure and internally generated momentum to be useful for prevalence estimation and forecasting.
142
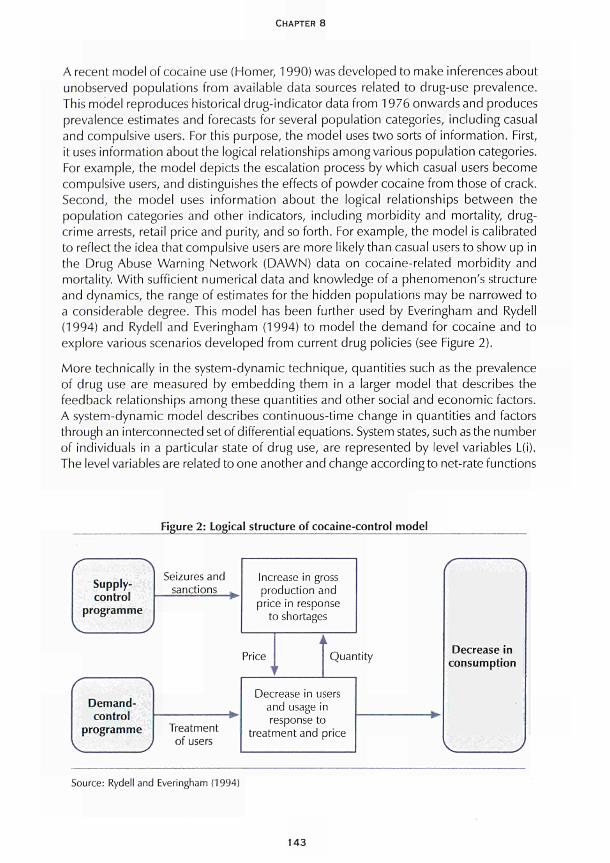
CHAPTER 8
A recent model of cocaine use (Homer, 1990) was developed to make inferences about unobserved populations from available data sources related to drug-use prevalence. This model reproduces historical drug-indicator data from 1976 onwards and produces prevalence estimates and forecasts for several population categories, including casual and compulsive users. For this purpose, the model uses two sorts of information. First, it uses information about the logical relationships among various population categories. For example, the model depicts the escalation process by which casual users become compulsive users, and distinguishes the effects of powder cocaine from those of crack. Second, the model uses information about the logical relationships between the population categories and other indicators, including morbidity and mortality, drug-crime arrests, retail price and purity, and so forth. For example, the model is calibrated to reflect the idea that compulsive users are more likely than casual users to show up in the Drug Abuse Warning Network (DAWN) data on cocaine-related morbidity and mortality. With sufficient numerical data and knowledge of a phenomenon's structure and dynamics, the range of estimates for the hidden populations may be narrowed to a considerable degree. This model has been further used by Everingham and Rydell (1994) and Rydell and Everingham (1994) to model the demand for cocaine and to explore various scenarios developed from current drug policies (see Figure 2).
More technically in the system-dynamic technique, quantities such as the prevalence of drug use are measured by embedding them in a larger model that describes the feedback relationships among these quantities and other social and economic factors. A system-dynamic model describes continuous-time change in quantities and factors through an interconnected set of differential equations. System states, such as the number of individuals in a particular state of drug use, are represented by level variables L(i). The level variables are related to one another and change according to net-rate functions
Figure 2: Logical structure of cocaine-control model
Supply-control
programme
Demand-control
programme
Seizures and sanctions
Treatment of users
Increase in gross production and
price in response to shortages
Price ι
i
r
i Quantity
Decrease in users and usage in r
treatr ssponse tc nentand
) arice
Decrease in consumption
Source: Rydell and Everingham (1994)
143
MODELLING TECHNIQUES AND THEIR USES
f; for each level L there is a single net-rate function fL. These net-rate functions use intermediate variables known as rates and auxiliaries. Rate variables define identifiable flows into and out of the levels, such as drug-use initiation, escalation, stopping and relapse. Auxiliary variables define other concepts that make the model more intuitive and natural, such as retail price and perceived health risk. The net-rate functions are parameterised by constants C, which include delay times and strength-of-response parameters, such as price elasticities. The net-rate functions may also be influenced by exogenous variables X(t) that change over time and are determined by external data, such as the baseline population growth rate and the fraction of drug imports that are seized. With the many level and exogenous variables, constants and net-rate functions written as vectors, a system-dynamic model is expressed as
dL(t)/M - ψ = flL(i), X(t); C]
When investigating the model, these differential equations are typically not solved analytically, but are expressed as difference equations, for small time intervals At.
L(t) = L(t-At) +AtxfL(i), X(t-At); C)
The variables are simulated starting at some initial time such as t = 1976 and stepping forward to subsequent times. The computation interval Δ has no real-world significance and is chosen to be sufficiently small such that the simulation output lies close to the true solution of the corresponding differential equations.
The validation of a system-dynamic model, unlike that of the simpler probabilistic models described elsewhere, is an ongoing process of building confidence in the realism of the model's structure and behaviour, using a variety of largely qualitative tests (Forrester and Senge, 1980). The complexity of the models allows for similar observed behaviour to be generated by a variety of structures, which must be carefully chosen if unobserved dynamic quantities, such as prevalence, are to be accurately described. Confidence in the model and its estimates is enhanced when all equations have concrete real-life significance, are dimensionally correct and operate appropriately even under extreme conditions. Confidence is also enhanced when the model faithfully recreates the dynamic patterns and correlations observed in real life, and when it bring to light behaviour in the real system that has gone unrecognised or unexplained (Mass, 1991).
System-dynamic models typically attempt to explain observed dynamics as being the consequence of endogenous feedback relationships among constituent variables. This endogenous perspective distinguishes the system-dynamic approach from other modelling methods, such as synthetic estimation, which depend heavily upon exogenous or independent predictors whose own behaviour over time is left unexplained by the model. The continuous-feedback perspective of system dynamics also leads to models that contain a greater variety of system variables than the multiple-capture or Markov-type models, and tend to be larger in scope. This enlarged scope is rendered manageable by modelling flows as aggregate measures, rather than by keeping a unique record of every individual unit in the flow, as is done in the multiple-capture models.
144
CHAPTER 8
System dynamics is an attractive approach for prevalence estimation largely because it can be used to explain past history, fill in the gaps in indicator data, and project outcomes under different assumed scenarios and policy interventions. In addition, a system-dynamic model can often help detect certain flaws in existing indicator data sets, such as possible logical inconsistencies between incidence data and prevalence data. However, the very flexibility of system dynamics opens the door to potential model mis-specification, a danger that becomes greater as the number of variables and conceptual scope of the model increase relative to the quantity of relevant data. Also, like any method, the accuracy of a system-dynamic model is sensitive to the quality of the data used to calibrate it. Nevertheless, a well-specified system-dynamic model may be useful even if it falls short in numerical precision, because it reveals and anticipates trends that other methods may miss.
Because of the complexity of system-dynamic models and the risks of mis-specification, a variety of tests for building confidence into such models have been offered that go well beyond the usual requirement that historical data be reproduced (Forrester and Senge, 1980). But these validation techniques are themselves subject to uneven application or improper interpretation. It must be recognised that system-dynamic modelling, despite its many attractions, is difficult to master, and there are pitfalls in its application that must be carefully avoided.
Conclusions
Techniques are already available for the dynamic system analysis of drug prevalence. The problem with such models is that their applicability is highly dependent on the level of data available. As better-quality and more comprehensive data become available it may be that more complex modelling techniques will also be proposed; however, at present there are already methods proposed which go beyond the available data. As such, the key priority in this area must be the implementation of better and more comprehensive methods of data collection. In addition, if these techniques are expected to be applied to the European drug market then it is also important that European data sources are developed.
References
Blumenthal, S., Dahiya, R. D., Gross A. J. (1978). 'Estimating the complete sample size from an incomplete Poisson sample'./ourna/of the American Statistical Association 73: 182-7.
Carothers, A. D. (1973). 'Capture-recapture methods applied to a population with known parameters'. Journal of Animal Ecology 42: 125-46.
Chandra-Sekar, C, Deming, W E. (1949). 'On a method of estimating birth and death rates and the extent of registration'. Journal of the American Statistical Association 44: 101-15.
Cormack, R. M. (1985). 'Examples of the use of GLIM to analyze capture-recapture studies', in Morgan, B. J. T, North, R M. (eds) Statistics in ornithology, Lecture notes in statistics, 29. Berlin-Heidelberg: Springer-Verlag.
145
MODELLING TECHNIQUES AND THEIR USES
Cormack, R. M. (1981 ). 'Loglinear models for capture-recapture experiment on open populations', in Hiorns, R. W , Cooke, D. (eds) The mathematical theory of the dynamics of biological populations. London: Academic Press.
Doscher, M. L., Woodward, J. A. (1983). 'Estimating the size of subpopulations of heroin users: applications of log-linear models to capture-recapture sampling'. The International Journal of the Addictions 18: 167-82.
Ericssen, E. R, Kadane, J. B. (1985). 'Estimating the population in a census year: 1980 and beyond'. Journal of the American Statistical Association 80: 98-109.
Everingham, S. S., Rydell, C. R (1994). Modelling the demand for cocaine. Santa Monica, CA: Drug Policy Research Centre, RAND.
Forrester, J. W , Senge, R M. (1980). 'Tests for building confidence in system-dynamic models'. TIMS Studies in Management Sciences 14: 209-28.
French, J. F. (1977). 'Prevalence of heroin use in New Jersey'. Unpublished report of the Department of Health, Alcohol, Narcotic, and Drug Abuse Unit, State of New Jersey.
Gardiner, L. K., Shreckengost, R. C. (1987). 'A system dynamics model for estimating heroin imports into the United States'. System Dynamics Review 3 (1): 8-27.
Gardiner, L. K., Shreckengost, R. C. (1985). 'Estimating heroin imports into the United States', in Rouse, Β. Α., Kozel, N. J., Richards, L. G. (eds) Self-report methods of estimating drug use: current challenges to validity, NIDA Research Monograph 57, DHHS Publication No. (ADM185-1402. Washington DC: US Government Printing Office.
Gilbert, R. O. (1973). 'Approximations of the bias in the Jolly-Seber capture-recapture model'. Biometrics 29: 501-26.
Greene, Μ. Α., Stollmack, S. (1981). 'Estimating the number of criminals', in Fox, J. A. (ed.) Models in quantitative criminology. New York: Academic Press, 1-24.
Greenwood, J. A. (1971). 'Estimating the number of narcotic addicts'. Drug Control Division, Office of Scientific Support, Bureau of Narcotics and Dangerous Drugs, US Department of Justice Document No SCD-TR-3.
Homer, J. (1990). 'A system dynamics simulation model of cocaine prevalence'. Final report to the National Institute of Justice, Grant 87-U-CX-0042.
Hser, Y.-L, Anglin, M. D. (1993). 'Prevalence estimation techniques for drug-using populations'. Journal of Drug Issues 23 (2): 163-360.
Huber, J. J. (1962). 'Trap response of confined cottontail populations'. Journal of Wildlife Management 26: 177-85.
Jolly, G. M. (1982). 'Mark-recapture models with parameters constant in time'. Biometrics 38: 301-21.
Jolly, G. M. (1965). 'Explicit estimates from capture-recapture data with both death and immigration: a stochastic model'. Biometrika 52: 225-47.
Levin, G., Roberts, E. B., Hirsch, G. Β. (1975). The persistent poppy. Cambridge, MA: Ballinger.
Manly, B. F J. (1971 ). 'Estimates of a marking effect with capture-recapture sampling'. Journal of Applied Ecology 8: 181-9.
146
CHAPTER 8
Mass, N.J. (1991). 'Diagnosing surprise model behavior: a tool for evolving behavioral and policy insights'. System Dynamics Review 14: 209-28.
Research Triangle Institute (1988). Presentation at the Prevalence Estimation Technique Conference, Washington DC, November.
Rydell, C. R, Everingham, S. S. (1994). Controlling cocaine: supply verses demand programs. Santa Monica, CA: Drug Policy Research Centre, RAND.
Seber, G. A. F. (1986). 'A review of estimating animal abundance'. Biometrics 42: 267-92.
Seber, G. A. F. (1982). The estimation of animal abundance and related parameters. London: Macmillan.
Seber, G. A. F. (1965). 'A note on the multiple-recapture census'. Biometrika 52: 249-59.
Shreckengost, R. C. (1985). 'Estimating cocaine imports into the United States'. Unpublished manuscript.
Shreckengost, R. C. (1984). 'How many heroin users are there?' Unpublished manuscript.
Wickens, T. D. (1993). 'Quantitative methods for estimating the size of a drug-using population'. Journal of Drug Issues 23: 185-216.
Wittes, J. T. (1974). 'Application of a multinomial capture-recapture model to epidemiological data''. Journal of the American Statistical Association 69: 93-7.
Woodward, J. Α., Bonett, D. G., Brecht, M. L. (1985). 'Estimating the size of a heroin-abusing population using multiple-recapture census', in Rouse, Kozel, Richards (eds) Self-report methods of estimating drug use, 58-171.
Woodward, J. Α., Brecht, M. L., Bonett, D. G. (1987). 'Statistical analysis of drug abuse indicators'. Final report to the Drug Enforcement Administration and the National Institute on Drug Abuse (NIDA), Washington, DC.
147

CHAPTER 9
STRUCTURAL EQUATIONS AND PATH ANALYSES:
USING MULTIPLE INDICATORS OF DRUG PREVALENCE
Colin Taylor and Philip Young
In many areas of social research it is sometimes not possible to measure directly the concepts that are of major interest. The first distinction that researchers wish to make is that between frequency of drug-taking and the quantity of drugs taken. Distinguishing between frequency and quantity has important implications for recognising the presence of drug or alcohol problems by health-care professionals, employers or co-workers. Many studies combine frequency and quantity measures to assess drug and alcohol consumption (e.g. Makela and Simpura, 1985).
However, frequency of drug use and quantity or amount of substance ingested per occasion may be differentially related to disruptive or 'problem' use of drugs. Thus, although frequency and quantity are typically correlated in a positive direction (Fitzgerald and Mulford, 1984; Huba et al., 1982), they may not be equally complicit in predicting general problems with drug use or use of drugs in inappropriate settings (i.e. disruptive use at work or school). Huba et al. (1982), in a study of 257 adolescents between 15 and 18 years of age, found a correlation of 0.91 between quantity and frequency measures of use of alcohol, cannabis and hard drugs. In addition, researchers are often interested in the public's subjective perception of the drug problem.
From the above, four underlying concepts related to drug use that may interest researchers can be identified: the frequency of drug use; the quantity of drug use; the amount of disruptive drug use; and the subjective perception of drug-use problems. Researchers may then be interested in the relationships between these concepts or factors. Specifically, researchers are often interested in modelling the correlations between them. The idea of using these underlying factors first appeared in the field of psychometric testing when researchers came to realise that the measurement of hypothesised constructs, such as personality traits and intelligence, could be improved by considering scores on a variety of indicators (Bentler, 1990).
Unfortunately, although it is easy to discuss drug usage conceptually in terms of these factors, it is often difficult to measure these quantities directly. As a result, researchers often tend to collect information on variables which they believe will act as indicators of the underlying concepts. The most basic way of proceeding is to use a technique known as factor analysis. The basic factor-analysis model is essentially the same as
149
MODELLING TECHNIQUES AND THEIR USES
multiple regression, except that the observed multiple indicators are regressed on the unobserved underlying factors, which are often referred to as latent variables.
When a specific number of factors are assumed to be involved, then the factor analysis really revolves around trying to justify, or confirm, that these are the correct factors to use, and is often called confirmatory-factor analysis. The use of multiple indicators has long been recommended as an alternative to counting actual prevalence or incidence, and at present the Pompidou Group of the Council of Europe is still making their use a central part of its recommended programme. The use of a multi-trait multi-method procedure (Campbell and Fiske, 1959) using latent-variable confirmatory-factor analyses is commonplace.
The confirmatory-factor model has been described by Schmitt and Stults (1986) as the preferred method of analysing multi-trait multi-method matrices. Such procedures have been successfully used to demonstrate construct validity and to derive more accurate measures of drug use (Stacy et al., 1985), while Harvey et al. (1985) found it useful to incorporate method factors into their confirmatory-factor analysis of the job diagnostic survey.
The above examples of latent variables are, of course, only some of the underlying constructs, or factors, that have been postulated. Another important aspect to recognise in researching drug prevalence is that poly-drug abuse is very common. In fact, most drug users do not limit themselves to a single substance and typically use two or more drugs as part of their lifestyle (Clayton and Ritter, 1985). In particular, those who use illicit drugs (i.e. cannabis, cocaine or other hard drugs) also tend to use alcohol (see Newcomb and Bentler, 1986a, 1986b). Thus, the general drug factors identified in these analyses reflect poly-drug use, a more realistic appraisal of drug involvement than studying single substances.
However, most heavy users of drugs other than alcohol tend to be poly-drug users (Clayton and Ritter, 1985), with alcohol being one of the multiple substances. Alcohol use in a poly-drug-use context may have quite different consequences than when it is used in moderation. It is possible that moderate use of drugs other than alcohol may not invariably be associated with problem use of such substances by young adults.
Another area where drug-prevalence research is concentrated is in the detailed relationship of drug use to personal behaviours and in particular to drug-related problems, expressed as underlying latent constructs. It is of particular interest to determine whether high levels of drug use are invariably associated with inappropriate or disruptive use of drugs on the job, or at school, or with other specific problems of use (e.g. car accidents and arrests) among adolescents. In the same way, many features of intravenous drug users' (IDUs) behaviour, such as sharing injecting equipment or sexual activity, may be considered latent variables with many partially correlated indicators.
Sadava and Secord (1984) reported that consumption of alcohol and drugs was related to, but not equivalent to or redundant with, alcohol problems. Sadava (1985) also found that self-reported consumption and problems were largely independent among
150
CHAPTER 9
adults. He argued that alcohol consumption and alcohol-related problems must be more clearly separated on conceptual and methodological bases. Survey studies typically have found an average correlation in the 0.3 to 0.4 range between measures of consumption and problems (Sadava and Secord, 1984). In a longitudinal study, Stein et al. (1987) found different prior determinants of use and problem use of drugs in young adulthood. General use was related to prior use and early adult models, whereas problem use was related to earlier rebelliousness.
In their 1988 study, which is a good example of the genre and which touches on all three of these issues, Stein et al. examined the interrelations among different ways to assess drug use, self-reported problems with use and specific negative outcomes resulting from drug use. Specifically, the analyses concern the relation among self-reported use of drugs in the workplace; arrests for driving while intoxicated (DWI) and for other drug-law violations; having car accidents while drunk or stoned; general drug problems; and frequency and quantity of using alcohol, cannabis, cocaine and other hard drugs.
Figure 1 depicts the hypothesised confirmatory-factor model and illustrates how the specific drug-use components (alcohol, cannabis, cocaine and hard drugs) are separated from poly-drug-use tendencies (frequency and quantity), disruptive use and subjective problem-use factors. These constructs are identified by 13 measured or observed variables. Latent variables are depicted as circles, and manifest variables are represented as rectangles. On the left-hand side of Figure 1, a general alcohol-use latent variable is hypothesised to generate measures of alcohol frequency, alcohol quantity, disruptive alcohol use, subjective problems with alcohol, and trouble with alcohol or drugs. Similarly, the other measured variables of drug use are assumed to reflect specific tendencies to use cannabis, hard drugs and cocaine. On the right-hand side of Figure 1, a substantive general latent variable of drug-use frequency (i.e. frequency of poly-drug use) is assumed to generate manifest measures of frequency of alcohol, cannabis, hard drug and cocaine use. Drug-use quantity is identified by quantity measures of alcohol and cannabis use. The tendency to use a range of drugs on the job or in school is called disruptive drug use and is reflected in four measures of disruptive alcohol, cannabis, cocaine and hard-drug use. Three measures of subjectively perceived problems with drugs or alcohol, both long-term and more recent, are reflected in a latent variable of subjective problem drug use. The lines with double-headed arrows indicate co-variances allowed between the latent variables. Correlations between the substantive latent variables and the specific drug-use latent variables were set at zero.
The report examined relations among self-report measures and outcomes of drug use among 739 young adults. It is worth noting that the usual factor-analysis model assumes normality of the indicators. However, the indicators used by Stein et al. (1988) were screened for appropriate distributional properties, such as skewness and kurtosis. Most of the indicators were found to have distributions quite far from normality. Fortunately, confirmatory-factor analysis is known to be fairly robust to departures from normality.
151
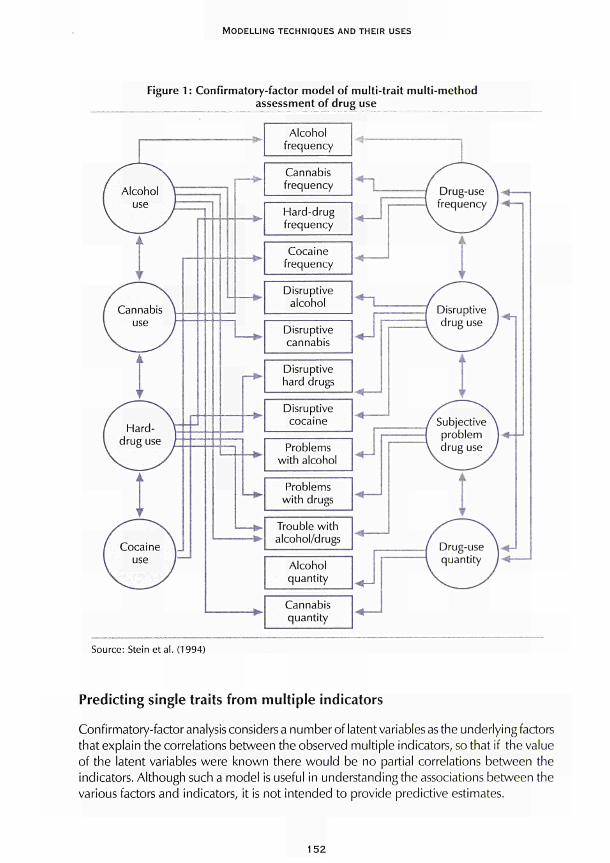
MODELLING TECHNIQUES AND THEIR USES
Figure 1 : Confirmatory-factor model of multi-trait multi-method assessment of drug use
Source: Stein et al. (1994)
Predicting single traits from multiple indicators
Confirmatory-factor analysis considers a number of latent variables as the underlying factors that explain the correlations between the observed multiple indicators, so that if the value of the latent variables were known there would be no partial correlations between the indicators. Although such a model is useful in understanding the associations between the various factors and indicators, it is not intended to provide predictive estimates.
152
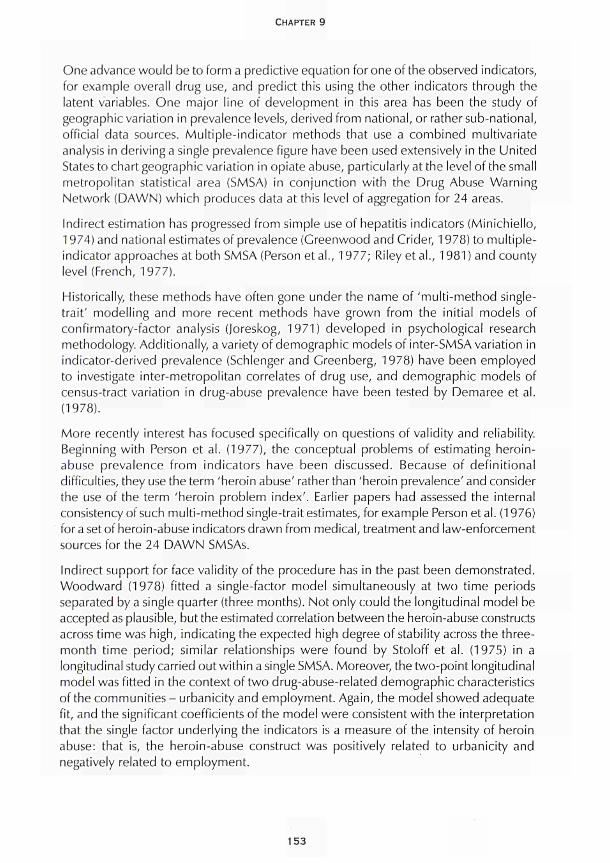
CHAPTER 9
One advance would be to form a predictive equation for one of the observed indicators, for example overall drug use, and predict this using the other indicators through the latent variables. One major line of development in this area has been the study of geographic variation in prevalence levels, derived from national, or rather sub-national, official data sources. Multiple-indicator methods that use a combined multivariate analysis in deriving a single prevalence figure have been used extensively in the United States to chart geographic variation in opiate abuse, particularly at the level of the small metropolitan statistical area (SMSA) in conjunction with the Drug Abuse Warning Network (DAWN) which produces data at this level of aggregation for 24 areas.
Indirect estimation has progressed from simple use of hepatitis indicators (Minichiello, 1974) and national estimates of prevalence (Greenwood and Crider, 1978) to multiple-indicator approaches at both SMSA (Person et al., 1977; Riley et al., 1981 ) and county level (French, 1977).
Historically, these methods have often gone under the name of 'multi-method single-trait' modelling and more recent methods have grown from the initial models of confirmatory-factor analysis (Joreskog, 1971) developed in psychological research methodology. Additionally, a variety of demographic models of ¡nter-SMSA variation in indicator-derived prevalence (Schlenger and Greenberg, 1978) have been employed to investigate inter-metropolitan correlates of drug use, and demographic models of census-tract variation in drug-abuse prevalence have been tested by Demaree et al. (1978).
More recently interest has focused specifically on questions of validity and reliability. Beginning with Person et al. (1977), the conceptual problems of estimating heroin-abuse prevalence from indicators have been discussed. Because of definitional difficulties, they use the term 'heroin abuse' rather than 'heroin prevalence' and consider the use of the term 'heroin problem index'. Earlier papers had assessed the internal consistency of such multi-method single-trait estimates, for example Person et al. (1976) for a set of heroin-abuse indicators drawn from medical, treatment and law-enforcement sources for the 24 DAWN SMSAs.
Indirect support for face validity of the procedure has in the past been demonstrated. Woodward (1978) fitted a single-factor model simultaneously at two time periods separated by a single quarter (three months). Not only could the longitudinal model be accepted as plausible, but the estimated correlation between the heroin-abuse constructs across time was high, indicating the expected high degree of stability across the three-month time period; similar relationships were found by Stoloff et al. (1975) in a longitudinal study carried out within a single SMSA. Moreover, the two-point longitudinal model was fitted in the context of two drug-abuse-related demographic characteristics of the communities - urbanicity and employment. Again, the model showed adequate fit, and the significant coefficients of the model were consistent with the interpretation that the single factor underlying the indicators is a measure of the intensity of heroin abuse: that is, the heroin-abuse construct was positively related to urbanicity and negatively related to employment.
153
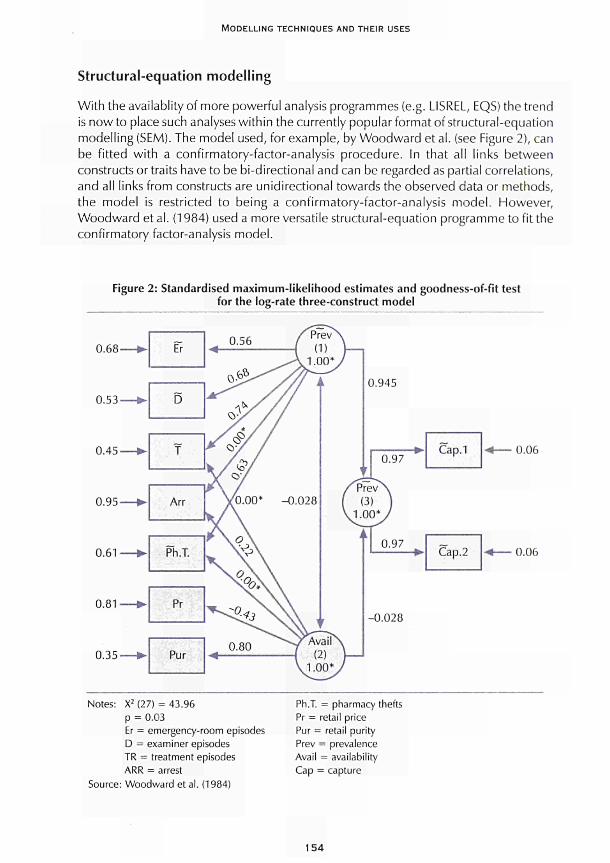
MODELLING TECHNIQUES AND THEIR USES
Structural-equation modelling
With the availablity of more powerful analysis programmes (e.g. LISREL, EQS) the trend is now to place such analyses within the currently popular format of structural-equation modelling (SEM). The model used, for example, by Woodward et al. (see Figure 2), can be fitted with a confirmatory-factor-analysis procedure. In that all links between constructs or traits have to be bi-directional and can be regarded as partial correlations, and all links from constructs are unidirectional towards the observed data or methods, the model is restricted to being a confirmatory-factor-analysis model. However, Woodward et al. (1984) used a more versatile structural-equation programme to fit the confirmatory factor-analysis model.
Figure 2: Standardised maximum-likelihood estimates and goodness-of-fit test for the log-rate three-construct model
0.68
0.53
0.45
0.95
0.61
0.81
0.35
- *
—
- *
—
—
— ►
- *
fr
D
Τ
Arr
Ph.T.
Pr
Pur
0.97 Cap.1 0.06
0.06
Notes: X2 (27) = 43.96 ρ = 0.03 Er = emergency-room episodes D = examiner episodes TR = treatment episodes ARR = arrest
Source: Woodward et al. (1984)
Ph.T. = pharmacy thefts Pr = retail price Pur = retail purity Prev = prevalence Avail = availability Cap = capture
154
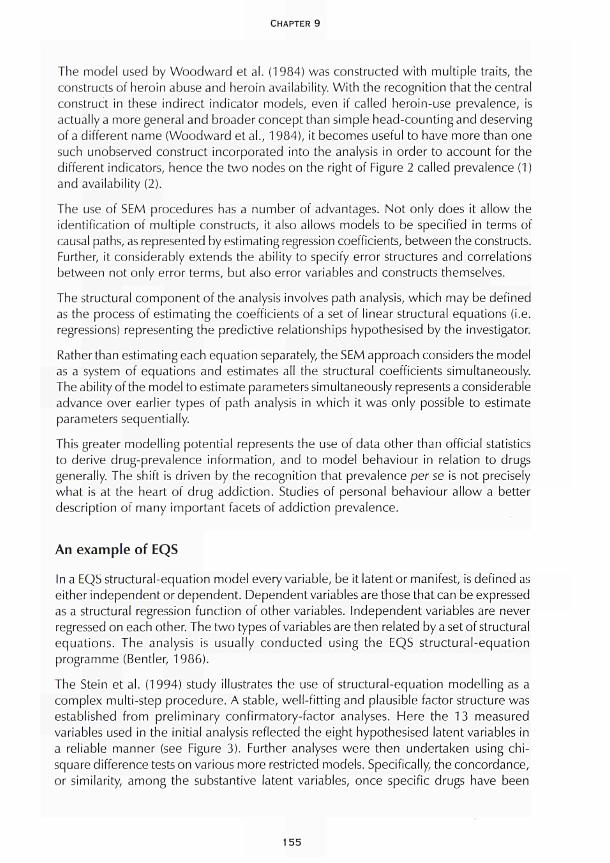
CHAPTER 9
The model used by Woodward et al. (1984) was constructed with multiple traits, the constructs of heroin abuse and heroin availability. With the recognition that the central construct in these indirect indicator models, even if called heroin-use prevalence, is actually a more general and broader concept than simple head-counting and deserving of a different name (Woodward et al., 1984), it becomes useful to have more than one such unobserved construct incorporated into the analysis in order to account for the different indicators, hence the two nodes on the right of Figure 2 called prevalence (1) and availability (2).
The use of SEM procedures has a number of advantages. Not only does it allow the identification of multiple constructs, it also allows models to be specified in terms of causal paths, as represented by estimating regression coefficients, between the constructs. Further, it considerably extends the ability to specify error structures and correlations between not only error terms, but also error variables and constructs themselves.
The structural component of the analysis involves path analysis, which may be defined as the process of estimating the coefficients of a set of linear structural equations (i.e. regressions) representing the predictive relationships hypothesised by the investigator.
Rather than estimating each equation separately, the SEM approach considers the model as a system of equations and estimates all the structural coefficients simultaneously. The ability of the model to estimate parameters simultaneously represents a considerable advance over earlier types of path analysis in which it was only possible to estimate parameters sequentially.
This greater modelling potential represents the use of data other than official statistics to derive drug-prevalence information, and to model behaviour in relation to drugs generally. The shift is driven by the recognition that prevalence per se is not precisely what is at the heart of drug addiction. Studies of personal behaviour allow a better description of many important facets of addiction prevalence.
An example of EQS
In a EQS structural-equation model every variable, be it latent or manifest, is defined as either independent or dependent. Dependent variables are those that can be expressed as a structural regression function of other variables. Independent variables are never regressed on each other. The two types of variables are then related by a set of structural equations. The analysis is usually conducted using the EQS structural-equation programme (Bentler, 1986).
The Stein et al. (1994) study illustrates the use of structural-equation modelling as a complex multi-step procedure. A stable, well-fitting and plausible factor structure was established from preliminary confirmatory-factor analyses. Here the 13 measured variables used in the initial analysis reflected the eight hypothesised latent variables in a reliable manner (see Figure 3). Further analyses were then undertaken using chi-square difference tests on various more restricted models. Specifically, the concordance, or similarity, among the substantive latent variables, once specific drugs have been
155
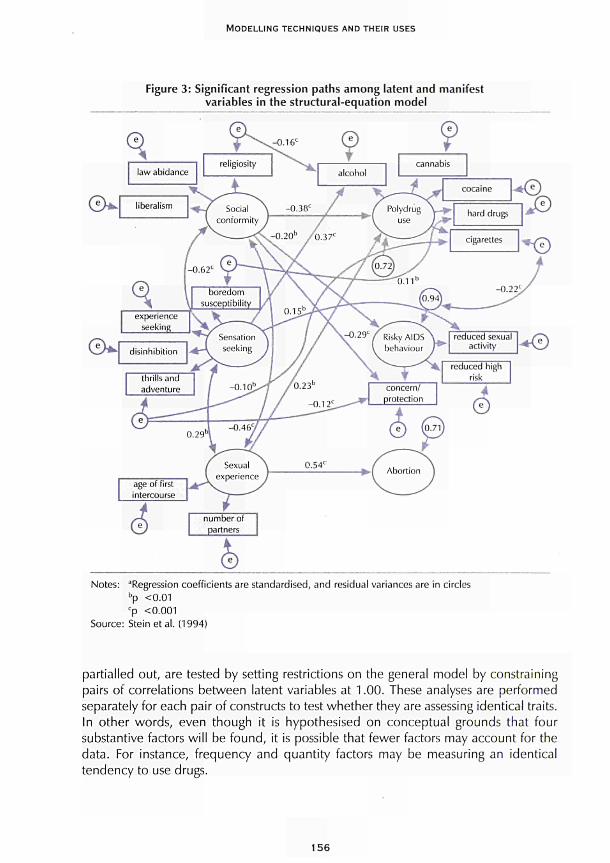
MODELLING TECHNIQUES AND THEIR USES
Figure 3: Significant regression paths among latent and manifest variables in the structural-equation model
► I Abortion 1
Notes: ^Regression coefficients are standardised, and residual variances are in circles bp <0.01 cp <0.001
Source: Steinetal. (1994)
partialled out, are tested by setting restrictions on the general model by constraining pairs of correlations between latent variables at 1.00. These analyses are performed separately for each pair of constructs to test whether they are assessing identical traits. In other words, even though it is hypothesised on conceptual grounds that four substantive factors will be found, it is possible that fewer factors may account for the data. For instance, frequency and quantity factors may be measuring an identical tendency to use drugs.
156
CHAPTER 9
The goodness-of-fit of the models is assessed in two ways: through use of a chi-square test of the overall fit of the model; and through use of the Bentler-Bonett normed fit index (NFI) statistic, which takes sample size into account. Acceptable values of the NFI should equal at least 0.90 (Bentler and Bonett, 1980).
Second-order factors are also tested. A second-order factor is a latent variable that is assumed to reflect an underlying relation or commonality among the primary latent variables. In particular, it is of interest to determine if the frequency and quantity latent variables may themselves result from a general drug-use second-order factor. Furthermore, another second-order general factor of drug-use and abuse is hypothesised and tested to account for all four of the substantive latent variables. If such a general, second-order factor were supported by the data, this would indicate that all types of drug-using behaviours, as well as negative consequences of drug-use, are generated by a pervasive disposition for drug involvement spanning both use and abuse.
After completion of the preliminary assessments of the factor structure, regression effects among the latent variables are examined. In particular, drug-use frequency and drug-use quantity are used to predict disruptive drug use and subjective problem drug use in order to assess the relative contribution of each predictor variable to these negative or adverse outcomes. These relations represent one of the main focal points of interest in the study because they represent associations among general drug factors after the influence of using specific drugs has been controlled. Finally, a model is tested that includes the negative drug consequences latent variable as part of the confirmatory-factor analysis. Then the negative drug consequences latent variable are included as a consequent variable in the regression model.
Specific problems arising from drug use are reflected in actual adverse consequences reported by the subjects. These variables include car accidents while under the influence of alcohol or other drugs, arrests or convictions for driving while intoxicated from alcohol or other drugs, and drug-law violations for selling or possessing drugs. The prediction of these specific drug-related behaviours is then based on the substantive latent variables identified in previous analyses. These problem variables are not included in the original multi-trait multi-method assessment because they do not relate specifically to separate drugs.
Both normal-theory maximum-likelihood (ML) and arbitrary-distribution theory (asymptotically distribution free; Browne, 1984) generalised least-squares (AGLS) estimation methods were used to estimate preliminary solutions for the model. Because many of the variables were non-normally distributed (normalised multivariate kurtosis estimate for the 13 variables = 319.75), the linearised AGLS (Bentler, 1983; Bentler and Dijkstra, 1985) solution was used in all subsequent analyses.
Results supported the construct validity of the hypothesised latent factors. Although highly correlated, drug-use frequency and drug-use quantity were not interchangeable: quantity was a more powerful predictor of disruptive and problem drug use. A second-order factor of general drug use and abuse accounted for these first-order constructs.
157
MODELLING TECHNIQUES A N D THEIR USES
LISREL example
In contrast to an EQS model, a linear structural-relations (LISREL) model defines a set of latent response variables. These latent response variables depend on a set of latent explanatory variables. The relationship between the latent response and explanatory variables is defined in what is known as the structural model. The latent explanatory variables cannot be observed directly. However, some manifest response variables and manifest explanatory variables are observed. These are linked to the latent variables, both response and explanatory, through what is known as the measurement model. The specification of both the structural and measurement models is left to the user, and care must be taken to define an overall model which is both plausible and calculable. This approach formally develops a model in which the measurement model is separate from the structural relations between the constructs or latent variables.
Specifically using the idea that latent variables could be used generally for all constructs required by the models, Frischer et al. (1991 ) used two indicator, or manifest, variables for each of the latent variables of interest. Frischer et al. (1991 ) used data obtained as part of a cross-national study sponsored by the World Health Organisation, and a representative sample of current Glasgow IDUs were recruited from 'in-treatment' and 'out-of-treatment' sites. For the purposes of this study, in-treatment sites were defined as agencies whose principal aim is to modify drug-taking behaviour. A total of 536 IDUs were eligible for participation in the study. The LISREL programme was used to construct measurement and structural models relating to injecting drug use (Joreskog and Sorbom, 1989).
Subjects were included in the Frischer et al. (1991 ) analysis who had injected drugs In the two months prior to interview and had not already been interviewed for the study in the current calendar year. In addition, those recruited from in-treatment sites were only eligible if their current episode of treatment had begun within the previous four weeks. Each participant joining the study was told the name of the interviewer and the purpose of the study - t o improve understanding of the drug-taking and sexual behaviour of IDUs in relation to their HIV seroprevalence. They were informed of the confidentiality of information to be obtained and the voluntary nature of the study. One hundred and seventy IDUs were recruited to the 'in-treatment' subset from 13 different agencies which together represent most of the drug-treatment capacity in Glasgow. The remaining 333 IDUs were recruited from 12 'out-of-treatment' settings, selected both to provide geographic spread and to maximise the likelihood that a proportion of the sub-set would include drug injectors who had no contact with drug-user treatment or harm-reduction agencies. The majority of respondents (84 %, N = 423) had injected in all of the six months prior to interview. The mean age of first drug use (by injection) was 17.3 years, and the mean length of drug-use injection was 6.8 years. The three drugs most commonly injected by respondents were buprenorphine, heroin and temazepam. Sample characteristics used as control variables in the analysis are described in the section on the measurement model below and shown in Table 1.
For the measurement model, ten features of injecting drug use were identified as being the most frequent topics of research (see Table 1 ) from a literature search which focused on injecting drug use and HIV-related risk practices. The measurement component of a SEM model consists of a number of underlying or latent variables that account for the
158
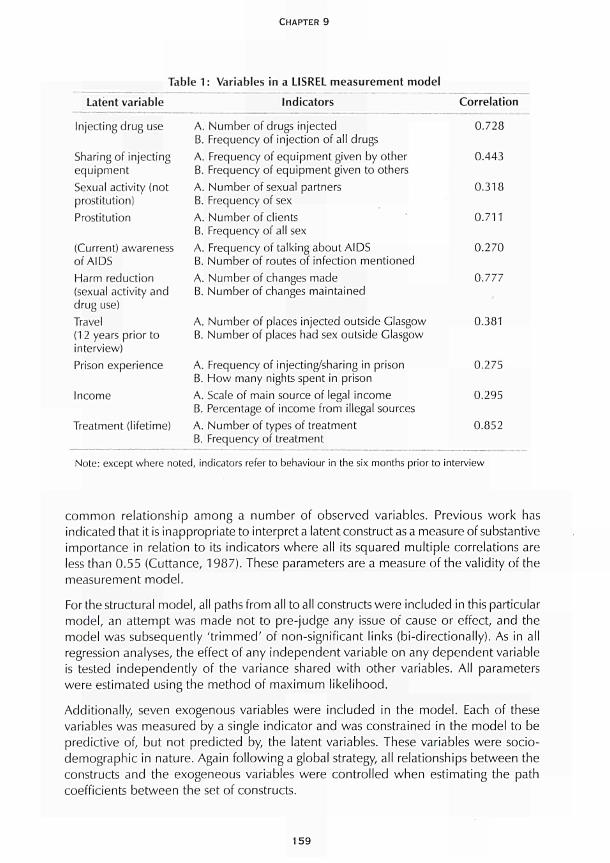
Latent variable
CHAPTER 9
Table 1: Variables in a LISREL measurement model
Indicators Correlation
Injecting drug use
Sharing of injecting equipment Sexual activity (not prostitution) Prostitution
(Current) awareness of AIDS Harm reduction (sexual activity and drug use) Travel (12 years prior to interview)
Prison experience
Income
Treatment (lifetime)
A. Number of drugs injected B. Frequency of injection of all drugs A. Frequency of equipment given by other B. Frequency of equipment given to others A. Number of sexual partners B. Frequency of sex A. Number of clients B. Frequency of all sex A. Frequency of talking about AIDS B. Number of routes of infection mentioned A. Number of changes made B. Number of changes maintained
A. Number of places injected outside Glasgow B. Number of places had sex outside Glasgow
A. Frequency of injecting/sharing in prison B. How many nights spent in prison A. Scale of main source of legal income B. Percentage of income from illegal sources A. Number of types of treatment B. Frequency of treatment
0.728
0.443
0.318
0.711
0.270
0.777
0.381
0.275
0.295
0.852
Note: except where noted, indicators refer to behaviour in the six months prior to interview
c o m m o n relat ionship among a number of observed variables. Previous work has indicated that it is inappropriate to interpret a latent construct as a measure of substantive importance in relation to its indicators where all its squared mult iple correlations are less than 0.55 (Cuttance, 1987). These parameters are a measure of the validity of the measurement model .
For the structural model , all paths from all to all constructs were included in this particular model , an at tempt was made not to pre-judge any issue of cause or effect, and the model was subsequently ' t r immed ' of non-significant links (bi-directionally). As in all regression analyses, the effect of any independent variable on any dependent variable is tested independent ly of the variance shared wi th other variables. All parameters were estimated using the method of max imum l ikel ihood.
Addit ionally, seven exogenous variables were included in the model . Each of these variables was measured by a single indicator and was constrained in the model to be predictive of, but not predicted by, the latent variables. These variables were socio-demographic in nature. Again fo l lowing a global strategy, all relationships between the constructs and the exogeneous variables were control led when estimating the path coefficients between the set of constructs.
159
MODELLING TECHNIQUES AND THEIR USES
Conclusions
The structural-equation-model procedures when brought to bear on very complex behaviours such as drug-addiction prevalence, intensity and problems can afford a richness of models to supply answers that are over-powering. The multiplicity of causal link paths between constructs that can only be loosely related to their manifest indicator measures, coupled with the ability to allow for measurement models that have correlated error variables, can generate models that are far from parsimonious (see e.g. Figure 2 from Stein et al., 1994). Such models tackle a particularly complex set of interrelationships. It is not clear that such extensive modelling actually clarifies the relationships between the observed phenomena.
Frischer et al. (1991) report on a study that carries the idea of estimating structural paths to a logical conclusion, implying that any regression-analysis model could be in fact replaced by a path analysis between latent variables within a structural-equation model. A study that assesses relationships using several regression models (as did the original path models) could take advantage of the larger structural-equation model by incorporating all such analyses, if using a common or overlapping set of variables, into a single model.
Stein et al. (1988) report a study that uses structural-equation modelling extensively, with the frequency/quantity issue as central. The study was designed to ascertain whether measures of frequency and quantity are essentially interchangeable as predictors of problem or disruptive use of drugs in an older sample. They further examined the interrelations among different ways to assess drug use, self-reported problems with use, and specific negative outcomes resulting from drug use.
An explicit measurement model was developed by Person et al. (1977) in which it was hypothesised that each indicator, regardless of the method of measurement, was a monotone function of heroin abuse and an error term unique to the indicator. Tests of the measurement model, which derive from non-metric confirmatory-factor analysis, using non-metric statistics (McDonald, 1967) revealed an adequate fit of the model to data collected at four different time periods.
Subsequently, Woodward (1978) applied linear structural-equation models to test statistically a variety of measurement models of heroin-abuse indicators drawn from medical treatment and law-enforcement domains, addressing a variety of reliability/ validity issues. Within a given quarter of the year, two alternative measurement models were contrasted. The first model allowed for factors defined by variables having a common method of measurement, and the second model postulated a single heroin-abuse construct underlying all indicators. The single-construct model could be accepted as plausible while the method-factor model could not.
While these early studies of the reliability and validity of indicator-based estimates of heroin abuse are important, they can be considered as only an initial step in the right direction. Because indirect methods such as factor analysis involve so many untenable assumptions, inaccuracies and influences beyond the control of the researcher, their practical utility remains constantly in doubt. In theory, the factor-analytic method works
160
CHAPTER 9
well (for a simulation, see Person et al., 1976), but application to SMSA aggregate data remains a problem because of potent ial ly shift ing report ing bases under ly ing the indicators, d ist r ibut ional problems of the data, and other pract ical v iolat ions of assumptions. The same, however, can be conc luded of the other major indirect estimation procedure, the capture-recapture method.
In conclusion, SEM models have been used successfully and have great potential to be used again in helping researchers to understand the complex relationships between various factors and in understanding how underlying theoretical concepts can be fitted into models of drug prevalence. As such, these methods are excellent tools for model generation and for stimulating discussion. That said, care should be taken not to take the results of such models too literally: these methods should always be viewed as powerful explorative tools.
References
Bentler, R M. (1990). 'Comparative fit indexes in structural models'. Psychological Bulletin 107: 238-46.
Bentler, R M. (1986). Theory and implementation of EOS: a structural equations program. Los Angeles, CA: BMDP Statistical Software.
Bentler, R M. (1983). 'Some contributions to efficient statistics in structural models: specification and estimation of moment structures'. Psychometrika 48: 493-51 7.
Bentler, R M., Bonett, D. G. (1980). 'Significance tests and goodness of fit in the analysis of covariance structures'. Psychological Bulletin 88: 588-606.
Bentler, R M., Dijkstra, T. (1985). 'Efficient estimation via linearization in structural models', in Krishnaiah, R R. (ed.) Multivariate analysis- VI. Amsterdam: Elsevier Science.
Browne, M. W. (1984). 'Asymptotically distribution-free methods for the analysis of covariance structures'. British Journal of Mathematical and Statistical Psychology 37: 62-83.
Campbell, D. I., Fiske, D. W. (1959). 'Convergent and discriminant validation by a multitrait-multimethod matrix'. Psychological Bulletin 56: 81-105.
Clayton, R. R., Ritter, C. (1985). 'The epidemiology of alcohol and drug abuse among adolescents'. Advances in Alcohol and Substance Abuse 4: 69-97.
Cuttance, R (1987). 'Issues and problems in the application of structural equation models', in Cuttance, R, Ecob, R. (eds) Structural modelling by example: applications of educational, sociological and behavioural research. Cambridge: Cambridge University Press.
Demaree, R. G., Simpson, D. D., Joe, G. W (1978). 'Recidivism and indices of drug abuse treatment effectiveness'. Drug Alcohol Dependency 3: 221-2.
Fitzgerald, J. L., Mulford, H. A. (1984). 'Factors related to problem-drinking rates'. Journal of Studies in Alcohol 45: 424-32.
French, J. F. (1977). 'Prevalence of heroin use in New Jersey'. Unpublished report of the Department of Health, Alcohol, Narcotic and Drug Abuse Unit, State of New Jersey.
161
MODELLING TECHNIQUES AND THEIR USES
Frisher, M., Bloor, M., Finlay, Α., Goldberg, D., Green, S., Haw, S., McKeganey, N., Piatt, S. (1991). 'A new method of estimating prevalence of injecting drug use in an urban population: results from a Scottish city'. International Journal of Epidemiology 20: 997-1000.
Greenwood, J. Α., Crider, R. (1978). Estimated number of heroin addicts in 1977. Rockville, MD: National Institute on Drug Abuse.
Harvey, R. J., Billings, R. S., Nilan, K. (1985). 'Confirmatory factor analysis of the Job Diagnostic Survey: good news and bad news'. Journal of Applied Psychology 70: 461-8.
Huba, G. J., Newcomb, M. D., Bentler, R M., Pandina, R. J. (1982). 'Comparison of adolescent drug use causal models controlling for response factors'. Paper presented at the meeting of the Western Psychological Association, Sacramento, CA, April.
Joreskog, K. G. (1971). 'Statistical analysis of congeneric tests'. Pyschometrika 36: 109-33.
Joreskog, K. G., Sorbom, D. (1989). LISREL 7 users' reference guide. Mahwah, NJ: Lawrence Erlbaum Associates Inc. in association with Scientific Software Inc.
Makela, L., Simpura, J. (1985). 'Experiences related to drinking as a function of annual alcohol intake by sex and age'. Drug and Alcohol Dependence 15: 389-404.
McDonald, R. (1967). Nonlinear factor analysis. Psychometrika Monograph 15. Chicago, IL: University of Chicago Press.
Minichiello, L. (1974). Indicators of intravenous drug use in the United States 1966-1973. Rockville, MD: National Institute on Drug Abuse.
Newcomb, M. D., Bentler, R M. (1986a). 'Cocaine use among adolescents: longitudinal associations with social context, psychopathology, and use of other substances'. Addictive Behaviors 11 : 263-73.
Newcomb, M. D., Bentler, R M. (1986b). 'Cocaine use among young adults'. Advances in Alcohol and Substance Abuse 6: 73-96.
Person, R, Retka, R. L., Woodward, J. A. (1977). A method of estimating heroin use prevalence. Rockville, MD: National Institute on Drug Abuse.
Person, R, Retka, R. L., Woodward, J. A. (1976). Toward a heroin problem index - an analytic model for drug abuse indicators. Rockville, MD: National Instituteon Drug Abuse.
Riley, W J., Wagenfeld, M. O., Sonnad, S. (1981). 'Triangulated investigating: an approach to the estimating of the extent of heroin use'. Addiction 16: 97-108.
Sadava, S. W (1985). 'Problem behaviour theory and consumption and consequences of alcohol use'. Journal of Studies on Alcohol 46: 392-7.
Sadava, S. W , Secord, M. J. (1984). 'Problem drinking in context'. Paper presented at the International Congress of Psychology, Acapulco, Mexico.
Schlenger, W. E., Greenberg, S. W. (1978). Analysis of intermediate correlates of heroin usage. Rockville, MD: National Instituteon Drug Abuse.
Schmitt, N., Stults, D. M. (1986). 'Methodology review: analysis of multi-trait multi-method matrices', Applied Psychological Measurement 10: 1-22.
Stacy, A. W , Widaman, I. F, Hays, R., DiMatteo, M. R. (1985). 'Validity of self-reports of alcohol and other drug use: a multi-trait multi-method assessment'. Journal of Personality and Social Psychology 49: 219-32.
162
CHAPTER 9
Stein, J. Α., Newcomb, M. D., Bentler, R M. (1994). Psychosocial correlates and predictors of AIDS risk behaviour, abortion, and drug use among a community sample of young adult women'. Health Psychology 13: 308-18.
Stein, J. Α., Newcomb, M. D., Bentler, R M. (1988). 'The relationship of gender, social conformity, and substance use: a longitudinal study'. Bulletin of the Society of Psychologists in Addictive Behaviours 5: 125-38.
Stein, J. Α., Newcomb, M. D., Bentler, R M. (1987). 'An 8-year study of multiple influences on drug use and drug use consequences'. Journal of Personality and Social Psychology 53: 1094-105.
Stoloff, R, Levine, D. Β., Spruill, Ν. (1975). Public drug treatment and addict crime. San Francisco, CA: Public Research Institute.
Woodward, J. A. (1978). 'Structural equation models of drug abuse indicators'. Paper presented at the National Drug Abuse Conference, Seattle, WA, April.
Woodward, J. Α., Retka, R. L., Ng, L. (1984). 'Construct validity of heroin abuse estimators'. International Journal of the Addictions 19: 93-117.
163

MODELLING THE HEALTH CONSEQUENCES OF
DRUG USE

INTRODUCTION
T his part concentrates on modelling adverse health consequences of problem drug use, possibly the main reason for policy and intervention in the field of drug use. One of the most important health consequences of illicit drug use is infectious
diseases such as AIDS. At the same time the field of infectious-diseases epidemiology is one of the public-health areas that may have benefited most from modelling studies and may therefore serve as an example for approaches that could be applied to the drugs field.
In Chapter 10, Kretzschmar follows a different approach from the chapters in Part III In starting from an explicit problem to be solved rather than from the methods to be used. She discusses the main disease-specific parameters that have been much used in models of the sexual transmission of HIV, but less so in models of injecting drug use or other drug-related infections. Kretzschmar defines dynamic models and introduces the concepts of a core group and a mixing matrix before considering the influence of partnership duration in pair-formation models and network models, where each individual and each contact between two individuals are modelled explicitly. The author argues that these models can easily be adjusted for hepatitis Β and C. Techniques discussed in the chapter could be used to answer questions such as how well the future course of these drug-related disease epidemics can be predicted, what the effects of behaviour change would be on these diseases, and what prevention strategies are to be recommended.
Jager and his colleagues give a structured overview of developing multinational scenario analyses in Chapter 11. The authors argue that the drug problem is well suited to this form of analysis as the issue is serious and important, complex, multinational, multi-disciplinary and in need of information to inform policy decisions. The main elements of a scenario study are the development of a conceptual model, the translation into mathematical models, the performance of a basic analysis and the construction of scenarios. A preliminary conceptual model for the drugs field is presented, besides examples of conceptual models for AIDS and blood supply that have already been applied at EU level.
167

CHAPTER 10
MODELLING INFECTIOUS DISEASES AND OTHER HEALTH CONSEQUENCES: PREDICTING FUTURE MORBIDITY CONSEQUENCES AND SPREAD OF HIV, H E P A T I T I S Β A N D H E P A T I T I S C
Mirjam Kretzschmar
A very high prevalence of HIV, hepatitis Β virus (HBV) and hepatitis C virus (HCV) is found in populations of injecting drug users (IDUs) due to a combination of high-risk behaviour and high transmission rates via sharing of contaminated injection equipment. In many European countries, HIV incidence among IDUs is alarmingly high and prevalence is rising explosively. In southern European countries, the largest fraction of new HIV infections is among IDUs. While the incidence among homosexual men has stabilised and prevalence seems no longer to be rising, among IDUs prevalence is still increasing. For HBV and HCV prevalence is even higher. Although hepatitis may not be as serious an illness as AIDS, it can nevertheless lead to major health problems and in a small fraction of cases can lead to liver cancer. A sustained prevalence of carriers of the hepatitis virus also constitutes a source of infection for the entire population. These infectious diseases are therefore important consequences of drug misuse.
Mathematical models are used to attempt to understand the quantitative relationships between the characteristics of a specific disease, the contact patterns in the population within which it is transmitted, and the resulting incidence and prevalence of the disease. These insights can then be used to support the interpretation of epidemiological data, help decide which data are needed to be able to assess an epidemiological situation, and help design effective prevention measures. To extend disease modelling in this way requires further steps and information. This could, for example, include costs of prevention programmes, or the quality of life for given levels of prevalence and incidence over a certain time period. It is clear that the time scale in which the spread of the epidemic takes place, and the time scale in which prevention programmes are designed, play an important role in the outcome of the evaluation of prevention programmes.
The disease-specific parameters of importance for modelling are, among others, the probability of transmission per contact, where a contact is defined as an event in which transmission can possibly take place; the duration of the latent period and the infectious period; the fraction of infections that are asymptomatic, but are infectious to others; the recovery rate. Which of these parameters are incorporated into the model depends
169
MODELLING THE HEALTH CONSEQUENCES OF DRUG USE
on the characteristics of the disease being modelled and on the level of detail that is needed to properly describe transmission and the required outcome variables. For example, in modelling the spread of HIV it might be useful to take a number of stages of infection into account distinguished by their CD4 + counts, even if these stages do not play distinct roles in the transmission process. Concerning the contact patterns that underlie transmission, these are obviously determined by the transmission route of the disease in question. For a sexually transmitted disease it matters whether spread is to be modelled by homosexual or heterosexual contact; furthermore, the number of sexual partners per time unit (e.g. year), the duration of the sexual partnerships, the overlap in time of partnerships or 'concurrency', and the heterogeneity with respect to these variables in the population are determinants of the contact patterns. Similarly, for IDUs the contact structure is constituted by the social contacts of drug users within which injecting equipment is shared, such as anonymous contacts in shooting galleries, or longer-lasting relationships with friends and sexual partners. In this case, the existence of two different transmission routes for the infection, namely the needle-sharing and the sexual routes, makes the contact patterns even more complex.
The aim of this chapter is to give an overview of the work that has been done in the area of infectious-disease modelling, and more specifically in modelling the spread of HIV via sexual contact and needle sharing. The relevant questions and approaches are identified and the implications for future work to investigate the spread of HIV, HBV and HCV in populations of IDUs are summarised. Finally, the findings are evaluated in the light of questions posed at EU level in the context of this monograph. The focus is on so-called dynamic models, that is, models that explicitly describe the transmission process and the resulting dynamics of the spread of an infection, as opposed to statistical models, such as the back-calculation method, that are used for data-based projections. For an application of the latter methodology to data from the European Union, see Downs et al. (1997) and for a fuller description of this method, see Chapter 6.
Models for HIV, HBV and HCV
Since the beginning of the AIDS pandemic in the early 1980s, an enormous effort has been made in devising mathematical models to predict the further spread of HIV. Rather than attempting to give a complete overview of the existing models, this chapter focuses on the relevant modelling questions that have been discussed and that are essential not only for HIV, but for any infectious disease that spreads via sexual contact or via shared injecting equipment. It should be said that the large majority of all models investigated so far have focused on the former transmission route, and many of these have dealt specifically with the transmission group of homosexual men. Only very few models have addressed questions pertaining to transmission via needle sharing. These models will be discussed in the following section. For the spread of HBV and HCV, to the author's knowledge only very few models exist and will be mentioned briefly at the end of this section.
Even before AIDS had become the dominant problem in the area of sexually transmitted diseases (STDs) it was recognised that the heterogeneity in sexual behaviour of a
170
CHAPTER 10
population plays an important role in determining the patterns of spread of an STD. In modelling prevention strategies for gonorrhea, Hethcote and Yorke (1984) introduced the concept of a 'core group', a small sub-group of the population engaging in very high levels of sexual activity, in other words, a high rate of partner change. With the advent of AIDS, attention to the incorporation of a detailed description of sexual behaviour increased greatly, and a number of modelling approaches developed. The basic idea was to distinguish different activity levels in the population and to define a 'mixing matrix' describing the contact rates within and among sub-groups of different sexual activity (see e.g. Anderson and May, 1991; Blythe and Castillo-Chavez, 1989; Jacquez et al., 1989). It was then possible to investigate how mixing between subgroups determines the epidemic spread, and how prevention focused on specific subgroups affects incidence and prevalence. However, it turned out to be very difficult to collect reliable data with which to estimate the parameters of the mixing matrix.
A different approach in modelling focused on the influence of partnership duration on the epidemic spread. In the above-mentioned mixing models, it is implicitly assumed that every contact is with a new individual and there are no longer-lasting partnerships. In contrast, in the so-called 'pair-formation models', first introduced in the context of STDs by Dietz and Hadeler (1988), the formation and separation of possibly long-lasting partnerships between pairs of individuals is explicitly taken into account. Especially for the spread of STDs in heterosexual populations, partnership duration cannot be neglected as a determining parameter. Although conceptually pair-formation models are very appealing, they have the disadvantage that including more structure into the model, such as sub-groups with different levels of sexual activity or the possibility to have more than one partnership at a time, rapidly increases the complexity of the model.
A further step towards a detailed description of sexual behaviour is made by 'network models' (Kretzschmar et al., 1994). These are models that try to capture the essential features of sexual networks by describing the population explicitly as a collection of individuals and their relationships. In contrast to the types of models discussed above, which are implemented as systems of differential equations, network models are inherently stochastic and require simulation by Monte Carlo methods for obtaining results. In other words, except in very simple cases, it is not possible to derive analytic 'parameter-value-independent' results, but it is necessary to run and analyse large numbers of simulations and to apply statistical techniques as if analysing real data. The advantage of this procedure is that the simulations are easily comparable with epidemiological data and data obtained by sexual-behaviour surveys. It has been shown (Morris and Kretzschmar, 1997) that a description of sexual partnerships in terms of numbers per year and duration is not sufficient to predict the spread of an STD, but also that the possible overlap and therefore concurrency has a large effect on the speed and size of an epidemic. Simultaneous, longer-lasting partnerships cannot be modelled with mixing models and only in a very limited degree with pair-formation models; they arise naturally, however, in network models.
Although these modelling approaches were developed with the aim of describing the sexual-contact structure in a population, it is obvious that the same questions will play
171
MODELLING THE HEALTH CONSEQUENCES OF DRUG USE
a role when describing the transmission of a disease via sharing injection equipment. In
that case an important determinant of the spread of an infectious disease is the
heterogeneity in behaviour, that is, the possible existence of subgroups of the population
with highrisk behaviour and their mixing patterns with the rest of the population with
lowerrisk behaviour. It is important to consider whether the sharing of needles takes
place within longlasting relationships, that is, with friends or sexual partners, or whether
it takes place more or less randomly as is the case in shooting galleries. If longerlasting
relationships are the basis for risk behaviour and disease transmission, the question will
be how best to describe the networks these contacts constitute. In short, modelling
techniques that have been developed to describe the spread of an infection via sexual
contacts, can with the proper adjustments be used for modelling transmission via
needle sharing. Of course there are additional factors to be considered that will be
discussed in the following section.
To describe a specific disease in terms of model variables and parameters the relevant
disease stages, their duration and the transmission probabilities related to those stages
must be specified. With respect to HIV/AIDS the discussion has focused on its long
incubation period and the varying ¡nfectivity during that period. Using statistical models,
Longini et al. (1989a), Longini et al. (1996) and Hendriks et al. (1998) have estimated
the time from infection to development of AIDS for homosexual men and IDUs,
respectively. For the transmission of the infection and therefore its epidemiology, the
probability of transmission per contact in the various stages of infection is important. As
Longini et al. (1989b) and Jacquez et al. (1994) have argued convincingly, data and
modelling results support the idea that ¡nfectivity is very high in the first acute phase of
infection, very low during the long asymptomatic phase, and higher again when the
first symptoms of AIDS become manifest. Blythe and Anderson (1988) have investigated
how variable ¡nfectivity affects the spread of the epidemic in a mixing model; Kretzschmar
and Dietz (1998) have investigated the effects of variable ¡nfectivity in models with
longlasting partnerships.
Although the prevalence of hepatitis Β and C is extremely high in some risk groups,
there has been surprisingly little work done on modelling the spread of those diseases.
The only work to the author's knowledge is by McLean and Blumberg (1994) and by
Williams et al. (1996a, 1996b). Both models are mixing models, as described above,
and incorporate features specific to hepatitis B, such as the existence of an asymptomatic
carrier stage. While the former focuses on modelling countries with high transmission
rates, the latter investigates the cost effectiveness of immunisation programmes against
hepatitis Β in the UK. Furthermore, the latter model makes a distinction between
transmission in the heterosexual and the homosexual populations, respectively,
characterised by different values of the parameters describing sexual activity. The
vaccination strategies discussed are antenatal screening, mass infant and adolescent
vaccination programmes with different coverages, and vaccination targeted at genito
urinary (GU) clinic attenders with various coverages.
172
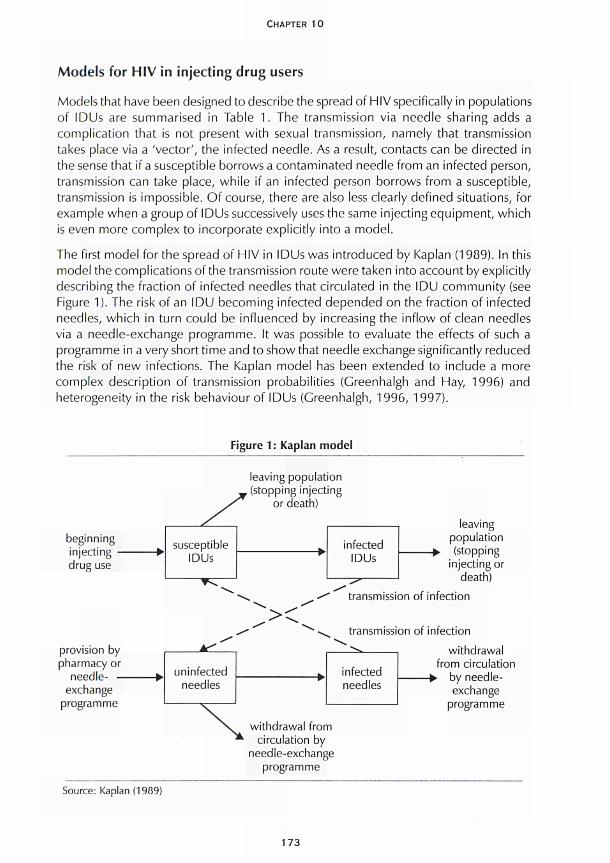
CHAPTER 10
Models for HIV in injecting drug users
Models that have been designed to describe the spread of HIV specifically in populations of IDUs are summarised in Table 1. The transmission via needle sharing adds a complication that is not present with sexual transmission, namely that transmission takes place via a 'vector', the infected needle. As a result, contacts can be directed in the sense that if a susceptible borrows a contaminated needle from an infected person, transmission can take place, while if an infected person borrows from a susceptible, transmission is impossible. Of course, there are also less clearly defined situations, for example when a group of IDUs successively uses the same injecting equipment, which is even more complex to incorporate explicitly into a model.
The first model for the spread of HIV in IDUs was introduced by Kaplan (1989). In this model the complications of the transmission route were taken into account by explicitly describing the fraction of infected needles that circulated in the IDU community (see Figure 1). The risk of an IDU becoming infected depended on the fraction of infected needles, which in turn could be influenced by increasing the inflow of clean needles via a needle-exchange programme. It was possible to evaluate the effects of such a programme in a very short time and to show that needle exchange significantly reduced the risk of new infections. The Kaplan model has been extended to include a more complex description of transmission probabilities (Greenhalgh and Hay, 1996) and heterogeneity in the risk behaviour of IDUs (Greenhalgh, 1996, 1997).
Figure 1 : Kaplan model
leaving population , (stopping injecting
or death)
beginning injecting drug use
provision by pharmacy or
needle- -exchange
programme
leaving population (stopping
injecting or death)
transmission of infection
transmission of infection
uninfected needles
infected needles
withdrawal from circulation
-► by needle-exchange
programme
withdrawal from circulation by
needle-exchange programme
Source: Kaplan (1989)
173
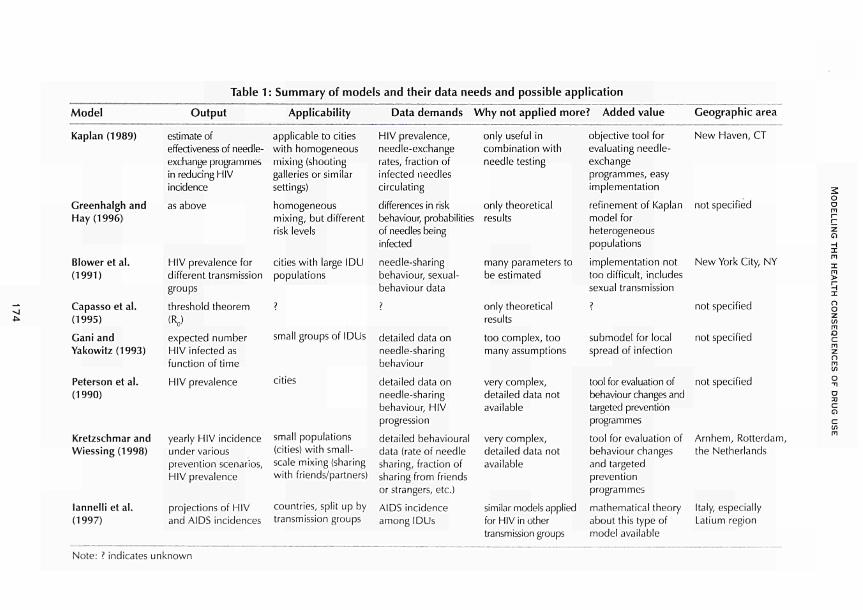
Table 1 : Summary of models and their data needs and possible application
Model
Kaplan (1989)
Greenhalgh and
Hay (1996)
Blower et al.
(1991)
Capasse et al.
(1995)
Gani and
Yakowitz(1993)
Peterson et al.
(1990)
Kretzschmar and
Wiessing (1998)
lannelli et al.
(1997)
Output
estimate of
effectiveness of needle
exchange programmes
in reducing HIV
incidence
as above
HIV prevalence for
different transmission
groups
threshold theorem
(R0)
expected number
HIV infected as
function of time
HIV prevalence
yearly HIV incidence
under various
prevention scenarios,
HIV prevalence
projections of HIV
and AIDS incidences
Applicability
applicable to cities
with homogeneous
mixing (shooting
galleries or similar
settings)
homogeneous
mixing, but different
risk levels
cities with large IDU
populations
?
small groups of IDUs
cities
small populations
(cities) with small
scale mixing (sharing
with friends/partners)
countries, split up by
transmission groups
Data demands
HIV prevalence,
needleexchange
rates, fraction of
infected needles
circulating
differences in risk
behaviour, probabilities
of needles being
infected
needlesharing
behaviour, sexual
behaviour data
?
detailed data on
needlesharing
behaviour
detailed data on
needlesharing
behaviour, HIV
progression
detailed behavioural
data (rate of needle
sharing, fraction of
sharing from friends
or strangers, etc.)
AIDS incidence
among IDUs
Why not applied more? Added value
only useful in
combination with
needle testing
only theoretical
results
many parameters to
be estimated
only theoretical
results
too complex, too
many assumptions
very complex,
detailed data not
available
very complex,
detailed data not
available
similar models applied
for HIV in other
transmission groups
objective tool for
evaluating needle
exchange
programmes, easy
implementation
refinement of Kaplan
model for
heterogeneous
populations
implementation not
too difficult, includes
sexual transmission
?
submodel for local
spread of infection
tool for evaluation of
behaviour changes and
targeted prevention
programmes
tool for evaluation of
behaviour changes
and targeted
prevention
programmes
mathematical theory
about this type of
model available
Geographic area
New Haven, CT
not specified
New York City, NY
not specified
not specified
not specified
Arnhem, Rotterdam,
the Netherlands
Italy, especially
tatium region
2 o o m Γη
ζ Ο Η Ι
χ
ο ο ζ ín
Ο c ΓΠ ζ π m in
O
η
α c ο <= in
m
Note: ? indicates unknown
CHAPTER 10
Blower et al. (1991 ) designed a model to describe the situation of IDUs in New York City. The model incorporated transmission via needle sharing, via heterosexual contact and via vertical transmission from mother to unborn child. Furthermore, differences in risk levels were taken into account by distinguishing between IDUs who share needles with strangers and others who share with 'buddies'. The model consisted of a system of 34 ordinary differential equations with a large number of parameters. One of the results obtained was that the stabilisation of prevalence that had been observed in New York City could be explained as the natural course of the epidemic without any behaviour changes. Also, the stabilisation of prevalence in the model was only temporary and was followed by a renewed increase in prevalence that was driven by heterosexual transmission. An important conclusion is that the stabilisation of prevalence may not be interpreted as being the consequence of behaviour changes without having more information about population structure and mixing parameters (Blower, 1991 ). This information, however, is very difficult to collect and the uncertainty in these parameters leads to extremely wide confidence intervals in the predictions of future incidence and prevalence.
The existence of groups of IDUs which exhibit risk behaviour is included in a deterministic model by Capasso et al. (1995) and in a stochastic model by Gani and Yakowitz (1993) and Yakowitz (1994). While the description of the group-forming process in a deterministic setting is questionable, in the stochastic setting it quickly leads to a very complex model. Thus as yet there appear to be few epidemiologically relevant results and future research remains to be done.
Peterson et al. (1990) and Kretzschmar and Wiessing (1998) investigated stochastic, individual-based models in which the contact patterns of IDUs can be described in much detail. The model of Peterson et al. consists of three sub-models: one is a model of HIV progression in an infected individual that distinguishes five stages of infection; the second describes the heterogeneity of injecting drug use within the population, distinguishing monthly, weekly and daily injectors and drug users in jail or in treatment programmes; the third sub-model describes the contact patterns in the IDU community and distinguishes between the acquaintance network of an IDU, individual strangers and shooting galleries. Transition probabilities are then defined for the various states an individual can be in and Monte Carlo simulations are performed. The authors investigated the effect of the social-network structure on the epidemic and found a far slower increase in prevalence in populations where sharing took place in acquaintance networks as opposed to random mixing in shooting galleries. Again, the prediction for prevalence in all cases displayed a wide variability, here as a consequence of the stochastic nature of the processes. Finally, the authors showed that the effectiveness of intervention is highly dependent on the prevalence level of the population; in a low-prevalence setting prevention can potentially be much more effective because it begins before the start of the epidemic.
In Kretzschmar and Wiessing (1998) the effect of different prevention strategies on the incidence of HIV in IDU populations is compared. The model distinguishes between needle sharing within long-lasting relationships (friends/partners) and sharing with individual strangers (see Figure 2). Furthermore, it is assumed thatthe ¡nfectivity of an infected individual is very high during the first six weeks of infection and very low during the long asymptomatic
175
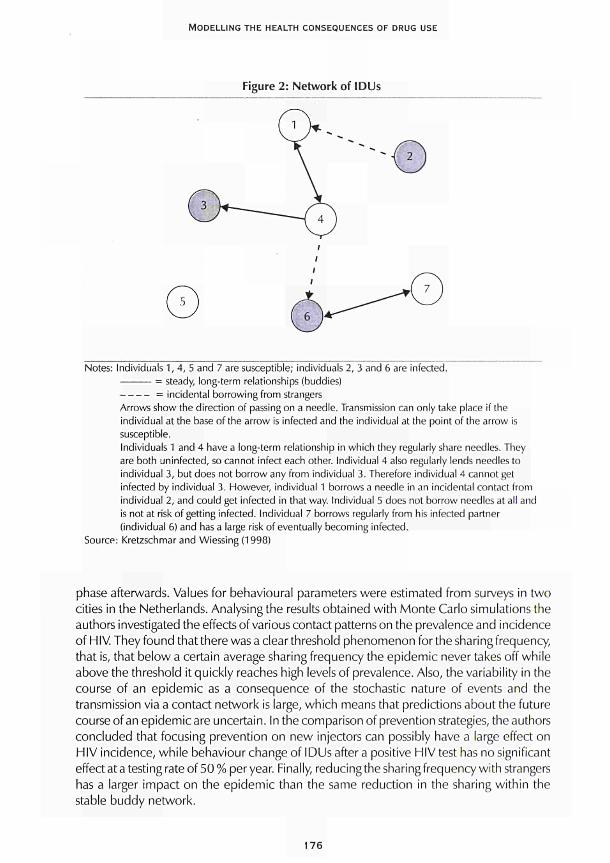
MODELLING THE HEALTH CONSEQUENCES OF DRUG USE
Figure 2: Network of IDUs
Notes: Individuals 1, 4, 5 and 7 are susceptible; individuals 2, 3 and 6 are infected. = steady, long-term relationships (buddies) = incidental borrowing from strangers
Arrows show the direction of passing on a needle. Transmission can only take place if the individual at the base of the arrow is infected and the individual at the point of the arrow is susceptible. Individuals 1 and 4 have a long-term relationship in which they regularly share needles. They are both uninfected, so cannot infect each other. Individual 4 also regularly lends needles to individual 3, but does not borrow any from individual 3. Therefore individual 4 cannot get infected by individual 3. However, individual 1 borrows a needle in an incidental contact from individual 2, and could get infected in that way. Individual 5 does not borrow needles at all and is not at risk of getting infected. Individual 7 borrows regularly from his infected partner (individual 6) and has a large risk of eventually becoming infected.
Source: Kretzschmar and Wiessing (1998)
phase afterwards. Values for behavioural parameters were estimated from surveys in two cities in the Netherlands. Analysing the results obtained with Monte Carlo simulations the authors investigated the effects of various contact patterns on the prevalence and incidence of HIV. They found that there was a clear threshold phenomenon for the sharing frequency, that is, that below a certain average sharing frequency the epidemic never takes off while above the threshold it quickly reaches high levels of prevalence. Also, the variability in the course of an epidemic as a consequence of the stochastic nature of events and the transmission via a contact network is large, which means that predictions about the future course of an epidemic are uncertain. In the comparison of prevention strategies, the authors concluded that focusing prevention on new injectors can possibly have a large effect on HIV incidence, while behaviour change of IDUs after a positive HIV test has no significant effect at a testing rate of 50 % per year. Finally, reducing the sharing frequency with strangers has a larger impact on the epidemic than the same reduction in the sharing within the stable buddy network.
176
CHAPTER 10
lannelli et al. (1997) examined several hypotheses about the dynamics of the HIV
epidemic among injecting drug users in Italy by fitting a model to the existing data and
using a leastsquares approach to determine the best fit. The model is a variant of the
classical susceptible, infected, removed (SIR) model, but includes variable ¡nfectivity
depending on the time since infection. The authors conclude that the fit of the model
to AIDSincidence data can be improved with respect to a simple reference model by
either assuming a reduction in risk behaviour over time, or assuming that there is a
small subgroup in the population with highrisk behaviour. Furthermore, the assumption
of constant ¡nfectivity turned out to be untenable, while variable ¡nfectivity seemed to
be in agreement with the data, thus confirming earlier empirical findings and theoretical
results.
Although none of the models discussed in this section is designed to describe the spread
of hepatitis Β and C, most models can be adjusted fairly easily to account for the
specific properties of those diseases.
Future role of modelling
Many problems remain to be solved in appropriately modelling the social structure
underlying the transmission of infectious diseases via needle sharing, and collecting data
that will provide more quantitative information about contact patterns and risk behaviour
is essential. In addition, little work has been done on analysing the interaction between
needlesharing networks and sexual networks. This section examines what is needed to
make modelling successful, and discusses some research topics in which modelling can
play a key role in investigating hypotheses and interpreting data.
A prerequisite in making any modelling effort successful will be the understanding of
the contact patterns of IDUs, of their essential featuresand how these are related to the
spread of an infectious disease. 'Contact pattern' here means a quantitative description
of behaviour that relates to possible transmission events. For the sharing of injection
equipment the following needs to be known: techniques of sharing such as borrowing
used syringes, backloading; with whom this behaviour takes place, whether steady
groups of IDUs, changing groups, steady sexual partners or strangers; how often risk
behaviour takes place, that is, borrowing rates per month; the typical 'life history'of an
IDU, in other words, how risk behaviour changes during an IDU's injecting career, how
long do IDUs on average stay in the population of drug users. An important aspect of all
these variables will be their heterogeneity: a population of IDUs is probably not
homogeneous in its behaviour, but will contain subgroups of individuals with very
different behaviour. For example, there is a small core group of IDUs with highrisk
behaviour including: high rates of injecting, high rates of sharing used equipment possibly
in settings that encourage sharing with strangers. Other IDUs, who restrict themselves
to sharing with their steady sexual partner, contribute much less to the spread of the
epidemic. Similar aspects are important for the sexual transmission route. While for
sexual behaviour large surveys have been conducted, the information about behavioural
aspects of sharing injection equipment is still scarce.
177
MODELLING THE HEALTH CONSEQUENCES OF DRUG USE
A task for the modeller is to identify those aspects of risk behaviour that can be quantified and that determine the epidemiology of the disease in question. The aim is therefore to find a (preferably small) number of aggregated variables that satisfactorily describe risk behaviour, that are possible to measure in the field and that are sufficient for explaining epidemiological phenomena or even predicting the qualitative and quantitative development of an epidemic, although the latter might only be a theoretical possibility. It immediately follows that this information can be used to design prevention programmes because knowledge of the risk factors that have the largest influence on, for example, the incidence of a disease indicates which prevention measures will have the largest effect on incidence.
Furthermore, modelling can be used to test hypotheses about the parameters describing the course of an infection. Comparable to the discussion about the variable ¡nfectivity in HIV-infected persons, there might be questions related to the natural course of a hepatitis infection which could be investigated in a model. Reliable epidemiological or microbiological data are then needed in order to compare the fit of model results under different hypotheses with the data and then decide on which hypothesis produces the best fit with observations.
A very interesting study will be the comparison of the way different infectious diseases spread in the same population. In a population of IDUs, in which needle sharing and sexual behaviour are the transmission routes, how on the basis of disease-specific parameter values an epidemic of HIV, HBV and HCV proceeds can be compared. What is the equilibrium prevalence and incidence for these diseases in the same population? What degree of co-morbidity can be expected? How do similarities and differences depend on the underlying contact parameters? If good information were available about the prevalence and/or incidence of these three diseases, could conclusions be drawn about the underlying levels of risk behaviour? It is expected that there will be differences in the effectiveness of a given prevention strategy as a consequence of differences in disease-specific parameters such as transmission rates and the resulting variations in prevalence.
It has been shown that HCV is transmitted mainly via needle sharing (or more generally blood-to-blood contact), while HBV spreads via sexual contact and via needle sharing (van Ameijden et al., 1993). A comparison of prevalence and incidence of these two viruses in a population of drug users can therefore give some information about the interaction of the two transmission networks. This in turn would be very valuable information for the design of prevention measures. A certain fraction of new infections could be attributed to the two transmission routes, possibly depending on the risk behaviour with respect to these transmission routes, and prevention could be focused on the dominating form of transmission. For example, how important are prostitutes who inject drugs as bridges between the IDU network and the core group with high sexual activity?
It is also possible to link the incidence of HBV and HCV to the prevalence of injecting drug use. If the fraction of infections due to transmission via needle sharing, the fraction of asymptomatically infected persons or chronic carriers, and the prevalence of HBV
178
CHAPTER IO
and HCV in IDU populations were known, then the number of IDUs in a country could be estimated. An assumption here would have to be that there was a stable endemic situation and that there was sufficient knowledge of the risk behaviour among IDUs to estimate the equilibrium prevalence.
In the context of a World Health Organisation (WHO) programme promoting vaccination against HBV infection, all countries are advised to vaccinate all newborns against hepatitis Β from the year 1997 on. As in many European countries, prevalence is very low and restricted mainly to some high-risk groups, the cost-effectiveness of such a vaccination programme is questionable (cf. Williams et al. 1996a, 1996b). However, vaccination focused on risk groups such as IDUs may be very effective in reducing incidence as well as the prevalence of chronic carriers. In view of the fact that a female IDU who is infected with HBV might pass the virus on via vertical transmission, screening of pregnant women within that risk group is especially important. However, it is known that IDUs are a group that is difficult to reach so the effectiveness of vaccination will be limited by its coverage. Modelling can help to quantify the dependence of cost-effectiveness measures on coverage and other parameters of a vaccination programme.
Conclusions
The use of specific models by an organisation such as the European Monitoring Centre for Drugs and Drug Addiction (EMCDDA) or in the context of a concerted action of the European Union depends very much on the types of questions being investigated and possibly answered. Types of questions could be: how well can the future course of the HIV epidemic be predicted in different Member States of the EU? What are the effects of behaviour change on the prevalence of HIV, HBV and HCV in different European countries? Which prevention strategies are recommended for a country given the dominant type of risk behaviour in that country? What conclusions can be drawn about the prevalence and incidence of injecting drug use from the prevalence of HIV, HBV and HCV in different European countries?
Predictions about the future course of the HIV epidemic among IDUs in Europe have been made via the back-calculation method (Downs et al., 1997). That method has some shortcomings, however, that makes its results unreliable. Predictions are made on the basis of AIDS incidence, and HIV incidence can be estimated using knowledge about the incubation time distribution. It is not possible to incorporate effects of behaviour change explicitly into the model. Also, as the effects of treatment on the incubation time are not known, the estimates will in the future become even more uncertain than they are now.
Dynamic models, which explicitly model the transmission process, can be used to evaluate the effects of behaviour change and other prevention measures. However, dynamic models require much more detailed data for describing the transmission process, mainly data about risk behaviour (Blower and Medley, 1992). A start at collecting such data at European level has been made by Papaevangelou and Richardson (1995) and Richardson et al. (1993). Using dynamic models it is often advisable to begin with a very simple structure even if many simplifying assumptions have to be made, because
179
MODELLING THE HEALTH CONSEQUENCES OF DRUG USE
the results will usually allow a clear interpretation. A very good example is the model by Kaplan and Heimer (1992), which consisted only of two differential equations and did not take any of the complications of the contact structure into account. Nevertheless, Kaplan demonstrated the positive effects of a needle-exchange programme on HIV incidence so clearly that the programme was continued and new needle-exchange programmes were established in different cities in the United States. A summary of the models discussed above, their data needs and possible applications is shown in Table 1, above.
If more detailed questions about the effects of behaviour changes are to be answered, more complex models are needed that allow the implementation of a relevant contact structure. In this respect, individual-based simulation models seem to be the best choice at present. However, if modelling is to be closely related to empirical findings it will be necessary to collect detailed behavioural data. It is very important that modellers and epidemiologists work together from the start to avoid large gaps between model design and data format.
In conclusion, regardless of the amount of work that has been done in modelling the spread of HIV/AIDS, modelling the spread of infectious diseases via needle sharing and the specific problems connected with the spread of hepatitis Β and C is still in its infancy. If models are to be used in an EU context, they should be developed according to the questions they are supposed to answer and in close interaction with social scientists and epidemiologists.
References
van Ameijden, E. C. J., van den Hoek, J. A. R., van den Mientjes, G. H. C, Coutinho, R. Α. (1993). 'A longitudinal study on the incidence and transmission patterns of HIV, HBV and HCV infection among drug users in Amsterdam'. European Journal of Epidemiology 9: 255-62.
Anderson, R. M., May, R. M. (1991). Infectious diseases of humans: dynamics and control. Oxford: Oxford University Press.
Blower, S. M. (1991). 'Behaviour change and stabilization of seroprevalence levels in communities of injecting drug users: correlation or causation?' Journal of AIDS 4: 920-4.
Blower, S. M., Medley, C. (1992). 'Epidemiology, HIV and drugs: mathematical models and data'. British Journal of Addiction 87: 371-9.
Blower, S. M., Hartel, D., Dowlatabadi, H., Anderson, R. M., May, R. M. (1991 ). 'Drugs, sex and HIV: a mathematical model for New York City'. Philosophical Transactions of the Royal Society of London. Series B: Biological Sciences 321: 171-87.
Blythe, S. R, Anderson, R. M. (1988). 'Variable infectiousness in HIV transmission models'. IMA Journal of Mathematics Applied in Medicine and Biology 5: 181-200.
Blythe, S. R, Castillo-Chavez, C. (1989). 'Like-with-like preference and sexual mixing models'. Mathematical Biosciences 96: 221-38.
Capasso, V, Sicurello, F, Villa, M. (1995). 'Mathematical models for HIV transmission in groups of injecting drug users via shared drug equipment'. Journal of Biological Systems 3: 747-58.
180
CHAPTER 10
Dietz, K., Hadeler, K. R (1988). 'Epidemiological models for sexually transmitted diseases'. Journal
of Mathematical Biology 26: 125.
Downs, A. M., Heisterkamp, S. H., Brunet, J. Β., Hamers, F. F. (1997). 'Reconstruction and
prediction of the HIV/AIDS epidemic among adults in the European Union and in the low
prevalence countries of central and eastern Europe'. AIDS 11 : 64962.
Cani, J., Yakowitz, S. (1993). 'Modelling the spread of HIV among intravenous drug users'. IMA
Journal of Mathematics Applied in Medicine and Biology 10: 5165.
Greenhalgh, D. (1997). 'Bounds on the endemic disease levels, risks and basic reproductive
numbers in heterogeneous models for HIV/AIDS amongst injecting drug users''. Journal of Biological
Systems 5 (2): 15180.
Greenhalgh, D. (1996). 'Effects of heterogeneity on the spread of HIV/AIDS among intravenous
drug users in shooting galleries'. Mathematical Biosciences 136 (2): 14186.
Greenhalgh, D., Hay, G. (1996). 'Mathematical modelling of the spread of HIV/AIDS amongst
injecting drug users'. IMA Journal of Mathematics Applied in Medicine and Biology 14: 128.
Hendriks, J. C. M., Satten, G. Α., van Ameijden, E. J. C , van Druten, J. A. M., Coutinho, R. Α., van
Griensven, G. J. R (1998). 'The incubation period to AIDS in injecting drug users estimated from
prevalent cohort data, accounting for death prior to an AIDS diagnosis'. AIDS 12:153744.
Hethcote, H. W., Yorke, J. A. (1984). Gonorrhea transmission dynamics and control. Lecture
Notes in Biomathematics Vol. 56. Berlin: Springer Verlag
lannelli, M., Milner, FA., Pugliese, Α., Gonzo, M. (1997). 'The HIV/AIDS epidemics among drug
injectors: a study of contact structure through a mathematical model'. Mathematical Biosciences
139: 2558.
Jacquez, J. Α., Koopman, J. S., Simon, C. R, Longini, Jr., L M . (1994). 'Role of the primary infection
in epidemics of HIV infection in gay cohorts'. Journal of AIDS 7:116984.
Jacquez, J. Α., Simon, C. R, Koopman, J. (1989). 'Structured mixing: heterogeneous mixing by
the definition of activity groups', in CastilloChavez, C. (ed.) Mathematical and statistical approaches
to AIDS epidemiology. Lecture Notes in Biomathematics Vol. 83. Berlin: Springer Verlag, 3 0 1
15.
Kaplan, E. H. (1989). 'Needles that kill: modelling human immunodeficiency virus transmission
via shared drug injection equipment in shooting galleries'. Review of Infectious Diseases 11 :
28998.
Kaplan, E. H., Heimer, R. (1992). 'A modelbased estimate of HIV ¡nfectivity via needle sharing'.
Journal of Aids 5: 111618.
Kretzschmar, M., Dietz, K. (1998). 'The effect of pair formation and variable ¡nfectivity on the
spread of an infection without recovery'. Mathematical Biosciences 148: 83113.
Kretzschmar, M., Wiessing, L. G. (1998). 'Modelling the spread of HIV in social networks of
injecting drug users'. AIDS 12: 80111.
Kretzschmar, M., Reinking, D. R, Jager, J. C , Brouwers, H., van Zessen, G. (1994). 'Network
models: from paradigm to mathematical tool', in Kaplan, E. H., Brandeau, M. (eds) Modeling the
AIDS epidemic. New York: Raven Press, 56183.
181
MODELLING THE HEALTH CONSEQUENCES OF DRUG USE
Longini Jr., I. M., Clark, W. S., Satten, G. Α., Byers, R. H., Karon, J. M. (1996). 'Staged Markov models based on CD4+ T-lymphocytes for the natural history of HIV infection', in Isham, V, Medley, G. Models for infectious human diseases: their structure and relation to data. Cambridge: Cambridge University Press, 439-59.
Longini, Jr., I. M., Clark, W. S., Byers, R. H., Ward, J. W., Darrow, W W., Lemp, G. F., Hethcote, H. W. (1989a). 'Statistical analysis of the stages of HIV infection using a Markov model'. Statistics in Medicine 8: 831-43.
Longini Jr., I. M., Clark, W. S., Haber, M., Horsburgh Jr., R. (1989b). 'The stages of HIV infection: waiting times and infection transmission probabilities', in Castillo-Chavez (ed.) Mathematical and statistical approaches to AIDS epidemiology, 111-37.
McLean, A. R., Blumberg, B. S. (1994). 'Modelling the impact of mass vaccination against hepatitis B. I. Model formulation and parameter estimation'. Proceedings of the Royal Society of London. Series B: Biological Sciences 256: 7-15.
Morris, M., Kretzschmar, M. (1997). 'Concurrent partnerships and the spread of HIV'. AIDS 11 : 641-8.
Papaevangelou, G., Richardson, S. C. (1995). 'HIV prevalence and risk factors among injecting drug users in EC and COST countries', in Baert, A.-E., et al. AIDS research at EC level. Amsterdam: IOS Press, 73-82.
Peterson, D., Willard, K., Altmann, M., Gatewood, L., Davidson, G. (1990). 'Monte Carlo simulation of HIV infection in an intravenous drug user community'. Journal of AIDS 3: 1086-95.
Richardson, C , Ancelle-Park, R., Papaevangelou, G. (1993). 'Factors associated with HIV seropositivity in European injecting drug users'. AIDS 7: 1485-91.
Williams, J. R., Nokes, D. J., Medley, G. F, Anderson, R. M. (1996a). 'The transmission dynamics of hepatitis Β in the UK: a mathematical model for evaluating costs and effectiveness of immunization programmes'. Epidemiology and Infection 116: 71-89.
Williams, J. R., Nokes, D. J., Anderson, R. M. (1996b). 'Targeted hepatitis Β vaccination - a cost-effective immunisation strategy for the UK?' Journal of Epidemiology and Community Health 50: 667-73.
Yakowitz, S. J. (1994). 'From a microcosmic IDU model to a macrocosmic HIV epidemic', in Kaplan, Brandeau, Modeling the AIDS epidemic, 365-83.
182
CHAPTER 11
DEVELOPING MULTINATIONAL SCENARIO ANALYSES OF HEALTH IMPACTS OF DRUG USE
Johannes C. Jager, Maarten J. Postma and Peter W. Achterberg
The issue of drug use and its health-related consequences represents a complicated and multifarious scientific and societal problem. This chapter explores how scenario analysis may be used to investigate the actual situation, possible future developments and potential effects of policy measures in Europe.
Since the early 1980s, considerable experience with future research on public health and health-care problems has been built up in the Netherlands. The Dutch Steering Committee on Future Health Scenarios (STG) commissioned about 20 scenario studies on diseases and their consequences for public-health-strategy development, including on chronic diseases such as diabetes mellitus, chronic non-specific lung disease, rheumatoid arthritis (Casparie and Verkleij, 1991-94), mental health care (Idenburget al., 1991; Bijl, 1991) and HIV/AIDS (van den Boometal., 1992). The methodological accomplishments from these STG studies have been summarised and translated into practical guidelines for scenario research (Genügten et al., 1996). On a broader scale, covering many diseases and determinants (risk factors) which affect health, the Department for Public Health Forecasting of the National Institute of Public Health and the Environment (RIVM), Bilthoven, established, in cooperation with several other institutes, a detailed description including forecasts of the health status of the Dutch population (Ruwaard et al., 1994; Ruwaard and Kramers, 1997). Further, in two specific research projects, the scenario-analytic approach was extended to the multinational (European Union) level, with the European Commission Concerted action on multinational AIDS scenarios examining the epidemiological, economic and socio-cultural impact of AIDS on society (Jageretal., 1995; Downs et al., 1997; Postma et al., 1997) and another project on the attainment of blood self-sufficiency in the EU (Van Aken et al., 1997).
These multinational EU-directed studies have developed and implemented an integrated application of mathematical modelling, epidemiology and health economics within a scenario-analytic framework. This chapter builds on the experience acquired through the studies with respect to their relevance for the scenario research process. The second section characterises essential features of the scenario-analytic approach while the third section motivates the application of scenario analysis to the drug issue. The following section gives a concise overview of the multinational scenario projects mentioned above
183

MODELLING THE HEALTH CONSEQUENCES OF DRUG USE
and their generalisable methodological accomplishments, and the fifth section offers a preliminary approach to scenario-building in modellingdruguseand related problems. The last section contains some conclusions and recommendations for potential policy-oriented research on drug use and related problems.
The scenario-analytic approach
Scenario analysis is a form of research that makes use of a variety of techniques, such as mathematical modelling and statistical analysis, brain-storming techniques, meta-analysis and cost-effectiveness analysis. Its main power lies in structuring a joint study involving participants from different disciplines, interests and countries. It differs from empirical research in its strong dependence on secondary data (data not collected according to a strict study design and sampling plan), incomplete and heterogeneous data and its meta-analytic approach. Methodological weakness has to be remedied by extensive consultation of experts.
Essential elements of a scenario research are the conceptual approach, the use of mathematical models, departure from a basic analysis and the development of scenarios.
Conceptual model
A scenario study starts with the construction of a conceptual model. This construction should be a joint activity of all participants involved in the project. The conceptual model is a schematic representation of the field under study in terms of components and their main relations. As stated in Ruwaard et al. (1994), it has the following functions: to provide a structure for the development of ideas; to define the boundaries; to offer a structure for orderly handling of the subject matter; and to serve as a basis for producing a formal model in mathematical terms.
Mathematical model
Ideally, the conceptual model is elaborated as a mathematical model, which can be used to describe the past, to predict the future and to perform 'what if' analyses. Modelling results represent the quantitative backbone of the scenario development. The role of modelling and the interaction of modellers and other researchers has been discussed in Jagerand van den Boom (1994). For a discussion of the interdependences of quantitative and qualitative procedures in scenario research, see Bijl (1991).
Basic analysis
The basic analysis (or baseline analysis) comprises the identification of data sources and the collection of available, primary and secondary data on all the components taken up in the conceptual model. These are subject to data analysis and meta-analysis, and form the basis for the application of scenarios. The evaluation of data availability and quality (comparability, completeness, potential for generalisation) is important here. Another
184
CHAPTER 11
important aspect of scenario analysis is to specify data needs. The basic analysis also comprises the selection and specification of key variables and impact indicators to be handled in the construction of scenarios (and the mathematical model). The data play a role in the validation of models. Often modelling detects essential data gaps. Key variables represent factors which may significantly influence the system understudy. Impact indicators describe the most interesting aspects of the performance of the system.
Scenario development
The construction of scenarios starts from the conceptual model, the mathematical model (where possible) and the results of the basic analysis. A reference scenario builds on the assumption that the present situation and recent trends will continue in the future, and describes the surprise-free continuation of the past. Alternative scenarios may be elaborated on the basis of 'what if' questions.
Why apply a multinational scenario approach to drugs?
Generally, the scenario-analytic approach to problems within the domains of public health and health care is motivated by its expected contribution to policy-making, to long-term planning and to strategy development. Effective analyses supporting these activities require a methodology which deals coherently with epidemiological analyses of the current situation and its projection into the future based on explicit assumptions. Mathematical modelling techniques and linking epidemiology to insights in costs related to care and prevention from health-services research are essential (Jager and van den Boom, 1994).
Thus, a scenario study requires cooperation between specific experts such as modellers, epidemiologists and economists. The following issues will particularly influence the choice of a scenario approach:
the weight, scope and complexity of the problem (only important and complex problems require a scenario approach; there is a demand for interdisciplinary approach);
the need to make decisions and launch interventions, which may be confronted with great uncertainty (an interest in the future; the wish to make predictions and plans/interventions, which are extremely difficult in view of great uncertainty); the potential impact on decision-making by elucidating alternative developments in quantitative terms; the involvement of different groups (patients, care providers, public-health officials, community, government, countries) with diverging interests and the inherent invitation to discuss these alternatives in a coherent and rational way (potential consensus as a result of discussion between interested parties and relevant disciplines).
To conduct a successful scenario analysis it should be possible to distinguish key variables and impact indicators that are sensitive to policies.
185
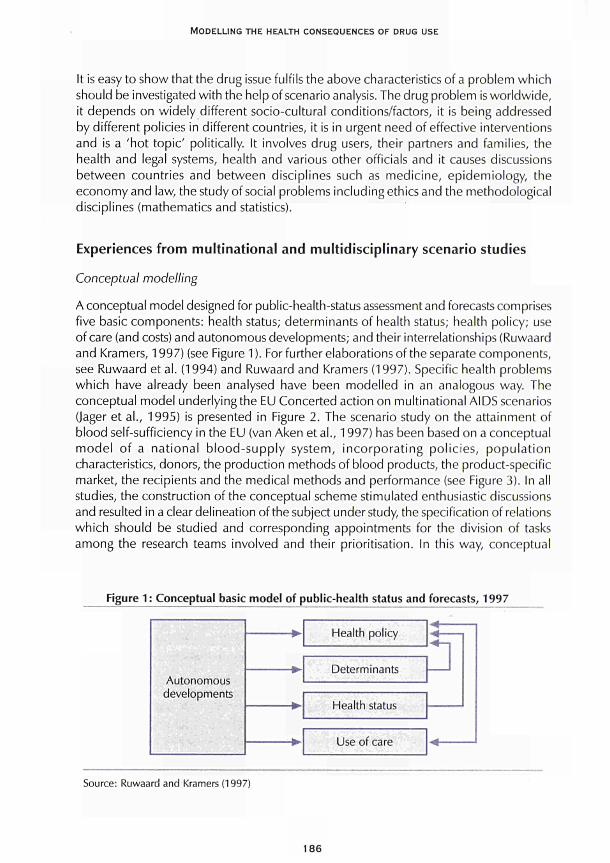
MODELLING THE HEALTH CONSEQUENCES OF DRUG USE
It is easy to show that the drug issue fulfils the above characteristics of a problem which should be investigated with the help of scenario analysis. The drug problem is worldwide, it depends on widely different socio-cultural conditions/factors, it is being addressed by different policies in different countries, it is in urgent need of effective interventions and is a 'hot topic' politically. It involves drug users, their partners and families, the health and legal systems, health and various other officials and it causes discussions between countries and between disciplines such as medicine, epidemiology, the economy and law, the study of social problems including ethics and the methodological disciplines (mathematics and statistics).
Experiences from multinational and multidisciplinary scenario studies
Conceptual modelling
A conceptual model designed for public-health-status assessment and forecasts comprises five basic components: health status; determinants of health status; health policy; use of care (and costs) and autonomous developments; and their interrelationships (Ruwaard and Kramers, 1997) (see Figure 1 ). For further elaborations of the separate components, see Ruwaard et al. (1994) and Ruwaard and Kramers (1997). Specific health problems which have already been analysed have been modelled in an analogous way. The conceptual model underlying the EU Concerted action on multinational AIDS scenarios (Jager et al., 1995) is presented in Figure 2. The scenario study on the attainment of blood self-sufficiency in the EU (van Aken et al., 1997) has been based on a conceptual model of a national blood-supply system, incorporating policies, population characteristics, donors, the production methods of blood products, the product-specific market, the recipients and the medical methods and performance (see Figure 3). In all studies, the construction of the conceptual scheme stimulated enthusiastic discussions and resulted in a clear delineation of the subject under study, the specification of relations which should be studied and corresponding appointments for the division of tasks among the research teams involved and their prioritisation. In this way, conceptual
Figure 1 : Conceptual basic model of public-health status and forecasts, 1997
Autonomous developments
Health policy
Determinants
Health status
Use of care
* 4_-
Source: Ruwaard and Kramers (1997)
186
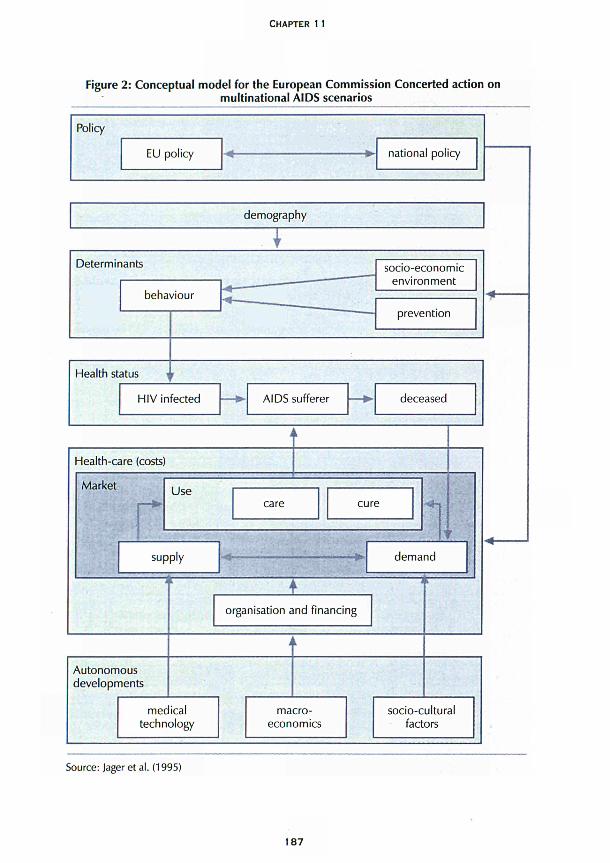
CHAPTER 11
Figure 2: Conceptual model for the European Commission Concerted action on
multinational AIDS scenarios
demography
Determinants
behaviour
Health status
socioeconomic
environment
prevention
HIV infected AIDS sufferer deceased
Healthcare (costs)
Market
r Use
care cure
supply # ■ demand
Autonomous
developments
± organisation and financing
medical
technology macro
economics
sociocultural
factors
Source: Jager et al. (1995)
187
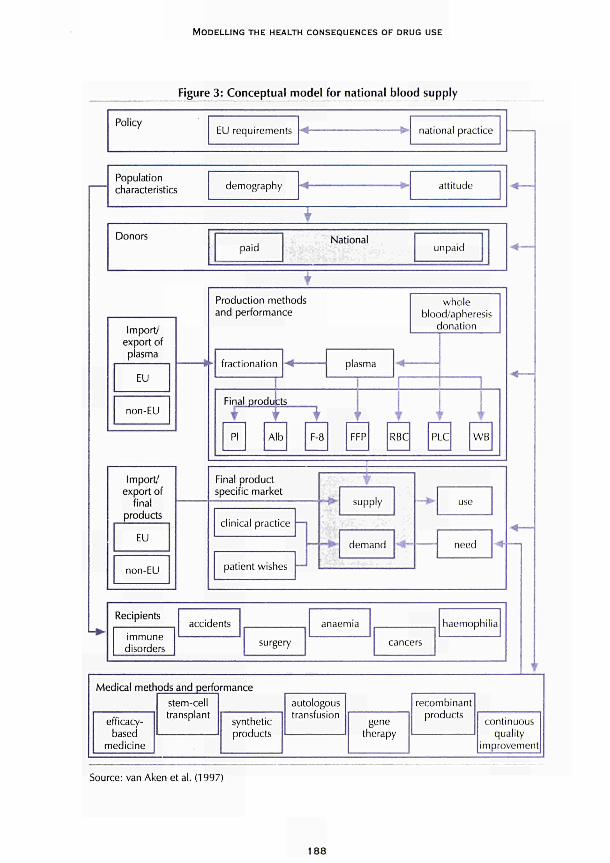
MODELLING THE HEALTH CONSEQUENCES OF DRUG USE
Figure 3: Conceptual model for national blood supply
Policy EU requirements **£ national practice
Population characteristics
Import/' export of piasma
EU
non-EU
demography attitude
Donors paid
National unpaid
Production methods and performance
whole blood/apheresis
donation
fractionation plasma
Final products
f PI Alb
ΓΊ t t FEP RBC PLC VV B
Final p r o d u c t speci f ic marke t
c l in ical pract ice —
pat ient wishes —'
φ. supply
d e m a n d need
Recipients
immune disorders
accidents
surgery
anaemia
cancers
haemophilia
Medical methods and performance
efficacy-based
medicine
stem-cell transplant
synthetic products
autologous transfusion
gene therapy
recombinant products
continuous quality
improvement!
Source: van Aken et al. (1997)
188
CHAPTER 11
modelling stimulates and facilitates interdisciplinary discussion and provides the mathematicians with starting points for elaborating the conceptual model in mathematical terms. This process can also highlight specific data needs.
Mathematical modelling
Mathematical modelling provides several functions: quantitative description of the phenomenon understudy; insight into the causal relations involved; detection of crucial data needs; parameter estimation starting from empirical information; projection into the future under specified conditions; and prediction. In the study concerning AIDS-impact scenarios, several models have been developed which pertain to parts of the conceptual model (e.g. concerning the effects of medical treatment, behavioural change and the organisation of health-care provisions) (Bailey and Heisterkamp, 1995). It would be unrealistic to try to encompass the whole area under study in one, necessarily very complicated, mathematical model. However, the specifications for different models were similar enough to warrant comparability of the outcomes. Much attention was paid to the development and application of a common methodology to describe the baseline situation (Downs et al., 1997; Heisterkamp, 1995). The blood-supply problem (van Aken et al., 1997) has been represented by a single model with sub-systems which may be activated as desired.
The overall experience is that mathematical modelling is essential in scenario analysis, but it should be applied flexibly (several models using the same specifications; simultaneous use of simple descriptive (trend analyses) and more complex dynamic models) and results should be supplemented by qualitative considerations, discussions and comments.
In AIDS-scenario studies, several models have been developed which incorporate intravenous drug use (IDU) as a determinant in the spread of HIV. For the Dutch AIDS scenario study (van den Boom et al., 1992) a multi-group transmission model was developed (van Drutenetal., 1990,1992) which represents the HIV epidemic as resulting from overlapping sub-epidemics in six groups (among which are IDU men and women). The contacts between and within these groups occur via several transmission routes: unprotected anal intercourse; unprotected vaginal intercourse; and the shared use of needles. The model enables the simulation of the effects of preventive interventions targeted to behavioural change (see Chapter 7 in van den Boom et al., 1992). Another mathematical technique, which also concerns the spread of HIV in several risk groups, including IDUs, is the so-called back calculation (BC) (Heisterkamp, 1995, and Chapter 6, above). Back calculation makes it possible to estimate past and to project future incidence and prevalence of HIV infection based on reported AIDS surveillance data. In the EC project on multinational AIDS scenarios, these estimates were obtained for the 15 European Member States (Downs et al., 1997). Recently, this BC has been extended to include age effects (report of EC Concerted action on multinational AIDS scenarios, in preparation). This advancement is important because it supports the results of analysis of the AIDS epidemic in birth cohorts of separate risk groups such as IDUs (Houweling et al., 1998) for public-health-strategy development. Recent estimates of HIV infections in IDUs in Europe by BC are available.
189
MODELLING THE HEALTH CONSEQUENCES OF DRUG USE
Basic analysis (key variables and impact indicators)
Basic analysis involves the collection of available data, which can be specified according to variables associated with the components in the conceptual model. It has been found profitable to devise a table which presents relevant variables according to the components of the conceptual model and/or according to the disciplines involved (van den Boom et al., 1992; Jager et al., 1995; van Aken et al., 1997). The correspondence to related impact indicators should be given. This table concerning the AIDS-scenario study is structured according to disciplines such as epidemiology, economy and sociology (see Figure 4) (Jager et al., 1995). In the blood-supply study (van Aken et al., 1997) the impact indicators were explicitly developed by considering each component in the model (see Figure 5).
Scenario development
In most previous scenario studies (van den Boom et al., 1992; Jager et al., 1995; van Aken et al., 1997), the construction of the reference scenario generally took a major part of the available time. In an initial planning meeting for the project on multinational AIDS scenarios, four working groups were formed on modelling support, on epidemiological impact, on economic impact and on social impact, respectively. The mathematicians started to devise an overview of available mathematical models (Heisterkamp, 1995) and decided to develop a common methodology which could be applied to European AIDS surveillance data. The epidemiologists needed several sessions to specify - in cooperation with the modellers -the epidemiological starting points for the reference scenario (Houweling et al., 1996). They also had to collect additional country-specific HIV/AIDS surveillance data to underpin their specifications (Roosmalen et al., 1996). Thus, rather late during the course of the project, alternatives to the reference scenario were eventually specified, though in principle, at the beginning of the project, available mathematical models could handle them very well. This shows that a reference scenario should be developed as soon as possible in the execution of a scenario project.
Apparently, a detailed elaboration of a reference is a satisfactory foundation for formulating themes for alternative scenarios and further scenario-building. Another aspect of multidisciplinary scenario construction refers to levels, for example the extension of the epidemiological level to the economic level by linking epidemiological variables to economic information (see Figure 4, and Leidl, 1994). The mathematicians should keep in mind which level is an endpoint (in terms of impact indicators) for their modelling activity, because it will determine the set-up of their models.
Some notes on economic aspects
Classification of costs and definition of economic-impact indicators
Essential dichotomies regarding the classification of costs suitable for scenario analyses of costs and effects are: 'costs within the health-care system' versus 'costs outside the health-care system'; and 'direct costs' versus 'indirect costs' (van Genügten et al., 1996, and Chapter 12, below).
190
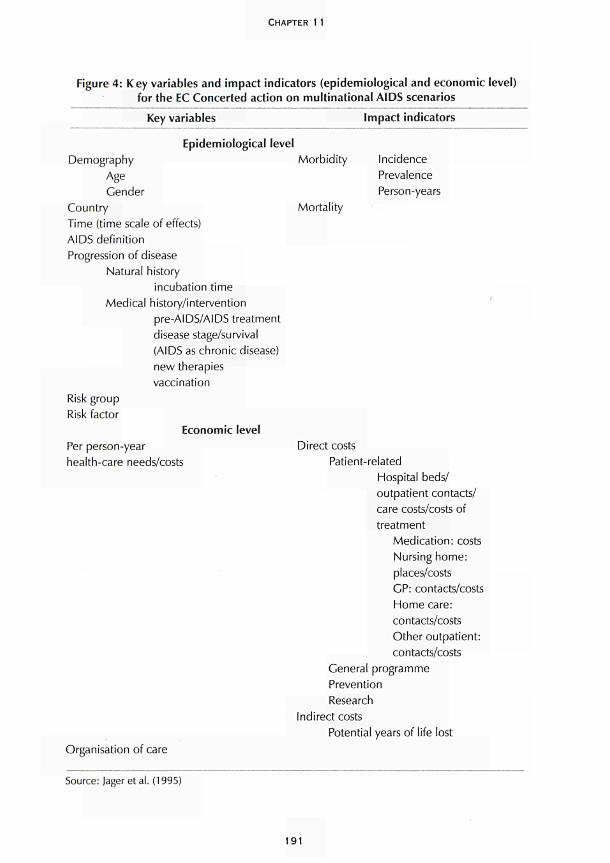
CHAPTER 1 1
Figure 4: Key variables and impact indicators (epidemiological and economic level) for the EC Concerted action on multinational AIDS scenarios
Key variables Impact indicators
Epidemiological level Demography Morbidity
Age Gender
Country Mortality Time (time scale of effects) AIDS definition Progression of disease
Natural history incubation time
Medical history/intervention pre-AIDS/AIDS treatment disease stage/survival (AIDS as chronic disease) new therapies vaccination
Incidence Prevalence Person-years
Risk group Risk factor
Economic level Per person-year health-care needs/costs
Direct costs Patient-related
Hospital beds/ outpatient contacts/ care costs/costs of treatment
Medication: costs Nursing home: places/costs GP: contacts/costs Home care: contacts/costs Other outpatient: contacts/costs
General programme Prevention Research
Indirect costs
Potential years of life lost Organisation of care
Source: Jager et al. (1995)
191
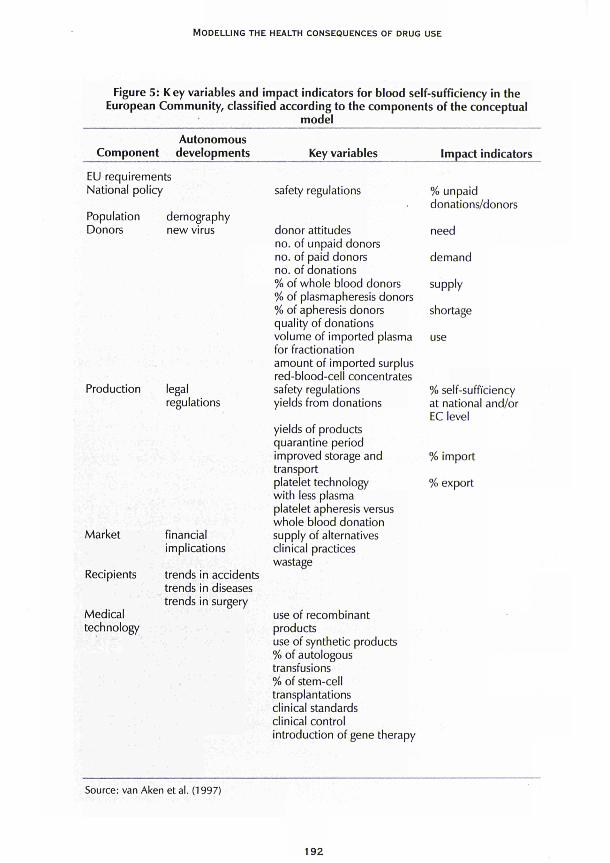
MODELLING THE HEALTH CONSEQUENCES OF DRUG USE
Figure 5: Key variables and impact indicators for blood self-sufficiency in the European Community, classified according to the components of the conceptual
model
Autonomous Component developments
EU requirements National policy
Population demography Donors new virus
Key variables
safety regulations
donor attitudes no. of unpaid donors no. of paid donors no. of donations % of whole blood donors % of plasmapheresis donors % of apheresis donors
Impact indicators
% unpaid donations/donors
need
demand
supply
shortage quality of donations volume of imported plasma for fractionation amount of imported surplus red-blood-cell concentrates
use
Production
Market
Recipients
Medical technology
legal regulations
financial implications
trends in accidents trends in diseases trends in surgery
safety regulations yields from donations
yields of products quarantine period improved storage and transport platelet technology with less plasma platelet apheresis versus whole blood donation supply of alternatives clinical practices wastage
use of recombinant products use of synthetic products % of autologous transfusions % of stem-cell transplantations clinical standards clinical control introduction of gene therapy
% self-sufficiency at national and/or EC level
% import
% export
Source: van Aken et al. (1997)
192
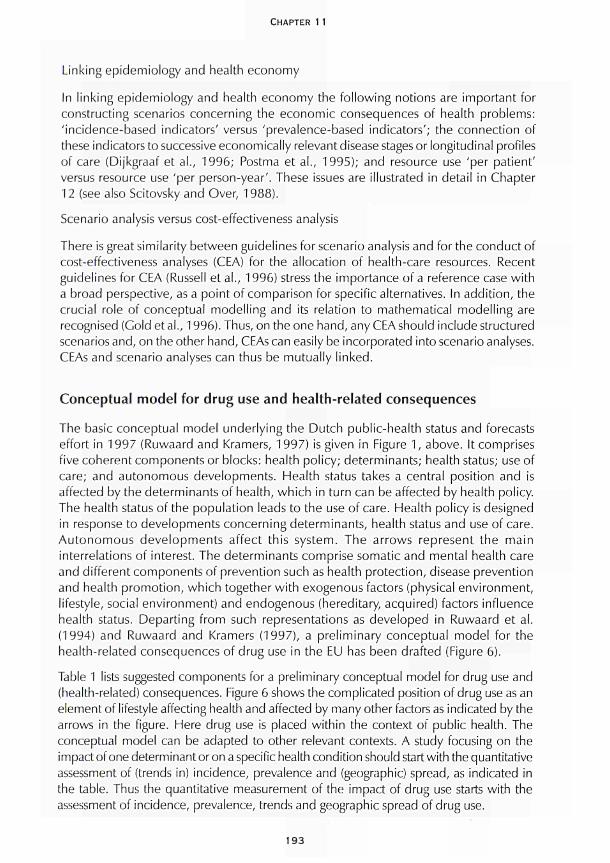
CHAPTER 11
Linking epidemiology and health economy
In linking epidemiology and health economy the following notions are important for constructing scenarios concerning the economic consequences of health problems: 'incidence-based indicators' versus 'prevalence-based indicators'; the connection of these indicators to successive economically relevant disease stages or longitudinal profiles of care (Dijkgraaf et al., 1996; Postma et al., 1995); and resource use 'per patient' versus resource use 'per person-year'. These issues are illustrated in detail in Chapter 12 (see also Scitovsky and Over, 1988).
Scenario analysis versus cost-effectiveness analysis
There is great similarity between guidelines for scenario analysis and for the conduct of cost-effectiveness analyses (CEA) for the allocation of health-care resources. Recent guidelines for CEA (Russell et al., 1996) stress the importance of a reference case with a broad perspective, as a point of comparison for specific alternatives. In addition, the crucial role of conceptual modelling and its relation to mathematical modelling are recognised (Gold et al., 1996). Thus, on the one hand, any CEA should include structured scenarios and, on the other hand, CEAs can easily be incorporated into scenario analyses. CEAs and scenario analyses can thus be mutually linked.
Conceptual model for drug use and health-related consequences
The basic conceptual model underlying the Dutch public-health status and forecasts effort in 1997 (Ruwaard and Kramers, 1997) is given in Figure 1, above. It comprises five coherent components or blocks: health policy; determinants; health status; use of care; and autonomous developments. Health status takes a central position and is affected by the determinants of health, which in turn can be affected by health policy. The health status of the population leads to the use of care. Health policy is designed in response to developments concerning determinants, health status and use of care. Autonomous developments affect this system. The arrows represent the main interrelations of interest. The determinants comprise somatic and mental health care and different components of prevention such as health protection, disease prevention and health promotion, which together with exogenous factors (physical environment, lifestyle, social environment) and endogenous (hereditary, acquired) factors influence health status. Departing from such representations as developed in Ruwaard et al. (1994) and Ruwaard and Kramers (1997), a preliminary conceptual model for the health-related consequences of drug use in the EU has been drafted (Figure 6).
Table 1 lists suggested components for a preliminary conceptual model for drug use and (health-related) consequences. Figure 6 shows the complicated position of drug use as an element of lifestyle affecting health and affected by many other factors as indicated by the arrows in the figure. Here drug use is placed within the context of' public health. The conceptual model can be adapted to other relevant contexts. A study focusing on the impact of one determinant or on a specific health condition should start with the quantitative assessment of (trends in) incidence, prevalence and (geographic) spread, as indicated in the table. Thus the quantitative measurement of the impact of drug use starts with the assessment of incidence, prevalence, trends and geographic spread of drug use.
193
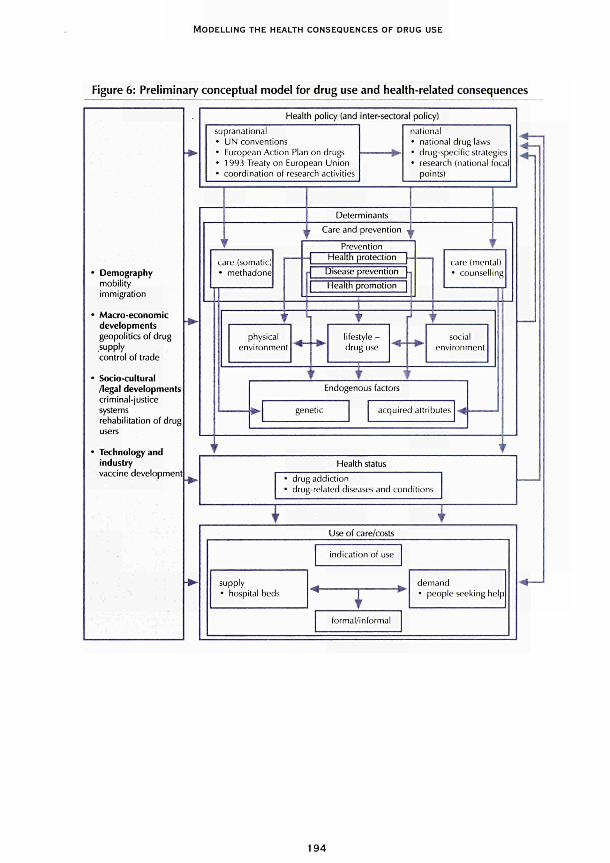
MODELLING THE HEALTH CONSEQUENCES OF DRUG USE
Figure 6: Preliminary conceptual model for drug use and health-related consequences
Demography
mobility
immigration
Macro-economic
developments
geopolitics of drug
supply
control of trade
Socio-cultural
/legal developments
criminal-justice
systems
rehabilitation of drug
Technology and
industry
vaccine development
Health policy (and inter-sectoral policy)
supranational
• UN conventions
• European Action Pian on drugs
• 1993 Treaty on European Union
• coordination of research activities
national
• national drug laws
" drug-specific strategies
• research (national focal
points)
Determinants
Care and prevention
care (somatic)
• methadone
Prevention
■ -\ Health protection [-
Disease prevention [η
Health promotion |
R physical
environment
lifestyle -
drug use
care (mental)
• counselling
social
environment
Endogenous factors
genetic acquired attribules
Health status
drug addiction
drug-related diseases and conditions
Τ τ Use of care/costs
supply
• hospital beds
indication of use
1 r
formal/informal
demand
• people seeking help
1 9 4
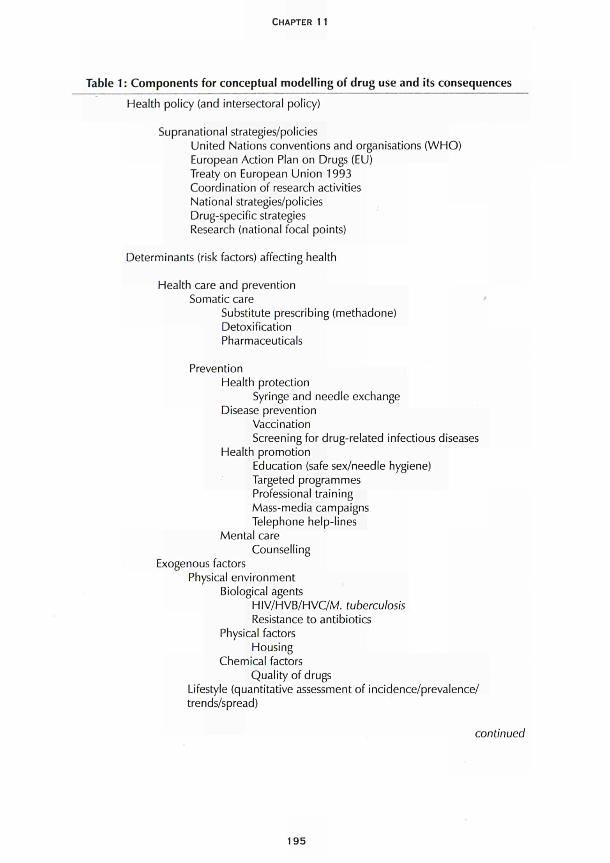
CHAPTER 11
Table 1 : Components for conceptual modelling of drug use and its consequences
Health policy (and intersectoral policy)
Supranational strategies/policies United Nations conventions and organisations (WHO) European Action Plan on Drugs (EU) Treaty on European Union 1993 Coordination of research activities National strategies/policies Drug-specific strategies Research (national focal points)
Determinants (risk factors) affecting health
Health care and prevention Somatic care
Substitute prescribing (methadone) Detoxification Pharmaceuticals
Prevention Health protection
Syringe and needle exchange Disease prevention
Vaccination Screening for drug-related infectious diseases
Health promotion Education (safe sex/needle hygiene) Targeted programmes Professional training Mass-media campaigns Telephone help-lines
Mental care Counselling
Exogenous factors Physical environment
Biological agents HIV/HVB/HVC/M. tuberculosis Resistance to antibiotics
Physical factors Housing
Chemical factors Quality of drugs
Lifestyle (quantitative assessment of incidence/prevalence/ trends/spread)
continued
195
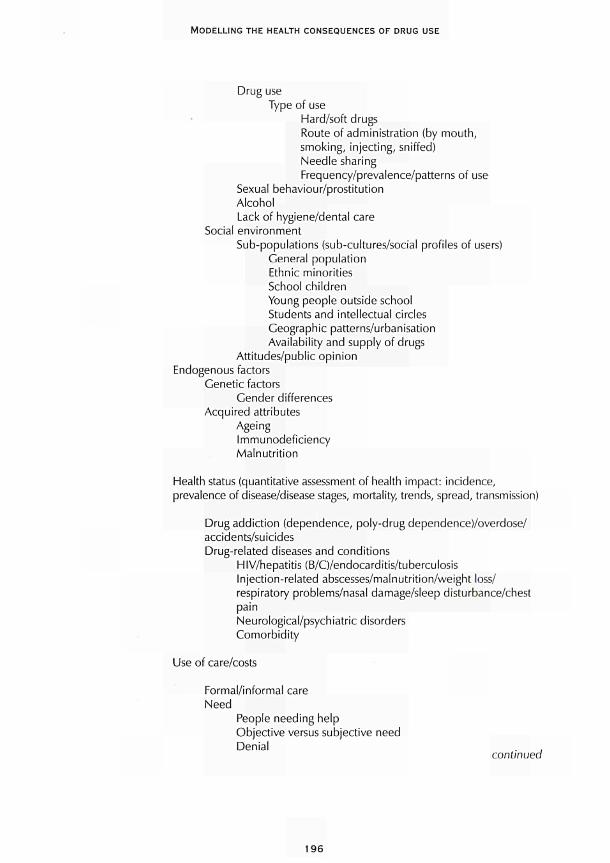
MODELLING THE HEALTH CONSEQUENCES OF DRUG USE
Drug use Type of use
Hard/soft drugs Route of administration (by mouth, smoking, injecting, sniffed) Needle sharing Frequency/prevalence/patterns of use
Sexual behaviour/prostitution Alcohol Lack of hygiene/dental care
Social environment Sub-populations (sub-cultures/social profiles of users)
General population Ethnic minorities School children Young people outside school Students and intellectual circles Geographic patterns/urbanisation Availability and supply of drugs
Attitudes/public opinion Endogenous factors
Genetic factors Gender differences
Acquired attributes Ageing Immunodeficiency Malnutrition
Health status (quantitative assessment of health impact: incidence, prevalence of disease/disease stages, mortality, trends, spread, transmission)
Drug addiction (dependence, poly-drug dependence)/overdose/ accidents/suicides Drug-related diseases and conditions
HIV/hepatitis (B/C)/endocarditis/tuberculosis Injection-related abscesses/malnutrition/weight loss/ respiratory problems/nasal damage/sleep disturbance/chest pain Neurological/psychiatric disorders Comorbidity
Use of care/costs
Formal/informal care Need
People needing help Objective versus subjective need Denial ,
continued
196
CHAPTER 11
Supply Hospital beds Budget Availability of doctors
Demand People seeking help Supplier-induced demand (Un)satisfied
Indication/use Hospital GP Medication
Related costs Direct costs
Patient-related General programme
Indirect costs Lost productivity Employment Potential years of life lost
Autonomous developments
Demography Mobility/immigration
Macro-economic developments Geopolitics of supply/control of trade
Socio-cultural/legai developments Criminal-justice systems/national drug laws (legal versus illegal drugs) Accessibility (prohibiting/punishing possession/arrests and drug seizures) Reduction in demand/supply of drugs
Rehabilitation of drug users Medical technology
Vaccine development
Conclusions
Scenario analysis offers an appropriate methodological context for approaching the drug problem in a pol icy-oriented mult inational sphere of interest. It can stimulate various research efforts in important interdisciplinary areas related to the drug-use problem in the EU Member States, so as to al low for best practices and best research to disseminate throughout the EU. This wil l guide individual States towards optimal strategies for combat ing the drug problem.
Four (general) aspects of scenario analysis should be emphasised: conceptual model l ing; its relation to data-gathering (basic analysis); its relation to mathematical model l ing; and its potential for orderly and creative scenario construction.
197

MODELLING THE HEALTH CONSEQUENCES OF DRUG USE
Conceptual modelling stimulates and facilitates interdisciplinary discussions and provides mathematicians with starting points for elaborating the conceptual model in mathematical terms. A multinational approach will allow for a much broader and divergent input to conceptual modelling, with a greater chance of high-quality expert input in all relevant areas. The process of conceptualisation stimulates causative and associative thinking and may identify priorities for data collection and analysis.
The drug problem should be delineated in a conceptual model. A preliminary conceptual model has been suggested as a starting point for further discussion on refinements and further elaboration. Parts of the conceptual model and associated specific questions may be selected for mathematical modelling. The development of scenarios should also build on a conceptual model.
Mathematical modelling should be applied in a flexible way within a scenario analysis, for example, by using several models simultaneously, such as simple, descriptive models and more complex, dynamic models. Modelling results should be supplemented by qualitative considerations to guide further discussions and comments, possibly resulting in new and better model input. Again, the multinational approach will give access to increasingly diverse mathematical models and expertise. Mathematical models should be classified in relation to the components and relations indicated in the conceptual model. The potential of mathematical models with respect to the construction of a reference scenario and alternative scenarios should be made explicit.
There are several other advantages of, and opportunities to be gained from, a multinational approach. Assessing variations within and between countries broadens the view of different policy options. A multinational approach may provide what might be called a 'natural' set of experiments as a disease may express itself differently in different countries. It can thereby also provide a first realistic estimate of the variability of certain outcomes. A good example, again, is the AIDS epidemic, where the development of an epidemic in a particular country is highly dependent upon the magnitude and characteristics of the sub-epidemics.
A multinational approach will thus give rise to an optimally balanced scenario analysis with regard to expertise in the areas relevant to the analysis, that is, epidemiology, mathematical modelling, economic analysis, and medical and sociological expertise. Moreover, policy-makers from different countries may in certain stages also be involved and contribute to the variety in policy options.
Acknowledgements
This chapter benefited from the support of the European Commission's Concerted action on multinational AIDS scenarios (BMH1 -CT-941723) and the Scenario analysis regarding the attainment of blood self-sufficiency in the European Community (SOC94 200985 05F01 (94CWF1 -040-0). The authors would like to thank G. J. Kommer, VV. G. Martens and F. J. Prinsze for their help in drawing the figures.
198
CHAPTER 11
References
van Aken, W. G., Jager, J. C. (project leaders), Kommer, G. J., Magirou, V. F, Postma, M. J.,
Prastacos, G. R, Strengers, R F. W. (research team), Delaney, F. M. (editor), Delaney, F. M.,
McClelland, D. B. (advisors) (1997). Scenario analysis regarding the attainment of blood self-
sufficiency in the European Community. A report for the European Commission (SOC94 200985
05F01 (94CWF1-040-0)). Amsterdam/Bilthoven/Athens: CLB, RIVM, OMAS.
Bailey, Ν. T. J., Heisterkamp, S. H. (eds) (1995). Preliminary review on the mathematical models
and data used for the baseline analysis. Bilthoven: National Institute of Public Health and the
Environment (RIVM).
Bijl, R. V. (1991). 'Construction of future scenarios: policy-oriented scenario research, applied to
the field of mental health and mental health care'. Thesis, Netherlands Centre for Mental Health,
Utrecht.
van den Boom, F. M. L. G., Jager, J. C , Reinking, D. R, Postma, M. J., Albers, C. E. S. (1992). AIDS
up to the year 2000. Epidemiological, sociocultural and economic analysis for the Netherlands.
Scenario report commissioned by the Steering Committee on Future Health Scenarios. Dordrecht/
Boston/London: Kluwer Academic Publishers.
Casparie, A. F, Verkleij, H. (1991-94). Chronic diseases in the year 2005. Scenario reports
commissioned by the Steering Committee on Future Health Scenarios. Dordrecht/Boston/London:
Kluwer Academic Publishers. Volume 1 : Scenarios on diabetes mellitus 1990-2005,1991. Volume
2: Scenarios on chronic non-specific lung diseases 1990-2005, 1993. Volume 3: Scenarios on
rheumatoid arthritis 1990-2005, 1994.
Dijkgraaf, M. G. W., Luijben, Α. Η. R, Postma, M. J., Borleffs, J. C. C , Schrijvers, A. J. R, Jager, J.
C. (1996). 'Lifetime hospitalization profiles for symptomatic, HIV-infected persons'. Health Policy
35: 13-32.
Downs, Α. M., Heisterkamp, S. H., Brunet, J.-B., Hamers, F. F. (1997). 'Reconstruction and
prediction of the HIV/AIDS epidemic among adults in the European Union and in the low
prevalence countries of central and eastern Europe'. AIDS 11 : 649-62.
van Druten, J. A. M., Poos, M. J. J. C , Hendriks, J., Jager, J. C. (1992). 'HIV epidemics in linked
risk groups: a move to exploratory scenario analysis', in Jager, J. C , Ruitenberg, E. J. (eds) AIDS
impact assessment: modelling and scenario analysis. Amsterdam/London/New York/Tokyo: Elsevier,
83-94.
van Druten, J. A. M., Reintjes, A. G. M., Jager, J. C , Heisterkamp, S. H., Poos, M. J. J. C , Coutinho,
R. Α., Dijkgraaf, M. G. W., Ruitenberg, E. J. (1990). 'HIV infection dynamics and intervention
experiments in linked risk groups'. Statistics in Medicine 9: 721-36.
van Genügten, M. L. L., Rutten, F. F. H., Jager, J. C. (1996). Scenario development and costing in
health care. Methodological accomplishments and practical guidelines. Report commissioned by
the Foundation for Future Health Scenarios. Utrecht: International Books.
Gold, M. R., Siegel, J. E., Russell, L. B., Weinstein, M. C. (1996). Cost-effectiveness in health and
medicine. New York/Oxford: Oxford University Press.
Heisterkamp, S. H. (1995). Quantitative analysis oíAIDS/HIV: development of methods to support
policy making for infectious disease control. Utrecht: Elinkwijk BV
199
MODELLING THE HEALTH CONSEQUENCES OF DRUG USE
Houweling, H., Hamers, F., Termorshuizen, F., Gill, O. N., Jager, J. C , Coutinho, R. Α. (1998). 'A
birth cohort analysis of AIDS in Europe: high incidence among young persons at risk'. AIDS 1 2:
8593.
Houweling, H., Heisterkamp, S. H., Gill, Ο. Ν., Jager, J. C , Coutinho, R. Α. (1996). Specification
of the epidemiological reference scenario. Bilthoven: RIVM.
Idenburg, P. Α., Ketting, E., Bijl, R. V, et al. (1991 ). Caring for mental health in the future. Future
scenarios on mental health and mental health care 1990-2010. Dordrecht/Boston/London: Kluwer
Academic Publishers.
Jager, J. C , van den Boom, F. M. L. G. (1994). 'Scenario analysis, health policy, and decision
making', in Kaplan, E. H., Brandeau, M. L. (eds) Modelling the AIDS epidemic. New York: Raven
Press, 23752.
Jager, J. C , Postma, M. J., Tolley, K., Kennelly, J. (1995). 'The economic impact of AIDS: from
national towards multinational scenarios', in Fitzsimons, D., Hardy, V, Tolley, K. (eds) The economic
and social impact of AIDS in Europe. London: Cassell, 4053.
Leidl, R. M. (1994). 'Some factors to consider when using the results of economic evaluation
studies at the population level'. International Journal of Technology Assessment 10: 46778.
Postma, M. J., Jager, J. C , Dijkgraaf, M. G. W„ Borleffs, J. C. C , Tolley, K., Leidl, R. M. (1995).
'AIDS scenarios for the Netherlands: the economic impact on hospitals'. Health Policy 31 : 127
50.
Postma, M. J., Tolley, K., Leidl, R. M., Downs, A. M., Beck, E. J., Tramarin, A. M., Flori, Υ. Α.,
Santin, M., Antoñanzas, F, Kornarou, H., Paparizos, V., Dijkgraaf, M. G. W , Borleffs, J. C. C ,
Luijben, A. H. R, Jager, J. C , for the European research team on AIDS scenarios (1997). 'Hospital
care for persons with AIDS in the European Union'. Health Policy 41 , 1 5776.
van Roosmalen, M., Hamers, F., Downs, Α. M., Houweling, H. (1996). Results oí the questionnaire
on country-specific HIV/AIDS surveillance data to be used in back-calculation. Bilthoven: RIVM.
Russell, L. B., Cold, M. R., Siegel, J. E., Daniels, N., Weinstein, M. C. (1996). 'The role of cost
effectiveness analysis in health and medicine'. Journal of the American Medical Association 76
(14): 11727.
Ruwaard, D., Kramers, R G. N. (eds) (1997). Volksgezondheid toekomst verkenning 1997. De
som der delen. Amsterdam: Elsevier/De Tijdstroom.
Ruwaard, D., Kramers, R G. N., van den Berg Jeths, Α., Achterberg, R W (1994). Public health
status and forecasts. The health status of the Dutch population over the period 1950-2010. The
Hague: Sdu Uitgeverij.
Scitovsky, Α. Α., Over, M. (1988). 'AIDS: costs of care in the developed and the developing
world'. AIDS 2 (suppl. 1): S71S81.
200

ECONOMIC MODELS

INTRODUCTION
E conomic models are often directly translatable to decisions on budget allocation, which is of primary importance for policy-makers. In Chapter 12, Postma and his colleagues elaborate on estimating drug-related HIV/AIDS costs as an example
for extending to other drug-related health-care costs. HIV/AIDS health-care costs include costs for resources such as hospital beds, nursing care, specialist consultations, day care and GP visits. Costing studies have been used to assess and project national health-care use and costs for HIV/AIDS and the economic impact of different intervention scenarios has also been explored. A set of methods thus exists that can be applied to other drug-related diseases. To date, studies have used different methods, and the authors argue that greater standardisation is necessary. They recommend extending the work on HIV/ AIDS to hepatitis as a first step, collecting country-specific information needs on healthcare use and costs by drug users, and developing future costing scenarios for all relevant drug-related diseases.
Sutton describes the potential for modelling economic drug markets in Chapter 13. He distinguishes three levels of analysis: picoeconomics (individual level); microeconomics (areas or markets); and macroeconomics (across areas or markets). Studies at individual level have the greatest potential, but the macro level is what policy-makers are most interested in and where by far most data are available. The author suggests that price and income elasticities of demand are currently unclear from existing published studies, and that essential issues to explore are individual health perception and education, individual preferences, habit formation, time preference and peer effects. Sutton concludes that individual-level analysis by a multi-disciplinary team is probably the most promising modelling approach for understanding interactions between policy interventions and markets.
203

CHAPTER 12
MODELLING THE HEALTH-CARE COSTS OF DRUG-USE-RELATED DISEASE
Maarten J. Postma, Keith Tolley and Johannes C. Jager
Different types of costs, such as health-care costs, the social costs of dependency and costs associated with criminal activity, can be related to drug use. In general, drug users are at increased risk of various types of infectious diseases, such as HIV/AIDS and hepatitis (Haverkos and Lange, 1990). Furthermore, some non-infectious diseases have also been associated with drug use, in particular with the use of crack cocaine (Umbricht-Schneiter et al.,1994; Kaku and Lowenstein, 1990; Dinwiddie et al., 1992). An overview of drug-related diseases is provided in Table 1.
At society level, the epidemiology of drug-use-related disease imposes a relevant public-health problem for many countries (Schlenger et al., 1992). For example, almost 40 %
Table 1 : Diseases and conditions related to drug use
Anaemia Bone infections Central nervous system infections (tetanus, meningitis) Chronic liver disease Endocarditis Heart disease (hypertension, heart attack, stroke) Hepatitis Human Immunodeficiency Virus (HIV) Mental disorders (schizophrenia) Other retroviruses (HTLV) Pneumococcal bacteremia Respiratory diseases Sexually transmitted diseases (gonorrhea, syphilis) Skin infections Tuberculosis
Sources: adapted from Haverkos and Lange (1990), Umbricht-Schnelter et al. (1994), Kaku and Lowenstein (1990)
205
ECONOMIC MODELS
of reported AIDS cases in the European Union are related to the intravenous use of drugs (European Centre for the Epidemiological Monitoring of AIDS, 1994).
This chapter focuses on the health-care costs of drug-use-related diseases. The treatment and care of these-mostly infectious-diseases require the input of various health-care resources such as hospital beds, nursing care, specialist consultations, day care and GP visits, corresponding to financial budgets and expenditures. Since 1990, research into the spread of HIV/AIDS in groups of intravenous drug users has increased the awareness of these type of costs (Rice et al., 1991 ). For example, an overview of hospital costing studies of HIV/AIDS was published in 1993 (Postma et al., 1993). In addition, quality standards for these type of costing studies were defined (Tolley and Gyldmark, 1993). As a next step, these studies have been used to assess and project national totals for the use of health-care resource and costs for HIV/AIDS (Rovira and Leidl, 1995; Postma et al., 1995; Kyriopoulos et al., 1992). Furthermore, in scenario analysis, the epidemiological and economic impact of different future courses of the epidemic and different treatment and prevention options are explored (Postma et al., 1993; Rovira and Leidl, 1995). Obviously, in the field of quantitative AIDS research and scenario analysis in particular, a set of new methods has been developed that might be applicable to problems of health-care costs of other drug-use-related infectious diseases (see Chapter 11). This chapter investigates this applicability, and reviews some previous and ongoing research into the health-care costing of drug-use-related diseases.
Chapter 11 also explains the basic framework for scenario analysis. The steps taken are: to construct a conceptual model; to go from a conceptual model to a mathematical model; to integrate into the model epidemiological and health-care information from a structured review; and to construct a reference and several alternative scenarios (Van Genügten et a!., 1996). Whereas for non-infectious diseases assessment of health-care burdens can sometimes do without an actual epidemiological model, the nature of infectious diseases necessitates the use of a sometimes complex mathematical model for the spread and progression of the disease (see Chapter 10). The methodological parts of this chapter focus on approaches for linking epidemiological models with healthcare information, preferably specified for drug users. To enable specific estimates for drug users, this chapter emphasises the need for patient-based data on health-care use. Several detailed examples are presented here, including one that addresses some of the problems that arise when different costing studies for one disease are reviewed and compared, focusing on hepatitis costs. A second example illustrates the use of patient-based data for estimating health-care impacts for drug users. The final example specifies the drug-use-related hospital care in the reference scenario for AIDS hospital care in EU countries (Postma et al., 1997).
Linking epidemiological models to health-care information
The objective of modelling the health-care impact of drug use is to assess current and project future health-care needs and financial requirements. The general design of the model links an epidemiological sub-model to formatted information on health-care needs. The epidemiological sub-model can be any type that assesses and projects the
206
CHAPTER 12
burden of disease at national or multinational (for example, EU) level. A common distinction in infectious-disease modelling is between population-dynamic models and empirical models (Bailey and Heisterkamp, 1995). Empirical models draw on surveillance data or counted new cases of a disease. Population-dynamic models explicitly incorporate some of the transmission dynamics of the infectious agent. To enable detailed country-specific impact assessments, the generalisability of the epidemiological model to various country contexts has become an important prerequisite. In particular, the model should enable the provision of standardised epidemiological information of comparable quality for all EU countries.
The format of the information on health-care needs should be in line with the type of output of the epidemiological model. The format of health-care-needs information will be addressed in the next section. Generally, the impact calculus is based on incidence or prevalence output figures. The methods are respectively labelled as incidence-based and prevalence-based (Hartunian and Smart, 1981). The first concerns accounting lifetime health-care resources to the year of incidence of disease. The second method concerns an annualisation of these lifetime health-care resources. To cover the full economic impact of a health-care measure, it is necessary to analyse the lifetime consequences for resource needs incurred by a representative case. This incidence-based approach does, however, assume that future health-care technologies will remain the same as in the analysis, and also extends all other assumptions up to the time until the last incident case has been dealt with. If the assumption of everything staying equal holds true for the period of analysis, and if the full economic impact is what is being referred to in a decision-making context (for example, in decisions on research budgets), the incidence-based approach is the more appropriate one. If, on the other hand, the budget impact of a health-care technology is the focus of analysis, and if this impact is expected to change with new treatment technologies, then the prevalence-based approach, applied over a well-defined period of time, will be the more appropriate approach. Obviously, the incidence- and prevalence-based approaches may differ when applied to the same epidemiological situation. Ideally, a modelling approach can deal with both incidence- and prevalence-based assessments.
Model development
Besides the availability of an appropriate epidemiological sub-model, a full model for the health-care impact of drug use requires a sound procedure for incorporating reliable estimates of health-care needs and costs. This procedure should take into account a disease-staging that distinguishes stages that differ significantly with respect to resource needs. Neglecting to take account of such stages can introduce serious biases in future projections, in particular in situations with non-stable epidemiology and changing treatment patterns (Postma et al., 1998). This staging may or may not overlap with clinically relevant stages. For example, for chronic diseases a useful staging has proved to be one that distinguishes a late or terminal phase from one or several other stages (Scitovsky, 1984). In particular, this concept has been of value in modelling the costs of a disease as clinically diverse and complex as HIV/AIDS. For a clinically clearer-cut disease progression, the use of a progression tree is a good alternative. Antoñanzas et
207
ECONOMIC MODELS
al. (1995) present a progression tree for the clinical evolution of hepatitis. Hepatitis infection has an acute symptomatic manifestation and may result in chronic carriership. The symptomatic form is often mild, but can be severe or fulminant in some cases with serious associated liver disease possibly requiring transplantation. The chronic carrier might develop active hepatitis, associated with cirrhosis, heptocellular carcinoma and again possibly requiring liver transplantation. In the next step, reliable parameter estimates for resource use and financial costs for the distinguished stages in the progression tree have to be specified.
In health economics, several classifications are used for expressing the consequences of disease on resource use and costs: direct versus indirect; patient-related versus general programme; and health-care versus non-health-care costs (Rovira, 1990). Direct costs arise from the treatment and care of patients in different health-care settings and from research, public-information, prevention and media campaigns. Indirect costs relate to production losses as a result of premature death (potential years of life lost or PYLL) or illness (sickness absence). Patient-related costs are directly associated with the individual person at a certain disease stage (Johnson, 1988). These costs comprise direct costs of treatment and care as well as indirect costs. General programme costs are the costs of research, prevention, public information and the maintenance of services for the benefit of the entire population. In particular, patient-related costs are very suitable for linking to epidemiology in an incidence- or prevalence-based assessment.
Drug use involves a range of clinical and public-health problems with alleged cost implications. Costing implications will vary from country to country and from healthcare sector to health-care sector. Drug-use-related disease, such as HIV/AIDS and hepatitis, involves hospital care, home care, medication, and so on. Furthermore, non-patient-related costs arise from providing information programmes for drug users, providing appropriate protection from infection for health-care workers, screening pregnant women for HIV and hepatitis, and screening and heat treating blood and blood products. Finally, mortality due to AIDS and hepatitis complications gives rise to life years lost and corresponding production losses. In this chapter, the main focus is on the patient-related direct costs of drug-use-related disease in the hospital sector.
As both HIV/AIDS and hepatitis involve serious complications and complex healthcare interventions that take place several years after the actual infection with the virus, the concept of discounting future costs is important. Discounting reflects a weighting procedure, where costs are weighted less the farther in the future they accrue. The discounting procedure reflects time preference: most people would rather get 100 Euros now than, for example, next year. First, 100 Euros acquired now can be invested and hence grow to an amount that is more than 100 Euros next year. Second, there is uncertainty with regard to future happenings, namely, will it be possible to benefit from the 100 Euros next year as now? There is widespread consensus among health economists on the discounting of costs (Drummond et al., 1987; Gold étal., 1996) and the rationale for the procedure can be found in the existence of 'time preference', opportunity cost of investment and economic growth. There is less agreement on the choice of the appropriate value of the discount rate, although it should clearly be related to the marginal rates of return on investment and market interest. Discount rates varying from
208
CHAPTER 12
zero to 20 % have been reported (Petrou et al., 1993). Furthermore, discounting should not be confused with correcting costs for inflation rates. In addition to discounting, costing studies should apply a deflator to express costs in different years in a currency of constant price level. It should be noted that there is less consensus on discounting health benefits, such as PYLL and quality-adjusted life years (Mooney and Olsen, 1994; Parsonage and Neuberger, 1992; Keeler and Scretin, 1983). A full discussion of the controversy is beyond the scope of this chpater, but the general recommendation is to include in the model calculation options with and without discounting future health benefits.
The reliability of the parameter estimates of the direct health-care costs depends on the quality and representativeness of the data that are used for estimation. Specific criteria for the data can refer to the number of patients in the database/costing study (also in relevant sub-groups, for example drug users), the number of health-care centres involved, their distribution throughout the country and a set up of the data-gathering allowing in-depth analysis for fine-tuning information to the epidemiological model's design. To enhance comparability of HIV/AIDS costing, a standardised approach has been developed (Tolley and Gyldmark, 1993; Tolley et al., 1998), identifying five specific fields for standardisation.
• First, information should be detectable from a sufficiently large patient sample size in the relevant disease stages and sufficient patient follow-up for recording resource use and costs to be ensured.
• To produce representative estimates for national and regional planning purposes a sufficient number of the main treatment sites covering the country/region needs to be included.
• It should be possible to break down aggregates so as to identify the contribution of different components in the care and cost totals.
• The possibility should be built in to produce homogeneous cost groups, for example using several classifications for HIV/AIDS as defined by the Centres for Disease Control in Atlanta, Georgia, the international classification of diseases (ICD) codes, the Turner stages (Turner et al., 1991 ) or specific disease-staging definitions, such as terminal/late versus chronic.
• Finally, a standardised methodology for approach and presentation should be followed to enable the effect of 'true factors' to be identified (differences in epidemics, health-care structure and practice, pricing structures and local health-care labour markets). The standardised approach is intended to provide guidelines in these five areas and could possibly serve as a clearing house for studies of resource use and costs for HIV/AIDS and other diseases, such as hepatitis.
209
ECONOMIC MODELS
Model applications
Reviewing costing studies
The standardised approach for costing studies is in essence a hierarchy of technical 'accounting' steps associated with estimating mean resource use and costs per person-year for disease stages, specific episodes and lifetime resources and costs. The accounting framework is based on a number of elements of standard economic costing practice, and can be applied to any disease. Five main standards were used to develop the approach.
• As a starting point, the perspective of the evaluation should be clarified, in other words, the hospital or the health-services planner at the national or multi-national (e.g. EU) level.
• Next, cost components and resource-use units should be identified according to the perspective adopted. The framework covers four standard cost components: inpatient; out-patient; day care (inpatient for several days with no overnight stay); and day case (admitted and discharged in one day). For specific purposes the last two or three components are taken together as day care and out-patient care respectively.
• To measure physical resource use, rigorous methods of study design and data collection are essential, such as a predominantly patient-based (bottom-up) assessment of resources.
• Resources should be valued using appropriate methods of unit-cost (or price) estimation that best reflect opportunity cost. Therefore, caution must be exercised in using health-service charges, tariffs or prices.
• Mean resource and cost estimates should be presented according to the decisionmaking context for which they areto be applied (total, disease-stage, clinical condition or transmission group such as drug users). Together, the accounting framework and the standard principles on which it is based, if adopted in new cost studies, should produce cost estimates that meet the normative criteria of good quality and comparability better than do previous studies.
The health-care impact of hepatitis has primarily been modelled for the purpose of evaluating the costs and benefits of vaccination programmes. Since both plasma-derived and recombinant-DNA-produced vaccines have become available, many studies in this field have been performed. In this framework several costing studies for hepatitis were conducted in the 1990s (Jefferson and Demicheli, 1994; Badia étal. , 1997). In general, concern has been expressed about the quality and comparability of such disease-specific health-care costing studies (Drummond et al., 1993). This concern is reinforced by Jefferson and Demicheli (1994) who indicate a wide range for direct health care (25th percentile US$ 650, 75th percentile US$ 3 768) and indirect costs (25th percentile US$ 14 164, 75th percentile US$ 127 592) in different hepatitis-costing studies. The high level of the indirect costs can be explained by the use of the human-capital method for valuing years of life lost to hepatitis. This section provides some of the costing details
210
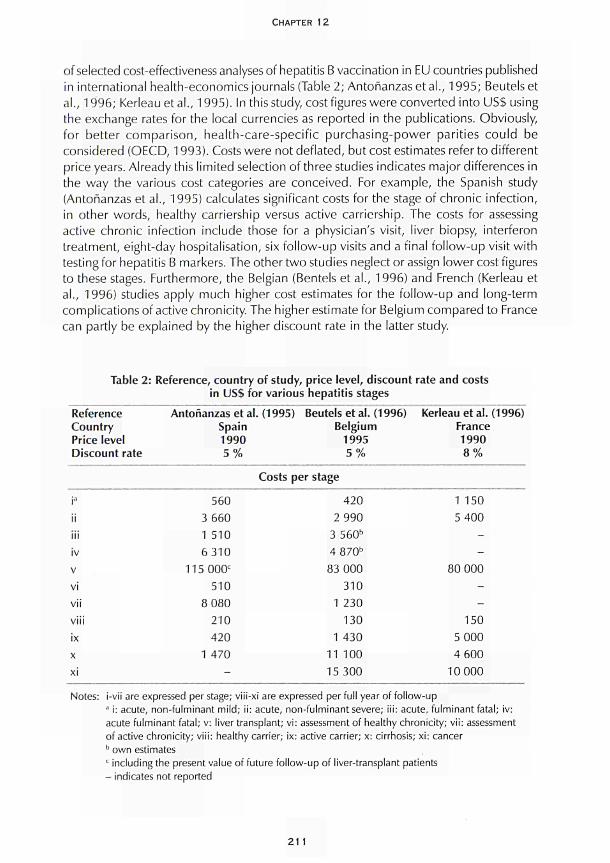
CHAPTER 12
of selected costeffectiveness analyses of hepatitis Β vaccination in EU countries published
in international healtheconomics journals (Table 2; Antoñanzas et al., 1995; Beutels et
al., 1996; Kerleau et al., 1995). In this study, cost figures were converted into US$ using
the exchange rates for the local currencies as reported in the publications. Obviously,
for better comparison, healthcarespecific purchasingpower parities could be
considered (OECD, 1993). Costs were not deflated, but cost estimates refer to different
price years. Already this limited selection of three studies indicates major differences in
the way the various cost categories are conceived. For example, the Spanish study
(Antoñanzas et al., 1995) calculates significant costs for the stage of chronic infection,
in other words, healthy carriership versus active carriership. The costs for assessing
active chronic infection include those for a physician's visit, liver biopsy, interferon
treatment, eightday hospitalisation, six followup visits and a final followup visit with
testing for hepatitis Β markers. The other two studies neglect or assign lower cost figures
to these stages. Furthermore, the Belgian (Bentels et al., 1996) and French (Kerleau et
al., 1996) studies apply much higher cost estimates for the followup and longterm
complications of active chronicity. The higher estimate for Belgium compared to France
can partly be explained by the higher discount rate in the latter study.
Table 2: Reference, country of study, price level, discount rate and costs
in US$ for various hepatitis stages
Reference
Country
Price level
Discount rate
Antoñanzas et al. (1995)
Spain
1990
5 %
Beutelsetal. (1996)
Belgium
1995
5 %
Kerleau et al. (1996)
France
1990
8 %
Costs per stage
ia
ii
iii
iv
ν
vi
vii
viii
ix
χ
xi
560
3 660
1 510
6310
115 000e
510
8 080
210
420
1 470
-
420
2 990
3 560b
4 870b
83 000
310
1 230
130
1 430
11 100
15 300
1 150
5 400
-
-
80 000
-
-
150
5 000
4 600
10 000
Notes: Ivü are expressed per stage; v¡üx¡ are expressed per full year of followup a ¡: acute, nonfulminant mild; ii: acute, nonfulminant severe; iii: acute, fulminant fatal; iv:
acute fulminant fatal; v: liver transplant; vi: assessment of healthy chronicity; vii: assessment
of active chronicity; viii: healthy carrier; ix: active carrier; x: cirrhosis; xi: cancer b own estimates
c including the present value of future followup of livertransplant patients
indicates not reported
21 1
ECONOMIC MODELS
A standardised approach to cost estimation would help explain such differences in cost
estimates, maximising the usefulness of the estimates for a range of policy purposes at
various decision-making levels. Obviously, there is a need for a standardised approach
to estimate the per-patient, per-stage and total costs of hepatitis treatment and care.
The development of this approach should follow principles outlined in earlier work on
costing standardisation of HIV/AIDS hospital care (Tolley and Gyldmark, 1993; Tolley
et al., 1998). Kerleau étal. (1995) pays special attention to hepatitis Β cost-effectiveness
for interventions among drug users. In particular, the authors estimate benefit-to-costs
ratios of 3.5 and 5.7 for respectively vaccinating all drug users and vaccinating only
those drug users found susceptible to hepatitis (after screening).
Selecting cost studies for scenario analysis
As mentioned above, the standardised approach to health-care costing has been applied
to HIV/AIDS. For the purpose of linking epidemiology and health care in future scenarios,
specific databases on AIDS hospital care in the EU have been selected. Three criteria
were applied. First, information should be recent (1990 or later), reflecting current
efficiency of practices in hospital care. During the 1980s and into the 1990s, efficiency
changed due to increasing experience with managing people with AIDS (PWAs).
Furthermore, resource use has been controlled by more (cost-)effective use; for example,
the substitution of less expensive out-patient care for hospital inpatient care. Second,
selected studies should include data that can be assumed to be representative of the
national situations. The representativeness was considered safeguarded in multi-centre
studies. Third, the resource-use data should be patient-based, enabling resource use to
be linked to individual patients, patient groups and disease stages, such as HIV infection
and specific opportunistic illnesses. Six studies - most of them designed as databases -
satisfied most of these criteria (individual studies are listed in Postma et al., 1997), and
are theoretically able to specify separate estimates for drug-use-related HIV/AIDS. In a
previous application no distinction between different risk groups was made (Postma et
al., 1997). For this chaper, it was possible to specify estimates for drug users from Dutch
(four hospitals) and Italian databases (ten hospitals).
It is well known that hospital-resource needs incurred by AIDS vary in the different
stages of the disease. In particular, the terminal phase of AIDS entails a relatively high
intensity of resource needs and costs. Therefore, two stages are differentiated for PWAs:
a final stage of six months (maximum) before death (late stage: LS); and a stage for the
foregoing period (chronic stage: CS). It has been argued that neglecting this concept
threatens the validity and comparability of estimates derived from different studies of
use and introduces significant biases in consequent future projections (Postma et al.,
1998). Applying the staging concept to Greece, Spain, France, Italy, the Netherlands
and the UK has shown that per-person-year (ppy) inpatient days in LS are at least twice
those in CS. For example, in Italy and the Netherlands ppy inpatient days in LS are,
respectively, 60 and 80, whereas the respective CS figures are 24 and 33 inpatient
days.
212
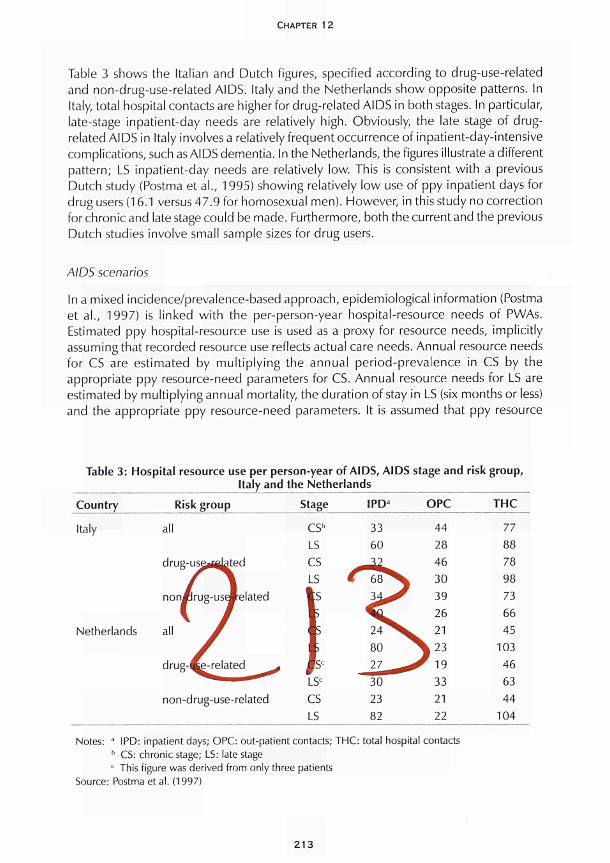
CHAPTER 12
Table 3 shows the Italian and Dutch figures, specified according to drug-use-related
and non-drug-use-related AIDS. Italy and the Netherlands show opposite patterns. In
Italy, total hospital contacts are higher for drug-related AIDS in both stages. In particular,
late-stage inpatient-day needs are relatively high. Obviously, the late stage of drug-
related AIDS in Italy involves a relatively frequent occurrence of inpatient-day-intensive
complications, such as AIDS dementia. In the Netherlands, the figures illustrate a different
pattern; LS inpatient-day needs are relatively low. This is consistent with a previous
Dutch study (Postma et al., 1995) showing relatively low use of ppy inpatient days for
drug users (16.1 versus 47.9 for homosexual men). However, in this study no correction
for chronic and late stage could be made. Furthermore, both the current and the previous
Dutch studies involve small sample sizes for drug users.
AIDS scenarios
In a mixed ¡ncidence/prevalence-based approach, epidemiological information (Postma
et al., 1997) is linked with the per-person-year hospital-resource needs of PWAs.
Estimated ppy hospital-resource use is used as a proxy for resource needs, implicitly
assuming that recorded resource use reflects actual care needs. Annual resource needs
for CS are estimated by multiplying the annual period-prevalence in CS by the
appropriate ppy resource-need parameters for CS. Annual resource needs for LS are
estimated by multiplying annual mortality, the duration of stay in LS (six months or less)
and the appropriate ppy resource-need parameters. It is assumed that ppy resource
Table 3: Hospital resource use per person-year of AIDS, A IDS stage and risk group,
Italy and the Netherlands
Country
Italy
Nether lands
Risk group
all
drug-use^lated
χ^^\ noni l rug-useJre la ted
all β
y drug-Ce- re la ted ^ *
^ ^ ■ * ^
non-drug-use-related
Stage
CS1'
LS
CS
LS
I r (r r LS
C
es LS
IPDa
33
60
€ 68^^ 3 ^ ^
24^S 80
27 ^
30
23
82
OPC
44
28
46
1 30
39
26
W 21
^ 2 3
^ 1 9
33
21
22
THC
77
88
78
98
73
66
45
103
46
63
44
104
Notes: ' IPD: inpatient days; OPC: out-patient contacts; THC: total hospital contacts b CS: chronic stage; LS: late stage
c This figure was derived from only three patients
Source: Postma et al. (1997)
213
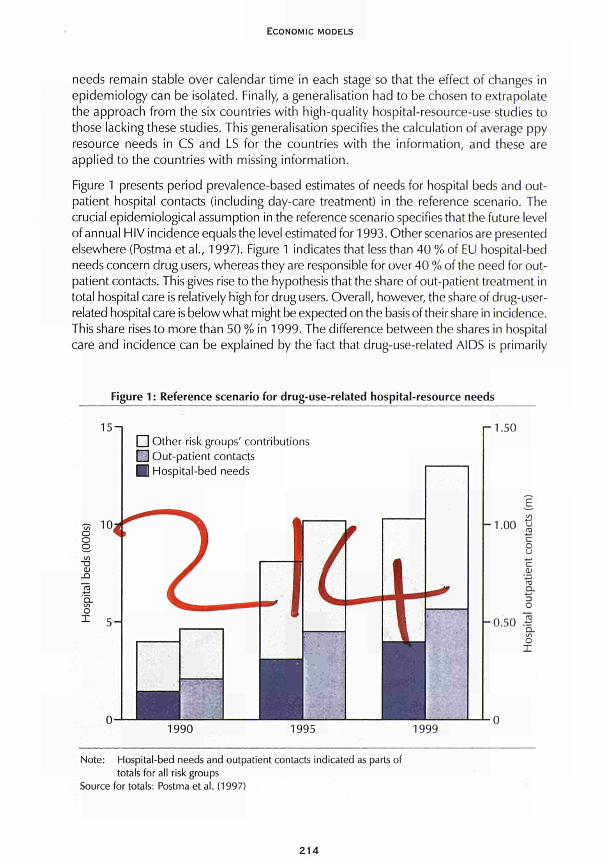
E C O N O M I C M O D E L S
needs remain stable over calendar time in each stage so that the effect of changes in epidemiology can be isolated. Finally, a generalisation had to be chosen to extrapolate the approach from the six countries with high-quality hospital-resource-use studies to those lacking these studies. This generalisation specifies the calculation of average ppy resource needs in CS and LS for the countries with the information, and these are applied to the countries with missing information.
Figure 1 presents period prevalence-based estimates of needs for hospital beds and outpatient hospital contacts (including day-care treatment) in the reference scenario. The crucial epidemiological assumption in the reference scenario specifies that the future level of annual HIV incidence equals the level estimated for 1993. Other scenarios are presented elsewhere (Postma et al., 1997). Figure 1 indicates that less than 40 % of EU hospital-bed needs concern drug users, whereas they are responsible for over 40 % of the need for outpatient contacts. This gives rise to the hypothesis that the share of out-patient treatment in total hospital care is relatively high for drug users. Overall, however, the share of drug-user-related hospital care is below what might be expected on the basis of their share in incidence. This share rises to more than 50 % in 1999. The difference between the shares in hospital care and incidence can be explained by the fact that drug-use-related AIDS is primarily
Figure 1: Reference scenario for drug-use-related hospital-resource needs
15-1 Γ 1.50
^r 10
1990 1995 1999
Note: Hospital-bed needs and outpatient contacts indicated as parts of totals for all risk groups
Source for totals: Postma et al. (1997)
214
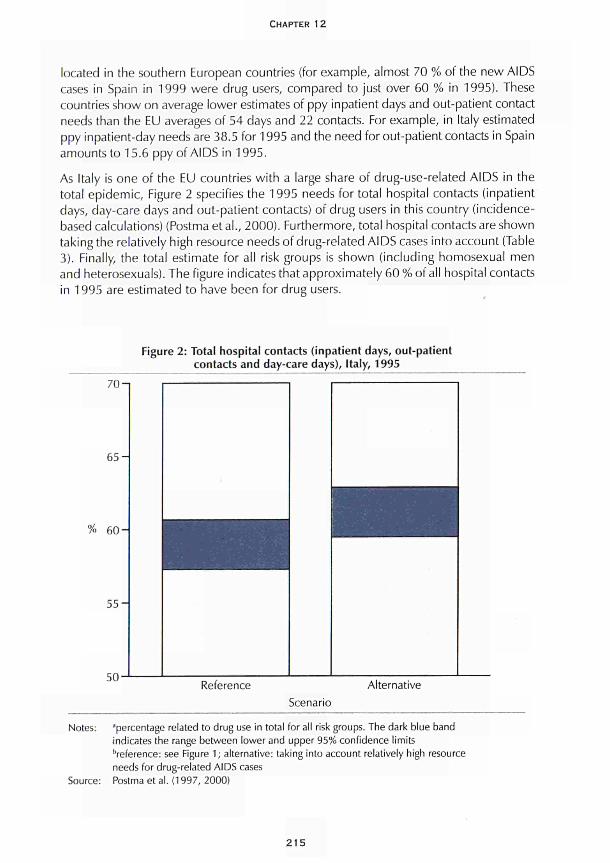
CHAPTER 12
located in the southern European countries (for example, almost 70 % of the new AIDS
cases in Spain in 1999 were drug users, compared to just over 60 % in 1995). These
countries show on average lower estimates of ppy inpatient days and out-patient contact
needs than the EU averages of 54 days and 22 contacts. For example, in Italy estimated
ppy inpatient-day needs are 38.5 for 1995 and the need for out-patient contacts in Spain
amounts to 15.6 ppy of AIDS in 1995.
As Italy is one of the EU countries with a large share of drug-use-related AIDS in the
total epidemic, Figure 2 specifies the 1995 needs for total hospital contacts (inpatient
days, day-care days and out-patient contacts) of drug users in this country (incidence-
based calculations) (Postma et al., 2000). Furthermore, total hospital contacts are shown
taking the relatively high resource needs of drug-related AIDS cases into account (Table
3). Finally, the total estimate for all risk groups is shown (including homosexual men
and heterosexuals). The figure indicates that approximately 60% of all hospital contacts
in 1995 are estimated to have been for drug users.
Figure 2: Total hospital contacts (inpatient days, out-patient
contacts and day-care days), Italy, 1995
70-1
6 5 -
% 6 0 -
5 5 -
50-Reference Alternative
Scenario
Notes: ■'percentage related to drug use in total for all risk groups. The dark blue band
indicates the range between lower and upper 95% confidence limits
•■reference: see Figure 1 ; alternative: taking into account relatively high resource
needs for drug-related AIDS cases
Source: Postma et al. (1997, 2000)
215
ECONOMIC MODELS
Critical assessment of models
Obviously, this type of costing analysis requires a rather detailed patient-based registration that is ideally set up to provide information for cost-of-illness and future projections. Furthermore, the type of information required can only be retrieved from bottom-up, patient-based data on health-care resource use and costs in cases of time-related staging of disease with documentation over the full life span of a specific patient. This detailed information enables estimates to be provided of drug-use-related disease in the present and in future projections to support health-policy decisions. They provide a quantitative order of magnitude for health-care resources in this area. They specify the patient mix, for example in terms of drug user versus non-drug user and chronic versus late, which are important indicators for planning hospital staff, capacity and support.
A standardised approach to costing health care has helped in designing bottom-up, patient-based costing studies for HIV/AIDS that can render the appropriate information. If such an approach is followed, the information that is necessary for cost assessment and projection is identifiable. Further application of the standardised approach could involve the examination of local, national and multinational variations in cost estimates for drug-use-related diseases such as HIV/AIDS and hepatitis. If bias due to methodological differences is minimised, cost variations due to differences in clinical practice, health-care structure and organisation and epidemiology can be more readily identified. In addition, the standards should improve investigation of resource-use variations over time in one or more sites. Furthermore, detailed analysis in specific areas of treatment and care could facilitate investigation of the cost-effectiveness of alternative policy and care options in these areas (for example, screening for HIV and hepatitis, HIV combination triple therapy and hepatitis vaccination). Finally, the standardised approach could provide a starting point for further development to cover non-hospital care and social care.
The focus of the models and model applications discussed above is mainly on the direct health-care costs. One study attempts to estimate the indirect costs of drug use (French et al., 1996). Using a quality-adjusted life-year methodology (French et al., 1992), the value of avoiding drug-use-related morbidity and mortality is estimated. As a common unit of well-being applicable to all illnesses and diseases, quality-adjusted life years are calculated using the Rosser/Kind index (Rosser and Kind, 1978). The Rosser/Kind index uses eight disability levels and four distress levels to define 29 health states. Perfect health corresponds to a value of 1, death corresponds to a value of 0. For example, a moderately acute case of hepatitis Β corresponds to a value of 0.956 (severe social and slight work disabilities and moderate distress). These life years are valued by means of the 'US dollar value' for human life. In this particular case, a 'dollar value' of human life of US $5 million is applied (Viscusi, 1993). Different from the human capital method that only values the present value of future earnings, the value of pain and suffering is included in the calculations. For example, the dollar values for AIDS, severe hypertension and ten weeks of severe pneumonia are estimated at respectively US $115 000, US $75 000 and US $58 000 (Viscusi, 1993). The total lifetime value for HIV/AIDS amounts to US $158 000 (including pre-AIDS stages). Furthermore, including mortality costs, the estimated full dollar value of avoiding a single case of HIV equals
216
CHAPTER 12
US $2 655 000. For comparison, lifetime health-care costs for HIV/AIDS in the United States have been estimated at US $119 000 (Hellinger, 1993), which obviously only reflects a small part of all the costs of a drug-related HIV/AIDS case.
Costing impact by scenario analysis as outlined above represents an exercise that should potentially underpin health-care policy for drug users. However, due to differences in patient group, type of hospital care provided, and stage of disease dealt with, the quantification of current and future costing impact is quite a complex task. By integrating recent and detailed data, important steps can be made in improving the current state of information. Nonetheless, uncertainty will remain, leaving issues of availability of representative data on drug-use-related health-care costs, impact on non-hospital care sectors and dynamic integration of treatment technology for future work. In the short term, however, an indication of the order of magnitude of the impact of drug-use-related disease on EU health-care systems can be provided, probably indicating that drug use should be an important issue on the agendas of health-care policy-makers in the coming years.
Conclusions
Essentially, this chapter argues that future costing scenarios for drug-use-related healthcare costs can be built by applying sound costing principles and by standardised epidemiological modelling using relevant disease-staging.
As a first step, standardised gathering of health-care and costing information is crucial. This involves applying classifications of health-care costs, breaking down aggregate cost figures in line with conceptual models of the disease and recalculations for standard discount rates, price levels and currencies. It is therefore recommended that the standardisation of costing data collection as developed for HIV/AIDS is extended to other drug-related diseases, in other words hepatitis as the next step.
For hepatitis, this chapter summarises some of the work that has been undertaken on costing the disease, in particular regarding the framework of cost-effectiveness analyses of vaccination strategies. As a logical start, it is recommended that existing databases for hepatitis care and costing be reviewed, in particular their appropriateness for application in drug-use-related costing scenarios should be evaluated. For example, the French AIDS-care database (Postma et al., 1997) includes hepatitis care, and could potentially be used for French drug-use-related hepatitis costs.
Future scenario analysis of health-care and costing impacts requires the application of epidemiological models - primarily of infectious diseases - in combination with health-economic information as indicated above. An appropriate choice for disease staging is important to avert structural biases in health-care needs assessments and projections. This has been argued for HIV/AIDS above, and has recently been illustrated for chronic diseases as well (Postma et al., 1998). In combination with major differences in resource needs and associated costs between these stages, epidemiological dynamics have major implications for resource needs and costs. In consequence, any application of costing approaches and scenario analysis should control for this disease staging. Again, it is
217
ECONOMIC MODELS
recommended to extend methods developed for HIV/AIDS in particular the disease
staging approach to other druguserelated disease costing (Postma, 1998).
Furthermore, this chapter illustrates that detailed information on druguserelated health
care needs and costs for HIV/AIDS is potentially available by citing some detailed
information for druguserelated AIDS in Italy and the Netherlands. It is recommended
that for other countries the acquisition of this type of information be pursued. For
example, Spanish, English and French AIDScare databases (Postma et al., 1997) allow
the extraction of this information. This information will enable the estimation of drug
userelated healthcare costs in the EU at present and in future scenarios. As a result it
is recommended that ultimately future costing scenarios are developed for all relevant
druguserelated diseases.
Acknowledgement
The authors would like to thank A. M. Tramarin and M. G. W. Dijkgraaf for kindly
providing the databases on druguserelated hospital care for AIDS in, respectively,
Italy and the Netherlands.
References
Antoñanzas, F., Caruz, R., Rovira, J., Antón, F., Trinxet, C, Navas, E., Salleras, L. (1995). 'Cost
effectiveness analysis of hepatitis B vaccination strategies in Catalonia, Spain'. Pharmacoeconomics
7: 42843.
Badia, X., Nocea, C , Rovira, J. (1997). 'Differences in the methodology and data of economic
evaluations of a health programme; the case of hepatitis B vaccination programmes in Spain'.
Pharmacoeconomics 2: 17583.
Bailey, N. T J., Heisterkamp, S. H. (eds) (1995). Preliminary review on the mathematical models
and data used for the baseline analysis. Bilthoven: National Institute of Public Health and the
Environment (RIVM).
Beutels, R, Tormans, G., van Damme, R, van Doorslaer, E. (1996). 'Algemene vaccinatie tegen
hepatitis B in Vlaanderen: kosteneffectief?' Tijdschrift voor Sociale Gezondheidszorg 74:
27281.
Dinwiddie, S. H., Reich, T., Cloninger, C. R. (1992). 'Psychiatric comorbidity and suicidality
among intravenous drug users'. Journal of Clinical Psychiatry 53: 364.
Drummond, M. F., Brandt, Α., Luce, Β., Rovira, J. (1993). 'Standardising economic evaluation
methodologies in health care: practice, problems and potential'. International Journal of Technology
Assessment in Health Care 1: 2636.
Drummond, M. F., Stoddart, G. L., Torrance, G. W. (1987). Methods for economic evaluation of
health care programmes. Oxford: Oxford University Press.
European Centre for the Epidemiological Monitoring of AIDS (1994). AIDS surveillance in the
European Community and COST countries. Quarterly Report 29. Paris: European Centre for the
Epidemiological Monitoring of AIDS.
218
CHAPTER 12
French, M. T., Mauskopf, J. Α. (1992). 'A qualityoflife method for estimating the value of avoided
morbidity'. American Journal of Public Health 82: 1553.
French, M. T., Mauskopf, J. Α., Teague, J. L., Roland, E. J. (1996). 'Estimating the dollar value of
health outcomes from drugabuse interventions'. Medical Care 34 (9): 890910.
Cold, M. R., Siegel, J. E., Russel, L. B., Weinstein, M. C. (1996). Cost-effectiveness in health and
medicine. New York: Oxford University Press.
Hartunian, N. S., Smart, C. N. (1981). The incidence and economic costs of major health
impairments. Washington DC: National Academy Press.
Haverkos, H. W , Lange, R. W. (1990). 'Serious infections other than human immunodeficiency
virus among intravenous drug abusers'. Journal of Infectious Diseases 161: 894.
Hellinger, F. (1993). 'The lifetime cost of treating a person with HIV'. Journal of the American
Medical Association 270: 474.
Jefferson, T., Demicheli, V. (1994). 'Is vaccination against hepatitis B efficient? A review of world
literature'. Health Economics 3: 2537.
Johnson, A. M. (1988). 'Economic aspects of care and prevention of HIV infection and AIDS', in
Jager, J. C , Ruitenberg, E.J. (eds) Statistical analysis and mathematical modelling ofAIDS. Oxford:
Oxford University Press.
Kaku, D. Α., Lowenstein, D. H. (1990). 'Emergence of recreational drug abuse as a major risk
factor for stroke in young adults'. Annals of Internal Medicine 113: 821.
Keeler, E. B., Scretin, S. (1983). 'Discounting of lifesaving and other nonmonetary effects'.
Management Science 29: 3006.
Kerleau, M., Flori, Υ. Α., Nalpas, B., Lanoé, J. L., Berthelot, R, FardeauGautier, M. (1995). 'Analyse
coûtavantage d'une polit ique de prévention vaccinale de l'hépatite virale B'. Revue
d'Epidémiologie et de Santé Publique 43: 4860.
Kyriopoulos, J., Georgoussi, E., Gennimata, D., Niakas, D., Skoutelis, G. (1992). 'AIDS cost in
Greece; 19891993 macroeconomic approach and estimations'. Health Review 4: 358.
Mooney, G., Olson, J. A. (1994). 'QALYs: where next?' in McGuire, Α., Fenn, R, Meyhew, K. (eds)
Providing health care. Oxford: Oxford University Press, 12040.
Organisation for Economic Cooperation and Development (OECD) (1993). OECD health systems.
Paris: OECD.
Parsonage, M., Neuberger, H. (1992). 'Discounting and health benefits'. Health Economics 1 :
716.
Petrou, S., Malek, M., Davey, R G. (1993). 'The reliability of costutility estimates in costper
QALY league tables'. Pharmacoeconomics 3: 34553.
Postma, M. J. (1998). Assessment of the economic impact of AIDS at national and multi-national
level. Zutphen: Koninklyke Wöhrmann bu.
Postma, M. J., Kornarou, H., Paparizos, V, Leidl, R. M., Tolley, K., Kyriopoulos, J., Jager, J. C
(2000). 'Hospital care for persons with AIDS in European Union countries; a crosscountry
comparison'. Health Care Management Science 3: 17.
219

ECONOMIC MODELS
Postma, M. J., Jager, J. C , Ruwaard, D., van Loy, N. C. M., Leidl, R. M. (1998). 'Diseasestaging
for modelling current and future healthcare impact of disease: illustrations for diabetes and
AIDS'. Health Policy 43: 4554.
Postma, M. J., Tolley, K., Leidl, R. M., Downs, A. M., Beck, E. J., Tramarin, A. M., Flori, Υ. Α.,
Santin, M., Antoñanzas, F., Kornarou, H., Paparizos, V. C. C , Dijkgraaf, M. G. W., Borleffs, J.,
Luijben, A. J. R, Jager, J. C. for the European research team on AIDS scenarios (1997). 'Hospital
care for persons with AIDS in the European Union'. Health Policy 41 : 1 5776.
Postma, M. J„ Jager, J. C , Dijkgraaf, M. C. W , Borleffs, J. C. C , Tolley, K., Leidl, R. M. (1995).
'AIDS scenarios for the Netherlands: the economic impact on hospitals'. HealÜi Policy 31:1 27
50.
Postma, M. J., Leidl, R. M., Downs, A. M., Rovira, j . , Tolley, K., Gyldmark, M., lager, J. C. (1993).
'Economic impact of the AIDS epidemic in the European Community: towards multinational
scenarios on hospital care and costs'. AIDS 7 (5): 4153.
Rice, D. R, Kelman, S., Miller, L. S. (1991 ). 'Costs of alcohol and drug abuse and mental illness,
198588'. Public Health Reports 106: 28092.
Rosser, R., Kind, R (1978). 'A scale of valuations for status of illness: is there a social consensus?'
International journal of Epidemiology 7: 347.
Rovira, J. (1990). 'Economic aspects of AIDS', in Schwefel, D., Leidl, R., Rovira, J., Drummond,
M. F. (eds) Economic aspects of AIDS and HIV infection. Berlin: SpringerVerlag.
Rovira, J., Leidl, R. (1995). 'Projecting individual healthcare costs of HIV/AIDS patients in Catalonia',
in Fitzsimons, D., Hardy, V, Tolley, K. (eds) The economic and social impact of AIDS in Europe.
London: Cassell.
Schlenger, W E., Kroutil, L. Α., Roland, E. J., Dennis, M. L. (1992). National evaluation of models
for linking drug abuse treatment and primary care: descriptive report of phase one findings. Rockville
MD: National Institute on Drug Abuse.
Scitovsky, A. A. (1984). "The high costs of dying": what do the data show?' Milbank Quarterly
62: 591608.
Tolley, K., Gyldmark, M. (1993). 'The treatment and care costs of people with HIV infection or
AIDS: development of a standardised cost framework for Europe'. Health Policy 24: 5570.
Tolley, K., Postma, M. J., Jager, J. C , Good, M. A. (1998). 'Standardised costing framework for
HIV/AIDS hospital care in the European Union', in Kyriopoulos, J., et al. (eds) AIDS cost analysis
and patient classification. Athens: Exandax, 3751.
Turner, B. J., Markson, L. E., McKee, L., Houchens, R., Fanning, T. (1991). 'The AIDSdefining
diagnosis and subsequent complications: a survivalbased severity index'. Journal of Acquired
Immune Deficiency Syndromes 4: 105971.
UmbrichtSchneiter, Α., Ginn, D. Η., Pabst, Κ. M., Bigelow, G. Ε. (1994). 'Providing medical care
to methadone clinic patients: referral vs onsite care'. American Journal oí Public Health 84: 207.
Van Genügten, M. L. L., Rutten, F. F. H., Jager, J. C. (1996). Scenario development and costing in
health care: methodological accomplishments and practical guidelines. Utrecht: International
Books.
Viscusi, W K. (1993). 'The value of risks to life and health'. Journal of Economic Literature 32:
1912.
220
CHAPTER 13
ECONOMIC MARKET MODELS
Matthew Sutton
Economists study behaviour in terms of markets or trading situations. In general, that study is divided between the analysis of demand or consumer behaviour and that of supply or producer and distributor behaviour. A fundamental distinction in the economics literature is the level of analysis. There are broadly three levels of analysis:
• picoeconomics: the study of behaviour within individuals (often across time); • microeconomics: the study of behaviour across individuals within areas (or markets); • macroeconomics: the study of behaviour across areas (or markets).
An interestin the dynamics of consumption suggests that picoeconomic analysis would be particularly pertinent in the case of illicit drugs, and much of the economic literature on addictive substances concerns picoeconomic relationships. However, whilst theoretical developments in the economics of addiction (and demand for addictive substances) have been more extensive at the picoeconomic level, it is macroeconomic outcomes which command the most policy attention. Much of the existing data on market outcomes and prices/purities are at the aggregate market level (e.g. Pompidou Group, 1994). The lack of conceptual guidance at this level tends to make interpretation of trends in these data precarious and the evaluation of policy interventions rather depressing (Caulkins and Reuter, 1996; Weatherburn and Lind, 1997).
One of the central premises of economics is that market prices will change to ensure that the supply of, and demand for, commodities reaches equilibrium. Therefore, much applied work in economics focuses on the relationship between quantities traded and market prices. The other fundamental lesson from economics is that choices are made within a budget constraint and therefore income levels will affect quantities purchased in the market.
Economic-market models can be used to generate estimates of the determinants of dynamic patterns of drug prevalence/incidence. There are very few applications of these models either within or outside Europe. The demand-side aspects of the models are based on theoretical models of individual behaviour which easily incorporate contextual/environmental factors. However, preferences play a major role in the determination of demand and there has been relatively little economic work on the formation of preferences.
221
ECONOMIC MODELS
The supply side of drug markets is known to vary substantially between areas, even within countries. It would therefore be difficult to extrapolate results to other areas (particularly between.the United States and Europe) because of the differences in the supply sides of markets. A study of how drug markets are formed and how their structure develops would aid the generalisability of any economic-market applications.
Economic-market models require good-quality data on levels of consumption or expenditure, prices, purities and total income. The analysis can either be at individual or market level. At individual level, there are considerable problems in the collection of consumption data, and measures of market prices and purities may have little explanatory power for individual outcomes because of wide variability between individuals in prices paid and purities received. Moreover, recent developments in dynamic modelling of individual consumption require panel data on quantities consumed and/or prices paid. Despite the obvious difficulty with the feasibility of such data collection, recent attempts to collect economic data at individual level are encouraging.
At a market level, the vast majority of economic data are derived from enforcement-agency reports. Price data often rely on reports from undercover buys and purities relate to drugs seized. Neither data source has been established to be representative. Moreover, the problems with inferences about levels of consumption based on 'market indicators' such as seizures, drug-related deaths or registrations for treatment are well known. Based on such data, applied studies have found little link between economic factors, enforcement activity and market outcomes.
This chapter contains an overview of the existing theoretical and applied economic analysis of drug markets. Available studies on demand are considered, followed by a limited analysis of the supply side of the market, a review of addiction models and finally some comments on market equilibrium. Some conclusions are drawn on the feasibility of further research across Europe.
Analysis of the demand for drugs
The extent to which demands respond to changes in price and income are termed the price elasticity and income elasticity of demand, respectively. The majority of applied-economics work on addictive substances therefore attempts to estimate price and income elasticities (Leung and Phelps, 1993; Godfrey, 1994). The study of illicit drugs has focused to a greater degree on the price elasticity of demand, and particularly on the way in which addiction may influence the nature of the relationship between prices and demand (Wagstaff and Maynard, 1988; Beckeretal., 1992).
However, there is more to economic models of demand and supply than price analysis and it is important to remember that the traditional study of market equilibrium (the downward-sloping demand curve and upward-sloping supply curve) is based on the ceteris paribus assumption (everything else held constant). Before reviewing the literature on price effects, a summary of economic work on the other determinants of demand and supply will be presented. Throughout the review, reference is made to applications of new models to the analysis of tobacco and alcohol consumption. Whilst simple
222
CHAPTER 13
extrapolation of these results to the consumption of illicit drugs is not appropriate, these studies demonstrate the potential for economic methods. Fuller reviews of the economic literature on addictive goods can be found in Godfrey (1994), Leung and Phelps (1993) and Buck et al. (1996).
Non-price determinants of demand
Various drug-using behaviours have been analysed in demand studies. For the consumption of legal addictive substances, applied-economic analyses have focused on the separation of decisions about whether to consume and, given the choice to consume, how much to consume (Atkinson et al., 1984; Jones, 1989). At the macro level, this can be analysed as the percentage of individuals participating in the market and the total level of consumption Cones, 1989). More recently, Jones (1995) has focused on the determinants of the decision to quit smoking. He finds that individuals with higher potential benefits from quitting (i.e. heavier consumers) are more likely to attempt to quit.
Analyses of the consumption of health-damaging commodities should be set within the context of individuals' decisions about their level of health (Birch and Stoddart, 1990). Grossman's (1972) model of individual health production dominated the early economic literature on individuals' choices about health and lifestyles. Grossman conceptualised health as being a stock variable which depreciates through time and can be replenished with health investments. Inputs into the health-production process include medical care and lifestyle variables, such as exercise and consumption of health-affecting commodities, for example, food and addictive substances. Grossman suggested that individuals with a higher level of education would have better knowledge of the production process and would therefore make more appropriate decisions about health inputs. Education may also affect individuals' knowledge of the health risks of addictive goods. Viscusi's (1992) empirical results suggest that, if anything, smokers overestimate the risks posed to their health by smoking. Viscusi's results have been challenged by Schoenbaum (1997), who found that heavysmokers, in particular, underestimated the risks they were taking with their future health.
Differences in levels of demand between individuals which cannot be explained by these factors are often attributed to differences in preferences. Despite the importance of such considerations, there has been relatively little focus within economics on the ways in which such preferences are formed (Pollak, 1976). Within the study of health-damaging and addictive goods there are some notable exceptions. There has been interest in the effect of habit formation on intertemporal consumption patterns (Alessie and Kapteyn, 1991 ) and the development of rational addiction models can be seen as a refinement of this broad approach (Becker and Murphy, 1988). Moreover, in the addiction area, there have been developments in the ways in which time preference is formed and manipulated (Becker and Mulligan, 1993). Finally, the effects of peer behaviour on consumption patterns have also received prominence in the area of addiction (Norton et al., 1997). Each of these three developments will be discussed in turn.
223
ECONOMIC MODELS
Habit formation
Becker and Murphy (1988), for example, propose a theoretical model of addiction which emphasises the time-dependence of consumption levels. Previous theories had incorporated the effect of previous consumption on current consumption, but Becker and Murphy's theory predicted that individuals would be rational, in the sense that they would consider the consequences of current consumption decisions on future time periods. Becker and Murphy's model of rational addiction has been applied to US cocaine-consumption data by Grossman and Chaloupka (1998). Despite the limitations of the data set and the way in which the consumption-level data were collected, Grossman and Chaloupka did find some evidence to support Becker and Murphy's predictions.
Time preference
One of the other central areas of interest in economics has been the way in which individuals discount future occurrences (Buck et al., 1996). Many theoretical models of dynamic behaviour have been based on stable models of intertemporal behaviour (such as constant exponential discounting). Differences in time preference between individuals was one of the main explanations given by Becker and Murphy (1988) for why some individuals would begin an addiction career whilst others would not. Bretteville-Jensen (1997), however, presents empirical estimates of the time preferences of current users, ex-users and never-users. Her results do not suggest that ever-users (i.e. current and ex-users) have systematically different (higher) time-discount rates. An alternative explanation for why current users do display higher time-preference rates as expected, but that ex-users have similar rates to never-users, is that of endogenous time-preference (Becker and Mulligan, 1993). If consumption of certain commodities (such as addictive goods) influences an individual's valuation of the future, drug users may be expected to have shorter planning horizons.
Peer effects
Most economic applications have included peer behaviour as an exogenous determinant of individual behaviour (Lewit et al., 1981; Jones, 1995; Sutton and Godfrey, 1995). Manski (1993) distinguishes between three different causal mechanisms which would give rise to similar patterns of behaviour within groups. Correlated effects arise when individuals form groups on the basis of common characteristics or attitudes. Exogenous effects relate to environmental or group factors which have a common effect on members of the same group. Endogenous effects, on the other hand, pertain to situations in which one individual's behaviour has a direct causal influence on the behaviours of others within the same group. It is only this latter effect which gives rise to the social multiplier which lies behind much of the policy concern with peer effects on behaviour.
Having distinguished between these three types of effect, Manski (1993) demonstrates the difficulty of separating out these effects in cross-sectional data. Rice and Sutton (1997) categorise various economic theories of why individuals' preferences and
224
CHAPTER 13
behaviours tend to conform in terms of whether they describe endogenous, exogenous or correlated effects. They apply Manski's (1993) framework to the analysis of alcohol-consumption patterns within households and find significant evidence of correlated (or group-selection) effects. They also find evidence of endogenous and/or exogenous effects within households, but are unable to distinguish between them. In a US setting, Norton et al. (1997) find no evidence of correlated effects in groups defined by school attendance.
Analysis of the supply side of the market
Applied analyses of the supply side of illicit drug markets have been almost exclusively linked to the effectiveness of enforcement interventions in the market. Grizzle (1979) did find some evidence of the effectiveness of enforcement. Weatherburn and Lind (1997) attempted to link enforcement activity with market outcomes. They correlated levels of enforcement seizures with price data in the Sydney heroin market. Allowing for time lags between seizures and market outcomes, they found no evidence of an effect of enforcement on market conditions. Apart from being rather depressing for enforcement agencies, it is rather unclear what can be done with these findings. It could be, of course, that the results are a consequence of the data-collection procedure (i.e. enforcement is effective but its effectiveness was not measured) or the level of aggregation at which the analysis was performed (i.e. enforcement is effective but its effectiveness is unmeasurable at this level). More importantly, however, if the results are to be trusted, the study gives no guidance as to why enforcement is not effective at the margin. This would require a more detailed understanding of the operation of the supply side of the market.
Wagstaff and Maynard (1988) illustrated the potential effectiveness of enforcement activity in the UK heroin market using Lewis et al.'s (1985) description of the structure of the London heroin market and Polich et al.'s (1984) model of the way in which enforcement activity impacts on the market. There were no real estimates available of the important parameters in the model and therefore the study became a way to generate data demands rather than an applied study of the effectiveness of enforcement. Subsequent studies in the US and the UK (Cave and Reuter, 1988; Crawford et al., 1988; Rydell and Everingham, 1994; Sutton and Maynard, 1994) suffer from similar requirements to base effectiveness estimates on a number of parameter assumptions.
Other studies of the supply side of the market have been broadly descriptive. Dorn et al. (1992), for example, provide a taxonomy of supply organisations which is impossible to operationalise in an economic model of the market. Chatterton et al. (1995) set out to characterise existing descriptions of trading organisations along a number of dimensions. An attempt was made to develop measures for some of these dimensions and to pilot data collection. Based on self-completion questionnaires from individuals attending treatment, an idea of the relative importance of different geographical market areas was sought. Respondents were also asked about the nature of trading relationships between themselves and the next level up in the supply chain. The vast majority of respondents reported using the same dealer either always or usually. Such a pilot exercise
225
ECONOMIC MODELS
indicates that at least at the lowest level, collection of quantitative data on market structure is feasible, although no tests of validity, reliability or representativeness were attempted.
Addiction and the effect of price on demand
Wagstaff and Maynard (1988) reviewed the pre-rational-addiction literature on models of the effect of addiction on the price elasticity of demand for addictive goods. In the late 1960s and early 1970s, it was widely believed that demand curves for addictive goods were perfectly inelastic, in other words that the quantity demanded by an individual did not respond in any way to changes in price.
However, later additions to the debate proposed a range of options that were available to drug users in the face of changes (particularly increases) in price: switching to close substitutes; entry into treatment; quitting drug use altogether; or reducing consumption through decreasing frequency of use and tolerating withdrawal effects (Holahan, 1973; Bernard, 1983). Blair and Vogel (1983) suggested that demand may be responsive to price at low prices, but that once addicted individuals had reduced their consumption to maintenance doses, further price increases would not decrease consumption any more. Alternatively, White and Luksetich (1983) proposed that demand would become price-responsive at high prices because of difficulties with raising sufficient funds, changes in the relative attractiveness of treatment and increased risks of detection by enforcement agents. Wagstaff and Maynard (1988) suggested that these arguments related to different segments of the demand curve and suggested that this curve may be kinked, with elastic segments at the top and bottom and a perfectly inelastic segment in the middle price range.
However, it was not clear whether this hypothesis referred to individuals or the market as a whole. The inelastic segment referred to individuals on maintenance doses and there was no discussion of whether this range would be common across individuals. Recent empirical work by Bretteville-Jensen and Sutton (1996b) failed to find evidence of changes in price-responsiveness along the market-demand curve. However their results, in common with those of van Ours (1995), suggested that the demand for heroin may be considerably more price-elastic than previously thought. The debate about the price-responsiveness of different groups of users is mirrored in the economic literature on alcohol consumption (Manningetal., 1995; Sutton and Godfrey, 1995).
The level of analysis remains particularly important in analysing the economic determinants of demand patterns. Several studies have demonstrated the wide variability in prices paid by individuals within the same market (Bretteville-Jensen and Sutton, 1996b; Caulkins and Reuter, 1996; Weatherburn and Lind, 1997). Collection of data from individual drug users has been shown to be feasible (Johnson et al., 1985; Grapendaal, 1992; Chatterton étal., 1995; Bretteville-Jensen and Sutton, 1996b) and offers far greater scope than simple analyses of unreliable indicators of market quantities and prices.
226
CHAPTER 13
Demand, supply and market equilibrium
Many studies of the price responsiveness of the consumption of addictive commodities refer to the price elasticity of demand rather than consumption. However, economic models emphasise that demand remains unobserved in most applications and all that is recorded is the quantity traded between demanders and suppliers. In markets where the price mechanism operates as assumed (i.e. it brings about equilibrium between supply and demand), the relationship between price and quantity traded can be assumed to relate to demand if supply is either held constant or controlled for using supply variables in the analysis. Where prices do not move to give equilibrium, more complex analysis is required such as disequilibrium models (Maddala, 1983; Chapter 10, above). Only structural relationships between market variables can be assumed to be generalisable between areas, and therefore careful consideration must be given to the relationship between demand, supply, prices and market equilibrium. The nature of these problems will differ considerably depending on whether the analysis is at the market or individual level.
Analysis of the supply and demand sides of the illicit drug market is further complicated by the fact that many users are also small-scale dealers. Bretteville-Jensen and Sutton (1996a) found significant differences between dealers and non-dealers in their levels of consumption and the ways in which they generated income. In further analysis, they found that the ways in which market factors affected the behaviour of these two groups also differed markedly. At this level, they found significant effects of prices, income levels and potential profit opportunities on individual behaviour. The structural relationship between supply and demand decisions by individuals has also been discussed by Sommers et al. (1996).
Conclusions
Paucity of data is one of the principal reasons why economic-market models have not been extensively applied in Europe. However, there are other contributory factors. Compared to other disciplines, economists have had relatively little involvement in the analysis of drug use and related problems. Economists' involvement in illicit-drug debates has been primarily to contribute semantically to the libertarian debate about drug legalisation. It is probably fair also to suggest that the credibility or' economic market models suffers from both over-simplification by many commentators and the 'non-results' found in the applied analyses undertaken at market level.
Given the lack of applications of these models, it is tempting to propose that any research project in this area would have considerable 'added value'. However, to be worthwhile, an economic analysis of illicit drug markets would require considerable investment and a particular blend of researchers. The economic input should be firmly grounded in theory, but its thrust should be the application of existing concepts. The 'added value' of market analysis would primarily be a better understanding of interactions between policy interventions and market outcomes, since existing policy evaluations either ignore the role of markets in dictating outcomes (particularly in the context of treatment) or
227
ECONOMIC MODELS
adopt extremely simplistic notions of the market (in the field of enforcement). Economic analysis is required to identify structural relationships between different aspects of the market.
There is no restriction on economic-market models as to the size of geographic area at which the analysis can be performed. However, individual-level analysis is the most clearly formulated and aggregate-level analysis may suffer from aggregation problems, such as the ecological fallacy or inappropriate aggregation of non-linear relationships at individual level. There is economic literature on the definitions of market areas and market segmentation which could be used to define the pertinent geographic area for analysis.
A successful research project in this area would require a substantial amount of resources to ensure sufficient data of good quality on levels of consumption, prices and purities. This would require economic input into the design of the data collection, but also fieldwork by interviewers sympathetic to economic methods and concepts. The subsequent analysis and interpretation of the data would need an economist conscious of the special (illicit) nature of the phenomenon under study and the consequently inevitable trade-off between the importance of academic rigour and the need to obtain policy-relevant results. At this time, it would be unlikely that an economist with sufficient specialist knowledge could be found and the project would therefore need to be multidisciplinar/.
References
Alessie, R., Kapteyn, A. (1991 ). 'Habit formation, interdependent preferences and demographic effects in the almost ideal demand system'. Economic Journal 101: 404-19.
Atkinson, Α., Gomulka, J., Stern, N. (1984). Household expenditure on tobacco 1970-1980: evidence from the Family Expenditure Survey. Economic and Social Science Research Council Programme, Taxation, Incentives and the Distribution of Income, No. 57. London: London School of Economics.
Becker, G. S., Mulligan, C. B. (1993). 'On the endogenous determination ottime preference'. Unpublished manuscript.
Becker, G. S., Murphy, Κ. M. (1988). 'A theory of rational addiction'. Journal of Political Economy 96 (4): 675-700.
Becker, G. S., Grossman, M., Murphy, Κ. M. (1992). 'Rational addiction and the effect of price on consumption', in Loewenstein, G., Elster, J. (eds) Choice over time. New York: Russell Sage Foundation 361-70.
Bernard, G. (1983). 'An economic analysis of the illicit drug market'. International Journal of the Addictions 18 (5): 681-700.
Birch, S., Stoddart, G. (1990). Incentives to be healthy: an economic model of health-related behaviour. Discussion Paper 63. York: Centre for Health Economics.
Blair, R. D., Vogel, R. J. (1983). 'Heroin addiction and urban crime'. Public Finance Quarterly 1 (4): 457-67.
228
CHAPTER 13
Bretteville-Jensen, A. L. (1997). 'Addiction and discounting'. Paper presented to the 18th Nordic Health Economists' Study Group, Helsinki.
Bretteville-Jensen, A. L., Sutton, M. (1996a). 'The income-generating behaviour of injecting drug-users in Oslo'. Addiction 91 (1): 63-79.
Bretteville-Jensen, A. L., Sutton, M. (1996b). Under the influence of the market: an applied study of illicitly selling and consuming heroin. Discussion Paper 143. York: Centre for Health Economics.
Buck, D., Godfrey, C , Sutton, M. (1996). 'Economic and other views of addiction: implications for the evaluation of policy options'. Drug and Alcohol Review 15: 357-68.
Caulkins, J., Reuter, R (1996). 'The meaning and utility of drug prices'. Addiction 91 (9): 1261-4.
Cave, J. A. K., Reuter, R (1988). The interdictor's lot: a dynamic model of the market for drug smuggling services. Santa Monica, CA: RAND.
Chatterton, M., Gibson, G., Gilman, M., Godfrey, C , Sutton, M., Wright, Α. (1995). Performance indicators for local anti-drug strategies: a preliminary analysis. Crime Detection and Prevention Series Paper 62. London: Home Office Police Research Group.
Crawford, G. B., Reuter, R, Isaacson, K., Murphy, R (1988). Simulation of adaptive response: a model of drug interdiction. Santa Monica, CA: RAND.
Dorn, N., Murji, K., South, N. (1992). Traffickers: drug markets and law enforcement. London: Routledge.
Godfrey, C. (1994). 'Economic influences on changes in population and personal substance behaviour', in Edwards, G., Lader, M. (eds) Addiction: processes of change. Society for the Study of Addiction Monograph No. 3. Oxford: Oxford University Press.
Grapendaal, M. (1992). 'Cutting their coat according to their cloth: economic behaviour of Amsterdam opiate users'. International Journal of the Addictions 27 (4): 487-501.
Grizzle, G. A. (1979). 'Illicit drug availability - effects of a local law-enforcement program'. Evaluation Quarterly 3 (4): 516-36.
Grossman, M. (1972). 'On the concept of health capital and the demand for health'. Journal of Political Economy 80: 223-55.
Grossman, M., Chaloupka, F J. (1998). 'The demand for cocaine by young adults: a rational addiction approach''. Journal of Health Economics 17 (4): 427-74.
Holahan, J. (1973). 'The economics of the control of the illegal supply of heroin'. Public Finance Quarterly 1 (4): 467-77.
Johnson, B. D., et al. (1985). Taking care of business: the economics of crime by heroin abusers. Lexington, MD: Lexington Books.
Jones, A. M. (1995). A microeconometric analysis of smoking in the UK Health and Lifestyle Survey. Discussion Paper 139. York: Centre for Health Economics.
Jones, A. M. (1989). 'A double-hurdle model of cigarette consumption'. Journal of Applied Econometrics 4: 23-39.
Leung, S. I., Phelps, C. E. (1993). '"My kingdom for a drink...?": a review of estimates of the price sensitivity of demand for alcoholic beverages', in Hilton, M. E., Bloss, G. (eds) Economics and the prevention of alcohol-related problems. Washington DC: US Department of Health and Human Services, 1-31.
229
ECONOMIC MODELS
Lewis, R., Hartnoll, R., Bryer, S., Daviaud, E., Mitcheson, M. (1985). 'Scoring smack: the illicit heroin market in London'. British Journal of Addiction 80: 281-90.
Lewit, E. M., Coate, D., Grossman, M. (1981). 'The effects of government regulation on teenage smoking'. Journal of Law and Economics 24: 545-70.
Maddala, G. S. (1983). Limited-dependent and qualitative variables in econometrics. Cambridge: Cambridge University Press.
Manning, W G., Blumberg, L., Moulton, L. H. (1995). 'The demand for alcohol: the differential response to price'. Journal of Health Economics 14:123-48.
Manski, C. F. (1993). 'Identification of endogenous social effects: the reflection problem'. Review of Economic Studies 60: 531-42.
Norton, E., Lindrooth, R., Ennett, S. (1997). 'Controlling for endogeneity of peer substance use on adolescent alcohol and tobacco use'. Paper presented to the Sixth European Workshop on Econometrics and Health Economics, New University of Lisbon, Lisbon.
Polich, J. M., Ellikson, R L., Reuter, R, Kalion, J. R (1984). Strategies for controlling adolescent drug use. Santa Monica, CA: RAND.
Pollak, R. A. (1976). 'Interdependent preferences'. American Economic Review 66: 309-20.
Pompidou Group (Co-operation Group to Combat Drug Abuse and Illicit Trafficking in Drugs) (1994). Multi-city study: drug misuse trends in thirteen European cities. Strasbourg: Council of Europe Press.
Rice, N., Sutton, M. (1997). The identification, estimation and interpretation of 'higher-level effects': the problem of endogeneity. Technical Paper 7. York: Centre for Health Economics.
Rydell, C. R, Everingham, S. S. (1994). Controlling cocaine: supply versus demand programs. Santa Monica, CA: RAND.
Schoenbaum, M. (1997). 'Do smokers understand the mortality effects of smoking? Evidence from the Health and Retirement Survey'. American Journal of Public Health 87 (5): 755-9.
Sommers, I., Baskin, D., Fagan, J. (1996). 'The structural relationship between drug use, drug dealing, and other income support activities among women drug sellers'. Journal of Drug Issues 26 (4): 975-1006.
Sutton, M., Godfrey, C. (1995). 'A grouped data regression approach to estimating economic and social influences on individual drinking behaviour'. Health Economics 4 (3): 237-47.
Sutton, M., Maynard, A. (1994). Trends in the cost-effectiveness of enforcement activity in the illicit heroin market, 1979-91. YARTIC Occasional Paper 4. York: Centre for Health Economics.
van Ours, J. C. (1995). 'The price-elasticity of hard drugs - the case of opium in the Dutch East Indies, 1923-1938' Journal of Political Economy 103 (2): 261-79.
Viscusi, W K. (1992). Smoking: taking the risky decision. Oxford: Oxford University Press.
Wagstaff, Α., Maynard, Α. (1988). Economic aspects of the illicit drug market and drug enforcement policies in the United Kingdom. Home Office Research Study 95. London: Home Office.
Weatherburn, D., Lind, Β. (1997). 'Drug law enforcement policy and its impact on the heroin market'. Addiction 92: 557-69.
White, M. D., Luksetich, W. A. (1983). 'Heroin: price elasticity and enforcement strategies'. Economic Inquiry 2 1 : 557-64.
230

GENERAL CONCLUSIONS

G E N E R A L C O N C L U S I O N S
Richard Hartnoll and Lucas Wiessing
Modelling has played and continues to play a principal role in various research fields such as the economy and public health, especially where macro-level decision-making is concerned. Scenario analyses of future trends in demography, AIDS cases or pension costs, for example, help to foresee future needs for services and financial reserves. Cost-benefit and cost-effectiveness analyses of alternative interventions help to decide whether procedures such as hepatitis vaccination or breast-cancer screening are best carried out for the general population or best limited to high-risk groups.
In the drugs field, only a limited amount of such work has been carried out, even though the potential for some basic approaches had already been demonstrated in the 1970s and earlier. It seems almost paradoxical that techniques that are meant to make sense of scarce data have rarely been applied in Europe because of a lack of data. An additional reason may be that European drugs research and social sciences in general have put stronger emphasis on historical or qualitative approaches than, for example, in the United States. Also, the European field of drugs research itself was very limited in size and resources until quite recently and is still under-funded. However, in recent years, the field has been developing rapidly and opening up to other disciplines including mathematics, statistics and economics. Data availability and quality are improving and the potential to use models to forecast future trends or to estimate hidden processes, such as initiation of drug use, has consequently been increasing.
Quantitative techniques such as modelling should not be applied in isolation. A multidisciplinary approach is essential, especially for modellers, who are often highly expert in mathematics or statistics but may sometimes have less 'field knowledge' of drug use. As the projects that led to this monograph, and their ongoing follow-ups have shown, the most useful results of modelling are derived by inter-disciplinary teams of mathematicians, statisticians, epidemiologists, economists, sociologists and the medical doctors who see addicted patients every day.
At the European Monitoring Centre for Drugs and Drug Addiction (EMCDDA), the most obvious complementary element to the European modelling network, of which this monograph isan important output, is the European network of qualitative researchers (see http://www.qed.org.uk and Understanding and responding to drug use: the role of qualitative research. EMCDDA Scientific Monograph No. 4. Lisbon: European Monitoring Centre for Drugsand Drug Addiction, 2000). Like the modelling network, this qualitative network aims to promote tools and methods to improve understanding of processes, hidden populations and usefulness of responses, be it using totally different and highly complementary approaches to mathematical and statistical modelling. It is very important, both for qualitative and quantitative drug-use researchers in Europe, that closer collaboration and mutual understanding of each other's approaches develops.
233

G E N E R A L C O N C L U S I O N S
Future directions
The EMCDDA has already embarked on a cluster of modelling projects as a follow-up to the initial reviewing project that resulted in this monograph. These activities are centred on three broad aims:
» bringing together and consolidating European research infrastructure by forming networks of researchers, funding meetings for exchange of results and stimulating collaborations and joint publications; developing priority themes on quantitative epidemiological research of drug use by funding small pilot or 'seed' studies meant to be continued by national and more robust EU research funding; linking the results of the networks and pilot projects to the needs of policy-makers by holding joint seminars, focusing research objectives around policy relevant questions and presenting results in formats that are understandable by non-specialists.
Bringing together and consolidating European research infrastructure
This includes stimulating research initiatives such as writing proposals for larger research funding, holding meetings where experts can exchange results and keeping the research community informed of new initiatives through presentations at scientific meetings and conferences and publication in the EMCDDA Annual report on the state of the drugs problem in the European Union, its newsletter Drugnet Europe and its website, http://www.emcdda.org. The EMCDDA-funded European modelling network, that started with the reviewing project which resulted in this monograph, was consolidated at the end of 1998 through a research grant from the EU Commission under the fourth framework programme of former Directorate-General XII, Targeted socio-economic research (TSER). The EMCDDA took the initiative for writing the research proposal and is coordinating the project. This is a so-called 'network project' where funding is mainly for regular meetings to exchange results on ongoing work. Six working groups are active on the following topics: national prevalence estimation; local prevalence estimation; geographic spread; time trends and incidence; costs and cost-effectiveness; and drug markets and policy options. The EMCDDA/TSER project has resulted in a series of meetings on different themes with participation from over 40 experts in modelling and other disciplines. Outcomes to date include more than 30 scientific publications that have directly benefited from the project (see http://www.emcdda.org/activities/ epidem_tser.shr.ml).
Developing priority themes on quantitative epidemiological research
From the 1997 review meetings in York and the May 1998 Lisbon seminar, a number of themes emerged that appeared the most relevant to policy-making in the short term as well as feasible given the data and expertise available. Given the lack of an overall macro picture of drug use in Europe in 1998, the main emphasis was placed on descriptive epidemiology. Already in 1996 a seminar held in Strasbourg had highlighted the importance of improving methods for estimating the prevalence of problem drug use, using separate
234
G E N E R A L C O N C L U S I O N S
approaches for the local and the national levels (see Estimating the prevalence of problem drug use in Europe. EMCDDA Scientific Monograph No. 1. Lisbon: European Monitoring Centre for Drugs and Drug Addiction, 1997). Additional themes that emerged from the modelling meetings in York and Lisbon were: estimation of the incidence of problem drug use using back-calculation methods and drug-treatment data; linking geographic information systems to forecasting models to investigate and map the geographic spread of problem drug use; using economic methods to calculate the health-care and social costs of drug-related infections and the cost-effectiveness of interventions; modelling drug markets and supply-side factors to gauge the potential for policy options aimed, for example, at increasing the price of drugs. As descriptive epidemiology improves and more data become available, new themes can concentrate further on understanding mechanisms and interrelationships at a more detailed level and in a more fundamental way. At the initial meetings, modelling micro-diffusion processes was not recommended as it was seen as too difficult to find appropriate data. However, more basic analyses are already proving important, as a prerequisite for understanding developments at macro level.
Linking the results of the networks and pilot projects to the needs of policy-makers
Even if there is an obvious need for a centre such as the EMCDDA, it has been challenging to make the link between the interests and priorities of quantitative researchers and policymakers. This was related to the themes themselves, the nature of the methods used, the types of participants in different meetings and their interests and 'languages', and also to the difficult)' of clearly defining the needs of policy-makers and the concept of 'policymaker' itself. While the importance of prevalence estimation of problem drug use seemed obvious from the beginning and never raised many questions as to its relevance, the wider concept of 'modelling' has not always been fully understood by non-modellers in the drugs field. Most of the methods that underlie the work of estimating prevalence, incidence or cost-effectiveness are hard to understand for non-specialists while the experts themselves may often not be used to writing for an audience other than expert readers. Mixing specialists and non-specialists at larger meetings proved important but not easy, as the different jargons used in some cases resulted in Babylonian discussions. On the other hand, in both York meetings, which were held mostly among modellers, discussions often converged on the working of different techniques rather than on the highest priorities in drugs policy, reflecting the methodological interests of the experts involved.
In conclusion, it is clear that work remains to be done in explaining the importance of using quantitative methods to estimate prevalence, incidence, spread, costs and cost-effectiveness and the interplay of supply factors in drug markets to non-specialist decisionmakers. It may sometimes be difficult to understand that to obtain a sound evidence base in the longer term, some patience is necessary and funding is needed to develop methodological infrastructure. It bodes well for the future, however, that despite these difficulties a strong network of European modellers has been formed. Results are improving quickly in relevance and quality, in parallel to the increasing access to data sources among networks of other experts. It is also encouraging that European drug-strategy documents are increasingly based on setting quantitative and measurable goals. It is only a matter of time before the drugs field will be using these techniques as if they had always been there.
235


CONTRIBUTORS

CONTRIBUTORS
Peter W. Achterberg National Institute of Public Health and the Environment (RIVM) Department of Public Health Forecasting PO Box 1 Bilthoven 3720 BA Bilthoven The Netherlands Tel. (31-30)274 38 37 Fax (31-30) 274 44 50 E-mail: [email protected]
Azzedine Boumhgar Observatoires Régionaux de la Santé Téléperformance France 12 rue Charles Fourier F-75013 Paris Tel. (33)155 76 40 10 Fax (33) 155 76 40 20 E-mail: [email protected]
Catherine Comiskey Department of Mathematics National University of Ireland Maynooth Co. Kildare Ireland Tel. (353-1) 708 39 94 Fax (353-1) 708 39 13 E-mail: [email protected]
Martin Frischer Department of Medicines Management University of Keele Staffordshire ST5 5BG UK Tel. (44-1782)58 35 68 Fax (44-1782) 71 35 86 E-mail: [email protected]
Christine Godfrey Centre for Health Economics University of York Heslington YorkYO10 5DD UK Tel. (44-1904)43 45 07 Fax (44-1904) 43 27 00 E-mail: [email protected]
239

CONTRIBUTORS
Richard Hartnoll EMCDDA Rua da Cruz de Santa Apolónia 23-25 P-1149-045 Lisbon Tel.(351)218 11 30 06 Fax (351) 218 13 79 43 E-mail: [email protected]
Gordon Hay Centre for Drug Misuse Research 12-15 Western Court Glasgow G12 8SQ UK Tel. (44-141)330 54 13 Fax (44-141) 330 28 20 E-mail: [email protected]
Heath Heatlie Department of Medicines Management Keele University Staffordshire ST5 5BG UK Tel. (44-1782)58 35 62 Fax (44-1782) 71 35 86 E-mail: [email protected]
Matthew Hickman Centre for Research on Drugs and Health Behaviour Department of Social Science and Medicine Imperial College School of Medicine St Dunstans Road London W6 8RP UK Tel. (44-20) 75 94 07 74 Fax (44-20) 75 94 08 52 E-mail: [email protected]
Johannes Jager National Institute of Public Health and the Environment (RIVM) PO Box 1 3720 BA Bilthoven The Netherlands Tel. (31-30)274 25 16 Fax (31-30) 274 44 66 E-mail: [email protected]
240

CONTRIBUTORS
James Kahan RAND Europe Newtonweg 1 2333 CP Leiden The Netherlands Tel. (31-71) 524 51 51 Fax (31-71) 524 51 91 E-mail: [email protected]
Ludwig Kraus Institut für Therapieforschung (IFT) Parzivalstr. 25 D-80804 München Tel. (49-89) 36 08 04 30 Fax (49-89) 36 08 04 49 E-mail: [email protected]
Mirjam Kretzschmar National Institute of Public Health and the Environment (RIVM) PO Box 1 3720 BA Bilthoven The Netherlands Tel. (31-30)274 37 49 Fax (31-30) 274 44 09 E-mail: [email protected]
Fabio Mariani Department of Epidemiology Institute of Clinical Physiology National Research Council Via Moruzzi 1-56100 Pisa Tel. (39-050) 315 20 94 Fax (39-050) 315 20 95 E-mail: [email protected]
Roberto Mollica Treatment Outpatient Addiction Unit (SERT) ASL Città di Milano District 5 381 via Delle Forze Armate 1-20100 Milan Tel. (39-02) 48 92 02 71 Fax (39-02) 48 92 63 09 E-mail: [email protected]
241

CONTRIBUTORS
Steve Parrott Centre for Health Economics University of York Heslington YorkYO10 5DD UK Tel. (44-1904)43 36 33 Fax (44-1904) 43 36 44 E-mail: [email protected]
Maarten Postma Groningen University Institute for Drug Exploration Groningen Research Institute of Pharmacy (GUIDE/GRIP) Antonius Deusinglaan 1 9713 AV Groningen The Netherlands Tel. (31-50)363 26 07 Fax (31-50) 363 27 72 E-mail: [email protected]
Carla Rossi University of Rome Tor Vergata Dipartimento Di Matematica Via Ricerca Scientifica 1-00133 Rome Tel. (39-06) 72 59 46 76 Fax (39-06) 72 59 46 99 E-mail: [email protected] or [email protected]
Gianpaolo Scalia Tomba University of Rome 'La Sapienza' Via A. Scarpa 16 1-00161 Rome Tel. (39-06) 49 91 66 76 Fax (39-06) 495 76 47 E-mail: [email protected]
Roland Simon Institut für Therapieforschung (IFT) Parzivalstr. 25 D-80804 München Tel. (49-89) 36 08 04 40 Fax (49-89) 36 08 04 49 E-mail: [email protected]
242

CONTRIBUTORS
Matthew Sutton Department of General Practice University of Glasgow 4 Lancaster Crescent Glasgow G12 ORR UK Tel. (44-141)211 16 66 Fax (44-141) 211 16 67 E-mail: [email protected]
Colin Taylor National Addiction Centre Addiction Sciences Building 4 Windsor Walk London SE5 8AF UK Tel. (44-20) 79 19 34 49 Fax (44-20) 72 52 48 94 E-mail: [email protected]
Keith Tolley Health Outcomes Research GlaxoSmithKline UK Stockley Park Uxbridge Middlesex UB11 1BT UK Tel. (44-20) 89 90 30 22 Fax (44-20) 89 90 30 15 E-mail: [email protected]
Vanessa Waby Centre for Health Economics University of York Heslington YorkYO10 5DD UK Tel. (44-1904)43 26 95 Fax (44-1904) 43 36 44 E-mail: [email protected]
Lucas Wiessing EMCDDA Rua da Cruz de Santa Apolónia 23-25 P-1149-045 Lisbon Tel. (351)218 11 30 16 Fax (351) 218 13 79 43 E-mail: [email protected]
243

CONTRIBUTORS
Philip Young Department of Health Sciences and Clinical Evaluation University of York Heslington YorkYO10 5DD UK Tel. (44-1904)43 45 11 Fax (44-1904) 43 45 17 E-mail: [email protected]
244
PRACTICAL INFORMATION
Address: European Monitoring Centre for Drugs and Drug Addiction (EMCDDA)
Rua da Cruz de Santa Apolónia 23-25 P-1149-045 Lisbon
Tel. (351)21 811 30 00
Fax (351)21 813 17 11
E-mail: [email protected]
Website: http://www.emcdda.org
EMCDDA, January 2001
European Monitoring Centre for Drugs and Drug Addiction
EMCDDA Scientific Monograph Series No 6
Modelling drug use: methods to quantify and understand hidden processes
Luxembourg: Office for Official Publications of the European Communities
2001 -246 pp . -16x24 cm
ISBN 92-9168-056-7
Price (including VAT in Luxembourg): EUR 18
245


E M C D D A S C I E N T I F I C M O N O G R A P H S E R I E S
The European Moni tor ing Centre for Drugs and Drug Addiction (EMCDDA) was set up in the face of an escalating drug problem in the European Union and a lack of sound and comparable information on the subject at European level. Established by Council Regulation (EEC) No 3 0 2 / 9 3 on 8 February 1 9 9 3 , the Centre became fully operational in 1995. Its main goal is to provide 'objective, reliable and comparable information at European level concerning drugs and drug addiction and their consequences'.
S
ζ
The Centre's tasks are divided into four categories:
• collecting and analysing existing data; • improving data-comparison methods; • disseminating data; and • co-operat ing w i t h European and internat ional bodies and
organisations, and with non-EU countries.
The EMCDDA works exclusively in the field of information.
Located in Lisbon, the EMCDDA is one of 11 decentralised agencies set up by the European Union to carry out specialised technical or scientific work. As such, the Centre is funded by the Community budget but is autonomous in its operations.
Price (excluding VAT) in Luxembourg: EUR 18
OFFICE FOR OFFICIAL PUBLICATIONS
ISBN TE-Tlbfl-DSL·-?
* OP * OF THE EUROPEAN COMMUNITIES
L-2985 Luxembourg 789291"680566