modeling of ro flux decline in textile wastewater reclamation plants using variable fouling index
TRANSCRIPT

PLEASE SCROLL DOWN FOR ARTICLE
This article was downloaded by: [Chiemchaisri, Chart]On: 2 June 2009Access details: Access Details: [subscription number 911880407]Publisher Taylor & FrancisInforma Ltd Registered in England and Wales Registered Number: 1072954 Registered office: Mortimer House,37-41 Mortimer Street, London W1T 3JH, UK
Separation Science and TechnologyPublication details, including instructions for authors and subscription information:http://www.informaworld.com/smpp/title~content=t713708471
Modeling of RO Flux Decline in Textile Wastewater Reclamation Plants UsingVariable Fouling IndexThirdpong Srisukphun a; Chart Chiemchaisri b; Kazuo Yamamoto c
a Department of Environmental Engineering, Faculty of Engineering, Kasetsart University, Bangkok, Thailandb Department of Environmental Engineering/National Center of Excellence for Environmental and HazardousWaste Management, Faculty of Engineering, Kasetsart University, Bangkok, Thailand c EnvironmentalScience Center, The University of Tokyo, Hongo, Bunkyo-ku, Tokyo, Japan
Online Publication Date: 01 June 2009
To cite this Article Srisukphun, Thirdpong, Chiemchaisri, Chart and Yamamoto, Kazuo(2009)'Modeling of RO Flux Decline in TextileWastewater Reclamation Plants Using Variable Fouling Index',Separation Science and Technology,44:8,1704 — 1721
To link to this Article: DOI: 10.1080/01496390902880057
URL: http://dx.doi.org/10.1080/01496390902880057
Full terms and conditions of use: http://www.informaworld.com/terms-and-conditions-of-access.pdf
This article may be used for research, teaching and private study purposes. Any substantial orsystematic reproduction, re-distribution, re-selling, loan or sub-licensing, systematic supply ordistribution in any form to anyone is expressly forbidden.
The publisher does not give any warranty express or implied or make any representation that the contentswill be complete or accurate or up to date. The accuracy of any instructions, formulae and drug dosesshould be independently verified with primary sources. The publisher shall not be liable for any loss,actions, claims, proceedings, demand or costs or damages whatsoever or howsoever caused arising directlyor indirectly in connection with or arising out of the use of this material.

Modeling of RO Flux Decline in TextileWastewater Reclamation Plants Using
Variable Fouling Index
Thirdpong Srisukphun,1 Chart Chiemchaisri,2 and Kazuo Yamamoto3
1Department of Environmental Engineering, Faculty of Engineering,Kasetsart University, Bangkok, Thailand
2Department of Environmental Engineering=National Center of Excellencefor Environmental and Hazardous Waste Management, Faculty of
Engineering, Kasetsart University, Bangkok, Thailand3Environmental Science Center, The University of Tokyo, Hongo,
Bunkyo-ku, Tokyo, Japan
Abstract: This research proposes the model for estimation of flux decline usingthe concept of ‘‘variable fouling index.’’ The change in fouling index isinduced by the accumulative foulant on the membrane and by the adhesionof the foulant on the membrane. The analysis of operating data of textilewastewater reclamation plants using the variable fouling index concepthas shown that this model which was derived from short-term data of benchscale achieves a promising accuracy for the estimation of flux decline andincrease of net driving pressure in a long-term operation of pilot-scale andfull-scale system.
Keywords: Flux decline, modified fouling index, reverse osmosis, textilewastewater, variable fouling index
Received 6 May 2008; accepted 6 February 2009.Address correspondence to Dr. Chart Chiemchaisri, Associate Professor,
Department of Environmental Engineering=National Center of Excellence forEnvironmental and Hazardous Waste Management, Faculty of Engineering,Kasetsart University, Bangkok 10900, Thailand; Fax: 662-5790730. E-mail:[email protected]
Separation Science and Technology, 44: 1704–1721, 2009
Copyright # Taylor & Francis Group, LLC
ISSN: 0149-6395 print=1520-5754 online
DOI: 10.1080/01496390902880057
1704
Downloaded By: [Chiemchaisri, Chart] At: 02:02 2 June 2009
INTRODUCTION
Presently, fresh water shortage has become a serious concern all over theworld. Reclamation of industrial wastewater is one of the potential solutionsto this problem. Huge water consumption in the textile industry, wherewater consumption reaches approximately 0.2 to 0.5m3=kg of the finishedproduct (1), is an attractive target for installing wastewater reclamation facil-ities. Reverse osmosis (RO) membrane has been successfully applied to thereclamation of textile wastewater (2,3); nevertheless, RO faces a hindrancerelating to the fouling issue. This problem has adversely affected plant per-formance both in terms of quantity and quality. It increases the operatingcost due to an enlargement of overall resistance as reflected by increaseda transmembrane pressure (TMP), routine-cleaning cycles, a corrosiveby-product from the microorganism, and an increased salt passage (4,5,6,7).
In the past, many flux decline models have been proposed. Thesemodels can be explained excellently for the flux decline behavior of theirequipment. However, applying bench-scale models to assess themembrane productivity on a larger scale was a predicament due to thedifferent conditions between the bench-scale and the larger scale plants.The instances of this problem are membrane configurations, size ofmembrane elements, recovery ratio, operating conditions, i.e., constantflux and constant pressure, etc. Hence, development of the model forassessment of membrane productivity using least data and smallestexperiment has been a challenging endeavor.
This research is proposing another simple and effective model for theassessment of flux decline in a longer operation time and larger-scaleplant from short-term data of the bench-scale experiment. The operatingdata of bench-scale and pilot-scale from the textile wastewaterreclamation plants were compared.
BACKGROUND
Review on Modeling of Membrane Flux Decline
RO process design was proposed by Pervov based on the evaluation ofaccumulative mass on membrane using a recirculation mode experiment(8). The accumulative mass was determined by measuring the change inconcentration in wastewater.
The normalized fouling rate (NFR) was a model for estimating theflux decline and cleaning interval time in ultrafiltration (UF) based onthe constant flux operation (9). The fouling rate of UF was assumedconstant in this model.
RO Flux Decline Modeling 1705
Downloaded By: [Chiemchaisri, Chart] At: 02:02 2 June 2009

The pore diffusion transport model was developed for the predictionand simulation of the permeate flux and concentration of permeate andconcentrate by Tu et al. (10). The resistance due to membrane, concentra-tion polarization, adsorption in membrane pores, and gel formation wereincluded in this model.
Braeken et al. (11) proposed the prediction model of flux decline inNF due to adsorption of dissolved organic compounds. The adsorptionthermodynamics were applied and the logarithmic function of the timewas obtained for the fraction of the fouled membrane surface.
Theory
Generally, the classical superior equation, resistance in series of model(Equation 1), has been used to describe the relationship between thepermeate flux and the membrane resistance (12). The reduction ofpermeate flux caused by the increase of foulant resistant (RF) as shownin Eq. (2), which can be expressed in term of adsorption resistance(RA), the pore blocking resistance (RP), the cake filtration resistance(RC), and the concentration polarization resistance (RCP), over the resis-tance due to the membrane itself (RM). In case of long-term operation,fouling plays an important role for change in the total hydraulic resis-tance. Hence, the permeate flux can be assessed if the total hydraulicresistance can be estimated.
J ¼ DPgðRM þ RA þ RCP þ RP þ RCÞ
ð1Þ
J ¼ DPgðRM þ RF Þ
ð2Þ
where RF is a foulant resistance, which is defined as proportional to thespecific volume containing the foulant (V=A, where V is the permeatevolume and A is the membrane area) multiplied by the fouling index (I).Furthermore, RF is also defined as a function of specific cake resistance(a) multiplied by the cake concentration (C) as shown in Eq. (3).
RF ¼ V
AI ¼ aC ð3Þ
Substituting the foulant resistance from Eq. (3) in Eq. (2), thepermeate flux can be expressed as shown in Eq. (4).
J ¼ DP
g RM þ VA I� �� � ð4Þ
1706 T. Srisukphun et al.
Downloaded By: [Chiemchaisri, Chart] At: 02:02 2 June 2009
Specific flux (L) or permeability is an important parameter which isuseful for the operation with constant flux, a normal operation of ROsystem (9). The specific flux can be calculated from the ratio of permeateflux (J) and net driving pressure (DP) or can be calculated from thereverse product of total resistance (RT) and dynamic viscosity (g) asshown in Eqs. (5) and (6). The net driving pressure was determined fromthe difference between applied pressure and osmotic pressure.
L ¼ J
DP¼ 1
gRTð5Þ
L ¼ 1
g RM þ VA I� �� � ð6Þ
MODELING OF FLUX DECLINE USING THE CONCEPT
OF VARIABLE MEMBRANE FOULING INDEX
Generally, the fouling index is assumed to be a constant parameter andthe permeate flux (J) is dependent upon the foulant resistant (RF) andthe permeate volume as defined in the theory of modified fouling index(MFI). MFI is determined from the gradient of the linear legion in theplot of t=V and V as presented in Eqs. (7) and (8) (13).
t
V¼ gRM
DPAþ gIDPA2
V ð7Þ
MFI ¼ gIDPA2
ð8Þ
According to the MFI concept, the specific flux (L) can be deter-mined by the rearrangement of Eq. (6) as shown in Eq. (9).
1
L¼ gRM þ gI
V
Að9Þ
In the case of a spiral wound membrane filtration unit, the foulingrate or fouling index always decreases with filtration time because of across-flow velocity and a decrease of adhesion of foulant on membrane,hydrophobicity, hydrophilicity, and ionic strength. The cross-flow velo-city limits the thickness of the foulant layer at the membrane surfaceby a detachment of the particle and a back diffusion of the solute (14).The hydrophobicity and hydrophilicity between the membrane and thefoulant are changed when the membrane surfaces are occupied by the
RO Flux Decline Modeling 1707
Downloaded By: [Chiemchaisri, Chart] At: 02:02 2 June 2009
foulant (15,16). The ionic strength between the membrane and thefoulant are changed by Donnan equilibrium and this equilibrium pre-vents the diffusion of the ion between membrane and bulk solution (17).
In Eq. (6), when the dynamic viscosity and the resistance due tomembrane are constant, specific flux is primarily influenced by specificvolume (V=A) and fouling index (I). The specific volume is determinedby multiplying the permeate flux and the filtration time. In addition, inthis research, the fouling index is defined as a variable parameter. Thevariable fouling index is a function of an initial fouling index (Io) and areduction coefficient (d). The n-order rate law is considered to estimatethe model parameters as shown in Eq. (10).
dI
dðV=AÞ ¼ �dIn ð10Þ
The n-order rate law is integrated from I¼ Io to I¼ I and V=A¼ 0 toV=A¼V=A. The integrated rate law becomes:
1
I ðn�1Þ ¼1
Iðn�1Þo
þ ðn� 1ÞdVA
ð11Þ
According to the Eq. (10), the reduction coefficient (d) is determinedby a linear plot between 1=I (n�1) and V=A. Consequently, Eqs. (6) and(11) are combined and the specific flux profile is determined by Eq. (12)as variable fouling index (VFI) model. The variable fouling index modelis appropriate for both the constant flux operation and the constant pres-sure operation.
L ¼ 1
g RM þ VA
Iðn�1Þo
1þ½ðn�1ÞdVAIðn�1Þo �
� � 1n�1ð Þ" #* + ð12Þ
MATERIALS AND METHODS
This research studied the accuracy of flux decline model with variablefouling index using the different textile wastewater and the different treat-ment systems. The parameters of the model were determined from theflux decline data of bench-scale obtained from factory A (yarn and knitdyeing factory) and factory B (yarn printing factory). The models whichwere determined from the bench-scale experiments were compared withthe operating data of pilot-scale experiment to test the competency in fluxdecline assessment of larger scale and longer operating time.
1708 T. Srisukphun et al.
Downloaded By: [Chiemchaisri, Chart] At: 02:02 2 June 2009
Pretreatment and RO Processes of Pilot-Scale Plants
Two textile wastewater treatment plants, Factory A and Factory B, hadbeen chosen to represent the RO plants in this study. RO pretreatmentfor factory A was a membrane bioreactor (MBR). In addition, RO pre-treatment for factory B was a combination of an activated sludge (AS)and a microfiltration (MF) membrane. The treated wastewater wasfurther treated by RO unit at a feed flow rate of 0.4m3=h and a permeateflow rate of 0.2m3=h. The system was operated under recirculation modeat a flow rate of 0.8m3=h. Two elements of a negatively charged mem-brane (model XLE-4040, Film Tech Corp.) with a diameter of 4 incheswere occupied. The concentrate water from the first element was filteredagain by the second RO element. The additive chemicals, biocide solution(Kuriverter EC 503, Kurita Water Industry LTD.), and anti-scalant solu-tion (Kulifloat, Kurita Water Industry LTD.) were added continuouslyfor controlling biofouling and scaling. Moreover, the pH value of thefeed water was controlled to near 6.5. The RO unit was operated witha recovery ratio of 50%.
RO Feed-Water
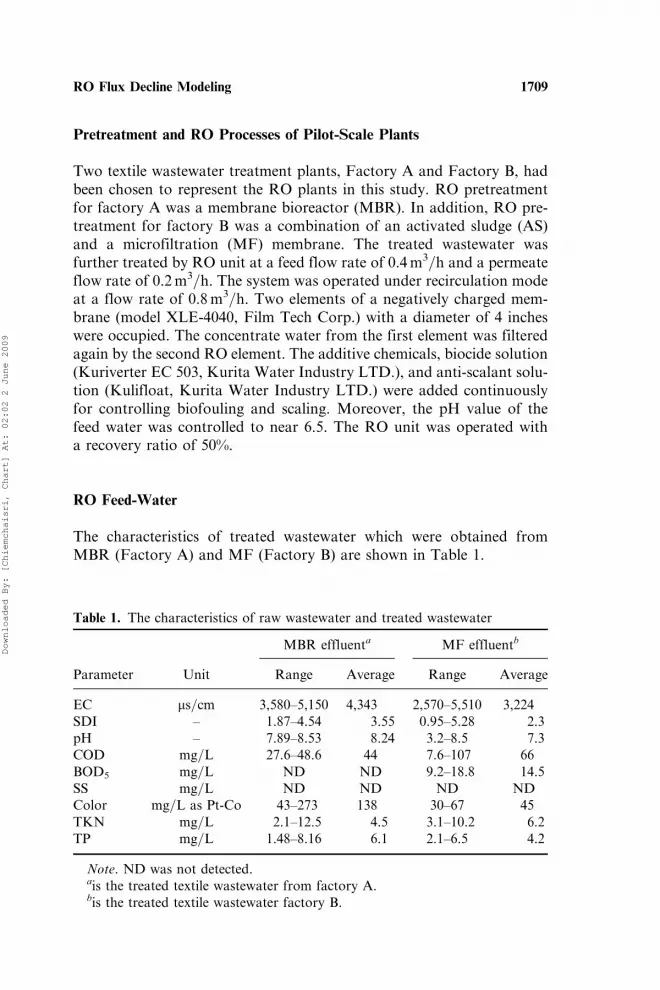
The characteristics of treated wastewater which were obtained fromMBR (Factory A) and MF (Factory B) are shown in Table 1.
Table 1. The characteristics of raw wastewater and treated wastewater
MBR effluenta MF effluentb
Parameter Unit Range Average Range Average
EC ms=cm 3,580–5,150 4,343 2,570–5,510 3,224SDI – 1.87–4.54 3.55 0.95–5.28 2.3pH – 7.89–8.53 8.24 3.2–8.5 7.3COD mg=L 27.6–48.6 44 7.6–107 66BOD5 mg=L ND ND 9.2–18.8 14.5SS mg=L ND ND ND NDColor mg=L as Pt-Co 43–273 138 30–67 45TKN mg=L 2.1–12.5 4.5 3.1–10.2 6.2TP mg=L 1.48–8.16 6.1 2.1–6.5 4.2
Note. ND was not detected.ais the treated textile wastewater from factory A.bis the treated textile wastewater factory B.
RO Flux Decline Modeling 1709
Downloaded By: [Chiemchaisri, Chart] At: 02:02 2 June 2009
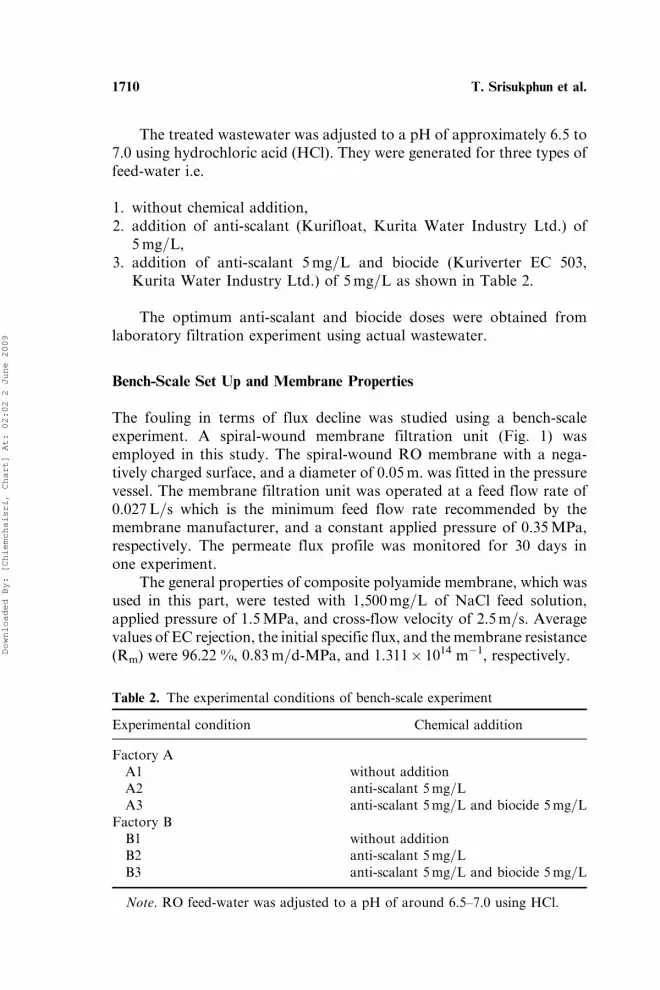
The treated wastewater was adjusted to a pH of approximately 6.5 to7.0 using hydrochloric acid (HCl). They were generated for three types offeed-water i.e.
1. without chemical addition,2. addition of anti-scalant (Kurifloat, Kurita Water Industry Ltd.) of
5mg=L,3. addition of anti-scalant 5mg=L and biocide (Kuriverter EC 503,
Kurita Water Industry Ltd.) of 5mg=L as shown in Table 2.
The optimum anti-scalant and biocide doses were obtained fromlaboratory filtration experiment using actual wastewater.
Bench-Scale Set Up and Membrane Properties
The fouling in terms of flux decline was studied using a bench-scaleexperiment. A spiral-wound membrane filtration unit (Fig. 1) wasemployed in this study. The spiral-wound RO membrane with a nega-tively charged surface, and a diameter of 0.05m. was fitted in the pressurevessel. The membrane filtration unit was operated at a feed flow rate of0.027L=s which is the minimum feed flow rate recommended by themembrane manufacturer, and a constant applied pressure of 0.35MPa,respectively. The permeate flux profile was monitored for 30 days inone experiment.
The general properties of composite polyamide membrane, which wasused in this part, were tested with 1,500mg=L of NaCl feed solution,applied pressure of 1.5MPa, and cross-flow velocity of 2.5m=s. Averagevalues of EC rejection, the initial specific flux, and themembrane resistance(Rm) were 96.22 %, 0.83m=d-MPa, and 1.311� 1014 m�1, respectively.
Table 2. The experimental conditions of bench-scale experiment
Experimental condition Chemical addition
Factory AA1 without additionA2 anti-scalant 5mg=LA3 anti-scalant 5mg=L and biocide 5mg=L
Factory BB1 without additionB2 anti-scalant 5mg=LB3 anti-scalant 5mg=L and biocide 5mg=L
Note. RO feed-water was adjusted to a pH of around 6.5–7.0 using HCl.
1710 T. Srisukphun et al.
Downloaded By: [Chiemchaisri, Chart] At: 02:02 2 June 2009

Estimation of Model Parameters
The model parameters were determined from three operating periods ofbench-scale experiment i.e., 1 day, 7 days, and 30 days of operation.The specific flux (Lmodel), which was calculated from three sets of modelparameters, was compared with the experimental data (Lexperiment) todetermine the appropriate operation period for the modeling. The sumof square error (SSE) as shown in Eq. (13) was used to evaluate the accu-racy of the models. The operating period, which provided the smallestamount of difference in specific flux between model and experiment, theminimum SSE, was selected to be the optimum operation period.
SSE ¼X
ðLexperiment � LmodelÞ2 ð13Þ
RESULTS AND DISCUSSIONS
Bench-Scale Experiment
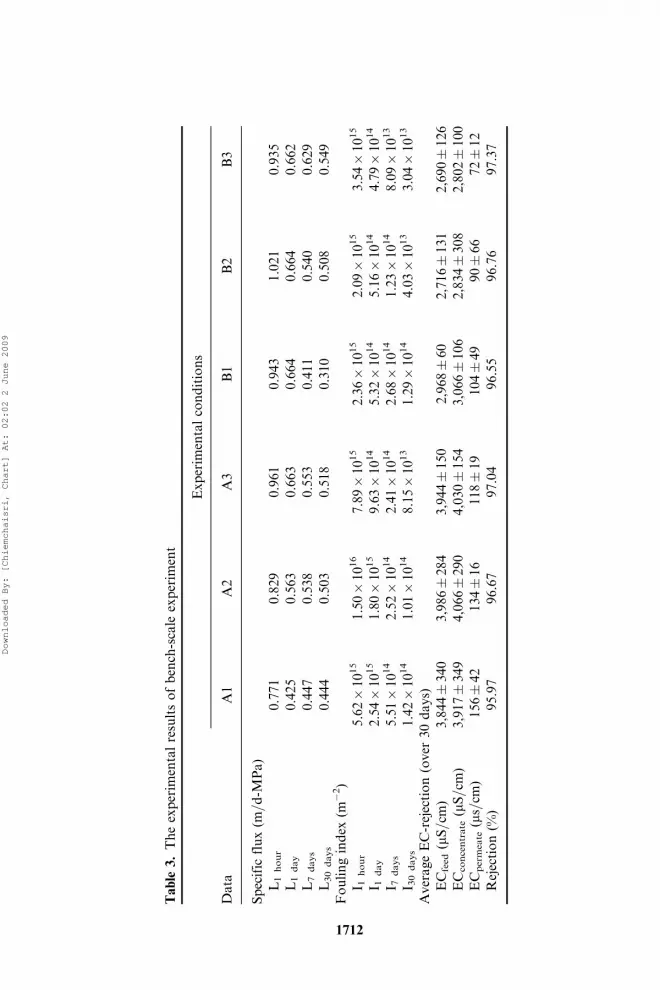
The bench-scale experiments were conducted to determine the pattern of fluxdecline and the variation of fouling index. The experimental results areshown in Table 3. Under all cases, the specific flux and fouling indexdecreased rapidly within 1 day. In addition, after 7 days of experiment, thespecific flux and fouling index decreased slightly until the end of experiment.
According to the results in Table 3, the addition of anti-scalant andbiocide tended to increase the rejection efficiency in term of EC-rejection.Moreover, these additive chemicals lower the final fouling index and thefinal increased specific flux as noted from comparing between conditionsA1 and A3 and conditions B1 and B3.
Figure 1. Schematic diagram of the spiral wound membrane filtration unit.
RO Flux Decline Modeling 1711
Downloaded By: [Chiemchaisri, Chart] At: 02:02 2 June 2009
Table
3.Theexperim
entalresultsofbench-scale
experim
ent
Experim
entalconditions
Data
A1
A2
A3
B1
B2
B3
Specific
flux(m
=d-M
Pa)
L1hour
0.771
0.829
0.961
0.943
1.021
0.935
L1day
0.425
0.563
0.663
0.664
0.664
0.662
L7days
0.447
0.538
0.553
0.411
0.540
0.629
L30days
0.444
0.503
0.518
0.310
0.508
0.549
Foulingindex
(m�2)
I 1hour
5.62�1015
1.50�1016
7.89�1015
2.36�1015
2.09�1015
3.54�1015
I 1day
2.54�1015
1.80�1015
9.63�1014
5.32�1014
5.16�1014
4.79�1014
I 7days
5.51�1014
2.52�1014
2.41�1014
2.68�1014
1.23�1014
8.09�1013
I 30days
1.42�1014
1.01�1014
8.15�1013
1.29�1014
4.03�1013
3.04�1013
AverageEC-rejection(over
30days)
ECfeed
(mS=cm
)3,844�340
3,986�284
3,944�150
2,968�60
2,716�131
2,690�126
ECconcentrate(mS=cm
)3,917�349
4,066�290
4,030�154
3,066�106
2,834�308
2,802�100
ECpermeate(ms=cm
)156�42
134�16
118�19
104�49
90�66
72�12
Rejection(%
)95.97
96.67
97.04
96.55
96.76
97.37
1712
Downloaded By: [Chiemchaisri, Chart] At: 02:02 2 June 2009

Estimation of Model Parameters and Determination of Model Accuracy
The specific flux data of the bench-scale experiment from both factorieswere calculated for the fouling index parameters. Subsequently, three setsof fouling index data obtained from the different operation periods(1 day, 7 days, and 30 days) were plotted against the specific volume todetermine three sets of the initial fouling index (Io) and the reductioncoefficient (d). Consequently, the estimated specific flux profiles werecalculated from these empirical parameters. The accuracies of theseempirical parameters obtained from the different operating periods werecompared.
In case of factory A, the model parameters and the calculated profilesof specific flux are shown in Table 4 and Fig. 2, respectively. It was foundthat the appreciating order of reaction rate is 2.2 for all conditions. More-over, similar profiles were achieved from all of the models which were cal-culated from different operation periods. The values of SSE of conditionA1 were 0.214, 0.149, and 0.132, for the operation periods of 1 day, 7days, and 30 days, respectively. In addition, the SSE values of conditionA2 were 0.133, 0.032, and 0.028. The values of SSE of condition A3 were0.033, 0.032, and 0.012. From these results, the lowest SSE value wasachieved from the operation period of 30 days. The model derived fromcondition A3, the normal operating condition of pilot-scale plant, which
Table 4. Comparison of model parameters between different periods fromfactory A
Experimental condition
ParametersA1: without
chemical additionA2: additionof anti-scalant
A3: addition ofanti-scalant and biocide
1 dIo (m
�2) 3.561� 1014 1.117� 1015 6.011� 1014
d (m�1) 2.155� 10�17 9.673� 10�18 1.421� 10�17
SSE 0.214 0.133 0.0337 dIo (m
�2) 2.895� 1014 1.118� 1016 7.735� 1014
d (m�1) 2.155� 10�17 2.180� 10�18 1.755� 10�17
SSE 0.149 0.032 0.03230 dIo (m
�2) 6.480� 1014 1.193� 1016 5.147� 1015
d (m�1) 1.789� 10�17 2.059� 10�19 1.811� 10�17
SSE 0.132 0.028 0.012
Note. n¼ 2.2.
RO Flux Decline Modeling 1713
Downloaded By: [Chiemchaisri, Chart] At: 02:02 2 June 2009

was calculated from the period of 30 days, is shown as follows:
L ¼ 1
g RM þ VA
5:147� 1015ð Þ1:2
1þ ð1:2Þ� 1:8110� 10�17VA 5:147� 1015ð Þ1:2½ �
� � 11:2ð Þ" #* + ð14Þ
In case of factory B, Table 5 and Fig. 3 shows the empirical para-meters and the specific flux profiles of each experimental condition.The values of SSE of condition B1 were 0.242, 0.037, and 0.030 for theoperation periods of 1 day, 7 days, and 30 days, respectively. In addition,SSE values of condition B2 were 0.183, 0.073, and 0.030. The values ofSSE of condition B3 were 0.053, 0.051, and 0.029. From these results,the best fit was obtained from the model which was calculated fromthe period of 30 days, similar to factory A. The comparison of SSE values
Figure 2. Comparison of the calculated specific flux profile between differentoperating periods (1day, 7 days, and 30 days) using the data of factory A.
1714 T. Srisukphun et al.
Downloaded By: [Chiemchaisri, Chart] At: 02:02 2 June 2009

and specific flux between 1 day, 7 days, and 30 days operation suggestedthat the model, which was derived from the operation period of 7 days, isalso in good agreement with the experimental data (Fig. 3). The modelderived from condition B3 at 30 days operation period is showed inEq. (15). From these results, it suggests that the bench scale operationdata of 7 days or longer could be used for the estimation of empiricalparameters for long term modeling of RO flux decline.
L ¼ 1
g RM þ VA
5:147�1015ð Þ1:2
1þ½ð1:2Þ�1:301�10�17VA 5:147�1015ð Þ1:2�
� � 11:2ð Þ" #* + ð15Þ
Sensitivity Analysis of Model Parameters
Figure 4 shows the effect of reduction coefficient (d), initial fouling index(Io), and the rate-order (n). It was found that the change in reductioncoefficient led to change in fouling index and specific flux profile. Anincrease in the reduction coefficient decreased the fouling index and ledto an increase of the specific flux. On the other hand, the decrease inthe reduction coefficient gave opposite results. The initial fouling indexaffected the specific flux only during the initial stage of operation.
Table 5. Comparison of model parameters between different periods fromfactory B
Experimental case
ParameterWithout chemical
additionAddition ofanti-scalant
Addition ofanti-scalant and biocide
1 dIo (m
�2) 6.986� 1014 1.305� 1014 6.049� 1014
d (m�1) 1.858� 10�17 2.067� 10�17 1.770� 10�17
SSE 0.242 0.183 0.0537 dIo (m
�2) 4.324� 1014 1.118� 1016 1.650� 1014
d (m�1) 8.180� 10�18 1.910� 10�17 3.312� 10�17
SSE 0.037 0.073 0.05130 dIo (m
�2) 4.052� 1014 4.590� 1014 5.147� 1015
d (m�1) 7.347� 10�17 1.832� 10�17 3.151� 10�17
SSE 0.030 0.035 0.029
Note. n¼ 2.2.
RO Flux Decline Modeling 1715
Downloaded By: [Chiemchaisri, Chart] At: 02:02 2 June 2009

In long-term operation, the specific flux was not influenced by this para-meter. The rate-order results in significant change of the specific flux pro-file. A minute increase of rate-order from 2.20 to 2.25 (�þ2.7%) yieldedalmost a constant profile of specific flux throughout the operation. Inaddition, a small decrease of rate-order from 2.20 to 2.15 (��2.7%)caused the large drop in the specific flux.
Model Competence in Assessment of Flux Decline in Larger
Scale RO Units
The empirical parameters derived from both bench-scale reclamationplants, in which the anti-scalant and the biocide were added, were testedfor their accuracy with long-term data of the pilot-scale plants. Thespecific flux profiles, which were determined from the model usingconstant fouling index concept (Eq. (9)) were also compared.
Figure 3. Comparison of the calculated specific flux profile between differentoperating periods (1day, 7 days, and 30 days) using the data of factory B.
1716 T. Srisukphun et al.
Downloaded By: [Chiemchaisri, Chart] At: 02:02 2 June 2009
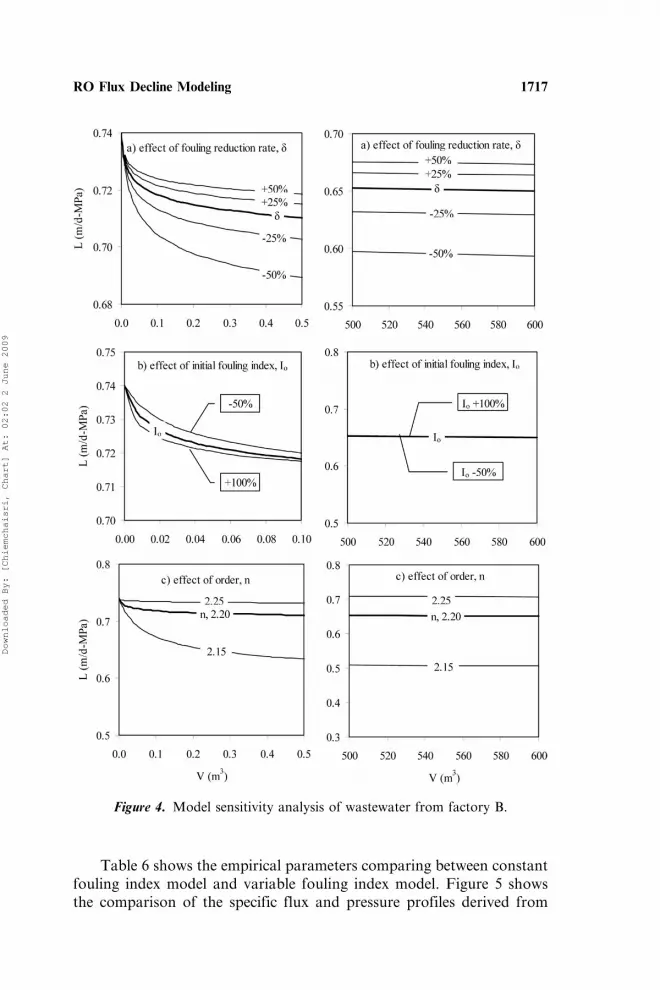
Table 6 shows the empirical parameters comparing between constantfouling index model and variable fouling index model. Figure 5 showsthe comparison of the specific flux and pressure profiles derived from
Figure 4. Model sensitivity analysis of wastewater from factory B.
RO Flux Decline Modeling 1717
Downloaded By: [Chiemchaisri, Chart] At: 02:02 2 June 2009

Table 6. The empirical parameters comparing between model with constantfouling index and model with variable fouling index
Parameters Factory A Factory B
Constant I1=Lo¼ gRM 0.1998 0.1382gI 1.4976 1.3509SSE 2.002 1.610Variable In 2.2 2.2Io 5.147� 1015 5.147� 1015
d 1.811� 10�17 1.301� 10�17
SSE 1.379 1.340
Note. The models with constant fouling index were calculated from Eq. (8).The models with variable fouling index were calculated from Eq. (10).
Figure 5. Comparison of the specific flux profiles and net driving pressure profilesbetween the constant fouling index model and the variable fouling index model.
1718 T. Srisukphun et al.
Downloaded By: [Chiemchaisri, Chart] At: 02:02 2 June 2009

constant fouling index and variable fouling index models with pilot scaleoperation data. In the comparison, the variable fouling index models offactory A and factory B previously described in Eqs. (14) and (15) arewhereas the constant fouling index for factory A and factory B inEqs. (16) and (17) are used.
Factory A:1
L¼ 0:1998þ 1:4976
V
Að16Þ
Factory B:1
L¼ 0:1382þ 1:3509
V
Að17Þ
It was found that, in case of Factory A, SSE values of the model withconstant fouling index and a model of variable fouling index were 2.002and 1.379 respectively. In case of Factory B, SSE values were 1.600 and1.340. Hence, the model with the variable fouling index provided a moreaccurate estimation of specific flux and pressure in the RO systemjudging from the lower value of SSE.
CONCLUSIONS
This research is proposing a model for estimation of the specific fluxprofile in long-term operation of a full-scale plant using short-term datafrom the bench-scale experiment. The model with variable fouling indexwas developed for simulation of the RO unit. The results are summarizedas follows:
1. The variable fouling index model was successfully used to model ROflux decline in a textile wastewater reclamation plant. It also providedmore accurate results than the constant fouling index model.
2. In this study, bench scale operation data of 7 days or more provided apromising accuracy for the estimation of flux decline in long-termoperation of larger scale system using variable fouling index model.
3. The membrane area and element size do not significantly affect theaccuracy of the proposed model in this study. Short-term operationin a small-scale experimental set-up was successfully applied to assessthe productivity of a larger plant in a long-term operation.
ACKNOWLEDGEMENT
The authors are grateful for the financial support given by KasetsartUniversity Research and Development Institute (KURDI).
RO Flux Decline Modeling 1719
Downloaded By: [Chiemchaisri, Chart] At: 02:02 2 June 2009

NOMENCLATURE
A membrane area (m2)C cake concentrationI fouling index (m�2)Io initial fouling index (m�2)J permeate flux (m=d)L specific flux (m=d-MPa)MFI modified fouling indexn order of reaction rateRA adsorption resistance (m�1)RC cake filtration resistance (m�1)RCP concentration polarization resistance (m�1)RF foulant resistance (m�1)RM resistance due to membrane (m�1)RP pore blocking resistance (m�1)RT total resistance (m�1)t filtration time (day)V permeate volume (m3)DP net driving pressure (MPa)a specific cake resistanced reduction coefficient (m�1)g viscosity
REFERENCES
1. Marcucci, M.; Nosenzo, G.; Capanelli, G.; Ciabatti, I.; Corrieri, D.; Ciardelli,G. (2001) Treatment and reuse of textile effluents based on new ultrafiltrationand other membrane technologies. Desalination, 138: 75.
2. Jiraratananon, R.; Sungpet, A.; Luangsowan, P. (2000) Performance evalua-tion of nanofiltration membranes for treatment of effluents containingreactive dye and salt. Desalination, 130: 177.
3. Suksaroj C.; Heran, M.; Allegre, C.; Persin, F. (2005) Treatment of textileplant effluent by nanofiltration and=or reverse osmosis for water reuse.Desalination, 178: 333.
4. Al-Ahmad, M.; Aleem, F.A.A.; Mutiri, A.; Ubaisy, A. (2000) Biofoulingin RO membrane systems part1: Fundamentals and control. Desalination,132: 173.
5. Baker, J.S.; Dudley, L.Y. (1998) Biofouling in membrane systems-A review.Desalination, 118: 81.
6. Brauns, E.; van Hoof, E.; Molenberghs, B.; Dotremont, C.; Doyen, W.;Leysen, R. (2002) A new method of measuring and presenting the membranefouling potential. Desalination, 150: 31.
1720 T. Srisukphun et al.
Downloaded By: [Chiemchaisri, Chart] At: 02:02 2 June 2009
7. Chang, I.S.; Clech, P.L.; Jefferson, B.; Judd, S. (2002) Membrane fouling inmembrane bioreactors for wastewater treatment. J. Environ. Eng., 11: 1018.
8. Pervov, A.G. (1999) A simplified RO process design base on understandingof fouling mechanisms. Desalination, 126: 227.
9. Rabie, H.R.; Cote, P.; Adams, N. (2001) A method for assessing membranefouling in pilot and full scale systems. Desalination, 141: 237.
10. Tu, S.-C.; Ravindran, V.; Pirbazari, M. (2005) A pore diffusion transportmodel for forecasting the performance of membrane process. J. MembraneSci., 265: 29.
11. Braeken, L.; van der Bruggen, B.; Vandecasteele, C. (2006) Flux decline innanofiltration due to adsorption of dissolved organic compounds: Modelprediction of time dependency. J. Phys. Chem. B., 110: 2957.
12. Schafer, A.L.; Fane, A.G.; Waite, T.D. (2005) Nanofiltration – Principles andApplications: Elesvier Advanced Technology, UK, p. 560.
13. Boerlage, S.F.E.; Kennedy, M.D.; Aniye, M.P.; Abogrean, E. M.; E1-Hodali,D.E.Y.; Tarawneh, Z.S.; Schippers, J.C. (2000) Modified foulingindexultrafiltration to compare pretreatment processes of reverse osmosisfeedwater. Desalination, 131: 201.
14. Bian, R.; Yamamoto, K.; Watanabe, Y. (2000) The effect of shear rate oncontrolling the concentration polarization and membrane fouling. Proc. ofthe Conference on Membranes in Drinking and Industrial Water Production.L’ Aquila. Italy. October 2000.
15. Wilbert, M.C.; Pellegrino, J.; Zydney, A. (1998) Bench-scale testing ofsurfactant-modified reverse osmosis=nanofiltration membranes. Desalination.115: 15.
16. Cornelis, G.; van der Bruggen, B.; Vandecasteele, C. (2005) Purification ofsurfactant containing effluents from the textile industry using ultrafiltrationand nanofiltration. Proc. of Membrane Process 2005. August, 21–26. Seoul,Korea.
17. Thanuttamavong, M.; Yamamoto, K.; Oh, J.I.; Choo, K.H.; Choi, S.J.(2002) Rejection characteristics of organic and inorganic pollutants by ultralow-pressure nanofiltration of surface water for drinking water treatment.Desalination, 145: 257.
RO Flux Decline Modeling 1721
Downloaded By: [Chiemchaisri, Chart] At: 02:02 2 June 2009