macq-ro insights
TRANSCRIPT

Please refer to page 41 for important disclosures and analyst certification, or on our website www.macquarie.com/research/disclosures.
GLOBAL
Why this issue matters to investors
1) President Trump is attempting to bring
factories back to the US. To succeed,
economic incentives have to be altered
2) This is possible through a radical
reduction in US corporate tax rates and
import tariffs
3) A 45% tariff on Chinese imports into the
US would result in an estimated 14%
volume decline in Chinese imports
4) A 20% tariff on all US imports would result
in an estimated 4% volume decline in total
US imports
5) Profits are highly vulnerable. Rather than
Asian exporters, it is safer for investors to
seek MNCs that are regionally self-
sufficient
Other related reports:
14 February 2017 The Global Macro outlook: Policy shifts in the US
19 January 2017 Fortress America: Buy America! Trade policy is great again
31 January 2017 An activist US trade policy a.k.a. protectionism
25 January 2017 Global slump scenarios, and the EM economies that concern us the most
11 January 2017 Following the new smart money
Analyst(s) Macquarie Capital Securities (Japan) Limited Peter Eadon-Clarke +81 3 3512 7850 [email protected] Nara Song +81 3 3512 7878 [email protected] Macquarie Capital Markets Canada Ltd. David Doyle, CFA +1 416 848 3663 [email protected]
1 March 2017
Macq-ro insights Factory Asia at risk: the numbers President Trump is attempting to roll back the ICT revolution’s 30-year impact on
multinationals (MNCs) sliced and diced supply chains, and to bring factories
back to the US. To succeed, economic incentives have to be altered.
Dramatic developments on US trade policy, the Budget and tax reform are
expected. Whilst attention is focussed currently on the potential for import tariffs,
the upcoming legislation for a radical reduction in US corporate tax rates (from
35% to say 20%) would also contribute to a revival in US-based manufacturing.
Whilst it is not clear yet how President Trump will proceed on trade, candidate
Trump provided a detailed roadmap in a speech on 28 June 2016, pages 2-3.
We believe Factory Asia is facing its most serious challenge in decades.
A 45% tariff on Chinese imports into the US would result in an estimated 14%
volume decline in Chinese imports. US domestic production would replace half;
other countries would supply the balance. The impact on US GDP would be
marginal, possibly positive. The real damage arrives with retaliation, pages 4-6.
Estimated decline in Chinese imports on a 45% tariff scenario
Pass-through rate (%) Price elasticity of US consumer demand to Chinese Imports 0.4 0.6 0.8 1.0
20 3.6 5.4 7.2 9.0 40 7.2 10.8 14.4 18.0
60 10.8 16.2 21.6 27.0 80 14.4 21.6 28.8 36.0
Source: Macquarie Research, March 2017
A 20% tariff on all US imports, tax reform’s possible border tax adjustment,
would result in an estimated 4% volume decline in total US imports.
Whilst the 45% tariff scenario results in only a 1.3% volume decline in total US
imports, there is a high risk of immediate retaliation, in our opinion. The second
scenario is likely to face a WTO challenge first.
Profits are highly vulnerable, reflecting the need to absorb part of the tariff
imposition, as well as the negative volume effect. An analysis of the textiles and
footwear sector by Terence Chang et al, Quantifying the US border tax impact,
estimated base case profit declines of 39% for HK/China footwear companies
and -18% for apparel companies. Given their extensive engagement in Factory
Asia, we judge many Japanese MNCs to be at risk. Rather than Asian exporters,
it is safer for investors to seek MNCs that are regionally self-sufficient.
East Asian growth: The integrated export supply-chain of Factory Asia means
that any fall in US imports from China has negative spill-over consequences
across East Asia. The resulting negative impact on real GDP growth is estimated
to be broadly similar across East Asian countries, though North East Asia
appears to be hit proportionally a little harder than ASEAN, page 28.
Lower trend growth in East Asia appears likely as the contribution from capital
deepening becomes less. We use trend growth rates as the anchor around
which our forecasts oscillate. We reduce our East Asia trend growth forecast by
0.2 ppt to 4.5% pa, from page 24.

Macquarie Research Macq-ro insights
1 March 2017 2
Candidate Trump on trade Whilst it is not clear yet how President Trump will proceed, candidate Trump provided a detailed roadmap in a speech on 28 June 2016.
The source of the potential 45% tariff on Chinese imports is explained on page 6.
28 June 2016, Pennsylvania, Trump’s speech on trade, selected quotes:
Hillary Clinton unleashed a trade war against the American worker when she supported one
terrible trade deal after another – from NAFTA to China to South Korea. A Trump
administration will end that war by getting a fair deal for the American people. The era of
economic surrender will finally be over.
Our politicians have aggressively pursued a policy of globalization, moving our jobs, our
wealth and our factories to Mexico and overseas. Globalization has made the financial elite,
who donate to politicians, very, very wealthy. I used to be one of them. I hate to say it, but I
used to be one. But it has left millions of our workers with nothing but poverty and heartache.
When subsidized foreign steel is dumped into our markets, threatening our factories, the
politicians have proven, folks, have proven they do nothing.
We allowed foreign countries to subsidize their goods, devalue their currencies, violate their
agreements and cheat in every way imaginable, and our politicians did nothing about it.
Trillions of our dollars and millions of our jobs flowed overseas as a result.
Today, we import nearly US$800bn more in goods than we export. We can’t continue to do
that. This is not some natural disaster, it’s a political disaster and politician-made disaster.
Very simple. And it can be corrected and we can correct it fast when we have people with the
right thinking.
And listen to this. The first Republican president, Abraham Lincoln, warned that, quote “the
abandonment of the protective policy by the American government will produce want and ruin
among our people.” He understood it much better than our current politicians, that’s why he
was Abraham Lincoln, I guess.
Ladies and gentlemen, it is time to declare our economic independence once again. I’ll do it.
No doubt about it. Not even a little doubt. It also means reversing two of the worst legacies of
the Clinton years. At the center of the catastrophe are two trade deals…
First, the North American Free Trade Agreement, or the disaster called NAFTA.
Second, China’s entry into the World Trade Organization.
China’s entrance into the WTO has enabled the greatest job theft in the history of our country
I have been talking about for many years. And you know what? Nobody listened. But they are
listening now. Almost half of our entire manufacturing trade deficit in goods with the world is
the result of trade with China.
Trade reform and the negotiation of great trade deals is the quickest way to bring our jobs
back to our country.
A Trump administration will change our failed trade policies, and I mean quickly. Here are
seven steps I would pursue right away to bring back our jobs.
Number one, I am going to withdraw the United States from the Trans-Pacific Partnership,
which has not yet been ratified.
I am going to appoint the toughest and smartest, and I know them all, trade negotiators to
fight on behalf of American workers.
I am going to direct the secretary of commerce to identify every violation of trade agreements
a foreign country is currently using to harm you, the American worker. I will then direct all
appropriate agencies to use every tool under American and international law to end these
abuses. And abuse is the right word.
Here are seven
steps I would
pursue right away to
bring back our jobs
We allowed foreign
countries to
subsidize their
goods, devalue their
currencies, violate
their agreements
and cheat in every
way imaginable, and
our politicians did
nothing about it

Macquarie Research Macq-ro insights
1 March 2017 3
Number four. I'm going to tell our NAFTA partners that I intend to immediately renegotiate the
terms of that agreement to get a better deal by a lot. Not just a little, by a lot for our workers.
And if they don't agree to a renegotiation, which they might not because they are so used to
having their own way -- not with Trump they won't have their own way. Then, I will submit
under Article 2205 of the NAFTA Agreement that America intends to withdraw from the deal.
Number five. I'm going to instruct my treasury secretary to label China a currency
manipulator, which should have been done years ago. Any country that devalues their
currency in order to take unfair advantage of the United States, which is many countries, will
be met with sharply. And that includes tariffs and taxes.
Number six, I'm going to instruct the U.S. trade representative to bring trade cases against
China, both in this country and at the WTO. China's unfair subsidy behavior is prohibited by
the terms of its entrance to the WTO and I intend to enforce those rules and regulations. And
basically, I intend to enforce the agreements from all countries, including China.
Seven, if China does not stop its illegal activities, including its theft of American trade secrets,
I will use every lawful -- this is very easy. This is so easy. I love saying this. I will use every
lawful presidential power to remedy trade disputes, including the application of tariffs
consistent with Section 201 and 301 of the Trade Act of 1974, and Section 232 of the Trade
Expansion Act of 1962.
And when they say trade expansion, they're talking about other countries, they're not talking
about us because there is no expansion. They get the expansion, we get the joblessness.
That's the way it works. It's not going to happen anymore. President Reagan deployed similar
trade measures when motorcycle and semiconductor imports threatened U.S. industry. I
remember. His tariff on Japanese motorcycles was 45 percent and his tariff to shield
America's semiconductor industry was 100 percent, and that had a big impact, folks. A big
impact.
A new era of prosperity will finally begin. America will be independent once more.
Independent once more. Doesn't that sound great? Under a Trump presidency, the American
worker will finally have a president who will protect them and fight for them. We will stand up
to trade cheating. Cheating. Cheaters, that's what they are. Cheaters. We will stand up to
trade cheating anywhere and everywhere it threatens the American job.
Will President Trump implement Candidate Trump’s policies?
Following the US election on 8 November 2016, financial markets embraced the “Reflation
trade” and as shown in Fig 1 and Fig 2, both the real yield, the growth proxy, and the inflation
compensation element continued rising until late December.
However since late December, growth expectations have fallen, whilst inflationary
expectations have continued to rise: a combination consistent with the bond market
discounting a higher probability of protectionist policies being implemented.
Fig 1 The real yield component, the growth proxy Fig 2 The US inflation compensation element
Note: The above is the 10-year US TIPS yield
Source: St. Louis, Macquarie Research, March 2017
Note: The 10-year US bond yield minus the 10-year US TIPS yield:
Source: Datastream ,Macquarie Research, March 2017
0
0.1
0.2
0.3
0.4
0.5
0.6
0.7
0.8
10/2016 11/2016 12/2016 01/2017 02/2017
10 year TIPS yield
1.6
1.7
1.8
1.9
2
2.1
2.2
10/2016 11/2016 12/2016 01/2017 02/2017
Inflation compensation
If China does not
stop its illegal
activities, including
its theft of American
trade secrets, I will
use every lawful --
this is very easy.
This is so easy. I
love saying this. I
will use every lawful
presidential power
to remedy trade
disputes, including
the application of
tariffs consistent
with Section 201
and 301 of the Trade
Act of 1974, and
Section 232 of the
Trade Expansion
Act of 1962

Macquarie Research Macq-ro insights
1 March 2017 4
Tariffs: concepts and numbers The following uses the methodology laid in out the paper Trump’s Tariffs: A dissent of 5 April
2016 by J.W. Mason.
A 45% tariff on Chinese imports
Assumption #1 Chinese exported/US importer pass-through rate: 40%
So a 45% tariff leads to a US consumer price rise of 18% (45 times 0.4). This is the split
between how much of the tariff is absorbed by the producers, importers in squeezed profit
margins, and how much is paid by consumers.
As an offset to squeezed RMB profit margins, another effect could be a fall in the value of the
RMB versus the US$, which reduces the Chinese cost of production in US$ terms. Please
see assumption #4 below.
Assumption #2 Price elasticity of US consumer demand to Chinese goods is 0.8
So an 18% increase in price leads to a 14% decrease in Chinese imports. This assumption
and the next one are about how the consumer reacts: do they pay the higher price which
leads to a fall in spending on other goods and services (real incomes fall), do they switch to
alternative imports at the old price (GDP neutral), or do they switch to domestically produced
goods boosting US growth (on a variety of assumptions)?
The import price elasticity tends to be lower the greater the complexity of the product e.g.
capital goods and/or intangible aspects such as brand. We assume China’s exports to the US
are mainly simple consumer goods.
Fig 3 Estimated decline in Chinese imports on a 45% tariff scenario
Pass-through rate (%) Price elasticity of US consumer demand to Chinese Imports 0.4 0.6 0.8 1.0
20 3.6 5.4 7.2 9.0 40 7.2 10.8 14.4 18.0
60 10.8 16.2 21.6 27.0 80 14.4 21.6 28.8 36.0
Source: Macquarie Research, March 2017
Assumption #3 Substitution 50% domestic, 50% foreign non-China
For simplicity, let’s assume these are supplied at the same price, but are of a lower quality.
This assumption gives the US total import price elasticity (0.5).
The following table gives an indication of the variation of estimates around this assumption.
Fig 4 US trade (import, export) price elasticities, survey of estimates (to one decimal point)
Study Years Imports Exports Measure
Income Price Income Price (see note)
Herve et al. (2010) n/a 1.2 0.3 1.0 0.6 C
Wu (2008) 1960-1998 2.2 0.2 1.6 1.4 E
Kwack et al. (2007) 1984-2003 1.9 0.9 P
Crane, Crowley and Quayyum (2007) 1955-2006 2.0 0.6 2.3 0.6 P, E
Bahmani-Oskooee and Ardalani (2006) 1991-2002 1.8 0.1 2.5 0.8 E
Mann and Plck (2005) 1980-2003 2.2 0.3 1.4 0.2 P
Chinn (2005) 1975-2004 2.4 0.2 1.9 0.8 E
Hooper, Johnson and Marquez (1998) 1960-1994 2.1 0.5 1.3 1.0 P
Senhadji (1998), Senhadji and Montenegro (1999) 1960-1993 2.5 0.5 1.0 0.7 P
Wren-Lewis and Driver (1998) 1980-1995 2.4 0.2 1.2 0.7 E
Marquez (1999) 1973-1985 1.9 0.8 1.4 0.8 P
Housthakker and Magee (1969) 1951-1966 1.7 1.0 1.0 1.5 P
Note: The far right column indicates if “price’ was measured with an import price index (P), the exchange rate (E), or competiveness, i.e. relative wages (C). The “P” estimates are the most relevant for a tariff
Source: Trump’s Tariffs: A Dissent by J.W. Mason (April 2016), Macquarie Research, March 2017
The import volume
decline equals:
Tariff rate times
Pass-through rate
times
Price elasticity of
US consumer
demand
A 14% decrease in
Chinese imports

Macquarie Research Macq-ro insights
1 March 2017 5
Assumption #4 The RMB remains broadly flat with the US$ in year one
As noted in assumption #3 other non-US countries are taking market share from China. This
would be expected to put downward pressure on the RMB exchange rate. We assume the
PBoC intervenes to offset this. We believe Chinese policymakers are keen to manage
exchange rate expectations, and to avoid depreciation expectations becoming entrenched.
Some additional implications
1) The 45% tariff on Chinese imports: the impact on US household income, as
measured by the increase in the US import bill, Fig 5.
Fig 5 US household income impact: the increased US import bill (as a % of GDP)
As a percentage of GDP Before After Change % change
Total US imports 15.50 15.31 -0.19 -1.2
Import substitution (US production) 0.19 0.19 na
US Imports from China (volume) 2.70 2.32 -0.38 -14.0
China import price 1.00 1.18 +0.18 +18.0
US imports from non-China (volume) 12.80 12.99 +0.19 +1.5
Non-China import prices 1.00 1.00 0.00 0.0
Weighted overall import prices 1.00 1.03 0.03 3.2%
US import bill 15.50 15.73 +0.23 +1.5
Note: the import substitution, US production does not include multiplier effects in this table, i.e. the need to build new factories equipped with machinery
Source: Macquarie Research, March 2017
2) The China tariff impact on the US CPI
0.19 (China’s current share of US imports) times
0.15 (gross imports to US GDP) times
0.86 (remaining Chinese imports) times
18% (pass-through of tariff to CPI)
= 0.44% (Strictly, this measures the price impact on GDP, and thus we are assuming that this
flows through one-to-one to the 70% of GDP which is consumption)
Assumption #5: the multiplier effect of a fall in real incomes, perhaps compounded by
an asset market effect: a US income multiplier of 1.5 over two years
3) The impact on US GDP
Fig 6 The 45% China tariff impact on US GDP: Marginal, possibly positive
Negative US incomes are reduced by 0.23% of GDP (the increase in the import bill, Fig 5, grey highlights) multiplied by the 1.5 income multiplier = a loss of 0.35% of GDP
Positive Import substitution - imports from China are about 2.8% of US GDP times 7% (0.5 times 14%, the amount of reduced Chinese imports substituted by domestic production) = 0.20% of GDP. There is an income multiplier on this too, 1.5 times = a gain of 0.30% of GDP (*)
Positive In addition, US tax revenues go up as the 45% tariff is levied on the remaining Chinese imports: 0.19 times 0.15 times 0.86 times 45% = 1.1% of GDP. This could be used by the US government to increase US public sector expenditures or cut other taxes, stimulating the economy
Note: (*) Please note that import substitution, domestic production takes into account the current resource constraints of the US economy through the assumption of a US income multiplier of 1.5 over two years. This incorporates the capex expenditures, the resultant inflation consequences and any growth dampening policy response by the US Fed. Source: Macquarie Research, March 2017
Real damage arrives with retaliation (at the same 45% tariff rate)
US exports to China are 0.7% of US GDP, and the pass-through rate is likely to be higher on
more complex goods, say 60%. The price elasticity is also probably higher, as for a relatively
poor China, US products are likely more discretionary (Chinese consumers are more price-
sensitive). Let’s say that there is a 1.5 price elasticity of Chinese demand to US exports. 45%
times 0.6 times 1.5 times (equals a 40.5% decline in US exports to China) times 0.7 times the
1.5 US income multiplier = a loss of 0.43% of US GDP.
The impact on US
household income,
as measured by the
increase in the US
import bill
The impact on the
US CPI
The impact on US GDP
A loss of 0.4% of
US GDP

Macquarie Research Macq-ro insights
1 March 2017 6
The source of the 45% tariff number
Peter Navarro is the director of the National Trade Council. The National Trade Council will
be a newly formed body under the Trump Administration to “advise the President on
innovative strategies in trade negotiations, coordinate with other agencies to assess US
manufacturing capabilities and the defence industrial base, and help match unemployed
American workers with new opportunities in the skilled manufacturing sector.”
On 21 July 2016, the LA Times published an Op-ed by Peter Navarro: “Trump's 45% tariff on
Chinese goods is perfectly calculated”. To quote:
Trump’s suggestion of a 45% tariff on Chinese imports would, by my calculations, be an
appropriate level. More than 10 years ago, I began analyzing exactly how China’s state-run
industries significantly undercut foreign manufacturers and found that lower labor costs
accounted for only 39% of China’s price advantage. Five other unfair trade practices — the
aforementioned illegal export subsidies and currency manipulation along with intellectual
property theft and lax worker safety and environmental regulations — are the bigger story.
Fig 7 comes from Peter Navarro’s referred to 2006 paper: The Economics of the “China
Price”
Fig 7 Relative contributions of the eight China Price drivers, %, total 100%
1 Wages 39.41 2 Subsidies 16.71 3 Network clustering 16.02 4 Undervalued currency 11.44 5 Counterfeiting & Piracy 8.63 6 FDI 3.09 7 Health & Safety 2.44 8 Environmental 2.26
Source: The Economics of the “China Price” by Peter Navarro (2006), Macquarie Research, March 2017
Wages, network clustering and (possibly) FDI are acknowledged as largely “fair” advantages,
and ignoring the undervalued currency, the remaining four items highlighted in grey add to
30%. It appears that the overall estimates are still believed to be broadly valid. To quote Peter
Navarro’s 21 July 2016 Op-ed again:
When I added up the effects of such practices in China in 2006, they accounted for 43.7% of
the artificially low price of Chinese manufactured goods — almost exactly the amount of
Trump’s proposed tariffs. In the decade since my study was conducted, China’s cheating has
only worsened and become more institutionalized. For example, the bipartisan Commission
on the Theft of American Intellectual Property in 2013 estimated that the U.S. loses more than
$300 billion a year to intellectual property theft and blames China for 50% to 80% of the
problem.
A 20% across the board tariff (the possible border tax adjustment)
For a fuller discussion of this, please see David Doyle’s 19 January 2017 Fortress America: Buy America! Trade policy is great again.
Whilst the same methodology is used, and the same 40% pass-through to US prices is assumed, the price elasticity of US consumer demand to all imports is lower, say 0.5 (versus 0.8 for Chinese imports), and domestic substitution in this scenario is 100%.
A 20% tariff times a 0.40 pass-through (so an 8% increase in import prices) times a 0.5 price
elasticity of US consumer demand implies a 4% drop in import volumes. Imports are 15.5% of
US GDP, so this is equivalent to a 0.6% of US GDP.
The exchange rate assumption needs to be made explicit. Unlike the managed RMB
exchange rate, the other major trading partners of the US have floating exchange rates.
For simplification, we’ve embedded the exchange rate move into the pass-through rate. So a
40% pass-through rate implies that 60% is absorbed by profit margins and exchange rate
movements combined. By way of reference, 93% of all US imports are priced in the US$.
In the decade since
my study was
conducted, China’s
cheating has only
worsened and
become more
institutionalized
Trump’s suggestion
of a 45% tariff on
Chinese imports
would, by my
calculations, be an
appropriate level
A 4% decrease in
total import

Macquarie Research Macq-ro insights
1 March 2017 7
Trade related numbers
Fig 8 has basic trade data for East Asian countries; whilst the two following pages (page 8
and page 9) provide detailed data on the US trade balance.
A 14% decrease in Chinese imports to the US would reduce overall Chinese exports by 2.5%
(14 times 0.18, Fig 8 highlighted in grey), as a first round effect.
Fig 8 2015 export data, East Asian countries
Exports to: (in US$bn) Exports to: (% of total exports)
Exports GDP Exports/GDP a) US b) China c) Japan a) US b) China c) Japan (US$bn) (US$bn) (%)
Japan 625 4,384.5 14.3 126 109 NA 20.2 17.5 NA China 2,281 10,959.9 20.8 411 NA 136 18.0 NA 6.0 South Korea 527 1,378.9 38.2 70 137 26 13.3 26.0 4.9 Taiwan 280 525.2 53.4 34 74 20 12.0 26.4 7.0 Hong Kong 465 309.2 150.5 44 250 16 9.5 53.7 3.4
Vietnam 164 191.4 85.8 35 22 14 21.0 13.2 8.4 Thailand 211 395.6 53.3 24 23 20 11.2 11.1 9.4 Malaysia 200 297.1 67.3 19 26 19 9.4 13.0 9.5 Singapore 352 292.8 120.1 24 48 15 6.9 13.7 4.3 Philippines 59 292.2 20.1 9 6 12 15.0 10.9 21.1 Indonesia 150 861.0 17.5 16 15 18 10.8 10.0 12.0 ASEAN-6 1,136 2,330.0 48.8 127 140 98 11.2 12.3 8.6
Note: GDP is Oxford Economics, Exports data are from Datastream and IMF
Source: Oxford Economics, Datastream, IMF, Macquarie Research, March 2017
In our opinion, President Trump, wearied by the implications of the US being the ‘consumer of
last resort’, wants to rebalance the US economy, and bring factories back to the US.
This implies that President Trump probably focusses more on the trade balance (goods only)
than the current account which includes the services balance. Fig.9 contrasts the trade
balance positions of Factory Asia and the US. In line with other advanced economies, the US
has a growing surplus on its services balance.
The trade surplus of Factory Asia is now materially bigger than in the years leading to the
Global Financial Crisis (GFC). We believe that this ‘savings surplus’ was one of the main
drivers of the decline in global real interest rates, a contributor to the debt build-up in
advanced economies’ private sectors prior to the GFC.
Ten years later this global ‘fault line’ still exists.
Fig 9 Trade account balances: Factory Asia in surplus, the US in deficit
Note: Factory Asia is the aggregate of Japan, China, Korea, Taiwan, HK, and the ASEAN-5
Source: IMF, Datastream , Macquarie Research, March 2017
Please see page 29 for a chart of the current account balances of Factory Asia and the US.
-1200
-800
-400
0
400
800
1200 (USbn$)
Factory Asia
United States
The trade surplus of
Factory Asia is now
materially bigger
than in the years
leading to the
Global Financial
Crisis

Ma
cq
ua
rie R
esea
rch
M
acq-ro
insig
hts
1 M
arc
h 2
01
7
8
Fig 10 US Exports and Imports – snapshot by major trade partner and major product
Source: Bureau of Economic Analysis, Macquarie Research, March 2017
Trade Partner
Exports of
goods and
services
(millions of
USD) Goods total
Foods, feeds,
and beverages
Industrial
supplies and
materials
Capital goods
except
automotive
Automotive
vehicles, parts,
and engines
Consumer
goods except
food and
automotive
Other general
merchandise Services total
Maintenance
and repair
services Transport
Travel (for all
purposes
including
education)
Insurance
services
Financial
services
Charges for
the use of
intellectual
property
Telecom,
computer, and
information
services
Other business
services
Government
goods and
services
Euro Area 346,859 201,149 9,267 50,053 75,280 13,258 47,084 5,936 145,710 5,046 14,312 23,257 1,693 14,342 38,483 5,958 41,796 822
China 164,435 111,970 17,755 31,209 43,907 11,070 7,079 748 52,466 1,518 4,704 31,581 700 3,067 5,869 710 3,816 502
Canada 324,102 269,704 23,418 70,122 70,307 59,015 35,172 10,127 54,397 2,152 8,007 14,914 1,941 6,172 8,186 3,312 9,303 409
Mexico 261,868 230,622 16,234 76,561 82,312 33,524 14,653 7,205 31,245 723 3,981 16,985 396 1,444 3,326 1,128 2,793 468
Japan 106,141 61,959 11,124 14,913 22,709 2,034 8,974 2,173 44,184 1,163 9,219 11,435 2,025 3,843 6,973 1,494 7,403 627
United Kingdom 122,491 56,655 1,876 10,312 22,624 3,712 12,061 2,436 65,837 2,799 7,443 12,836 2,728 13,815 9,227 4,440 12,352 196
OPEC 107,885 71,451 6,149 12,366 30,700 9,119 5,837 6,666 36,434 3,227 3,178 12,994 322 2,566 1,743 2,272 5,813 4,320
South Korea 60,999 41,509 5,526 11,632 16,640 2,564 2,873 2,263 19,490 656 2,359 8,535 213 968 4,462 326 1,628 347
India 40,202 20,370 977 6,388 5,114 304 5,547 681 19,833 351 1,868 11,304 96 839 2,388 1,299 1,294 391
Brazil 54,309 28,828 659 12,040 12,408 1,032 2,198 490 25,482 607 4,330 9,217 396 1,620 3,333 4,197 1,632 150
Taiw an 37,938 26,293 2,897 5,443 14,564 279 1,217 1,846 11,645 938 2,128 2,244 42 650 4,270 149 602 624
Singapore 43,079 26,452 637 6,639 15,745 253 2,060 953 16,627 1,243 638 973 394 1,107 2,737 1,073 8,228 233
Australia 45,122 22,639 1,369 3,370 8,587 2,686 3,673 2,694 22,483 970 1,275 8,372 1,387 3,385 2,673 1,387 2,598 436
Total of above 1,715,430 1,169,601 97,888 311,048 420,897 138,850 148,428 44,218 545,833 21,393 63,442 164,647 12,333 53,818 93,670 27,745 99,258 9,525
US Total 2,201,653 1,455,593 131,758 383,174 520,175 150,787 193,608 56,776 746,062 26,147 84,807 206,326 17,743 95,023 121,300 37,288 138,055 19,370
Trade Partner
Imports of
goods and
services
(millions of
USD) Goods total
Foods, feeds,
and beverages
Industrial
supplies and
materials
Capital goods
except
automotive
Automotive
vehicles, parts,
and engines
Consumer
goods except
food and
automotive
Other general
merchandise Services total
Maintenance
and repair
services Transport
Travel (for all
purposes
including
education)
Insurance
services
Financial
services
Charges for
the use of
intellectual
property
Telecom,
computer, and
information
services
Other business
services
Government
goods and
services
Euro Area 442,586 331,073 20,497 51,638 92,276 48,120 99,166 19,249 111,514 1,235 21,658 25,371 6,530 2,901 12,888 5,778 28,510 6,643
China 477,769 461,942 5,752 42,135 168,068 18,948 221,652 5,353 15,827 520 4,346 4,521 55 583 426 923 4,341 112
Canada 311,773 282,365 23,798 119,066 34,076 65,711 18,016 17,833 29,406 1,559 5,853 6,605 467 1,827 1,362 4,170 7,306 258
Mexico 323,357 300,315 24,637 28,994 89,818 106,428 39,096 8,160 23,041 232 3,030 14,731 28 329 653 962 2,953 126
Japan 162,814 132,214 875 15,087 49,482 52,235 10,868 3,433 30,601 122 8,250 2,935 358 1,489 10,773 438 3,172 3,062
United Kingdom 105,526 53,802 2,586 9,900 13,527 9,140 12,146 6,423 51,724 2,533 7,969 8,247 4,275 8,536 3,685 2,320 13,413 746
OPEC 82,806 72,042 4,362 55,194 1,341 948 8,009 1,863 10,764 50 3,375 2,990 39 440 342 240 1,438 1,851
South Korea 81,637 70,910 661 11,928 17,443 25,970 13,409 1,500 10,726 16 5,657 1,200 98 249 216 60 1,055 2,176
India 70,839 44,737 2,771 8,167 4,278 1,243 27,611 666 26,101 20 547 3,203 49 522 371 14,808 6,536 43
Brazil 31,024 24,396 2,697 11,503 5,163 1,051 1,473 1,951 6,629 510 779 945 31 449 1,449 449 1,974 45
Taiw an 46,632 39,048 432 6,954 19,426 3,213 7,452 1,572 7,583 37 5,016 1,311 12 137 34 50 928 58
Singapore 25,601 18,583 65 3,992 8,342 46 3,712 2,290 7,019 620 1,202 536 205 821 115 387 3,005 126
Australia 17,347 9,932 3,263 2,304 1,547 317 1,407 954 7,415 33 1,019 1,797 505 796 577 301 2,177 211
Total of above 2,179,711 1,841,359 92,396 366,862 504,787 333,370 464,017 71,247 338,350 7,487 68,701 74,392 12,652 19,079 32,891 30,886 76,808 15,457
US Total 2,692,256 2,194,719 129,332 432,747 592,752 350,727 585,227 86,558 497,538 8,530 96,415 119,645 47,644 24,612 42,010 37,053 100,882 20,747
US Exports 4Q15 through 3Q16
US Imports 4Q15 through 3Q16
Goods Services
Goods Services

Ma
cq
ua
rie R
esea
rch
M
acq-ro
insig
hts
1 M
arc
h 2
01
7
9
Fig 11 US net exports and total trade – snapshot by major trade partner and major product
Source: Bureau of Economic Analysis, Macquarie Research, March 2017
Trade Partner
Net exports of
goods and
services
(millions of
USD) Goods total
Foods, feeds,
and beverages
Industrial
supplies and
materials
Capital goods
except
automotive
Automotive
vehicles, parts,
and engines
Consumer
goods except
food and
automotive
Other general
merchandise Services total
Maintenance
and repair
services Transport
Travel (for all
purposes
including
education)
Insurance
services
Financial
services
Charges for
the use of
intellectual
property
Telecom,
computer, and
information
services
Other business
services
Government
goods and
services
Euro Area (95,727) (129,924) (11,230) (1,585) (16,996) (34,862) (52,082) (13,313) 34,196 3,811 (7,346) (2,114) (4,837) 11,441 25,595 180 13,286 (5,821)
China (313,334) (349,972) 12,003 (10,926) (124,161) (7,878) (214,573) (4,605) 36,639 998 358 27,060 645 2,484 5,443 (213) (525) 390
Canada 12,329 (12,661) (380) (48,944) 36,231 (6,696) 17,156 (7,706) 24,991 593 2,154 8,309 1,474 4,345 6,824 (858) 1,997 151
Mexico (61,489) (69,693) (8,403) 47,567 (7,506) (72,904) (24,443) (955) 8,204 491 951 2,254 368 1,115 2,673 166 (160) 342
Japan (56,673) (70,255) 10,249 (174) (26,773) (50,201) (1,894) (1,260) 13,583 1,041 969 8,500 1,667 2,354 (3,800) 1,056 4,231 (2,435)
United Kingdom 16,965 2,853 (710) 412 9,097 (5,428) (85) (3,987) 14,113 266 (526) 4,589 (1,547) 5,279 5,542 2,120 (1,061) (550)
OPEC 25,079 (591) 1,787 (42,828) 29,359 8,171 (2,172) 4,803 25,670 3,177 (197) 10,004 283 2,126 1,401 2,032 4,375 2,469
South Korea (20,638) (29,401) 4,865 (296) (803) (23,406) (10,536) 763 8,764 640 (3,298) 7,335 115 719 4,246 266 573 (1,829)
India (30,637) (24,367) (1,794) (1,779) 836 (939) (22,064) 15 (6,268) 331 1,321 8,101 47 317 2,017 (13,509) (5,242) 348
Brazil 23,285 4,432 (2,038) 537 7,245 (19) 725 (1,461) 18,853 97 3,551 8,272 365 1,171 1,884 3,748 (342) 105
Taiw an (8,694) (12,755) 2,465 (1,511) (4,862) (2,934) (6,235) 274 4,062 901 (2,888) 933 30 513 4,236 99 (326) 566
Singapore 17,478 7,869 572 2,647 7,403 207 (1,652) (1,337) 9,608 623 (564) 437 189 286 2,622 686 5,223 107
Australia 27,775 12,707 (1,894) 1,066 7,040 2,369 2,266 1,740 15,068 937 256 6,575 882 2,589 2,096 1,086 421 225
Total of above (464,281) (671,758) 5,492 (55,814) (83,890) (194,520) (315,589) (27,029) 207,483 13,906 (5,259) 90,255 (319) 34,739 60,779 (3,141) 22,450 (5,932)
US Total (490,603) (739,126) 2,426 (49,573) (72,577) (199,940) (391,619) (29,782) 248,524 17,617 (11,608) 86,681 (29,901) 70,411 79,290 235 37,173 (1,377)
Trade partner
Total trade of
goods and
services
(millions of
USD) Goods total
Foods, feeds,
and beverages
Industrial
supplies and
materials
Capital goods
except
automotive
Automotive
vehicles, parts,
and engines
Consumer
goods except
food and
automotive
Other general
merchandise Services total
Maintenance
and repair
services Transport
Travel (for all
purposes
including
education)
Insurance
services
Financial
services
Charges for
the use of
intellectual
property
Telecom,
computer, and
information
services
Other business
services
Government
goods and
services
Euro Area 789,445 532,222 29,764 101,691 167,556 61,378 146,250 25,185 257,224 6,281 35,970 48,628 8,223 17,243 51,371 11,736 70,306 7,465
China 642,204 573,912 23,507 73,344 211,975 30,018 228,731 6,101 68,293 2,038 9,050 36,102 755 3,650 6,295 1,633 8,157 614
Canada 635,875 552,069 47,216 189,188 104,383 124,726 53,188 27,960 83,803 3,711 13,860 21,519 2,408 7,999 9,548 7,482 16,609 667
Mexico 585,225 530,937 40,871 105,555 172,130 139,952 53,749 15,365 54,286 955 7,011 31,716 424 1,773 3,979 2,090 5,746 594
Japan 268,955 194,173 11,999 30,000 72,191 54,269 19,842 5,606 74,785 1,285 17,469 14,370 2,383 5,332 17,746 1,932 10,575 3,689
United Kingdom 228,017 110,457 4,462 20,212 36,151 12,852 24,207 8,859 117,561 5,332 15,412 21,083 7,003 22,351 12,912 6,760 25,765 942
OPEC 190,691 143,493 10,511 67,560 32,041 10,067 13,846 8,529 47,198 3,277 6,553 15,984 361 3,006 2,085 2,512 7,251 6,171
South Korea 142,636 112,419 6,187 23,560 34,083 28,534 16,282 3,763 30,216 672 8,016 9,735 311 1,217 4,678 386 2,683 2,523
India 111,041 65,107 3,748 14,555 9,392 1,547 33,158 1,347 45,934 371 2,415 14,507 145 1,361 2,759 16,107 7,830 434
Brazil 85,333 53,224 3,356 23,543 17,571 2,083 3,671 2,441 32,111 1,117 5,109 10,162 427 2,069 4,782 4,646 3,606 195
Taiw an 84,570 65,341 3,329 12,397 33,990 3,492 8,669 3,418 19,228 975 7,144 3,555 54 787 4,304 199 1,530 682
Singapore 68,680 45,035 702 10,631 24,087 299 5,772 3,243 23,646 1,863 1,840 1,509 599 1,928 2,852 1,460 11,233 359
Australia 62,469 32,571 4,632 5,674 10,134 3,003 5,080 3,648 29,898 1,003 2,294 10,169 1,892 4,181 3,250 1,688 4,775 647
Total of above 3,895,141 3,010,960 190,284 677,910 925,684 472,220 612,445 115,465 884,183 28,880 132,143 239,039 24,985 72,897 126,561 58,631 176,066 24,982
US Total 4,893,909 3,650,312 261,090 815,921 1,112,927 501,514 778,835 143,334 1,243,600 34,677 181,222 325,971 65,387 119,635 163,310 74,341 238,937 40,117
Goods Services
US Net Exports 4Q15 through 3Q16
US Total trade 4Q15 through 3Q16
Goods Services

Macquarie Research Macq-ro insights
1 March 2017 10
Factory Asia The discussion that follows focusses on a possible 45% tariff on Chinese exports. As the
above has illustrated this is a serious situation for Factory Asia. We need to go further than
the 14% fall in China’s export volumes to the US to include:
1) The country sources of the value-added in China’s exports. There is an East Asian
integrated supply chain, that often culminates in the final assembly in China before
shipment to the US
2) An allowance for the countries that might supply the substitute imports to the US.
To aid in judgements, there is a more detailed history of the evolution of Factory Asia from
page 14. First, we capture the essence of the situation on this and the next page.
A visual history of the emergence of Factory Asia
As the joint WTO & Ide-Jetro paper Trade patterns and global value chains in East Asia
notes, supplying demand in the US from East Asia began in the 1960s with mass
consumption and mass marketing. In 1970 Japan led the way, with Hong Kong the leading
Asian Tiger at that time, Fig 12. By 1990, Fig 13, South Korea and China had begun to
emerge, but Japan remained the dominant exporter to the US market.
Fig 12 Total US trade with selected Asian partners (US$bn), 1970
Fig 13 Total US trade with selected Asian partners (US$bn), 1990
Source: WTO, Macquarie Research, March 2017 Source: WTO, Macquarie Research, March 2017
Fig 14 Total US trade with selected Asian partners (US$bn), 2000
Fig 15 Total US trade with selected Asian partners (US$bn), 2009
Source: WTO, Macquarie Research, March 2017 Source: WTO, Macquarie Research, March 2017
0
1
2
3
4
5
6
7
0 1 2 3 4 5 6
Japan Singapore India Thailand China Republic of Korea Hong Kong Chinese Taipei Malaysia
(US imports)
(US exports)0
20
40
60
80
100
120
0 10 20 30 40 50 60
Japan Singapore India Thailand China Republic of Korea Hong Kong Chinese Taipei Malaysia
(US imports)
(US exports)
0
20
40
60
80
100
120
140
160
180
0 20 40 60 80
Japan Singapore India Thailand China Republic of Korea Hong Kong Chinese Taipei Malaysia
(US imports)
(US exports) 0
50
100
150
200
250
300
350
400
0 20 40 60 80 100
Japan Singapore India Thailand China Republic of Korea Hong Kong Chinese Taipei Malaysia
(US imports)
(US exports)

Macquarie Research Macq-ro insights
1 March 2017 11
Whilst from 1990 the narrative remains in country terms, it becomes increasingly misleading.
Whilst previously Japanese companies were predominantly producing and exporting from
Japan, now begins an aggressive slicing and dicing of their supply chains via FDI throughout
East Asia.
Fig 14 shows the situation on the eve of China’s December 2001 WTO entry. China had
already grown in importance relative to Japan, but as pages 14-23 explain, this reflected the
relocation of Japanese final assembly plants to China at an accelerating pace since 1992. In
terms of the source of East Asian exports to the US, in 2009, at the time of the Global
Financial Crisis (GFC), China had become dominant, Fig 15.
Fig 16 has the most recent data.
Fig 16 Total US trade with selected Asian partners, 2015
Source: BEA, Macquarie Research, March 2017
Identifying the country of origin of the value added in goods imported into the US (rather than
attributing everything to the final exporting country) is possible through using Input-Output
tables, the topic of the next section.
Fig 17 is one proxy for the importance of Japanese and other multinationals (MNCs). Please
note that number of Japanese affiliates in China that import and export at 2,260 compares to
the total of the US, Germany, Taiwan, South Korea and France of 2,207. As financial centres,
we chose to exclude HK and Singapore in this comparison. Please also note that Japan’s
affiliates are extensively represented across other East Asia nations (grey highlights).
Fig 17 Global value chain (GVC)-FDI, the most common bilateral pairs
Destination Origin Number of affiliates that import and export % of total affiliates
PRC Japan 2,260 81 PRC Hong Kong 1,314 76 PRC US 646 74 PRC Germany 625 76 PRC Taipei, China 401 79 PRC South Korea 358 86 PRC Singapore 337 71 Vietnam Japan 306 72 Thailand Japan 258 64 Indonesia Japan 214 53 Taipei, China Japan 212 74 PRC France 177 77 Malaysia Japan 175 78 Philippines Japan 171 69 Singapore Japan 164 54
Note: Asian economic integration report 2016 by the ADB. GVC-FDI refers to foreign affiliates engaged in both exports and imports. ADB calculations from data sourced from the Dun & Bradsheet D&B Worldbase
Source: ADB, Macquarie Research, March 2017
0
50
100
150
200
250
300
350
400
0 10 20 30 40 50 60 70 80 90 100
Japan Singapore India ThailandChina Republic of Korea Hong Kong Chinese Taipei Malaysia
(US imports)
(US exports)
Whilst from 1990 the
narrative remains in
country terms, it
becomes
increasingly
misleading
Whilst previously
Japanese
companies were
predominantly
producing and
exporting from
Japan, now begins
an aggressive
slicing and dicing of
their supply chains
via FDI throughout
East Asia
One proxy for the
importance of
Japanese and other
multinationals

Macquarie Research Macq-ro insights
1 March 2017 12
Sources of Value Added in Gross exports Conventional trade statistics measure the value of commerce between two countries, rather
than attributing the value-added in the goods. This has become increasingly important as
supply chains have sliced and diced activities. The following draws on the IMF 2013 working
paper Export performance in Europe: What do we know from supply links? By Jesmin
Rahman & Tianli Zhao. The vibrancy of Factory Europe is perhaps underappreciated.
The value-added of gross exports is subdivided by the location of value-added (domestic,
foreign) and for domestic value-added by the stage of production, Fig 18. Components 1 and
2 are stand-alone exports whilst components 3, 4 and 5 are parts of supply chains.
Domestic value-added intermediate exports, components 3 and 4, processed further in to
exports are “upstream”.
Component 5, the foreign-value-added going into final exports is “downstream”. The higher
the percentage the more likely the country is the downstream final assembler.
Fig 18 Decomposition of gross exports into five value-added components
Note: From the IMF working paper Export performance in Europe: What do we know from supply links? By Jesmin Rahman & Tianli Zhao (2013) which draws on Koopman, Powers, Wang & Wei (2011): Give credit where credit is due, Tracing value-added in global production chains
Source: IMF, Macquarie Research, March 2017
Fig.19 has the available data, comparing 2008 versus 1995. Please note that for Asia-Pacific
countries the slicing and dicing of MNC supply chains has led to:
1) A lower share of domestic value-added in gross exports, and a higher share of
foreign value-added (shaded in light brown). Japan has gone from 6.7% to 19.8%,
China from 17.5% to 31.4%, South Korea from 26.9% to 43.9% and Taiwan from
35.9% to 48.6%.
2) A relative increase in component 3, the export of intermediates which are processed
and then re-exported to third countries, shaded in pale red. Japan has gone from
14.3% to 21.1%, China from a modest 8.9% to a still modest 11.8%, South Korea
from 13.5% to 16.2%, and Taiwan from 10.4% to an impressive 20.8%.
3) The US and Germany are highlighted in pale green for comparison. Please note the
relatively high component 4 scores (exported intermediates that return home) in both
cases, but especially the US. This shows the importance of NAFTA trade.
4) Summing all three supply-chain components (3, 4 and 5), and comparing 1995 with
2008, the US has gone from 33.0% to 41.7%, Germany from 35.3% to 48.4% and
Japan from 22.6% to 42.2%, for increases of 8.7%, 13.1% and 19.6% respectively.
Whilst Japan has evolved the most rapidly since 1995, Germany remains the most
advanced.
Whilst Japan has
evolved the most
rapidly since 1995,
Germany remains
the most advanced
Conventional trade
statistics measure
the value of
commerce between
two countries,
rather than
attributing the
value-added in the
goods

Ma
cq
ua
rie R
esea
rch
M
acq-ro
insig
hts
1 M
arc
h 2
01
7
13
Fig 19 Value-Added Decomposition of Exports in Manufacturing: DVA is Domestic value added, FVA is Foreign value added, all numbers % unless otherwise stated
Country of Region
Decomposition in export of manufacturing good 1995 Decomposition in export of manufacturing good 2008
Gross manufacturing export (US$m)
DVA in direct
exports of final goods
DVA in intermediates
absorbed by direct importer
Indirect DVA exports to
third countries
Returned DVA FVA Total
Gross manufacturing export (US$m)
DVA in direct
exports of final goods
DVA in intermediates
absorbed by direct importer
Indirect DVA exports to
third countries
Returned DVA FVA Total
(1) (2) (3) (4) (5) (1) (2) (3) (4) (5)
CHN 136,325 50.6 22.6 8.9 0.4 17.5 100 1,803,921 35.4 19.8 11.8 1.5 31.4 100 JPN 399,313 39.3 38.0 14.3 1.6 6.7 100 723,610 29.2 28.7 21.1 1.3 19.8 100 KOR 119,391 29.5 29.6 13.5 0.4 26.9 100 424,822 18.8 20.7 16.2 0.4 43.9 100 TWN 108,406 28.7 24.8 10.4 0.2 35.9 100 254,976 10.6 19.8 20.8 0.2 48.6 100 INDIA 32,005 40.8 36.1 10.8 0.1 12.2 100 176,800 32.9 24.3 14.1 0.4 28.3 100 IDN 36,721 30.4 38.6 11.7 0.2 19.1 100 97,085 19.3 38.9 20.3 0.3 21.2 100 AUS 30,659 30.7 39.4 13.9 0.2 15.8 100 94,421 21.6 33.9 20.8 0.5 23.1 100
USA 479,211 35.6 31.4 11.0 8.9 13.1 100 1,001,641 30.9 27.5 14.8 6.8 20.1 100 CAN 158,479 27.6 34.4 7.1 0.8 30.2 100 300,671 26.3 30.9 9.9 1.0 32.0 100 MEX 54,824 31.5 25.4 7.6 0.3 35.2 100 199,372 28.3 23.4 9.4 0.5 38.5 100 BRA 41,011 24.4 50.0 16.3 0.3 9.0 100 145,530 32.8 32.6 18.6 0.4 15.6 100
DEU 511,451 36.3 28.3 14.3 2.7 18.3 100 1,434,387 29.5 22.2 16.5 2.1 29.8 100 FRA 261,160 37.1 25.6 13.8 1.4 22.1 100 576,334 32.8 19.7 15.5 1.2 30.9 100 ITA 219,179 41.7 25.0 11.9 0.8 20.6 100 515,486 34.3 21.1 15.6 0.9 28.1 100 GBR 225,865 36.3 25.6 13.8 1.3 23.0 100 403,728 32.3 21.5 16.4 1.1 28.6 100 NLD 148,442 28.9 21.2 12.9 0.7 36.4 100 329,863 24.0 15.5 13.8 0.5 46.2 100 ESP 86,279 37.8 24.9 12.9 0.6 23.7 100 269,583 30.3 19.7 14.5 0.9 34.7 100 BEL 134,844 24.0 19.2 12.3 0.5 44.0 100 267,975 18.0 14.7 13.4 0.3 53.7 100 SWE 77,872 29.1 27.7 15.3 0.4 27.5 100 176,392 23.7 20.7 16.1 0.3 39.2 100 POL 23,293 36.4 27.7 16.4 0.2 19.3 100 168,624 28.6 17.7 16.9 0.4 36.4 100 AUT 47,262 27.1 27.9 16.1 0.5 28.4 100 156,202 23.1 19.0 17.7 0.4 39.8 100 TUR 24,664 50.2 23.4 11.2 0.1 15.1 100 136,191 31.7 22.1 13.9 0.2 32.1 100 CZE 16,880 23.5 25.5 15.4 0.7 34.9 100 135,925 19.8 14.5 15.0 0.2 50.5 100 IRL 40,338 33.2 16.6 8.5 0.1 41.6 100 117,948 26.1 14.3 9.2 0.1 50.3 100 RUS 27,595 14.7 47.9 24.8 0.6 12.0 100 111,251 13.2 43.5 32.1 1.0 10.3 100 FIN 39,298 23.6 34.4 17.1 0.3 24.7 100 102,544 18.5 25.9 18.4 0.2 37.0 100 DNK 48,727 44.8 19.1 9.9 0.2 26.1 100 94,058 35.6 17.0 13.3 0.2 33.8 100 HUN 8,703 29.4 22.0 13.2 0.1 35.4 100 86,360 18.7 12.1 12.9 0.2 56.1 100 SVK 7,467 18.1 27.5 17.7 0.5 36.1 100 60,929 18.7 13.7 15.8 0.2 51.6 100 PRT 21,379 40.0 19.3 9.3 0.2 31.2 100 51,345 28.7 19.1 13.0 0.3 38.9 100 ROM 6,475 30.1 28.5 14.4 0.1 26.9 100 38,436 25.7 20.9 18.4 0.3 34.7 100 SVN 7,850 30.8 21.3 11.1 0.0 36.7 100 26,238 24.2 15.9 15.0 0.1 44.9 100 GRC 4,282 42.1 22.4 10.9 0.2 24.4 100 17,847 26.7 18.6 12.3 0.3 42.2 100 BGR 3,444 28.7 22.8 9.7 0.0 38.8 100 17,499 17.5 16.0 13.2 0.1 53.2 100 LTU 1,660 24.9 23.3 10.9 0.0 40.9 100 14,435 20.3 15.6 11.3 0.2 52.7 100 LUX 6,635 11.2 21.5 16.5 0.1 50.8 100 13,346 11.6 15.3 17.5 0.1 55.5 100 EST 1,380 28.7 20.3 10.7 0.1 40.2 100 8,650 20.9 21.1 16.2 0.1 41.7 100 LVA 871 29.5 28.4 13.5 0.0 28.6 100 5,598 24.4 21.6 14.9 0.3 38.8 100 MLT 1,363 15.9 11.7 7.3 0.0 65.1 100 2,763 17.5 13.5 12.7 0.0 56.4 100 CYP 848 42.9 13.9 3.9 0.0 39.2 100 1,457 29.7 18.3 10.7 0.1 41.2 100
Rest of the world 418,354 30.3 25.9 9.7 2.4 31.8 100 1,647,992 19.9 21.2 11.1 3.6 44.2 100
Total 58% 14% 28% 56% 16% 38%
Note: From the IMF working paper Export performance in Europe: What do we know from supply links? By Jesmin Rahman & Tianli Zhao (2013). Source: IMF, Macquarie Research, March 2017

Macquarie Research Macq-ro insights
1 March 2017 14
Japan & Factory Asia Multinationals (MNCs) deployed the ICT revolution over the 20 years up until 2008, and the
Global Financial Crisis, into what many call “Globalisation’s second unbundling”, the slicing
up of supply chains around the world. MNCs have been the primary transmission mechanism,
and have been rewarded by the increased global share of income going to capital. For more
analysis, please see the 20 May 2016 Macq-ro insights: from labour to capital.
Fig 20 comes from the February 2007 ADB working paper: Managing the Noodle Bowl: The
fragility of East Asian regionalism by Richard Baldwin. Richard Baldwin’s new book The Great
Convergence: Information technology and the new globalization (2016) is recommended.
Fig 20 Japanese plants in emerging East Asia
Fig 21 BITs, worldwide
Note: The figure shows the sum of plants in the auto and electrical machinery industries. From the February 2007 ADB working paper: Managing the Noodle Bowl: The fragility of East Asian regionalism by Richard Baldwin, which cites Fujita and Hamaguchi (2006): The coming age of China-plus-one
Source: ADB above, Macquarie Research, March 2017
Source: UNCTAD, Macquarie Research, March 2017
As noted by Richard Baldwin and Javier Lopez-Gonzales in their 2012 Supply-chain trade: A
portrait of global patterns and several testable hypotheses there was a demand pull element
into EM economies as well as a MNC supply-push seeking lower labour costs:
Developing nations that had eschewed trade liberalisation for decades, suddenly embraced
openness that facilitated international production sharing. They slashed tariffs unilaterally
(especially on intermediates), signing Bilateral Investment Treaties (BITs, which are mostly
unilateral concessions to rich-nation firms seeking to invest), signing Regional Trade
Agreements (RTAs) with ‘deep’ provisions that are pro-supply-chain (e.g. assurances for
intellectual property, capital movements, inward investments, competition policy, business
visas, etc.).
Please see Fig 21.
The result has been regional supply chains built around Factory Asia, Factory North America
and Factory Europe.
Headquarter economies (Japan, US, Germany), those with advanced technology and high
wages, have outsourced slices of their supply chains to factory economies, those with low
wages.
Exceptions to this image include China, which has progressed to exporting low-tech industrial
intermediates, and Japan, whose high tech industrial intermediates are also exported to
Factory North America and Factory Europe.
This has important consequences for estimating the economic impact of protectionism.
The following pages focus on the evolution of Factory Asia, drawing on the reports below.
0
500
1000
1500
2000
2500
3000
3500
0
50
100
150
200
250
1959
1962
1965
1968
1971
1974
1977
1980
1983
1986
1989
1992
1995
1998
2001
2004
2007
2010
2013
2016
Number of new BITs signed per year [LHS]
Accumulated newly created BITs [RHS]
Globalisation’s 2nd
unbundling
Factory Asia,
Factory North
America and
Factory Europe

Macquarie Research Macq-ro insights
1 March 2017 15
Fig 22 The US-Japan relationship, recommended articles
Author Title
Fukunari Kimura International production and distribution networks in East Asia: 18 facts, mechanics, and policy implications (2006) Shujiro Urata Free trade agreements: A catalyst for Japan’s economic revitalisation (2005) Shujiro Urata Changing competitiveness of the Japanese manufacturing sector and firms in regional production networks in
Asia, chapter 5 of the ADB-KERI Future of Factory Asia (2014)
Shujiro Urata Japan’s trade policy with Asia, from the Japan MOF Public Policy Review Vol.10, No.1 (2014) Richard Baldwin, Tadashi Ito, Hitoshi Sato
Portrait of factory Asia: Production network in Asia and its implication for growth – the ‘smile curve’ (2014)
ADB Asian economic integration report 2016: What drives FDI in Asia and the Pacific? (2016)
Source: Macquarie Research, March 2017
Japan and the development of Factory Asia
Fig 23 and Fig 24 show how Japanese direct exports to the US and the EU have been
broadly stagnant since 1989 in yen value terms, and have fallen as a percentage of total
Japanese exports from 51% to 35%.
Exports to East Asia have grown strongly over the period.
Fig 23 Japanese exports to the US and by region, 1988 to 2016, ¥tr
Source: RIETI, Macquarie Research, March 2017
Fig 24 Japanese exports by region (shares), 1988-2016, %
Source: RIETI, Macquarie Research, March 2017
0
10
20
30
40
50
60
70
80
90
1988
1989
1990
1991
1992
1993
1994
1995
1996
1997
1998
1999
2000
2001
2002
2003
2004
2005
2006
2007
2008
2009
2010
2011
2012
2013
2014
2015
2016
(trJPY)
US EU Korea TaiwanSingapore Hong Kong ASEAN IndiaChina Others Exports
0%
10%
20%
30%
40%
50%
60%
70%
80%
90%
100%
1988
1989
1990
1991
1992
1993
1994
1995
1996
1997
1998
1999
2000
2001
2002
2003
2004
2005
2006
2007
2008
2009
2010
2011
2012
2013
2014
2015
2016
(trJPY)
US EU Korea Taiwan Singapore Hong Kong ASEAN India China Others
Japanese direct
exports to the US
and the EU have
been broadly
stagnant since 1989
in yen value terms…
…and have fallen as
a percentage of total
Japanese exports
from 51% to 35%

Macquarie Research Macq-ro insights
1 March 2017 16
Fig.25 and Fig 26 show a similar pattern for Japanese imports.
Fig 25 Japanese imports by region, 1988-2016, ¥tr
Source: RIETI, Macquarie Research, March 2017
Fig 26 Japanese imports by region (shares), 1988-2016, %
Source: RIETI, MOF, Macquarie Research, March 2017
In terms of the share of Japanese trade, it is only China that has shifted materially from 1988
to now. As a share of Japanese exports China’s share has grown from 3% to 23%, whilst
China’s share of Japanese imports has grown from 5% to 21%.
Developing in tandem, Fig 27 shows the waves of Japanese FDI into China from 1980 to
2011, and the related market opening policies (Fig 28). For example, the middle 1990’s was a
period of major realised investment, following the 1994 reforms.
Fig 27 also has data on the number of FDI cases into China each year, and with cases
consistently measured in thousands, it reflects that even Japan’s SME sector embraced the
lower wage cost opportunity in China.
Japan’s companies began to internationalise from the late 1980s. Fig 29, and this provides a
context for the China FDI waves of Fig 27.
The US and EU have dominated M&A activity (Fig 29, lower panel) which is included in total
FDI flows (Fig 29, upper panel) when at least a 10% stake is acquired. FDI flows to China
have been overwhelmingly greenfield investment until 2015.
0
10
20
30
40
50
60
70
80
90
100
1988
1989
1990
1991
1992
1993
1994
1995
1996
1997
1998
1999
2000
2001
2002
2003
2004
2005
2006
2007
2008
2009
2010
2011
2012
2013
2014
2015
2016
(trJPY)
US EU Korea TaiwanSingapore Hong Kong ASEAN IndiaChina Others Exports
0%
10%
20%
30%
40%
50%
60%
70%
80%
90%
100%
1988
1989
1990
1991
1992
1993
1994
1995
1996
1997
1998
1999
2000
2001
2002
2003
2004
2005
2006
2007
2008
2009
2010
2011
2012
2013
2014
2015
2016
(trJPY)
US EU Korea Taiwan Singapore Hong Kong ASEAN India China Others
Japanese direct
imports from the US
and the EU have
grown modestly
since 1989 in yen
value terms…
…and have fallen as
a percentage of total
Japanese imports
from 35% to 25%
Even Japan’s SME
sector embraced the
lower wage cost
opportunity in China

Ma
cq
ua
rie R
esea
rch
M
acq-ro
insig
hts
1 M
arc
h 2
01
7
17
Fig 27 Japan FDI into China, 1996-2010
Note: The FDI value for 2011 is the sum of January to November 2011. Source: Invest In China, Macquarie Research, March 2017
Fig 28 Procession of Japan's FDI into China
1980s 1H 1980s 2H 1990s 1H 1990s 2H 2000 onwards
Reasons for investment
Cheap and good labour pool The previous + infrastructure, marketisation
The previous + parts procurement (Pearl River Delta)
The previous + domestic market (Yangtze Delta), entry into WTO, R&D
Main regions Dalian Dalian, Pearl River Delta Pearl River Delta, Yangtze Delta Pearl River Delta, Yangtze Delta, Beijing Main industries Textiles, sundry goods, food Textiles, sundry goods, food, electric
appliances, machinery, motorbikes, automobiles
Textiles, sundry goods, food, electric appliances, electric devices, machinery, chemistry, electric device components, machinery parts
Textiles, sundry goods, food, electric appliances, electric devices, machinery, chemistry, electric device components, machinery parts, software development, R&D centre, automobile
Major policies July 1979: Foreign investment granted
legal status in China 1980: 4 Special Economic Zones (SEZs) (Shenzhen, Zhuhai, Shantou, Xiamen) established 1983: Regulations for the Implementation of the Law of the People's Republic of China on Joint Ventures using China and Foreign Investment promulgated, further liberalising domestic market and clarifying business environment 1984: 14 SEZs established in coastal cities
1985: 12 of the 14 SEZs designated as Technology Promotion Zones to expedite transfer of technology. Development Triangles including the Yangtze River delta, Pearl River delta, and Min Nan region in Fujian were opened to foreign investors. 1986: Favourable regulations and provisions established to promote export-oriented JVs and JVS using advanced technologies. Wholly foreign-owned enterprises allowed. '22 Article Provisions' gave foreign enterprises preferential treatment, with freedom to import inputs, right to retain/swap foreign exchange, privileged access to utilities, etc.
1994: New proposals to attract FDI into specific sectors to match domestic industrial objectives: agriculture, hydropower, communications, energy and raw material sectors. Tightened procedures for contract approvals and foreign enterprise registrations. Increased penalties if agreements unfulfilled.
1995: Provisional Guidelines for Foreign Investment Projects took effect. Priority given to FDI in agriculture, energy, transportation, telecommunications, basic raw materials, and high-technology industries. Those advancing into the central and central west region strongly encouraged. Guiding Catalogue of Foreign Investment Projects categorised investments into four categories: Encouraged, Restricted, Prohibited and Permitted.
Dec 2001: China joins the WTO. 2007: Third update to the Catalogue of Industries for Guiding Foreign Investment. Encouraged sectors include high-tech, equipment manufacturing, and new material production industries. Areas such as recycling industry, clean production, renewable energy, ecological environment protection, and comprehensive utilisation of resource encouraged.
Source: MOF, Macquarie Research, March 2017
0
1,000
2,000
3,000
4,000
5,000
6,000
7,000
19
86
19
87
19
88
19
89
19
90
19
91
19
92
19
93
19
94
19
95
19
96
19
97
19
98
19
99
20
00
20
01
20
02
20
03
20
04
20
05
20
06
20
07
20
08
20
09
20
10
20
11
0
500
1,000
1,500
2,000
2,500
3,000
3,500
4,000
Japan's Realised FDI Value in China (LHS) # of cases (RHS) # of cases(US$mn)

Ma
cq
ua
rie R
esea
rch
M
acq-ro
insig
hts
1 M
arc
h 2
01
7
18
Fig 29 Japanese FDI outflow (top panel) and M&A outflow (lower panel)
M&A outflow
Note: Western Europe includes Germany, UK, France, Netherlands, Italy, Belgium, Luxembourg, Switzerland, Sweden, and Spain. M&A outflow data for 1983-1995 are from FactSet, 1996-2011 are from RECOF. Transaction values are converted from JPY to USD using the annual average exchange rate from Federal Reserve. Please also note the data availability between 1983-1995: North America (1990-) and Western Europe (1993-). RECOF: the source of the M&A outflow chart was modified in 2014 and the data categories have slightly changed.
Source: MOF, JETRO, RECOF , Macquarie Research, March 2017
-10
10
30
50
70
90
110
130
150
170
190
198
3
198
4
198
5
198
6
198
7
198
8
198
9
199
0
199
1
199
2
199
3
199
4
199
5
199
6
199
7
199
8
199
9
200
0
200
1
200
2
200
3
200
4
200
5
200
6
200
7
200
8
200
9
201
0
201
1
201
2
201
3
201
4
201
5
201
6
(US$bn) North America Western Europe China South Korea Other Asia Others
0
20
40
60
80
100
120
1996 1997 1998 1999 2000 2001 2002 2003 2004 2005 2006 2007 2008 2009 2010 2011 2012 2013 2014 2015 2016
(US$bn)
North America Western Europe China South Korea Other Asia Others

Macquarie Research Macq-ro insights
1 March 2017 19
Fig 30 provides a summary of the FDI flows, presented in cumulative stock terms, whilst Fig
31 does the same for company overseas affiliate sales. Asia has been an important
contributor in both cases.
Fig 30 Japan’s Outward FDI Stock by Region
Note: data from https://www.jetro.go.jp/en/reports/statistics/
Source: Jetro, Macquarie Research, March 2017
Fig 31 Sales of Overseas Affiliates of Japanese Companies by Regions
Source: METI, Macquarie Research, March 2017
Next we present charts of Japanese exports and imports classified into primary, intermediate
and final goods. As expected, the growth in intermediate goods has been very strong,
especially in the case of Japanese exports.
Fig 32 Japanese exports
Source: RIETI, Macquarie Research, March 2017
0
200
400
600
800
1,000
1,200
1,400 (US$bn)
Asia North America
Latin America Oceania
Europe Middle East
Africa
0
50
100
150
200
250
300
350
1997 1998 1999 2000 2001 2002 2003 2004 2005 2006 2007 2008 2009 2010 2011 2012 2013 2014
(10trJPY)
Africa Oceania
Europe Middle East
South America North America
Asia
0
50
100
150
200
250
300
350
400
450
500 (US$bn)
Final Goods
Intermediate Goods
Primary Goods
The growth in
intermediate goods
has been very
strong
Macquarie Research Macq-ro insights
1 March 2017 20
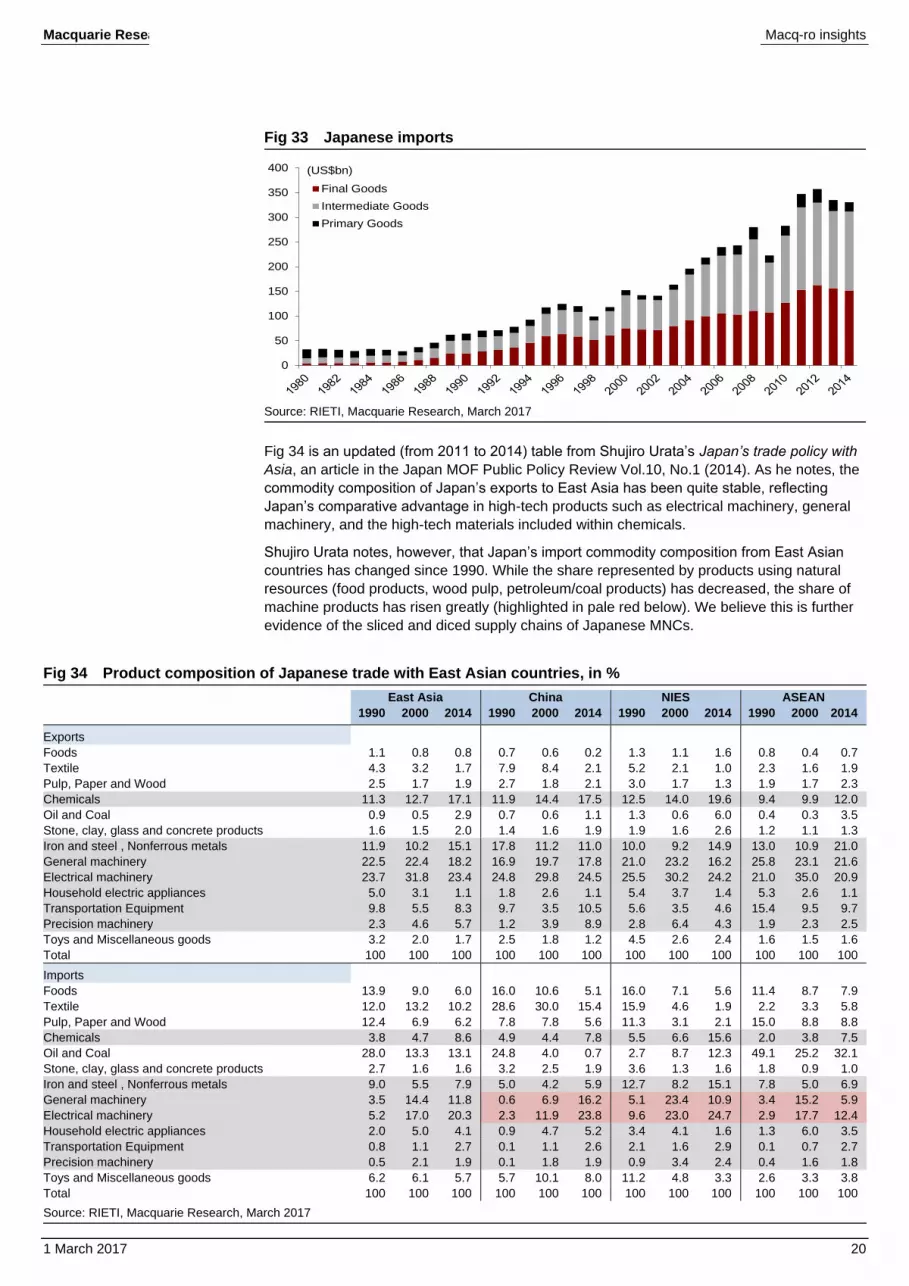
Fig 33 Japanese imports
Source: RIETI, Macquarie Research, March 2017
Fig 34 is an updated (from 2011 to 2014) table from Shujiro Urata’s Japan’s trade policy with
Asia, an article in the Japan MOF Public Policy Review Vol.10, No.1 (2014). As he notes, the
commodity composition of Japan’s exports to East Asia has been quite stable, reflecting
Japan’s comparative advantage in high-tech products such as electrical machinery, general
machinery, and the high-tech materials included within chemicals.
Shujiro Urata notes, however, that Japan’s import commodity composition from East Asian
countries has changed since 1990. While the share represented by products using natural
resources (food products, wood pulp, petroleum/coal products) has decreased, the share of
machine products has risen greatly (highlighted in pale red below). We believe this is further
evidence of the sliced and diced supply chains of Japanese MNCs.
Fig 34 Product composition of Japanese trade with East Asian countries, in %
East Asia China NIES ASEAN
1990 2000 2014 1990 2000 2014 1990 2000 2014 1990 2000 2014
Exports
Foods 1.1 0.8 0.8 0.7 0.6 0.2 1.3 1.1 1.6 0.8 0.4 0.7
Textile 4.3 3.2 1.7 7.9 8.4 2.1 5.2 2.1 1.0 2.3 1.6 1.9
Pulp, Paper and Wood 2.5 1.7 1.9 2.7 1.8 2.1 3.0 1.7 1.3 1.9 1.7 2.3
Chemicals 11.3 12.7 17.1 11.9 14.4 17.5 12.5 14.0 19.6 9.4 9.9 12.0
Oil and Coal 0.9 0.5 2.9 0.7 0.6 1.1 1.3 0.6 6.0 0.4 0.3 3.5
Stone, clay, glass and concrete products 1.6 1.5 2.0 1.4 1.6 1.9 1.9 1.6 2.6 1.2 1.1 1.3
Iron and steel , Nonferrous metals 11.9 10.2 15.1 17.8 11.2 11.0 10.0 9.2 14.9 13.0 10.9 21.0
General machinery 22.5 22.4 18.2 16.9 19.7 17.8 21.0 23.2 16.2 25.8 23.1 21.6
Electrical machinery 23.7 31.8 23.4 24.8 29.8 24.5 25.5 30.2 24.2 21.0 35.0 20.9
Household electric appliances 5.0 3.1 1.1 1.8 2.6 1.1 5.4 3.7 1.4 5.3 2.6 1.1
Transportation Equipment 9.8 5.5 8.3 9.7 3.5 10.5 5.6 3.5 4.6 15.4 9.5 9.7
Precision machinery 2.3 4.6 5.7 1.2 3.9 8.9 2.8 6.4 4.3 1.9 2.3 2.5
Toys and Miscellaneous goods 3.2 2.0 1.7 2.5 1.8 1.2 4.5 2.6 2.4 1.6 1.5 1.6
Total 100 100 100 100 100 100 100 100 100 100 100 100
Imports
Foods 13.9 9.0 6.0 16.0 10.6 5.1 16.0 7.1 5.6 11.4 8.7 7.9
Textile 12.0 13.2 10.2 28.6 30.0 15.4 15.9 4.6 1.9 2.2 3.3 5.8
Pulp, Paper and Wood 12.4 6.9 6.2 7.8 7.8 5.6 11.3 3.1 2.1 15.0 8.8 8.8
Chemicals 3.8 4.7 8.6 4.9 4.4 7.8 5.5 6.6 15.6 2.0 3.8 7.5
Oil and Coal 28.0 13.3 13.1 24.8 4.0 0.7 2.7 8.7 12.3 49.1 25.2 32.1
Stone, clay, glass and concrete products 2.7 1.6 1.6 3.2 2.5 1.9 3.6 1.3 1.6 1.8 0.9 1.0
Iron and steel , Nonferrous metals 9.0 5.5 7.9 5.0 4.2 5.9 12.7 8.2 15.1 7.8 5.0 6.9
General machinery 3.5 14.4 11.8 0.6 6.9 16.2 5.1 23.4 10.9 3.4 15.2 5.9
Electrical machinery 5.2 17.0 20.3 2.3 11.9 23.8 9.6 23.0 24.7 2.9 17.7 12.4
Household electric appliances 2.0 5.0 4.1 0.9 4.7 5.2 3.4 4.1 1.6 1.3 6.0 3.5
Transportation Equipment 0.8 1.1 2.7 0.1 1.1 2.6 2.1 1.6 2.9 0.1 0.7 2.7
Precision machinery 0.5 2.1 1.9 0.1 1.8 1.9 0.9 3.4 2.4 0.4 1.6 1.8
Toys and Miscellaneous goods 6.2 6.1 5.7 5.7 10.1 8.0 11.2 4.8 3.3 2.6 3.3 3.8
Total 100 100 100 100 100 100 100 100 100 100 100 100
Source: RIETI, Macquarie Research, March 2017
0
50
100
150
200
250
300
350
400 (US$bn)
Final Goods
Intermediate Goods
Primary Goods

Macquarie Research Macq-ro insights
1 March 2017 21
Extended supply chains require low friction costs as well as robust ICT systems. Fig 35
shows Japan’s Free Trade Agreements, which are predominately with other Asian countries.
Fig 36 gives an indication of customs and logistic ease across Asia, with Mexico included for
comparison purposes.
Fig 35 Japan’s completed FTAs
FTA Partners Start of negotiation Signing of FTA Enactment of FTA
In effect Singapore Jan-01 Jan-02 Nov-02
Mexico Nov-02 Sep-04 Mar-05
Malaysia Jan-04 Dec-05 Jul-06
Chile Feb-06 Mar-07 Sep-07
Thailand Feb-04 Apr-07 Nov-07
Indonesia Jul-05 Aug-07 Jul-08
Brunei Jun-06 Jun-07 Jul-08
ASEAN Apr-05 Apr-08 Dec-08
Philippines Feb-04 Sep-06 Dec-08
Switzerland May-07 Feb-09 Sep-09
Vietnam Jan-07 Dec-08 Oct-09
India Jan-07 Feb-11 Aug-11
Peru May-09 May-11 Mar-12
Australia Apr-07 Jul-14 Jan-15
Mongolia Jun-12 Feb-15 Jun-16
Source: Ministry of Foreign Affairs, Macquarie Research, March 2017
Fig 36 Efficiency of international logistics: 2016
Country Ranking (out of 160
countries) Score (1-5) Customs Infrastructure International
shipments Logistics
competence Tracking &
tracing Timeliness
Singapore 5 4.1 4.2 4.2 4.0 4.1 4.1 4.4 Hong Kong, China 9 4.1 3.9 4.1 4.1 4.0 4.0 4.3 Japan 12 4.0 3.9 4.1 3.7 4.0 4.0 4.2 Korea, Rep. 24 3.7 3.5 3.8 3.6 3.7 3.8 4.0 Taiwan 25 3.7 3.2 3.6 3.6 4.0 3.6 4.3 China 27 3.7 3.3 3.8 3.7 3.6 3.7 3.9 Malaysia 32 3.4 3.2 3.5 3.5 3.3 3.5 3.7 India 35 3.4 3.2 3.3 3.4 3.4 3.5 3.7 Thailand 45 3.3 3.1 3.1 3.4 3.1 3.2 3.6 Mexico 54 3.1 2.9 2.9 3.0 3.1 3.4 3.4 Indonesia 63 3.0 2.7 2.7 2.9 3.0 3.2 3.5 Vietnam 64 3.0 2.8 2.7 3.1 2.9 2.8 3.5 Brunei 70 2.9 2.8 2.8 3.0 2.6 2.9 3.2 Philippines 71 2.9 2.6 2.6 3.0 2.7 2.9 3.4 Cambodia 73 2.8 2.6 2.4 3.1 2.6 2.7 3.3 Myanmar 113 2.5 2.4 2.3 2.2 2.4 2.6 2.9 Lao PDR 152 2.1 1.9 1.8 2.2 2.1 1.8 2.7
Note: Myanmar and Lao PDR score poorly below, implying that despite low wage levels, both need to make considerable progress in their infrastructure facilities before they will be able to join the East Asian export supply chain in any scale
Source: World Bank, Logistics Performance Index, Macquarie Research, March 2017
For two Japanese MNCs, Fig 38 shows their East Asia ex Japan factory network: Canon
(7751 JP, ¥3,305, Neutral, TP: ¥3,350, Damian Thong) and Panasonic (recommendation
details below).
Fig 37 has the recommendation details for some of, we believe, Japan’s major exporters.
However, Japanese companies rarely release export data. The website “World’s Top
Exporters” is recommended for readers who wish to explore further.
Fig 37 Some of Japan’s major exporters, recommendation details
Stock Ticker Rec C/P T/P To TP
(%) Stock Ticker Rec C/P T/P To TP
(%)
Toyota Motor 7203 OP 6,448 7,900 22.5 Panasonic 6752 OP 1,259 1,450 15.2 Honda Motor 7267 OP 3,553 4,300 21.0 Sony 6758 OP 3,486 4,250 21.9 Nissan Motor 7201 OP 1,112 1,530 37.6 Toshiba 6502 OP 224 315 40.7 Hitachi 6501 OP 633 755 19.3 Nippon Steel SM 5401 OP 2,808 3,000 6.9 JX Holdings 5020 OP 532 630 18.4 MHI 7011 N 444 470 5.9
Note: Share prices as of 24 February. Source: Macquarie Research, March 2017
Japan’s Free Trade
Agreements are
predominately with
other Asian
countries
Canon and
Panasonic
Japanese
companies rarely
release export data

Ma
cq
ua
rie R
esea
rch
M
acq-ro
insig
hts
1 M
arc
h 2
01
7
22
Fig 38 Examples of Japanese MNC factory networks in East Asia ex-Japan: Canon and Panasonic
Panasonic
1. Panasonic Industrial Devices Singapore, 2. Panasonic Industrial Devices Malaysia Sdn. Bhd. 3. PT. Panasonic Industrial Devices Batam, 4. Panasonic Manufacturing (Thailand) Co., Ltd, 5. Panasonic Industrial Devices Vietnam Co.,Ltd, 6. P.T SANYO Jaya Components Indonesia, 7. Panasonic Precision Devices Philippines Corporation, 8. Panasonic Industrial Devices (Tianjin) Co.,Ltd, 9. Panasonic Industrial Devices (Beijing) Co., Ltd, 10. Panasonic Industrial Devices (Qingdao) Co.,Ltd, 11. Panasonic Industrial Devices Taiko (Shenzhen) Co, 12. Panasonic Electronic Devices (Jingmen) Co.,Ltd, 13. Panasonic Industrial Devices (Hong Kong) Co.,Ltd
Canon
1. Canon Dalian Business Machines, Inc, 2. Canon Zhuhai, Inc, 3. Guangdong, United Optical Instrument Co., Ltd., 4. Tianjin Canon Co., Ltd., 5. Canon Zhongshan Business Machines, Co., Ltd., 6. Canon (Suzhou) Inc., 7. Canon Finetech Industries Development Co., Ltd., 8. Canon Finetech (Suzhou) Business Machines Inc., 9. Lotte Canon Co., Ltd, 10. Canon Opto (Malaysia) Sdn. Bhd., 11. Canon Electronics (Malaysia) Sdn. Bhd., 12. Canon Inc., Taiwan, 13. Canon Hi-Tech (Thailand) Ltd., 14. Canon Engineering (Thailand) Ltd., 15. Canon Vietnam Co. Ltd.
Source: OECD/IEA, Google Image, Canon, Panasonic, Macquarie Research, March 2017

Macquarie Research Macq-ro insights
1 March 2017 23
Factory Asia and the ‘Smile-curve’ Of the articles noted in Fig 22 , the Portrait of factory Asia: Production network in Asia and its
implication for growth – the ‘smile curve’ (2014) by Richard Baldwin, Tadashi Ito, Hitoshi Sato
is especially interesting, in our opinion.
The ‘smile-curve’ introduced by Stan Shin, the founder and CEO of Acer, in the early 1990s is
a belief that the share of value-added in manufactured goods is shifting to post-fabrication
services, Fig 39. The research article then seeks ‘smile-curves’ at the economy level, by
tracking the evolution of value-added in the primary, manufacturing and service sectors, to
the country’s exports. As Fig 40 illustrates, be it the HQ-economy of Japan or the developing
factory-economy of the Philippines, neither had a ‘smile-curve’ over 1985-1995, whilst both
did over 1995-2005. The article demonstrates a similar pattern for other East Asian nations,
as well as across industries.
Fig 39 Stan Shin’s ‘Smile-curve’
Fig 40 Economy-wide ‘smile-curves’
Note: From the Portrait of factory Asia: Production network in Asia and its implication for growth – the ‘smile curve’ (2014) by Richard Baldwin, Tadashi Ito, Hitoshi Sato
Source: Portrait of Factory Asia above, Macquarie Research, March 2017
However, the above ignored the country-source of the value-added. For example, the share
of domestic value added in services in Thailand’s machinery sector exports fell from 94% in
1985 to 40% in 2005. In Japan’s machinery sector case, the corresponding numbers were
99% and 89%. With the own-nation share declining everywhere, it is the degree that is
important.
Fig 41 Reduction in own-nation service-sector sourcing shares, 1985-2005, %
Japan China Korea Taiwan Indonesia Thailand Philippines
Textile & Leather -8 -16 -14 -22 -19 -23 -33 Chemical products -8 -22 -24 -34 -24 -30 -44 Machinery -10 -22 -25 -34 -19 -54 -47 Transport Equipment -6 -16 -23 -27 -36 -45 -82 Metal products -6 -14 -28 -24 -24 -40 -45
Note: grey shading is referred to in the text above
Source: Portrait of Factory Asia above, Macquarie Research, March 2017
Thus, a great deal of the value-added shift towards services across countries and sectors has
involved international outsourcing. Please note the hierarchy from a relative modest decline in
the case of Japan, to extensive declines in the Philippines.
The above table is another indication of integrated cross-border production networks,
controlled by the MNC lead firm.
Another indication
of integrated cross-
border production
networks, controlled
by the MNC
lead firm

Macquarie Research Macq-ro insights
1 March 2017 24
Lower trend growth in East Asia As we noted on the front cover, we believe Factory Asia is about to face its most serious
challenge in decades. Rather than East Asia decoupling from developments in the US,
“America First” is the US claiming, at the margin, an increased share of a smaller global
whole, in our opinion.
Lower trend growth in East Asia appears likely as the contribution from capital deepening
becomes less. As one proxy indicator, the following chart looks at inward FDI inflows into
China and the US. The overall number includes M&A transactions where a stake of at least
10% is taken. Greenfield investments exclude M&A and are the two lines at the bottom of the
chart. The trends are interesting with China waning, whilst FDI greenfield inflows into the US
have been steady to increasing.
Fig 42 FDI flows, total and greenfield only for the US and China, US$bn
Note: Inward FDI data is Oxford Economics and the greenfield data series is from UNCTAD.
Source: UNCTAD, Oxford Economics, Macquarie Research, March 2017
FDI flows reflect the political networks utilised by MNCs to make longer-term investment
decisions. In an increasingly politicalised global economy, we regard this as valuable
knowledge. The 11 January 2017 Macq-ro insights: Following the new smart money identified
four key FDI trends that are expected to persist over the next three years:
1) A 40% shrinkage of inward FDI from the 2015 high. UNCTAD estimates that 2016
saw a 10-15% decline
2) Relative strength in flows to advanced economies versus EM economies
3) Pronounced strength in flows to India versus China, reflecting absolute growth and
material YoY declines respectively
4) Pronounced weakness in FDI flows to commodity-exporting economies
Fig 43 provides a decomposition of our global growth expectations.
Fig 43 Global growth and components, per annum, %, 2016-22
Labour supply
growth Capital
deepening TFP Total
Advanced economies 0.2 0.8 0.5 1.5
EM economies 0.8 2.3 1.0 4.0
Global 0.4 1.4 0.7 2.5
Note: Macquarie estimates. Weights used for the global aggregate: advanced economies 0.6, EM economies 0.4. Pale red shading: most vulnerable, highest downside risk. Blue shading: most upside risk, in our opinion
Source: Macquarie Research, March 2017
0
50
100
150
200
250
300
350
400 US Inward FDI China Inward FDI
US Greenfield China Greenfield(in bnUS$)
The new smart
money is already
disengaging from
China
Lower trend growth
in East Asia appears
likely as the
contribution from
capital accumulation
falls

Macquarie Research Macq-ro insights
1 March 2017 25
The 14 February 2017 The Global Macro Outlook: Policy shifts in the US has more. As
indicated in Fig 43, pale red highlights and footnote, we have been concerned about the
capital deepening contribution to EM economies potential growth for some time.
The following four charts provide some context. The blue/black line in Fig 45 is vulnerable to
a material decline, in our opinion.
Fig 44 World investment by economic groups (US$tr)
Fig 45 World investment by economic groups (% of current GDP)
Note: Private investment includes residential investment. Source: IMF WEO database, Macquarie Research, March 2017
Fig 46 US investment (US$tr)
Fig 47 US investment (% of current GDP)
Note: Private investment includes residential investment. Source: IMF WEO database, Macquarie Research, March
Fig 48 provides a decomposition of our East Asia growth expectations. We have reduced the
capital deepening contribution by 0.2% pa, but still believe the estimate is vulnerable to a
further reduction. Our forecasts through 2020 are shown in Fig 55, and are for East Asian
growth of 4.7-4.9%. There is downside risk depending on the announcement and
implementation of President Trump’s policies.
Fig 48 East Asia growth and components, per annum, %, 2016-22
Labour supply growth Capital deepening TFP Total
East Asia 0.1 3.4 1.0 4.5
Global 0.4 1.4 0.7 2.5
Note: Macquarie estimates. East Asia is Japan, China, Korea, Taiwan, HK, 5-ASEAN, please see Fig 54 and Fig 55. Weights used for the global aggregate: advanced economies 0.6, EM economies 0.4. Pale red shading: most vulnerable, highest downside risk
Source: Macquarie Research, March 2017
0
5
10
15
20
25
1980
1982
1984
1986
1988
1990
1992
1994
1996
1998
2000
2002
2004
2006
2008
2010
2012
2014
2016
(US$tr) Emerging and developing economies investment
Advanced economies, investment
15
17
19
21
23
25
27
29
31
33
35
1980
1982
1984
1986
1988
1990
1992
1994
1996
1998
2000
2002
2004
2006
2008
2010
2012
2014
2016
(%) Advanced economies, investment, % of GDP
Emerging and developing economies investment, % of GDP
0.0
0.5
1.0
1.5
2.0
2.5
3.0
3.5
4.0
4.5
1980
1982
1984
1986
1988
1990
1992
1994
1996
1998
2000
2002
2004
2006
2008
2010
2012
2014
2016
(US$tr) US's investment
10
12
14
16
18
20
22
24
26
1980
1982
1984
1986
1988
1990
1992
1994
1996
1998
2000
2002
2004
2006
2008
2010
2012
2014
2016
(%GDP) US's investment, % of GDP

Macquarie Research Macq-ro insights
1 March 2017 26
Trend growth rates are the anchor around which forecasts oscillate
The integrated export supply-chain of Factory Asia means that any fall in US imports from
China has negative spill-over consequences across East Asia.
East Asia decoupling is not supported by the data. The January 2017 ADB working paper
#506 “Decoupling Asia revisited” by Cyn-Young Park made the following observations:
Deepening trade and financial linkages within and beyond the region are strengthening
expectation that emerging East Asia (EEA) will gain greater macroeconomic independence
from the US economy and become more resilient to global trade and financial shocks.
However, findings of this study suggest no evidence to support Asia’s decoupling from the
world economy, both structurally and cyclically.
The post-crisis economic recovery has been based on strong trade and financial openness,
but deeper economic integration in EEA through increased trade and financial openness has
led to not only greater economic integration within the region, but also to the region’s
integration with the global economy. While development of regional value chains through
vertical specialization has led to increased productivity and opportunities to move up the
value chain, expansion of Asia’s trade and investment links has seen the region remain
structurally linked to global final demand. EEA has become more, not less, integrated with the
global economy and as a result, the impact of a global shock, whether related to trade or
financial markets, will be greater. Further, deeper regional economic integration can help
propagate a shock across economies of the region.
The ADB working paper has an extensive bibliography on the East Asian export supply chain,
and the decoupling thesis.
Our senior China economist, Larry Hu, in his 17 February 2017 China Macro: US marketing
feedback: 9 questions comments as follows:
But if we have to give a view, we think that it’s not very likely for the US to impose a 45% tariff
on all Chinese products. It’s likely to be more targeted with lower rates. Suppose it causes
China’s exports to the US to drop by the same magnitude as 2009 (down 12.5%), the largest
drop in history, China’s total exports would drop only by 2ppt. China’s GDP sensitivity to trade
is around 0.1, i.e. 10 ppt decline in China’s total exports could reduce GDP growth by around
1ppt. So a 2ppt drop in China’s total export growth could only lower GDP growth by 0.2ppt. In
other words, if a trade war like this really happens, the impact on sentiment might be even
bigger than on the real economy.
Meanwhile, China could retaliate on various fronts. For instance, imposing tariffs on imports
from the US or asking the government and SOEs (such as airline companies) to reduce their
purchase of US goods. After all, China is the third-largest exports destination for the US. Or
China could increase scrutiny of US companies operating in China. A potential trade war
could also impact the cooperation between China and the US in various areas such as
geopolitics, anti-terrorism and others. That said, some investors’ worry that China might use
the RMB as another weapon. In our view, it’s possible but not very likely. At this moment,
China’s policy makers are grappling with the RMB depreciation expectation, which is the most
important driver for capital outflows. A sizeable depreciation would worsen the current
situation. Moreover, amid the power transition, the last thing China’s policy makers want to
see is the kind of market panic in late 2015, which was caused by an unexpected
depreciation of the RMB.
The problem for forecasting, as Larry notes above, is to go beyond the first round impact, into
incorporating retaliation, and global spill-over consequences.
Fig 49 is a scenario undertaken by Oxford Economics on the following assumptions. The US
introduces a 35% trade tariff on Mexico and a 45% trade tariff on China. Both countries
respond by matching these tariffs. Subsequently, tariffs are imposed on Korea and Taiwan
meeting a similar response.
The result of this scenario is 1% off Asian growth over two years with variable impacts,
compared to the baseline forecast, Fig.41.
The hit to Japan’s real GDP is estimated by Oxford Economics to be a cumulative 1.2% over
two years. Japan is a major capital goods exporter.
Emerging East Asia
has become more,
not less, integrated
with the global
economy and as a
result, the impact of
a global shock,
whether related to
trade or financial
markets, will be
greater
A 2ppt drop in
China’s total export
growth would lower
GDP growth by
0.2ppt
Retaliation, and
global spill-over
consequences
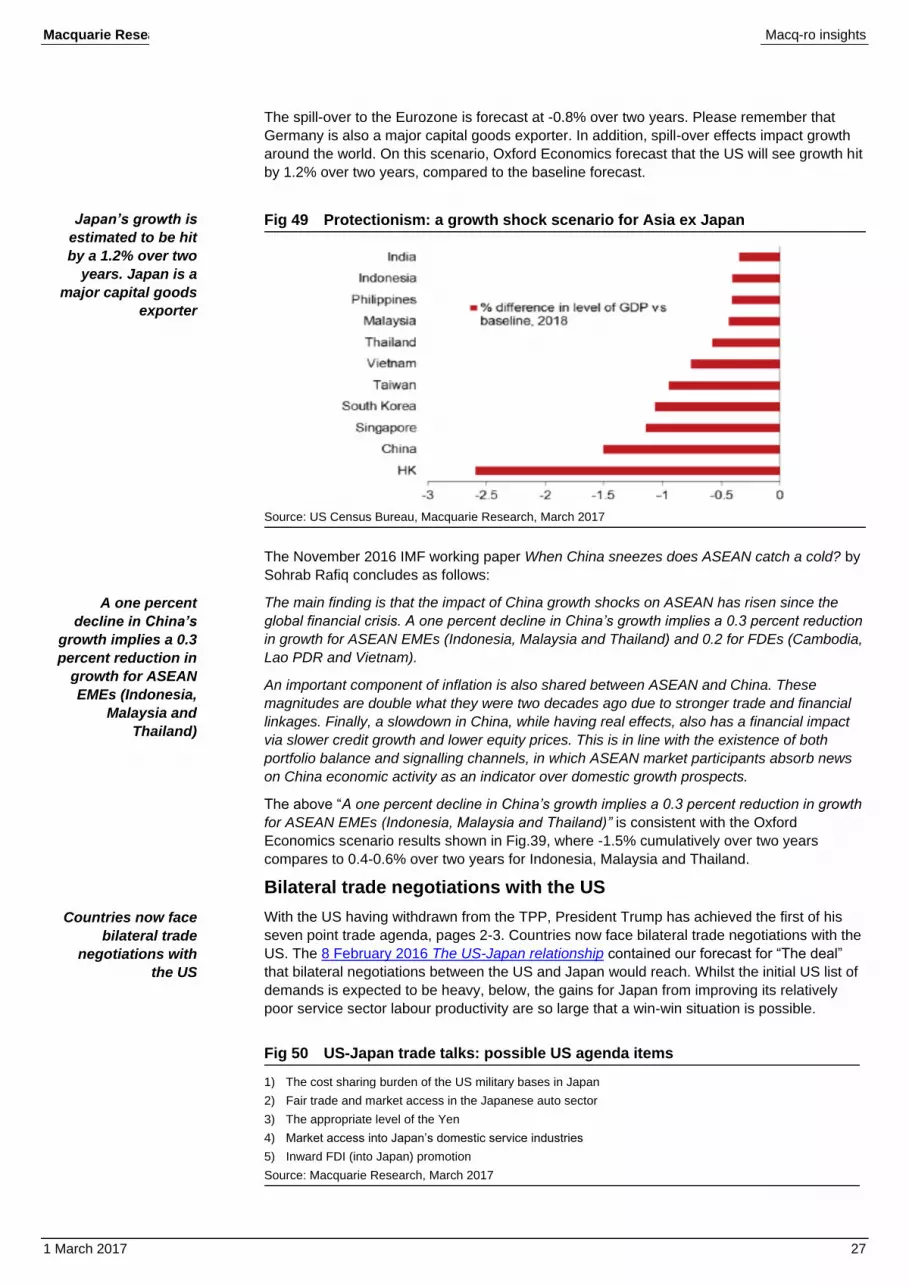
Macquarie Research Macq-ro insights
1 March 2017 27
The spill-over to the Eurozone is forecast at -0.8% over two years. Please remember that
Germany is also a major capital goods exporter. In addition, spill-over effects impact growth
around the world. On this scenario, Oxford Economics forecast that the US will see growth hit
by 1.2% over two years, compared to the baseline forecast.
Fig 49 Protectionism: a growth shock scenario for Asia ex Japan
Source: US Census Bureau, Macquarie Research, March 2017
The November 2016 IMF working paper When China sneezes does ASEAN catch a cold? by
Sohrab Rafiq concludes as follows:
The main finding is that the impact of China growth shocks on ASEAN has risen since the
global financial crisis. A one percent decline in China’s growth implies a 0.3 percent reduction
in growth for ASEAN EMEs (Indonesia, Malaysia and Thailand) and 0.2 for FDEs (Cambodia,
Lao PDR and Vietnam).
An important component of inflation is also shared between ASEAN and China. These
magnitudes are double what they were two decades ago due to stronger trade and financial
linkages. Finally, a slowdown in China, while having real effects, also has a financial impact
via slower credit growth and lower equity prices. This is in line with the existence of both
portfolio balance and signalling channels, in which ASEAN market participants absorb news
on China economic activity as an indicator over domestic growth prospects.
The above “A one percent decline in China’s growth implies a 0.3 percent reduction in growth
for ASEAN EMEs (Indonesia, Malaysia and Thailand)” is consistent with the Oxford
Economics scenario results shown in Fig.39, where -1.5% cumulatively over two years
compares to 0.4-0.6% over two years for Indonesia, Malaysia and Thailand.
Bilateral trade negotiations with the US
With the US having withdrawn from the TPP, President Trump has achieved the first of his
seven point trade agenda, pages 2-3. Countries now face bilateral trade negotiations with the
US. The 8 February 2016 The US-Japan relationship contained our forecast for “The deal”
that bilateral negotiations between the US and Japan would reach. Whilst the initial US list of
demands is expected to be heavy, below, the gains for Japan from improving its relatively
poor service sector labour productivity are so large that a win-win situation is possible.
Fig 50 US-Japan trade talks: possible US agenda items
1) The cost sharing burden of the US military bases in Japan
2) Fair trade and market access in the Japanese auto sector
3) The appropriate level of the Yen
4) Market access into Japan’s domestic service industries
5) Inward FDI (into Japan) promotion
Source: Macquarie Research, March 2017
A one percent
decline in China’s
growth implies a 0.3
percent reduction in
growth for ASEAN
EMEs (Indonesia,
Malaysia and
Thailand)
Countries now face
bilateral trade
negotiations with
the US
Japan’s growth is
estimated to be hit
by a 1.2% over two
years. Japan is a
major capital goods
exporter

Macquarie Research Macq-ro insights
1 March 2017 28
East Asian growth is at risk The integrated export supply-chain of Factory Asia means that any fall in US imports from
China has negative spill-over consequences across East Asia.
The resulting negative impact on real GDP growth is estimated to be broadly similar across
East Asian countries, though North East Asia appears to be hit proportionally a little harder
than ASEAN.
A possible 2018 – some numbers
Our 25 January 2017 Global slump scenarios, and the EM economies that concern us the
most concluded that 4Q 2017 was likely the earliest that any of the identified growth shocks
would arrive.
Believing in irregular oscillations around trend growth rates this suggests that after the 2016-
17 global cyclical recovery, the cycle will turn down in 2018.
What could be unusual in this cycle, is the cause of the down-cycle might be clearly visible in
advance: an activist US trade policy.
Following the imposition of a 45% tariff on Chinese imports into the US, the hit to
Chinese GDP would be as follows: A 14% decline in Chinese exports to the US, times the
ratio of US exports/total Chinese exports (0.18, Fig 8), times the ratio of Chinese
export/Chinese GDP (0.208, Fig 8) times the domestic value added in exports (0.64, Fig 19
and below) is equals to a 0.34% fall in Chinese GDP, the direct first-round impact.
Ricocheting retaliation around the world bridges this forecast and Fig 49 above.
The foreign value added in Chinese exports has increased from 17.5% in 1995 to 31.4% in
2005 (Fig 19) and is currently assumed to be 36%.
We then break this into quarters: 1) Japan, 2) Korea & Taiwan, 3) ASEAN, and 4) The rest of
the world. This reflects, broadly, for 1-3 their exports to China multiplied by domestic value
added ratios (Fig 8 and Fig 19) and then adding a fourth quarter for the rest of the world.
This enables an apportioning of lost value added by country.
For ASEAN for example, the spill over hit to real GDP would be US$411bn (Chinese exports
to the US) times -14% times 0.36 (foreign value added) times 0.25 divided by US$2,330bn
(ASEAN GDP) i.e. -0.2% of ASEAN GDP (before spill over and retaliation consequences).
Using the same methodology, the hit to growth for other East Asian countries is: Japan:
-0.1%, Korea: -0.2% and Taiwan: -0.5%.
Assumption #3 on page 4 was that substitution would be 50% domestic and 50% foreign non-
China suppliers. We assume that this is split between Factory Asia and Factory Europe. This
will dampen the first round negative direct impacts above. An offset, however, would be the
negative impact on Asia ex China exports to domestic demand in China from the hit to
Chinese GDP.
The imposition of a 20% tariff on all imports would lead to an estimated 4% decline in total
US imports, approximately 3x the first round impact of a 45% tariff on just Chinese imports,
front cover and pages 4-6.
Broadly similar hits to GDP growth across East Asian countries…
…though North East Asia appears to be hit proportionally a little harder than ASEAN.
A 0.3% hit to Chinese growth when it is growing around 6.0% is similar to a 0.2% hit to
ASEAN growth when the latter is growing around 4.5% (Fig 55). The forecast hit to Japanese
real GDP growth at 0.1% is proportionally a bigger hit, based on our growth forecast of 0.7%
in 2018.The above analysis is based on goods trade, and Japan is likely to experience a
relatively negative hit from service exports (page 23). The same applies to Korea where an
estimated 0.2% hit compares to forecast growth of 2.7% in 2018. Taiwan appears to be
potentially impacted more negatively than other countries.
What could be
unusual in this
cycle, is the cause
of the down-cycle
might be clearly
visible in advance:
an activist US trade
policy
A 0.3% fall in
Chinese GDP
A 0.2% fall in
ASEAN GDP…
…and falls in GDP
of Japan: -0.1%,
Korea: -0.2% and
Taiwan: -0.5%

Macquarie Research Macq-ro insights
1 March 2017 29
Data section Please see page 7 for a chart of the trade balances for Factory Asia and the US. The data
beneath both charts is on page 32.
Fig 51 Current account balances: Factory Asia in surplus, the US in deficit
Note: Factory Asia is the aggregate of Japan, China, Korea, Taiwan, HK, and the ASEAN-5
Source: IMF, Datastream , Macquarie Research, March 2017
The major trade and current account surpluses in East Asia are shown below.
Fig 52 Trade balance, % of GDP
Source: IMF, Macquarie Research, March 2017
Fig 53 Current account balance, % of GDP
Source: IMF, Macquarie Research, March 2017
-1200
-1000
-800
-600
-400
-200
0
200
400
600
800 (USbn$)
Factory Asia
United States
-35
-25
-15
-5
5
15
25
35
45 (% of GDP)
China Korea
Malaysia Singapore
Japan Taiwan
The top 3 in terms of
trade surpluses to
GDP are:
Singapore
Taiwan
Korea
The top 3 in terms of
current account
surpluses to GDP
are also:
Singapore
Taiwan
South Korea

Ma
cq
ua
rie R
esea
rch
M
acq-ro
insig
hts
1 M
arc
h 2
01
7
30
Fig 54 GDP in current US$ for 10-Advanced countries and 6-Emerging market economies. Also for the 5-ASEAN majors
Country Name 2000
% of total 2001
% of total 2002
% of total 2003
% of total 2004
% of total 2005
% of total 2006
% of total 2007
% of total 2008
% of total 2009
% of total 2010
% of total 2011
% of total 2012
% of total 2013
% of total 2014
% of total 2015
% of total
10-advanced countries (GDP in trillion)
US 10.3 38% 10.6 40% 11.0 40% 11.5 37% 12.3 36% 13.1 35% 13.9 35% 14.5 33% 14.7 31% 14.4 32% 15.0 30% 15.5 29% 16.2 29% 16.8 30% 17.3 30% 17.9 32%
Japan 4.7 18% 4.2 16% 4.0 14% 4.3 14% 4.7 13% 4.6 12% 4.4 11% 4.4 10% 4.8 10% 5.0 11% 5.5 11% 5.9 11% 6.0 11% 4.9 9% 4.6 8% 4.1 7%
Germany 1.9 7% 1.9 7% 2.1 7% 2.5 8% 2.8 8% 2.9 8% 3.0 8% 3.4 8% 3.7 8% 3.4 8% 3.4 7% 3.8 7% 3.5 6% 3.7 7% 3.9 7% 3.4 6%
France 1.4 5% 1.4 5% 1.5 5% 1.8 6% 2.1 6% 2.2 6% 2.3 6% 2.7 6% 2.9 6% 2.7 6% 2.6 5% 2.9 5% 2.7 5% 2.8 5% 2.8 5% 2.4 4%
Italy 1.1 4% 1.2 4% 1.3 5% 1.6 5% 1.8 5% 1.9 5% 1.9 5% 2.2 5% 2.4 5% 2.2 5% 2.1 4% 2.3 4% 2.1 4% 2.1 4% 2.1 4% 1.8 3%
Spain 0.6 2% 0.6 2% 0.7 3% 0.9 3% 1.1 3% 1.2 3% 1.3 3% 1.5 3% 1.6 3% 1.5 3% 1.4 3% 1.5 3% 1.4 2% 1.4 2% 1.4 2% 1.2 2%
UK 1.5 6% 1.5 6% 1.7 6% 1.9 6% 2.3 7% 2.4 7% 2.6 7% 3.0 7% 2.8 6% 2.3 5% 2.4 5% 2.6 5% 2.6 5% 2.7 5% 3.0 5% 2.8 5%
Australia 0.4 2% 0.4 1% 0.4 1% 0.5 2% 0.6 2% 0.7 2% 0.7 2% 0.9 2% 1.1 2% 0.9 2% 1.1 2% 1.4 3% 1.5 3% 1.6 3% 1.5 2% 1.3 2%
Canada 0.7 3% 0.7 3% 0.8 3% 0.9 3% 1.0 3% 1.2 3% 1.3 3% 1.5 3% 1.5 3% 1.4 3% 1.6 3% 1.8 3% 1.8 3% 1.8 3% 1.8 3% 1.6 3%
S. Korea 0.6 2% 0.5 2% 0.6 2% 0.7 2% 0.8 2% 0.9 2% 1.0 3% 1.1 3% 1.0 2% 0.9 2% 1.1 2% 1.2 2% 1.2 2% 1.3 2% 1.4 2% 1.4 2%
(Advanced) 23.3 87% 23.1 87% 23.9 86% 26.6 86% 29.4 85% 30.9 84% 32.4 82% 35.0 79% 36.7 77% 34.8 76% 36.3 74% 38.8 71% 39.0 71% 39.1 69% 39.8 68% 38.0 68%
6-emerging market economies (GDP in trillion)
Brazil 0.6 2% 0.6 2% 0.5 2% 0.6 2% 0.7 2% 0.9 2% 1.1 3% 1.4 3% 1.7 3% 1.6 4% 2.1 4% 2.5 5% 2.2 4% 2.2 4% 2.4 4% 1.8 3%
Mexico 0.7 3% 0.7 3% 0.7 3% 0.7 2% 0.8 2% 0.9 2% 1.0 2% 1.0 2% 1.1 2% 0.9 2% 1.1 2% 1.2 2% 1.2 2% 1.3 2% 1.3 2% 1.1 2%
Russia 0.3 1% 0.3 1% 0.3 1% 0.4 1% 0.6 2% 0.8 2% 1.0 2% 1.3 3% 1.7 3% 1.2 3% 1.5 3% 1.9 4% 2.0 4% 2.1 4% 2.0 3% 1.3 2%
Turkey 0.3 1% 0.2 1% 0.2 1% 0.3 1% 0.4 1% 0.5 1% 0.5 1% 0.6 1% 0.7 2% 0.6 1% 0.7 1% 0.8 1% 0.8 1% 0.8 1% 0.8 1% 0.7 1%
India 0.5 2% 0.5 2% 0.5 2% 0.6 2% 0.7 2% 0.8 2% 0.9 2% 1.2 3% 1.2 3% 1.4 3% 1.7 3% 1.8 3% 1.8 3% 1.9 3% 2.0 3% 2.1 4%
China 1.2 4% 1.3 5% 1.5 5% 1.6 5% 1.9 6% 2.3 6% 2.7 7% 3.5 8% 4.5 10% 5.0 11% 5.9 12% 7.3 13% 8.2 15% 9.2 16% 10.4 18% 10.9 19%
(Emerging) 3.5 13% 3.6 13% 3.8 14% 4.3 14% 5.1 15% 6.1 16% 7.2 18% 9.1 21% 10.9 23% 10.7 24% 13.1 26% 15.5 29% 16.3 29% 17.5 31% 18.9 31% 17.9 31%
Total 26.9 26.7 27.7 30.9 34.5 37.0 39.6 44.1 47.5 45.5 49.4 54.3 55.3 56.7 58.7 55.9
5-Asean Countries (GDP in trillion)
Indonesia 0.2 30% 0.2 30% 0.2 33% 0.2 35% 0.3 34% 0.3 34% 0.4 36% 0.4 36% 0.5 37% 0.5 39% 0.8 42% 0.9 43% 0.9 43% 0.9 41% 0.9 40% 0.9 40%
Malaysia 0.1 17% 0.1 17% 0.1 17% 0.1 16% 0.1 16% 0.1 17% 0.2 16% 0.2 16% 0.2 17% 0.2 15% 0.3 14% 0.3 15% 0.3 14% 0.3 14% 0.3 15% 0.3 14%
Singapore 0.1 17% 0.1 17% 0.1 15% 0.1 14% 0.1 15% 0.1 15% 0.1 15% 0.2 15% 0.2 14% 0.2 14% 0.2 13% 0.3 13% 0.3 13% 0.3 13% 0.3 14% 0.3 14%
Philippines 0.1 15% 0.1 14% 0.1 14% 0.1 12% 0.1 12% 0.1 12% 0.1 12% 0.1 12% 0.2 12% 0.2 12% 0.2 11% 0.2 11% 0.3 12% 0.3 12% 0.3 13% 0.3 14%
Thailand 0.1 22% 0.1 22% 0.1 21% 0.2 22% 0.2 22% 0.2 22% 0.2 22% 0.3 21% 0.3 21% 0.3 20% 0.3 19% 0.4 18% 0.4 18% 0.4 19% 0.4 18% 0.4 18%
5-ASEAN 0.6 100 0.5 100 0.6 100 0.7 100 0.8 100 0.8 100 1.0 100 1.2 100 1.4 100 1.4 100 1.8 100 2.1 100 2.2 100 2.2 100 2.2 100 2.1 100
10-East Asia (GDP in trillion)
Japan 3.1 71% 3.5 71% 3.9 70% 4.4 70% 4.9 71% 5.3 69% 4.7 64% 4.3 61% 3.9 63% 4.4 63% 4.7 62% 4.2 59% 4.0 56% 4.3 55% 4.7 54% 4.6 50%
China 0.4 9% 0.4 8% 0.5 9% 0.6 10% 0.6 8% 0.7 10% 0.9 12% 1.0 14% 1.0 17% 1.1 16% 1.2 16% 1.3 19% 1.5 21% 1.7 21% 2.0 22% 2.3 25%
Korea 0.3 6% 0.3 7% 0.4 6% 0.4 6% 0.5 7% 0.6 7% 0.6 8% 0.6 8% 0.4 6% 0.5 7% 0.6 7% 0.5 8% 0.6 9% 0.7 9% 0.8 9% 0.9 10%
Taiwan 0.2 4% 0.2 4% 0.2 4% 0.2 4% 0.3 4% 0.3 4% 0.3 4% 0.3 4% 0.3 4% 0.3 4% 0.3 4% 0.3 4% 0.3 4% 0.3 4% 0.3 4% 0.4 4%
HK 0.1 2% 0.1 2% 0.1 2% 0.1 2% 0.1 2% 0.1 2% 0.2 2% 0.2 3% 0.2 3% 0.2 2% 0.2 2% 0.2 2% 0.2 2% 0.2 2% 0.2 2% 0.2 2%
5-ASEAN 0.4 8% 0.4 8% 0.5 8% 0.5 8% 0.6 9% 0.7 9% 0.8 10% 0.7 10% 0.5 7% 0.6 8% 0.6 8% 0.6 8% 0.6 9% 0.7 9% 0.8 9% 0.9 10%
10-East Asia 4.4 5.0 5.5 6.3 6.8 7.7 7.4 7.0 6.2 7.0 7.6 7.1 7.2 7.8 8.7 9.2
Note: The GDP trillions numbers are to one decimal point, so rounding plays an important part in the ASEAN part of the table
Source: IMF, World Bank, Macquarie Research, March 2017

Ma
cq
ua
rie R
esea
rch
M
acq-ro
insig
hts
1 M
arc
h 2
01
7
31
Fig 55 Real GDP growth (annual %), totals weighted by GDP in current US$ shares, Macquarie where available (shaded in grey)
Country Name 1990 1991 1992 1993 1994 1995 1996 1997 1998 1999 2000 2001 2002 2003 2004 2005 2006 2007 2008 2009 2010 2011 2012 2013 2014 2015 2016 2017 2018 2019 2020
Advanced US 1.9 -0.1 3.6 2.7 4.0 2.7 3.8 4.5 4.5 4.7 4.1 1.0 1.8 2.8 3.8 3.3 2.7 1.8 -0.3 -2.8 2.5 1.6 2.2 1.7 2.4 2.6 1.7 2.5 2.3 1.9 1.8 Japan 5.6 3.3 0.8 0.2 0.9 1.9 2.6 1.6 -2.0 -0.2 2.3 0.4 0.3 1.7 2.4 1.3 1.7 2.2 -1.0 -5.5 4.7 -0.5 1.7 1.4 0.0 0.5 0.7 0.8 0.7 0.8 0.8 Germany 5.7 5.0 1.5 -1.0 2.5 1.8 0.9 1.9 1.8 1.8 3.2 1.8 0.0 -0.7 0.7 0.9 3.9 3.4 0.8 -5.6 4.0 3.7 0.7 0.6 1.6 1.5 1.7 1.4 1.4 1.3 1.3 France 2.9 1.0 1.6 -0.6 2.3 2.1 1.4 2.3 3.6 3.4 3.9 2.0 1.1 0.8 2.8 1.6 2.4 2.4 0.2 -2.9 2.0 2.1 0.2 0.6 0.6 1.3 1.3 1.3 1.6 1.7 1.8 Italy 2.1 1.5 0.8 -0.9 2.2 2.3 1.3 1.8 1.6 1.6 3.7 1.8 0.2 0.2 1.6 1.0 2.0 1.5 -1.1 -5.5 1.7 0.6 -2.8 -1.7 -0.3 0.8 0.8 0.9 1.1 0.9 0.9 Spain 3.8 2.5 0.9 -1.3 2.3 4.1 2.4 3.9 4.5 4.7 5.1 4.0 2.9 3.2 3.2 3.7 4.2 3.8 1.1 -3.6 0.0 -1.0 -2.6 -1.7 1.4 3.2 3.1 2.2 1.9 1.9 1.8 UK 0.7 -1.1 0.4 2.5 3.9 2.5 2.5 3.1 3.2 3.3 3.7 2.7 2.4 3.5 2.5 3.0 2.5 2.6 -0.6 -4.3 1.9 1.5 1.3 1.9 3.1 2.2 2.0 1.7 1.3 1.6 1.7 Australia 1.5 -1.1 2.7 4.0 4.9 3.0 4.3 4.3 4.6 4.3 3.2 2.5 4.0 3.0 4.1 3.2 2.7 4.5 2.6 1.8 2.3 2.7 3.6 2.0 2.7 2.4 2.3 1.9 2.7 2.8 2.5 Canada 0.2 -2.1 0.9 2.7 4.5 2.7 1.6 4.3 3.9 5.2 5.2 1.8 3.0 1.8 3.1 3.2 2.6 2.1 1.0 -3.0 3.1 3.1 1.7 2.2 2.5 1.1 1.3 1.7 1.6 1.4 1.4 S. Korea 9.8 10.4 6.2 6.8 9.2 9.6 7.6 5.9 -5.5 11.3 8.9 4.5 7.4 2.9 4.9 3.9 5.2 5.5 2.8 0.7 6.5 3.7 2.3 2.9 3.3 2.6 2.8 2.9 2.7 2.6 2.6
10-Total 3.7 1.4 1.6 2.0 2.9 2.5 2.7 2.4 0.0 -3.6 2.9 1.5 1.4 1.2 1.8 2.0 1.6 2.0 1.8 1.7 1.6
Emerging Brazil -4.2 1.0 -0.5 4.7 5.3 4.4 2.2 3.4 0.3 0.5 4.4 1.4 3.1 1.1 5.8 3.2 4.0 6.1 5.1 -0.1 7.5 3.9 1.9 3.0 0.1 -3.8 -3.3 0.5 1.5 2.0 2.0 Mexico 5.2 4.2 3.5 2.3 4.7 -5.8 5.9 7.0 4.7 2.7 5.3 -0.6 0.1 1.4 4.3 3.0 5.0 3.1 1.4 -4.7 5.1 4.0 4.0 1.4 2.2 2.5 2.1 2.3 2.6 2.9 3.0 Russia n/a n/a n/a -8.7 -12.7 -4.1 -3.6 1.4 -5.3 6.4 10.0 5.1 4.7 7.3 7.2 6.4 8.2 8.5 5.2 -7.8 4.5 4.0 3.5 1.3 0.7 -3.7 -0.8 1.1 1.2 1.5 1.5 Turkey 9.3 0.9 6.0 8.0 -5.5 7.2 7.0 7.5 3.1 -3.4 6.8 -5.7 6.2 5.3 9.4 8.4 6.9 4.7 0.7 -4.8 9.2 8.8 2.1 4.2 3.0 4.0 3.3 3.0 3.2 3.3 3.5 India 5.5 1.1 5.5 4.8 6.7 7.6 7.6 4.1 6.2 8.5 4.0 4.9 3.9 7.9 7.8 9.3 9.3 9.8 3.9 8.5 10.3 6.6 5.6 6.6 7.2 7.6 7.2 6.9 7.7 7.5 7.5 China 3.9 9.2 14.3 13.9 13.1 11.0 9.9 9.2 7.8 7.6 8.4 8.3 9.1 10.0 10.1 11.3 12.7 14.2 9.6 9.2 10.6 9.5 7.9 7.8 7.3 6.9 6.8 6.5 5.6 5.4 5.8
6-Total 6.5 3.9 5.3 6.5 7.9 7.8 8.9 9.6 6.2 3.8 8.8 7.1 5.7 5.7 5.2 4.7 4.9 5.2 4.8 4.8 5.0
16-Total 4.1 1.7 2.1 2.7 3.7 3.4 3.8 3.9 1.4 -1.8 4.5 3.1 2.7 2.6 2.9 2.9 2.7 3.0 2.8 2.7 2.7
ASEAN Indonesia 9.0 8.9 6.5 8.0 7.5 8.2 7.8 4.7 -13.1 0.8 5.0 3.6 4.5 4.8 5.0 5.7 5.5 6.3 7.4 4.7 6.4 6.2 6.0 5.6 5.0 4.8 4.9 5.2 5.2 5.0 5.0 Malaysia 9.0 9.5 8.9 9.9 9.2 9.8 10.0 7.3 -7.4 6.1 8.7 0.5 5.4 5.8 6.8 5.0 5.6 6.3 4.8 -1.5 7.5 5.3 5.5 4.7 6.0 5.0 4.3 4.5 5.1 5.1 5.1 Singapore 10.0 6.7 7.1 11.5 10.9 7.0 7.5 8.3 -2.2 6.1 8.9 -1.0 4.2 4.4 9.5 7.5 8.9 9.1 1.8 -0.6 15.2 6.2 3.7 4.7 3.3 2.0 1.8 1.6 2.6 2.6 2.6 Philippines 3.0 -0.6 0.3 2.1 4.4 4.7 5.8 5.2 -0.6 3.1 4.4 2.9 3.6 5.0 6.7 4.8 5.2 6.6 4.2 1.1 7.6 3.7 6.7 7.1 6.2 5.9 6.2 6.1 6.3 6.0 6.0 Thailand 11.6 8.4 9.2 8.7 8.0 8.1 5.7 -2.8 -7.6 4.6 4.5 3.4 6.1 7.2 6.3 4.2 5.0 5.4 1.7 -0.7 7.5 0.8 7.2 2.7 0.8 2.8 3.2 3.3 3.5 3.5 3.5
5-ASEAN 6.1 2.2 4.8 5.5 6.5 5.4 5.9 6.6 4.6 1.5 8.1 4.8 5.9 5.0 4.3 4.2 4.3 4.4 4.6 4.6 4.5
10-East Asia
Japan 5.6 3.3 0.8 0.2 0.9 1.9 2.6 1.6 -2.0 -0.2 2.3 0.4 0.3 1.7 2.4 1.3 1.7 2.2 -1.0 -5.5 4.7 -0.5 1.7 1.4 0.0 0.5 0.7 0.8 0.7 0.8 0.8
China 3.9 9.2 14.3 13.9 13.1 11.0 9.9 9.2 7.8 7.6 8.4 8.3 9.1 10.0 10.1 11.3 12.7 14.2 9.6 9.2 10.6 9.5 7.9 7.8 7.3 6.9 6.8 6.5 5.6 5.4 5.8
Korea 9.8 10.4 6.2 6.8 9.2 9.6 7.6 5.9 -5.5 11.3 8.9 4.5 7.4 2.9 4.9 3.9 5.2 5.5 2.8 0.7 6.5 3.7 2.3 2.9 3.3 2.6 2.8 2.9 2.7 2.6 2.6
Taiwan 5.6 8.4 8.3 6.8 7.5 6.5 6.2 6.1 4.2 6.7 6.4 -1.3 5.6 4.1 6.5 5.4 5.6 6.5 0.7 -1.6 10.6 3.8 2.1 2.2 3.9 0.6 1.0 1.7 1.9 2.2 2.5
HK 3.8 5.7 6.2 6.2 6.0 2.4 4.3 5.1 -5.9 2.5 7.7 0.6 1.7 3.1 8.7 7.4 7.0 6.5 2.1 -2.5 6.8 4.8 1.7 3.1 2.7 2.4 1.2 1.5 2.0 2.4 2.4
5-ASEAN 8.9 7.4 6.8 8.1 7.9 7.8 7.3 4.1 -6.9 3.7 6.1 2.2 4.8 5.5 6.5 5.4 5.9 6.6 4.6 1.5 8.1 4.8 5.9 5.0 4.3 4.2 4.3 4.4 4.6 4.6 4.5
10-East Asia 4.3 2.3 3.4 4.0 5.0 4.7 5.9 7.2 3.9 1.6 7.8 4.9 5.1 5.2 4.8 4.7 4.7 4.9 4.7 4.7 4.8
Note: Totals are weighted by the respective year ‘GDP in current US$’ weights from Fig 54. 2016-20 use 2015 weights.
Source: IMF, World Bank, Macquarie Research, March 2017

Ma
cq
ua
rie R
esea
rch
M
acq-ro
insig
hts
1 M
arc
h 2
01
7
32
Fig 56 Trade balance in US$bn
2000 2001 2002 2003 2004 2005 2006 2007 2008 2009 2010 2011 2012 2013 2014 2015 2016 2017 2018 2019 2020
Japan 118 73 97 108 133 107 95 120 56 57 108 -4 -53 -89 -100 -5 53 54 56 52 50 China 30 28 38 40 59 130 216 312 360 244 246 229 312 359 435 567 495 447 462 495 544 Korea 16 10 15 22 39 32 25 33 12 48 48 29 49 83 89 122 123 110 112 108 104 Hong Kong 20 21 24 24 24 31 31 27 25 13 3 -7 -19 -28 -32 -23 -18 -20 -19 -21 -23 Taiwan 19 26 31 34 25 25 31 38 29 39 37 40 49 55 60 73 71 72 73 80 80 Malaysia 21 18 19 26 28 34 38 38 51 40 38 46 37 31 35 28 23 26 25 24 26 Indonesia 25 23 24 25 20 18 30 33 23 31 31 34 9 6 7 13 15 14 19 24 29 Singapore 16 21 22 37 40 48 51 58 42 48 63 74 70 76 80 83 86 81 80 86 93 Philippines -11 -12 -10 -11 -10 -12 -11 -14 -19 -14 -17 -20 -19 -18 -17 -23 -34 -35 -35 -38 -41 Thailand 12 9 9 11 11 3 14 27 17 31 27 12 0 0 17 27 38 48 50 46 44 Total 266 216 268 316 369 416 519 671 597 537 585 431 436 474 573 862 853 798 822 856 906
US -454 -433 -486 -555 -677 -793 -850 -837 -851 -525 -670 -778 -780 -739 -778 -793 -771 -831 -863 -923 -1006
Note: Forecasts by the IMF
Source: Oxford Economics, Datastream, Macquarie Research, January 2017
Fig 57 Current account balance in US$bn
2000 2001 2002 2003 2004 2005 2006 2007 2008 2009 2010 2011 2012 2013 2014 2015 2016 2017 2018 2019 2020
Japan 131 86 109 139 182 170 175 212 143 145 221 130 60 46 36 136 176 171 175 170 183 China 20 17 35 43 69 132 232 353 421 243 238 136 215 148 277 331 271 201 185 171 153 Korea 10 3 5 12 30 13 4 12 3 34 29 19 51 81 84 106 102 90 90 93 93 Hong Kong 8 10 13 17 17 22 25 28 33 21 16 14 4 4 4 10 9 10 11 12 13 Taiwan 9 19 26 31 20 18 26 35 28 43 40 40 47 53 64 76 78 77 77 79 82 Malaysia 8 7 7 13 15 21 26 30 39 31 26 32 16 11 15 9 4 5 6 6 7 Indonesia 8 7 8 8 5 2 10 7 0 11 5 2 -24 -29 -28 -18 -21 -24 -27 -27 -29 Singapore 10 12 12 22 21 28 37 47 28 33 56 63 52 54 54 58 57 60 59 58 57 Philippines -2 -2 0 0 2 2 7 8 0 8 7 6 7 11 11 8 6 5 4 4 3 Thailand 9 5 5 5 3 -8 2 16 1 21 10 9 -1 -5 15 31 38 31 24 20 15 Total 212 166 221 291 363 399 543 747 695 590 648 450 427 375 533 746 718 625 604 586 576
US -411 -395 -458 -521 -634 -745 -807 -719 -691 -384 -442 -460 -447 -366 -392 -463 -469 -519 -567 -584 -580
Note: forecasts by Oxford Economics
Source: IMF, Datastream, Oxford Economics, Macquarie Research, January 2017

Macquarie Research Macq-ro insights
1 March 2017 33
Japan
Fig 58 Unemployment rate Fig 59 Industrial production, YoY%
Source: Datastream, Macquarie Research, March 2017 Source: Datastream, Macquarie Research, March 2017
Fig 60 CPI, YoY%
Fig 61 Bank lending, YoY%
Source: Datastream, Macquarie Research, March 2017 Source: Datastream, Macquarie Research, March 2017
Fig 62 Retail sales, YoY%
Fig 63 Consumer confidence index
Source: Datastream, Macquarie Research, March 2017 Source: Datastream, Macquarie Research, March 2017
1.0
1.5
2.0
2.5
3.0
3.5
4.0
4.5
5.0
5.5
6.0
19
59
19
62
19
65
19
68
19
71
19
74
19
77
19
80
19
83
19
86
19
89
19
92
19
95
19
98
20
01
20
04
20
07
20
10
20
13
20
16
Unemployment rate
-40
-30
-20
-10
0
10
20
30
1994 1996 1998 2000 2002 2004 2006 2008 2010 2012 2014 2016
(YoY%)
Industrial production
-2
-1
0
1
2
3
4(Y/Y, %)
All Items less food (less alcoholic beverages) and energy
All items less fresh food
All items
-8
-6
-4
-2
0
2
4
6
8
1993 1995 1997 1999 2001 2003 2005 2007 2009 2011 2013 2015
Bank lending excluding shinkin banks (YoY%)
-12
-10
-8
-6
-4
-2
0
2
4
6
8 (YoY%)Retail sales
25
30
35
40
45
50
55
2005 2006 2007 2008 2009 2010 2011 2012 2013 2014 2015 2016
Consumer confidence index - excluding one person household, SADJ(%)

Macquarie Research Macq-ro insights
1 March 2017 34
Singapore
Fig 64 Unemployment rate Fig 65 Industrial production, YoY%
Source: Datastream, Macquarie Research, March 2017 Source: Datastream, Macquarie Research, March 2017
Fig 66 CPI, YoY%
Fig 67 Bank lending, YoY%
Source: Datastream, Macquarie Research, March 2017 Source: Datastream, Macquarie Research, March 2017
Fig 68 Retail sales, YoY%
Source: Datastream, Macquarie Research, March 2017
1.0
1.5
2.0
2.5
3.0
3.5
4.0
4.5
5.0Unemployment rate
-40
-30
-20
-10
0
10
20
30
40
50
60
70
1991 1993 1995 1997 1999 2001 2003 2005 2007 2009 2011 2013 2015
(YoY%)industrial production
-2
-1
0
1
2
3
4
5
6
7
8(YoY%) CPI
-3
2
7
12
17
22
27
32(YoY%) Bank lending
-30
-20
-10
0
10
20
30
40 (YoY%) Retail sales index

Macquarie Research Macq-ro insights
1 March 2017 35
Malaysia
Fig 69 Unemployment rate Fig 70 Industrial production, YoY%
Source: Datastream, Macquarie Research, March 2017 Source: Datastream, Macquarie Research, March 2017
Fig 71 CPI, YoY%
Source: Datastream, Macquarie Research, March 2017
Fig 72 Retail sales, YoY%
Source: Datastream, Macquarie Research, March 2017
2.4
2.6
2.8
3.0
3.2
3.4
3.6
3.8
Unemployment rate
-10
-5
0
5
10
15 (YoY%)
Industrial production
-4
-2
0
2
4
6
8
10 (YoY%)CPI
0
2
4
6
8
10
12(YoY%)
Retail sales

Macquarie Research Macq-ro insights
1 March 2017 36
Thailand
Fig 73 Unemployment rate Fig 74 Industrial production, YoY%
Source: Datastream, Macquarie Research, March 2017 Source: Datastream, Macquarie Research, March 2017
Fig 75 CPI, YoY%
Source: Datastream, Macquarie Research, March 2017
Fig 76 Retail sales, YoY%
Fig 77 Consumer confidence index
Source: Datastream, Macquarie Research, March 2017 Source: Datastream, Macquarie Research, March 2017
0.0
0.5
1.0
1.5
2.0
2.5
3.0
3.5Unemployment rate
-40
-30
-20
-10
0
10
20
30
40
50
60 (YoY%)
Industrial production
-6
-4
-2
0
2
4
6
8
10 (YoY%)CPI
-30
-20
-10
0
10
20
30
40
50
60 (YoY%) Retail sales
50
60
70
80
90
100
110
120Consumer confidence index

Macquarie Research Macq-ro insights
1 March 2017 37
Indonesia
Fig 78 Unemployment rate Fig 79 Industrial production, YoY%
Source: Datastream, Macquarie Research, March 2017 Source: Datastream, Macquarie Research, March 2017
Fig 80 CPI, YoY%
Fig 81 Business confidence index
Source: Datastream, Macquarie Research, March 2017 Source: OECD, Macquarie Research, March 2017
Fig 82 Retail sales, YoY%
Fig 83 Consumer confidence index
Source: Datastream, Macquarie Research, March 2017 Source: Datastream, Macquarie Research, March 2017
5
6
7
8
9
10
11
12
19
99
20
00
20
01
20
02
20
03
20
04
20
05
20
06
20
07
20
08
20
09
20
10
20
11
20
12
20
13
20
14
20
15
20
16
Unemployment rate
-20
-10
0
10
20
30
40 Industrial Production(YoY%)
0
2
4
6
8
10
12
14
16
18
20CPI(YoY%)
99.0
99.2
99.4
99.6
99.8
100.0
100.2
100.4
100.6
100.8
101.0
2004 2006 2008 2010 2012 2014 2016
Indonesia
-30
-20
-10
0
10
20
30
40
50Retail sales(YoY%)
50
60
70
80
90
100
110
120
130Consumer confidence index

Macquarie Research Macq-ro insights
1 March 2017 38
Philippines
Fig 84 Unemployment rate Fig 85 Industrial production, YoY%
Source: Datastream, Macquarie Research, March 2017 Source: Datastream, Macquarie Research, March 2017
Fig 86 CPI, YoY%
Source: Datastream, Macquarie Research, March 2017
Fig 87 Retail sales, YoY%
Source: Datastream, Macquarie Research, March 2017
5
6
7
8
9
10
11
12
13
14
15Unemployment rate
-30
-20
-10
0
10
20
30
40
1997 1999 2001 2003 2005 2007 2009 2011 2013 2015
(YoY%) Industrial production
0
2
4
6
8
10
12
1997 1999 2001 2003 2005 2007 2009 2011 2013 2015
(YoY%) CPI
-5
0
5
10
15
20
25 (YoY%)Retail sales
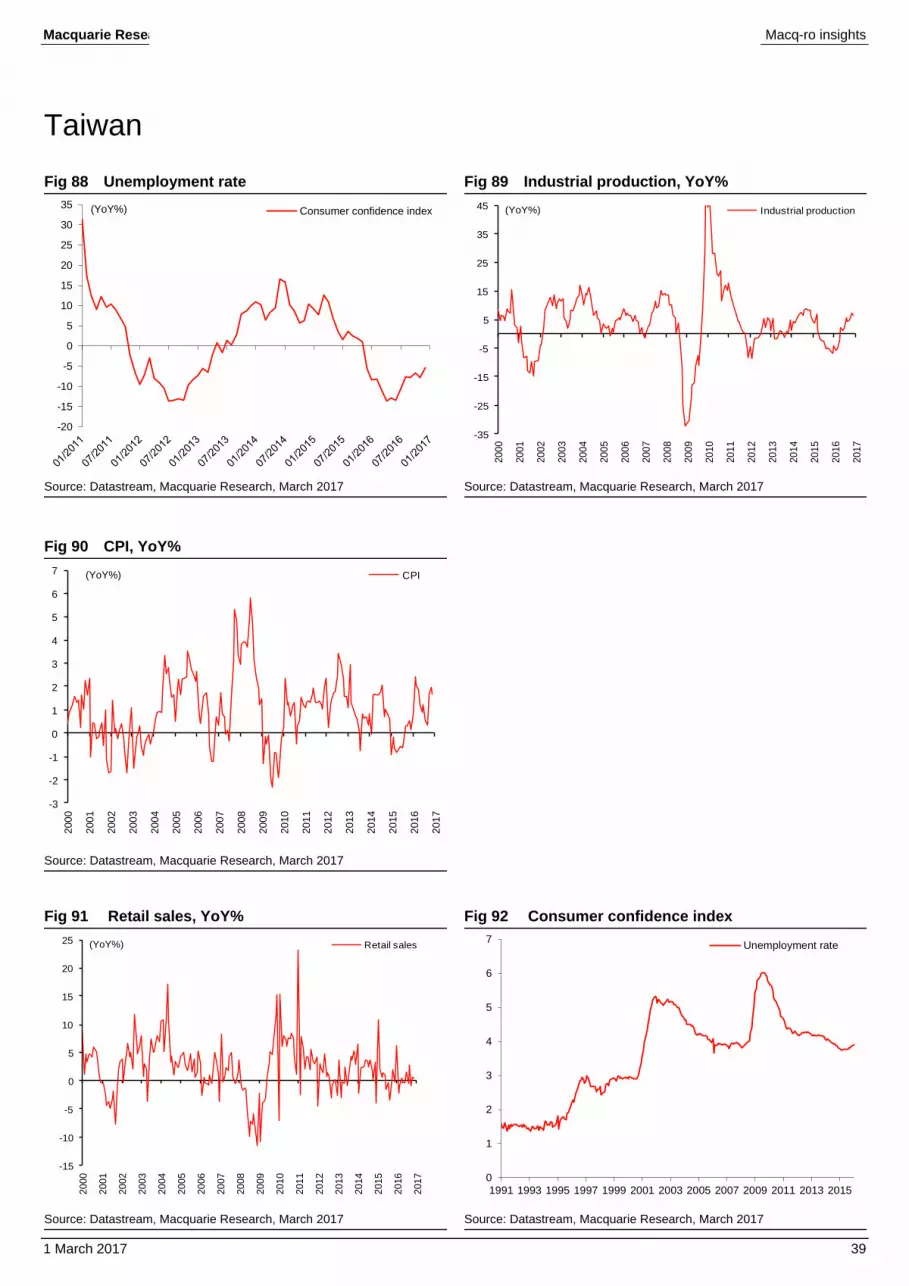
Macquarie Research Macq-ro insights
1 March 2017 39
Taiwan
Fig 88 Unemployment rate Fig 89 Industrial production, YoY%
Source: Datastream, Macquarie Research, March 2017 Source: Datastream, Macquarie Research, March 2017
Fig 90 CPI, YoY%
Source: Datastream, Macquarie Research, March 2017
Fig 91 Retail sales, YoY%
Fig 92 Consumer confidence index
Source: Datastream, Macquarie Research, March 2017 Source: Datastream, Macquarie Research, March 2017
-20
-15
-10
-5
0
5
10
15
20
25
30
35 (YoY%) Consumer confidence index
-35
-25
-15
-5
5
15
25
35
45
2000
2001
2002
2003
2004
2005
2006
2007
2008
2009
2010
2011
2012
2013
2014
2015
2016
2017
(YoY%) Industrial production
-3
-2
-1
0
1
2
3
4
5
6
7
2000
2001
2002
2003
2004
2005
2006
2007
2008
2009
2010
2011
2012
2013
2014
2015
2016
2017
(YoY%) CPI
-15
-10
-5
0
5
10
15
20
25
2000
2001
2002
2003
2004
2005
2006
2007
2008
2009
2010
2011
2012
2013
2014
2015
2016
2017
(YoY%) Retail sales
0
1
2
3
4
5
6
7
1991 1993 1995 1997 1999 2001 2003 2005 2007 2009 2011 2013 2015
Unemployment rate

Macquarie Research Macq-ro insights
1 March 2017 40
South Korea
Fig 93 Unemployment rate Fig 94 Industrial production, YoY%
Source: Datastream, Macquarie Research, March 2017 Source: Datastream, Macquarie Research, March 2017
Fig 95 CPI, YoY%
Fig 96 Business confidence index
Source: Datastream, Macquarie Research, March 2017 Source: OECD, Macquarie Research, March 2017
Fig 97 Construction orders, YoY%
Fig 98 Consumer confidence index
Source: Datastream, Macquarie Research, March 2017 Source: Datastream, Macquarie Research, March 2017
2.5
3.0
3.5
4.0
4.5
5.0
5.5Unemployment rate
-30
-20
-10
0
10
20
30
40(YoY%) Industrial production
0
1
2
3
4
5
6
7(YoY%) CPI
94
96
98
100
102
104
106
108
1991 1993 1995 1997 1999 2001 2003 2005 2007 2009 2011 2013 2015
Korea
-70
-20
30
80
130
180
230(YoY%) Construction orders
95
96
97
98
99
100
101
102
103
104
Consumer confidence index

Macquarie Research Macq-ro insights
1 March 2017 41
Important disclosures:
Recommendation definitions
Macquarie - Australia/New Zealand Outperform – return >3% in excess of benchmark return Neutral – return within 3% of benchmark return Underperform – return >3% below benchmark return Benchmark return is determined by long term nominal GDP growth plus 12 month forward market dividend yield
Macquarie – Asia/Europe Outperform – expected return >+10% Neutral – expected return from -10% to +10% Underperform – expected return <-10%
Macquarie – South Africa Outperform – expected return >+10% Neutral – expected return from -10% to +10% Underperform – expected return <-10%
Macquarie - Canada Outperform – return >5% in excess of benchmark return Neutral – return within 5% of benchmark return Underperform – return >5% below benchmark return
Macquarie - USA Outperform (Buy) – return >5% in excess of Russell 3000 index return Neutral (Hold) – return within 5% of Russell 3000 index return Underperform (Sell)– return >5% below Russell 3000 index return
Volatility index definition*
This is calculated from the volatility of historical price movements. Very high–highest risk – Stock should be expected to move up or down 60–100% in a year – investors should be aware this stock is highly speculative. High – stock should be expected to move up or down at least 40–60% in a year – investors should be aware this stock could be speculative. Medium – stock should be expected to move up or down at least 30–40% in a year. Low–medium – stock should be expected to move up or down at least 25–30% in a year. Low – stock should be expected to move up or down at least 15–25% in a year. * Applicable to Asia/Australian/NZ/Canada stocks only
Recommendations – 12 months Note: Quant recommendations may differ from Fundamental Analyst recommendations
Financial definitions
All "Adjusted" data items have had the following adjustments made: Added back: goodwill amortisation, provision for catastrophe reserves, IFRS derivatives & hedging, IFRS impairments & IFRS interest expense Excluded: non recurring items, asset revals, property revals, appraisal value uplift, preference dividends & minority interests EPS = adjusted net profit / efpowa* ROA = adjusted ebit / average total assets ROA Banks/Insurance = adjusted net profit /average total assets ROE = adjusted net profit / average shareholders funds Gross cashflow = adjusted net profit + depreciation *equivalent fully paid ordinary weighted average number of shares All Reported numbers for Australian/NZ listed stocks are modelled under IFRS (International Financial Reporting Standards).
Recommendation proportions – For quarter ending 31 December 2016
AU/NZ Asia RSA USA CA EUR Outperform 57.53% 50.72% 45.57% 42.28% 60.58% 52.79% (for global coverage by Macquarie, 8.71% of stocks followed are investment banking clients)
Neutral 33.90% 33.97% 43.04% 50.11% 37.23% 35.62% (for global coverage by Macquarie, 8.05% of stocks followed are investment banking clients)
Underperform 8.56% 15.30% 11.39% 7.61% 2.19% 11.59% (for global coverage by Macquarie, 4.63% of stocks followed are investment banking clients)
Company-specific disclosures: Important disclosure information regarding the subject companies covered in this report is available at www.macquarie.com/research/disclosures.
Analyst certification: We hereby certify that all of the views expressed in this report accurately reflect our personal views about the subject company or companies and its or their securities. We also certify that no part of our compensation was, is or will be, directly or indirectly, related to the specific recommendations or views expressed in this report. The Analysts responsible for preparing this report receive compensation from Macquarie that is based upon various factors including Macquarie Group Ltd total revenues, a portion of which are generated by Macquarie Group’s Investment Banking activities. General disclaimers: Macquarie Securities (Australia) Ltd; Macquarie Capital (Europe) Ltd; Macquarie Capital Markets Canada Ltd; Macquarie Capital Markets North America Ltd; Macquarie Capital (USA) Inc; Macquarie Capital Limited and Macquarie Capital Limited, Taiwan Securities Branch; Macquarie Capital Securities (Singapore) Pte Ltd; Macquarie Securities (NZ) Ltd; Macquarie Equities South Africa (Pty) Ltd; Macquarie Capital Securities (India) Pvt Ltd; Macquarie Capital Securities (Malaysia) Sdn Bhd; Macquarie Securities Korea Limited and Macquarie Securities (Thailand) Ltd are not authorized deposit-taking institutions for the purposes of the Banking Act 1959 (Commonwealth of Australia), and their obligations do not represent deposits or other liabilities of Macquarie Bank Limited ABN 46 008 583 542 (MBL) or MGL. MBL does not guarantee or otherwise provide assurance in respect of the obligations of any of the above mentioned entities. MGL provides a guarantee to the Monetary Authority of Singapore in respect of the obligations and liabilities of Macquarie Capital Securities (Singapore) Pte Ltd for up to SGD 35 million. This research has been prepared for the general use of the wholesale clients of the Macquarie Group and must not be copied, either in whole or in part, or distributed to any other person. If you are not the intended recipient you must not use or disclose the information in this research in any way. If you received it in error, please tell us immediately by return e-mail and delete the document. We do not guarantee the integrity of any e-mails or attached files and are not responsible for any changes made to them by any other person. MGL has established and implemented a conflicts policy at group level (which may be revised and updated from time to time) (the "Conflicts Policy") pursuant to regulatory requirements (including the FCA Rules) which sets out how we must seek to identify and manage all material conflicts of interest. Nothing in this research shall be construed as a solicitation to buy or sell any security or product, or to engage in or refrain from engaging in any transaction. In preparing this research, we did not take into account your investment objectives, financial situation or particular needs. Macquarie salespeople, traders and other professionals may provide oral or written market commentary or trading strategies to our clients that reflect opinions which are contrary to the opinions expressed in this research. Macquarie Research produces a variety of research products including, but not limited to, fundamental analysis, macro-economic analysis, quantitative analysis, and trade ideas. Recommendations contained in one type of research product may differ from recommendations contained in other types of research, whether as a result of differing time horizons, methodologies, or otherwise. Before making an investment decision on the basis of this research, you need to consider, with or without the assistance of an adviser, whether the advice is appropriate in light of your particular investment needs, objectives and financial circumstances. There are risks involved in securities trading. The price of securities can and does fluctuate, and an individual security may even become valueless. International investors are reminded of the additional risks inherent in international investments, such as currency fluctuations and international stock market or economic conditions, which may adversely affect the value of the investment. This research is based on information obtained from sources believed to be reliable but we do not make any representation or warranty that it is accurate, complete or up to date. We accept no obligation to correct or update the information or opinions in it. Opinions expressed are subject to change without notice. No member of the Macquarie Group accepts any liability whatsoever for any direct, indirect, consequential or other loss arising from any use of this research and/or further communication in relation to this research. Clients should contact analysts at, and execute transactions through, a Macquarie Group entity in their home jurisdiction unless governing law permits otherwise. The date and timestamp for above share price and market cap is the closed price of the price date. #CLOSE is the final price at which the security is traded in the relevant exchange on the date indicated. Country-specific disclaimers: Australia: In Australia, research is issued and distributed by Macquarie Securities (Australia) Ltd (AFSL No. 238947), a participating organisation of the Australian Securities Exchange. New Zealand: In New Zealand, research is issued and distributed by Macquarie Securities (NZ) Ltd, a NZX Firm. Canada: In Canada, research is prepared, approved and distributed by Macquarie Capital Markets Canada Ltd, a participating organisation of the Toronto Stock Exchange, TSX Venture Exchange & Montréal Exchange. Macquarie Capital Markets North America Ltd., which is a registered broker-dealer and member of FINRA, accepts responsibility for the contents of reports issued by Macquarie Capital Markets Canada Ltd in the United States and sent to US persons. Any US person wishing to effect transactions in the securities described in the reports issued by Macquarie Capital Markets Canada Ltd should do so with Macquarie Capital Markets North America Ltd. The Research Distribution Policy of Macquarie Capital Markets Canada Ltd is to allow all clients that are entitled to have equal access to our research. United Kingdom: In the United Kingdom, research is issued and distributed by Macquarie Capital (Europe) Ltd, which is authorised and regulated by the Financial Conduct Authority (No. 193905). Germany: In

Macquarie Research Macq-ro insights
1 March 2017 42
Germany, this research is issued and/or distributed by Macquarie Capital (Europe) Limited, Niederlassung Deutschland, which is authorised and regulated by the UK Financial Conduct Authority (No. 193905). and in Germany by BaFin. France: In France, research is issued and distributed by Macquarie Capital (Europe) Ltd, which is authorised and regulated in the United Kingdom by the Financial Conduct Authority (No. 193905). Hong Kong & Mainland China: In Hong Kong, research is issued and distributed by Macquarie Capital Limited, which is licensed and regulated by the Securities and Futures Commission. In Mainland China, Macquarie Securities (Australia) Limited Shanghai Representative Office only engages in non-business operational activities excluding issuing and distributing research. Only non-A share research is distributed into Mainland China by Macquarie Capital Limited. Japan: In Japan, research is Issued and distributed by Macquarie Capital Securities (Japan) Limited, a member of the Tokyo Stock Exchange, Inc. and Osaka Exchange, Inc. (Financial Instruments Firm, Kanto Financial Bureau (kin-sho) No. 231, a member of Japan Securities Dealers Association). India: In India, research is issued and distributed by Macquarie Capital Securities (India) Pvt. Ltd. (CIN: U65920MH1995PTC090696), 92, Level 9, 2 North Avenue, Maker Maxity, Bandra Kurla Complex, Bandra (East), Mumbai – 400 051, India, which is a SEBI registered Research Analyst having registration no. INH000000545. Malaysia: In Malaysia, research is issued and distributed by Macquarie Capital Securities (Malaysia) Sdn. Bhd. (Company registration number: 463469-W) which is a Participating Organisation of Bursa Malaysia Berhad and a holder of Capital Markets Services License issued by the Securities Commission. Taiwan: In Taiwan, research is issued and distributed by Macquarie Capital Limited, Taiwan Securities Branch, which is licensed and regulated by the Financial Supervisory Commission. No portion of the report may be reproduced or quoted by the press or any other person without authorisation from Macquarie. Nothing in this research shall be construed as a solicitation to buy or sell any security or product. The recipient of this report shall not engage in any activities which may give rise to potential conflicts of interest to the report. Research Associate(s) in this report who are registered as Clerks only assist in the preparation of research and are not engaged in writing the research. Thailand: In Thailand, research is produced, issued and distributed by Macquarie Securities (Thailand) Ltd. Macquarie Securities (Thailand) Ltd. is a licensed securities company that is authorized by the Ministry of Finance, regulated by the Securities and Exchange Commission of Thailand and is an exchange member of the Stock Exchange of Thailand. The Thai Institute of Directors Association has disclosed the Corporate Governance Report of Thai Listed Companies made pursuant to the policy of the Securities and Exchange Commission of Thailand. Macquarie Securities (Thailand) Ltd does not endorse the result of the Corporate Governance Report of Thai Listed Companies but this Report can be accessed at: http://www.thai-iod.com/en/publications.asp?type=4. South Korea: In South Korea, unless otherwise stated, research is prepared, issued and distributed by Macquarie Securities Korea Limited, which is regulated by the Financial Supervisory Services. Information on analysts in MSKL is disclosed at http://dis.kofia.or.kr/websquare/index.jsp?w2xPath=/wq/fundMgr/DISFundMgrAnalystStut.xml&divisionId=MDIS03002001000000&serviceId=SDIS03002001000. South Africa: In South Africa, research is issued and distributed by Macquarie Equities South Africa (Pty) Ltd, a member of the JSE Limited. Singapore: In Singapore, research is issued and distributed by Macquarie Capital Securities (Singapore) Pte Ltd (Company Registration Number: 198702912C), a Capital Markets Services license holder under the Securities and Futures Act to deal in securities and provide custodial services in Singapore. Pursuant to the Financial Advisers (Amendment) Regulations 2005, Macquarie Capital Securities (Singapore) Pte Ltd is exempt from complying with sections 25, 27 and 36 of the Financial Advisers Act. All Singapore-based recipients of research produced by Macquarie Capital (Europe) Limited, Macquarie Capital Markets Canada Ltd, Macquarie Equities South Africa (Pty) Ltd and Macquarie Capital (USA) Inc. represent and warrant that they are institutional investors as defined in the Securities and Futures Act. United States: In the United States, research is issued and distributed by Macquarie Capital (USA) Inc., which is a registered broker-dealer and member of FINRA. Macquarie Capital (USA) Inc, accepts responsibility for the content of each research report prepared by one of its non-US affiliates when the research report is distributed in the United States by Macquarie Capital (USA) Inc. Macquarie Capital (USA) Inc.’s affiliate’s analysts are not registered as research analysts with FINRA, may not be associated persons of Macquarie Capital (USA) Inc., and therefore may not be subject to FINRA rule restrictions on communications with a subject company, public appearances, and trading securities held by a research analyst account. Information regarding futures is provided for reference purposes only and is not a solicitation for purchases or sales of futures. Any persons receiving this report directly from Macquarie Capital (USA) Inc. and wishing to effect a transaction in any security described herein should do so with Macquarie Capital (USA) Inc. Important disclosure information regarding the subject companies covered in this report is available at www.macquarie.com/research/disclosures, or contact your registered representative at 1-888-MAC-STOCK, or write to the Supervisory Analysts, Research Department, Macquarie Securities, 125 W.55th Street, New York, NY 10019. © Macquarie Group

Asia Research Head of Equity Research
Peter Redhead (Global – Head) (852) 3922 4836
Jake Lynch (Asia – Head) (852) 3922 3583
David Gibson (Japan – Head) (813) 3512 7880
Conrad Werner (ASEAN – Head) (65) 6601 0182
Automobiles/Auto Parts
Janet Lewis (China, Japan) (813) 3512 7856
James Hong (Korea) (822) 3705 8661
Amit Mishra (India) (9122) 6720 4084
Financials
Scott Russell (Asia) (852) 3922 3567
Dexter Hsu (China, Taiwan) (8862) 2734 7530
Keisuke Moriyama (Japan) (813) 3512 7476
Chan Hwang (Korea) (822) 3705 8643
Suresh Ganapathy (India) (9122) 6720 4078
Sameer Bhise (India) (9122) 6720 4099
Gilbert Lopez (Philippines) (632) 857 0892
Ken Ang (Singapore) (65) 6601 0836
Passakorn Linmaneechote (Thailand) (662) 694 7728
Conglomerates
David Ng (China, Hong Kong) (852) 3922 1291
Conrad Werner (Singapore) (65) 6601 0182
Gilbert Lopez (Philippines) (632) 857 0892
Consumer and Gaming
Linda Huang (Asia, China, Hong Kong) (852) 3922 4068
Zibo Chen (China, Hong Kong) (852) 3922 1130
Terence Chang (China, Hong Kong) (852) 3922 3581
Sunny Chow (China, Hong Kong) (852) 3922 3768
Satsuki Kawasaki (Japan) (813) 3512 7870
Kwang Cho (Korea) (822) 3705 4953
KJ Lee (Korea) (822) 3705 9935
Stella Li (Taiwan) (8862) 2734 7514
Amit Sinha (India) (9122) 6720 4085
Fransisca Widjaja (65) 6601 0847 (Indonesia, Singapore)
Karisa Magpayo (Philippines) (632) 857 0899
Chalinee Congmuang (Thailand) (662) 694 7993
Emerging Leaders
Jake Lynch (Asia) (852) 3922 3583
Aditya Suresh (Asia) (852) 3922 1265
Timothy Lam (China, Hong Kong) (852) 3922 1086
Kwang Cho (Korea) (822) 3705 4953
Corinne Jian (Taiwan) (8862) 2734 7522
Marcus Yang (Taiwan) (8862) 2734 7532
Conrad Werner (ASEAN) (65) 6601 0182
Industrials
Janet Lewis (Asia) (813) 3512 7856
Patrick Dai (China) (8621) 2412 9082
Kunio Sakaida (Japan) (813) 3512 7873
William Montgomery (Japan) (813) 3512 7864
James Hong (Korea) (822) 3705 8661
Benson Pan (Taiwan) (8862) 2734 7527
Inderjeetsingh Bhatia (India) (9122) 6720 4087
Justin Chiam (Singapore) (65) 6601 0560
Internet, Media and Software
Wendy Huang (Asia, China) (852) 3922 3378
David Gibson (Asia, Japan) (813) 3512 7880
Hillman Chan (China, Hong Kong) (852) 3922 3716
Soyun Shin (Korea) (822) 3705 8659
Abhishek Bhandari (India) (9122) 6720 4088
Oil, Gas and Petrochemicals
Polina Diyachkina (Asia, Japan) (813) 3512 7886
Aditya Suresh (Asia, China, India) (852) 3922 1265
Anna Park (Korea) (822) 3705 8669
Duke Suttikulpanich (ASEAN) (65) 6601 0148
Isaac Chow (Malaysia) (603) 2059 8982
Pharmaceuticals and Healthcare
Abhishek Singhal (India) (9122) 6720 4086
Wei Li (China, Hong Kong) (852) 3922 5494
Property
Tuck Yin Soong (Asia, Singapore) (65) 6601 0838
David Ng (China, Hong Kong) (852) 3922 1291
Raymond Liu (China, Hong Kong) (852) 3922 3629
Wilson Ho (China) (852) 3922 3248
William Montgomery (Japan) (813) 3512 7864
Corinne Jian (Taiwan) (8862) 2734 7522
Abhishek Bhandari (India) (9122) 6720 4088
Aiman Mohamad (Malaysia) (603) 2059 8986
Kervin Sisayan (Philippines) (632) 857 0893
Patti Tomaitrichitr (Thailand) (662) 694 7727
Resources / Metals and Mining
Polina Diyachkina (Asia, Japan) (813) 3512 7886
Coria Chow (China) (852) 3922 1181
Anna Park (Korea) (822) 3705 8669
Sumangal Nevatia (India) (9122) 6720 4093
Technology
Damian Thong (Asia, Japan) (813) 3512 7877
George Chang (Japan) (813) 3512 7854
Daniel Kim (Korea) (822) 3705 8641
Allen Chang (Greater China) (852) 3922 1136
Jeffrey Ohlweiler (Greater China) (8862) 2734 7512
Patrick Liao (Greater China) (8862) 2734 7515
Louis Cheng (Greater China) (8862) 2734 7526
Kaylin Tsai (Greater China) (8862) 2734 7523
Telecoms
Soyun Shin (Korea) (822) 3705 8659
Prem Jearajasingam (ASEAN) (603) 2059 8989
Kervin Sisayan (Philippines) (632) 857 0893
Transport & Infrastructure
Janet Lewis (Asia) (852) 3922 5417
Corinne Jian (Taiwan) (8862) 2734 7522
Azita Nazrene (ASEAN) (603) 2059 8980
Utilities & Renewables
Patrick Dai (China) (8621) 2412 9082
Candice Chen (China) (8621) 2412 9087
Alan Hon (Hong Kong) (852) 3922 3589
Inderjeetsingh Bhatia (India) (9122) 6720 4087
Prem Jearajasingam (Malaysia) (603) 2059 8989
Karisa Magpayo (Philippines) (632) 857 0899
Commodities
Colin Hamilton (Global) (44 20) 3037 4061
Ian Roper (65) 6601 0698
Jim Lennon (44 20) 3037 4271
Lynn Zhao (8621) 2412 9035
Matthew Turner (44 20) 3037 4340
Economics
Peter Eadon-Clarke (Global) (813) 3512 7850
Larry Hu (China, Hong Kong) (852) 3922 3778
Tanvee Gupta Jain (India) (9122) 6720 4355
Quantitative / CPG
Gurvinder Brar (Global) (44 20) 3037 4036
Woei Chan (Asia) (852) 3922 1421
Danny Deng (Asia) (852) 3922 4646
Per Gullberg (Asia) (852) 3922 1478
Strategy/Country
Viktor Shvets (Asia, Global) (852) 3922 3883
Chetan Seth (Asia) (852) 3922 4769
David Ng (China, Hong Kong) (852) 3922 1291
Peter Eadon-Clarke (Japan) (813) 3512 7850
Chan Hwang (Korea) (822) 3705 8643
Jeffrey Ohlweiler (Taiwan) (8862) 2734 7512
Inderjeetsingh Bhatia (India) (9122) 6720 4087
Jayden Vantarakis (Indonesia) (6221) 2598 8310
Anand Pathmakanthan (Malaysia) (603) 2059 8833
Gilbert Lopez (Philippines) (632) 857 0892
Conrad Werner (Singapore) (65) 6601 0182
Passakorn Linmaneechote (Thailand) (662) 694 7728
Find our research at Macquarie: www.macquarieresearch.com/ideas/ Thomson: www.thomson.com/financial Reuters: www.knowledge.reuters.com Bloomberg: MAC GO Factset: http://www.factset.com/home.aspx CapitalIQ www.capitaliq.com Email [email protected] for access
Asia Sales Regional Heads of Sales
Miki Edelman (Global) (1 212) 231 6121
Jeff Evans (Boston) (1 617) 598 2508
Jeffrey Shiu (China, Hong Kong) (852) 3922 2061
Sandeep Bhatia (India) (9122) 6720 4101
Thomas Renz (Geneva) (41 22) 818 7712
Riaz Hyder (Indonesia) (6221) 2598 8486
Nick Cant (Japan) (65) 6601 0210
John Jay Lee (Korea) (822) 3705 9988
Nik Hadi (Malaysia) (603) 2059 8888
Eric Roles (New York) (1 212) 231 2559
Gino C Rojas (Philippines) (632) 857 0861
Regional Heads of Sales cont’d
Paul Colaco (San Francisco) (1 415) 762 5003
Amelia Mehta (Singapore) (65) 6601 0211
Angus Kent (Thailand) (662) 694 7601
Ben Musgrave (UK/Europe) (44 20) 3037 4882
Christina Lee (UK/Europe) (44 20) 3037 4873
Sales Trading
Adam Zaki (Asia) (852) 3922 2002
Stanley Dunda (Indonesia) (6221) 515 1555
Sales Trading cont’d
Suhaida Samsudin (Malaysia) (603) 2059 8888
Michael Santos (Philippines) (632) 857 0813
Chris Reale (New York) (1 212) 231 2555
Marc Rosa (New York) (1 212) 231 2555
Justin Morrison (Singapore) (65) 6601 0288
Daniel Clarke (Taiwan) (8862) 2734 7580
Brendan Rake (Thailand) (662) 694 7707
Mike Keen (UK/Europe) (44 20) 3037 4905
This publication was disseminated on 01 March 2017 at 06:30 UTC.