migration patterns in male great bustards (otis tarda)
TRANSCRIPT
493
Short Communications
The Auk 117(2):493–498, 2000
Migration Patterns in Male Great Bustards (Otis tarda)
MANUEL B. MORALES,1 JUAN C. ALONSO,1,3 JAVIER A. ALONSO,2 AND ENRIQUE MARTIN1
1Museo Nacional de Ciencias Naturales, CSIC, Jose Gutierrez Abascal 2, 28006 Madrid, Spain; and2Departamento de Biologıa Animal, Facultad de Biologıa, Universidad Complutense, 28040 Madrid, Spain
The Great Bustard (Otis tarda) is distributed fromIberia and Morocco in the west to China in the eastand has been considered sedentary in all but thenorthern and eastern parts of its range (Gewalt 1959,Glutz et al. 1973, Cramp and Simmons 1980). How-ever, some studies have reported seasonal changes inpopulation numbers in different areas in the IberianPeninsula (Hidalgo and Carranza 1990, Alonso et al.1995), suggesting that the species is a partial migrant(sensu Terrill and Able 1988) in this region.
We describe seasonal movements of marked adultmale Great Bustards and discuss observed patternsin relation to the following questions: (1) Do migra-tory males display interannual fidelity to breedingand postbreeding areas? (2) Do males travel signifi-cantly farther than females in their seasonal move-ments? We also suggest several hypotheses thatcould explain patterns of partial and differential mi-gration in male Great Bustards.
Methods.—Our study was carried out in the Wild-life Reserve of Villafafila (41�50�N, 5�35�W; ca. 700 melevation), which extends over 32,682 ha of dry, tree-less and gently undulating farmland in the Provinceof Zamora, northwestern Spain. The land is almostentirely cultivated with wheat and barley. The re-maining surface (ca. 9%) is occupied by naturalgrassland used for sheep grazing. The Reserve holdsthe world’s densest population of Great Bustards(Alonso et al. 1995), which are ground-dwellinglekking birds that inhabit natural and cultivatedgrasslands. The Great Bustard is endangered in mostof its range except for the Iberian Peninsula, whichis the main stronghold for the species (Alonso andAlonso 1996). It exhibits one of the highest amountsof sexual size dimorphism of all vertebrates, andmales and females generally occur in separate flocks.Between late winter and early spring, males concen-trate at traditional arenas where they fight to estab-lish rank and display in an exploded-lek mating sys-tem (see Hoglund and Alatalo 1995). Juvenile malesusually disperse after independence. From theirthird year on, they begin to establish territories at
3 Address correspondence to this author. E-mail:[email protected]
leks 5 to 65 km from their natal sites, but generallythey do not succeed in mating until they are at leastfour years old. Compared with males, females tendto remain closer to their natal site (0.5 to 5 km) andbegin breeding earlier (Alonso et al. 1998).
Each summer from 1983 to 1993, we capturedyoung Great Bustards (body mass 1 to 3.5 kg) bychasing them down while they were still being at-tended by the female parent. We marked a total of105 juvenile males with patagial tags, and in the lastthree years of the study we attached backpack-mounted radio transmitters to 58 of these birds. Bat-tery life of the transmitters averaged three to fouryears, which allowed us to track birds from groundvehicles or aircraft from the time they dispersed un-til they settled as breeding adults (and sometimes forlonger periods). Only 15 males from the originalpool survived long enough to settle in the study areaand be studied during their adult life. Once estab-lished, these males could be located by sight (evenwhen transmitters no longer functioned) during oursurveys of the Reserve and its surroundings. In ad-dition, in February and March 1993 and 1994, wecaptured 11 adult males using a rocket net and pro-vided them with backpack transmitters and dorsalPVC tags for visual identification. During the threeyears after capture, we obtained locations for each ofthese males at least once per month. Therefore, thetotal sample of marked adults was 26, from which wegathered more than 800 locations on different days.
We located all radio-tagged individuals by trian-gulation and subsequent visual observation. Two ofthe 15 birds marked as juveniles settled as residentadults in the Reserve and could be located monthly.These two, plus the 11 marked as adults, resulted in13 adult males for which we obtained data on month-ly patterns of movement. The remaining 13 birds inthe total sample of 26 were seasonal visitors to theReserve and could be contacted only at leks duringthe breeding season, thus yielding information onlyon their presence or absence in the Reserve. When-ever a marked Great Bustard was found during sur-veys, we recorded its location to the nearest 100 mon 1:50,000 maps.
We conducted 50 censuses of Great Bustards in theReserve between January 1987 and March 1998 with
494 [Auk, Vol. 117Short Communications
a frequency that varied from once per fortnight toone every four months. All parts of the Reserve werecovered with equal effort to avoid biases in the prob-ability of contact with individual birds. Some adja-cent areas were also surveyed, although less inten-sively. Each survey was carried out by four people intwo cars during two consecutive days. Surveys fol-lowed predetermined transects to cover the entireReserve and always used the same starting location.Transects covered nearly 400 km in length and re-quired 20 h per team to complete. Surveying was in-terrupted during midday hours (between 1000 to1100 and 1500 to 1600 GMT, depending on the sea-son), when birds usually were inactive and thus lessdetectable. Given the large size of Great Bustards,the generally flat terrain, and the fact that the max-imum distance between roads in the Reserve wasabout 1 km, we assumed that we sighted nearly allof the birds in the study area (see Alonso and Alonso1990). The census results that we present refer tomales that were older than one year. Monthly varia-tion in the number of male Great Bustards observedwas analyzed by one-way ANOVA, and monthly dif-ferences were assessed with the LSD test using val-ues based on more than three censuses. To accountfor interannual effects on the monthly variation inmale numbers, we performed a two-factor ANOVA,adding the variable year to the original model.
To determine the central location of each male’slek, we plotted all sightings of a given male on 1:50,000 maps that contained the boundaries of all leksin the Reserve (Morales et al. 1996, Morales 1999).Sightings were plotted during the period when cop-ulation rate is highest, which in our study area is be-tween 25 March and 15 April (Carranza et al. 1989,Morales et al. 1996). For this analysis, data werepooled over the duration of the study, which yielded17 to 45 locations for each male. The arithmetic meanof these coordinates was used as the coordinate ofthe lek that each male visited each year (this meanwas calculated for every marked bird). All statisticalanalyses were conducted using STATISTICA 5.0(Statsoft 1995).
For each of the 13 males for which we obtained themonthly pattern of movements (see above), we cal-culated the linear distance from its lek coordinatesto every other sighting of that bird and obtained amonthly mean distance to the lek using all sightingsof that bird over the study period. We analyzed themonthly variation of the mean distance to the lek foreach of these males with a one-way ANOVA afterlog-transformation of the data.
We used the total sample of 26 males to measureinterannual fidelity to leks and postbreeding areasby calculating the percentage of males that was seendisplaying at the same lek or using the same post-breeding area, respectively. Any relocation of a malewithin 3 km of its average postbreeding coordinatewas considered to be within that bird’s postbreeding
area. To account for the total percentage of sedentaryand dispersing males, we counted birds in this glob-al sample that were sighted in the Reserve during themating season only and birds that were detected inthe vicinity of their leks throughout the year. We fur-ther used this sample to analyze the influence of ageas a factor in the migratory behavior of the birds afterdividing the sample into two age groups, �5 yearsand �5 years. Although the exact age was knownonly for birds that we caught as chicks (n � 15),males captured as adults (n � 11) were easily as-signed to one or the other age category based onplumage characteristics (Glutz et al. 1973).
The degree of development of secondary sex traitssuch as male body mass or ornamental feathers canbe used as an indirect measure of social statusamong males (Andersson 1994). Body mass and thedegree of development of ‘‘moustache’’ feathers (seeGewalt 1959, Hidalgo and Carranza 1990) have beenshown to play a role in determining social rank inmale Great Bustards (Delgado et al. 1991, Carranzaand Hidalgo 1993). We used these two traits to in-vestigate the relationship between social dominanceand migratory behavior among male bustards. Be-cause adult body mass was not known for all birdsin our global sample, we used only those marked asadults (n � 11). We divided this subsample intomales that weighed less than 10 kg (median value)and males that weighed 10 kg or more to test the as-sociation between body mass and migratory status.With respect to moustache feathers, during threeconsecutive springs we classified birds visually inthe field into three discrete categories of develop-ment: (1) poorly developed, (2) developed, and (3)highly developed (see Gewalt 1959, Morales 1999). Itwas possible to make such classification for 15 malesin our global sample. We obtained a mean value foreach of these males based on the value assigned tothem each spring over the duration of the study. Wethen assigned each of these males into one of twogroups based on the mean development of mous-tache feathers: (1) �2.5, and (2) �2.5 (2.5 was the me-dian value for this sample of males).
To investigate the extent to which migration mir-rors juvenile dispersal, we used a subsample of sevenmales for which enough data existed to determinethe percentage of birds that revisited as migrantadults any of the areas where they had been locatedduring their period of juvenile dispersal. We com-pared this value with the percentage of birds that didnot visit such areas using a test of the difference be-tween two percentages (Statsoft 1995). To test forsexual differences in migration distance, we com-pared data from marked females that were migratory(n � 10; Morales 1999) with data from our sample ofnonsedentary males (n � 6).
Results.—Monthly variation in the number of maleGreat Bustards seen in the study area was significant(F � 7.10, P � 0.05), whereas the interannual effect
April 2000] 495Short Communications
FIG. 1. Mean distance to lek (� SD) for maleGreat Bustards for which we had contacts in allmonths of the year. (A) Global pattern, all males (F� 2.86, df � 11 and 143, P � 0.002); (B) sedentarymales (F � 1.22, df � 11 and 70, n � 6, P � 0.29); and(C) migratory males (F � 3.87, df � 11 and 60, n �7, P � 0.001).
TABLE 1. Months of return to and departure from leks for six migratory male Great Bustards that wereequipped with radio transmitters.
MaleMonth of
return YearsMonth ofdeparture Years
A January 1995, 1996 July 1994, 1995, 1996B February 1994, 1995, 1996 July 1994, 1995C March 1994, 1995, 1996, 1997 June 1994, 1995, 1996D March 1996, 1997 July 1996, 1997E October 1994, 1995, 1996, 1997 May 1994, 1995, 1996, 1997F October 1994, 1995 June 1994, 1995
was negligible (F � 1.64, P � 0.05). The highest av-erage number of males occurred in March, and dif-ferences between March and all other months weresignificant (P � 0.05). Numbers decreased to a min-imum during summer, representing 39% of theMarch population on average. The difference be-
tween the summer months combined versus all theother months was significant (P � 0.05).
A seasonal pattern of postbreeding dispersal fromthe lek was clearly distinguishable when we consid-ered all 13 males that we radio tracked continuously(Fig. 1A). Moreover, by studying each individualseparately, two distinct patterns emerged: (1) a sed-entary pattern, corresponding to males that stayedclose to their leks year-round and performed no sig-nificant monthly movements (�3 km from their mat-ing center; Fig. 1B); and (2) a migratory pattern.Males in the migratory group made significant sea-sonal movements between their breeding areas,which they attended from late January to earlyMarch through May (four males), or from October toMay through June (two males), and their postbreed-ing areas, which they used during the rest of the year(Fig. 1C). Migrating individuals tended to abandonand return to the lekking areas at around the samedates each year (Table 1).
We observed no significant change of winteringarea during the postbreeding period, but one malevisited two leks that were more than 10 km apart andregularly repeated this pattern each year. The dis-tances between lek and postbreeding areas variedfrom nearly 7 km to more than 20 km. Some birdswith wing tags but no radio transmitter may havetraveled longer distances.
Of the total sample of 26 birds (including maleswith wing tags but no transmitter), 8 (31%) behavedas sedentary individuals, and the remaining 18(69%) performed migratory movements, spendingeither the summer or the summer and winter awayfrom their breeding ranges (generally outside the Re-serve). We found no significant difference in the pro-portion of each migratory pattern between malesyounger than 5 years versus older than 5 years (Fish-er’s exact test, P � 1.00, n � 26), males weighing �10kg versus �10 kg (P � 1.00, n � 11), or males withpoorly developed moustache feathers versus highlydeveloped moustache feathers (P � 1.00, n � 15).
We observed all 26 males in our global sample onthe same lek every year during the main copulationperiod. Even the ‘‘lek-shifting’’ male, referred toabove, visited the same leks each year. All males that
496 [Auk, Vol. 117Short Communications
made significant seasonal movements and could beradio tracked regularly or sighted during surveysvisited the same areas during their postbreeding dis-persal (n � 6). Moreover, no male changed its statusfrom sedentary to migratory or vice versa during thestudy.
For seven males, we had enough data to comparethe areas they visited as dispersing juveniles withthose they regularly moved to as migrant adults.Both areas coincided in six cases (86%), and in onlyone case (14%) they did not (P � 0.01). Postbreedingdispersal distance from the lek was higher in males(median � 12,483 m, range 5,946 to 20,062 m, n � 6)than in females (median � 3,981 m, range 2,405 to10,892 m, n � 10; Mann-Whitney U-test, Z � 3.04, P� 0.002).
Discussion.—We identified two well-differentiatedpatterns of seasonal movement with respect to leksin our sample of marked Great Bustard males: (1)sedentary males, which stayed within 2 to 3 km oftheir lek all year and did not exhibit a defined patternof movement, and (2) migratory males, which movedyearly from leks to postbreeding areas 7 to 20 kmaway. This range of distances may underestimate thetrue distance moved by males, because birds withoutradio transmitters might have moved longer dis-tances. The distinction between these two patternswas not arbitrarily based on a linear distance bound-ary but rather on the presence or absence of each birdduring the postbreeding season in the area occupiedby the exploded lek to which it belonged in spring.The two movement patterns agree with the seasonalvariation in numbers of males censused in the Re-serve of Villafafila, which peaked in March, reflect-ing the arrival of individuals from outside the studyarea to concentrate at leks within the Reserve.
Although no other study based on marked indi-viduals has been published, the few data availablefor other western populations of Great Bustards sug-gest that the pattern of seasonal movements de-scribed here is typical for the species, with averagedispersal distances perhaps being dependent on lo-cal habitat characteristics (Alonso and Alonso 1990,Hidalgo and Carranza 1990). For example, in a studythat is being conducted in central Spain, some radio-tagged males have traveled much greater distancesfrom their leks to postbreeding areas (M. Morales etal. unpubl. data). Most reports of Great Bustardmovements in other parts of Europe refer to obser-vations of irruptive migrations into milder areas dur-ing harsh winters (Cramp and Simmons 1980).Whereas some populations from central and easternAsia undertake long-distance movements fromnorth to south, it is unclear whether these are totalor partial migrations (Dementiev et al. 1969, Crampand Simmons 1980).
All males showed year-to-year fidelity to leks andpostbreeding areas, and none changed its status be-tween years from migratory to sedentary or vice ver-
sa. Moreover, each male apparently showed constan-cy in departure and return dates, suggesting thatseasonal movements are quite independent of the en-vironmental conditions of particular years. The co-existence of sedentary and migratory individuals inthe same population corresponds to a partial migra-tion pattern as defined by Terrill and Able (1988).Partial migration has been reported in other lekkingor polygynous birds, many of which were previouslyconsidered sedentary, such as several species ofgrouse (Schroeder 1985, Rolstad 1989, Cade andHoffmann 1993, Schroeder and Braun 1993).
Partial migration may be regarded as a strategywith two condition-dependent states (migratory orsedentary) that are determined, for instance, by age,body condition, social status, or sex (Lundberg1988). Two lines of evidence seem to reject age as afactor of the migratory status in our study: (1) we didnot record any status change from migratory to sed-entary or vice versa, and (2) the proportion of malesthat was migratory or sedentary did not change be-tween age classes.
In polygynous, size-dimorphic species, male re-productive success is tied to social status, which of-ten is determined through agonistic behavior inwhich body mass and other secondary sexual traitsplay an important role (Clutton-Brock et al. 1988,Andersson 1994). In partially migrant species, dom-inant individuals are expected to stay close to theirbreeding territories, whereas subordinate individu-als should leave as a consequence of intraspecificcompetition (Gauthreaux 1982, Smith and Nilsson1987). However, the lack of a significant associationbetween migratory status and either male body massor the development of moustache feathers does notseem to support this hypothesis.
Great Bustards exhibit partial migration amongmales (some males migrate, and some do not), anddifferential migration between sexes (females mi-grate shorter distances), which has also been de-scribed in other species such as Spruce Grouse (Fal-cipennis canadensis; Schroeder 1985) and Blue Grouse(Dendragapus obscurus; Cade and Hoffmann 1993).These sexual differences could give support to thearrival-time hypothesis for the evolution of differ-ential migration between the sexes (Gauthreaux1982, Ketterson and Nolan 1983, Smith and Nilsson1987), because females seem to experience higher in-trasexual competition for breeding territories andthus higher pressure for early arrival than do males(Morales et al. 1996, Morales 1999).
Acknowledgments.—We thank the Spanish AirForce, particularly the 42 Group of the Getafe base,for generous collaboration in locating radio-taggedbirds; all farmers and other people from the studyarea for cooperation; and C. Morillo and J. M. de Be-nito for encouragement. V. Ena and his colleaguesmarked some of the young. L. M. Bautista, H. Bus-tami, C. Caldero, A. Correas, I. Martın, and M. A.
April 2000] 497Short Communications
Naveso helped capture birds. C. A. Martın and P. E.Osborne took part in surveys and helped with radiotracking during the last two years of the study. Fieldwork was financed by the Direccion General de In-vestigacion Cientıfica y Tecnica, the Instituto para laConservacion de la Naturaleza, and the Junta de Cas-tilla y Leon. MBM and EM benefited from predoc-toral fellowships from the Consejerıa de Educacionde la Comunidad de Madrid (Museo Nacional deCiencias Naturales) and the Direccion General de In-vestigacion Cientıfica y Tecnica, respectively. Wegreatly appreciate the critical remarks on a previousversion of this paper provided by D. A. Aborn, D. N.Ewert, and an anonymous referee. Finally, we thankS. J. Lane, who also took part in some surveys, forreviewing the English in the last version of the man-uscript. This study is a contribution to DGICYT-pro-ject PB94–0068.
LITERATURE CITED
ALONSO, J. C., AND J. A. ALONSO (Eds.). 1990. Para-metros demograficos, seleccion de habitat y dis-tribucion de la avutarda en tres regiones espan-olas. ICONA, Madrid.
ALONSO, J. C., AND J. A. ALONSO. 1996. The GreatBustard (Otis tarda) in Spain: Present status, re-cent trends and an evaluation of earlier census-es. Biological Conservation 77:79–86.
ALONSO, J. C., J. A. ALONSO, E. MARTIN, AND M. B.MORALES. 1995. Range and patterns of GreatBustard movements at Villafafila, NW Spain.Ardeola 42:69–76.
ALONSO, J. C., J. A. ALONSO, E. MARTIN, AND M. B.MORALES. 1998. Proximate and ultimate causesof natal dispersal in the Great Bustard Otis tarda.Behavioral Ecology 9:243–252.
ANDERSSON, M. 1994. Sexual selection. PrincetonUniversity Press, Princeton, New Jersey.
CADE, B. S., AND R. W. HOFFMAN. 1993. Differentialmigration of Blue Grouse in Colorado. Auk 110:70–77.
CARRANZA, J., AND S. J. HIDALGO. 1993. Condition-dependence and sex traits in the male Great Bus-tard. Ethology 94:187–200.
CARRANZA, J., S. J. HIDALGO, AND V. ENA. 1989. Mat-ing system in the Great Bustard: A comparativestudy. Bird Study 36:192–198.
CLUTTON-BROCK, T. H., S. D. ALBON, AND F. E. GUIN-NESS. 1988. Reproductive success in male and fe-male red deer. Pages 325–343 in Reproductivesuccess: Studies of individual variation in con-trasting breeding systems (T. H. Clutton-Brock,Ed.). University of Chicago Press, Chicago.
CRAMP, S., AND K. E. L. SIMMONS (Eds). 1980. Thebirds of the western Paleactic, vol. 2. OxfordUniversity Press, Oxford.
DELGADO, J. J., J. CARRANZA, AND S. J. HIDALGO.1991. Relaciones de dominancia en avutardas
(Otis tarda L.) en cautividad. Actas del 1˚ Con-greso Nacional de Etologıa. Caceres, Spain.
DEMENTIEV, G., R. MEKLENBURTSEV, A. SUDILOV-SKAYA, AND E. SPANBERGER. 1969. Birds of theSoviet Union, vol. II. Israel Program for ScientificTranslation, Jerusalem.
GAUTHREAUX, S. A., JR. 1982. The ecology and evo-lution of avian migration systems. Pages 93–168in Avian biology, vol. 6 (D. S. Farner, J. R. King,and K. C. Parkes, Eds.). Academic Press, NewYork.
GEWALT, W. 1959. Die Grobtrappe. Die Neue Brehm-Bucherei. Lutherstadt Wittenberg, Germany.
GLUTZ, U. N., K. M. BAUER, AND E. BEZZEL. 1973.Handbuch der Vogel Mitteleuropas, vol. 5. Aka-demische Verlagsgesellschaft, Frankfurt, Ger-many.
HIDALGO, S. J., AND J. CARRANZA. 1990. Ecologıa ycomportamiento de la avutarda (Otis tarda).Universidad de Extremadura, Caceres, Spain.
HOGLUND, J., AND R. V. ALATALO. 1995. Leks. Prince-ton University Press, Princeton, New Jersey.
KETTERSON, E. D., AND V. NOLAN, JR. 1983. The evo-lution of differential bird migration. Current Or-nithology 1:357–402.
LUNDBERG, P. 1988. The evolution of partial bird mi-gration. Trends in Ecology and Evolution 3:172–175.
MORALES, M. B. 1999. Ecologıa reproductiva y mov-imientos estacionales en la avutarda (Otis tarda).Ph.D. dissertation, Universidad Complutense,Madrid.
MORALES, M. B., J. C. ALONSO, E. MARTIN, AND J. A.ALONSO. 1996. Mating system in the Great Bus-tard: A review of published work in light of re-cent radiotracking results. Pages 131–136 inConservacion de las aves esteparias y su habitat(J. Fernandez Gutierrez and J. Sanz-Zuasti Eds.).Junta de Castilla y Leon, Valladolid, Spain.
ROLSTAD, J. 1989. Habitat and range use of Caper-caillie Tetrao urogallus L. in southcentral Scan-dinavian forests. Ph.D. dissertation, Agricultur-al University of Norway, As.
SCHROEDER, M. A. 1985. Behavioral differences of fe-male Spruce Grouse undertaking short and longmigrations. Condor 87:281–286.
SCHROEDER, M. A., AND C. E. BRAUN. 1993. Partialmigration in a population of Greater Prairie-Chikens in northeastern Colorado. Auk 110:21–28.
SMITH, H. G., AND J.-A. NILSSON. 1987. Intraspecificvariation in migratory pattern of a partial mi-grant, the Blue Tit (Parus caeruleus): An evalua-tion of different hypotheses. Auk 104:109–115.
STATSOFT, INC. 1995. STATISTICA for Windows ver-sion 5.0 user manual. Tulsa, Oklahoma.
498 [Auk, Vol. 117Short Communications
TERRILL, S. B., AND K. P. ABLE. 1988. Bird migrationterminology. Auk 105:205–206.
Received 9 October 1998, accepted 20 July 1999.Associate Editor: F. R. Moore
The Auk 117(2):498–500, 2000
What Happens to Old Nests in Natural Cavities?
TOMASZ WESOŁOWSKI1
Department of Avian Ecology, Wrocław University, Sienkiewicza 21, 50 335 Wrocław, Poland
It is well known that old nest material accumulatesin nest boxes and should be removed to keep the box-es usable. Perrins (1979) and Møller (1989) proposedthat the removal of old material, via reduction of ec-toparasites, could improve conditions in the boxes.This in turn could have profound effects on nest-sitechoice, mating success, and reproductive efficiencyof the individuals that use the boxes.
Natural cavities are not cleaned by humans. Thus,by implication, conditions in them should deteriorateowing to the accumulation of old nest material. In-deed, Perrins (1979) stated that ‘‘. . . the nest materialwould slowly decompose within the chamber andpresumably over a series of years the site might be-come filled with old nests.’’ I have tried to find sup-port for this statement in the literature, but so far Ihave failed to find any information on this issue.Therefore, it seems that the information presentedbelow, which indicates that old nest material disap-pears rapidly from natural cavities, constitutes thefirst data on this subject.
Study Area and Methods.—Data were gathered from1992 to 1998 in the Białowieza National Park in east-ern Poland, within which the last surviving frag-ments of European primeval lowland temperate for-est are preserved. The tree stands of the park havenever been cut, and the entire area has been strictlyprotected as a reserve since 1921. Hence, one can stillobserve cavities and cavity nesters in conditions freeof direct anthropogenic disturbance. The forest con-sists of several types of old-growth stands (see Tom-iałojc and Wesołowski 1990, Tomiałojc 1991,Wesołowski and Tomiałojc 1995), but most of thedata were gathered in two types of chiefly deciduousstands. One was a stand of riparian trees composedmostly of alder (Alnus glutinosa), ash (Fraxinus excel-sior), and Norway spruce (Picea excelsa); the otherwas a stand of upland deciduous forest composed ofmore than 12 species of trees, mainly hornbeam (Car-pinus betulus), small-leafed linden (Tilia cordata), con-
1 E-mail: [email protected]
tinental maple (Acer platanoides), pedunculate oak(Quercus robur), and spruce.
Since 1992, all cavities used by breeding birdswithin four large study plots (33 to 55 ha each; seeWesołowski 1998) and accessible from a ladder (upto 5 m above ground, in living trees) were markedand checked the following year (in the second half ofApril) to see whether old nest material was still pre-sent. For checking cavity contents, I used a smalllight bulb on a flexible wire and a small mirror.
The April inspections showed that cavities fromprevious years could be impossible for birds to usefor several reasons (e.g. flooding, or being filled withrotten wood up to the cavity entrance). I have omit-ted these instances from the present analysis becausethey are irrelevant to the question at hand. If the cav-ity contained remnants of old material (e.g. moss andhair), it was classified as an ‘‘old nest.’’ If the cavitycontained new material (e.g. fresh pieces of moss), itwas classified as a ‘‘new nest’’ (the timing of the cav-ity inspections coincided with the nest-buildingphase of earliest breeding species in the study area;Wesołowski and Stawarczyk 1991, Wesołowski1998). When a cavity contained no nest material andthe bottom was covered with decayed material androtten wood, or occasionally with a single fragmentof leaf or piece of moss, it was classified as contain-ing ‘‘no nest.’’
Because the type of nest material could have influ-enced the rate of nest disappearance, I divided nestsinto two categories: (1) ‘‘tit‘‘nests, which were con-structed mostly of moss, wool, hair, or feathers andwere made by Parus major, P. caeruleus, P. palustris, P.ater, and Certhia familiaris; and (2) ‘‘flycatcher’’ nests,which were composed mostly of dry leaves and otherplant material and were made by Ficedula albicollis, F.hypoleuca, and Erithacus rubecula.
Results and Discussion.—No trace of the previousyear’s nest was visible in two-thirds of the cavities(Table 1), nor did cavities with new nests (ca. 20%)contain remains from the previous year’s nest. As arule, new nests were in the initial stages of construc-tion, so any remains of old material would have beenapparent. I found remnants of old nest material in
April 2000] 499Short Communications
TABLE 1. Contents of natural cavities in the secondhalf of April in relation to the type of nest in theprevious breeding season. Data are the number ofcavities.
Previousnest
Cavity contents
Old nest(%)a
New nest(%)b
No nest(%) Total
Titc 5 (6.0) 19 (22.9) 59 (71.1) 83Flycatcherd 24 (20.5) 20 (17.1) 73 (62.4) 117
Total 29 (14.5) 39 (19.5) 132 (66.0) 200a Remnants of old material still visible (e.g. moss and hair).b New material present (e.g. fresh pieces of moss).c Moss, wool, and hair or feathers; made by Parus major, P. caeruleus,
P. palustris, P. ater, and Certhia familiaris.d Mostly dry leaves and other plant material; made by Ficedula al-
bicollis, F. hypoleuca, and Erithacus rubecula.
only 6% of the cavities that originally had contained‘‘tit’’ nests and in 20% of those that had contained‘‘flycatcher’’ nests (Table 1). ‘‘Tit’’ nests vanished sig-nificantly more frequently from one year to the nextthan did ‘‘flycatcher’’ nests (�2 � 8.4, df � 2, P �0.02); consequently, dry leaves appeared to be moreresistant to loss than did moss or substances of ani-mal origin (see Table 1).
Causes of the disappearance of nest material areunknown. Nest material could have been removed bya non-human animal, or it could have decomposedin situ. In cavities that contained new nests, the re-mains could have been removed by the birds them-selves; e.g. I commonly observed tits remove debrisfrom nest cavities (Wesołowski 1998, 1999). Nest box-es in the managed part of the Białowieza Forest oftencontained nearly intact nests from the previous sea-son. It is difficult to envisage why old material wouldbe selectively removed from natural cavities but notfrom nest boxes. Therefore, I propose the alternativeexplanation that conditions in the cavities them-selves, i.e. a favorable microclimate and a rich assem-blage of decomposing organisms, result in high de-cay rates of old nest material.
Apart from cavities that were used for breeding intwo consecutive years, numerous suitable but un-used cavities were available in the study area(Wesołowski 1989, Walankiewicz 1991). Consequent-ly, birds that were prospecting for new nest siteswould have found traces of old material in cavitiesless frequently than the present data indicate, per-haps in less than 1 of 10 cavities.
Rates of disappearance of old material were simi-lar in all study plots (�2 � 0.74, df � 3, P � 0.86) anddid not vary substantially among years (�2 � 3.37, df� 4, P � 0.49). Given that the species concerned ac-counted for more than 80% by number of all second-ary cavity nesters in the Białowieza Forest (Tomiałojcand Wesołowski 1990, 1996; Wesołowski and Tom-iałojc 1997), my results are likely to be representativefor the situation in this primaeval forest. However, it
is not known whether the rapid disappearance of oldmaterial is typical of most natural cavities, or wheth-er it is only a local phenomenon. Nevertheless, mydata indicate that contrary to the suggestions of Per-rins (1979) and Møller (1989), it is the accumulationof old nest material, rather than the removal of suchmaterial, that distinguishes nest boxes from naturalcavities.
The removal of old nests from boxes can reduce theload of ectoparasites whose survival depends on nestmaterial (Rendell and Verbeek 1996). Whether par-asite numbers would decline if nest material disap-peared from decay is unknown. Clearly, additionalinformation is needed on the relationship betweenparasite loads and the presence of old nest materialin natural cavities.
Acknowledgments.—I thank M. Czuchra, T. Klis, K.Konieczny, C. Mitrus, J. Nowakowski, B. Orłowska,P. Rowinski, L. Tomiałojc, and W. Walankiewicz forhelp with field work. Funding was provided by theALA, Schweizerische Vogelwarte, the Ministry of En-vironmental Protection and Natural Resources, andthe National Fund for Environment Protection andWater Management. I also appreciate the commentsof R. N. Conner and an anonymous reviewer.
LITERATURE CITED
MØLLER, A. P. 1989. Parasites, predators and nestboxes: Facts and artefacts in nest box studies ofbirds. Oikos 56:421–423.
PERRINS, C. 1979. British tits. Collins, London.RENDELL, W. B., AND N. A. M. VERBEEK. 1996. Are
avian ectoparasites more numerous in nest box-es with old nest material? Canadian Journal ofZoology 74:1819–1825.
TOMIAŁOJC, L. 1991. Characteristics of oldgrowth inthe Bialowieza Forest, Poland. Natural AreasJournal 11:7–18.
TOMIAŁOJC, L., and T. WesoŁowski. 1990. Bird com-munities of the primaeval temperate forest ofBiałowieza, Poland. Pages 141–165 in Biogeog-raphy and ecology of forest bird communities.(A. Keast, Ed.). SPB Academic Publishers, TheHague, Netherlands.
TOMIAŁOJC, L., AND T. WESOŁOWSKI. 1996. Structureof a primaeval forest bird community during1970s and 1990s (Białowieza National Park, Po-land). Acta Ornithologica 31:133–154.
WALANKIEWICZ, W. 1991. Do secondary-cavity nest-ing birds suffer more from competition for cav-ities or from predation in a primaeval deciduousforest? Natural Areas Journal 11:203–212.
WESOŁOWSKI, T. 1989. Nest-sites of hole-nesters in aprimaeval temperate forest (Białowieza NationalPark, Poland). Acta Ornithologica 25:321–351.
WESOŁOWSKI, T. 1998. Timing and synchronisation ofbreeding in a Marsh Tit Parus palustris popula-tion from a primaeval forest. Ardea 86:89–100.
500 [Auk, Vol. 117Short Communications
WESOŁOWSKI, T. 1999. Marsh Tits (Parus palustris) arenot excavators. Ibis 141:149.
WESOŁOWSKI, T., AND T. STAWARCZYK. 1991. Survivaland population dynamics of Nuthatches Sitta eu-ropaea breeding in natural cavities in a primaevaltemperate forest. Ornis Scandinavica 22:143–154.
WESOŁOWSKI, T., AND L. TOMIAŁOJc. 1995. Ornithol-ogische Untersuchungen im Urwald von
Białowieza - eine Ubersicht. OrnithologischeBeobachter 92:111–146.
WESOŁOWSKI, T., AND L. TOMIAŁOJC. 1997. Breedingbird dynamics in a primaeval temperate forest:Long-term trends in Białowieza National Park(Poland). Ecography 20:432–453.
Received 22 October 1998, accepted 20 July 1999.Associate Editor: J. R. Walters
The Auk 117(2):500–504, 2000
Natal Dispersal of Peregrine Falcons in Greenland
MARCO RESTANI1,3 AND WILLIAM G. MATTOX2
1Division of Ecosystem Sciences, College of Forest Resources, University of Washington,Seattle, Washington 98195, USA; and
2Conservation Research Foundation, 8300 Gantz Avenue, Boise, Idaho 83709, USA
Natal dispersal is female biased in most bird spe-cies in that proportionally more females than malesdisperse, or females disperse farther than males(Greenwood 1980). This pattern appears to be relat-ed to the amount of effort each sex spends in com-peting for territories or mates versus the amount ofeffort spent in raising young and choosing mates(Greenwood 1980). Presumably, males gain foragingand antipredator benefits that improve reproductionand survival when establishing territories in familiarareas. If males are philopatric, then females shoulddisperse to avoid inbreeding (Pusey 1987) and toevaluate potential mates (Greenwood 1980). The ef-fects of mating system and inbreeding avoidance ondispersal behavior are not mutually exclusive, and acombination of factors likely produces sex-biaseddispersal.
Although some long-distance dispersers experi-ence lower survival and reproductive success thantheir philopatric counterparts (Newton and Mar-quiss 1983, Nilsson 1989, Part 1990), others suffer noapparent costs (Arcese 1989, Plissner and Gowaty1996, Miller and Smallwood 1997). Most investiga-tions of natal dispersal have focused on species thatbreed at one year of age, have short lifespans, andnest in unpredictable environments. Few studieshave examined dispersal in long-lived, long-distancemigrants that nest in predictable environments. In-dividuals of these species typically spend severalseasons exploiting different habitats over large spa-tial scales before settling to breed. Therefore, wemight expect the benefits of short-distance dispersal
3 E-mail: [email protected]
to males, such as higher productivity and lower mor-tality, to be less pronounced or absent, particularlyif nesting habitat is not limiting.
We analyzed 20 years of Peregrine Falcon (Falcoperegrinus) breeding data from Greenland to identifythe proximate causes and consequences of natal dis-persal associated with this long-lived, long-distancemigrant. We determined if (1) sex ratio, survival, andpopulation density affected natal dispersal; and (2)whether natal dispersal distance affected survivaland subsequent productivity.
Study Area and Methods.—The study area encom-passed approximately 6,000 km2 in the widest partof ice-free land of western Greenland (66�45�N,51�30�W). Most of the study area was rolling tundra(elevation up to 1,100 m) interspersed with nearly1,000 lakes. Vegetation was dominated by willow(Salix glauca), dwarf birch (Betula nana), heaths (Em-petrum, Ledum, Cassiope, spp.), and grasses (Calama-grostis, Festuca, Poa; see Burnham and Mattox [1984]for a more complete description of the study area).
From June to mid-August, 1978 to 1997, a variablenumber (two to five) of two-person teams back-packed across the tundra and visited cliffs that pro-vided potential nesting habitat for Peregrine Falcons(Burnham and Mattox 1984). Teams observed cliffsfor signs of breeding activity. If breeding activitywas not evident after a minimum of 4 h of observa-tion, the cliff was considered inactive. Observers re-corded the presence of adult peregrines and attempt-ed to classify individuals by sex at cliffs occupied bylone adults.
Banding teams either rappelled or climbed to ey-ries that contained young. Nestlings were individu-ally marked with a Danish Zoological Museum num-
April 2000] 501Short Communications
bered band on the left tarsus and an alpha-numericcolor band on the right tarsus (except during 1982 to1985). Nestling sex was determined based on size,and age was estimated during 1983 to 1997 followingMoritsch (1983). Banding teams used spotting scopesand binoculars to note or read the alpha-numericcodes on the bands of attending adults. From 1983 to1997, trapping teams captured adults at nest sitesand banded each unmarked bird with a numberedband on the right tarsus and an alpha-numeric colorband on the left tarsus (i.e. opposite the scheme usedfor nestlings).
Prior to using parametric statistics, we log-trans-formed data to satisfy assumptions of normality andhomogeneity of variances. To determine the relation-ship between dispersal distance and productivityand lifespan (i.e. survivorship), we first calculatedmean values of each parameter for each disperser. Wecalculated a productivity estimate for each disperserby dividing the total number of young produced (i.e.sum of brood sizes at banding) by the number ofyears of breeding. Most nestlings were banded when20 to 25 days old, which is approximately 50 to 60%of the average age at which young leave the nest (40days). Thus, productivity estimates were liberal be-cause a few nestlings probably died before fledging,so we used these values only as an index to evaluatethe relationship between productivity and dispersaldistance. We used the number of years each disperseroccupied a cliff as an estimate of breeding lifespan.These values were slightly conservative because wedetected dispersers a mean 1.3 � SE of 0.3 years old-er than the mean age of first breeding (Ambrose andRiddle 1988), and a small proportion (3.9%) of thepopulation exhibited breeding dispersal (Mattox andSeegar 1988). Therefore, we used these values only asan index to evaluate the relationship between dis-persal distance and survivorship. We used simplelinear regression to determine the relationship be-tween dispersal distance and productivity and sur-vival, but we also examined plots of the data for cur-vilinear relationships (see Nilsson 1989, Part 1990).Fledging dates of broods were estimated from meannestling ages at banding, assuming young fledgedwhen 40 days old. We report untransformed valuesin the Results.
Results.—During the 1978 to 1997 breeding sea-sons, we banded 1,702 nestlings from 583 broods.The number of nestlings banded each year rangedfrom 17 to 190 (6 to 69 broods per year). At least onenestling in 56 broods could not be identified to sexduring banding, so we calculated nestling sex ratiofrom the sample of 527 broods (1,566 nestlings) inwhich sex was determined for all nestlings. The over-all sex ratio (774 males, 792 females) did not differfrom parity (�2 � 0.10, df � 1, P � 0.75).
We documented 42 (2.6%) banded nestlings thatwere recruited into the study population. Nestlingsbanded in 1996 and 1997 were not included in this
calculation because they had not reached sexual ma-turity by 1997. Broods that produced recruits tendedto fledge earlier (median � 16 August) than otherbroods (median � 18 August; one-tailed t-test, t �1.52, df � 386, P � 0.065). The direction of dispersalaveraged 83�, although the distribution of directionsdid not differ from random (Rayleigh test, z � 2.24,n � 27, P � 0.097).
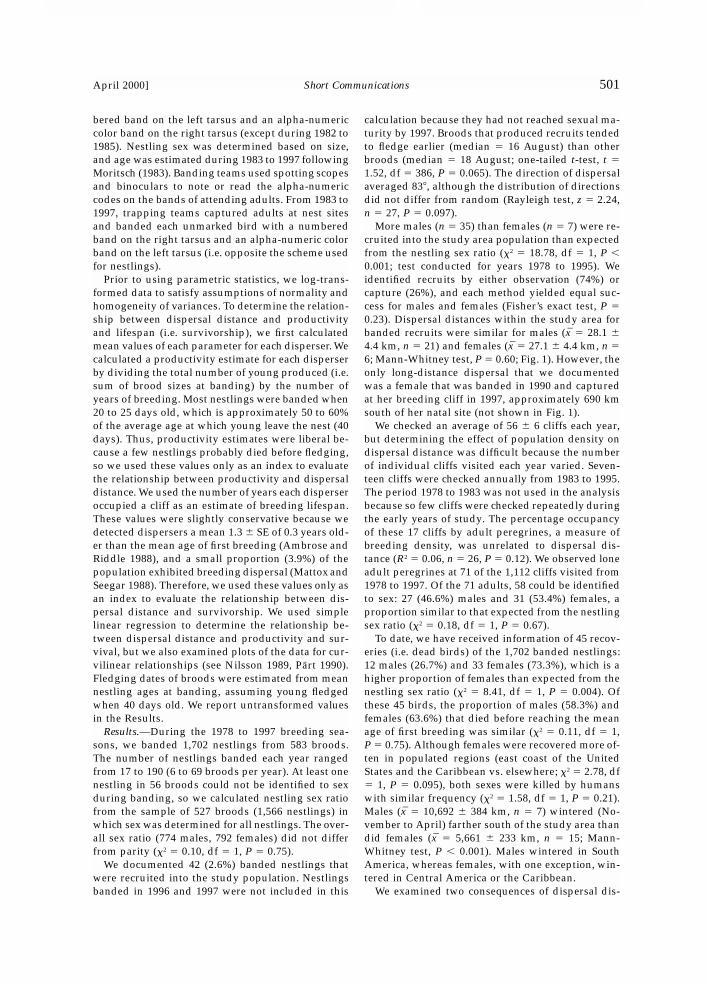
More males (n � 35) than females (n � 7) were re-cruited into the study area population than expectedfrom the nestling sex ratio (�2 � 18.78, df � 1, P �0.001; test conducted for years 1978 to 1995). Weidentified recruits by either observation (74%) orcapture (26%), and each method yielded equal suc-cess for males and females (Fisher’s exact test, P �0.23). Dispersal distances within the study area forbanded recruits were similar for males (x � 28.1 �4.4 km, n � 21) and females (x � 27.1 � 4.4 km, n �6; Mann-Whitney test, P � 0.60; Fig. 1). However, theonly long-distance dispersal that we documentedwas a female that was banded in 1990 and capturedat her breeding cliff in 1997, approximately 690 kmsouth of her natal site (not shown in Fig. 1).
We checked an average of 56 � 6 cliffs each year,but determining the effect of population density ondispersal distance was difficult because the numberof individual cliffs visited each year varied. Seven-teen cliffs were checked annually from 1983 to 1995.The period 1978 to 1983 was not used in the analysisbecause so few cliffs were checked repeatedly duringthe early years of study. The percentage occupancyof these 17 cliffs by adult peregrines, a measure ofbreeding density, was unrelated to dispersal dis-tance (R2 � 0.06, n � 26, P � 0.12). We observed loneadult peregrines at 71 of the 1,112 cliffs visited from1978 to 1997. Of the 71 adults, 58 could be identifiedto sex: 27 (46.6%) males and 31 (53.4%) females, aproportion similar to that expected from the nestlingsex ratio (�2 � 0.18, df � 1, P � 0.67).
To date, we have received information of 45 recov-eries (i.e. dead birds) of the 1,702 banded nestlings:12 males (26.7%) and 33 females (73.3%), which is ahigher proportion of females than expected from thenestling sex ratio (�2 � 8.41, df � 1, P � 0.004). Ofthese 45 birds, the proportion of males (58.3%) andfemales (63.6%) that died before reaching the meanage of first breeding was similar (�2 � 0.11, df � 1,P � 0.75). Although females were recovered more of-ten in populated regions (east coast of the UnitedStates and the Caribbean vs. elsewhere; �2 � 2.78, df� 1, P � 0.095), both sexes were killed by humanswith similar frequency (�2 � 1.58, df � 1, P � 0.21).Males (x � 10,692 � 384 km, n � 7) wintered (No-vember to April) farther south of the study area thandid females (x � 5,661 � 233 km, n � 15; Mann-Whitney test, P � 0.001). Males wintered in SouthAmerica, whereas females, with one exception, win-tered in Central America or the Caribbean.
We examined two consequences of dispersal dis-
502 [Auk, Vol. 117Short Communications
FIG. 1. Natal dispersal distance of Peregrine Falcons produced and recruited in the study area in westernGreenland.
tance. Breeding lifespan, the mean minimum num-ber of years occupying a cliff, was similar for male(2.2 � 0.3 years, n � 31) and female (2.0 � 0.3 years,n � 6) dispersers (Mann-Whitney test, P � 0.97).Lifespan was unrelated to dispersal distance (males,R2 � 0.01, n � 16, P � 0.94; females, R2 � 0.27, n �5, P � 0.21). Productivity, the mean number of youngraised to fledging each year, was similar for male (2.4� 0.2 young, n � 35) and female (2.7 � 0.3 n � 7)dispersers (Mann-Whitney test, P � 0.76). Produc-tivity was unrelated to dispersal distance (males, R2
� 0.01, n � 21, P � 0.98; females, R2 � 0.05, n � 6, P� 0.33). The sample size of female recruits was small,so these data should be interpreted with caution. Wedid not observe close inbreeding (i.e. parent-off-spring or sibling-sibling mating).
Discussion.—Natal dispersal of Peregrine Falconsin Greenland was female biased. We have discountedtwo proximate factors that could have produced sex-biased dispersal. First, the sex ratio of nestlings wasequal, so an overproduction of males did not in-crease the probability that they, rather than females,recruited into the local population. Second, sex-spe-cific breeding opportunity did not influence dispers-al because the sex ratio of lone adults occupyingcliffs was equal, and adult males and females hadsimilar breeding lifespans. Therefore, turnover ratesand the availability of territories were similar be-tween the sexes (see Court et al. 1989).
Recoveries of banded nestlings (12 males, 33 fe-males) suggested that females have lower survivor-ship than males, a factor that could have caused fe-male-biased dispersal by reducing the number of fe-
males available for recruitment. Evaluating the im-plications of these data was difficult because maleand female peregrines produced in Greenland win-tered in different areas (W. Mattox unpubl. data).Males wintered in South America, whereas femaleswintered in Central America and the Caribbean. Fe-males simply may have died in areas frequented byhumans, which would have increased the probabilityof their discovery and given a false impression of lowsurvival. For example, significantly more femalesthan males (50% vs. 16%) were recovered in the pop-ulated regions of the United States (i.e. East Coast)and the Caribbean compared with remote regions ofGreenland and South America, yet both sexes wereequally likely to be killed by humans. Moreover, ifdifferential survival contributed to females-biaseddispersal, then we should have seen more lone malesthan females at breeding cliffs, but we did not. Whenthese findings were combined with the observationthat survivorship of juvenile male and female pere-grines, based on sightings rather than recoveries,was similar in the midwestern United States (Tordoffand Redig 1997), we believe that differential survi-vorship probably did not occur or contribute to sex-biased dispersal.
Density of the breeding population did not affectdispersal distance of peregrines (see also Newtonand Marquiss 1983, Part 1990). However, populationdensity has influenced dispersal distances in otherspecies (Nilsson 1989, Negro et al. 1997), and this ef-fect was related to availability of breeding habitat.The nesting population of Peregrine Falcons inGreenland has increased each year during the past
April 2000] 503Short Communications
26 years (Burnham and Mattox 1984, Mattox andSeegar 1988). Apparently, breeding habitat withinthe core study area remained available, which prob-ably prevented the expression of density-dependenteffects on settling patterns.
Peregrine Falcons have a resource-based breedingsystem whereby males obtain and defend territoriesto attract females. This mating system should pro-duce female-biased dispersal, which it does, and alsoshould exert a cost on males who disperse farthest(Greenwood 1980). However, male peregrines inGreenland do not suffer reduced productivity or sur-vivorship when dispersing greater distances, at leastwithin our study area. This finding is not uniqueamong birds (Arcese 1989, Plissner and Gowaty1996, Miller and Smallwood 1997). When a negativerelationship occurs between dispersal distance andproductivity and survivorship (Newton and Mar-quiss 1983, Nilsson 1989, Part 1990), it is attributedto benefits accrued from familiarity with the natalarea (Part 1995), knowledge gained either from earlyarrival after spring migration (Part 1994) or from ex-plorations prior to autumn migration (Morton 1992).Knowledge of natal areas probably is poorly devel-oped in high-latitude peregrines because they mi-grate soon after they leave the nest (Mearns andNewton 1984). However, most peregrines first breedwhen two or three years old (Mearns and Newton1984, Ambrose and Riddle 1988, Tordoff and Redig1997), so individuals have several summers to ex-plore and become familiar with an area before theysecure a territory.
Acknowledgments.—This research would not havebeen possible without the tireless efforts of numer-ous banders. S. Ward and W. Seegar secured long-term funding from the U.S. Army Edgewood Re-search, Development, and Engineering Center, Ab-erdeen Proving Ground, Maryland. The DanishCommission for Scientific Research in Greenland,the Greenland Home Rule Government, the DanishPolar Center, and the Danish Meteorological Insti-tute issued research permits, supported our work,and provided housing. K. Kampp of the ZoologicalMuseum in Copenhagen, Denmark, supplied bandsand timely recovery information. K. Falk and S.Møller shared data from their study in South Green-land. Logistical support was provided by P. Bjerre, P.Buus, the Polar Ice Coring Office (Universities ofAlaska and Nebraska), the New York Air NationalGuard, the U.S. Air Force, and the Greenland Icesh-eet Project. K. Coffin, R. Donnelly, M. du Plessis, J.Enderson, A. Harmata, K. Miller, J. Robinson, and C.White provided helpful comments on the draft man-uscript.
LITERATURE CITED
AMBROSE, R. E., AND K. E. RIDDLE. 1988. Populationdispersal, turnover, and migration of Alaska
Peregrines. Pages 677–684 in Peregrine Falconpopulations: Their management and recovery(T. J. Cade, J. H. Enderson, C. G. Thelander, andC. W. White, Eds.). The Peregrine Fund, Boise,Idaho.
ARCESE, P. 1989. Intrasexual competition, matingsystem and natal dispersal in Song Sparrows.Animal Behaviour 38:958–979.
BURNHAM, W. A., AND W. G. MATTOX. 1984. Biologyof the Peregrine and Gyrfalcon in Greenland.Meddelelser om Grønland Bioscience 14:1–28.
COURT, C. S., D. M. BRADLEY, C. C. GATES, AND D. A.BOAG. 1989. Turnover and recruitment in a tun-dra population of Peregrine Falcons Falco pere-grinus. Ibis 131:487–496.
GREENWOOD, P. J. 1980. Mating systems, philopatryand dispersal in birds and mammals. AnimalBehaviour 28:1140–1162.
MATTOX, W. G., AND W. S. SEEGAR. 1988. The Green-land Peregrine Falcon survey, 1972–1984, withemphasis on recent population status. Pages 27–36 in Peregrine Falcon populations: Their man-agement and recovery (T. J. Cade, J. H. Enderson,C. G. Thelander, and C. W. White, Eds.). The Per-egrine Fund, Boise, Idaho.
MEARNS, R., AND I. NEWTON. 1984. Turnover and dis-persal in a Peregrine Falco peregrinus population.Ibis 126:347–355.
MILLER, K. E., AND J. A. SMALLWOOD. 1997. Natal dis-persal and philopatry of southeastern AmericanKestrels in Florida. Wilson Bulletin 109:226–232.
MORITSCH, M. Q. 1983. Photographic guide for agingnestling Prairie Falcons. United States Bureau ofLand Management, Boise, Idaho.
MORTON, M. L. 1992. Effects of sex and birth date onpremigration biology, migration schedules, re-turn rates and natal dispersal in the MountainWhite-crowned Sparrow. Condor 94:117–133.
NEGRO, J. J., F. HIRALDO, AND J. A. DONAZAR. 1997.Causes of natal dispersal in the Lesser Kestrel:Inbreeding avoidance or resource depression?Journal of Animal Ecology 66:640–648.
NEWTON, I., AND M. MARQUISS. 1983. Dispersal ofSparrowhawks between birthplace and breed-ing place. Journal of Animal Ecology 52:463–477.
NILSSON, J.-A. 1989. Causes and consequences of na-tal dispersal in the Marsh Tit, Parus palustris.Journal of Animal Ecology 58:619–636.
PART, T. 1990. Natal dispersal in the Collared Fly-catcher: Possible causes and reproductive con-sequences. Ornis Scandinavica 21:83–88.
PART, T. 1994. Male philopatry confers a mating ad-vantage in the migratory Collared Flycatcher, Fi-cedula albicollis. Animal Behaviour 48:401–409.
PART, T. 1995. The importance of local familiarityand search costs for age- and sex-biased philo-patry in the Collared Flycatcher. Animal Behav-iour 49:1029–1038.
504 [Auk, Vol. 117Short Communications
PLISSNER, J. H., AND P. A. GOWATY. 1996. Patterns ofnatal dispersal, turnover and dispersal costs inEastern Bluebirds. Animal Behaviour 51:1307–1322.
PUSEY, A. E. 1987. Sex-biased dispersal and inbreed-ing avoidance in birds and mammals. Trends inEcology and Evolution 2:295–299.
TORDOFF, H. B., AND P. T. REDIG. 1997. Midwest Per-egrine Falcon demography, 1982–1995. Journalof Raptor Research 31:339–346.
Received 28 December 1998, accepted 28 July 1999.Associate Editor: M. du Plessis
The Auk 117(2):504–507, 2000
Influence of Lipid and Uric Acid on �13C and �15N Values of Avian Blood:Implications for Trophic Studies
STUART BEARHOP,1,4 MARK A. TEECE,2 SUSAN WALDRON3 AND ROBERT W. FURNESS1
1Ornithology Group, Graham Kerr Building, Institute of Biomedical and Life Sciences, University of Glasgow,Glasgow G12 8QQ, United Kingdom;
2Geophysical Laboratory, Carnegie Institution of Washington, 5251 Broad Branch Road NW, Washington,D.C. 20015, USA; and
3Scottish Universities Research and Reactor Centre (SURRC), East Kilbride, Glasgow G75 0QF, United Kingdom
The use of nitrogen (15N/14N) and carbon (13C/12C)stable isotopes to infer trophic relationships in foodwebs has become a common and widely acceptedtechnique (see Michener and Schell 1994). Stable-iso-tope ratios in the tissues of consumers reflect thosein their diets in a predictable fashion, being isoto-pically enriched in 15N (up to 4‰) and 13C (usuallyca. 1‰; DeNiro and Epstein 1981, Peterson and Fry1987). Thus, unlike conventional dietary studies, sta-ble-isotope analyses reflect assimilated (vs. merelyingested) foodstuffs. In addition, depending on thetissue chosen, dietary information spanning differ-ent temporal scales can be obtained (Hobson andClark 1992a). Typical proteins used in such analysesare bone collagen and muscle (e.g. Hobson 1987,1990; Hobson et al. 1994), which usually require thesacrifice of live animals or the opportunistic sam-pling of carcasses.
Isotopic analyses can also be performed on tissuesthat can be sampled nondestructively, such as blood,feathers, and hair (Hobson and Clark 1993, Thomp-son and Furness 1995, Bearhop et al. 1999). Nonde-structive sampling is desirable when dealing withrare species, when individuals are part of ongoingstudies, and when investigating variation within in-dividuals over time. However, there are consistentdifferences in isotopic signatures among tissue types(e.g. Tieszen et al. 1983). Some of this variation canbe linked to differences in tissue metabolic rates, butsome reflects differences among tissues in biochem-ical composition (e.g. Hobson and Clark 1992a). Lip-
4 E-mail: [email protected]
id presents a particular problem. The lipid compo-nent of a given tissue type can be quite variableamong individuals and generally is depleted in 13Ccompared with whole tissues (e.g. Tieszen et al.1983). For these reasons, it is common practice to re-move lipids from tissue samples where they may bepresent (Hobson 1987, 1990; Hobson and Clark1992b; Thompson and Furness 1995).
One of the most obvious ways to take nondestruc-tive samples from animals is to obtain blood. The lip-id component of blood generally is very low and iscarried mostly in the plasma (Deuel 1955). Research-ers have either analyzed whole blood (Hobson andClark 1993, Hobson et al. 1997) or removed the serumfraction and analyzed the cells (Ben-David et al.1997). However, the concentration of uric acid andurea (the end products of protein catabolism) reachsubstantial levels in blood plasma, particularly intimes of high protein turnover such as during growth(Skadhauge 1983, Wolf et al. 1985, Alonso et al. 1991).Indeed, the concentration of uric acid in blood plas-ma is close to its solubility limit, and in avian urine,it grossly exceeds this limit and is present in colloidsuspension (Skadhauge 1983). The mechanism bywhich 15N enrichment occurs is largely due to the ex-cretion of isotopically light nitrogen (14N) in nitrog-enous waste (Peterson and Fry 1987). Thus, if bloodlevels of urea or uric acid are elevated, then wholeblood measurements will appear to be depleted in15N. To date, no workers have assessed the influencethat the lipid component and the uric acid/urea con-tent may have on the isotopic signature of wholeblood.
April 2000] 505Short Communications
In this paper, we compare the isotope signaturesmeasured in whole blood of Great Skua (Catharactaskua) adults and chicks (more than 28 days old) withthose of the same samples after they have been sub-jected to an aggressive lipid and uric acid/urea ex-traction technique. As top predators in many marineecosystems, seabirds frequently have been used inisotopic studies (Hobson 1987, 1990; Hobson et al.1994; Thompson and Furness 1995). Seabirds tend toshare a number of life-history characteristics, so theGreat Skua should be a good model for seabirds ingeneral. Moreover, because elevated levels of uricacid have been reported in the blood of chicks froma wide range of taxa (including pelecaniforms [Wolfet al. 1985], ciconiiforms [Alfonso et al. 1991], andgalliforms [Featherston 1969]), it might be expectedthat this phenomenon would apply to a great manyspecies.
Methods.—Great Skuas were sampled on Foula,Shetland (60�08�N, 2�05�W), during summer 1996and on St. Kilda, Western Isles (57�49�N, 8�35�W),during summer 1997. Blood was collected from thetarsal vein using a 23-gauge needle and transferredto a glass vial, where it was stored frozen until anal-ysis. Prior to analysis, samples of whole blood werefreeze dried and powdered. Part of each dried sam-ple was subjected to a standard technique for the ex-traction of lipids using a soxhlet apparatus with re-fluxing chloroform for 4 to 6 h. Unfortunately, thesamples were not weighed.
All �13C and �15N analyses were carried out by con-tinuous-flow isotope ratio mass spectrometry (CF-IRMS) using a Europa Anca 20–20 C/N/S appara-tus. Samples were loaded into miniature tin cups (4 6 mm) for combustion. A typical run consisted ofa reference sample, duplicate analyses of two stan-dards (internal laboratory carbon standard andIAEA-N-2), and then 8 to 10 samples. This sequencewas repeated throughout the run, allowing a correc-tion to be made for drift, if necessary. Isotope ratiosare expressed in parts per thousand (‰) accordingto the following equation:
rsample�X � 1 1,000, (1)� �[ ]rstandard
where X is 15N or 13C and r is the corresponding ratio15N/14N or 13C /12C. The rstandard for 13C is Pee Dee bel-emnite and for 15N is atmospheric nitrogen. Mea-surements of �13C and �15N are precise and accurateto �0.2‰ and �0.4‰, respectively. To adjust fortest-wise error, we applied a sequential Bonferroniadjustment for � (� � 0.006 for 8 statistical tests).
Results.—The �13C signatures of blood from adultGreat Skuas did not change significantly after wash-ing in hot chloroform (before, x � 17.1 � SD of0.6‰, n � 23; after, x � 17.2 � 0.8‰, n � 23; pairedt � 1.61, P � 0.122). The same was true of �15N valuesin adult blood (before, x � 12.6 � 0.9‰, n � 21; after,
x � 12.6 � 0.9‰, n � 21; paired t � 0.76, P � 0.94).The �13C values of chick blood also remained unaf-fected by the treatment (before, x � 17.6 � 0.6‰,n � 30; after, x � 17.7 � 0.9‰, n � 30; paired t �0.43, P � 0.43). However, the mean �15N value ofchick blood increased significantly after treatment(before, x � 11.6 � 0.5‰, n � 30; after, x � 12.8 �0.7‰, n � 30; paired t � 11.5, P � 0.001). Before ex-traction with hot chloroform, the mean �13C value ofadult whole blood was lower than that of chicks (t �2.9, df � 51, P � 0.005), as was the mean �15N value(t � 4.3, df � 29, P � 0.001). However, after treatmentwith hot chloroform, we detected no significant dif-ferences between blood from adults and chicks (�13C,t � 1.9, df � 51, P � 0.052; �15N, t � 1.1, df � 49, P� 0.27).
Discussion.—Given that other researchers havemeasured the 13C content of lipid as being depletedrelative to whole tissues (e.g. Tieszen et al. 1983), car-bon-isotope ratios suggest that the lipid componentof adult blood is so small that it does not signifi-cantly affect the whole-tissue isotope signatures.These findings are supported by studies that deter-mined that the lipid component of avian blood is lessthan 1% of the total wet mass (e.g. Wolf et al. 1985,Rosa et al. 1993, Sartori et al. 1995); hence, it is un-likely to be of sufficient magnitude to influence theoverall �13C value. The pattern for skua chicks ap-pears to be similar, which is somewhat surprisingbecause young birds tend to have larger stores of lip-id than adults (see Blem 1990), and one might haveexpected to detect a similar pattern in blood. How-ever, even if lipid levels in chick blood were muchhigher than those in adult blood, they would stillcomprise only a small proportion of the whole tissueand as such would probably not be substantialenough to affect the �13C ratio significantly.
The results for 15N were different than those for13C. After washing in hot chloroform, �15N values inchick blood were significantly higher than those ofwhole tissue, whereas no such difference was de-tected in adult blood. Moreover, after the aggressiveextraction procedure, the mean �15N signature ofchick blood did not differ significantly from that ofadult blood. These observations suggest that wash-ing whole blood with hot chloroform results in theremoval of isotopically light nitrogenous com-pounds, which are present in high concentrations inchick blood but in low amounts in adult blood.
Excreted nitrogenous compounds, such as ureaand uric acid, are isotopically depleted in 15N (Peter-sen and Fry 1987). Assessment of plasma concentra-tions of these components in adults and chicks of theWhite Stork (Ciconia ciconia) yielded higher overallconcentrations in chicks (Alfonso et al. 1991). Fur-thermore, in Brown Pelicans (Pelecanus occidentalis)and domestic fowl (Gallus gallus), large chicks tendto have elevated levels of uric acid in blood due totheir large daily food intake (Featherston 1969, Wolf
506 [Auk, Vol. 117Short Communications
et al. 1985). Uric acid is the end product of proteincatabolism and is produced mostly in the kidney andliver, and the serum concentration of uric acid is em-ployed as an indicator of rates of protein catabolism(Stevens 1996). Rates of protein turnover are sub-stantially higher during growth periods, with mus-cle protein turnover of 30% per day in chicks versus5% per day in adults (Swick 1982).
We suggest that the aggressive extraction tech-nique using refluxing hot chloroform removes uricacid from whole blood. The solubility of uric acid inchloroform increases substantially with temperaturefrom ca. 0.11 mM at 25�C to more than 0.25 at 50�C(M. Teece unpubl. data). Furthermore, in a study ofmono- and dimethyl uric acids in incubation media,a mixture of chloroform and 2-propanol (85:15 v/v)was used to extract the compounds of interest (Ben-chekroun et al. 1990). Because uric acid is assumedto be isotopically light (Petersen and Fry 1987) andis present in substantially higher concentrations inchicks than in adults (Alfonso et al. 1991), removalof this compound during the extraction procedurewould account for the observed results.
Our results indicate that there is no need to extractlipids prior to isotopic analysis of avian blood. How-ever, if protein turnover in the individuals beingstudied is thought to be high, then the possibility ofelevated uric acid levels should be considered, par-ticularly when comparing the diets of adults andyoung. It is worth noting that adult birds also canexperience periods of high protein turnover, for ex-ample during rapid molt or egg formation (Blem1990), at which time they also may have high levelsof uric acid in their blood. Therefore, the influence ofelevated concentrations of nitrogenous waste on the�15N of blood must be considered when assessingtrophic status based solely on the measurement ofbulk tissue.
Acknowledgments.—We thank Tony Fallick and JulieDougans from the Life Sciences Community StableIsotope Facility, which is funded by a consortium ofScottish Universities and the Natural EnvironmentalResearch Council. Fieldwork was made possible bythe Holborn family in Foula and by Scottish NaturalHeritage in St. Kilda. Dan Greenwood, Rob Malsom,Catherine Gray, Ben Ross, and Paulo Catry gave in-valuable assistance in the field. We also thank DavidThompson. SB was funded by a University of Glas-gow Scholarship and the Louise Hiom Trust.
LITERATURE CITED
ALONSO, J. C., V. HUECAS, J. A. ALONSO, M. ABELEN-DA, R. MUNOZ-PULIDO, AND M. L. PUERTA. 1991.Hematology and blood chemistry of adult WhiteStorks (Ciconia ciconia). Comparative Biochem-istry and Physiology 98A:395–397.
BEARHOP, S., D. R. THOMPSON, S. WALDRON, I. C.RUSSELL, G. ALEXANDER, AND R. W. FURNESS.
1999. Stable isotopes indicate the extent of fresh-water feeding by cormorants Phalacrocorax carboshot at inland fisheries in England. Journal ofApplied Ecology 36:75–84.
BEN-DAVID, M. R. W. FLYNN, AND D. M. SCHELL.1997. Annual and seasonal changes in diets ofmartens: Evidence from stable isotope analysis.Oecologia 111:280–291.
BENCHEKROUN, Y., M. DESAGE, B. RIBON, AND J. L.BRAZIER. 1990. Gas chromatographic-mass spec-trometric quantification of trimethylxanthines,dimethylxanthines and monomethylxanthinesand uric acids from hepatocyte incubation me-dia. Journal of Chromatography 532:261–276.
BLEM, C. R. 1990. Avian energy storage. Current Or-nithology 7:59–113.
DENIRO, M. J., AND S. EPSTEIN. 1981. Influence of dieton the distribution of nitrogen isotopes in ani-mals. Geochimica et Cosmochimica Acta 45:341–351.
DEUEL, H. J. 1955. The lipids II: Biochemistry, diges-tion, absorption, transport and storage. Intersci-ence, New York.
FEATHERSTON, W. R. 1969. Nitrogenous metabolitesin the plasma of chicks adapted to high proteindiets. Poultry Science 48:646–652.
HOBSON, K. A. 1987. Use of stable-carbon isotopeanalysis to estimate marine and terrestrial pro-tein content in gull diets. Canadian Journal ofZoology 65:1210–1213.
HOBSON, K. A. 1990. Stable isotope analysis of Mar-bled Murrelets: Evidence for freshwater feedingand determination of trophic level. Condor 92:897–903.
HOBSON, K. A., AND R. G. CLARK. 1992a. Assessingavian diets using stable isotopes I: Turnover of13C in tissues. Condor 94:181–188.
HOBSON, K. A., AND R. G. CLARK. 1992b. Assessingavian diets using stable isotopes II: Factors in-fluencing diet-tissue fractionation. Condor 94:189–197.
HOBSON, K. A., AND R. G. CLARK. 1993. Turnover of13C in cellular and plasma fractions of blood: Im-plications for nondestructive sampling in aviandietary studies. Auk 110:638–641.
HOBSON, K. A., H. L. GIBBS, AND M. L. GLOUTNEY.1997. Preservation of blood and tissue samplesfor stable-carbon and stable-nitrogen isotopeanalysis. Canadian Journal of Zoology 75:1720–1723.
HOBSON, K. A., J. F. PIATT, AND J. PITOCECHELLI. 1994.Using stable isotopes to determine seabird tro-phic relationships. Journal of Animal Ecology63:786–798.
MICHENER, R. H., AND D. M. SCHELL. 1994. Stable iso-tope ratios as tracers in marine aquatic foodwebs. Pages 138–157 in Stable isotopes in ecol-ogy and environmental science (K. Lajtha and R.H. Michener, Eds.). Blackwell, Oxford.
April 2000] 507Short Communications
PETERSON, B. J., AND B. FRY. 1987. Stable isotopes inecosystem studies. Annul Review of Ecologyand Systematics 18:293–320.
ROSA, C. D., R. ROSA, E. RODRIGUES, AND M. BACILA.1993. Blood constituents and electrophoreticpatterns in antarctic birds: Penguins and skuas.Comparative Biochemistry and Physiology104A:117–123.
SARTORI, D. R. S., R. H. MIGLIORINI, J. A. S. VEIGA, J.L. MOURA, I. C. KETTELHUT, AND C. LINDER.1995. Metabolic adaptations induced by long-term fasting in quails. Comparative Biochemis-try and Physiology 111A:487–493.
SKADHAUGE, E. 1983. Formation and composition ofurine. Pages 108–135 in Physiology and bio-chemistry of the domestic fowl, vol. 4. (B. M.Freeman, Ed.). Academic Press, London.
STEVENS, L. 1996. Avian biochemistry and molecularbiology. Cambridge University Press, Cam-bridge, United Kingdom.
SWICK, R. W. 1982. Growth and protein turnover inanimals. Critical Reviews in Food Science andNutrition 16:117–126.
THOMPSON, D. R., AND R. W. FURNESS. 1995. Stable-isotope ratios of carbon and nitrogen in feathersindicate seasonal dietary shifts in Northern Ful-mars. Auk 112:493–498.
TIESZEN, L. L., T. W. BOUTTON, K. G. TESDAHL, AND
N. A. SLADE. 1983. Fractionation and turnover ofstable carbon isotopes in animal tissues: Impli-cations for �13C analysis of diet. Oecologia 57:32–37.
WOLF, S. H., R.W. SCHREIBER, L. KAHANA, AND J. J.TORRES. 1985. Seasonal, sexual and age-relatedvariation in the blood composition of the BrownPelican (Pelecanus occidentalis) Comparative Bio-chemistry and Physiology 82A:837–846.
Received 18 September 1998, accepted 4 August 1999.Associate Editor: J. C. Wingfield
The Auk 117(2):507–510, 2000
Dive Depth and Diet of the Black-vented Shearwater (Puffinus opisthomelas)
BRADFORD S. KEITT,1 DONALD A. CROLL, AND BERNIE R. TERSHY
Institute of Marine Sciences, University of California, Santa Cruz, California 95064, USA; andIsland Conservation and Ecology Group, P.O. Box 141, Davenport, California 95017, USA
In general, procellariiforms have been considered tobe surface and shallow-dive foragers (Brooke 1990,Warham 1990). This view has persisted despite Ku-roda’s (1954) demonstration that Short-tailed Shear-waters (Puffinus tenuirostris) and Sooty Shearwaters (P.griseus) have streamlined tarsi and a narrow pelvisthat should make them more proficient divers thansome other procellariiforms. Weimerskirch and Sagar(1996) deployed maximum depth gauges and foundthat Sooty Shearwaters dive to 67 m. These depths aresurprising for such a proficient flier. Weimerskirch andSagar’s data corroborate Kuroda’s predictions from hismorphological data and challenge previous assump-tions about shearwater foraging ecology. However, itis difficult to determine whether diving is widespreadin shearwaters because no studies have been pub-lished on the diving capabilities of species other thanthe Sooty Shearwater. Here, we examine maximumdive depths and diet of the Black-vented Shearwater(Puffinus opisthomelas).
1 Address correspondence to Institute of Marine Sci-ences, University of California, Santa Cruz, California95064, USA. E-mail: [email protected]
The Black-vented Shearwater is endemic to islandsoff the Pacific coast of Mexico and is the only shear-water that breeds on islands in the California Cur-rent (Everett 1988). Anecdotal observations of thisspecies began at the turn of the century (Anthony1896), but only recently have detailed studies beenconducted on the biology of this species (Keitt 1998).Natividad Island, Baja California, Mexico, with abreeding population of about 150,000 pairs, supportsmost of the world population. The Black-ventedShearwater is a summer breeder with a four-monthreproductive cycle that is very similar to that of thewell-studied Manx Shearwater (Puffinus puffinus;Harris 1965, Perrins et al. 1973, Brooke 1990). At-seaobservations indicate that the Black-vented Shear-water, unlike many other procellariiforms, is a near-shore forager that does not regularly make extendedpelagic foraging trips (Ainley 1976).
Methods.—Maximum depth gauges (MDG) weredeployed at Natividad Island between 13 May and 30June 1998. The MDGs were constructed similar tothose described in Croll et al. (1992). Briefly, lengthsof Tygon tubing (15 to 18 cm) were lined with a sol-uble indicator (confectioner’s sugar), and one endwas securely tied to allow water entry only at the
508 [Auk, Vol. 117Short Communications
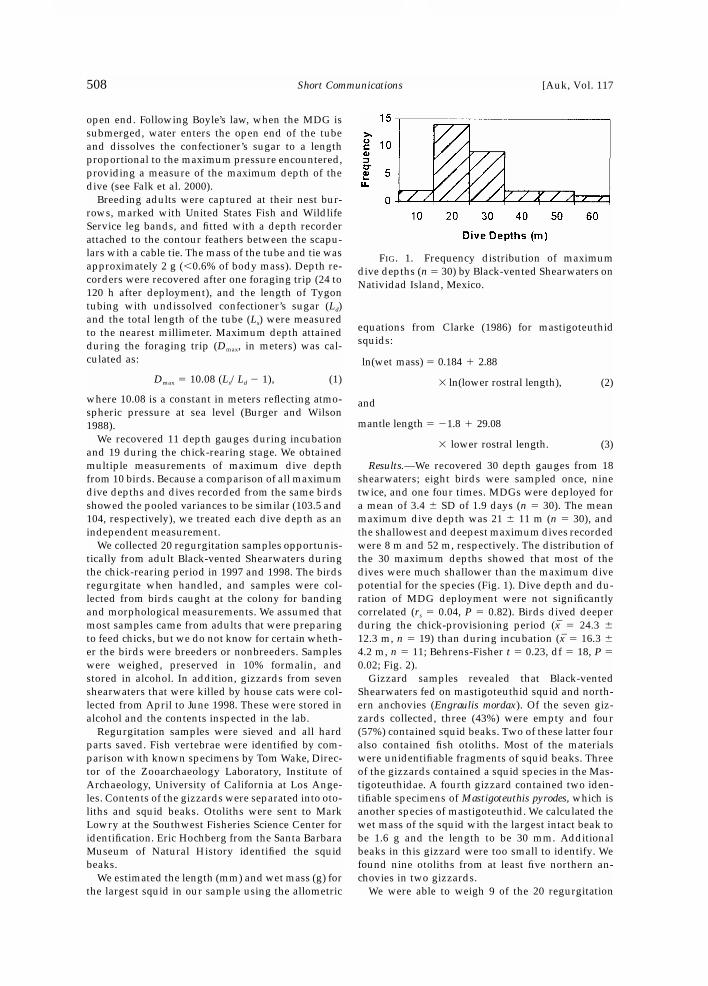
FIG. 1. Frequency distribution of maximumdive depths (n � 30) by Black-vented Shearwaters onNatividad Island, Mexico.
open end. Following Boyle’s law, when the MDG issubmerged, water enters the open end of the tubeand dissolves the confectioner’s sugar to a lengthproportional to the maximum pressure encountered,providing a measure of the maximum depth of thedive (see Falk et al. 2000).
Breeding adults were captured at their nest bur-rows, marked with United States Fish and WildlifeService leg bands, and fitted with a depth recorderattached to the contour feathers between the scapu-lars with a cable tie. The mass of the tube and tie wasapproximately 2 g (�0.6% of body mass). Depth re-corders were recovered after one foraging trip (24 to120 h after deployment), and the length of Tygontubing with undissolved confectioner’s sugar (Ld)and the total length of the tube (Ls) were measuredto the nearest millimeter. Maximum depth attainedduring the foraging trip (Dmax, in meters) was cal-culated as:
Dmax � 10.08 (Ls/Ld 1), (1)
where 10.08 is a constant in meters reflecting atmo-spheric pressure at sea level (Burger and Wilson1988).
We recovered 11 depth gauges during incubationand 19 during the chick-rearing stage. We obtainedmultiple measurements of maximum dive depthfrom 10 birds. Because a comparison of all maximumdive depths and dives recorded from the same birdsshowed the pooled variances to be similar (103.5 and104, respectively), we treated each dive depth as anindependent measurement.
We collected 20 regurgitation samples opportunis-tically from adult Black-vented Shearwaters duringthe chick-rearing period in 1997 and 1998. The birdsregurgitate when handled, and samples were col-lected from birds caught at the colony for bandingand morphological measurements. We assumed thatmost samples came from adults that were preparingto feed chicks, but we do not know for certain wheth-er the birds were breeders or nonbreeders. Sampleswere weighed, preserved in 10% formalin, andstored in alcohol. In addition, gizzards from sevenshearwaters that were killed by house cats were col-lected from April to June 1998. These were stored inalcohol and the contents inspected in the lab.
Regurgitation samples were sieved and all hardparts saved. Fish vertebrae were identified by com-parison with known specimens by Tom Wake, Direc-tor of the Zooarchaeology Laboratory, Institute ofArchaeology, University of California at Los Ange-les. Contents of the gizzards were separated into oto-liths and squid beaks. Otoliths were sent to MarkLowry at the Southwest Fisheries Science Center foridentification. Eric Hochberg from the Santa BarbaraMuseum of Natural History identified the squidbeaks.
We estimated the length (mm) and wet mass (g) forthe largest squid in our sample using the allometric
equations from Clarke (1986) for mastigoteuthidsquids:
ln(wet mass) � 0.184 � 2.88
ln(lower rostral length), (2)
and
mantle length � 1.8 � 29.08
lower rostral length. (3)
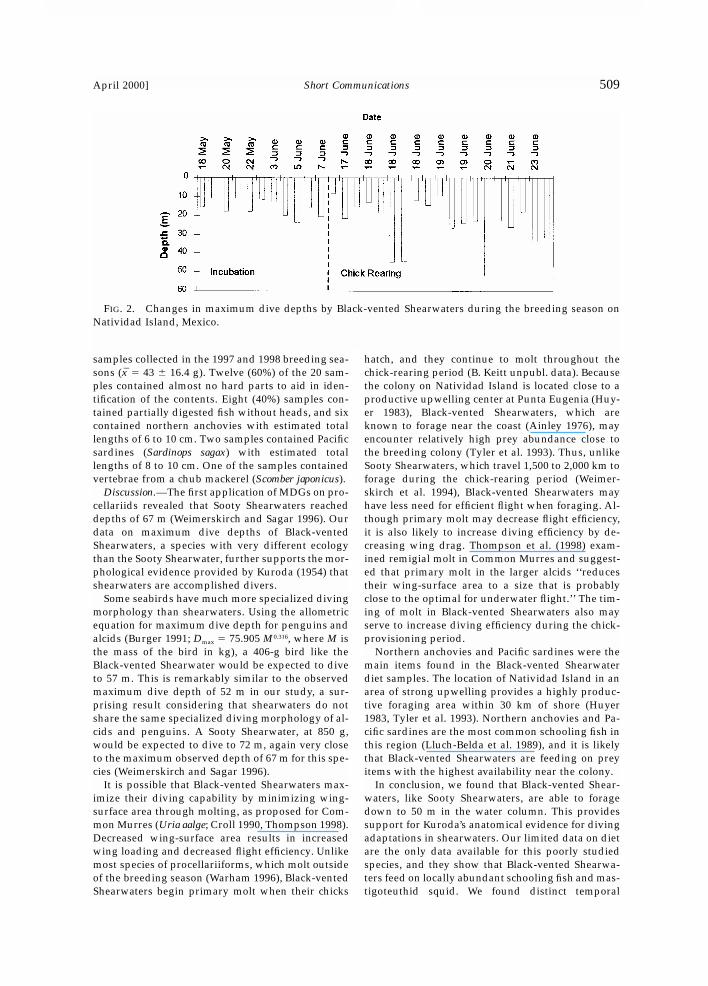
Results.—We recovered 30 depth gauges from 18shearwaters; eight birds were sampled once, ninetwice, and one four times. MDGs were deployed fora mean of 3.4 � SD of 1.9 days (n � 30). The meanmaximum dive depth was 21 � 11 m (n � 30), andthe shallowest and deepest maximum dives recordedwere 8 m and 52 m, respectively. The distribution ofthe 30 maximum depths showed that most of thedives were much shallower than the maximum divepotential for the species (Fig. 1). Dive depth and du-ration of MDG deployment were not significantlycorrelated (rs � 0.04, P � 0.82). Birds dived deeperduring the chick-provisioning period (x � 24.3 �12.3 m, n � 19) than during incubation (x � 16.3 �4.2 m, n � 11; Behrens-Fisher t � 0.23, df � 18, P �0.02; Fig. 2).
Gizzard samples revealed that Black-ventedShearwaters fed on mastigoteuthid squid and north-ern anchovies (Engraulis mordax). Of the seven giz-zards collected, three (43%) were empty and four(57%) contained squid beaks. Two of these latter fouralso contained fish otoliths. Most of the materialswere unidentifiable fragments of squid beaks. Threeof the gizzards contained a squid species in the Mas-tigoteuthidae. A fourth gizzard contained two iden-tifiable specimens of Mastigoteuthis pyrodes, which isanother species of mastigoteuthid. We calculated thewet mass of the squid with the largest intact beak tobe 1.6 g and the length to be 30 mm. Additionalbeaks in this gizzard were too small to identify. Wefound nine otoliths from at least five northern an-chovies in two gizzards.
We were able to weigh 9 of the 20 regurgitation
April 2000] 509Short Communications
FIG. 2. Changes in maximum dive depths by Black-vented Shearwaters during the breeding season onNatividad Island, Mexico.
samples collected in the 1997 and 1998 breeding sea-sons (x � 43 � 16.4 g). Twelve (60%) of the 20 sam-ples contained almost no hard parts to aid in iden-tification of the contents. Eight (40%) samples con-tained partially digested fish without heads, and sixcontained northern anchovies with estimated totallengths of 6 to 10 cm. Two samples contained Pacificsardines (Sardinops sagax) with estimated totallengths of 8 to 10 cm. One of the samples containedvertebrae from a chub mackerel (Scomber japonicus).
Discussion.—The first application of MDGs on pro-cellariids revealed that Sooty Shearwaters reacheddepths of 67 m (Weimerskirch and Sagar 1996). Ourdata on maximum dive depths of Black-ventedShearwaters, a species with very different ecologythan the Sooty Shearwater, further supports the mor-phological evidence provided by Kuroda (1954) thatshearwaters are accomplished divers.
Some seabirds have much more specialized divingmorphology than shearwaters. Using the allometricequation for maximum dive depth for penguins andalcids (Burger 1991; Dmax � 75.905 M0.316, where M isthe mass of the bird in kg), a 406-g bird like theBlack-vented Shearwater would be expected to diveto 57 m. This is remarkably similar to the observedmaximum dive depth of 52 m in our study, a sur-prising result considering that shearwaters do notshare the same specialized diving morphology of al-cids and penguins. A Sooty Shearwater, at 850 g,would be expected to dive to 72 m, again very closeto the maximum observed depth of 67 m for this spe-cies (Weimerskirch and Sagar 1996).
It is possible that Black-vented Shearwaters max-imize their diving capability by minimizing wing-surface area through molting, as proposed for Com-mon Murres (Uria aalge; Croll 1990, Thompson 1998).Decreased wing-surface area results in increasedwing loading and decreased flight efficiency. Unlikemost species of procellariiforms, which molt outsideof the breeding season (Warham 1996), Black-ventedShearwaters begin primary molt when their chicks
hatch, and they continue to molt throughout thechick-rearing period (B. Keitt unpubl. data). Becausethe colony on Natividad Island is located close to aproductive upwelling center at Punta Eugenia (Huy-er 1983), Black-vented Shearwaters, which areknown to forage near the coast (Ainley 1976), mayencounter relatively high prey abundance close tothe breeding colony (Tyler et al. 1993). Thus, unlikeSooty Shearwaters, which travel 1,500 to 2,000 km toforage during the chick-rearing period (Weimer-skirch et al. 1994), Black-vented Shearwaters mayhave less need for efficient flight when foraging. Al-though primary molt may decrease flight efficiency,it is also likely to increase diving efficiency by de-creasing wing drag. Thompson et al. (1998) exam-ined remigial molt in Common Murres and suggest-ed that primary molt in the larger alcids ‘‘reducestheir wing-surface area to a size that is probablyclose to the optimal for underwater flight.’’ The tim-ing of molt in Black-vented Shearwaters also mayserve to increase diving efficiency during the chick-provisioning period.
Northern anchovies and Pacific sardines were themain items found in the Black-vented Shearwaterdiet samples. The location of Natividad Island in anarea of strong upwelling provides a highly produc-tive foraging area within 30 km of shore (Huyer1983, Tyler et al. 1993). Northern anchovies and Pa-cific sardines are the most common schooling fish inthis region (Lluch-Belda et al. 1989), and it is likelythat Black-vented Shearwaters are feeding on preyitems with the highest availability near the colony.
In conclusion, we found that Black-vented Shear-waters, like Sooty Shearwaters, are able to foragedown to 50 m in the water column. This providessupport for Kuroda’s anatomical evidence for divingadaptations in shearwaters. Our limited data on dietare the only data available for this poorly studiedspecies, and they show that Black-vented Shearwa-ters feed on locally abundant schooling fish and mas-tigoteuthid squid. We found distinct temporal
510 [Auk, Vol. 117Short Communications
changes in maximum dive depths during the shear-water’s breeding season. These may translate intotemporal differences in prey consumption; however,we were not able to collect diet samples and divingdata on the same birds at the same time. Furtherstudies should examine these important factors si-multaneously.
Acknowledgments.—This project was a collaborativeeffort between the Reserva Biosfera ‘‘El Vizcaino,’’the Sociedad Cooperativa Produccion Pesquera ‘‘Bu-zos y Pescadores,’’ and the Island Conservation andEcology Group. Permits were issued by the Secretar-ia De Ambiente, Recursos Naturales y Pesca. Wethank the Biosphere Reserve and the Sociedad Coop-erativa for help with housing, transportation, andcommunications. We especially thank Felipe Becerril,Xavier Basurto, and Holly Gellerman for assistancewith data collection and Jose-Angel Sanchez Pachecofor support and interest in Black-vented Shearwa-ters. Jim Estes, Bruce Lyon, Peggy Delaney, Mike Lit-zow, Carlos Bosque, William Ostrand, and an anon-ymous reviewer provided valuable comments on themanuscript. This work was funded by the MyersOceanographic and Marine Biology Trust, the Amer-ican Museum of Natural History Frank M. ChapmanFund, and a Switzer Environmental Fellowship.
LITERATURE CITED
AINLEY, D. G. 1976. The occurrence of seabirds in thecoastal region of California. Western Birds 7:33–68.
ANTHONY, A. W. 1896. The Black-vented Shearwater(Puffinus opisthomelas). Auk 13:222–228.
BROOKE, M. 1990. The Manx Shearwater. T & A DPoyser, London.
BURGER, A. E. 1991. Maximum diving depths and un-derwater foraging in alcids and penguins. Ca-nadian Wildlife Service Occasional Paper 68:9–15.
BURGER, A. E., AND R. P. WILSON. 1988. Capillary-tube depth gauges for diving animals: An as-sessment of their accuracy and applicability.Journal of Field Ornithology 59:345–354.
CLARKE, M. R. 1986. A handbook for the identifica-tion of cephalopod beaks. Clarendon Press, Ox-ford.
CROLL, D. A. 1990. Physical and biological determi-nants of the abundance, distribution, and diet ofthe Common Murre in Monterey Bay, California.Pages 139–148 in Auks at sea (S. G. Sealy, Ed.).Studies in Avian Biology No. 14.
CROLL, D. A., A. J. GASTON, A. E. BURGER, AND D.KONNOFF. 1992. Foraging behavior and physio-logical adaptation for diving in Thick-billedMurres. Ecology 73:344–356.
EVERETT, W. T. 1988. Biology of the Black-ventedShearwater. Western Birds 19:89–104.
FALK, K., C. E. PEDERSEN, AND K. KAMPP. 2000. Mea-surements of diving depth in Dovekies (Allealle). Auk 117:522-525.
HARRIS, M. P. 1965. Breeding biology of the ManxShearwater. Ibis 108:17–33.
HUYER, A. 1983. Coastal upwelling in the CaliforniaCurrent system. Progressive Oceanographer 12:259–284.
KEITT, B. S. 1998. Ecology and conservation biologyof the Black-vented Shearwater (Puffinus opistho-melas) on Natividad Island, Vizcaino BiosphereReserve, Baja California Sur, Mexico. M.S. the-sis, University of California, Santa Cruz.
KURODA, N. 1954. On the classification and phylog-eny of the order Tubinares, particulary theshearwaters Puffinus: With special considara-tions [sic] on their osteology and habit differ-entiation. N. Kuroda, Tokyo.
LLUCH-BELDA, D., R. J. M. CRAWFORD, T. KAWASAKI,A. D. MACCALL, R. H. PARRISH, R. A. SCHWART-ZLOSE, AND P. E. SMITH. 1989. World-wide fluc-tuations of sardine and anchovy stocks: The re-gime problem. South African Journal MarineScience 8:195–205.
PERRINS, C. M., M. P. HARRIS, AND C. K. BRITTON.1973. Survival of Manx Shearwaters (Puffinuspuffinus). Ibis 115:335–348.
THOMPSON, C. W., M. L. WILSON, E. F. MELVIN, AND
D. J. PIERCE. 1998. An unusual sequence of flight-feather molt in Common Murres and its evolu-tionary implications. Auk 115:653–669.
TYLER, W. B., K. T. BRIGGS, D. B. LEWIS, AND R. G.FORD. 1993. Seabird distribution and abundancein relation to oceanographic processes in theCalifornia Current system. Pages 48–60 in Thestatus, ecology, and conservation of marinebirds of the North Pacific (K. Vermeer, K. T.Briggs, K. H. Morgan, and D. Siegel-Causey,Eds.). Canadian Wildlife Service Special Publi-cations, Ottawa.
WARHAM, J. 1990. The petrels: Their ecology andbreeding systems. Academic Press, London.
WARHAM, J. 1996. The behaviour, population biologyand physiology of the petrels. Academic Press,London.
WEIMERSKIRCH, H., O. CHASTEL, L. ACKERMANN, T.CHAURAND, F. CUENOT-CHAILLET, X. HINDER-MEYER, AND J. JUDAS. 1994. Alternate long andshort foraging trips in pelagic seabird parents.Animal Behaviour 47:472–476.
WEIMERSKIRCH, H., AND P. M. SAGAR. 1996. Divingdepths of Sooty Shearwaters Puffinus griseus. Ibis138:786–788.
Received 7 January 1999, accepted 4 August 1999.Associate Editor: C. Bosque