methodology for the comparative assessment of the satellite power system (sps) and alternative...
TRANSCRIPT
DOE/ER-0051
Dist. Category UC-11, 13, =,a, 97c
A METHODOLOGY FOR THE COMPARATIVE ASSESSMENT OF THE SATELLITE POWER SYSTEM (SPS) AND ALTERNATIVE TECHNOLOGIES
January 1980
Prepared by: T. Wolsko, W. Buehring, R. Cirillo, J. Gasper, L. Habegger, K. Hub, D. Newsom, M. Samsa, E. Stenehjem, and R. Whitfield
Integrated Assessments and Policy Evaluations Group tnergy ana tnvironmenrai Sysrerns Givisiori Argonne National Laboratory Argonne, Illinois 60439
Under Contract No. 31 -109-ENG-38
Prepared for: U.S. Department of Energy Off ice of Energy Research Satellite Power System Project Division Washington, D.C. 20545
DOE/NASA SATELLITE POWER SYSTEM Concept Development and Evaluation Program
ACKN-NTS
The au thors are g r a t e f u l t o the following reviewers who contr ibuted t o
t h i s r epor t through t h e i r cons t ruc t ive comments: M.R. Riches and F.A. Kooma-
noff , Department of Energy; R. Ayres, Carnegie-Mellon University; S. Cohen,
TRW; and t h e members of t he Comparative Assessment Review Committee: JOG.
Asbury, Argonne National Laboratory; ROE. Bailey, Ohio S t a t e University; R.W.
Bosse t t , New York S t a t e Consumer Pro tec t ion Board; K. Bossong, Cit izens '
Energy P ro jec t ; G. DeLoss, Environmental Pol icy Center; G.A. Kent, Glenn A.
Kent Associates; B.D. LaMar, Argonne National Laboratory; A. Manne, Stanford
Universi ty; T.J. Nagel, American E l e c t r i c Power Service Corporation; and GOA.
Tol ley, Universi ty of Chicago. However, t he reviewers l i s t e d do not neces-
s a r i l y agree with a l l of the methods described herein.
iii
TABLE OF CONTENTS
ABSTRACT ........................................................ 1. INTRODUCTION. ............................................... 2 . ASSESSMENT F.WO. ........................................
2.1 SELECTION OF COMPARATIVE ISSIJES ........................ 2.2 SELECTION OF ENERGY ALTERNATIVES ....................... 2.3 ENERGY SYSTEM ..ER.ATION ......................... 2.4 SIDE-BY-SIDE ANALYSIS OF ENERGY SYS.S ................ 2.5 ALTERNATIVE FUTURES ANALYSIS ........................... 2.6 ASSESSMENT INTEGRATION AND AGGREGATION TECHNIQUES ......
3 . METHODOLOGY FOR COMPARATIVE ASSES.. ...................... 3.1 COST AND PE.O.CE ................................... 3.2 ENVIRONMENTAL IMPACTS ..................................
3.2.1 Health and Safety E f f e c t s ....................... 3.2.2 Welfare E f f e c t s .................................
3.3 RESOURCES .............................................. 3.3.1 Land U s e ........................................ 3.3.2 Critical Materials .............................. 3.3.3 E n e r g y Balance .................................. 3.3.4 Water .sources ................................. 3.3.5 C o m p a r a t i v e Labor E f f e c t s .......................
3.4 ECONOMIC AND SOCIETAL IMPACTS .......................... 3.4.1 Macroeconomic E f f e c t s ........................... 3.4.2 S o c i o e c o n o m i c Errects ...........................
3.5 INSTITUTIONAL IMPACTS .................................. REFERENCES. .....................................................
Page
v i i
1
1
5
7 10 13 15 18 23
27
28 33
33 43
47
47 48 52 55 59
59
59
64
_ - OL
67
V
LIST OF TABLES
No . . 2.1 2.2
2.3
3.1
3.2 3.3 3.4
3.5
3.6
3.7
1.1
2.1 2.2 2.3 2.4 2.5
3.1 3.2
Title
Candidate Alternative Technologies ........................... Preliminary Energy Alternatives .............................. Units of Measure for Cost Analysis ........................... Nominal Values in Cost Analysis .............................. Economic Work Sheet .......................................... Qualitative Indicators and Units of Measure of Public and Occupational Health and Safety Impacts per Unit Output ....... Components of the Comparative Assessment of Health and Safety Impacts ............................................... Units of Measure for Water Resource Requirements and Impacts of Energy Systems .................................... Units of Measure for Regional Availability and Quality of Water for Energy Production ..................................
Scenario Characteristics of Energy Demand and Supply .........
LIST OF FIGURES
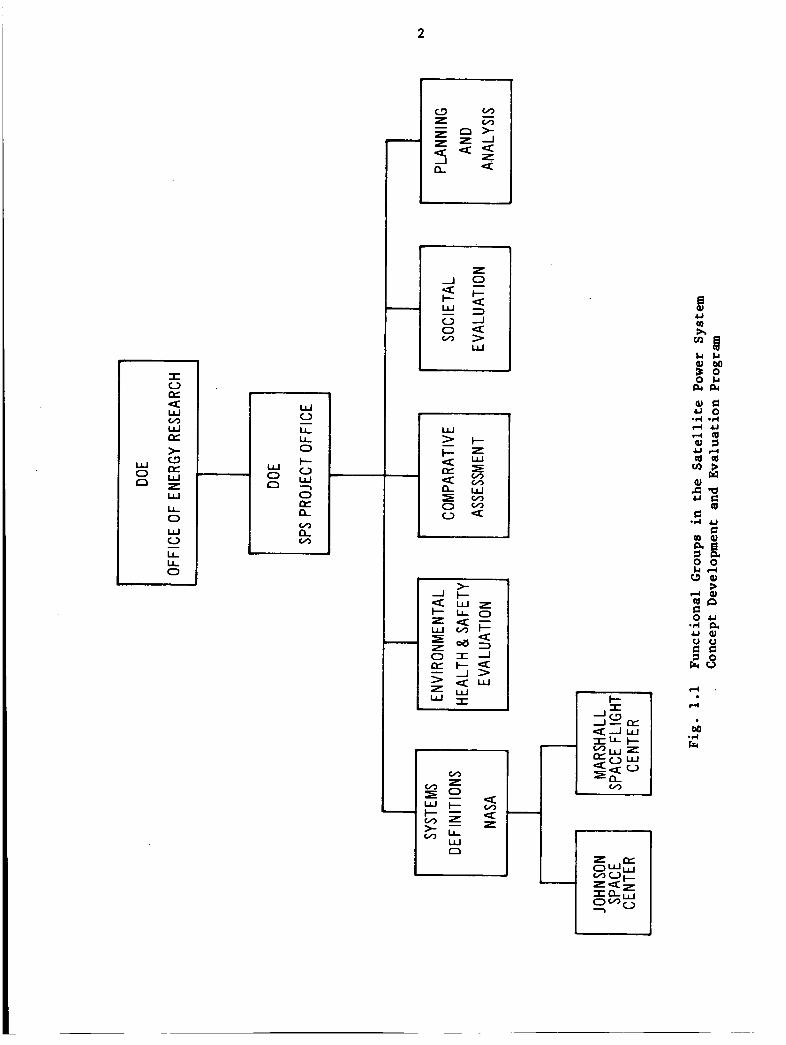
Functional Groups in the Satellite Power System Concept Development and Evaluation Program ........................... Analytic Sequence for the Comparative Assessment ............. Classification System of the Comparative Assessment .......... Energy System Characterization ............................... Side-by-Side Analysis ........................................ Alternative Futures Analysis ................................. Flowchart for General Methodology ........................... Flowchart for Cost and Value Calculation ....................
3.3 Pathway of Energy Activities. Impacts. and Welfare Effects ...
vi
Page
11 11 21 31
34 35
38
40
57
57
2 6
8 14 17 20
28
29 45
PREFACE
The work reported here was sponsored by DOE and NASA as part of their
Satellite Power System Concept Development and Evaluation Prograb (SPS-CDEP).
One of the objectives of that program is the comparison of the technological,
environmental, societal, and economic aspects of the SPS with those of selec-
ted alternative energy systems after the year 2000.
.
The purpose of this work was the formulation of a methodology for the
comparative assessment portion of the SPS-CDEP. This methodology is an
initial prescription, rather than a program plan, for performing a comparative
assessment and is expected to be further developed and refined as the assess-
ment proceeds. The scope of this methodology does not include any specific
program limitations; therefore, program planners must consider time and budgetary constraints when using this work as a reference.
The results of the comparative assessment are to be used as input to
the overall evaluation program. That program will provide information to
the energy policy data base, which will be used in decision making on post- 1980 research and development programs for the SPS.
vii

1
ABSTRACT
\ L This report is a description of the ini t ial method-
ology for the Comparative A88e88ment of the satel l i te Pmer System C w e p t Development and Evaluation Program of IASA and LWE. Incltdsd are s tudy objectives, issue identification, units of m&asurment~ methods, and data bases. The eneryy sYst4m8 c o n c e d are the satell i te power system, seveml coat technotogies, geothermal energy, f i s s i o n , fusion, terrestriat solar systsas, Md mean themi! energy cave+ swn. //GUideline8 are suggestsd for the characteriaation of thzse qptms, &&+&?side mult yeis, a1 t e m t i v e f uttcres mralysis, and integrcrtia and aggregation of data. IIlze bulk
the technical, economic, environmental, societal, and insti- tUtioM1 issues surpounding the deployment of the setected energy techno~ogies.
Of t h i s e $8 a d e S C ? V @ b h Of the ?Nethods f O P -8e88i?l9
1 INTRODUCTION
The purpose of the Satellite Power System Concept Development and
Evaluation Program (SPS-CDEP) is to gather information that will reduce
uncertainty and clarify decision making regarding the continued development of a satellite power system technology after fiscal year 1980. The SPS evalua-
tion program is divided into five functions (Fig. 1.1): 1) systems defini- tion, 2) evaluation of the environmental, health, and safety factors of the
SPS, 3) evaluation of societal issues, 4) a comparative assessment (CAI of
alternative energy systems, and 5) planning and analysis. The objectives
of these functional categories are as follows:
0 Systems Definition: Produce a reference SPS concept for the assessment of technical possibility, environmental and social acceptability, and economic viability.
Environmental Assessment: Determine the potential impact of the SPS on the environment and on the health and safety of the SPS workers and the general public.
0 Societal Assessment: Determine the international, insti- tutional, resource, and other impacts that might inhibit or constrain the deployment of SPS technology.
0 Comparative Assessment: Compare the SPS with selected near-term and advanced energy technologies at the time of implementation (2000).
*Satellite Power System (SPS) Concept Development and Evaluation Program Plan, July 1977-August 1980, National Aeronautics and Space Administration and U.S. Department of Energy (February 1978).
2
v) W a
LL 0 W
LL LL 0
u e
a U Q )
d i
d
3
0 Planning and Analysis: Provide proper direction to the overall SPS-CDEP or to any of its parts.
The environmental, societal, and comparative assessments of the SPS-CDEP will
provide feedback to the systems definition activity, to assist'in the develop- ment of a more viable SPS concept.
Comparative Assessment
The comparative assessment has been divided into four parts:
1.
2.
3.
4.
Comparative Methodology: The framework and methods of evaluation are established.
Energy Alternatives Characterization: The terrestrial alternatives are defined in terms of their cost, perfor- mance, and environmental and societal attributes in the post-2000 era.
Comparative Evaluations: The information compiled in the comparative assessment and in other parts of the SPS program is used to evaluate the SPS and other technologies,
Management and Integration: Data from other parts of the assessment are assembled and integrated into a form useful to decision makers.
The major inputs to the comparative assessment are the results of research conducted on systems designs and on the economic, environmental, and
societal aspects of the deployment of the SPS and alternative technologies. The purpose of the comparative assessment is to evaluate and synthesize the
information obtained into a consistent format useful for making comparisons between future energy systems.
The results of the comparative assessment will be incorporated into a data base used in policy formulation. To ensure the usefulness of program outputs, several reviews of intermediate and final outputs by experts external
to the program have been planned,
Comparative Methodology
The comparative methodology must perform the following functions:
1) establish a framework of assessment information that incorporates different comparative viewpoints, 2) develop a classification system in which the environmental, social, and economic issues can be grouped into meaningful categories for the decision maker, 3) identify the units of measure that are
4
used to compare the environmental, social, and economic issues, 4 ) establish
quantitative and qualitative strategies (approaches, methods, models) of data
collection and analysis for an issue assessment, and 5) identify sources of data for the comparative assessment. Published and unpublished sources of
information, computerized data bases, and assessments already performed on alternative technologies will be used to form a data base that will serve as a
traceable reference point for all comparisons.
The next section describes the four stages of the assessment framework (technology characterization, side-by-side assessment analyses, alternative futures analyses, and assessment integration) and the selection of energy
alternatives and issues. Section 3 contains a detailed description of the comparative issues to be studied in the assessment and the units of measure that could be used for comparing these issues. In addition, methods of data collection and analysis and the sources of data for this assessment are
discussed. Because it is an initial attempt at a general methodological framework for the comparative assessment and because it will be modified as it is used, this methodology may not reflect the same understanding of the issues as that which will finally result from the assessment activities.
2 ASSESSMENT FRAMEWORK
The purpose of this section is to describe the comparative framework
for assessing the technical possibility, economic viability, and social and
environmental acceptability of the alternative energy systems and of the SPS at the time of its implementation.
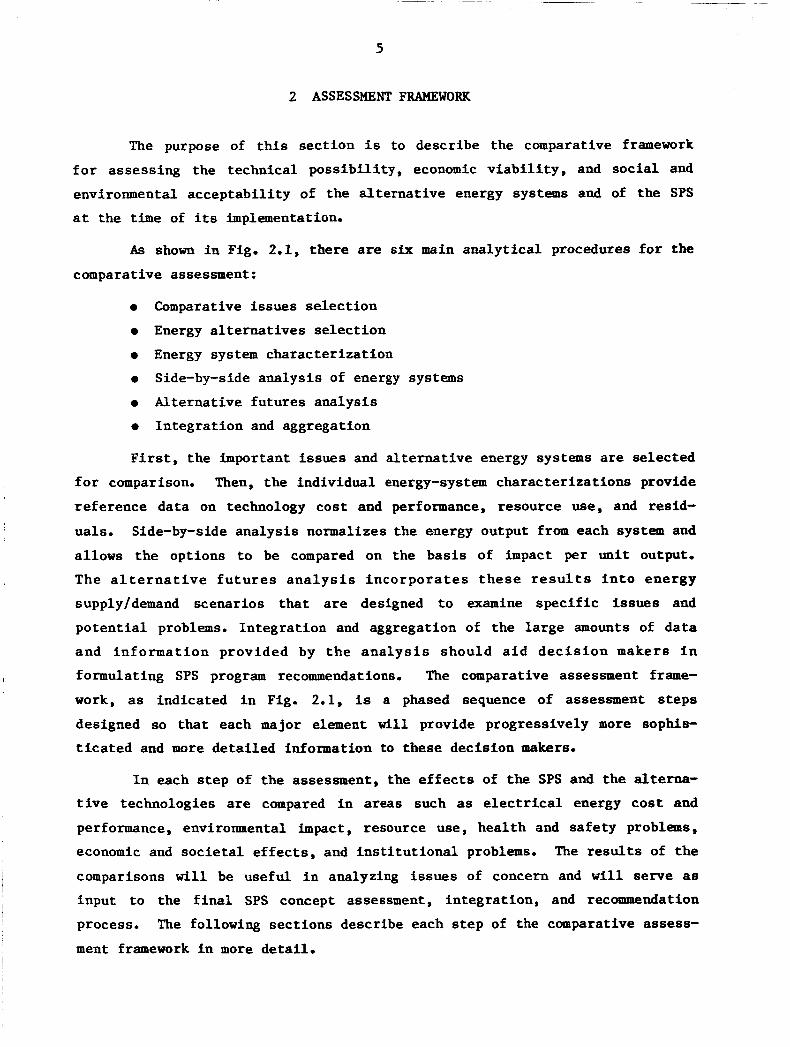
As shown in Fig. 2.1, there are s ix main analytical procedures for the
comparative assessment:
0 Comparative issues selection
0 Energy alternatives selection
0 Energy system characterization
0
0 Alternative futures analysis
0 Integration and aggregation
Side-by-side analysis of energy systems
First, the important issues and alternative energy systems are selected
for comparison. Then, the individual energy-system characterizations provide
reference data on technology cost and performance, resource use, and resid-
uals. Side-by-side analysis normalizes the energy output from each system and
allows the options to be compared on the basis of impact per unit output.
The alternative futures analysis incorporates these results into energy
supply/demand scenarios that are designed to examine specific issues and
potential problems. Integration and aggregation of the large amounts of data
and information provided by the analysis should aid decision makers in
formulating SPS program recommendations. The comparative assessment frame-
work, as indicated in Fig. 2.1, is a phased sequence of assessment steps
designed so that each major element will provide progressively more sophis-
ticated and more detailed information to these decision makers.
In each step of the assessment, the effects of the SPS and the alterna- tive technologies are compared in areas such as electrical energy cost and
performance, environmental impact, resource use, health and safety problems, economic and societal effects, and institutional problems. The results of the
comparisons will be useful in analyzing issues of concern and will serve as
input to the final SPS concept assessment, integration, and recommendation
process.
ment framework in more detail.
The following sections describe each step of the comparative assess-
6
w
t
0 0
7
2.1 SELECTION OF COMPARATIVE ISSUES
Significant issues arising from the deployment of SPS and the alterna-
tive terrestrial power systems are identified and described in the process of
comparative issues selection. The issues selected for the comparative
assessment must not only be general enough to accommodate differences among
the alternative technologies, but also specific enough to be truly ccmunen-
surable. For example, among the energy systems being compared, the SPSl alone
entails microwave power transmission.* The interaction of the microwave beam with the atmosphere may cause atmospheric heating, %Mcl?, in turn, could
cause climatological problems or interfere with electromagnetically sensitive
systems (e.g. , communications transmitters/receivers) . In addition, disper- sion or scattering of the beam could result in public or occupational health and safety problems. However, since microwave energy is not a feature of any
of the alternatives that might be selected for comparison with SPS, the issues
cannot be described simply along the lines of microwave problems. Therefore,
the approach taken here is to define comparative issues in terms of the
stakeholder concerns, that is, climate, welfare, and health and safety issues.
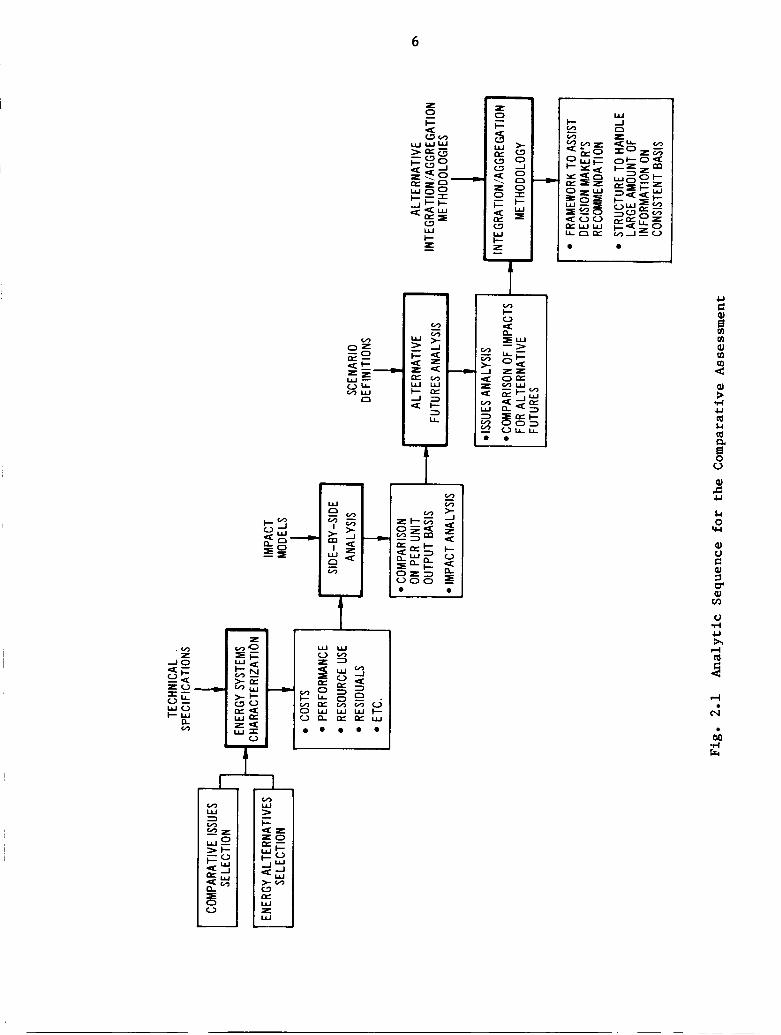
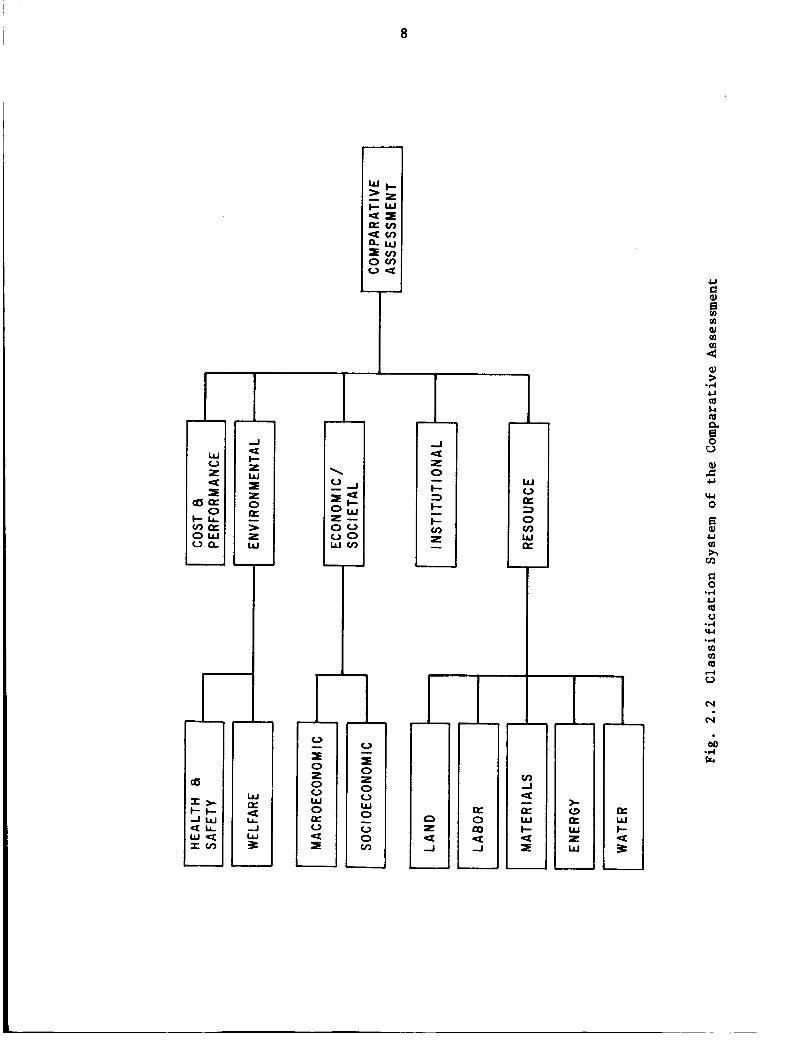
Figure 2.2 illustrates the classification system that was devised for
comparing technologies. The issues are grouped under five major categories:
cost and performance, environmental, economic/societal, resource, and institu-
tional. The definitions of some of these categories are unique to this
methodology and therefore should not be confused with definitions reported
elsewhere. The relative importance of each of these issue areas is not clear
at this point. As the assessment proceeds, some issues may be eliminated on the basis of relative unimportance, unavailability of data, or overlap with
other issue areas.
The issues grouped under cost and performance concern the cost of construction, operation, and maintenance of an energy system, in terms of both capital costs and of operation and maintenance costs. Included in this group
are system performance issues, e.g., the reliability and overall value of an
alternative technology to the complete energy-supply system.
*The current baseline method for transmitting power from the satellite to earth is via microwave beam.
8
r
L
U C Q)
m m Q) m
a
3 9) 3 .d U Q Fc Q a a 0 u Q)
5 VI 0
a Q) U m h cn
.I4 U (0 u -4 VI *d m m m d V
N
N
ea .d Er
9
Environmental i s sues are divided i n t o two subcategories: those t h a t
d i r e c t l y concern publ ic and occupational hea l th and sa fe ty and those t h a t do
not d i r e c t l y concern these areas. Environmental i s sues not d i r e c t l y r e l a t e d
t o hea l th and sa fe ty dea l with problems such as damage to bui ldings from a i r
pol lu t ion , l o s s of radio-frequency communication due t o microwave in t e r f e r -
eace, changes i n land values resu l t ing f r o 2 deployment of an energy tech-
nology, and crop damage due t o c l imatological changes. t
The i s sues grouped under hea l th and s a f e t y are subdivided i n t o those
concerning pubi ic hea i th and safe ty and those concerning occupationai health
and safety. Health bas i ca l ly r e f e r s t o chronic problems, whereas s a f e t y
r e f e r s t o more a c u t e problems such as a c c i d e n t s , s p i l l s , and unexpected
releases of hazardous pol lutants . For the SPS, occupational concerns include
the e f f e c t s of prolonged labor i n geosynchronous e a r t h o r b i t (GEO) and t h e
s a f e l i m i t s f o r such a c t i v i t y , the r i sks of large-scale space construct ion,
and the e f f e c t s of Van Allen b e l t radiat ion; occupational concerns f o r o ther
technologies include accidents during mining, mi l l ing , construct ion, and
operation. Publ ic hea l th and sa fe ty i ssues a r i s i n g from deployment of the SPS
are l a r g e l y associated with the e f f e c t s of short-term and long-term exposure
t o low-power densi ty of microwave energy, The i s sues of f u e l t r anspor t a t ion
acc idents , and pol lu tan t and pa r t i cu la t e emissions are mainly assoc ia ted with
f o s s i l f u e l systems, whereas the e f f e c t s of rad ioac t ive waste and the t h r e a t
of subversive ac t ions are associated with nuclear systems.
I
t
I
The category of economic/societal i s sues i s divided i n t o two pa r t s :
macroeconomic and socioeconomic e f fec ts , The deployment of energy technol-
og ies w i l l result i n socioeconomic e f f e c t s (e.g., temporary and permanent
s h i f t s i n population, near-term and long-term serv ices , and employment oppor-
t u n i t i e s ) , The macroeconomic subcategory concerns na t iona l economic issues
( l i k e balance of t rade , e f f e c t on the gross na t iona l product, and c a p i t a l
demands), I n s t i t u t i o n a l comparisons deal with the e f f e c t s of ex i s t ing i n s t i -
- t u t ions on the deployment of a technology ( regula tory impacts), t h e i n s t i t u -
t i o n a l changes r e su l t i ng from t h e deployment of a technology (e.g., new labor
u n i o n s , new t r a i n i n g programs) , and i n t e r n a t i o n a l c o n s i d e r a t i o n s (e.g.,
fo re ign regula t ion and par t ic ipa t ion) . The resource category includes f i v e
subcategories: land, labor , materials, energy, and water. Here, key concerns
inc lude resource l i m i t s , production l i m i t s , degree of fore ign dependency, and
need f o r new s k i l l e d labor.
10
2.2 SELECTION OF ENERGY ALTERNATIVES
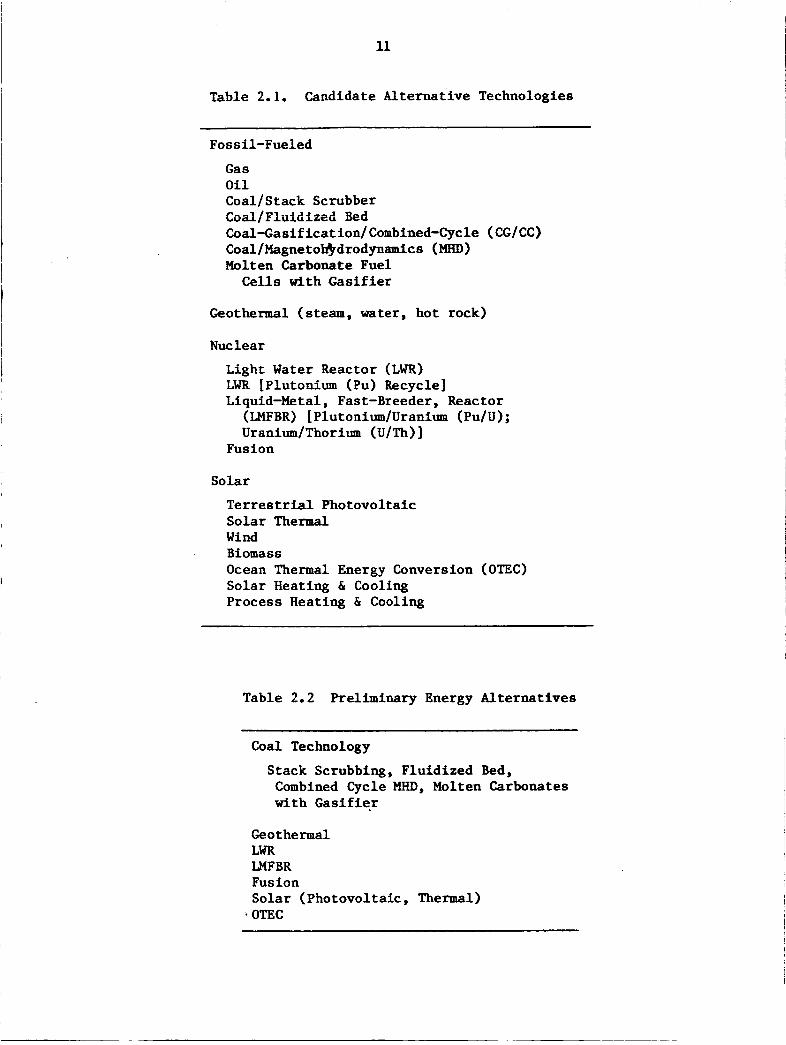
A l a rge number of technologies ( l i s t e d i n Table 2.1), including seven
f o s s i l options, t h r e e geothermal options, f i v e nuclear technologies, and f i v e
s o l a r technologies, were i n i t i a l l y considered f o r s e l e c t i o n as a l t e r n a t i v e s t o
the SPS. The following cr i ter ia were used t o a r r i v e a t t he reduced l i s t of
energy a l t e r n a t i v e s shown i n Table 2.2:
The l is t must be kept t o a minimum because t h e systems selected w i l l be s tudied i n d e t a i l i n the energy charac- t e r i z a t i o n s t e p (consequently, r ep resen ta t ive systems from major technology areas were chosen).
Energy output must be i n the form of e l e c t r i c i t y .
Commercial a v a i l a b i l i t y s h o u l d be p o s s i b l e a f t e r t h e year 2000.
The technology must have t h e c a p a b i l i t y f o r base load operation.
The technology must have an a v a i l a b l e source of f u e l f o r many years.
Design information on the technology must be avai lable .
These cri teria allow the inc lus ion of cu r ren t ly used technologies t h a t
have improved performance s ince t h e i r o r i g i n a l deployment, as w e l l as the
s e l e c t i o n of new technologies t h a t are being developed o r technologies t h a t
are st i l l a t the conceptual s t age ( those f o r which l i t t l e engineering design
information e x i s t s ) . Note t h a t t h e s e l e c t i o n of a l t e r n a t i v e s t h a t l a c k a
complete design may cause d i f f i c u l t i e s i n performing the comparative assess-
ment; thus , some technologies may have t o be excluded a t a la ter d a t e on the
b a s i s of inadequate data.
This preliminary l i s t of energy a l t e r n a t i v e s groups the technologies
i n t o seven areas. Several methods of producing e l e c t r i c i t y from coal combus-
t i o n are included under coa l technology. Each of these methods i s an improve-
ment over conventional coa l combustion environmentally, economically, o r
technical ly . These methods w i l l t he re fo re be grouped as one a l t e r n a t i v e t o
t h e SPS with seve ra l options i n terms of environmental, t echn ica l , o r economic
performance. Due t o l imi t ed f u e l resources and the f a c t t h a t no new gas- o r
o i l - f i r e d p lan ts are planned, gas and o i l have been eliminated as sources of
s u b s t a n t i a l q u a n t i t i e s of e l e c t r i c i t y i n the post-2000 era.
11
Table 2.1. Candidate Alternat ive Technologies
~ ~
Fossil-Fueled
G a s O i l Coal/Stack Scrubber Coal/Fluidizeb Bed Coal-Gasification/Combined-Cycle (CG/CC) Coal/Magneto€$rdrodynamics (MHD) Molten Carbonate Fuel
C e l l s with Gasifier
Geothermal (steam, water, hot rock)
Nuclear
Light Water Reactor (LWR) LWR [Plutonium (Pu) Recycle] Liquid-Metal, Fast-Breeder, Reactor
(LMFBR) [Plutonium/Uranirrm (Pu/U) ; Uranium/Thorium (U/Th)l
Fusion
Solar
Terrestrial Photovoltaic Solar Thermal Wind Biomass Ocean Thermal Energy Conversion (OTEC) Solar Heating & Cooling Process Heating & Cooling
~ ~ ~ ~ ~ ~ ~~~~
Table 2.2 Preliminary Energy Al te rna t ives
Coal Technology
Stack Scrubbing, Fluidized Bed, Combined Cycle MHD, Molten Carbonates with Gas i f ie r
Geothermal LWR LMFBR Fusion Solar (Photovoltaic, Thermal) OTEC
12
The second a l t e r n a t i v e t o the SPS i s the hot rock concept of geothermal
energy. Geothermal steam and hot water energy were eliminated as electrical
energy sources because i n the post-2000 era they w i l l be too small t o compete
with t h e other cen t r a l - s t a t ion a l t e r n a t i v e s of e lectr ical generation. (How-
ever , these geothermal concepts may s t i l l be included i n t h e energy supply
p i c tu re , as w i l l be discussed later.) The a v a i l a b i l i t y of a hot rock geother-
m a l design and proper i d e n t i f i c a t i o n of enyironmental, s o c i e t a l , t echn ica l ,
and economic i s sues may make i t d i f f i c u l t t o properly compare t h i s a l t e r n a t i v e
with the SPS, but i t is included i n the l i s t of preliminary a l t e r n a t i v e s a t
t h i s t i m e . There is a strong p o s s i b i l i t y that hot rock geothermal energy w i l l
be a s i g n i f i c a n t energy source on a regional basis.
Because of d i f f e r e n t resource demands and environmental problems,
two sys tems of nuclear f i s s i o n were se l ec t ed f o r t he assessment: l i g h t water
r e a c t o r s (LWR) and liquid-metal, fast-breeder r eac to r s (LMFBR). Plutonium
recycle w i l l be considered as an option i n the LWR a l t e r n a t i v e . Several LMFBR
opt ions may be included i n order t o assess the t echn ica l , economic, environ-
mental, and s o c i e t a l v i a b i l i t y of t h i s technology.
Fusion, which has several p o t e n t i a l concepts, was chosen as a sepa ra t e
a l t e rna t ive . The l ack of a design and i n s u f f i c i e n t i d e n t i f i c a t i o n of t h e
environmental, s o c i e t a l , t echn ica l , and economic performance of t h i s a l t e rna -
t i v e may exclude i t from the comparative assessment a t a l a t e r date. However,
i t would be wrong t o exclude fusion from the comparative assessment s ince i t
i s p o t e n t i a l l y a huge source of energy.
Two d i r e c t s o l a r o p t i o n s s h o u l d be c o n s i d e r e d i n t h e p r e l i m i n a r y
assessment: photovoltaic systems and thermal systems. Since SPS i s a c e n t r a l
s t a t i o n , baseload type of system, t h e preliminary comparison should be t o a
c e n t r a l s t a t i o n , s o l a r a l t e r n a t i v e ; however, later assessments could include a
comparison t o a d i s t r i b u t e d s o l a r technology.
The seventh energy a l t e r n a t i v e t o the SPS comprises ocean thermal
energy conve r s ion sys tems (OTEC). Although t h i s t y p e of technology h a s
l i m i t e d geographic a p p l i c a t i o n , i t n o n e t h e l e s s c a n become a s i g n i f i c a n t
baseload energy source.
13
2.3 ENERGY SYSTEM CHARACTERIZATION
Following the selection of energy alternatives and the preliminary
selection of comparative issues, the energy system characterizations will provide the basis for the comparative analysis. The objective of energy system characterization is to define and describe reference energy systems that are the principal alternatives to the SPS. The data for these charac-
terizations will be assembled according to the following criteria:
0 Characterizations should use readily available informa- tion.
0 Characterizations should be performed and documented by experts.
0 Each technology characterization should be internally consistent.
0 The set of characterizations should display overall consistency and facilitate comparisons with the SPS concept.
0 Characterizations should be comprehensive enough to allow adequate evaluation of issues (failing this cri- terion, a candidate technology may have to be dropped from consideration at a later date).
0 Characterizations should include the areas of uncertainty in the technology definition.
0 Characterizations should be credible to the stakeholder.
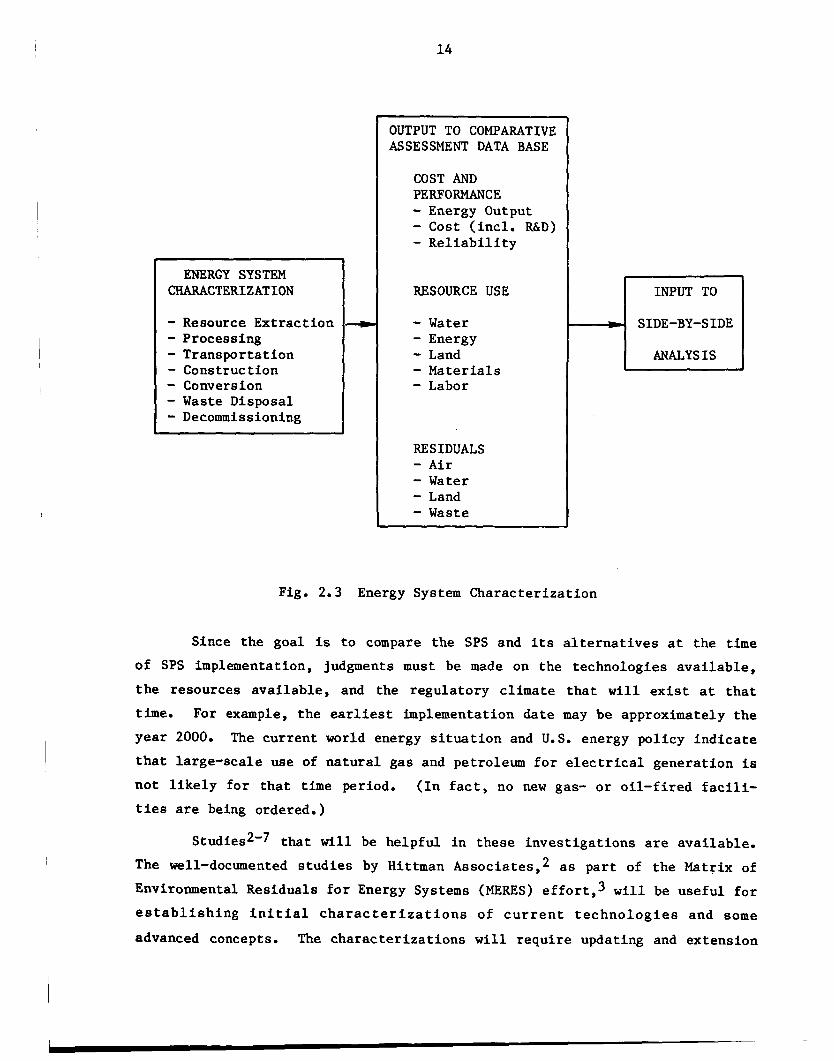
Figure.2.3 illustrates the relationship of the energy characterizations and the comparative assessment data base. Characterizations consider the complete fuel cycle (i.e., resource extraction, processing, transportation,
conversion, and waste disposal) and quantify the effects of the energy supply systems in terms of cost and performance, resource use (land, water, labor, materials) and residuals of the energy systems.
The characterizations of the reference energy systems generally will not attempt to carry the impact analysis beyond quantification of residuals, resource use, and performance. For example, the expected emission of sulfur
dioxide from a coal-fired power plant with scrubbers will be specified. However, the ambient concentrations and associated health effects will not be part of the characterization but will be included in the side-by-side analysis to the extent that they have been quantified. Many of these non-cost issues
will be included in the analysis on a qualitative basis.
14
ENERGY SYSTEM CHARACTERIZATION
- Resource Extraction - Processing - Transportation - Construction - Conversion - Waste Disposal - Decommissioning
-m
OUTPUT TO COMPARATIVE ASSESSMENT DATA BASE
COST AND PERFORMANCE - Energy Output - Cost (incl. R&D) - Reliability
RESOURCE USE
- Water - Energy - Land - Materials - Labor
RESIDUALS - Air - Water - Land - Waste
INPUT TO
SIDE-BY -S IDE I ANALYSIS
Fig. 2.3 Energy System Characterization
Since the goal is to compare the SPS and its alternatives at the time of SPS implementation, judgments must be made on the technologies available, the resources available, and the regulatory climate that will exist at that time. For example, the earliest implementation date may be approximately the year 2000. The current world energy situation and U.S. energy policy indicate that large-scale use of natural gas and petroleum for electrical generation is not likely for that time period. (In fact, no new gas- or oil-fired facili-
ties are being ordered.)
St~dies~'~ that will be helpful in these investigations are available. The well-documented studies by Hittman Associates,2 as part of the Matrix of Environmental Residuals for Energy Systems (MERES) eff~rt,~ will be useful for establishing initial characterizations of current technologies and some
advanced concepts. The characterizations will require updating and extension
15
to the post-2000 conditions that are established as part of the comparison. A Jet Propulsion Laboratory (JPL) report5 and its supporting studies will help to establish the conditions and special considerations associated with an SPS
comparison, NASA reference designs, and environmental and societal assess- ments will be used where appropriate. A MITRE report is available for cow sideration of solar technologies, There are many assessments that provide
characterization information, but many of these are internally inconsistent
or do not provide the basis for consistent traceable reference designs or both,
The output from the characterization phase will serve as basic informa- tion for decision makers, However, without further analysis, this data is of
, limited value, since it will describe alternative systems of varying capaci- ties and will merely list the technology characteristics, resource require-
ments, and residuals, Therefore, the characterization output will also be used as the foundation for the side-by-side analysis.
2.4 SIDE-BY-SIDE ANALYSIS OF ENERGY SYSTEMS
The objective of the side-by-side analysis is t o perform an initial I
I comparison of the SPS and its alternatives. This comparison is the initial analytical step of the comparative assessment, and it consists mainly of a listing of information (some detailed, some summary) for each of the energy
systems. Information categories cover technical, economic, environmental, health and safety, and societal issues.
A side-by-side comparison tabulates normalized effects on a consistent
basis for inspection and analysis by decision makers and researchers. Al- though some elements of side-by-side analysis have been performed for conven-
tional technologies on a comprehensive basis, these have limited applicability to the SPS Concept Development and Evaluation Program because the SPS com-
parative assessment must be concerned with SPS competitors and thus must analyze technologies and expected conditions after 2000 rather than conven-
tional technologies and current or near-term conditions.
The side-by-side comparison will provide useful but somewhat limited information for decision makers, Although it uses a nondynamic approach (not accounting for changing conditions), the comparative assessment includes
specific assumptions about certain exogenous economic variables such as GNP
I
I
16
growth rates and discount rates, and assumptions about i n t e r n a t i o n a l t r ade and
p o l i t i c a l r e l a t ionsh ips , e.g., t he absence of major wars and the maintenance
of world t rade s t a b i l i t y . Side-by-side comparison provides a r e l a t i v e l i s t i n g
of impacts and e f f e c t s of a l t e r n a t i v e technologies and does not display f o r
the decision maker the regional s e n s i t i v i t y of technology impacts o r t h e
s y n e r g i s t i c e f f e c t s of environmental impacts. The side-by-side a n a l y s i s
approach w i l l assume t h a t those va r i ab le s are "exogenous" and w i l l not attempt
t o account f o r t h e i r interdependence with the technologies under study through
t h e use of a feedback process. ' This " p a r t i a l equilibrium" approach i s , i n
r e a l i t y , incorrect but methodologically use fu l because of t he qua l i t y of t h e
d a t a a v a i l a b l e f o r t h e comparisons and t h e p r e c i s i o n of t h e compara t ive
methods.
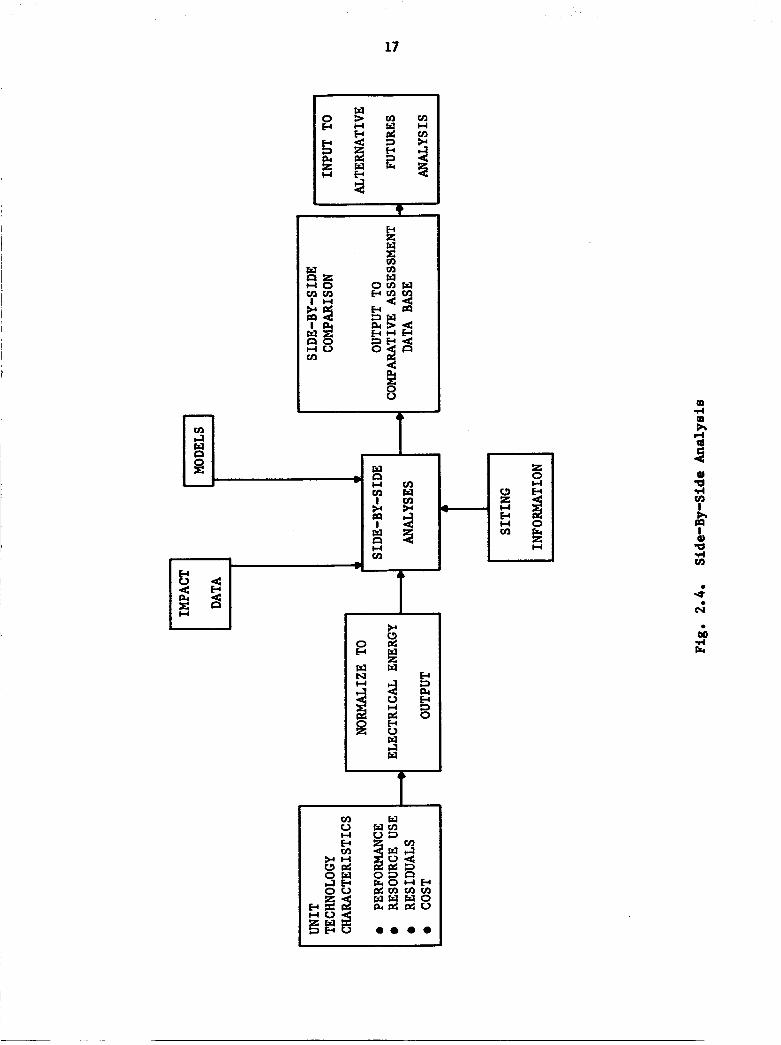
As shown i n Fig. 2.4, t he side-by-side a n a l y s i s accepts t he system
c h a r a c t e r i s t i c s of each a l t e r n a t i v e technology as input. Since technologies
d i f f e r i n c h a r a c t e r i s t i c s such as nominal capaci ty , r e l i a b i l i t y , geographic
a c c e p t a b i l i t y , and e l e c t r i c a l output, t he f i r s t s t e p of t he side-by-side
comparison is t o normalize* t h e system c h a r a c t e r i s t i c s t o some comparable
parameter, usually e lec t r ica l energy output. A proper normalization r e s u l t s
i n technology desc r ip t ions t h a t are i n t e r n a l l y and thermodynamically consis-
t e n t , y e t which represent the f u t u r e u n i t capaci ty mixes.
The second s t e p of t he side-by-side comparison a p p l i e s impact da t a ,
models , and o t h e r a v a i l a b l e t o o l s t o d e r i v e t h e i m p a c t s a s s o c i a t e d w i t h
t h e deployment of the technologies. For example, t he technology character iza-
t i o n and normalization tasks provide basic c h a r a c t e r i s t i c s such as employment
and job type requirements f o r t he construct ion and operat ion of t he a l t e rna -
t i v e technologies. This second comparison extends the a n a l y s i s t o the appli-
c a t i o n of accident r a t e s and s e v e r i t y , by job type, t o der ive and t a b u l a t e t he
normalized person-days l o s t due t o accidents and injuries.** The side-by-side
*The term "normalized comparison" simply means t h a t quan t i f i ab le impacts are expressed i n terms of amount per u n i t output of e lectr ical energy, l i k e a megawatt-year (We-yr). Thus, a 5-MWe system t h a t provides energy contin- uously f o r one year and expels 1,000 tons of po l lu t an t t o the environment i n t h e p r o c e s s w i l l b e c h a r a c t e r i z e d by t h e normal ized amount of 200 ( o r 1,000 f 5) tons of po l lu t an t p e r MWe-yr of e lectr ical energy; s i m i l a r l y , a 1-MWe plant t h a t operates f o r half a year and produces 50 tons of po l lu t an t i s assigned the normalized amount of 100 ( o r 50 f %) tons of po l lu t an t per MWe-yr .
**It i s d i f f i c u l t t o de r ive t h i s f i g u r e f o r e x i s t i n g , well-known technologies; extrapolat ion t o f u t u r e technologies i s even more d i f f i c u l t .
17
T
18
comparison ,will use the resource requirements, e.g., dollars, labor, and
materials, characterized for each technology, and arrive at the relative attractiveness of the alternatives with regard to these characteristics. Similarly, the normalized environmental residuals as characterized for each
technology may be modeled for some typical or standard site using available dispersion and pollutant transport models. Local air quality, water quality, and environmental consequences can be derived and tabulated for each tech- nology on the basis of modeling assumptions and population distribution used in the definition of a standard site.
2.5 ALTERNATIVE FUTURES ANALYSIS
The alternative futures analysis will place the results of the energy
characterizations and side-by-side analysis into a dynamic framework that
considers different plausible future conditions. The analysis will help
address impacts that may have synergistic characteristics or that result from
multiple plant effects. The results of the analysis will improve under- standing of the effects of SPS implementation in key issue areas. An integral part of the analysis is the creation of scenarios (statements about future
supply, demand, lifestyle, resources, regulations, etc.), which serve as
inputs to the alternative futures analysis. These scenarios, coupled with impact models, are used to describe possible alternative futures in terms of parameters such as economic indicators, population, environmental conditions, and institutional responses.
The primary objectives of the alternative futures analysis are:
0 To provide a comparison of the impacts for different
0 To focus on the effects of SPS with respect to selected
0 To provide input for the assessment and integration
future economic, social, and political conditions.
key issues that will require decisions.
process and the final comparative assessment.
The following criteria have been selected to guide the choice of
scenarios :
0 A small number of scenarios should be used, and they should be feasible and representative.
0 They must illustrate a suitably large range of alter- natives, policies, and economic and social conditions (or at least those of major concern or interest).
19
0 They should also organize the results of preceding assessment activities (namely, discussion of issues and interpretation of energy system characterizations).
e They should highlight or identify major categories of issues for further analysis.
0 Uncertainty should be included in a consistent and efficient manner.
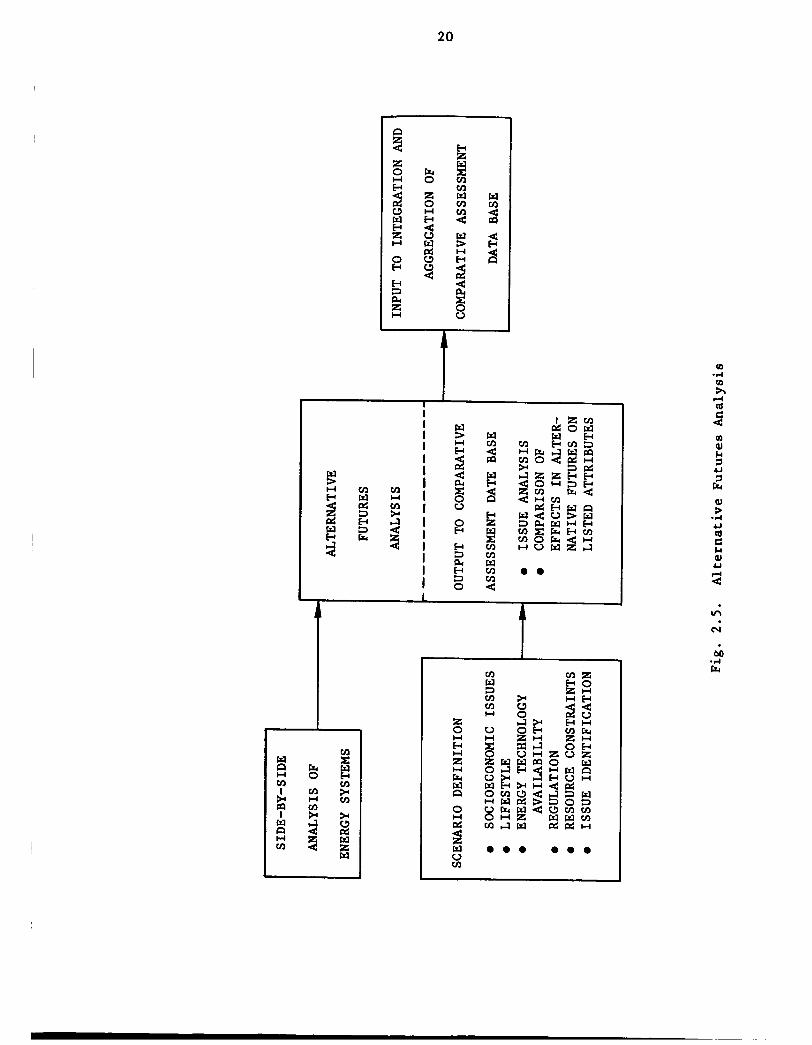
The alternative futures analysis will indicate the effect of SPS implementa-
tion on several variables (Pig. 2.5), at different levels of aggregation,
e-3. a
Level of Aggregation
0 World-wide
0 National
0 Regional
0 Local
Variable
C02 production Plutonium production
Resource use Balance of payments
Air quality Land use
Employment Ecology
It must be emphasized that the scenarios are not predictions or fore-
casts but rather are indications of the conditions that would be expected to
exist given the judgments concerning scenario definitions and technology
availability. This approach is useful
present in estimating future conditions.
conditions . Parameter
0 Socioeconomic conditions
0 Lifestyle
0 Energy technology
0 Regulation
availability
0 Environment
0 Resource constraints
0 Issue identification
because of the large uncertainties
The following are examples of such
Examples of Uncertainty
Population, GNP Impact of conservation on energy demand, decentralized society
LMFBR, coal gasification, terrestrial solar Pollutant emission standards, ambient air quality standards
C02, waste heat effects
Uranium, oil and gas, wind, construction materials
What issues will be especially important in decison making on future energy technology?
20
k 0 z H s 5 z 3 c3
t I ‘ 8
W rn 0 .
2
2
H H z H k W m
s
s
2 9 W
OD .d
OD h
N
2 1
!
I
Uncer ta in t ies i n these major parameters can be examined using the scenario
approach t h a t i s based on c o n s i s t e n t sets of assumpt ions and p o l i c i e s .
A scenario does not have a probabi l i ty of occurrence associated with i t but
ins tead addresses key issues and, perhaps, revea ls o ther problems that result
from that f e a s i b l e future.
The s c e n a r i o approach has proven v a l u a b l e i n p rev ious s t u d i e s of
a l t e r n a t i v e energy futures.*'ll Indeed, one of the bene f i t s of the approach
i s s t i m u l a t i o n of d i s c u s s i o n , such a s accompanied s t u d i e s by Xeadows e t al, , I 2 a d L4Vin,Ei13J4
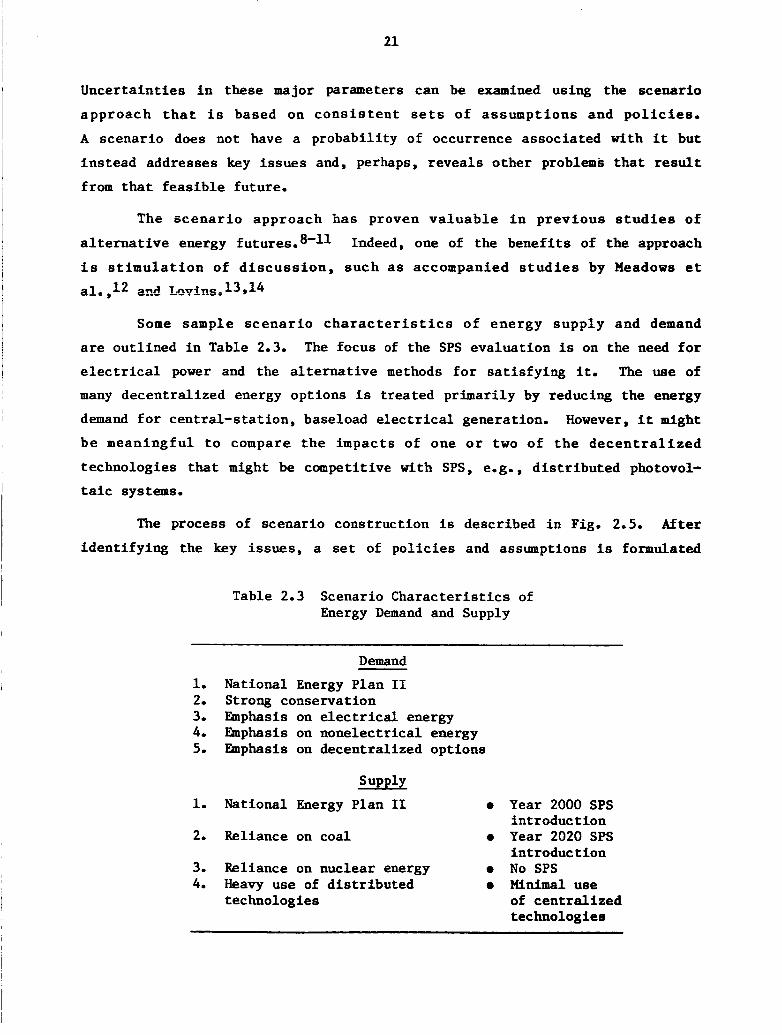
Some sample s c e n a r i o c h a r a c t e r i s t i c s of energy supp ly and demand
a r e out l ined i n Table 2.3. The focus of the SPS evaluat ion is on the need f o r
electrical power and the a l t e r n a t i v e methods for sa t i s fy ing it. The use of
many decentral ized energy opt ions i s t rea ted pr imari ly by reducing the energy
demand f o r cent ra l - s ta t ion , baseload electrical generation. However, i t might
be meaningfu l t o compare t h e i m p a c t s of one o r two of t h e d e c e n t r a l i z e d
technologies that might be competitive with SPS, e.g., d i s t r i b u t e d photovol-
taic systems.
The process of scenario construct ion i s described i n Fig. 2.5. After
iden t i fy ing the key i ssues , a set of po l i c i e s and assumptions is formulated
Table 2.3 Scenario Charac te r i s t ics of Energy Demand and Supply
Demand
1. National Energy Plan I1 2. Strong conservation 3. Emphasis on electrical energy 4. Emphasis on nonelec t r ica l energy 5. Emphasis on decentralized options
Supply 1. National Energy Plan I1 0
2. Reliance on coal 0
3. Reliance on nuclear energy 0
4. Heavy use of d i s t r ibu ted 0
technologies
Year 2000 SPS in t roduct ion Year 2020 SPS in t roduct ion No SPS Minimal use of cent ra l ized technologies
22
concerning the top ic s indicated i n the f igure . A l imi t ed number of scenarios
can generally i l l u s t r a t e the range of a l t e r n a t i v e s without overwhelming the
a n a l y s t s and decis ion makers with data. A c l a s s i f i c a t i o n system such as t h a t
shown i n Fig. 2.2 a i d s i n organizing the r e s u l t s and i n reminding use r s and
ana lys t s of t he major categories f o r comparison and the perceived key issues.
A f t e r t h e s p e c i f i c a t i o n of t h e i s s u e s , p o l i c i e s , and assumpt ions
t h a t def ine the scenario, computer models can be used f o r scenario simulation.
This i n f ac t becomes the ob jec t ive of t h e modeling e f f o r t : t o provide the
l i n k between t h e s c e n a r i o s and what t h e y might mean i n t h e f u t u r e . The
computer models provide an e f f i c i e n t method f o r quantifying energy supply-
demand options and generating a cons i s t en t set of scenario e f f e c t s . The
choice of models is governed by the following c r i te r ia :
0 They must be thoroughly t e s t e d and proven r e l i a b l e .
0 They must be r ead i ly ava i l ab le and w e l l documented ( t h i s p r e c l u d e s t h e u s e of models t h a t are p r o p r i e t a r y i n any manner).
0 They must be cos t e f f i c i e n t .
One of the f i r s t s t eps i n the modeling e f f o r t i s t o e s t a b l i s h consis-
tency between the economic and energy c h a r a c t e r i s t i c s of t he scenario. Models
reviewed by the Energy Modeling Forum,15 including PILOT and DRI-Brookhaven
models, would provide the desired framework and consistency. Another model
t h a t treats s u b s t i t u t i o n between c a p i t a l , l abor , and energy and i n t e g r a t e s
long-term supply and demand project ions i s the ETA-MACRO Model.16 Following
s e l e c t i o n and use of one of these models t h a t treat energy-economic in t e r -
ac t ions , other models may prove useful f o r developing the associated impacts
f o r each scenario, as measured by the ca t egor i e s of e f f e c t s shown i n Fig.
2.2.
The scenario r e s u l t s are not always easy t o determine o r understand
because of complexities such as the following:
0 In t e rdependenc ie s among economic, t e c h n o l o g i c a l , and e c o l o g i c a l c h a r a c t e r i s t i c s , as mentioned p r e v i o u s l y .
0 D i f f i c u l t i e s i n iden t i fy ing c o s t s and b e n e f i t s and i n associat ing them with s p e c i f i c groups.
0 Uncertainties i n scenario parameters and changes over t i m e .
23
0 D i f f i c u l t i e s i n communicating t h i s complex material. 1 7 0 Differen t preference s t ruc tu res f o r scenario evaluation.
The multiple-objective nature of the problem is evident from Fig. 2.2. The t r adeof f s between costs , hea l th and sa fe ty , land use, air qua l i ty , re- source use, and jobs are d i f f i c u l t t o make and na tu ra l ly are subject t o many
d i f f e r e n t conclusions. Thus, t h e scenarios can serve not only as ind ica t ions
of t he e f f e c t s of deployment on the l i s t e d a t t r i b u t e s but also as input t o
a framework f o r evaluation. Aggregation techniques, which are addressed in
t h e next sec t ion , can - k i p address some of t he complexities.
2.6 ASSESSMENT INTEGRATION AND AGGREGATION TECHNIQUES
The purpose of this s e c t i o n is to introduce a number of techniques that
are p o t e n t i a l l y usefu l i n the in t eg ra t ion and aggregation s t e p of t h e com- p a r a t i v e assessment. The techniques are descr ibed i n order of sophis t icat ion.
The objec t ive of a l l these in t eg ra t ion and aggregation techniques is t o
analyze the data assembled f o r the camparison of SPS with o ther f u t u r e terres- t r i a l technologies. A f u r t h e r ob jec t ive is a t least t o begin reducing the
complexity of the decisiorroaaking problem, which is aggravated by the l a r g e
amounts of supporting data f o r each technology, by var ious techniques that are a l s o descr ibed (e.g., by performing some formal t r adeof f s o r s e t t i n g p r i o r i -
ties f o r object ives) .
There are a number of criteria that can be used i n deciding t h e appro-
p r i a t e l e v e l a t which t o conduct such i n t e g r a t i o n and aggregation analysis .
Some of these criteria are the following:
0
0 The number of alternatives desired.
0 The manner i n which viewpoints over p r i o r i t i e s are deter- mined, represented, and incorporated i n t o the decision-
The number of measurement ca tegor ies desired.
making process.
0 U s e of uncertainty.
a Degree of inc lus ion of i n t e r a c t i o n s and p r i o r i t i e s .
0 S u i t a b i l i t y f o r d e s c r i b i n g dynamic conditions.
between va r i ab le s
and t ime-varying
24
The degree of appropriateness of any of t hese cri teria is y e t t o be
determined and depends c r i t i c a l l y on the degree of q u a n t i f i c a t i o n of va r i ab le s
and e f f e c t s t h a t is achievable throughout t h e e n t i r e program. The i n t e n t of
t h i s program is t o be adaptive and thus t o u t i l i z e a l l of t hese techniques as
t h e need arises.
S i x t e c h n i q u e s were i n v e s t i g a t e d i n a n i n i t i a l p e r i o d of s tudy:*
engineer ing economics, cost-r isk-benefi t ana lys i s , matr ix methods, scoring
models, venture ana lys i s , and dec is ion ana lys i s . Each of these o f f e r s a
unique ana ly t i ca l capab i l i t y t h a t may be usefu l i n the context of a l a r g e
comparison such a s t h a t planned f o r SPS.
Since the cos t of generat ing e l e c t r i c power is a s i g n i f i c a n t f a c t o r i n
t h i s evaluat ion, var ious methods f o r performing economic analyses were stu-
Popular keywords i n the open l i t e r a t u r e a r e "engineering econo-
m i c s " and "conventional finance." I n such economic analyses , concepts of
economic e f f i c i ency , e.g., present value, r e t u r n on investment, and payback,
are important. These techniques are highly popular and w e l l su i t ed f o r a id ing
dec i s ion making i n s i t u a t i o n s where only the cos t v a r i a b l e is important.
However, because of concerns about environmental and s o c i a l e f f e c t s and
t echn ica l f e a s i b i l i t y , i n addi t ion t o economics, t he re is a need t o go beyond
t h e scope of such cos t analyses. Cost-risk-benef i t analysis21-*3 t r ad i -
t i o n a l l y promises t o e x p l i c i t l y include e x t e r n a l i t i e s . This is t y p i c a l l y done
by expressing ex te rna l cos t s and i n t e r n a l c o s t s on a common, usua l ly monetary,
scale. This can be r a t h e r d i f f i c u l t , e s p e c i a l l y when s e t t i n g a d o l l a r f i g u r e
on the value of a human l i f e , but i t does produce a s i n g l e number, which
r e f l e c t s the r e l a t i v e value of each a l t e r n a t i v e , f o r t he p a r t i c u l a r set of
va lue judgments chosen.
Matrix methods24 avoid t h i s problem by s imply i den t i fy ing a l l t he
i t e m s of conce rn , whether t h e y a re i n t e r n a l o r e x t e r n a l , q u a l i t a t i v e o r
quan t i t a t ive , quan t i f i ab le o r nonquantifiable. The i t e m s are arranged i n
mat r ix form t o c l e a r l y i d e n t i f y a l t e r n a t i v e s and dec is ion criteria. Some
a n a l y s t s then augment these with index numbers t o ind ica t e : (1) the environ-
*The references c i t e d i n t h i s s ec t ion genera l ly provide both t h e o r e t i c a l i n f o r m a t i o n and examples of a p p l i c a t i o n s t h a t s h o u l d be of u s e t o t h e reader i n t e re s t ed i n fu r the r d e t a i l .
25
ment or population affected, and (2) the level or seriousness of the impact.
The decision maker must intuitively weigh the output of a matrix method to
make a decision if no single alternative dominates the rest. Scoring
m0dels~5-27 again push for a bottom line number by assigning weights to each
of the factors in the analysis. Then, taking the impact level or a qualita-
tive index describing the level, and multiplying by the scoring weight, an
overall score can be determined for each alternative. This score may be used
to rank the desirability of the alternatives.
All of the foregoing methods treat uncertainty, a 'key coneern in the
SPS evaluation, in a "brute force" fashion. It is usual to perform a sen-
sitivity analysis to test the effects of extreme outcomes. Venture analy-
sis 2 8 ~ 2 9 explicitly includes uncertainty in the analysis by creating a probability distribution for the factors of interest. Usually only one factor
is considered, generally an economic efficiency variable. Assuming that one
factor is sufficient for comparing alternatives, the decision maker must
be able to discern the most preferred probability distribution out of a group
of probability distributions. Inclusion of more than one factor, especially
externalities like environmental or societal interests, is difficult if not
impossible.
Decision analysis3*32 also treats uncertainty in an explicit manner
while providing the methodology for including any number of factors in the
analysis and performing trade-offs between factors. Combining the notions of
aggregation from scoring models and uncertainty from venture analysis with the
notion of careful quantification of preferences for individual factors results
in a powerful method for evaluating complex preference structures. An impor-
tant example is risk aversion, which is preference for high-probability
but low-impact-level risks over low-probability but high-impact-level risks,
even though both have the same expected level of impact.
All of these methods are potentially useful for varying degrees or
depth of analysis of key issues, comparison of impacts, and evaluation of
various scenarios relating to SPS and other future terrestrial alternatives. The degree of appropriateness of any of these methods is yet to be determined
and depends critically on the degree of quantification of variables and
effects that is achievable throughout the entire program.

27
3 METHODOLOGY FOR COMPARATIVE ASSESSMENT
Th e of this section is to describe specific techniques that may
be used to perform the assessments within each of the comparative issue categories illustrated in Fig. 2.2 and described in Section 2.2. The method-
ology described here provides a general assessment framework and does not take
into account the realities of future energy program constraints. The methods
described here concern the issue selection and energy system characterization
steps and will supply modeled impact data for the integration and aggregation
s teps . The following format is used to describe each comparative issue assess-
ment: (1) a preliminary description of each issue, including definitions and objectives, (2) an identification of the units of measure for comparing these issues, (3) a description of available methods (Le., approaches, models,
paradigms) to obtain issue comparisons in the selected units of measure,
and (4) a preliminary identification of potential data bases (e.g., data,
previous assessments, and characterizations).
Final selection of the methods used will be guided by the particular
objectives and needs of each issue area. However, the following generaliza-
tions can be made:
0 Evaluations must produce outputs that are useful to
0 Data and evaluation results must be well documented,
0 Assessments must be timely.
0 Assessments must meet resource constraints.
policymakers and decision makers.
self-consistent, and traceable.
The general flow of activities involves first a characterization of the
issue and its parameters, and specifying scenario conditions is part of this
first step. Data from the characterization are then used in computational
models that provide some quantification of the issue. Results of such
calculations will be analyzed to provide input for program recommendations.
Figure 3.1 gives a general flowchart of the methodology.
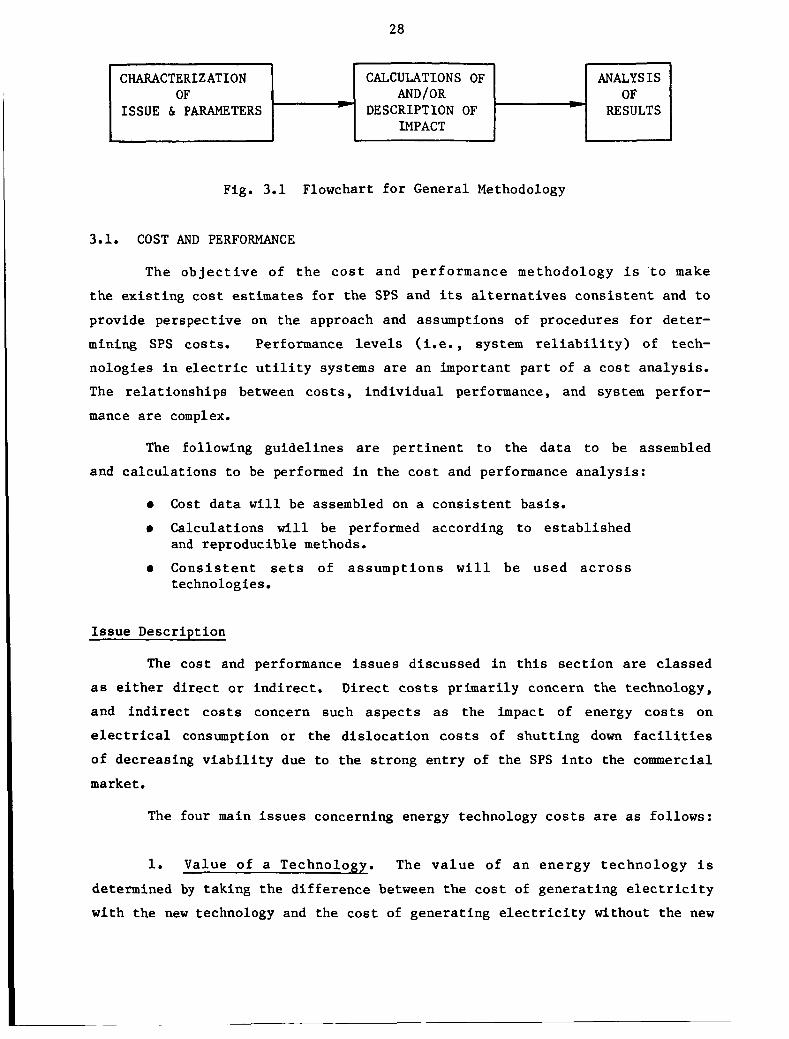
CHARACTERIZATION OF
ISSUE & PARAMETERS - Fig. 3.1 Flowchart for General Methodology
CALCULATIONS OF ANALYSIS AND/OR OF
DESCRIPTION OF * RESULTS IMPACT -
3.1. COST AND PERFORMANCE
The objective of the cost and performance methodology is 'to make
the existing cost estimates for the SPS and its alternatives consistent and to
provide perspective on the approach and assumptions of procedures for deter- mining SPS costs. Performance levels (i.e., system reliability) of tech- nologies in electric utility systems are an important part of a cost analysis. The relationships between costs, individual performance, and system perfor-
mance are complex.
The following guidelines are pertinent to the data to be assembled and calculations to be performed in the cost and performance analysis:
0 Cost data will be assembled on a consistent basis. 0 Calculations will be performed according to established
0 Consistent sets of assumptions will be used across and reproducible methods.
technologies . Issue Description
The cost and performance issues discussed in this section are classed
as either direct or indirect. Direct costs primarily concern the technology, and indirect costs concern such aspects as the impact of energy costs on electrical consumption or the dislocation costs of shutting down facilities of decreasing viability due to the strong entry of the SPS into the commercial market.
The four main issues concerning energy technology costs are as follows:
1. Value of a Technology. The value of an energy technology is
determined by taking the difference between the cost of generating electricity with the new technology and the cost of generating electricity without the new
29
New Technology
Power Demands 1 c Energy Allocat ion
Generating Costs Cost Factors
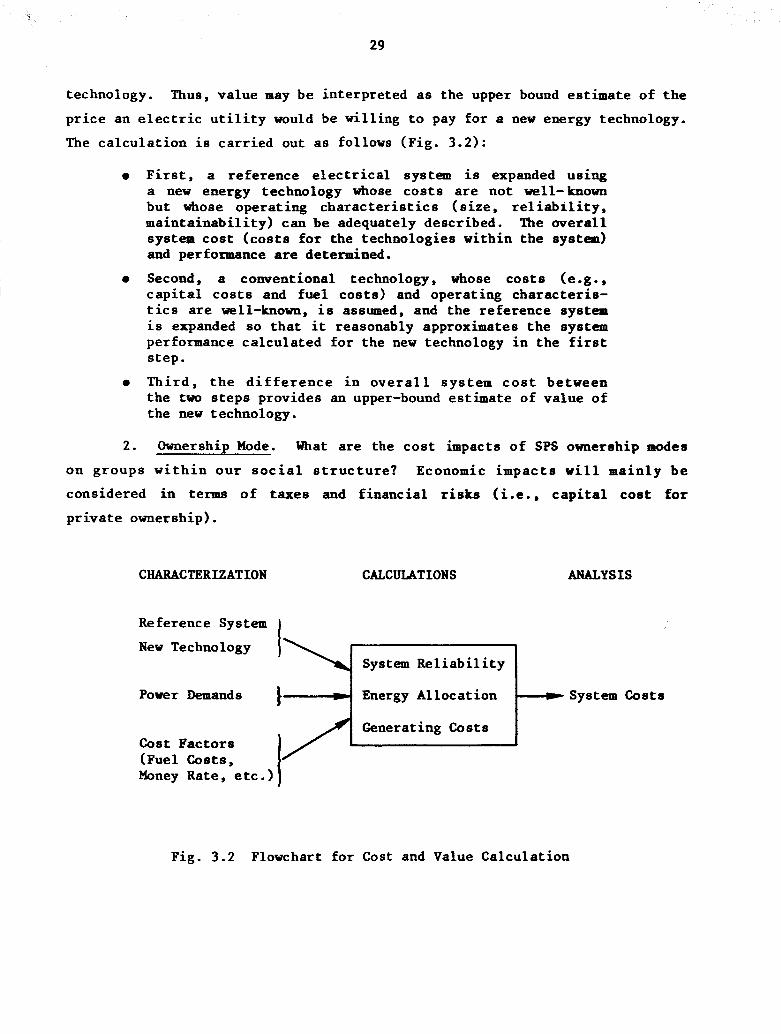
technology. Thus, value may be interpreted as the upper bound estimate of t h e
p r i c e an e l e c t r i c u t i l i t y would be wil l ing t o pay f o r a new energy technology.
The ca lcu la t ion i s car r ied out a s follows (Fig. 3.2):
__t System Costs
e F i r s t , a reference e l e c t r i c a l system i s expanded using a new energy technology whose c o s t s are not well-known but whose operating c h a r a c t e r i s t i c s ( s i z e , r e l i a b i l i t y , main ta inabi l i ty ) can be adequately described. The ove ra l l system cost ( c o s t s f o r the technologies within the system) and performance are determined.
e Second, a conventional technology, whose cos t s (e.g., c a p i t a l c o s t s and fue l cos t s ) and operating character is- t i c s are well-known, i s assumed, and the reference system i s expanded so t h a t it reasonably approximates t h e system performance ca lcu la ted f o r the new technology i n the f i r s t s tep.
e Thi rd , t h e d i f f e r e n c e i n o v e r a l l s y s t e m c o s t between the two s t eps provides an upper-bound est imate of value of the new technology.
2. Ownership Mode. What are t h e c o s t impacts of SPS ownership modes
on groups w i t h i n o u r s o c i a l s t r u c t u r e ? Economic impacts w i l l main ly be considered in terms of taxes and f inanc ia l r i s k s ( i .e. , c a p i t a l cost f o r
p r iva t e ownership).
CHARACTERIZATION CALCULATIONS ANALYSIS
Fig. 3.2 Flowchart fo r Cost and Value Calculat ion
30
3. R&D Costs. What are the costs of future research and development
for SPS and selected alternative technologies? If these costs were arbitrar- ily charged to electrical generation over a plant construction interval, e.g., 30 years, would they significantly reduce the value of the technology to utilities?
4 . Cost Uncertainties. What are the cost uncertainties? How can they
be incorporated into the analysis in a meaningful and helpful manner? The goal is to produce bounds on cost estimates and to identify critical cost factors.
The following are the two main issues concerning performance of alter-
native technologies:
1. System Performance. What are the impacts of adding many units of a
specific technology to utility systems on the mix of generation plant types, fuel requirements, and general utility operation?
2, Location and Technology Application. What are the regional vari- ables of deployment of the various technologies, e,g., siting requirements,
location of fuel or heat sources, and transmission distances?
Units Of Measure
The unit of measure most frequently used in evaluating cost issues is
the cost of electricity, expressed in mills/kWh. This unit is used because
the product (energy) is measured on a unit cost basis by the consumer, who sees the monthly or bimonthly bill in dollars but views specific electricity
costs in terms of cents/kWh. In some instances, the electric bill shows a demand charge in terms of dollars per kilowatt plus an energy charge per kilowatt hour. For these reasons, analysis of electricity costs for the
various technologies will focus on the mills/kWh at the busbar of the gene-
rating plant. Transmission costs will be included where applicable on an incremental basis, i.e., the added transmission cost that may clearly be
assigned to a technology because of such factors as increased distance of the facility from the load center or the need for special transmission lines. All
four cost issues (value of a technology, SPS ownership mode, R&D costs, and cost uncertainties) will mainly be analyzed in mills/kWh. In addition, the
R&D costs (l.e., future costs related to research and development of energy
technology elements) will be expressed in terms of the dollar expenditures
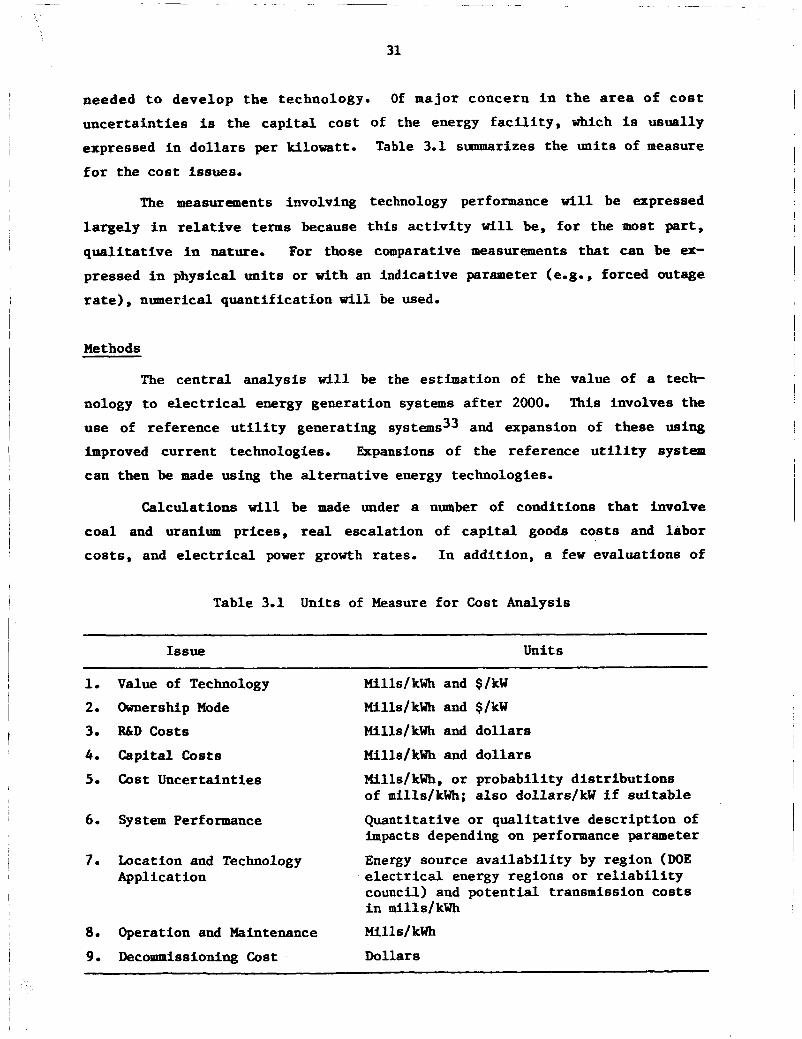
needed t o deve lop t h e technology. Of major concern i n t h e area of c o s t
u n c e r t a i n t i e s is the c a p i t a l cos t of the energy f a c i l i t y , which is usua l ly
expressed i n d o l l a r s per kilowatt . Table 3.1 summarizes the u n i t s of measure
f o r the c o s t issues.
The measurements involving technology performance w i l l be expressed
l a r g e l y i n r e l a t i v e terms because t h i s a c t i v i t y w i l l be, f o r the most part,
q u a l i t a t i v e i n nature. For those comparative measurements t ha t can be ex-
pressed in physical u n i t s or with an i nd ica t ive parameter (e.g., forced outage
r a t e ) , nlrmerical quan t i f i ca t ion will be used.
Methods
The c e n t r a l ana lys i s w i l l be the es t imat ion of t he value of a tech-
nology t o electrical energy generat ion systems a f t e r 2000. This involves the
use of re ference u t i l i t y generating systems33 and expansion of these using
improved cu r ren t technologies. Expansions of the reference u t i l i t y system
can then be made using the a l t e r n a t i v e energy technologies.
Calculat ions w i l l be made under a number of condi t ions that involve
c o a l and u r a n i m pr ices , real e sca l a t ion of c a p i t a l goods c o s t s and labor c o s t s , and e l e c t r i c a l power growth rates. In addi t ion , a few eva lua t ions Qf
I
Issue
Table 3.1 Units of Measure for Cost Analysis
Units
1, Value of Technology
2, Ownership Mode
3. R&D Costs
4. c a p i t a l Costs
5. Cost Uncer ta in t ies
6. System Performance
Mills/kWh and $/kW Mills/kWh and $/kW Mills/kWh and d o l l a r s
Mills/kWh and d o l l a r s
Mills/kWh, o r p robab i l i t y d i s t r i b u t i o n s of mills/kWh; a l s o dollars/kW i f s u i t a b l e
Quant i ta t ive or q u a l i t a t i v e desc r ip t ion of impacts depending on performance parameter
7. Location and Technology Energy source a v a i l a b i l i t y by region (DOE e l e c t r i c a l energy regions or r e l i a b i l i t y council) and p o t e n t i a l transmission c o s t s i n mills/kWh
Application
8. Operation and Maintenance Mills/kWh
9. Decommissioning Cost Dollars
32
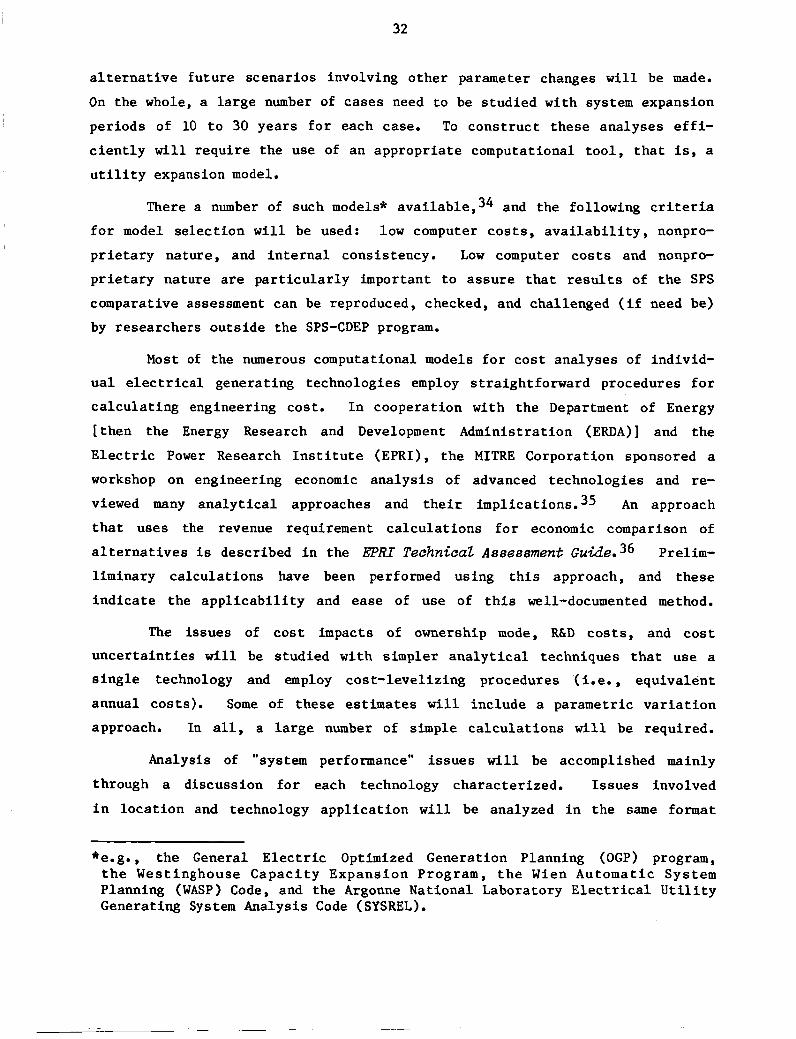
a l t e r n a t i v e f u t u r e scenarios involving o the r parameter changes w i l l be made.
On the whole, a l a rge number of cases need t o be s tudied with system expansion
per iods of 10 t o 30 years f o r each case. To cons t ruc t these analyses e f f i -
c i e n t l y w i l l r equi re the use of an appropr ia te computational t o o l , t h a t is, a
u t i l i t y expansion model.
There a number of such models* ava i lab le ,34 and the following criteria
f o r model s e l ec t ion w i l l be used: low computer c o s t s , a v a i l a b i l i t y , nonpro-
p r i e t a r y nature , and i n t e r n a l consistency. Low computer c o s t s and nonpro-
p r i e t a r y nature a r e p a r t i c u l a r l y important t o a s su re t h a t r e s u l t s of t h e SPS
comparative assessment can be reproduced, checked, and challenged (if need be)
by researchers ou ts ide the SPS-CDEP program.
Most of the numerous computational models f o r c o s t analyses of individ-
u a l e l e c t r i c a l generating technologies employ s t ra ight forward procedures f o r
ca l cu la t ing engineering cost . I n cooperation with the Department of Energy
[ then the Energy Research and Development Administration (ERDA)] and the
E l e c t r i c Power Research I n s t i t u t e (EPRI), t he MITRE Corporation sponsored a
workshop on engineering economic ana lys i s of advanced technologies and re-
viewed many a n a l y t i c a l approaches and t h e i r implicat ions. 35 An approach
t h a t uses the revenue requirement ca l cu la t ions f o r economic comparison of
a l t e r n a t i v e s is described i n the EPRI Technical Assessment Guide. 36 Pre l im-
l iminary ca lcu la t ions have been performed using t h i s approach, and these
i n d i c a t e the a p p l i c a b i l i t y and ease of use of t h i s well-documented method.
The i ssues of c o s t impacts of ownership mode, R&D cos t s , and c o s t
unce r t a in t i e s w i l l be s tud ied with simpler a n a l y t i c a l techniques t h a t use a
s i n g l e technology and employ cos t - leve l iz ing procedures (i.e., equiva len t
annual costs) . Some of these estimates w i l l include a parametric v a r i a t i o n
approach. In al l , a l a r g e number of simple ca l cu la t ions w i l l be required.
Analysis of "system performance" i s sues w i l l be accomplished mainly
through a discussion f o r each technology character ized. I ssues involved
i n loca t ion and technology app l i ca t ion w i l l be analyzed i n the same format
*e.g., t he General E l e c t r i c Optimized Generation Planning (OGP) program, the Westinghouse Capac i ty Expans ion Program, t h e Wien Automatic System Planning (WASP) Code, and the Argonne National Laboratory E l e c t r i c a l U t i l i t y Generating System Analysis Code (SYSREL).
33
for each technology. These evaluations will be both qualitative and quan-
titative in nature.
Data Bases
A guideline of this assessment is that the data required should be
readily avaifdle to groups that may wish to make their own analyses. This
cannot be cumpletely guaranteed, but proprietary data cannot be used because
the traceability requirement that is standard for public assessments would be
jeopaidfzed. Gie tf :he LLiisi activities is CO i d a i t f f y itle recent liisrature
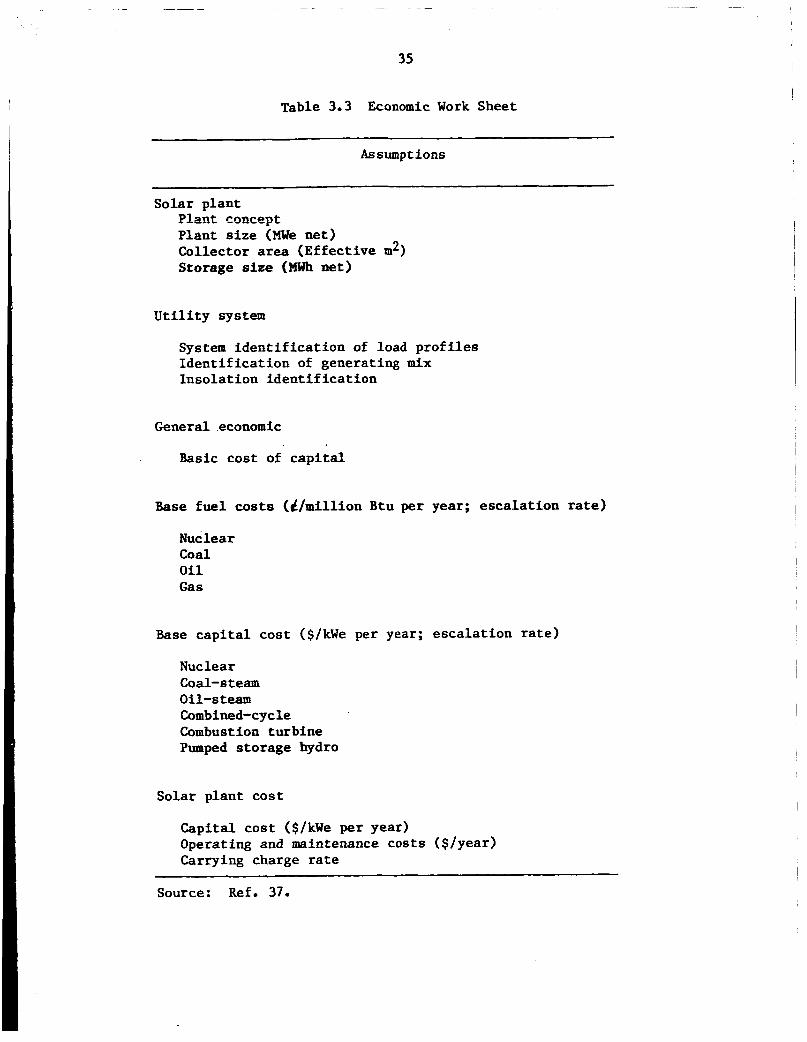
containing cost and performance data. Tables 3.2 and 3.3 contain some nominal
input data and some assumptions, respectively, from a methodology report on solar-thermal power plant studies. 37 These examples are typical of the
input required for the SPS study,
In order to promote uniformity in their evaluations, EPRI has issued a
technical assessment guide,36 that will serve as a source of data where
applicable. The data are both national and regional in character.
MITRE has prepared a nine-volume collection of systems descriptions
and engineering costs7 for the Division of Solar Energy in DOE. These
data support the SPURR model (System for Projecting Utilization of Renewable
Energy Resources) and will form part of the data base for the SPS assessment.
3.2 ENVIRONMENTAL IMPACTS
3.2.1 Health and Safety Effects
The objective of this analysis is to assess the extent of known and
potential public and occupational health and safety impacts due to the SPS and alternative energy technologies.
Issue Description
It is generally accepted that the relative impact on human health and
safety is among the most important considerations in a comparative evaluation
of alternative technologies. The general acceptance of high priority for
health and safety issues does not imply, however, that quantification of such
effects will result in common values for straightforward ranking of systems

34
Table 3.2 Nominal Values in Cost Analysis
Nominal Nominal Inputs Value
~~~~~ ~
Utility Description Data:
System operating lifetime
Annual "other taxes" as a fraction of the capital investment ( CI ) Annual insurance premiums as a fraction of CI
Effective income tax rate Ratio of debt to total capitalization Ratio of common stock to total capitalization Ratio of preferred stock to total capitalization Annual rate of return on debt Annual rate of return on common stock Annual rate of return on preferred stock
General Economic Conditions
Rate of general inflation
Escalation rate for capital costs
Escalation rate for operating costs
Escalation rate for maintenance costs Base year for constant dollars
Nominal Intermediate Outputs
Cost of capital to (and internal rate of return in) a typical utility
Capital recovery factor (8%, 30 years) Typical annualized fixed charge rate
30 years
0.02 0.0025
0.40 0.50
0.40 0.10 1.08 9.12
0.08
0.05 0.05 0.06 0.06 1976
0.08 0.0888 0.1483
Source: Ref. 37.
35
Table 3.3 Economic Work Sheet
Assumptions
Solar p lan t Plant concept P lan t s i z e ( ~ b k n e t ) Col lector area (Effec t ive m2) Storage size (Mwlr net)
U t i l i t y system
System i d e n t i f i c a t i o n of load p r o f i l e s I d e n t i f i c a t i o n of generating mix Inso la t ion i d e n t i f i c a t i o n
General economic
Basic cos t of c a p i t a l
Base f u e l c o s t s (d/mil l ion Btu per year; e sca l a t ion rate)
Nuclear Coal O i l G a s
Base c a p i t a l cos t ($/kWe per year; e sca l a t ion rate)
Nuclear Coal-s team O i l - s team Combined-cycle Combustion turb ine -ped s torage hydro
Solar p lan t cos t
Capi ta l cos t ($/kWe per year) Operating and maintenance costs ($/year) Carrying charge rate
Source: Ref. 37.
36
because energy systems d i f f e r not only i n t h e l e v e l , but a l s o i n the manner i n
which h e a l t h and s a f e t y e f f e c t s a r e i n c u r r e d . These d i f f e r e n c e s a f f e c t
soc i e ty ' s perceptions of "acceptable" hea l th and s a f e t y i m p a c t s and thus
should be preserved i n the analysis . Following are shor t descr ip t ions of
d i f fe rences to be included t o the ex ten t poss ib le with ava i l ab le a n a l y t i c a l
tools .
The f i r s t aspect i n which energy systems d i f f e r w i t h regard t o hea l th
and safe ty i ssues i s impact severi ty . There are a number of quan t i t a t ive
measures of t h e s e v e r i t y of a c c i d e n t s and d i s e a s e . One s t r a i g h t f o r w a r d
approach , which w i l l be used h e r e , i s t o es t imate t h e number of d e a t h s
incurred and the number of person-days lo s t . Nonfatal events span a range of
hea l th impacts from nominal t o permanently d isab l ing , with a corresponding
range of cos t impacts, both emotional and f inanc ia l . These d i f f e r i n g e f f e c t s
can be combined i n t o s ing le u n i t s of measure such as person-days-lost (PDL) i f
p r o d u c t i v i t y i s t h e f a c t o r under c o n s i d e r a t i o n . Where p r a c t i c a l , o t h e r
f a c t o r s such a s emotional impact and publ ic perception of t he impact s eve r i ty
w i l l a l s o be considered.
Energy systems a l s o d i f f e r i n whether they a f f e c t occupational popula-
t i o n s o r g e n e r a l p o p u l a t i o n s o r bo th and i n t h e l e v e l s of such impacts .
Occupational hea l th e f f e c t s from energy technologies are genera l ly character-
i zed by high r i s k t o s m a l l populations, whereas publ ic hea l th e f f e c t s are
genera l ly character ized by r i s k s t h a t are low but a f f e c t l a r g e populations.
Therefore, separate ca tegor ies w i l l be maintained f o r publ ic and occupa-
t i o n a l hea l th impacts.
Impacts due t o accidents and d isease w i l l a l s o be considered. Acci-
dents involve immediate cause-effect r e l a t ionsh ips and are genera l ly per-
ceived as avoidable. A s a r e s u l t , mi t iga t ion procedures t o prevent acci-
dents are r e l a t i v e l y s t ra ightforward, although possibly expensive. Cause-
e f f e c t re la t ionships f o r d i sease a r e much less v i s i b l e and not as immediate.
Latent periods between exposure and response may span years and mask the
o r i g i n a l cause. I n addi t ion , t he range of ind iv idua l responses t o accidents
i s r e l a t i v e l y s m a l l compared t o t h a t f o r disease--there may be s i g n i f i c a n t
d i f f e rences among individual responses t o similar exposures.
37
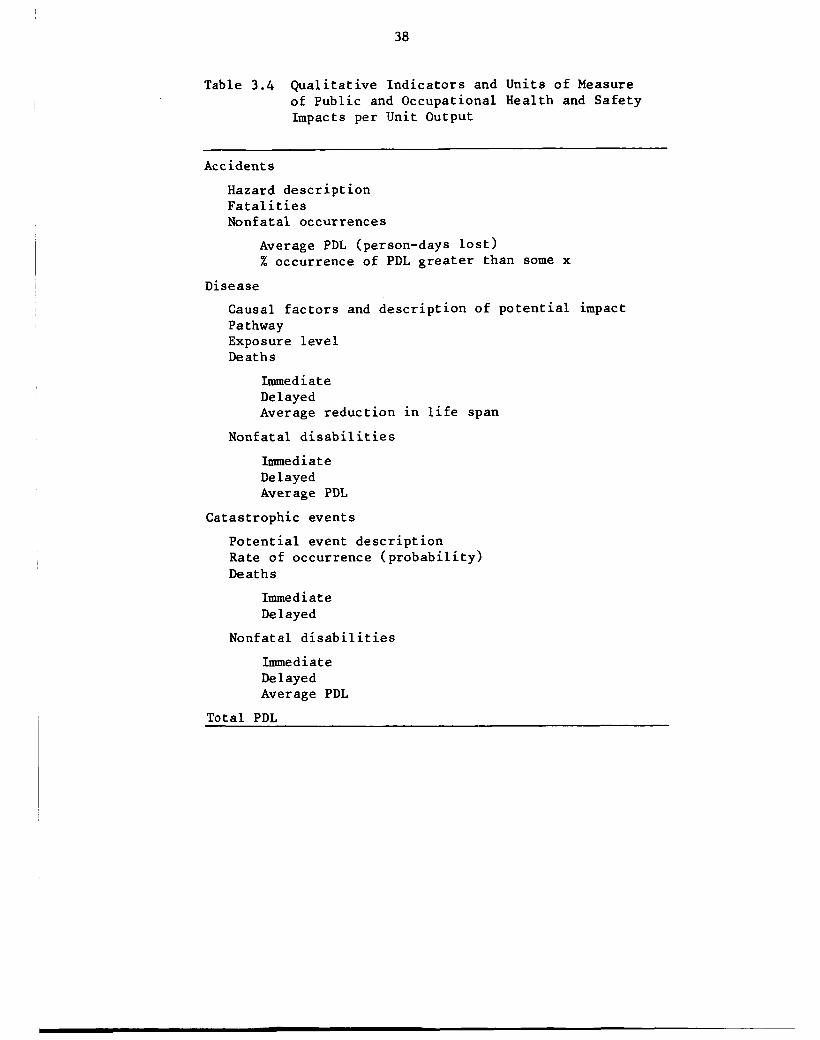
Public and occupational impacts on hea l th and sa fe ty w i l l be compiled
according t o the u n i t s of measure l i s t e d i n Table 3 .4 . Within each of t h e
ca t egor i e s i n that t a b l e (accidents , disease, ca t a s t roph ic events) , t he u n i t s
of measure begin with q u a l i t a t i v e descr ip tors (e.g., accident hazard descrip-
t i o n ) and proceed through progressively more quan t i t a t ive evaluat ion measures
(e.g., percent of accident occurrences resulting i n person-days l o s t g r e a t e r
than some x). This format not only allows d e t a i l e d compilation of impact
estimates f o r energy systems such as conventional coa l and nuclear systems,
f o r which more p rec i se quan t i f i ca t ion i s possible , but a l s o provides f o r
preliminary comparison with advanced technologies, f o r which, i n many in-
s tances , information i s cur ren t ly l imited t o the q u a l i t a t i v e i d e n t i f i c a t i o n of
p o t e n t i a l r i s k s o r hazards.
The ca tegor ies i n Table 3 .4 w i l l be used f o r each energy production
sys tem and a l s o f o r each of t h e major phases of each sys tem (e.g., r a w
t h e e f f e c t s occur i n one event o r a r e spread out over a period of t i m e , i.e.,
whether they are ca tas t rophic o r noncatastrophic. The high v i s i b i l i t y and
p o t e n t i a l magnitude of ca tas t rophic events increase both publ ic awareness and
t h e short-term cos t s of dealing with the e f f e c t s of such events. Catastrophic
e v e n t s a l s o ove r load t h e c a p a c i t i e s of a v a i l a b l e h e a l t h systems. H e a l t h
e f f e c t s from noncatastrophic events a r e more e a s i l y accepted because of t h e i r
chronic nature.
Closely r e l a t e d t o t h e last considerat ion are immediate and delayed
e f f ec t s . Immediate hea l th and s a f e t y e f f e c t s requi re immediate ac t ion (e.g.,
h o s p i t a l i z a t i o n and medical care) and, as such, are more v i s i b l e and more
accura te ly reported than are delayed ef fec ts . Delayed e f f e c t s such as cancer
o r mutation are o f t en " los t" due t o t h e lack of v i s i b l e cause-effect re la t ion-
sh ips , migrating populations, and reporting e r rors . The cos t s of immediate
e f f e c t s must be d e a l t with immediately whereas t h e c o s t s of delayed e f f e c t s
may be considered t o diminish the value of f u t u r e s o c i e t a l contr ibut ions by
impeded energy development and t h e necessi ty f o r developing mit igat ing proce-
dures. As a result, immediate hea l th r i s k s are perceived d i f f e r e n t l y from
delayed h e a l t h risks by both the general publ ic and pol icy makers. Thus, t h e
assessment of the two types of r i s k s w i l l remain separate.
Units of Measure
38
Table 3.4 Qual i ta t ive Indica tors and Units of Measure of Public and Occupational Health and Safety Impacts per Unit Output
Accidents
Hazard descr ip t ion Fat a1 i t ies Nonfatal occurrences
Average PDL (person-days l o s t ) % occurrence of PDL g rea t e r than some x
Disease
Causa l f ac to r s and descr ip t ion of po ten t i a l impact Pathway Exposure leve l Deaths
Immed i a t e De 1 ayed Average reduct ion i n l i f e span
Nonfatal d i s a b i l i t i e s
Immediate Delayed Average PDL
Catastrophic events
Po ten t i a l event descr ip t ion Rate of occurrence (p robab i l i t y ) Deaths
Immediate Delayed
Nonfatal d i s a b i l i t i e s
Immediate Delayed Average PDL
Total PDL
39
material extraction, material processing) , described in the following methods subsection. The quantitative units of measure will be based on some unit of
output energy (e.g., per We). Since many health and safety effects cannot be precisely estimated with current knowledge, it is important that where quanti-
tative estimates are included, an estimate of the uncertainties should also be
given so that premature technology comparisons are avoided and areas for
further study are identified.
The basic study approach (see Table 3.5) is to initially provide, with-
in the consistent framework described in the preceding subsection, largely
qualitative descriptions of the significant health and safety issues for each
of the broad categories of energy alternatives to be considered. Where
readily available, these issue descriptions will be supported by quantitative information; however, the initial issue description will precede the full
development of technology characterizations and will thus be limited in the
degree of quantification possible. Included as part of the issue identifica-
tion will be listings of potential toxic or carcinogenic components within the process streams and effluents; descriptions of potential impact pathways;
pollutant toxicity levels and dose responses, if known; industrial sectors
c, supporting the energy technology; the nature of occupational hazards within
those sectors; and feasible scenarios for occurrence of catastrophic events.
The preliminary issue identification of the health and safety assess-
ment will be an important source of information for defining the methodology
for more quantitative evaluations that will utilize more detailed charac-
terizations of the energy systems and options. The quantification in the second step of the health and safety assessment will be utilized in side-by- side comparisons of generic unit systems. The final steps in the comparative
evaluation will consider the influence of variations in geographic distribu-
tion and level of deployment in the alternative futures analysis and evaluate
the cost and effectiveness of strategies for mitigating the health and
safety impacts of the alternative technologies.
For purposes of uniformity and consistency in the comparative evalu-
ation, the health and safety issue identification for each energy production system will be compiled separately for each of the following components of the

40
Table 3.5 Components of the Comparative Assessment of Health and Safety Impacts
Step I - Issue Identification Preliminary Energy System Definitions (Qualitative)
System
Coal Nuclear Geothermal Solar Terrestrial SPS
Fuel Cycle Raw Material Extraction Material Processing Fabrication Transport at ion Construct ion Operation and Maintenance Waste Disposal and Deactivation
Identify Health and Safety Issues (Qualitative and Quantitative Where Readily Available) Toxic and Carcinogenic Process Components and Residuals Exposure and Impact Pathways Exposure Effects Accident Hazards Description of Potential Catastrophic Events Probability of Catastrophic Event
Step I1 - Side-by-Side Comparative Assessment Detailed Energy System Definitions (Quantitative, from External Study)
Deaths, Person-Days Lost (See Units of Measure, Table 3 . 4 ) Level of Uncertainty Identification of Data Gaps and Research Needs
Step 111 - Alternative Futures Comparative Assessment Alternative Futures Definition (from External Study) Level of Technology Deployment Geographical Distribution
Alternative Futures Health and Safety Impact Severity
Cumulative Effects Regional Differences
Step IV - Impact Mitigation Assessment Options for Health and Safety Impact Mitigation cost Effectiveness
41
f u e l cycle: raw material extract ion; material processing, f ab r i ca t ion , and
t ranspor ta t ion ; construction; operation and maintenance (ObM); waste disposal ;
and deact ivat ion.
Health and sa fe ty impacts due t o raw material ex t rac t ion , including
mining f o r f u e l s such as coa l and uranium as w e l l as f o r component materials s u c h as i r o n , copper , and b a u x i t e , w i l l be e v a l u a t e d , Also i nc luded i s e x t r a c t i o n of materials i n d i r e c t l y used i n the component cons t ruc t ion (e.g, , coal used f o r steel production). The primary impacts on occupational popula-
t i o n s w i l l result from t h e s a f e t y unce r t a in t i e s inherent i n ex t r ac t ion a c t i v i -
t ies, although exposure t o hea l th stresses such as coa l dust w i l l also be i m p 0 r t an t
Material processing includes coal and nuclear f u e l processing, and
production of components such as steel, aluminum, copper, cement, and lumber
necessary f o r f ab r i ca t ion of energy technology s t r u c t u r e s and process machi- nery. Occupational impacts include exposure t o stresses such as m e t a l fumes,
hea t , dus t and noise, as w e l l as unsafe working condi t ions- Publ ic health
risks include exposure t o atmospheric, aquat ic , and s o l i d waste emissions.
H e a l t h and s a f e t y a s p e c t s of the p r o d u c t i o n of steam g e n e r a t o r s ,
photovol ta ic cells, copper tubing, and other process components necessary for each technology w i l l also be considered. Occupational r i s k s w i l l include
exposure t o machinery such as stamping presses and chemical stresses such as exposure t o gallium aluminum arsenide.
Also included w i l l be the t ranspor ta t ion of fue l s , processed materials,
f ab r i ca t ed components, and wastes, from the point a t which they are produced
t o the point a t which they wi l l be u t i l i z e d or disposed of.
The construct ion phase of the energy cycle includes assembly of corn-
ponents at the f a c i l i t y site. Carpenters, plumbers, e l e c t r i c i a n s , and' steel
and concrete workers assembling the plant w i l l be exposed t o major hea l th and
s a f e t y risks. The t ranspor ta t ion of needed r a w materials and process compo-
n e n t s w i l l r e s u l t i n a d d i t i o n a l o c c u p a t i o n a l and p u b l i c h e a l t h impacts ,
Routine O&M procedures w i l l r e s u l t i n occupational h e a l t h and s a f e t y
impacts on plant personnel. The magnitude of e f f e c t s w i l l vary with tech-
nology. P o t e n t i a l l y s i g n i f i c a n t p u b l i c h e a l t h impacts may r e s u l t from
environmental emissions from process waste streams-
42
The health and safety impacts of handling and disposal of waste mater-
ials from energy facilities will differ significantly with each technology.
For example, the occupational and public Ampacts of disposal of nuclear wastes or carcinogens from coal gasification processes will be different from those
due to disposal of photovolatic cells from centralized solar facilities. The category of impact resulting from the latter situation will include
disassembly and disposal or recycling of the decommissioned facilities.
Depending on the nature of the health and safety risks, various techni-
ques will be used for estimation; however, generic approaches will be defined for the following impacts:
0 Occupational accidents and disease 0 Effects of air pollutant inhalation 0 Radiation effects a Transportation effects 0 Catastrophic occurrences
The approaches for estimating each of the listed impacts will be addressed in the following paragraphs. For each component activity of the
fuel cycle, the person-hour labor requirements will be established on the
basis of national productivity and employment statistics. Data on accidents and disease in the industry will then be utilized to determine their rates of occurrence in the energy-related activity. These data can be obtained from
both state and federal sources as well as industrial reports. A primary source of such information is the National Bureau of Labor Statistics, which
routinely gathers and disseminates occupational accident data.
Existing emission rates or emission rates subject to anticipated state or federal standards are utilized to determine air pollutant exposure for a generic population. Dose response functions have been adopted from the
work of S. Morris38 of Brookhaven National Laboratory and will be fitted to a generalized cigarette consumption model.
Radiation releases from all segments of the nuclear fuel cycle are well
documented in the open literature (see bibliography for some key references).
These emissions can be used to estimate the population dose from the cycle. The health effects from low-level radiation can be quantified in terms of
radiation-induced cancer mortality. Such an analysis would include the relative risks of developing specific tumors.
43
For each phase of each energy technology assessment, the tons of material requiring transportation, the travel mode, and the number of miles transported will be developed on the basis of process needs and locational
estimates. These factors will be used in conjunction with train, truck, barge, and pipeline occupational risk statistics, number and severity of grade-
crossing accidents, and other related public health data to determine health and safety risks associated with each energy technology. In the case of SPS, a unique and important area of interest and concern is that surrounding the transport of --* -Lerials to GEC, iiicliidfng the ifs'ks of rocket Pa-mchiqs.
Catastrophic occurrences are primarily related to potential accidents in the nuclear fuel cycle and have been evaluated in detail (Rasmussen re- p0rt).3~ Such occurrences in other technologies are feasible but have not been quantified in similar detail. Preliminary estimates of the likelihood and the magnitude of possible catastrophes will be made through analogy with documented man-made and natural disasters.
Data Bases
As discussed in this section, the basic study strategy is to compile results of previous energy-related health and safety studies into a prelimi- nary comparative framework. Key references and data bases to be critically reviewed and utilized are listed in the bibliography. This listing does not
include anticipated input through discussions with participants of previous or ongoing health and safety studies, which may be particularly significant for
identifying the effects of developing technologies.
3.2.2 Welfare Effects
Several types of environmental degradation effects are not directly
related to public or occupational health and safety. For the purposes of this methodology, these effects will be referred to as environmental welfare effects, since they concern the well-being of individuals. Included in this
group are effects such as materials corrosion, deterioration of aesthetic quality, removal of bodies of water or land from desired uses, and crop damage. The welfare effects associated with an SPS system include radio frequency interference, communications disruption, interference with electro-
magnetic equipment (e.g. electronics, computers, electro-optics), and land use
44
disturbances. Spec i f i ca l ly excluded from t h i s category are e f f e c t s on h e a l t h
and s a f e t y , n a t u r a l b io log ica l systems, resource deple t ion (including d i r e c t
land and water use) , and s o c i a l and economic d i s loca t ions . Conditions fol-
lowing accidents were a l s o not included i n t h i s study.
A t i s sue i n the SPS comparative assessment is how the welfare impacts
associated with SPS deployment compare with those of o the r energy supply
systems. However, f u r t h e r ana lys i s is required t o i d e n t i f y which of t he
impacts a r e t h e most i m p o r t a n t i n t h e d e t e r m i n a t i o n o f w e l f a r e e f f e c t s .
Determination of the environmental welfare e f f e c t s of each energy
technology begins with an examination of t h e va r ious a c t i v i t i e s involved i n
t h e f u e l cycle beginning with ex t r ac t ion of the resource and extending through
the production of e l e c t r i c i t y and deconmissioning. These a c t i v i t i e s r e s u l t i n
environmental impacts such as noise and a i r and water emissions. I n turn , t h e
environmental impacts could r e s u l t i n welfare e f f e c t s such as property damage,
climatic change, i n t e r f e rence with o the r a c t i v i t i e s , and a e s t h e t i c d i s tu r -
bances. Fig. 3 . 3 shows t h i s activity-impact-effect chain used f o r categor-
i z i n g the environmental impacts and welfare e f f e c t s of t he var ious a c t i v i t i e s
i n the f u e l cycle.
Units of Measure
Since the welfare impacts span a wide range of condi t ions, t he re i s
no s i n g l e metric t h a t can be used t o quantify t h e ex ten t of t h e e f f ec t s . I n
some instances (e.g. d e t e r i o r a t i o n of a e s t h e t i c q u a l i t y ) i t is not possible t o
quant i fy the e f f e c t a t a l l . The comparative assessment w i l l , t he re fo re ,
employ a number of measurement u n i t s t o a d d r e s s t h e i s s u e s . For t h o s e
impacts t h a t can be r ead i ly measured by economic c o s t s , t h e metric w i l l be the
d o l l a r value of t h e impact (e.g., c o s t of r e t r o f i t of e l e c t r o n i c equipment t o
e l i m i n a t e i n t e r f e r e n c e , c o s t of p rov id ing a d d i t i o n a l n o i s e i n s u l a t i o n ) .
Other impacts (e.g., land use disturbance) w i l l be measured by t h e number of
persons affected. Qua l i t a t ive evaluat ions of t he ex ten t of impacts (e.g.,
s e v e r e a e s t h e t i c d e g r a d a t i o n ) w i l l a l s o be made. O the r me t r i c s w i l l b e
developed as appropriate.
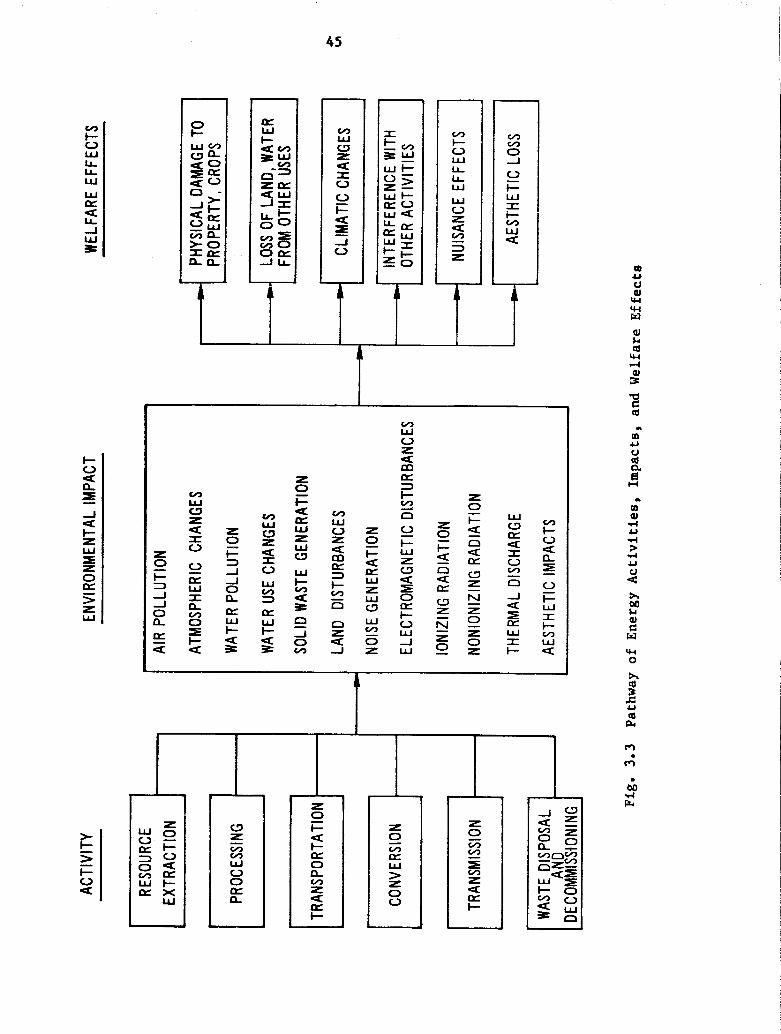
45
2 u W I& LL W
n
l e I
>- > I- 0
I-
a
-
E J 1 u
I ;2 u w LL LL W w 0 z 2 3 z
T z 0
3 J J 0 a w l-
L
i=
a
z 0 I- 4 a W L w c3 w
0 II
v1 W u L a m Lzs 3 I- Y n u I- W z c3 U z 0 Lzs i- u w J w
z 0 I- - 5 n a
f !Y
Lzs c3
z 0 z 0 z
-
46
Methods
The ana lys i s w i l l begin wi th a systematic i den , t i f i ca t ion of the welfare
Impacts w i l l be i d e n t i f i e d impacts of the various energy supply technologies.
f o r the e n t i r e f u e l cycle.
Next, a set of metries w i l l be se l ec t ed f o r es t imat ing t h e ex ten t of
t h e e f f ec t s . Where appropriate , t h e metrics w i l l be grouped f o r t he purpose
o f d i r e c t comparisons between t e c h n o l o g i e s . For example, t h e number of
persons affected by the appropriat ion of land f o r t he energy supply system can
be a metric common t o a l l of the technology systems. Some of t h e economic
c o s t s can be compared d i r e c t l y whereas o the r s must remain d i s t i n c t (e.g., t he
c o s t of r e t r o f i t t i n g personal t e l e v i s i o n sets t o e l iminate in t e r f e rence must
be borne by t h e individual consumer, as opposed t o the cos t of crops damaged
by a i r pollution). The process of s e l e c t i n g and grouping the metrics w i l l
determine the types of comparisons t h a t can be made..
The quan t i f i ca t ion , where appropriate , of t he extent of t he impacts is
t h e next step. An important point t o emphasize is t h a t no attempt w i l l be
made t o reduce a l l of the impacts t o a common metric such as cost . Many
previous e f f o r t s a t doing t h i s have r e su l t ed i n extended controversies over
ass igning weighting values t o diverse impacts, s ince the re i s no consensus
about t h e proper way t o compute the common metric. The ana lys i s w i l l there-
f o r e preserve the diverse metrics f o r evaluation.
Synthesis of t he r e s u l t s i n t o a comparison of t h e technologies w i l l
be the f i n a l step. Conclusions w i l l be drawn f o r those metrics t h a t are
common t o a l l the systems, and a q u a l i t a t i v e evaluat ion of t he o the r i s s u e s
w i l l be made.
Data Bases
A l i t e r a t u r e review w i l l be used t o assemble information on conven-
t i o n a l energy s y s t e m (e.g., coa l , nuclear) impacts. The da ta f o r nonconven-
t i o n a l systems (e.g., terrestrial s o l a r ) w i l l be estimated using concep-
t u a l system de f in i t i ons . Sources of information on SPS w i l l be t h e environ-
mental and s o c i e t a l assessments of t he CDEP, both of which w i l l be generating
d a t a useful t o t h i s analysis .
-~
47
3.3 RESOUBCES
For the comparative evaluat ion of resource consumption by SPS and
a l t e r n a t i v e technologies, f i v e resource ca tegor ies have been se lec ted : land,
critical materials, energy, water, and labor. A more in-depth ana lys i s w i l l
i n v e s t i g a t e the cumulative e f f e c t s of the technologies i n d i f f e r e n t scenarios.
3.3.1 Land U s e
The ob jec t ive of t he land category is t o cha rac t e r i ze t h e nature,
purpose, and e f f e c t s of land used by an energy technology. Criteria used t o
characterize land use include: area, time (temporary versus permanent),
and l o s t opportunity ( recrea t ion , preserves, ag r i cu l tu re ) .
I s sue Descr ipt ion
I n comparing energy a l t e r n a t i v e s , one of t h e critical resources that
must be evaluated is land. The f i r s t and most obvious issue that must be
addressed is simply tbe amount of land that a given technology wi l l require.
Second, the length of time the land w i l l be required must also be determined.
For some technologies, the area required w i l l vary throughout t he p l an t ' s l i f e
cycle. For example, d i f f e r e n t amounts of land may be required during t h e
p l an t ' s cons t ruc t ion , operat ioa, and a f t e r shutdown (such as f o r s torage of
nuclear waste).
Also of i n t e r e s t is the loca t ion of the required land. The l o c a t i o n
w i l l have a bearing on d i r e c t c o s t and s o c i a l costs. The d i r e c t c o s t (e.g.,
$ /acre) w i l l obviously vary with location. In addi t ion , t h e loca t ion may
a f f e c t o the r land requirements, such as the amount of right-of-way needed f o r
t ransmission lines. Social c o s t s w i l l depend on the proximity of land t o
o t h e r publ ic funct ions, such as housing o r recreat ion. The den ia l of oppor-
t u n i t y t o use t h e land i n s o m e o the r way is a s o c i a l cost. I n i t i a l evalua-
t i o n s w i l l be performed on a regional bas i s , avoiding the complexities of
analyzing s p e c i f i c sites.
Units of Measure
The primary u n i t of measure i s simply land area. For a side-by-side
ana lys i s , t he area w i l l be normalized on per plan t o r per u n i t energy output.
The land area required may a l s o be broken down i n t o the phases of l i f e cyc le
48
and function, e.g., mining, construct ion, t h e p l an t i t s e l f , transmission, and
waste disposal. The length of t i m e of use i s a l s o a unit of measure pertain-
ing t o each of these categories. Direct and s o c i a l c o s t s w i l l be incorporated
only insofar as they are evident o r encountered i n o the r s tudies .
Methods
Most of t he a v a i l a b l e comparative assessments of land requirements
take a s i m p l e side-by-side approach. I n this approach, t h e land area required
by each technology is simply s t a t e d , t y p i c a l l y normalized per u n i t of energy
output. The da ta may a l s o be broken down according t o the purpose and dura-
t i o n f o r which t h e land is used. L i t t l e a t t e n t i o n is given t o d i r e c t o r
s o c i a l costs.
L i m i t a t i o n s on t h e a v a i l a b i l i t y of d a t a s u g g e s t t h a t t h e p r e s e n t
assessment s h o u l d a l s o t a k e a s ide-by-s ide approach. The approach w i l l
mainly e n t a i l compilation of the da t a a l ready a v a i l a b l e from sources c i t e d
i n the reference section. These sources present adequate measures of t he
amount, t i m e , and manner of use of land required f o r given plant designs. I n
cases where it is possible t o surmise the type of land t h a t would be used, as
w i l l be the case f o r regional sites, g r e a t e r d e t a i l w i l l r e s u l t .
Data Bases
Several side-by-side assessments g ive use fu l data. Among these are
Caputo' s i n i t i a l comparative assessment, Gallagher' s40 "Energy Supply Plan-
ning Model," and the "MERES" system of the Council on Environmental Quality.41
A MITRE/METREK study7 of solar-related technologies a l s o i d e n t i f i e s l i k e l y
l o c a t i o n s by census region and mentions environmental o r economic f a c t o r s
r e s u l t i n g i n c o s t v a r i a t i o n among regions. A l and use a n a l y s i s f o r SPS has
been prepared by Allan D. Kotin Economic consultant^.^^ I f not e x p l i c i t l y
s t a t e d , the land area required f o r f u e l mining can be t raced back through d a t a
on the amount of f u e l required.
3.3.2 Critical Materials
The a s ses smen t of c r i t i c a l materials r e s o u r c e s conce rns mater ia l
demands, current and required production rates, dependence on fo re ign sup-
p l i e s , and supply-demand consequences f o r SPS and each of the a l t e r n a t i v e
technologies.
49
I ssue Descr ip t ion
The eva lua t ion of c r i t i c a l ma te r i a l s is important pr imari ly f o r econo-
m i c reasons. The p o s s i b i l i t y exists t h a t a technology could be constrained
because a necessary ma te r i a l i s unavailable a t any p r i ce . However, such a
c o n s t r a i n t does not seem t o apply t o any of t h e present ly considered technol-
ogies . The main concerns seem t o be i n the following areas:
1. Domestic production capac i ty . What is the cu r ren t capaci ty? What
is i t s normal rate of growth? What rate of growth would be needed t o meet a
given demand?
2. Foreign dependence. I f domestic suppl ies o f a mater ia l a r e inade-
quate , where w i l l t he balance come from? How w i l l i t a f f e c t the U . S . balance
of t rade? A r e t he re p o s s i b i l i t i e s of c a r t e l s ?
3. P r i c e of materials. The p r i ce is d i r e c t l y r e l a t e d t o the s t a t u s and
form of material resources . For example, how much o f t he resource is already
i n proven reserves r a t h e r than i n probable o r subeconomic reserves? Are the
resources i n forms t h a t r equ i r e d i f f e r e n t production methods, f o r example,
gal l ium may be processed from bauxi te or from c lays .
4. Cost of Lost Opportunity. I f a mater ia l i s used for an energy
technology, what o t h e r poss ib le uses of the resource w i l l have t o be foregone?
The importance of t hese i s sues should not be overlooked. The require-
ment of a high production growth r a t e in a ma te r i a l processing indus t ry could
be d i f f i c u l t t o meet, but even i f t h a t is not t he case , t he re i s a need f o r
advance knowledge so t h a t industry w i l l have t i m e t o gear up f o r the demand.
I f high import l e v e l s are requi red , there may be uncer ta in ty about p r i ces
and a v a i l a b i l i t y of materials. The e f f e c t of an energy technology on ma-
terials p r i c e s w i l l , of course, not be confined t o the energy indus t ry , bu t
w i l l a f f e c t t he whole economy. Although the c o s t of l o s t opportuni ty i s an
important i s sue , i t is more d i f f i c u l t t o eva lua te , s ince it i s d i f f i c u l t t o
specula te on t h e poss ib le a l t e r n a t i v e uses a ma te r i a l may have i n the next few
decades.
Units of Measure
The obvious u n i t of measure for a c r i t i c a l ma te r i a l s s tudy i s the
amount of a material required by a technology. For comparison o f d i f f e r e n t
50
technologies, the mater ia l q u a n t i t i e s would t y p i c a l l y be normalized, such as
p e r u n i t of power o r energy output. Such u n i t s are typ ica l of system charac-
t e r i z a t i o n comparisons. However, t o move beyond such an assessment approach,
it is necessary t o consider the material q u a n t i t i e s i n comparison with o the r
f a c t o r s , such as:
1. Current production capac i ty , and the projected a b i l i t y
2. The resource base, broken down by ca t egor i e s of economic
3. The r e s o u r c e b a s e , b roken down by g e o g r a p h i c a l l o -
4. Pr ice of the mater ia l , r e l a t e d t o f a c t o r s 2 and 3 above.
to increase it.
f e a s i b i l i t y , geological assurance, and form.
cation.
Data f o r a l l of these f a c t o r s i s genera l ly a v a i l a b l e from the Bureau of
Mines43 o r the U.S. Geological Survey.44 The qua l i ty of the da ta v a r i e s ,
however. Some resource assessments a r e more c e r t a i n than o the r s , and the
uncer ta in ty is espec ia l ly g r e a t i n the f a c t o r s requi r ing the most pro jec t ion ,
such as undiscovered resources, o r the a b i l i t y of indus t ry t o expand pro-
duct ion capacity. S t i l l , the a v a i l a b i l i t y of some da ta makes a l l of t he above
u n i t s of measure feas ib le . For the i n i t i a l comparative assessment, however,
only a subset of the complete de t a i l ed breakdown of u n i t s suggested by the
f a c t o r s above w i l l be necessary. A good idea of what i s sues requi re f u r t h e r
explora t ion can be learned from a small number of simple u n i t s , such as:
1. Material quant i ty required versus cur ren t production
2. Q u a n t i t y r e q u i r e d v e r s u s proven r e s e r v e s , o r v e r s u s
3. Q u a n t i t y r e q u i r e d v e r s u s p e r c e n t a g e of t h e r e s o u r c e
4. Price of the material as r e l a t e d t o proven reserves o r
capacity.
t o t a l resources.
t ha t is imported.
t o t a l resources.
Me tho d s
The simplest comparative assessment of cr i t ical materials c o n s i s t s of a
side-by-side statement of system charac te r iza t ions . That is, the amounts of
v a r i o u s m a t e r i a l s r e q u i r e d by a r e f e r e n c e d e s i g n are s t a t e d b u t w i t h no
assessment of t h e i r c r i t i c a l i t y . Methods t h a t go beyond t h i s approach use
some screening process t o i d e n t i f y c r i t i c a l o r p o t e n t i a l l y c r i t i c a l materials.
51
One very simple screen checks off t he l i s t of materials aga ins t an outs ide
source 's l i s t of cr i t ical materials but without regard t o the q u a n t i t i e s
b e i n g cons ide red . More t h o u g h t f u l s c r e e n i n g methods e s t a b l i s h c r i t e r i a
r e l a t e d t o t h e supply/demand balance. Poss ib le problems indicated by the
screens are explored f u r t h e r manually. The screening may be comparatively
simple and done manually, o r very de ta i led , making good use of a computer f o r
bookkeeping. The methodology developed a t P a c i f i c Northwest Laboratory45
i s of t he la t ter type.
I From t h e ava i l ab le data, system cha rac t e r i za t ions of t h e technologies
under cons idera t ion may be obtained. However, except f o r SPS and photovol-
taics, l i t t l e has been done t o assess the c r i t i c a l i t y of t he required materi- I als. For SPS and photovoltaics, compilation of e x i s t i n g da ta w i l l suff ice .
However, f o r most of t h e t e c h n o l o g i e s a manual s c r e e n i n g method w i l l be
employed, followed by f u r t h e r manual i nves t iga t ion of poss ib le materials
problems. The screening criteria w i l l be r e l a t e d t o the u n i t s of measure
noted earlier, with l e v e l s set a t which t o f l a g po ten t i a l problems. For
example, a material would be flagged i f i t s demand represents more than a
s t a t e d percentage of cur ren t production. I f f lagged, t h e i s sue would be
inves t iga ted f u r t h e r t o see i f t he re r e a l l y i s a problem o r i f t he re are
mi t iga t ing factors .
i
Data Bases
Several earlier comparative assessments conta in usefu l system charac-
1 t e r i z a t i o n data. These s tud ie s include Caputo's i n i t i a l comparative assess- ment ,5 G a l l a g h e r ' s "Energy Supply P lanning Model" , 4 0 and MITRE/METREK' s
System D e 8 C r i p t & n l 8 and Engineelring C06t6 fop SolaFRelated Techmlogies.7 Additional cha rac t e r i za t ion data are ava i l ab le from s tud ie s of ind iv idua l
technologies. Two s tud ie s a l s o assess c r i t i c a l i t y : t he PNL study mentioned
ez1rlier;~5 and a study of SPS by Allan D. Kotin Economic consultant^.^^ I n
addi t ion , Battelle Columbus is analyzing the po ten t i a l c r i t i c a l i t y of terres-
t r i a l al t erna t i v e s . Data about the resource base and importation of materials is genera l ly
a v a i l a b l e from the Bureau of Mines43 and U.S. Geological Survey.44 Data
compiled i n o ther references may be general ly t raced back t o these sources.
52
3 .3 .3 Energy Balance
An a n a l y s i s of " n e t energy b a l a n c e " i s des igned to .de t e rmine t h e
quan t i ty of energy t h a t must be invested i n bui lding and operat ing an energy
supply system and t o determine i f t h a t system is capable of re turning enough
usable energy t o j u s t i f y the investment. The concern f o r ne t energy r e t u r n on
investment for an SPS system l ies i n the s i g n i f i c a n t amount of energy t h a t
must be expended i n i n s t a l l i n g a series of power satel l i tes i n geosynchronous
o r b i t ; severa l other systems are a l s o highly energy intensive.
Issue Description
The issues of concern i n conducting a n e t energy a n a l y s i s as p a r t of
t h e comparative assessment are the following:
1.
2.
3.
4.
It
For each of t h e e l e c t r i c i t y g e n e r a t i n g t e c h n o l o g i e s considered, how much energy ( i n the form of e l e c t r i c i t y , f u e l s , and m a t e r i a l s ) must b e expended t o b u i l d and operate the system?
For each technology, how e f f i c i e n t l y does it u t i l i z e the primary energy resource? Special emphasis must be given to the use of nonrenewable resources.
For each technology, what i s the "payback period"? That i s , how long w i l l i t take f o r t he system t o generate a q u a n t i t y of energy e q u a l t o t h e energy inves tmen t?
Does the ne t energy ana lys i s i n d i c a t e t h a t t he p o t e n t i a l re turn on investment f o r an SPS system i s s u f f i c i e n t t o warrant continued development, o r i s the rate of r e t u r n too low t o r i s k the investment? This must be answered i n the context of a comparison with a l t e r n a t i v e technolo- gies.
must be emphasized t h a t n e t energy a n a l y s i s cannot provide the
d e f i n i t i v e answer t o the problem of s e l e c t i n g a technological a l t e r n a t i v e . It
can only provide another piece of information upon which t o base a decision.
A l l four of the above i s sues are important i n answering the n e t energy balance
question; however, because of l i m i t a t i o n s of t h e methodology and da ta , not a l l
of them can be answered completely o r d e f i n i t i v e l y .
The one major question t h a t w i l l not be addressed i n t h i s ana lys i s is
whether the energy form provided by the technology ( i n t h i s case, e l e c t r i c i t y )
i s of s u f f i c i e n t bene f i t t o soc ie ty t o warrant t he investment of l imi t ed
resources. Since the technologies t o be compared are a l l e l e c t r i c i t y gener-
53
a t o r s , the quest ion f a l l s ou ts ide the scope of t h i s ana lys i s and the issue
becomes one of evaluat ing a l t e r n a t i v e ways of providing t h a t e l e c t r i c i t y .
Units of Measure
Idea l ly , t h e measure of energy investment i n a system would include the
energy required f o r the following: provision of materials f o r system con-
s t r u c t i o n , cons t ruc t ion of t h e facilities, provis ion of process materials used
i n operat ing the system, and operat ion of t h e system. These energy require-
ments would be compared with the primary input , l o s ses , and usefu l energy
output of the system. Because of the complexity of t he ana lys i s , i t is not
poss ib le t o assemble t h i s information on a cons is ten t basis. I n some in-
s tances the measure of energy flow i s the result of d i r e c t f i e l d experience
with u n i t s i n operat ion or a t least with laboratory-scale experiments. I n
o the r cases, p a r t i c u l a r l y with respect t o materials energy requirements, d a t a
on the energy flow are derived and based on sur roga te parameters such as
cost . It w i l l not be possible , i n the scope of t h i s assessment, t o generate a
c o m p l e t e l y c o n s i s t e n t and comprehensive d a t a b a s e f o r t h e energy f lows.
t
It would a lso be des i r ab le to maintain d i s t i n c t i o n s among var ious
forms of energy (e.g., e l e c t r i c i t y , fue l s , hea t , r ad ia t ion , etc.) so as t o
account f o r t he varying qua l i ty of each. This w i l l not be e n t i r e l y possible ,
again due t o the po ten t i a l complexity of t he ana lys i s and the l ack of compre-
hensive information.
Thus, t he measure of energy flow w i l l be cons is ten t with respect t o
u n i t s (e.g. j o u l e d y e a r ) , but the data w i l l r e f l e c t d i f f e r e n t degrees of
accuracy i n t h e i r der ivat ion.
The measure of e f f i c i ency of resource u t i l i z a t i o n is a r a t i o of t h e
energy output t o the resource input. A number of a l t e r n a t i v e e f f i c i ency
r a t i o s can be formed using d i f f e r e n t combinations of t he energy flows. The
most meaningful w i l l be i d e n t i f i e d i n the course of t he analysis .
The measurement of payback period i s simply an in t eg ra t ion of t h e
ene rgy f lows ove r t i m e . I d e a l l y , t h e energy f lows would be computed as
func t ions of t i m e , considering i t e m s such as s tar t -up times, cons t ruc t ion time
l a g s , and system de ter iora t ion . I n prac t ice , however, these da ta are not
e a s i l y computed, and the a n a l y s i s w i l l have t o u s e i n f o r m a t i o n ave raged
over t he l i f e t i m e of the system.
The f i n a l measure of the s u i t a b i l i t y of t h e rate of energy r e t u r n on
inves tmen t w i l l be s t r i c t l y a comparison of t h e r e t u r n from t h e v a r i o u s
a l t e r n a t i v e s considered. Since many o the r v a r i a b l e s e n t e r i n t o the f i n a l
dec i s ion on s u i t a b i l i t y , t he only evaluat ion t o be conducted here i s a com-
parison of SPS t o other systems.
Methods
There are bas i ca l ly th ree forms of n e t energy a n a l y s i s t h a t can be
employed. A Battelle study46 gives a concise review and c r i t i q u e of t h e
a l t e rna t ives . Process ana lys i s , which involves a d e t a i l e d balance of energy
flows i n t o and out of a system, i s the most accurate and most involved form of
assessment and can be applied t o s i t u a t i o n s where a g r e a t dea l of process-
s p e c i f i c information ex i s t s . Input-output a n a l y s i s uses an analogy t o eco-
nomic input-output ana lys i s t o determine the energy "costs" of any energy
supply. It involves an i d e n t i f i c a t i o n of the i n t e r a c t i o n s among a l l s e c t o r s
o f t h e economy r e q u i r e d t o produce energy and a t r a n s l a t i o n i n t o energy
equivalents of the flow of goods and se rv ices among sectors . Ecoenergetics
a n a l y s i s , which can be compared t o a c o s t / b e n e f i t ana lys i s , involves t h e
assignment of energy values t o various port ions of t he n a t u r a l environment
t h a t are affected by the energy system.
For t h i s study, a combination of process a n a l y s i s and input/output
a n a l y s i s w i l l be employed; t h e e c o e n e r g e t i c s approach w i l l n o t be used.
Process analysis w i l l be used where the energy flow da ta are d e t a i l e d and are
derived from f i e l d experience, which i s general ly the case when dealing with
t h e performance c h a r a c t e r i s t i c s of var ious pieces of equipment i n the tech-
nology stream. The input/output ana lys i s w i l l be used t o determine the energy
investment i n materials and construction. It i s the only method t h a t can be
appl ied with a reasonable expenditure of e f f o r t when considering t h e complex
in t e rac t ions and energy flows throughout t he economy t h a t are involved i n
de l ive ry of a given quant i ty of materials. The method accounts f o r economic
t ransact ions and uses an energy i n t e n s i t y measured i n Btu/$ t o convert t h e
c o s t t ransact ions t o energy flows. This procedure has been used i n a number
of other technology analyses.
5s
Data Bases
There is a wealth of da ta ava i lab le on the performance c h a r a c t e r i s t i c s
of var ious systems of e l e c t r i c i t y generation. Even f o r the SPS, which is one
of the least well-defined because of its r e l a t i v e l y recent proposal, t he NASA- and contractor-developed system de f in i t i ons provide adequate information f o r a
n e t energy analysis. These data are useful in t he process ana lys i s procedure
as appl ied t o d i r e c t energy flows through the systems.
For the ana lys i s of the energy required i n t h e materials and construc-
t i o n , t he da t a are more sketchy and less cons i s t en t ly presented. I n some
cases, the materials requirements a r e s t a t ed i n physical quan t i t i e s , i n o ther
cases, only i n terms of costs. This is not an e spec ia l ly d i f f i c u l t problem
s ince a l l materials requirements can be converted t o cos t equivalents t o apply
the input /output methodology.
Data f o r t h e i n p u t / o u t p u t a n a l y s i s (i.e., economic s e c t o r v a l u e s
f o r Btu/$ of material product) are derived from t h e work of Herendeen and
B ~ l l a r d . ~ ~ Many modifications and perturbations48 have been made t o the
bas i c information generated i n that work, but i t remains the most widely used da ta base f o r ne t energy analysis . K ~ t i n ~ ~ i s a source f o r energy da ta on
SPS. Data for process energy consumption w i l l be drawn from a number of
sources (Ref s. 49-51) . I
Wherever possible , da t a from other net energy analyses of similar or
c lose ly r e l a t e d systems w i l l be used t o shorten the time requirements f o r
obtaining a preliminary analysis . This may lead t o some inconsis tencies ,
and evaluat ions w i l l be made t o determine i f the da t a from p r i o r analyses are
adequate.
I
3.3.4 Water Resources
The objec t ive of the water resources ana lys i s is t o determine the
quant i ty of water used (consumptive and nonconsumptive) and the qua l i t y of
water returned during the complete fue l cycles of t he SPS and a l t e r n a t i v e
technologies.
Issue Descr ipt ion
Water is u t i l i z e d t o varying degrees i n near ly a l l electrical energy
I production a c t i v i t i e s , including r a w material ex t r ac t ion and processing, 1
56
reclamation of mined land, component fabrication, transportation, construc- tion, on-site processing and cooling, and waste disposal. The central issues
for comparing the water resource impacts of alternative energy systems (side-by-side analysis) are (1) total withdrawal requirements, (2 ) consumptive requirements (the portion of water utilized that is not.returned), and ( 3 )
quality of the water utilized and returned (changes in chemical, thermal, and
radioactive constituents).
The overall significance of the relative differences in withdrawal, consumption, and quality parameters only becomes apparent through consider-
ation of the availability of regional water resources and the competin'g natural and societal uses of that resource. Thus an evaluation of the water resource requirements for anticipated levels and geographical distribution of energy processes
Units of Measure
The units
is also required (alternative futures analysis).
of measure for conducting the side-by-side analysis of water
resource impacts are obtained directly from the characterizations to be provided for each of the activities within the energy production system (i.e., mining, reclamation, generation, component fabrication). The principal parameters in this analysis are listed in Table 3 . 6 . These parameters must also include regional sensitivity to factors such as evaporation rates and
precipitation-dependent, non-point run-off.
The consumptive water requirements are not ultimate losses from the global system but are rather changes in the geographical distribution and availability of the resource. For this reason, the units of measure in Table
3 . 6 distinguish between evaporative losses, which are those from the immediate
basin from which the water was extracted, and discharges to groundwater, which may replenish local supplies.
The alternative futures analysis of water resource impacts requires
delineation o f the regional availability and quality of water resources for energy production. The available parameters to be utilized for this analysis are given in Table 3 . 7 . The basic geographical units for this analysis are the Water Source Council Aggregated Subareas ( ASAs). 52 The boundaries of the
100 A S A s in the U.S. follow county boundaries s o as to approximate the
boundaries of the major hydrologic basins. A major shortcoming in the param-
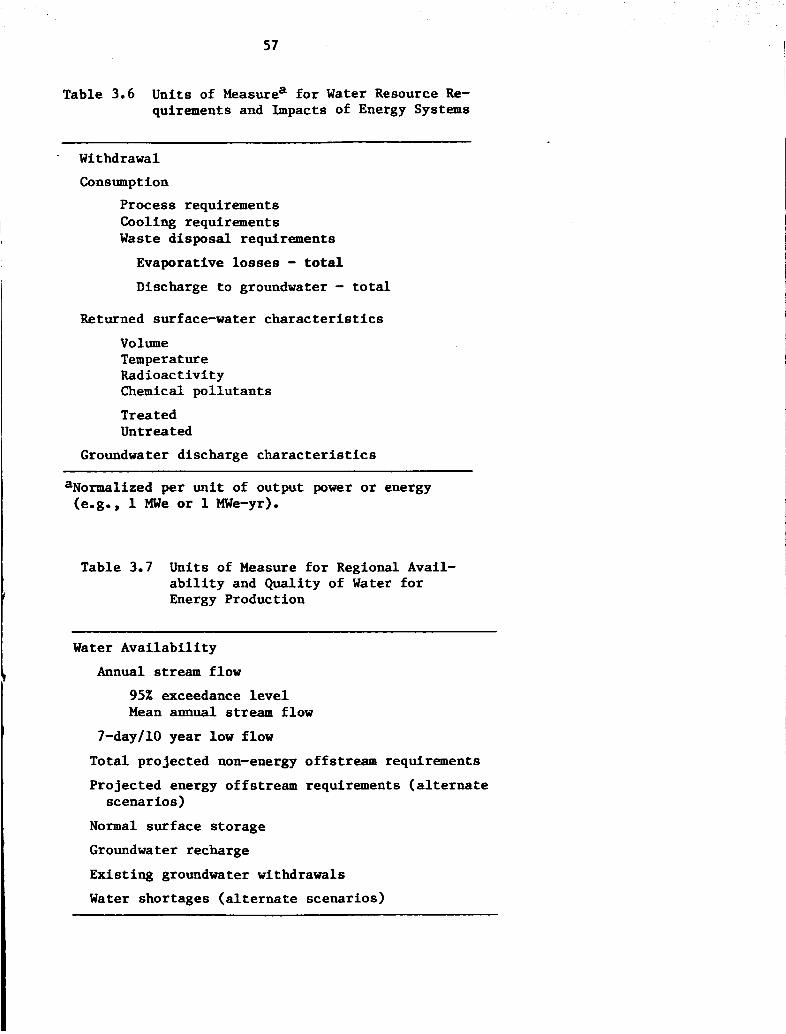
57
Table 3.6 Units of Measurea for Water Resource Re- quirements and Impacts of Energy Systems
Withdrawal Consumption
Process requirements Cooling requirements Waste disposal requirements
Evaporative losses - total Discbarge tc grcmdwater - total
Returned surface-water characteristics
Volume Temper at ur e Radioactivity Chemical pollutants
Treated Untreated
Groundwater discharge characteristics
aNormalized per unit of output power or energy (e.g., 1 W e or 1 We-yr).
Table 3.7 Units of Measure for Regional Avail- ability and Quality of Water for Energy Production
~ ~ ~~~~ ~~ ~~~~~~ ~
Water Availability
Annual stream flow
95% exceedance level Mean annual stream flow
7-day110 year low flow
Total projected non-energy offstream requirements
Projected energy offstream requirements (alternate
Normal surface storage
Groundwater recharge
Existing groundwater withdrawals
Water shortages (alternate scenarios)
scenarios)
58
eters of regional water availability is the inadequate definition of cumula-
tive instream water requirements for aquatic ecosystems, recreation, and hydropower. These instream requirements have been established by planning agencies in only selected areas. In the absence of explicit instream re- quirements a common practice has been to assume that certain historical low
flow levels are to be maintained. Examples are 90% of the 7-day-average low flow that occurs statistically every 10 years (7-day/lO-year flow) and the
annual stream flow statistically exceeded 95 years out of each 100-year period (95-percent annual flow exceedance).
Table 3.7 also lists as a parameter the surface storage that can be used for a limited period to augment supplies during low flow conditions. Subsurface supplies can also be used to augment water resources; however data on these supplies are not available in detail, and it is a conservative estimate that these groundwaters should not be depleted at a rate larger than
the recharge rate, which is included as a unit of measure in Table 3.7.
Methods
The preliminary evaluation will be a side-by-side evaluation based
primarily on the water use and quality parameters listed in Table 3.7 for all activities associated with unit energy production within the alternative energy systems. Subsequent analysis will determine the water consumption and withdrawal impacts of the alternative technologies in areas with water shor-
tages or critically limited water availability, as identified in previous extensive analyses of various energy scenarios. The approach to be used is to replace the technologies within those areas with the alternatives defined in this study, and to determine the level to which the water availability prob- lems will be alleviated or exacerbated. The level of replacement by alterna-
tive technologies will be designed to be consistent with the overall alterna- tive futures analysis.
Data Bases
The most extensive and current data for use in the regional water
availability analysis is that compiled by the Water Resources Council in the Second National Water A88e88mmt. 52 This reference contains detailed data on
59
surface-water flows, groundwater aquifers , and cur ren t and projected use
by var ious sec tors , including energy development. This data has been used as
a bas i s f o r evaluating water requirements and cons t r a in t s f o r var ious energy
scenar ios devised by DOE and other agencies. 53s54
3.3.5 Comparative Labor Effec ts
The objec t ive of the labor analysis is t o assess the supply and demand
characteristics of var ious types of skills needed f o r the SPS and a l t e r n a t i v e
energy technologies. The concern here is not merely with the numbers of
p e r s o n s r e q u i r e d i n each c a t e g o r y , which i s a n employment q u e s t i o n , b u t
cu r ren t and l i k e l y t rends influencing the a v a i l a b i l i t y of persons with spe-
c i f i c s k i l l s .
It i s important that the choice of an energy technology c lose ly match
ava i l ab le skills. I f l i k e l y def ic ienc ies are determined, then measures must
be taken ahead of time t o develop the s k i l l s required. It might a lso be
des i r ab le t o avoid a surplus of c e r t a i n skills with r e s u l t a n t underu t i l i za t ion
of the work force.
For example, these concerns would arise during the choice of a "high
technology" ove r one r e q u i r i n g l e s s s o p h i s t i c a t e d s k i l l s . I f t h e t r e n d
Eowar i a more nig-hiy educated work force continues, there may be increased
reluctance on the part of members of the work fo rce t o en ter careers that they
f e e l are not challenging. I n such a s i t u a t i o n , t he choice of a high tech-
nology may result i n b e t t e r u t i l i z a t i o n of ava i l ab le labor because i t promises
more challenging work, b e t t e r job s a t i s f a c t i o n , and more f u l f i l l i n g careers.
3.4 ECONOMIC AND SOCIETAL IMPACTS
3.4.1 Macroeconomic Effec ts
The purpose of the macroeconomic assessment is t o compare the impact
that the SPS and the energy a l t e r n a t i v e s w i l l have on the U.S. economy of t he
2 1 s t century a t the na t iona l , regional , and income class leve ls . Because of
t h e l a rge expenditures involved i n sa t i s fy ing power growth requirements, t he re
may be s i g n i f i c a n t differences among the systems i n t h e i r e f f e c t s on such
macrovariables as GNP and in f l a t ion .
60
Units of Measure
The units of measure at the national level are the differential effects
on GNP growth, employment, inflation rates, interest rates, and 'foreign trade
balances. Effects on taxes or government debt o r on both will be analyzed in the context of the type of system ownership postulated, that is, federally-
owned systems could be expected to be associated with taxes and/or national debt higher than comparable privately-owned systems.
Met hods The major components of a macroeconomic comparative assessment include
the following :
0 Aggregation of direct and indirect costs that would be estimated in connection with the assessments of costs and performance, resources, and socioeconomic and welfare is s ue s .
e Selection of (an) appropriate macroeconomic/energy model(s) to be used for assessment purposes. Specification of ground rules and policy inputs for the model(s). For example, such specifications would include ownership mode, degree of government financing, total national capacity, and utilization factors.
0 Exercise of the assessment model(s) and interpretation of results.
Although difficult, rough estimates of direct and indirect system costs can be developed and aggregated into macro-inputs to the model. For example,
indirect costs due to resource depletion may be partially estimated by re- ference to coal and uranium supply curves included in the SRI-Gulf55 energy
model, which extends to 2025.
A fundamental problem is the selection of an appropriate assessment
model from existing models that are mostly based on partial equilibrium. For example, macrovariables are inputs to the PIES56 model, which can then deter-
mine equilibrium energy prices and quantities. But these prices and quanti- ties do not affect the original inputs. Thus, PIES does not capture the
feedback effect of energy prices that can affect the economy. (It is widely believed that the 1974 recession was triggered by massive increases in oil prices. )

61
Fortunately, t he Hudson-Jorgenson, 57 PILOT58 and ETA-MACR014 (which
extends t o 2050) models use a general equilibrium approach. Consequently,
these models w i l l be evaluated f o r use i n the assessment. Spec i f i ca l ly ,
results from t h e "Energy Forum" project a t Stanford University (sponsored
by E P R I ) w i l l be used. I n t h e "Forum" e f f o r t , v a r i o u s energy/economics
models were t e s t e d using comparable inputs and ground rules . Differences i n
results were e i t h e r reconciled o r compared, and on the b a s i s of these con-
par isons, sme jud-ents can be made on the m e r i t s of t he var ious models.
Spec i f ica t ion of ground rules for the assessment models w i l l s t rongly
a f f e c t t h e r e s u l t s ob ta ined . Accordingly, s e v e r a l sets of ground r u l e s
corresponding t o severa l f u t u r e scenarios w i l l be defined. For example, i f
t h e economy is postulated t o be a t l e s s than a ful l -capaci ty u t i l i z a t i o n
l e v e l , new system expenditures should increase GNP and employment. Further ,
such increases could be estimated by use of Keynesian mul t ip l ie rs . On t h e
o the r hand, a ful l -capaci ty u t i l i z a t i o n scenario would imply e i t h e r "crowding
out" of o ther ventures t o permit power financing o r an increase i n the eco-
nomy's s a v i n g s ra te , i n which case, n e o c l a s s i c growth models59 would be
appropr ia te f o r assessment purposes. ( In neoc lass ic models, economic growth
t r a j e c t o r i e s are, genera l ly , funct ions of t he growth and product ivi ty increase
of labor , t h e r e l a t ionsh ip of output t o the mix of labor and c a p i t a l , and the
growth rate of c a p i t a l t h a t arises from divers ion of output t o capi ta l . )
Considering that t h e s t ruc tu re of most macroeconomic models is based on
h i s t o r i c a l time series, project ions of results t o the post-2000 era w i l l
r equ i r e caution. Relat ive ra ther than absolute r e s u l t s w i l l be s t r e s sed , and
s e n s i t i v i t y t o scenarios w i l l be examined closely.
Data Bases
Bas ica l ly two types of da t a w i l l be required f o r macroeconomic assess-
ment. One type w i l l include d i r e c t and i n d i r e c t system c o s t s and w i l l be
generated as a by-product of comparative assessments i n the areas of cos t and
performance, resources , socioeconomics and welfare. The o ther type of d a t a
w i l l e n t a i l poss ib le t r a j e c t o r i e s of the economy without SPS and i ts a l te rna-
t i v e s . These economic t r a j e c t o r i e s a r e s c e n a r i o s t h a t w i l l be d e f i n e d
i n a for thcoming s c e n a r i o development e f f o r t . F i n a l l y , a g r e a t d e a l of
spec ia l ized information on energy and power is ava i l ab le from t h e data bases
that support such models as ALPS60 and BESOM.61

62
3 . 4 . 2 Socioeconomic I m D a c t s
The purpose of t he socioeconomic assessment i s t o evaluate regional
differences i n economic and s o c i e t a l gains and l o s s e s due t o the development
and deployment of a l t e r n a t i v e energy technologies and t o compare these e f f e c t s
with those due t o a s a t e l l i t e power system. Important f a c t o r s pe r t inen t t o
t h i s e v a l u a t i o n i n c l u d e t h e s t i m u l u s t o r e g i o n a l employment and growth,
i n d i r e c t i n d u s t r i a l growth, secondary growth, and population and i n d u s t r i a l
migration.
Issue Description
The growing trend toward p o l i t i c a l pluralism has i t s counterpar t i n
t h e observed trend toward decen t r a l i za t ion and what John Na i sb i t t has termed
geographic pluralism.62 A s the states have begun t o move i n the d i r e c t i o n of
g a r n e r i n g i n c r e a s e d c o n t r o l o v e r t h e i r own d e s t i n i e s by c h a l l e n g i n g t h e
f e d e r a l government i n areas once considered i t s s o l e preserve (e.g. , energy
and environmental r egu la t ion ) , new c o a l i t i o n s and organizat ions of s ta tes
have been formed along regional boundaries. According t o N a i s b i t t , these
regional p o l i t i c a l organizat ions have grown out of the concern of individual
s ta tes fo r the widening d i f f e rences i n economic growth and demographic change
among c e r t a i n regions of the country.
It i s i n t o t h i s climate of i n t ens i fy ing regionalism t h a t t h e debate
over a l t e r n a t i v e e lec t r ic power technologies w i l l be th rus t . With the f ros t -
b e l t , sunbel t , and intermountain west vying with the f e d e r a l government over
energy policy and with each other over the i s sue of s ta te and regional growth
and development, i t seems imperative t h a t an assessment of t h e impacts of
t hese a l t e r n a t i v e energy opt ions be conducted t o examine the r e l a t i v e regional
economic and demographic advantages and disadvantages t h a t these opt ions are
l i k e l y t o impose. Spec i f i ca l ly , t he following i s sues need t o be e x p l i c i t l y
addressed i n order t o determine the e f f e c t s of a l t e r n a t i v e energy opt ions on
regional growth and development goals:
1.
2.
3.
An i d e n t i f i c a t i o n of basel ine demographic and economic t rends within regions.
A determination of regional growth and development goals.
The stimulus t o employment and population growth provided by each technology within the regions.
63
4. The effect of this stimulus on future industrial growth and development among regions.
5. The changes in inter-regional population and industrial migration likely to accompany each major energy option.
Units of Measure
The analysis of comparative regional economic and societal effects will
be largely quantitative, Trends in regional economic and demographic changes
will be made with the aid of acceptable estimates for the period up to and
beyond 2000. The stimulus to employment and population change will a lso be
.estimated empirically with existing models developed for comparative assess-
ments of technologies. The effect of the stimulus of energy development and availability on industrial and population relocation will be treated less
quantitatively. Much of the information for assessing these specific impacts
will be obtained from the existing literature and will be used to construct
hypothetical patterns that can be used to judge the probable range of regional
economic and demographic changes likely to accompany each energy technology,
I
Methode
The assessment of the regional approach and societal effects will . . ~ i i 4 - ~ .. -L,..*+- __.._ - -------a. .m- - - - i - - s - ----*a L- - - - - a - ~ - - - & - - J A L --***I- u Y Y L L V ~ up a p p ~ w a b u . LUS a u a A y 0 ~ 0 ~ U U A U uc L ~ L L A S U UUL W A L U
, the aid of computational tools like the Social and Economic Assessment Model
(SEAM).63 These will be applied to a "typical" electricity supply facility in
a "real world" environment. Given the employment characterization of a L typical facility and its probable site, the following information will be
generated:
I 1, Baseline characteristics of the size and composition of the population in the surrounding areas.
2. Employment characteristics of the population.
3. Annual employment requirements in the energy facility and expanded commercial and retail sectors.
4. Annual job-induced changes in the population of the area.
5. Effects on community infrastructure of these changes (if any) in population.
64
This analysis will be conducted for typical energy supply facilities
for each technology in several typical sites with different characteristics
(e.g., size, economic base). Given this information on the localized or site-specific economic and social changes accompanying the introduction of
these various technologies, the regional economic and societal effects will be extrapolated and compared across regions for each technology.
This extrapolation of socioeconomic effects will be based on the "observed" impacts of each technology in different settings, a reasonable
siting scenario for each of the technologies, and the relationship of elec- trical energy supply to the inducement of industrial relocation. For example,
if a given technology is appropriately sited in only two or three major regions (e.g., OTEC) and its economic and societal effects are estimated to be large in specific sites, the effects on regional growth and development and the consequences for population shifts among regions might be judged to be
substantial. If, in addition, the availability of electrical energy in these regions would cause specific industries to relocate, the effects on interre- gional population and economic growth and change would be magnified. Although
specific analyses of the relationship between the availability of power and
industrial location decisions are beyond the scope of this study, alternative scenarios can be developed to demonstrate the effects of varying industrial relocation possibilities that are consistent with the findings in the avail- able literature.
Data Bases
The data required to conduct this assessment will come from the
following primary sources:
0 Computational models, like the SEAM,63 which include exten- sive data bases of their own.
0 SPS societal assessment data from the CDEP. 0 Satellite and terrestrial systems characteristics (e.g.,
employment requirements, regional siting information, and materials requirements).
3. 5 INSTITUTIONAL IMPACTS
The purpose of the assessment of institutional effects is to investi- gate the potential impacts of energy technology deployment and operation on
regulatory agencies and the reciprocal impact of the latter on energy tech-
65
nology deployment and operation. The p r inc ipa l i s s u e s that must be inves t i -
gated inc lude the following :
The impacts of l o c a l , s t a t e , f ede ra l , and i n t e r n a t i o n a l regula t ions on the cos t and f l e x i b i l i t y of a technology.
The e x t e n t t o which r e g u l a t o r y p o l i c i e s may have t o be a l t e r e d to accommodate new regulatory problems crea ted by a technology, including the l i k e l y c o s t and purview of regulatory agencies, which may be formed t o con t ro l these new concerns.
The extent t o which initisti*ies required t o effec- t i v e l y r e g u l a t e a new technology harmonize w i t h t h e needs of existing nonregulatory governmental i n s t i t u t i o n s .
The e x t e n t t o which new f e d e r a l i n s t i t u t i o n s c r e a t e d to e f f e c t i v e l y r egu la t e a new technology harmonize with the needs of nongovernmental i n s t i t u t i o n s .
Units of Measure
The comparative i n s t i t u t i o n a l assessment w i l l of necess i ty be qua l i ta -
t ive , and the s e l e c t i o n of particular measures w i l l depend on the type of i n s t i t u t i o n a l e f f e c t s be ing assessed and t h e methods t h a t are a p p l i e d ,
Because i n s t i t u t i o n s tend t o respond t o perceived problems r e s u l t i n g from a new technology, the nneasurements i n t h i s comparison w i l l depend t o a l a r g e
ex ten t on t he measurements u t i l i z e d i n other sec t ions of t h i s study-
regula t ion and regulatory delay w i l l be quant i f ied t o the g r e a t e s t ex ten t
possible.
f h t a
M e t hods
The r e l a t i o n s h i p between each technology and the i n s t i t u t i o n s that may
a f f e c t it w i l l be i d e n t i f i e d from the impact da ta determined i n o the r parts of t h i s study. The poss ib le involvement of e x i s t i n g i n s t i t u t i o n s a t l o c a l ,
state, f e d e r a l , and i n t e r n a t i o n a l l e v e l s w i l l be surveyed on t he basis of
e x i s t i n g formal and informal ju r i sd i c t ions . The poss ib le need f o r new regula-
t o r y a u t h o r i t y or new agencies w i l l be assessed i n comparison t o h i s t o r i c a l
precedents and developing regulatory trends.
In t h e p r o c e s s of t h i s s u r v e y , l a w s , r e g u l a t i o n s , a d m i n i s t r a t i v e
codes and guide l ines , and other l e g a l cons t r a in t s on the implementation of
la rge-sca le energy technologies w i l l be cross-referenced and catalogued. To
t h e ex ten t that they can be i d e n t i f i e d , particular l a w s a f f e c t i n g the s p e c i f i c
technologies t h a t are being compared should also be evaluated.
REFERENCES I
1. U.S. Department of Energy and NASA, SPS CDEP Reference System Report, DOE/ER-O023 (October 1978).
2. Hittman Associates, Inc., Environmental Impacts, Efficiency, a d , Cost of Energy Supply and krd Use, Vol. I (November 1974) PB-238 784, and Vol. 11 ( J a n u r y 1975) PB-239 159, ava i lab le from NTIS, Spr ingf ie ld , Va.
3. Council on Environmental Qual i ty , MERES and the Evaluation of Enepgy Altenurt&)es, Stock number 041-011-0026-2, U.S. Government P r in t ing Office, Washington, D.C. (May 1975).
4.
5.
6.
7.
8.
9.
10 . 11.
12 . 13 . 14 .
University of Oklahoma, Science and Public Policy Program, Energy Alte~natiVe6: A Comparative A m l y s i s , prepared f o r the Council on Environmental Quality, Stock number 041-011-00025-4, U.S. Government Pr in t ing Office, Washington, D.C. (May 1975).
Caputo, R., An Ini t ial Comparative A66e6Sment of Orbital and Terrestrial Central Power Systems, Jet Propulsion Lab, 900-780 (March 1977).
Hub, K.A., et al., A Study of Social Costs for Alternative Means of Electrical Power Generation f o r 1980 and 1990, Argonne National Laboratory Report ANL-8092 (February 1973).
Mitre Corporation, METREK Division, System Descriptions and Engineering Cost6 for SolaFRelated Technologies, Volumes I - I X , MTR-7485 (June 1977).
Wilson, Car ro l l L., p ro jec t d i r e c t o r , Energy: Global PPO6peCt6 1985-2000, Report of the Workshop on Alternat ive Energy S t r a t e g i e s (WAES), M c G r a w - H i l l , New York, N.Y. (1977).
Wilson, Car ro l l L., p ro jec t d i r e c t o r , Energy Supply-Demand Integration6 to the Year 2000, MIT P r e s s , Cambridge, Mass. (1977).
Foel l , W.K., ed., P~oceedings of the 1978 Conference on Alternative Energy Futures for Wisconsin, Wisconsin Off ice of S t a t e Planning and Energy, Madison, W i s . (1978).
Meadows, D.H., e t al., The L i m i t 6 t o Growth, Potomac Associates, Washington, D. C. (1972) . Lovins, A,, Energy Strategy: The Road Not Taken, Foreign Af fa i r s , 55( 1) : 65-96 (1976).
LOvins, A., Soft Energy Paths: Publishing Co., Cambridge, Mass. (1977).
Tbward a Durable Peace, Ball inger
68
15. Energy Modeling Forum, Energy and the Economy, Electr ic Power Research I n s t i t u t e Report EPRI EA-620, Palo Alto, Ca l i fo rn ia (1978).
16. Manne, A.S., Energy-Economy Interaction: An Overvim of the ETA-MACRO Model, Energiespectrum (November 1977).
17. Buehring , W. A. , W. K. Foe11 , and R. L. Keeney , Examining Energy/Enviroment policy Using Decision Analysis, Energy Systems and Policy, 2(3):341-367 (1978).
18. Bierman, H., and S. Smidt, fie Capital Budgeting Decision, 2nd ed., The Macmillan Co., New York (1966).
19. Grant, E.L., and W.G. Ireson, Principles of Engineering Economy, 4th ed., Ronald Press Co., New York (1960).
20. Commonwealth Edison Company, Engineering Economics, Commonwealth Edison Company, Chicago (1975).
21. Mishan, E.M., Cost-Benefit AnaZysis: An Introduction, Praeger, New York (1971).
22. P r e s t , A.R., and R. Turvey, Cost Benefit Analysis: A Survey, The Economic Journal, 15(300):683-735 (1965).
23. Fischhoff, B., Cost-Benefit Analysis and the Art of Motorcycle Maintenance, Oregon Research I n s t i t u t e , OR1 Research Monograph, Vol. 16 , No. 1 (January 30, 1976).
24. Baecher, G.B., e t a l . , Balancing Apples and Oranges: Facility Siting Decisions, f o r Applied Systems Analysis, Laxenburg, Austria (September 1975).
Methodologies for &?port No. RR-75-33, In t e rna t iona l I n s t i t u t e
25. Dean, B.V., and M.J. Nishry, Scoring and Profitability Models for Evaluating and Selecting Engineering Projects, JORSA, 13(4) : 550-570 (1965).
26. Gaurguilo, G.R., e t a l . , Developing Systematic Procedures for Directing Research Programs, pp. 2-7 (1960).
IRE Transactions on Engineering Management, Volume EM-7,
27. Fishburn, P.C., Utility Theory, Management Science, 14(5):335-378 (1968).
28. E.I. DuPont de Nemours and Co. DuPont Guide to Venture Analysis (1971).
29. Rudd, Dale F., and Charles C. Watson, Strategy of Process Engineering, John Wiley and Sons, New York (1968).
30. Brown, Rex V. , Andrew S. Kahr, and Cameron Peterson, Decision Anatysis for the Manager, Holt, Rinehart and Winston, New York (1974).
9 1 T I - - - - - . 4A. r.bcrrLJ , ? 2 p h L., and Rai f fa , Howard, DeCisiOns with Multiple Objectives: Preferences and Value Tradeoffs, John Wiley and Sons, N e w York (1976).
69
32. Stanford Research I n s t i t u t e , Decision Analysis Group, Readings i n Decision Analysis, Palo Alto, Calif . (1974).
33. Electric Power Research I n s t i t u t e , Synthetic Electric U t i l i t y Systems for Evaluating Adwnced Technologies (February 1977).
34. Regional Pmer P l a m i n g : A State-of-the-Art Assesment, University of Oklahoma (January 1978).
35. Ezzat i , A l i , E c d c Anazys& of Advanced Energy Technologies: Proceedings of Enghzeering Workshop, A p r i l 4-5, 1977, M I T R E TR7611 (August 1977).
36. EPRI 1977 Technical Assessment Guide, rev ised , EPRI PS-866-SR (June 1978).
37. Westinghouse, A Methodology fo r Sola+Thermaal Pmer Plant Evaluation, prepared f o r EPRI , EPRI ER-869 (August 1978).
38. Morris, S.C., and R.M. Novak, Databook for the Quantification of Health Effect6 frm Coal Energy Systems, Biomedical and Environmental Assess- ment Division, Brookhaven National Laboratory, Upton N.Y. (1977).
39. Reactor Safety S t d y : An Assessment of Accident Risks i n U.S. Com- mercial Nucteur Pmer P t a n t s , WASH-1400 (NUREG 75/014), October 1975.
40. Gallagher, JIM., et al., Resource Requirements, Impacts and Potential Constraints As6ociated Oith Various Energy Futures, PAEf3794-6, Bechtel Corporation, San Francisco (March 1977).
42. Kotin, A.D., SPS Resource Requirements (Criticat Materiak, Energy, and Land), HCP/R-4024-02, U.S. Department of Energy (October 1978).
43. Kneral F a c t s and Problems, Bureau of Mines, U.S. Department of t he I n t e r i o r , Washington, D.C. (1976).
44. Brobst, D.A., and W.P. P r a t t , eds., Uni ted States Mineral Resource6, U.S. Geological Survey Professional Paper 820, U.S. Government P r in t ing Off ice , Washington, DOC. (1973).
45. Watts, R.L., e t al., Some Potential Material SuppZy Constraints i n the Deployment of Photovoltaic Solar Electric Systems, Pac i f i c Northwest Laboratory, Richland, Wash. (September 1978).
46. Fraley, D.W., C.L. McDonald, and N.E. Carter, A Revia, of Issues and A p p l i c a - tion6 of Net Energy AmZysi8, Draft Report, Battelle Pac i f i c Northwest Laborator ies (September 26, 1977).
70
47.
48.
49.
50.
51
52.
53.
54.
55.
56.
57 . 58.
59.
60.
61.
62.
63.
Herendeen, R.A., and C.W. Bullard 111, Energy Costs of Goods and Services, 1963 and 1967, CAC Document No. 140, Center f o r Advanced Computation, University of I l l i n o i s a t Urbana-Champaign (November 1974).
F r a b e t t i , A.J. Jr., e t a l . , Application of Net Energy Analysis to Consumer Technologies, DSI Report No. 047, Development Sciences, Inc. (December 22, 1976).
Livingston, F.R., e t al . , Satellite Pmer System (SPS) Preliminary Resource Assessment Report No. 900-805, Rev. A, Jet Propulsion Laboratory (August 7 , 1978).
Herendeen, R.A., Two Technologies Near the Net Energy Limit: Solar Satellite Pmer Station, Energy Research Group, Universi ty of I l l i n o i s a t Urbana-Champaign (August 1978).
Gandel, M.G., e t a l . , Assessment of Large-Scale Photovoltaic Materials Production, Report No. EPA-600/7-77-087, U.S. Environmental Protect ion Agency (August 1977).
The Nation’s Water Resources, The Second National Water Assessment, Water Resources Council ( d r a f t , March 1978).
National Coat Utilization Assessment, Pro jec t P lan t 1977-1979, ERDA 77-19 (March 1977). A series of regional r epor t s are ava i l ab le through t h i s program, which includes water resource ana lys i s f o r energy development.
Harte, J., and M. El-Glassier, Energy and Water, Science, 199(4329) (February 10 , 1978).
Cazalet , E.G., Generalized Equilibrium Modeling: SRI-Gulf Energy Model, Decision Focus Inc. (May 1977).
Federal Energy Administration, National Energy Outlook, U.S. Government Pr in t ing Off ice (February 1976).
Hudson, E.A., and Jorgenson, D.W. U S . Energy Policy and Economic Grmth 1975-2000, B e l l J. Econ. Mgt. Sc i 5:461-514 (1974).
Dantzig, G. B., e t al. , Stanford PILOT Energy/Economic Model, Electric Power Research I n s t i t u t e , Report EA-626 (1978).
Allen, R.G. D. , Macro-Economic Theory , Macmillan, New York (1968).
Hardie, R.W., e t al . , ALPS, A Linear Programming System for Forecasting Optimum Pmer Growth Patterns, Hanford Engineering Development Laboratory (Apri l 1972).
Hoffman, K.C:, A Unified Frammork for Energy Systems Planning, in Energy Modelzng, Resources f o r the Future (March 1973).
Na i sb i t t , John, Satellite Pmer System (SPS) Centralization/DecentralG zation , HCP/R-4024-09 , U. S. Department of Energy (September 1978).
Stenehjem, E.J., Swmnary Description of SEAM: The Social and Economic Assessment Model, ANL Technical Report, ANL/IAPE-TM-78-9 (Apri l 1978).
Gasohol and
The Methodology of the

71
BIBLIOGRAPHY
Health and Safety E f f e c t s
occupationat 1n&4~ies mrd Ittnesses in the U.S. by ~ n d u s t r y 1875, U.S. Department of Labor, Bureau of S t a t i s t i c s , P1981 (1978).
Environinental Protect ion Agency, Strvztegic hsvirownsntul Assesanent Sptem (SEAS) Model.
Environmental Pro tec t ion Agency, Health Consequences of Sulfur W e e - A Report frm &e88 1970-1971, EPA 650/1-74-004.
Buechley, R.W., e t al., LeUeh and Perturbation6 in M o r t d i t y , Archives of Env. Health, 27(3) (Sept. 1973).
Lave, L.B., and E.P. Seskin, A i r P o t z u t h on Rtonm Health, Johns Hopkins University Press, Baltimore (1977).
Union of Concerned S c i e n t i s t s , Pretiminary Revieo of AEC Redctor Safety Sttd8, Cambridge, Mass. (1974).
National Academy of Sciences (BEIR), The Effect8 on Poputatias of Exposure t o L m Levels of Ionbing R a d k t h . Biological E f f e c t s of Ionizing Radiations. NAS/NRC (November 1972) .
Report on the Advisory Committee on the Division of Medical Sciences
Sagan, L.A., Health Cost8 Assoc&zted Oith the Mining, Transport and Conc bustion of Coal in the Steam Eh&pic I?&etr#, Nature, 250:107-111 (1974).
Comer, C.L., and L.A. Sagan, Eealth Effects O f Energy P r o d u c t h rmd C a n V S r h , Annual Review of Energy, 2:581-599 (1976).
Lave, L.B., and L.C. Freeburg, Health Effect8 of Electricity G e n s r a t G m from Cod, O i l mad Ructear Fuel, Nuclear Safety, 14 :40+428 (1973).
Salmon, L. B. , Compami&e Assesme?at of Health, Safety, and Gnu~romentat Impacts of Coal Use, f o r DTA/OTI, (Draft , O c t . 1978).
Economic and Socie ta l Impacts
Cohen, S., e t al , Selection Criteria for Synthetic Acets COPrmerCid D w n o n s t r u l - tation Proglumr, T R W (June 1976).
Synfuels Interagency Task Force, RecamnsndationS for a Synthetic Fuels Comn~+ c&zliaation P r o g m , Vol. 11, Appendix D, U.S. Government Pr in t ing Off ice Washington, D. C. (November 1975).
72'
9 Rink, R., and A. Ford, BOOM-H: A Simulation .-Jdet for Boomtown Housing, Los Alamos S c i e n t i f i c Laboratory LA-7324-MS (September 1978).
Comparative I n s t i t u t i o n a l E f f e c t s
Political and Legal Implications of Deueloping and Operating a SPS, Fina l Report, ECON, Inc., Princeton, N.J. (August 15, 1977).
Jones, W i l l i a m K., Regulated Industries: Press (1976).
Cases and Materiats, Foundation
S a t e l l i t e Power System (SPS) S t a t e and Local Regulations as Applied t o S a t e l l i t e Power System Microwave Receiving Antenna F a c i l i t i e s , HCP/R- 4024-05, Allan D. Kotin, DOE/NASA, S a t e l l i t e Power System Concept Develop- ment and Evaluation Program (October 1978).
*U.S. GOVERNMENTPRINTING OFFICE: 1880- 311-1 19:7