subsea production system (sps) control modelling - utpedia
TRANSCRIPT
Subsea Production System (SPS) Control Modelling
by
Mohd Muslim bin Abd Koha
Dissertation in partial fulfilment of
The requirements for the
Bachelor of Engineering (Hons)
(Mechanical Engineering)
September 2013
Universiti Teknologi PETRONAS
Bandar Seri Iskandar
31750 Tronoh
Perak Darul Ridzuan
CERTIFICATION OF APPROVAL
Subsea Production System (SPS) Control Modelling
by
Mohd Muslim bin Abd Koha
A project dissertation submitted to the
Mechanical Engineering Programme
Universiti Teknologi PETRONAS
in partial fulfilment of the requirement for the
BACHELOR OF ENGINEERING (Hons)
(MECHANICAL ENGINEERING)
Approved by,
(AP Dr Fakhruldin b Mohd Hashim)
UNIVERSITI TEKNOLOGI PETRONAS
TRONOH, PERAK
SEPTEMBER 2013

CERTIFICATION OF ORIGINALITY
This is to certify that I am responsible for the work submitted in this project, that the
original work is my own except as specified in the references and acknowledgements, and
that the original work contained herein have not been undertaken or done by unspecified
sources or persons.
MOHD MUSLIM B ABD KOHA
ABSTRACT
The motivations of this project work are to develop a simulation model for a direct
hydraulic control system, find the effect of changing key parameters to the system’s
response time, and also to demonstrate Emergency Shut Down (ESD) feature which is a
requirement for the subsea production control systems (SPCS). The methodology of this
project involves selecting a control system to be studied which is a direct hydraulic control
system, gathering technical details and data regarding the control system and components
that constitute the control system, and translating the technical details and concepts into
acceptable simulation forms in the simulation’s software. This project used SimulationX
to simulate the developed model. The developed model consist of a hydraulic power unit,
a topside control panel, hydraulic lines, a subsea control module and two actuator valves.
The Cadlao oil field has been selected as the case study and simulation models were built
according to the Cadlao field’s SPCS. The simulated model is validated by comparing the
Cadlao’s performance curves and the acquired results. The simulation is done by varying
3 parameters which are umbilical length, umbilical diameter, and actuator size. Each
parameter is tested to study its influences on the signal time and shift time. To find the
effect of umbilical length on the signal time, umbilical lengths of 6000 ft, 12000 ft, and
18000 ft have been used. Time taken are 47 s, 110 s, and 195 s respectively. For the
simulation using different umbilical diameters, 0.15 inch, 0.35 inch and 0.50 inch have
been used. Time taken to fully pressurize the umbilical are 111 s, 39 s and 48 s
respectively. For the second part, to find the effect of varying parameters on shift time,
three parameters are changed (umbilical length, umbilical diameter and actuator
diameter). 6000 ft, 12000 ft and 18000 ft umbilical lengths have been used and the
recorded shift times are 13 s, 21 s and 31 s respectively. For the simulation using different
umbilical diameters, 0.15 in, 0.35 in and 0.50 in have been used and the recorded shift
times are 113 s, 19 s and 13 s respectively. Lastly, sensitivity analysis is done using three
different piston diameters. Diameters of 6 in, 9 in and 12 in have been used and the
recorded shift times are 28 s, 36 s and 56 s respectively. Lastly, emergency shut-down
simulated showed that the actuator is able to return to fail safe condition in 33 s.
ACKNOWLEDGEMENT
Firstly, I would like to express my deepest appreciation and gratitude to my supervisor,
AP Dr Fakhruldin bin Mohd Hashim, who has been guiding me throughout this project.
Without his consistent supervisions, concerns and supports, this particular project would
not has been as complete as it is today.
I am also indebted to the final year project’s coordinator, Dr Azmi Abd Wahab for his
time and commitments in arranging various seminars to provide support and knowledge
to assist me in doing this project. I am also would like to thank my final year project poster
and oral presentation’s evaluator, AP. Ir. Dr. Mohd Amin Bin Abd Majid, and my oral
presentation’s examiner, Dr. Mark Ovinis for his time and willingness to assess my
project.
Special thanks to my beloved family who has been supporting and encourage me in
completing this final year project. Lastly, I also would like to thank all the individuals that
have helped me in many ways in doing this project. Thank you.
TABLE OF CONTENT
TABLE OF CONTENT ..................................................................................................... 1
LIST OF FIGURES .......................................................................................................... ii
LIST OF TABLES ............................................................................................................ iv
ABBREVIATIONS .......................................................................................................... iv
CHAPTER 1 ...................................................................................................................... 1
1.1 BACKGROUND STUDY ................................................................ 1
1.2 PROBLEM STATEMENT ............................................................... 4
1.3 OBJECTIVES ................................................................................... 4
1.4 SCOPE OF PROJECT ....................................................................... 4
CHAPTER 2 ...................................................................................................................... 6
2.1 SUBSEA PRODUCTION CONTROL SYSTEM ............................ 6
2.2 DIRECT HYDRAULIC CONTROL SYSTEM ............................... 8
2.2.1 Hydraulic Power Unit (HPU) ......................................................... 9
2.2.2 Topside Umbilical Termination Unit (TUTU) ............................. 10
2.2.3 Subsea Control Module (SCM) .................................................... 11
2.2.4 Umbilical ...................................................................................... 12
2.2.5 Valve Actuator ............................................................................. 14
2.3 ARTICLES REVIEWED ................................................................ 16
2.4 LITERATURE SUMMARY ........................................................... 20
2.5 AGITO SIMULATIONX ................................................................ 22
CHAPTER 3 .................................................................................................................... 25
3.1 WORKFLOW ................................................................................. 25
3.2 PROJECT ACTIVITIES ................................................................. 27
3.3 CASE STUDY ................................................................................ 27
3.4 MODEL CONCEPTUALIZATION ............................................... 31
3.5 MODEL TRANSLATION .............................................................. 33
3.5.1 Hydraulic Power Unit Model ....................................................... 33
3.5.2 Topside Umbilical Termination Unit (TUTU) Model.................. 34
3.5.3 Hydraulic Lines Model ................................................................. 35
3.5.4 Subsea Control Module Model ..................................................... 37
3.5.5 Subsea Actuator Valve Model ...................................................... 38
3.6 OVERALL MODEL ....................................................................... 39
3.7 MODEL VALIDATION ................................................................. 41
CHAPTER 4 .................................................................................................................... 44
4.1 SYSTEM BEHAVIOUR ................................................................. 45
4.1.1 Gate Valve .................................................................................... 45
4.1.2 Umbilical ...................................................................................... 47
4.2 SIGNAL TIME ................................................................................ 48
4.2.1 Umbilical’s Bulk Modulus Effect ................................................ 48
4.2.2 Umbilical’s Length Effect ............................................................ 49
4.2.3 Umbilical’s Inner Diameter Effect ............................................... 50
4.3 SHIFT TIME ................................................................................... 52
4.3.1 Umbilical’s Length Effect ............................................................ 52
4.3.2 Umbilical’s Inner Diameter Effect ............................................... 53
4.3.3 Actuator’s Size Effect .................................................................. 54
4.4 EMERGENCY SHUT DOWN (ESD) ............................................ 55
CHAPTER 5 .................................................................................................................... 58
5.1 CONCLUSION ............................................................................... 58
5.2 RECOMMENDATION ................................................................... 60
REFERENCES ................................................................................................................. 61
APPENDICES ................................................................................................................. 64
ii
LIST OF FIGURES
Figure 1: Global oil consumption [1] ................................................................................. 1
Figure 2: Offshore production from 1970 to 2020 [1] ....................................................... 2
Figure 3: World subsea hardware market [1] ..................................................................... 2
Figure 4: Direct hydraulic control system [7] .................................................................... 8
Figure 5: Hydraulic power unit [7] .................................................................................. 10
Figure 6: TUTU [8] .......................................................................................................... 10
Figure 7: Typical subsea control module [10] ................................................................. 12
Figure 8: Direct hydraulic umbilical [12] ........................................................................ 13
Figure 9: Hydraulic control line criteria [4] ..................................................................... 14
Figure 10: Subsea production valves on X-mas tree [14] ................................................ 15
Figure 11: Illustrations of a typical gate valve in closed and open position [13] ............ 15
Figure 12: Typical volumetric curve for 1" line (2000 ft. length) [4] .............................. 16
Figure 13: Leakage hydraulic control system [16] .......................................................... 19
Figure 14: Simplified SPARSC design [17] .................................................................... 20
Figure 15: SimulationX GUI Overview [20] ................................................................... 23
Figure 16: Elements in subsea library [20] ...................................................................... 24
Figure 17: Flow Chart of the Project................................................................................ 26
Figure 18: Cadlao Oil Field [23] ...................................................................................... 28
Figure 19: Schematic of test arrangement [21] ................................................................ 29
Figure 20: Effect of valve volume and hose size to shift time [21] ................................. 30
Figure 21: Effect of hose length and hose diameter to the signal response time [21] ..... 30
Figure 22: Model conceptualization................................................................................. 31
Figure 23: Signal time and shift time [21] ....................................................................... 32
Figure 24: Overall response time expected behaviour [21] ............................................. 33
Figure 25: HPU Model [20] ............................................................................................. 34
Figure 26: HPU model and parameters ............................................................................ 34
Figure 27: TUTU model and parameters ......................................................................... 35
Figure 28: Distributed Line Model [13] ........................................................................... 35
iii
Figure 29: Umbilical's parameter definition [20] ............................................................. 36
Figure 30: Umbilical’s parameters [20] ........................................................................... 36
Figure 31: Umbilical model [20] ..................................................................................... 36
Figure 32: SCM schematic diagram ................................................................................. 37
Figure 33: SCM modelled in SimulationX ...................................................................... 37
Figure 34: Main parameters for the check valve .............................................................. 38
Figure 35: Actuator definition and parts [20] .................................................................. 38
Figure 36: Actuator model and parameters ...................................................................... 39
Figure 37: Overall simulation model ............................................................................... 40
Figure 38: Fluid properties [24] ....................................................................................... 42
Figure 39: Umbilical parameters [25] .............................................................................. 43
Figure 40: Gate valve behaviour during opening and closing ......................................... 45
Figure 41: Pressure drop when operating second actuator............................................... 46
Figure 42: Umbilical hose pressurization ........................................................................ 47
Figure 43: Umbilical pressurization time for different bulk modulus ............................. 48
Figure 44: umbilical pressurization at different length .................................................... 49
Figure 45: Umbilical pressurization at different diameter ............................................... 50
Figure 46: Cadlao response time for umbilical at different length and diameter [21] ..... 51
Figure 47: Shift time for different umbilical length ......................................................... 53
Figure 48: Effect of varying hose diameter...................................................................... 54
Figure 49: Effect of actuator size on shift time ................................................................ 55
Figure 50: Gate valve time to return to safe state ............................................................ 56
Figure 51: correction on spring force and preload force on spring .................................. 57
iv
LIST OF TABLES
Table 1: Advantages and disadvantages of subsea system ................................................ 3
Table 2: Control system selection criteria ........................................................................ 17
Table 3: Summary of literature review ............................................................................ 21
Table 4: Function of areas in SimulationX GUI .............................................................. 23
Table 5: Data used in Cadlao field [21] ........................................................................... 28
Table 6: HPU configurations ........................................................................................... 41
Table 7: Umbilical configurations ................................................................................... 41
Table 8: Actuator configurations ..................................................................................... 42
Table 9: Effect of varying bulk modulus of hose pressurization ..................................... 49
Table 10 : Effect of varying umbilical length to pressurization time .............................. 49
Table 11: Effect of varying umbilical diameter on pressurization ................................... 50
Table 12: Time taken to fully open actuator valve using different hose length ............... 53
Table 13: Recorded time for piston to fully shift to the other end ................................... 54
Table 14: Recorded shift time for different piston diameter ............................................ 55
ABBREVIATIONS
CAPEX Capital Expenditures
CIU Chemical Injection Unit
DCV Directional Control Valve
DHSV Down Hole Safety Valve
HIPPS High Integrity Pressure Protection System
HPU Hydraulic Power Unit
OPEC Organization of the Petroleum Exporting Countries
SCM Subsea Control Module
SDU Subsea Distribution Unit
v
SEM Subsea Electronic Module
SPCS Subsea Production Control System
SPCU Subsea Power and Communication Unit
SPS Subsea Production System
SRM Subsea Router Module
UTA Umbilical Termination Assembly
XT X-mas Tree
1
CHAPTER 1
INTRODUCTION
1.1 BACKGROUND STUDY
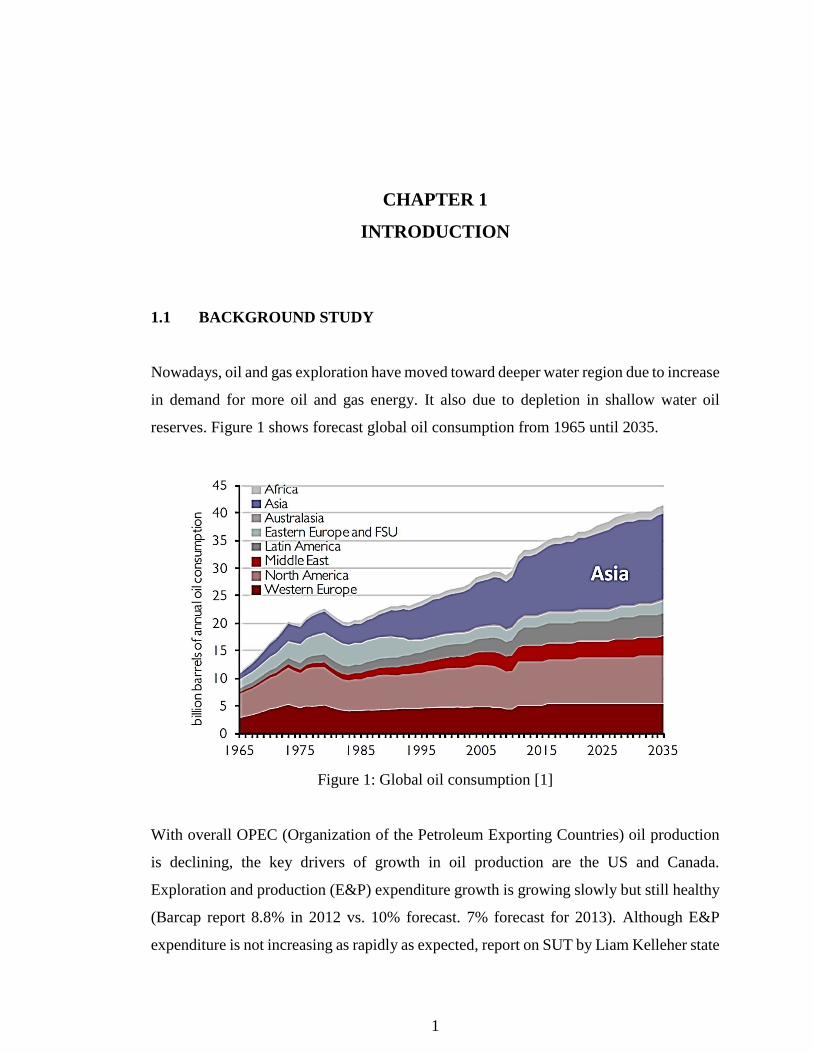
Nowadays, oil and gas exploration have moved toward deeper water region due to increase
in demand for more oil and gas energy. It also due to depletion in shallow water oil
reserves. Figure 1 shows forecast global oil consumption from 1965 until 2035.
Figure 1: Global oil consumption [1]
With overall OPEC (Organization of the Petroleum Exporting Countries) oil production
is declining, the key drivers of growth in oil production are the US and Canada.
Exploration and production (E&P) expenditure growth is growing slowly but still healthy
(Barcap report 8.8% in 2012 vs. 10% forecast. 7% forecast for 2013). Although E&P
expenditure is not increasing as rapidly as expected, report on SUT by Liam Kelleher state
2
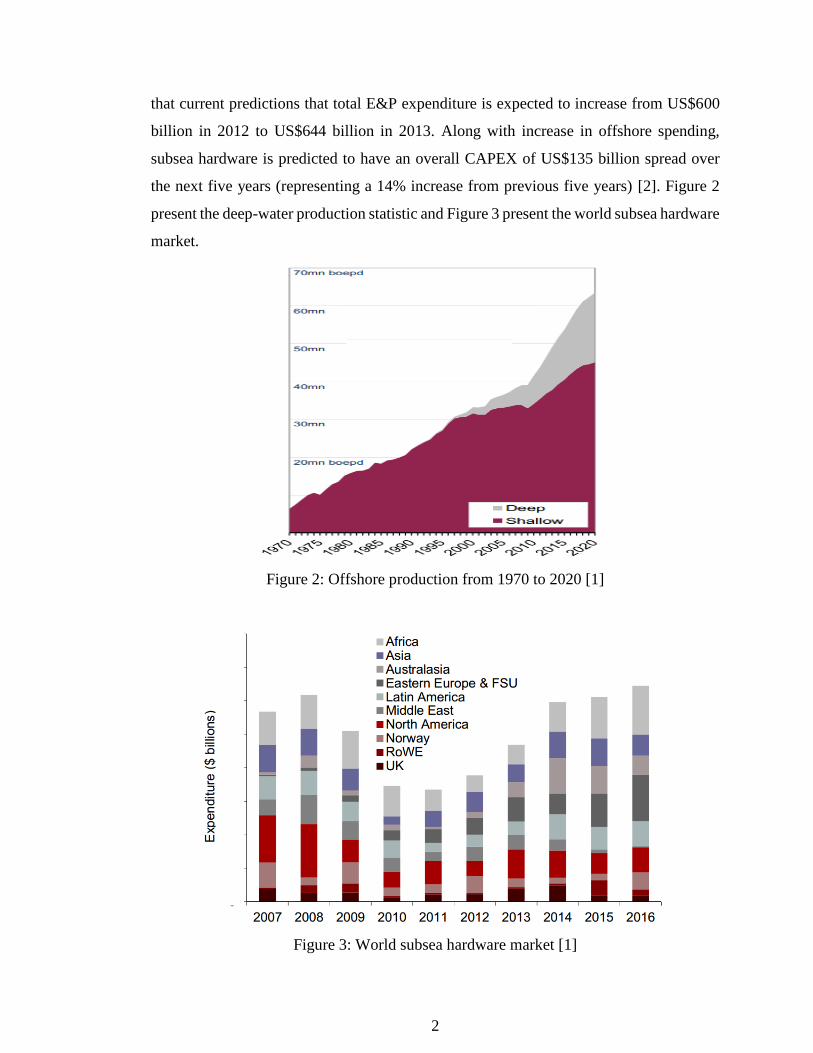
that current predictions that total E&P expenditure is expected to increase from US$600
billion in 2012 to US$644 billion in 2013. Along with increase in offshore spending,
subsea hardware is predicted to have an overall CAPEX of US$135 billion spread over
the next five years (representing a 14% increase from previous five years) [2]. Figure 2
present the deep-water production statistic and Figure 3 present the world subsea hardware
market.
Figure 2: Offshore production from 1970 to 2020 [1]
Figure 3: World subsea hardware market [1]
3
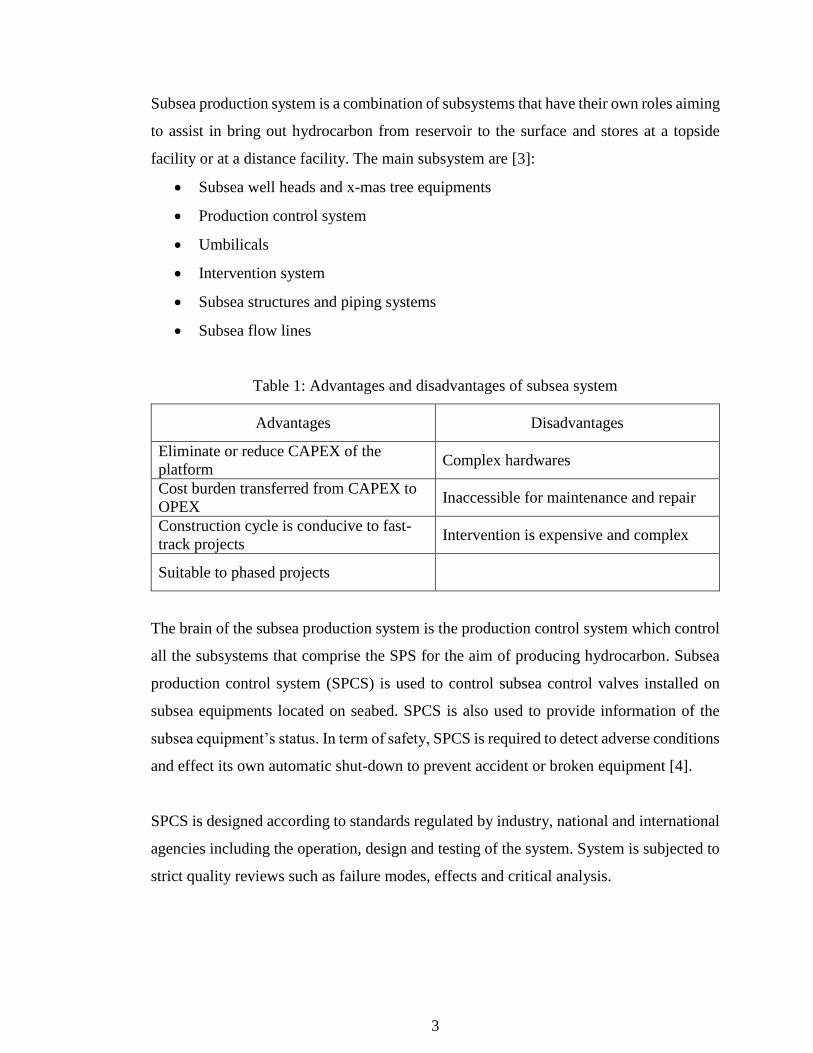
Subsea production system is a combination of subsystems that have their own roles aiming
to assist in bring out hydrocarbon from reservoir to the surface and stores at a topside
facility or at a distance facility. The main subsystem are [3]:
Subsea well heads and x-mas tree equipments
Production control system
Umbilicals
Intervention system
Subsea structures and piping systems
Subsea flow lines
Table 1: Advantages and disadvantages of subsea system
Advantages Disadvantages
Eliminate or reduce CAPEX of the
platform Complex hardwares
Cost burden transferred from CAPEX to
OPEX Inaccessible for maintenance and repair
Construction cycle is conducive to fast-
track projects Intervention is expensive and complex
Suitable to phased projects
The brain of the subsea production system is the production control system which control
all the subsystems that comprise the SPS for the aim of producing hydrocarbon. Subsea
production control system (SPCS) is used to control subsea control valves installed on
subsea equipments located on seabed. SPCS is also used to provide information of the
subsea equipment’s status. In term of safety, SPCS is required to detect adverse conditions
and effect its own automatic shut-down to prevent accident or broken equipment [4].
SPCS is designed according to standards regulated by industry, national and international
agencies including the operation, design and testing of the system. System is subjected to
strict quality reviews such as failure modes, effects and critical analysis.
4
1.2 PROBLEM STATEMENT
As oil field moving toward deeper region, as shallow water reserves have mostly depleted,
operator requires new technologies to be implemented to cope with new challenges faced
in this region. To understand new technology capabilities, beside physical experiment on
model, which will consume a lot of time and very costly, developer nowadays are using
simulation software to virtually test their proposed solution. By simulation, system can be
virtually tested in various operation conditions and verified the system capability to run
in the field. This will increase the confidence in the system. Despite that, many other
alternative solutions also can be tested and each solution can be compared to find the most
dependable one. For example, the effect of varying dimension of umbilical or different
actuator size can be analysed and their impact to system performance can be acquired
quickly. The need for simulation is heightened as umbilical is the most expensive
component in subsea system, and if wrongly dimensioned, it can result in major time and
cost overruns. Therefore, various alternative solutions of umbilical can be tested through
simulation in order to select the best solution.
1.3 OBJECTIVES
The objectives of this project are:
1. To develop simulation model for a direct hydraulic control system.
2. Investigate model’s signal time and shift time under varying parameters.
3. Investigate model behaviour under emergency situation.
1.4 SCOPE OF PROJECT
The scope of the study covers the following:
1. Study on a various subsea control system and select a system for modelling and
simulation.
2. Develop a simulation model focusing on the critical components in subsea
production control system (hydraulic power unit, umbilical, subsea control
5
module, and actuator) that operates the subsea gate valves and effectively
illustrates the gate valves operations on controlling an oil or gas flow.
3. SPCS model is simulated using real operating field data acquired from patents.
4. Behaviours of the developed umbilical and gate valves are studied and their effects
on the system’s response time aer shown through performance curves.
5. Emergency shut-down feature included in model is simulated to show system
behaviour under emergency situation.
6. Cadlao oil field is selected as the case study for this project and the developed
simulation model is validated by comparing the performance curves of the Cadlao
field and the acquired results.
6
CHAPTER 2
LITERATURE REVIEW
2.1 SUBSEA PRODUCTION CONTROL SYSTEM
With reference to API 17F, subsea production control system is defined as a control
system operating a subsea production system during operations [5]. Subsea Production
Control System (SPCS) manages the operation of subsea equipment located on the seabed
during various subsea functions execution. The control functions include:
1. Operates valves and chokes on subsea trees, manifold/templates, and pipelines
remotely from topside.
2. Receives and transmits the data between the topside and subsea equipment, which
helps engineers monitor the status of production.
3. Enable safe operation of subsea wells by enabling the operator to control the
opening and closing of valves and perform shut down operation during emergency.
Appendix I illustrates an overview of a subsea production control system. The control of
SPCS is done at the topside facility and transferred to seabed where the control function
is executed. It typically consists of three sections [6]:
1. Topside (surface control unit)
Comprises of a hydraulic power unit (HPU), electric power unit (EPU) and well
panel. The HPU can be on surface station on land or a work over rig platform.
2. Umbilical (control line)
Combination of electric cables, hoses or steel tubes, either on their own or in
combination (or with fibre optic cables), cabled together to increase flexibility and
mechanical strength. It is used to transfer electrical power and signals, hydraulic
7
power, and/or chemicals to the subsea components on the subsea production
system.
3. Subsea installations
Subsea installations include subsea control module (SCM), subsea distribution
systems (distribute chemical, electrical, and hydraulic from umbilical
termination), and subsea located sensors.
Satisfactory response time is an important factor that may affect system’s reliability and
safe of operation. As communication distance between topside production facilities and
subsea installations increases, total well that have to be controlled increases and water
depth become deeper, earlier control method using direct hydraulic control become less
feasible. As a result, more advanced and complex control method being developed. There
are several type of control system:
1. Direct Hydraulic Control System
2. Piloted Hydraulic Control System
3. Sequential Piloted Hydraulic Control System
4. Hard-wired Electrohydraulic Control System
5. Multiplexed Electrohydraulic Control System
Selection of fluids to be used should consider maximum operation temperature and
pressure that the fluid will be exposed to. Besides, compatibility of the fluid with system
components also have to be considered [5]. Two commonly used fluid for subsea
production system are high water content-based or synthetic hydrocarbon control fluids.
Mostly used fluid is high water content-based.
The characteristics of high water content-based fluid depend on the ethylene glycol
content (typically 10% to 40%), viscosity varies with temperature (normally 2-10oC). Due
to government regulations does not allow venting mineral-based oil into the sea, the
system that uses this type of fluid must be closed-loop system, which requires extra
conduit in the umbilical, thus making it more complex [6].
8
2.2 DIRECT HYDRAULIC CONTROL SYSTEM
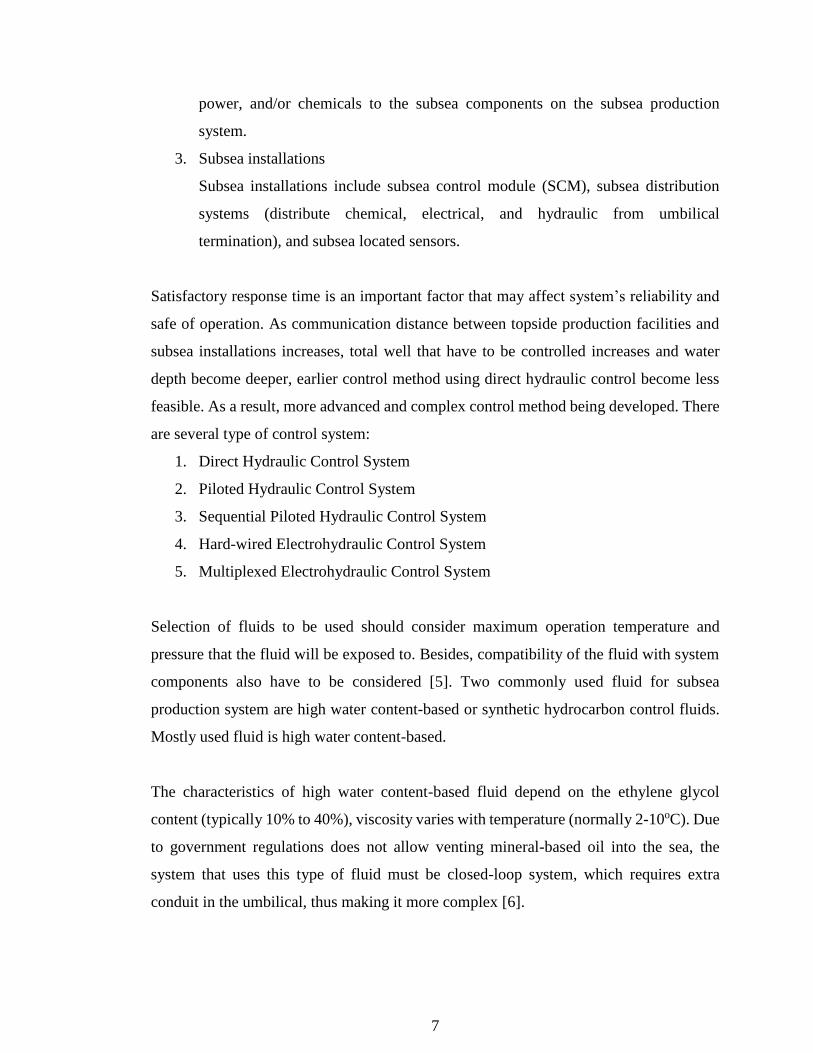
Direct hydraulic control system operation is the relatively simple and straight forward
system in which HPU and control panel for each well to be controlled located on the
topside facility. The control panel consist of solenoid-operated control valve which control
the flow of the hydraulic fluid. When operator set the control valve on control panel to
open position, allowing pressurized fluid to pass through and transported to actuator
located on the X-mas tree via umbilical hose.
Figure 4: Direct hydraulic control system [7]
The system advantages are relatively simple control system, high reliability, ease of
service, and minimization of subsea components [6]. Regardless of the strengths of the
control system, it also has downsides such as complex hydraulic line as it has to contain
all the individual line for each subsea function. The size of the umbilical also increased.
Hence, cost also increased. Besides that, it has slow response time caused by the need to
TOPSIDE
SUBSEA
9
pressurize the fluid until it reached the pressure that enough to operate subsea actuator or
to perform other task. Slow response of the hydraulic fluid is influenced by the fluid’s
properties (e.g. bulk modulus, viscosity), characteristics of the umbilical (e.g. wall
roughness, elasticity) and compliance and volume of actuators. Due to slow response time,
this type of control system is limited to applications where the distance between the
topside facility and the operated subsea equipment is less than 3-4 km [6].
2.2.1 Hydraulic Power Unit (HPU)
By NORSOK Standard’s requirement, HPU shall supply regulated hydraulic fluid to the
subsea installation. Output fluid from the HPU shall as a minimum satisfy cleanliness
requirement of NAS 1638 class 6. Hydraulic system shall be designed 10% above the
maximum operating pressure. Maximum operating pressure should be 5% above normal
operating pressure. Typical operation pressures for Christmas tree and manifold functions
are 3000 psi and 9000 psi for down hole safety valves (DHSV) functions. The pressure
difference is dictated by the function of water depth and process pressures [6].
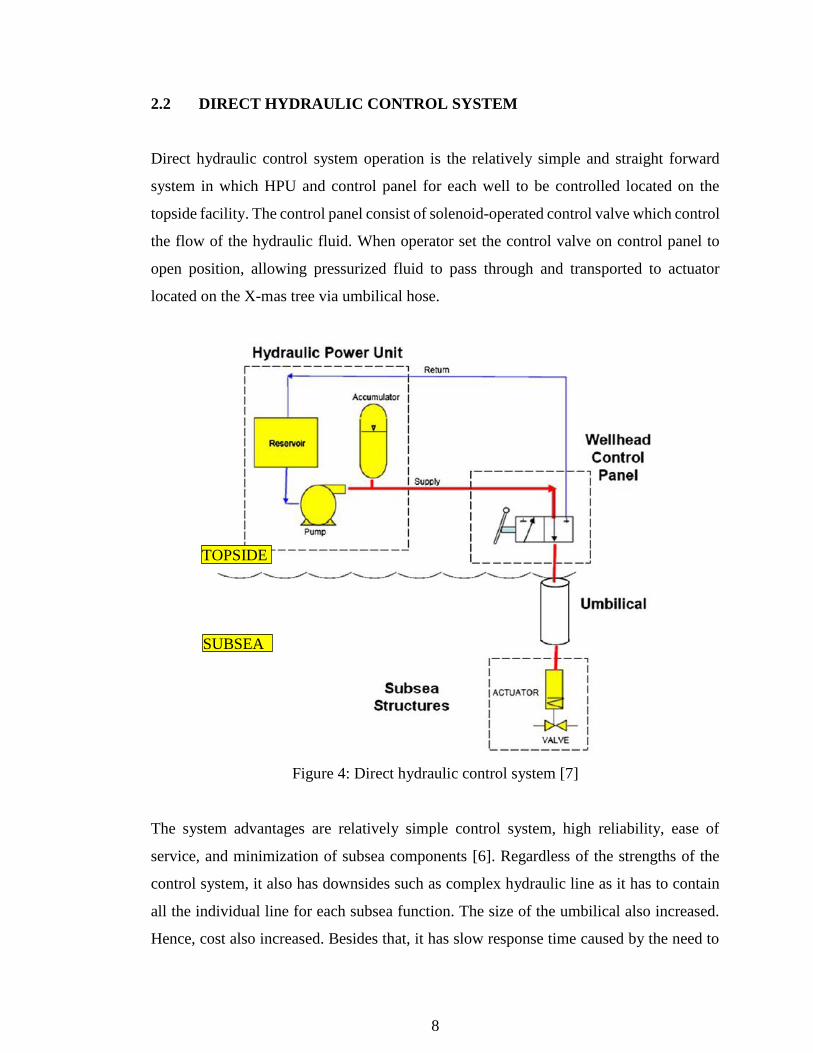
HPU functioned to supply fluid at correct pressure, flow rate and acceptable cleanliness
to remotely operated subsea valves through the umbilical. The reason for cleanliness is to
maintain the reliability of the system. Besides that, HPU also regulates supply pressure to
avoid overpressure or during insufficient hydraulic pressure. HPU normally installed on
the FPSO or platform or may be located onshore for subsea-to-beach tiebacks. Fluid is
supplied via the controls umbilical, the subsea hydraulic distribution system, and the
SCM’s to operate subsea valve actuators. The pressurized fluid provided by pump is
driven by an electric motor. There are many types of pump, but the most common type
uses accumulators that are charged by fix pumps. Redundancy for the motor pump sets
act as backups in case of pump failures or maintenance.
10
Figure 5: Hydraulic power unit [7]
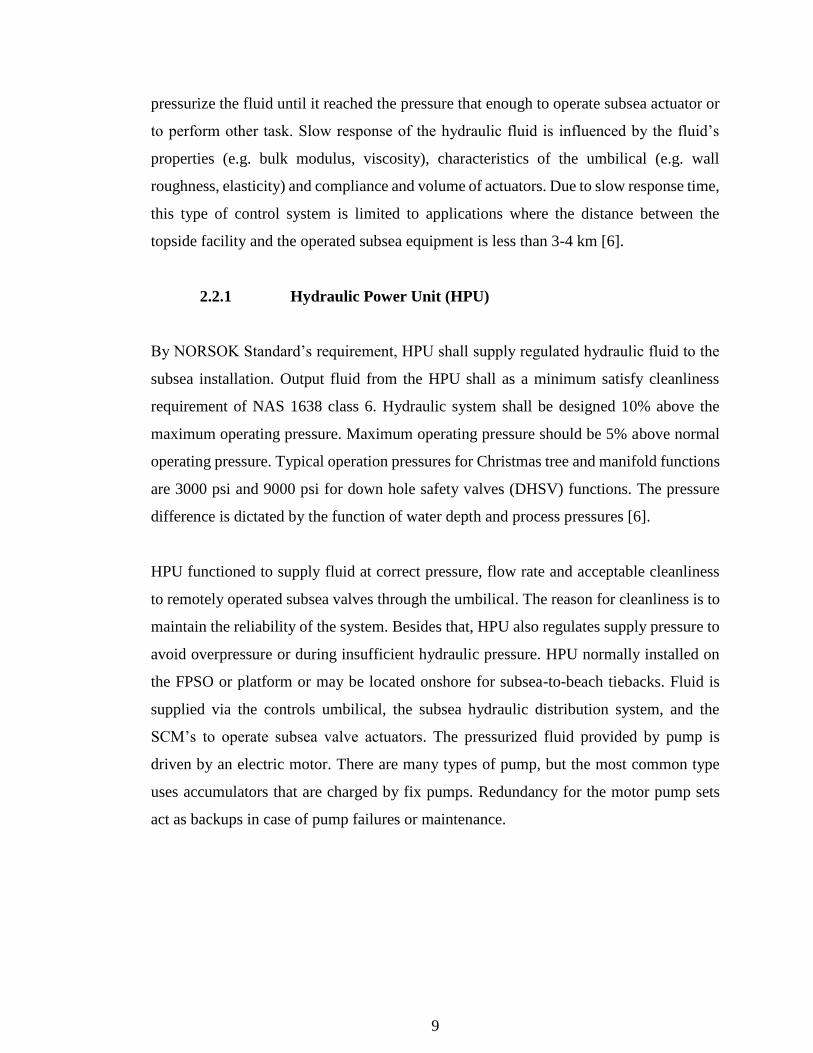
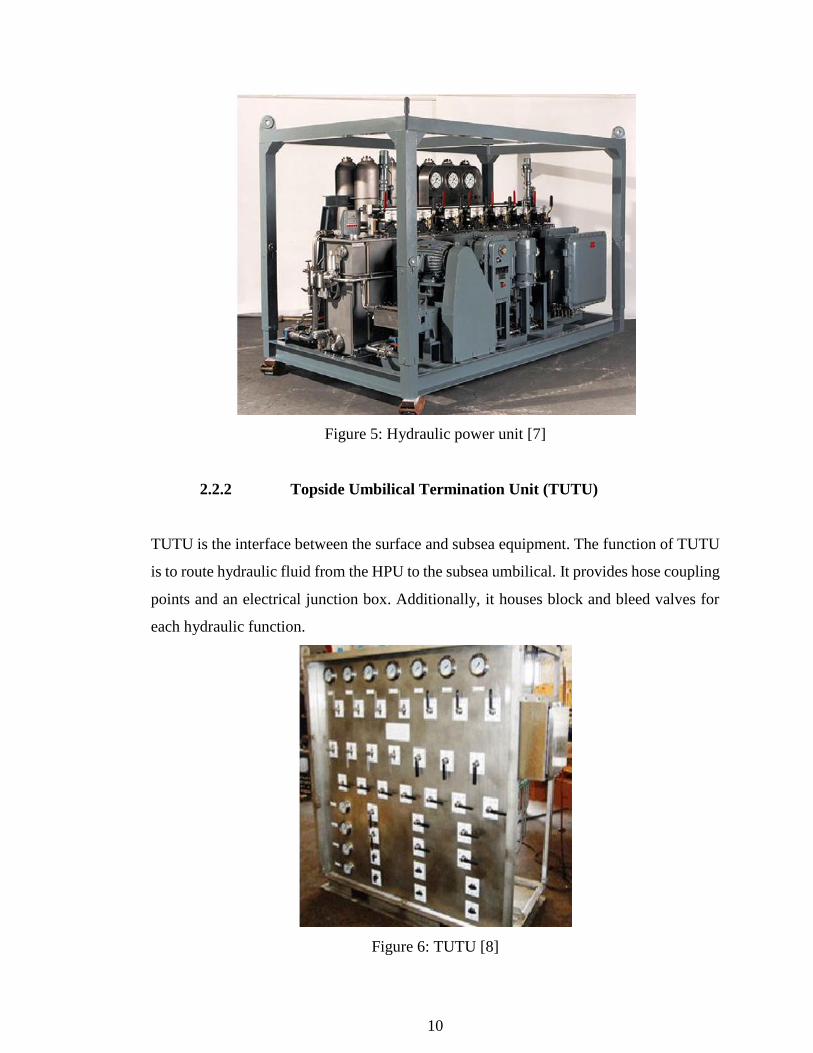
2.2.2 Topside Umbilical Termination Unit (TUTU)
TUTU is the interface between the surface and subsea equipment. The function of TUTU
is to route hydraulic fluid from the HPU to the subsea umbilical. It provides hose coupling
points and an electrical junction box. Additionally, it houses block and bleed valves for
each hydraulic function.
Figure 6: TUTU [8]
11
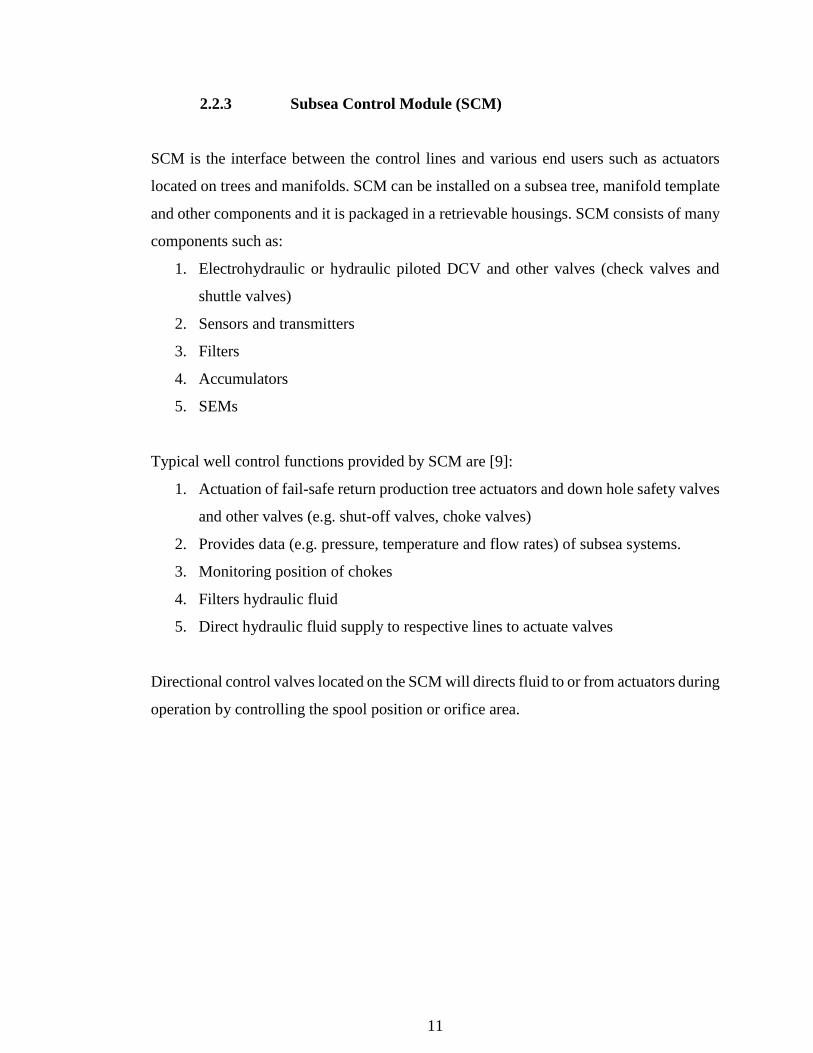
2.2.3 Subsea Control Module (SCM)
SCM is the interface between the control lines and various end users such as actuators
located on trees and manifolds. SCM can be installed on a subsea tree, manifold template
and other components and it is packaged in a retrievable housings. SCM consists of many
components such as:
1. Electrohydraulic or hydraulic piloted DCV and other valves (check valves and
shuttle valves)
2. Sensors and transmitters
3. Filters
4. Accumulators
5. SEMs
Typical well control functions provided by SCM are [9]:
1. Actuation of fail-safe return production tree actuators and down hole safety valves
and other valves (e.g. shut-off valves, choke valves)
2. Provides data (e.g. pressure, temperature and flow rates) of subsea systems.
3. Monitoring position of chokes
4. Filters hydraulic fluid
5. Direct hydraulic fluid supply to respective lines to actuate valves
Directional control valves located on the SCM will directs fluid to or from actuators during
operation by controlling the spool position or orifice area.
12
Figure 7: Typical subsea control module [10]
2.2.4 Umbilical
Umbilical is a composite cable containing tension wires, hydraulic pipes, electrical power,
control and communication signals which is installed from host facility to subsea
installations [11]. The main functions of the umbilical are:
1. To deliver control fluids or electric control signals to control the functions of
subsea equipment (e.g. tree, valves, manifold)
2. To convey chemical during chemical injection to subsea trees or manifolds
3. To monitor pressures in well annulus
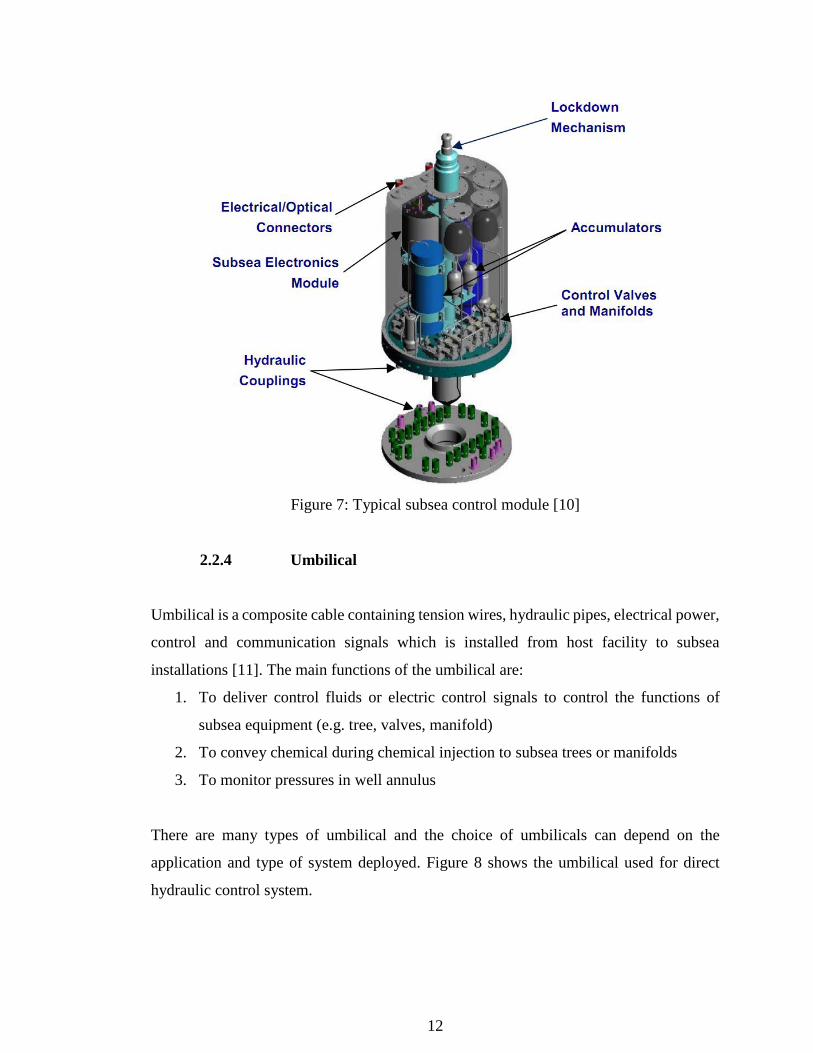
There are many types of umbilical and the choice of umbilicals can depend on the
application and type of system deployed. Figure 8 shows the umbilical used for direct
hydraulic control system.
13
Figure 8: Direct hydraulic umbilical [12]
Umbilical dimensions typically range up to 25.5 cm in diameter. The umbilical may be
very long, in some cases up to 20 km or more depending on the offset between the host
facility and the subsea equipment that it connecting to. To avoid any potential faults, the
umbilicals are fabricated in continuous length [6].
Due to long umbilical’s length, the flow resistance in the hydraulic line becomes
substantial and can affect the response time of the valve actuators in the system. The
ability of hoses to accumulate liquid can be a disadvantage in a system that requires rapid
bleeding of lines. However, this property can also turned into an advantage in systems
where large actuators are to be operated. Using hoses with high volumetric expansion can
be in some cases replace accumulators on the seabed.
The design of the hydraulic lines are important to the performance and operation of the
whole system. It is therefore important that model of the hose is accurate, and that it
includes the delays that are experienced in real operations [13]. There are many types of
umbilical available such as hybrid umbilical, thermoplastic, steel tube, optical fibre and
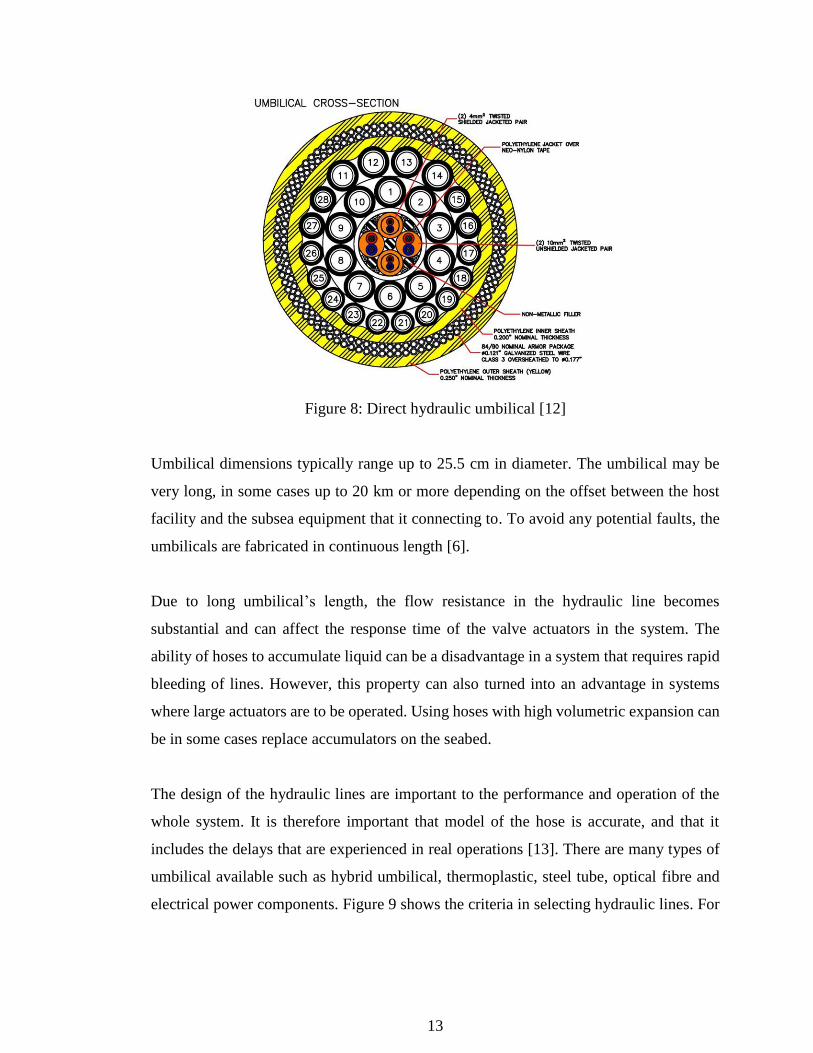
electrical power components. Figure 9 shows the criteria in selecting hydraulic lines. For
14
this report, 2 criteria of hydraulic line will be simulated to investigate the impact on the
system response time which are the length of control line and size of hose bore.
Figure 9: Hydraulic control line criteria [4]
2.2.5 Valve Actuator
Typically, linear actuators are used in the SPCS [13]. In subsea production system,
production valve is used to control oil and gas flow from wells. Wellhead Xmas tree is
installed on top of the wells comprises process control valves, where each process control
valve is provided with an actuator for the operation of the valves. Actuators can be
operated electrically or hydraulically but mostly for wellhead Xmas tree, hydraulic
actuator is used.
15
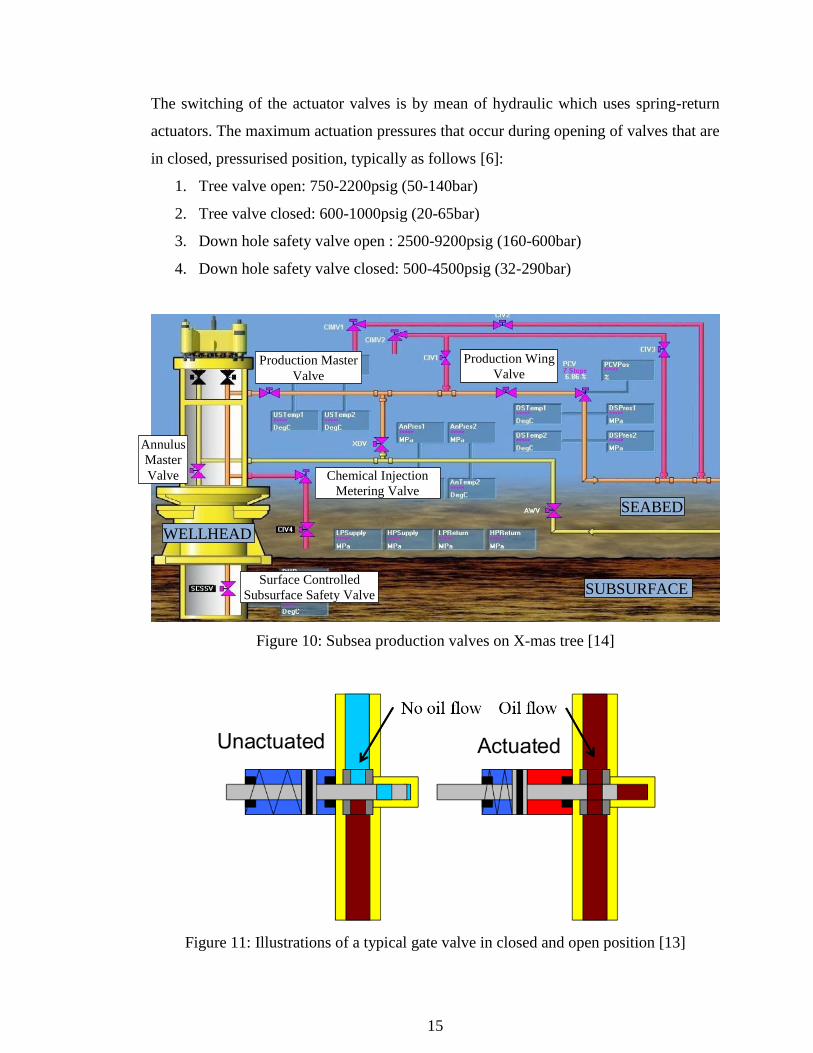
The switching of the actuator valves is by mean of hydraulic which uses spring-return
actuators. The maximum actuation pressures that occur during opening of valves that are
in closed, pressurised position, typically as follows [6]:
1. Tree valve open: 750-2200psig (50-140bar)
2. Tree valve closed: 600-1000psig (20-65bar)
3. Down hole safety valve open : 2500-9200psig (160-600bar)
4. Down hole safety valve closed: 500-4500psig (32-290bar)
Figure 10: Subsea production valves on X-mas tree [14]
Figure 11: Illustrations of a typical gate valve in closed and open position [13]
Annulus
Master
Valve Chemical Injection
Metering Valve
Production Master
Valve
SEABED
SUBSURFACE
WELLHEAD
Production Wing
Valve
Surface Controlled
Subsurface Safety Valve
16
2.3 ARTICLES REVIEWED
Subsea production control system has been crucial and the most interesting topic for
researchers. The need for new technology to be applied in the field drives researchers to
continually investigate potential technology that can be introduced to overcome
challenges found in the field.
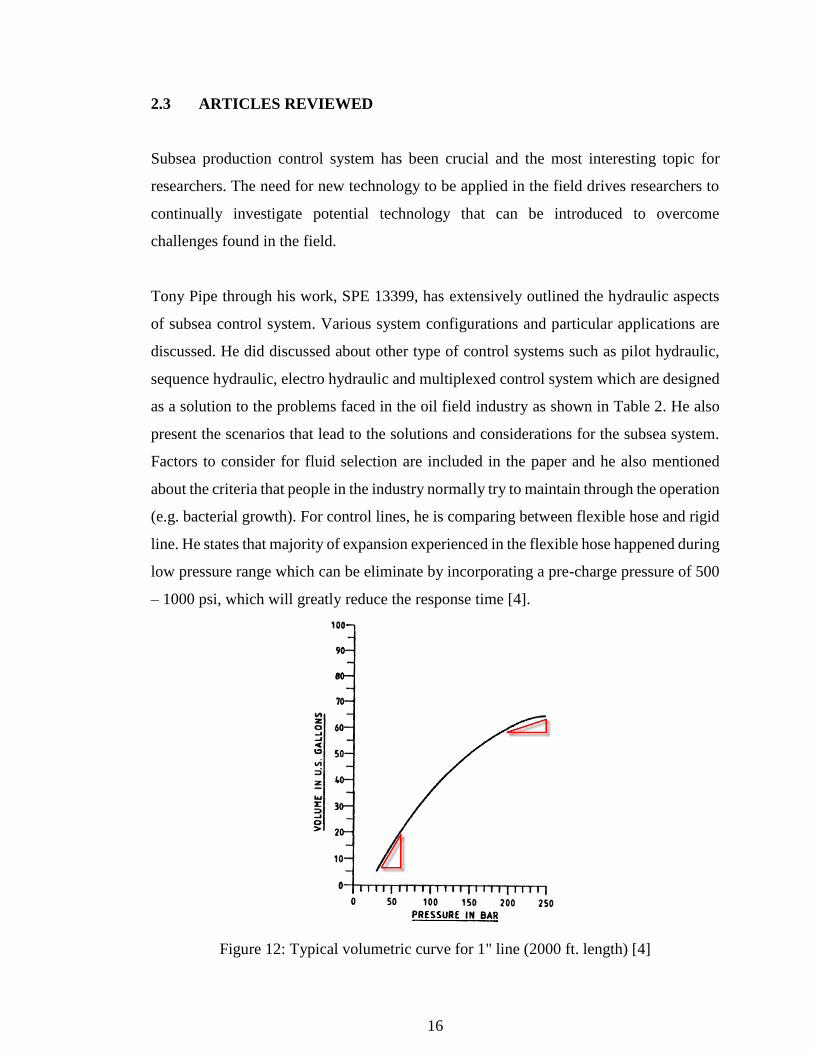
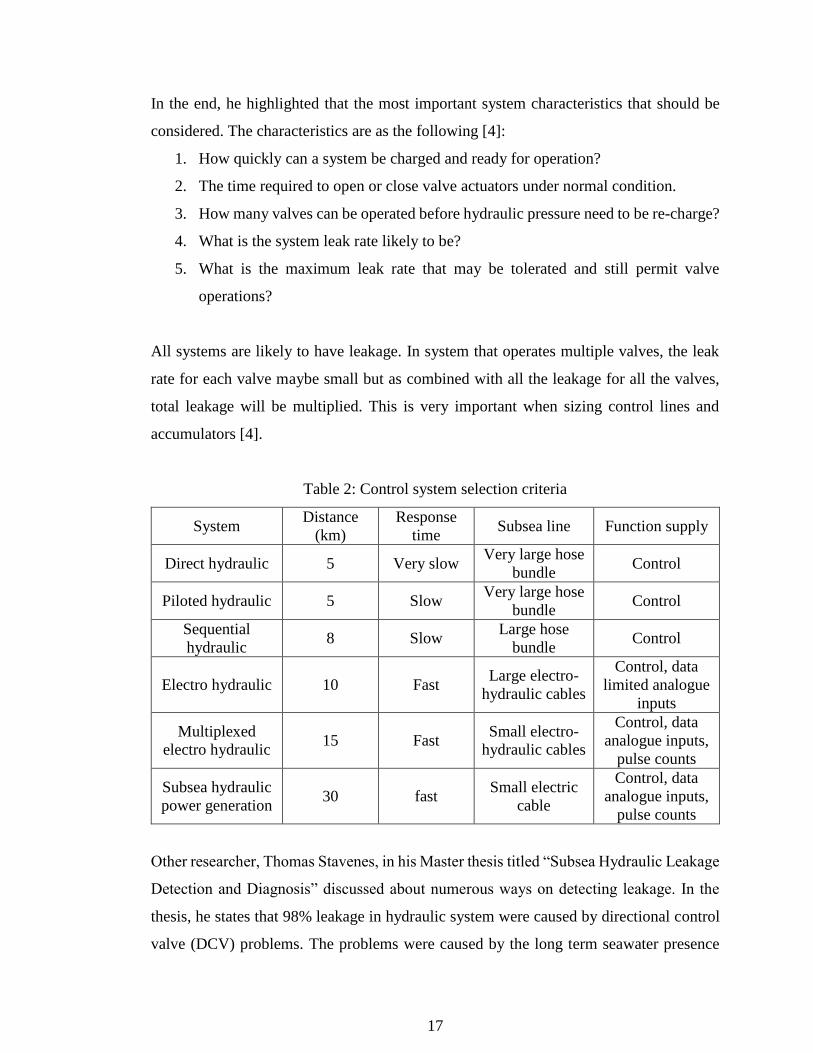
Tony Pipe through his work, SPE 13399, has extensively outlined the hydraulic aspects
of subsea control system. Various system configurations and particular applications are
discussed. He did discussed about other type of control systems such as pilot hydraulic,
sequence hydraulic, electro hydraulic and multiplexed control system which are designed
as a solution to the problems faced in the oil field industry as shown in Table 2. He also
present the scenarios that lead to the solutions and considerations for the subsea system.
Factors to consider for fluid selection are included in the paper and he also mentioned
about the criteria that people in the industry normally try to maintain through the operation
(e.g. bacterial growth). For control lines, he is comparing between flexible hose and rigid
line. He states that majority of expansion experienced in the flexible hose happened during
low pressure range which can be eliminate by incorporating a pre-charge pressure of 500
– 1000 psi, which will greatly reduce the response time [4].
Figure 12: Typical volumetric curve for 1" line (2000 ft. length) [4]
17
In the end, he highlighted that the most important system characteristics that should be
considered. The characteristics are as the following [4]:
1. How quickly can a system be charged and ready for operation?
2. The time required to open or close valve actuators under normal condition.
3. How many valves can be operated before hydraulic pressure need to be re-charge?
4. What is the system leak rate likely to be?
5. What is the maximum leak rate that may be tolerated and still permit valve
operations?
All systems are likely to have leakage. In system that operates multiple valves, the leak
rate for each valve maybe small but as combined with all the leakage for all the valves,
total leakage will be multiplied. This is very important when sizing control lines and
accumulators [4].
Table 2: Control system selection criteria
System Distance
(km)
Response
time Subsea line Function supply
Direct hydraulic 5 Very slow Very large hose
bundle Control
Piloted hydraulic 5 Slow Very large hose
bundle Control
Sequential
hydraulic 8 Slow
Large hose
bundle Control
Electro hydraulic 10 Fast Large electro-
hydraulic cables
Control, data
limited analogue
inputs
Multiplexed
electro hydraulic 15 Fast
Small electro-
hydraulic cables
Control, data
analogue inputs,
pulse counts
Subsea hydraulic
power generation 30 fast
Small electric
cable
Control, data
analogue inputs,
pulse counts
Other researcher, Thomas Stavenes, in his Master thesis titled “Subsea Hydraulic Leakage
Detection and Diagnosis” discussed about numerous ways on detecting leakage. In the
thesis, he states that 98% leakage in hydraulic system were caused by directional control
valve (DCV) problems. The problems were caused by the long term seawater presence
18
due to the seawater ingress during installation. Besides that, hydraulic fluid caused
biodegradation that led to the DCV leakage. In other statement, he states that close circuit
system is more reliable than open circuit system due to seawater ingress and type of fluid
used (water based or mineral based) [15].
The following state-of-the-art leakage detection and diagnosis methods that can be used
for pipeline [15].
1. Line balance calculation (conservative of mass)
2. Real time transient model (simulation model)
3. Statistical analysis (by comparing historical data)
4. Pressure/flow monitoring
The author also mentioned about the current leakage detection and diagnosis efforts that
are used such GE Smart Centre which responsible to monitor and gather data from subsea
from around the world, and then interpret the data to gain knowledge for decision
purposes. Another technology used by FMC is Condition and Performance Maintenance
(CPM) which functioned to monitor systems including subsea control system. Data
collected from SCM and sensors are then processed for decision purposes [15].
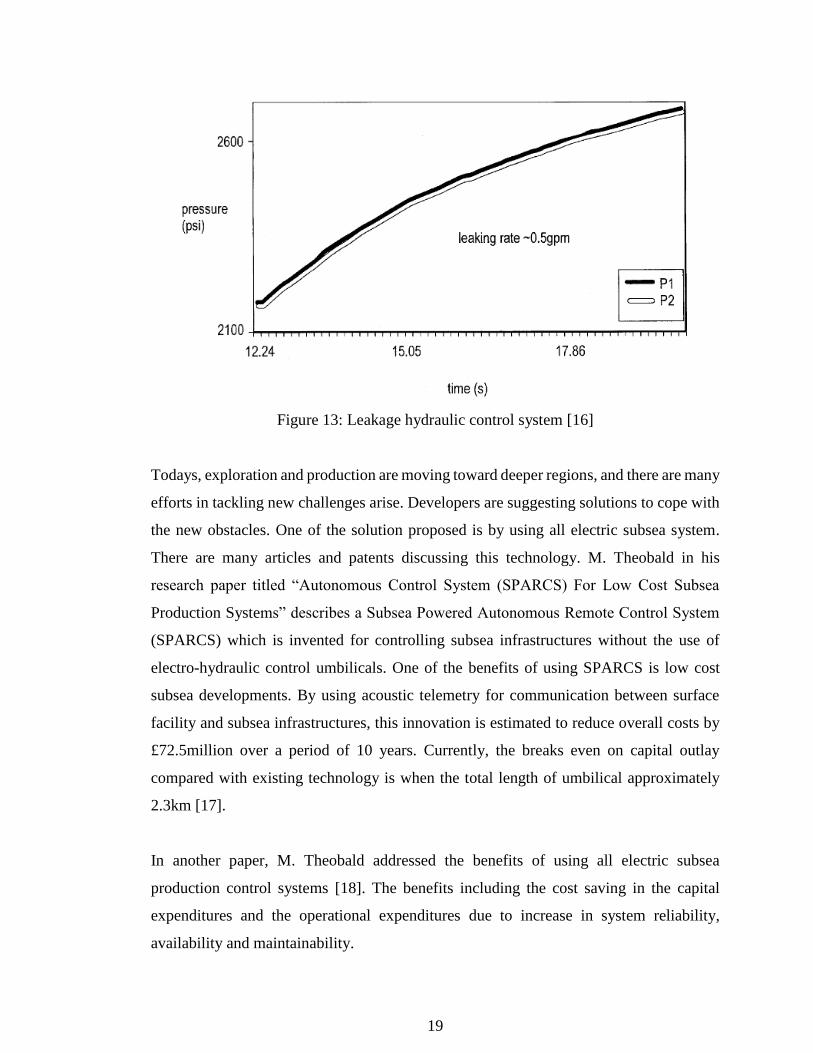
Another work done a group of three inventors to detect leakage in subsea production
control system. In the patent, leakage detection is done by monitoring the valves
signatures during accumulator recharging. The pressure differential between two points
adjacent to subsea equipment (before and after component) should be zero for non-leaking
system. Figure 13 shows leaking hydraulic control system of an approximately 5 gpm
[16].
19
Figure 13: Leakage hydraulic control system [16]
Todays, exploration and production are moving toward deeper regions, and there are many
efforts in tackling new challenges arise. Developers are suggesting solutions to cope with
the new obstacles. One of the solution proposed is by using all electric subsea system.
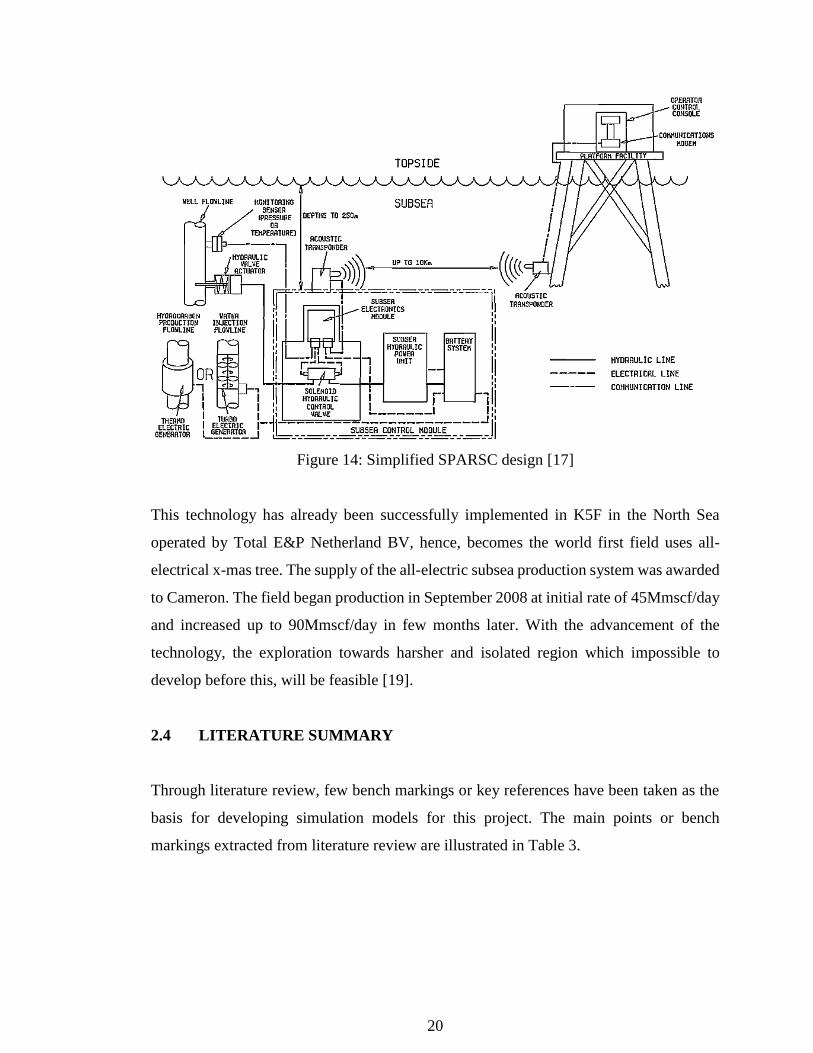
There are many articles and patents discussing this technology. M. Theobald in his
research paper titled “Autonomous Control System (SPARCS) For Low Cost Subsea
Production Systems” describes a Subsea Powered Autonomous Remote Control System
(SPARCS) which is invented for controlling subsea infrastructures without the use of
electro-hydraulic control umbilicals. One of the benefits of using SPARCS is low cost
subsea developments. By using acoustic telemetry for communication between surface
facility and subsea infrastructures, this innovation is estimated to reduce overall costs by
£72.5million over a period of 10 years. Currently, the breaks even on capital outlay
compared with existing technology is when the total length of umbilical approximately
2.3km [17].
In another paper, M. Theobald addressed the benefits of using all electric subsea
production control systems [18]. The benefits including the cost saving in the capital
expenditures and the operational expenditures due to increase in system reliability,
availability and maintainability.
20
Figure 14: Simplified SPARSC design [17]
This technology has already been successfully implemented in K5F in the North Sea
operated by Total E&P Netherland BV, hence, becomes the world first field uses all-
electrical x-mas tree. The supply of the all-electric subsea production system was awarded
to Cameron. The field began production in September 2008 at initial rate of 45Mmscf/day
and increased up to 90Mmscf/day in few months later. With the advancement of the
technology, the exploration towards harsher and isolated region which impossible to
develop before this, will be feasible [19].
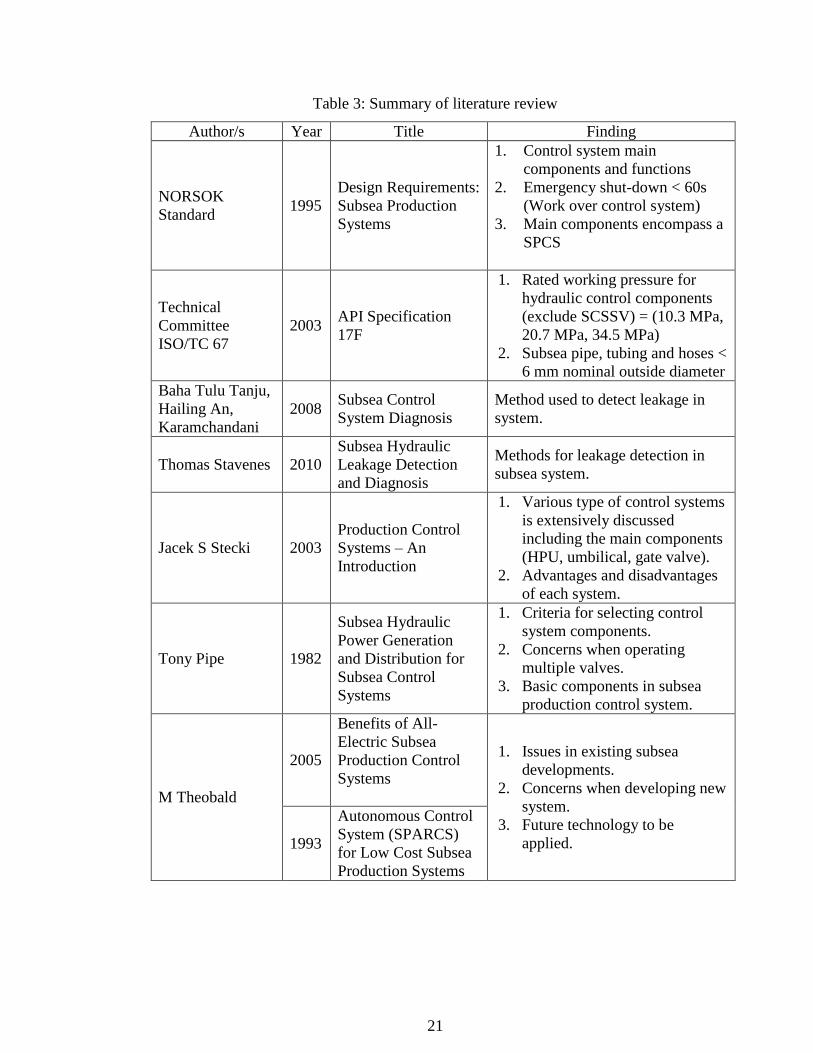
2.4 LITERATURE SUMMARY
Through literature review, few bench markings or key references have been taken as the
basis for developing simulation models for this project. The main points or bench
markings extracted from literature review are illustrated in Table 3.
21
Table 3: Summary of literature review
Author/s Year Title Finding
NORSOK
Standard 1995
Design Requirements:
Subsea Production
Systems
1. Control system main
components and functions
2. Emergency shut-down < 60s
(Work over control system)
3. Main components encompass a
SPCS
Technical
Committee
ISO/TC 67
2003 API Specification
17F
1. Rated working pressure for
hydraulic control components
(exclude SCSSV) = (10.3 MPa,
20.7 MPa, 34.5 MPa)
2. Subsea pipe, tubing and hoses <
6 mm nominal outside diameter
Baha Tulu Tanju,
Hailing An,
Karamchandani
2008 Subsea Control
System Diagnosis
Method used to detect leakage in
system.
Thomas Stavenes 2010
Subsea Hydraulic
Leakage Detection
and Diagnosis
Methods for leakage detection in
subsea system.
Jacek S Stecki 2003
Production Control
Systems – An
Introduction
1. Various type of control systems
is extensively discussed
including the main components
(HPU, umbilical, gate valve).
2. Advantages and disadvantages
of each system.
Tony Pipe 1982
Subsea Hydraulic
Power Generation
and Distribution for
Subsea Control
Systems
1. Criteria for selecting control
system components.
2. Concerns when operating
multiple valves.
3. Basic components in subsea
production control system.
M Theobald
2005
Benefits of All-
Electric Subsea
Production Control
Systems
1. Issues in existing subsea
developments.
2. Concerns when developing new
system.
3. Future technology to be
applied. 1993
Autonomous Control
System (SPARCS)
for Low Cost Subsea
Production Systems
22
2.5 AGITO SIMULATIONX
SimulationX is a program for modelling, computation, simulation, and reliability analysis
of components and systems in many areas of technological development. The
computational includes mechanics, fluid, control, electrical technology and magnetics are
represented by models which are found in the libraries. With the integrated models found
in SimulationX’s library, systems or models can be designed fast and efficiently with
validated standard elements. This include subsea hydraulic library which contain
commonly used elements.
Users also can create their own models without the need for setting up differential
equations, signal flow diagrams or transfer functions. Elements can be arranged and
connected graphically in order to resemble the physical structures of needed systems or
components. The variables such as the pressure, temperature, density are kept as simple
as possible and close to the technical device. Furthermore, it also can be manipulated to
comply with the experimental system’s parameters. An extensive fluid library offers a
great variety of predefined hydraulic fluids. However, users can easily modify the
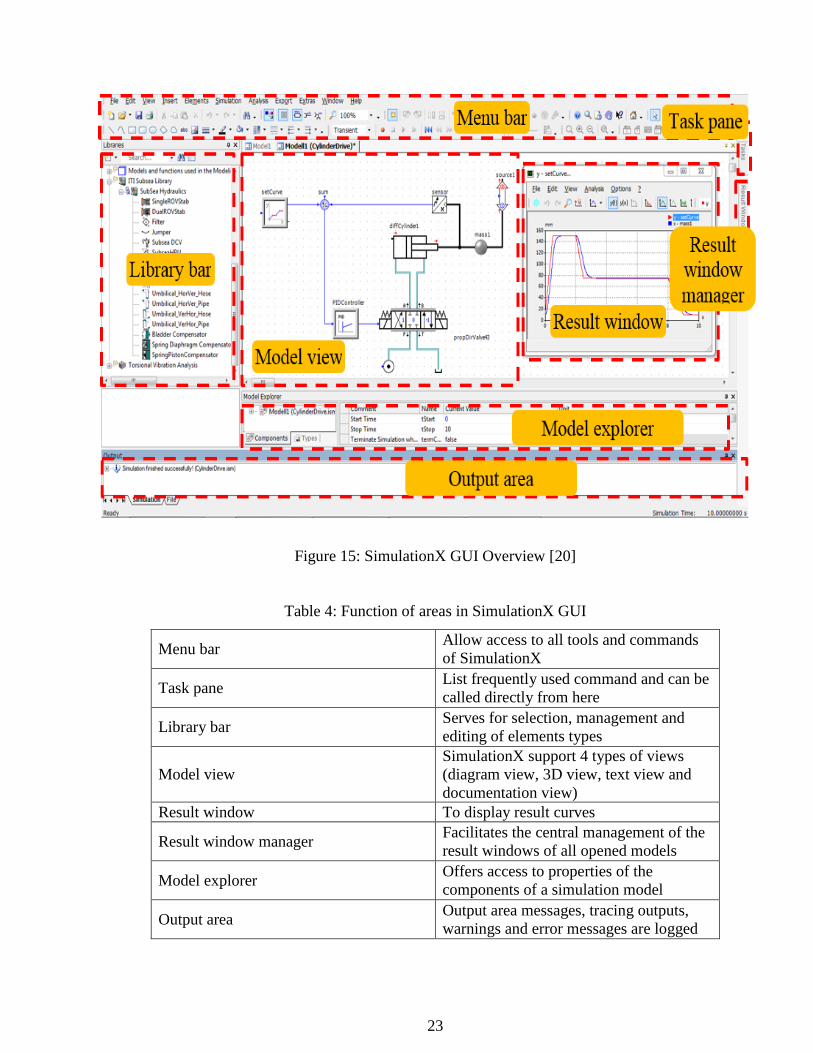
predefine fluid as needed [20]. The working area of ITI SimulationX can be subdivided
into different windows and areas as illustrated in Figure 15.
23
Figure 15: SimulationX GUI Overview [20]
Table 4: Function of areas in SimulationX GUI
Menu bar Allow access to all tools and commands
of SimulationX
Task pane List frequently used command and can be
called directly from here
Library bar Serves for selection, management and
editing of elements types
Model view
SimulationX support 4 types of views
(diagram view, 3D view, text view and
documentation view)
Result window To display result curves
Result window manager Facilitates the central management of the
result windows of all opened models
Model explorer Offers access to properties of the
components of a simulation model
Output area Output area messages, tracing outputs,
warnings and error messages are logged
24
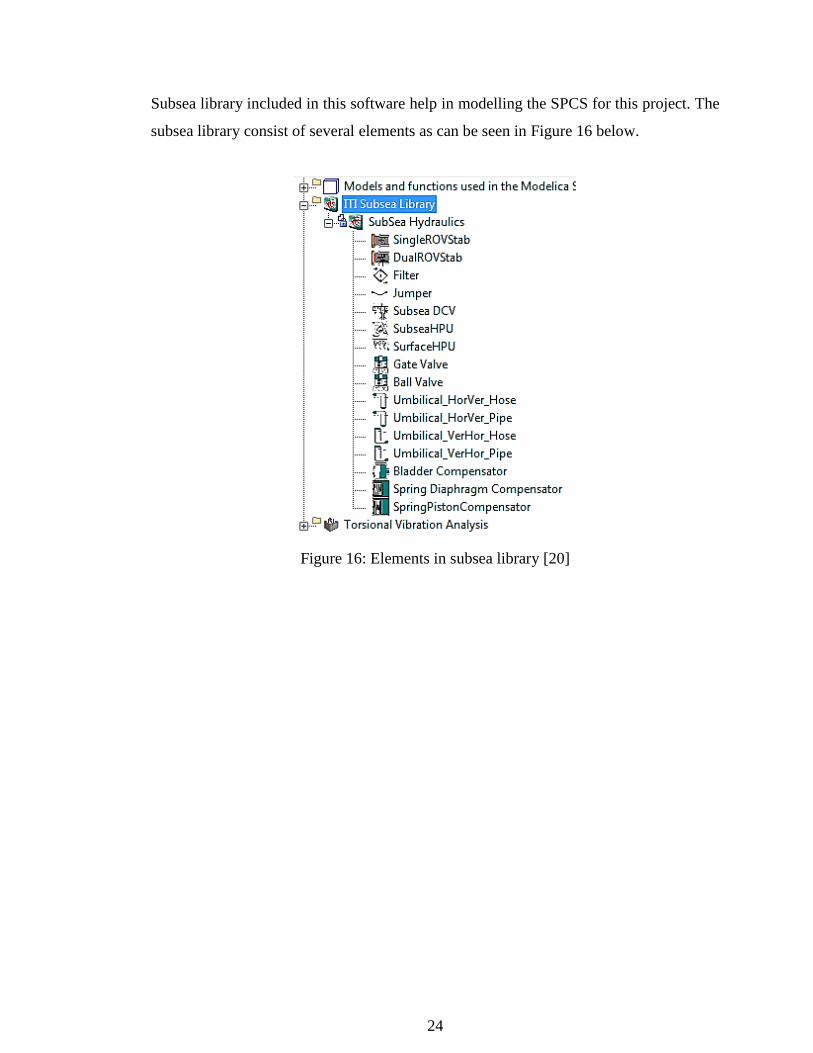
Subsea library included in this software help in modelling the SPCS for this project. The
subsea library consist of several elements as can be seen in Figure 16 below.
Figure 16: Elements in subsea library [20]
25
CHAPTER 3
METHODOLOGY
3.1 WORKFLOW
This project work aims to investigate the effect of varying length and diameter of
umbilical, and size of actuator to the model’s signal time and shift time. Firstly, simulation
model have to be developed. In this chapter, work flow of this project is elaborated. For
this project, direct hydraulic control system have been chosen to be modelled. The reasons
for choosing direct hydraulic control system are:
1. Direct hydraulic control system is the simplest control system. Therefore it will
not generate complex simulation model as the components included are hydraulic
power unit, control panel, umbilical, subsea control module, and actuator.
2. Direct hydraulic control system is the most common control system. For this
reason, huge range of aids can be found to assist model development.
3. Can be a stepping stone in understanding newer and complicated control system
such as electro-hydraulic control system.
4. As the case study selected for this project used a direct hydraulic control system,
therefore, simulation model is developed based on the real system for the
validation purposes.
Modelling and simulation of SPCS involves observing the system, noting various
components that building it, developing an acceptable representation of the system for
further study and experimentation virtually to understand its behaviours, interaction
between components and evaluate the operations of the system. With proper analysis,
suggestions can be made for further improvement of the system.
26
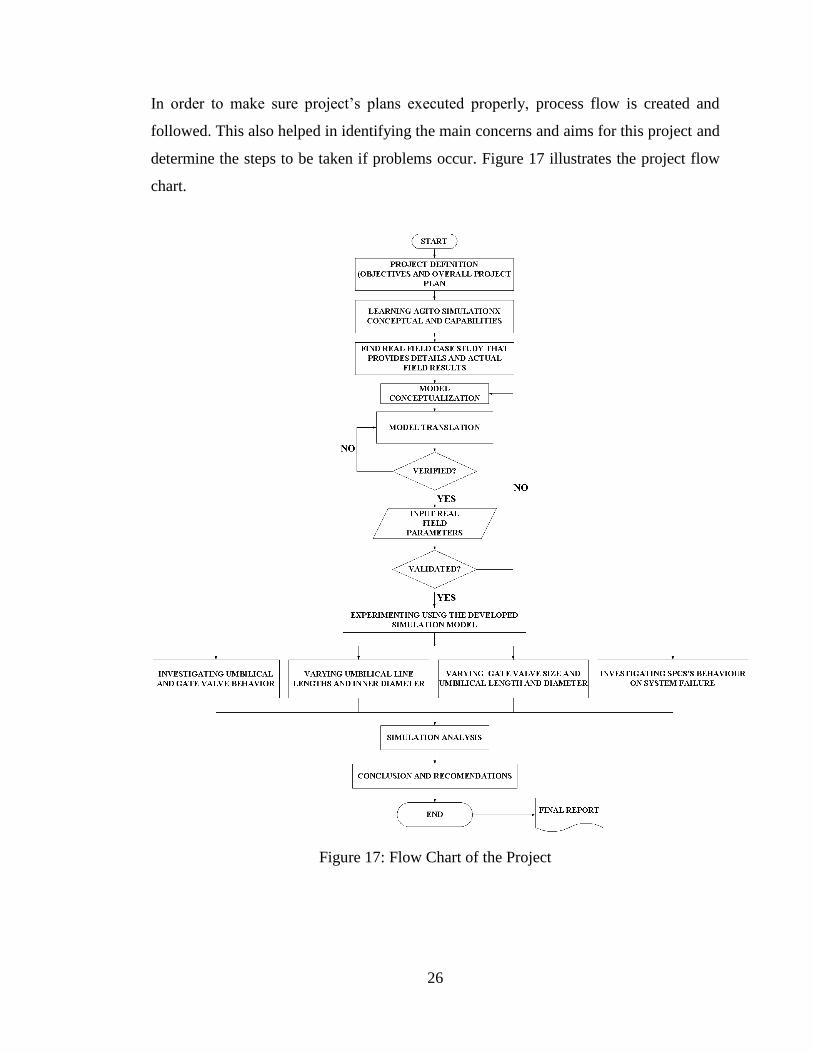
In order to make sure project’s plans executed properly, process flow is created and
followed. This also helped in identifying the main concerns and aims for this project and
determine the steps to be taken if problems occur. Figure 17 illustrates the project flow
chart.
Figure 17: Flow Chart of the Project
27
3.2 PROJECT ACTIVITIES
Project Gantt chart can be seen in appendices section. It is the list of all the activities done
throughout this project.
3.3 CASE STUDY
SPE 12001 by W.S. Manuel and J.E. Hall has been acquired and selected for further study
[21]. The report on Cadlao oil field located in Philippines shows the performances of the
field using a direct hydraulic control system. The experimental testing in the SPE 12001
report was simulated in 29 different operating conditions and data and results from this
report is crucial for this project especially in validating the developed simulation model.
Due to time constrain only a few of the tests will be used to validate simulation model.
The offshore 20 m depth Cadlao oil field located 400km southwest of Manila in the
offshore North West Palawan, Philippines was discovered in 1977 by Amoco. The field
is then developed in 1981 and produced about 11.235 mmbbls of light oil (47o API) from
two wells by natural flow. Its production stopped in 1991 due to high operating costs and
low oil prices. Two reports showed that the remaining oil reserves is around 6 mmbbls
(most likely) and 4 mmbbls (proven) [22]. Redevelopment of the field by Blade Petroleum
Limited that act as the operator with share of 80% of equity interest in the field and
VenturOil Philippines Inc. has the 20% of the equity interest.
The reasons why Cadlao oil field has been chosen as case study are:
All the required parameters for this project is well presented in the report by W.S.
Manuel and J.E. Hall and therefore making the simulation possible.
The testing results conducted at Cameron Iron Works plant in Berwick, Louisiana
are also included in the report. Hence, validation of developed control system is
possible by comparing the performance curves of the field and the acquired results
from model.
28
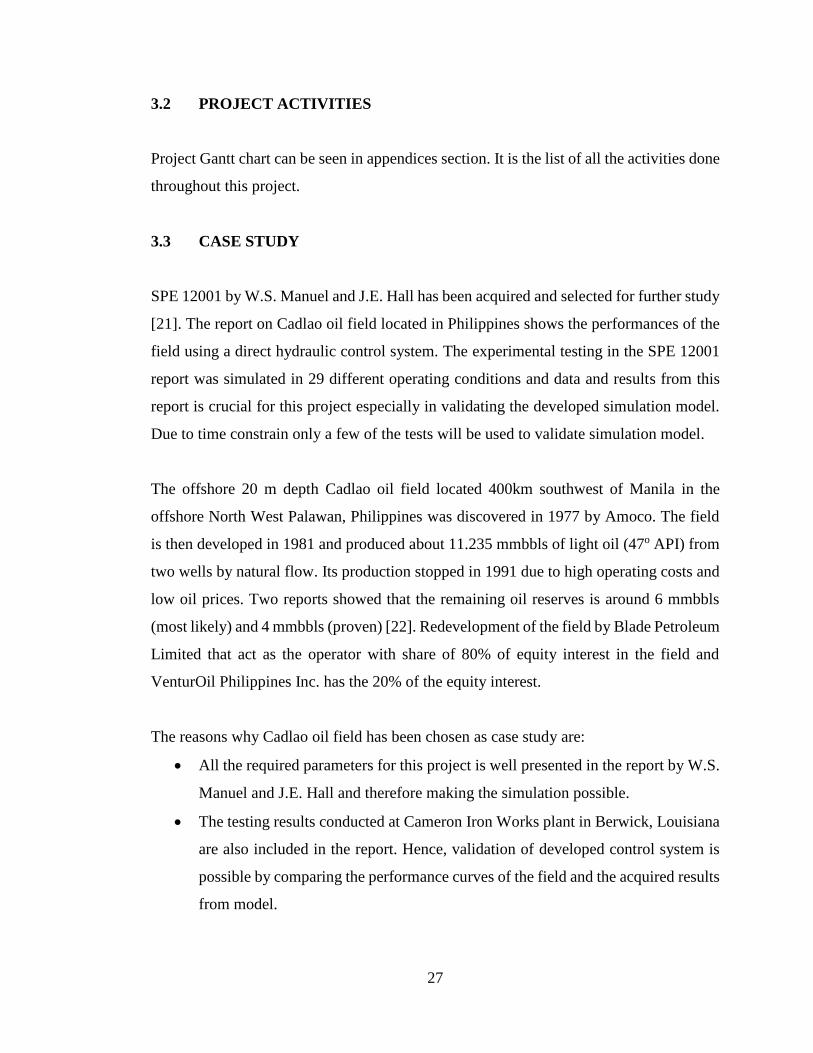
Figure 18: Cadlao Oil Field [23]
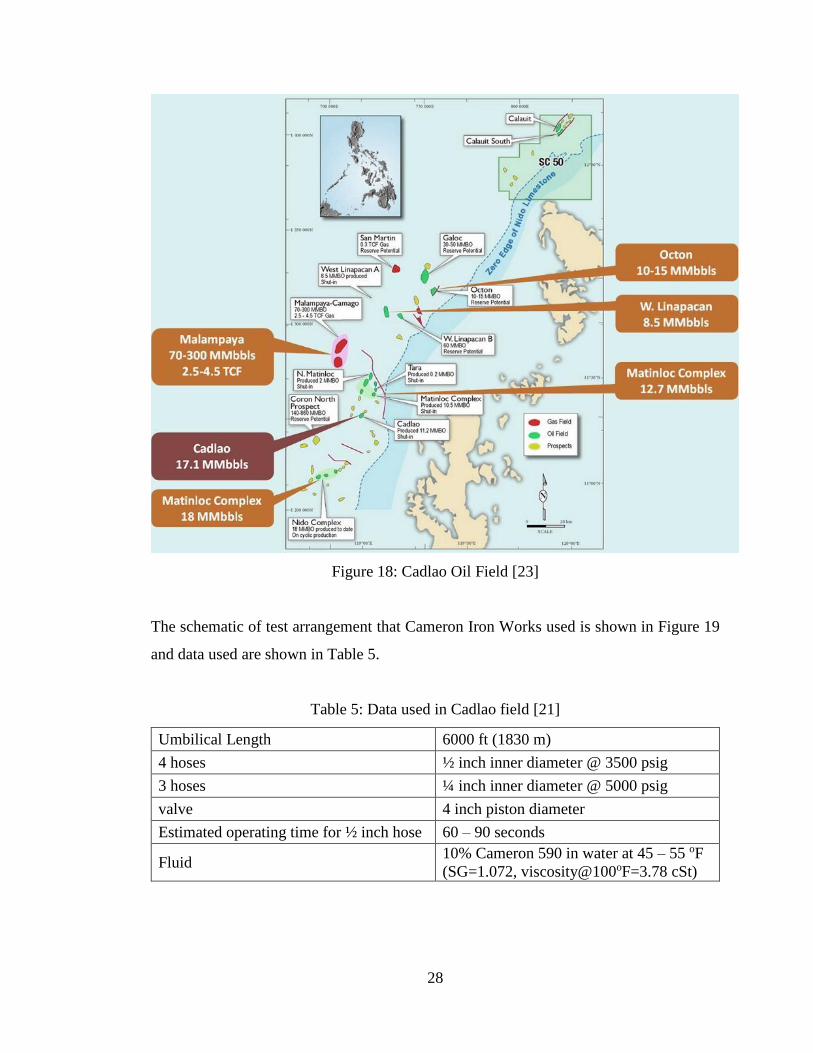
The schematic of test arrangement that Cameron Iron Works used is shown in Figure 19
and data used are shown in Table 5.
Table 5: Data used in Cadlao field [21]
Umbilical Length 6000 ft (1830 m)
4 hoses ½ inch inner diameter @ 3500 psig
3 hoses ¼ inch inner diameter @ 5000 psig
valve 4 inch piston diameter
Estimated operating time for ½ inch hose 60 – 90 seconds
Fluid 10% Cameron 590 in water at 45 – 55 oF
(SG=1.072, viscosity@100oF=3.78 cSt)
29
Figure 19: Schematic of test arrangement [21]
The reason for presenting the schematic diagram and the data is to show that the simulation
model developed is based on the system’s configuration used by the Cameron Iron Works.
The real data are used in simulating the developed model and validation done by
comparing results acquired with the actual results.
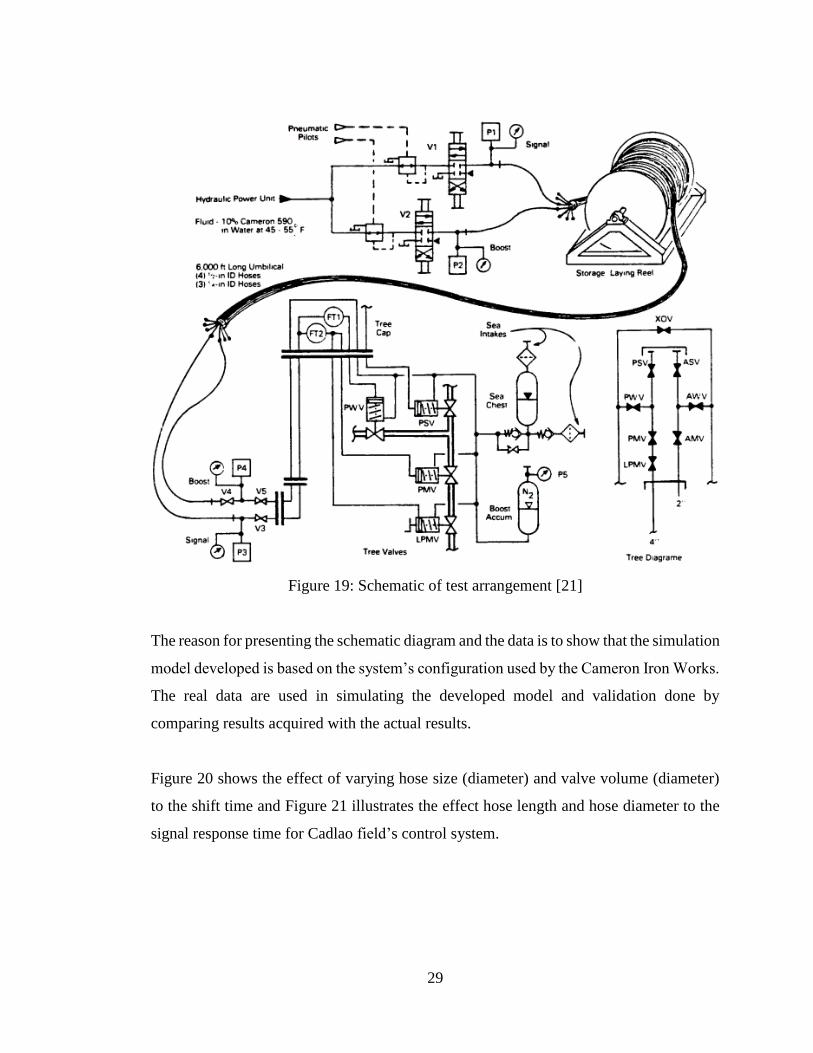
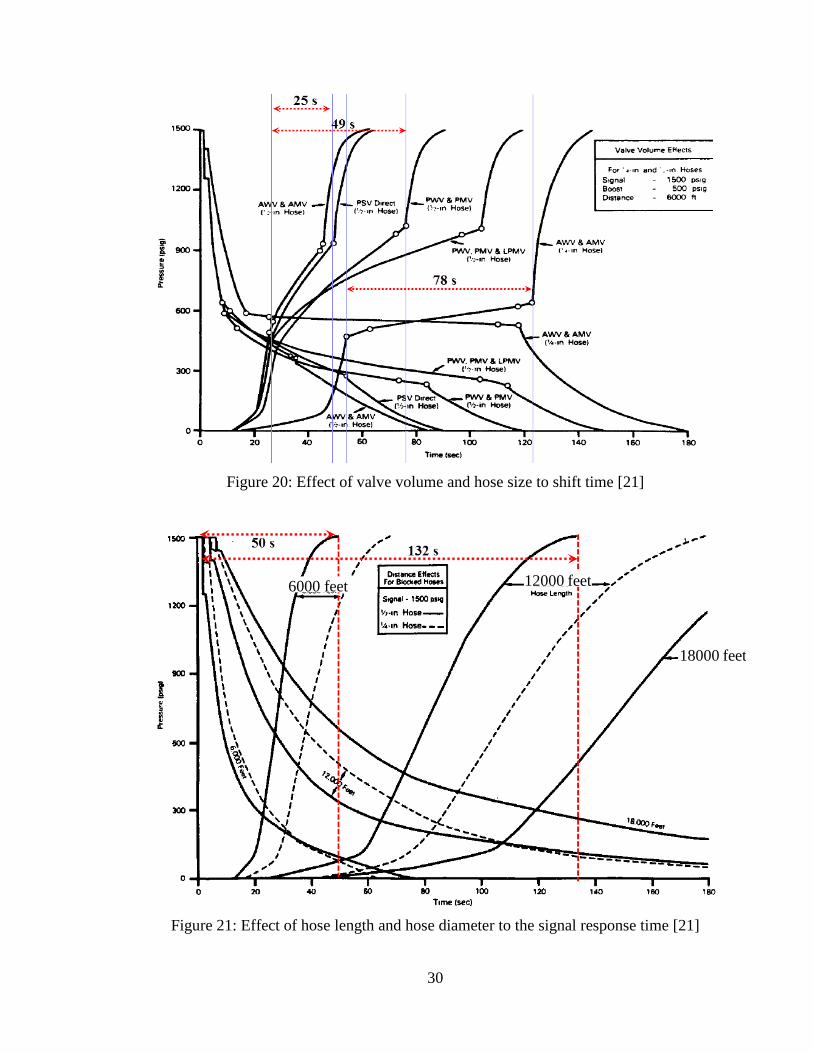
Figure 20 shows the effect of varying hose size (diameter) and valve volume (diameter)
to the shift time and Figure 21 illustrates the effect hose length and hose diameter to the
signal response time for Cadlao field’s control system.
30
Figure 20: Effect of valve volume and hose size to shift time [21]
Figure 21: Effect of hose length and hose diameter to the signal response time [21]
6000 feet 12000 feet
18000 feet
31
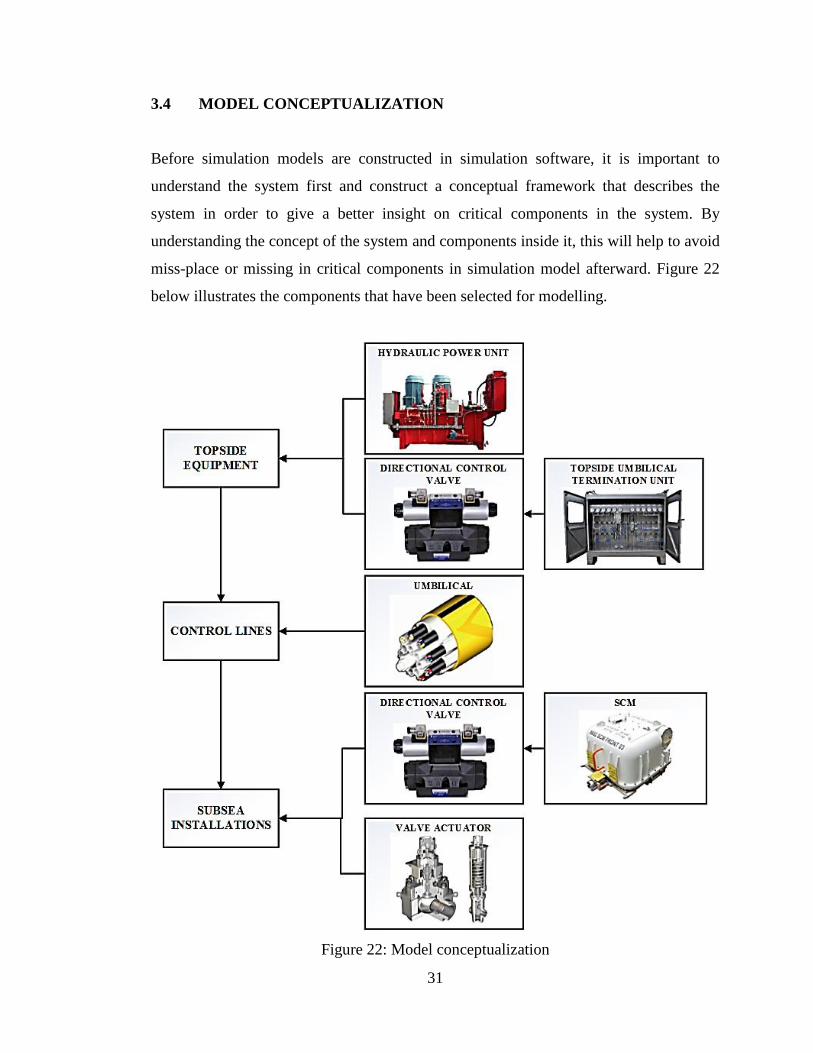
3.4 MODEL CONCEPTUALIZATION
Before simulation models are constructed in simulation software, it is important to
understand the system first and construct a conceptual framework that describes the
system in order to give a better insight on critical components in the system. By
understanding the concept of the system and components inside it, this will help to avoid
miss-place or missing in critical components in simulation model afterward. Figure 22
below illustrates the components that have been selected for modelling.
Figure 22: Model conceptualization
32
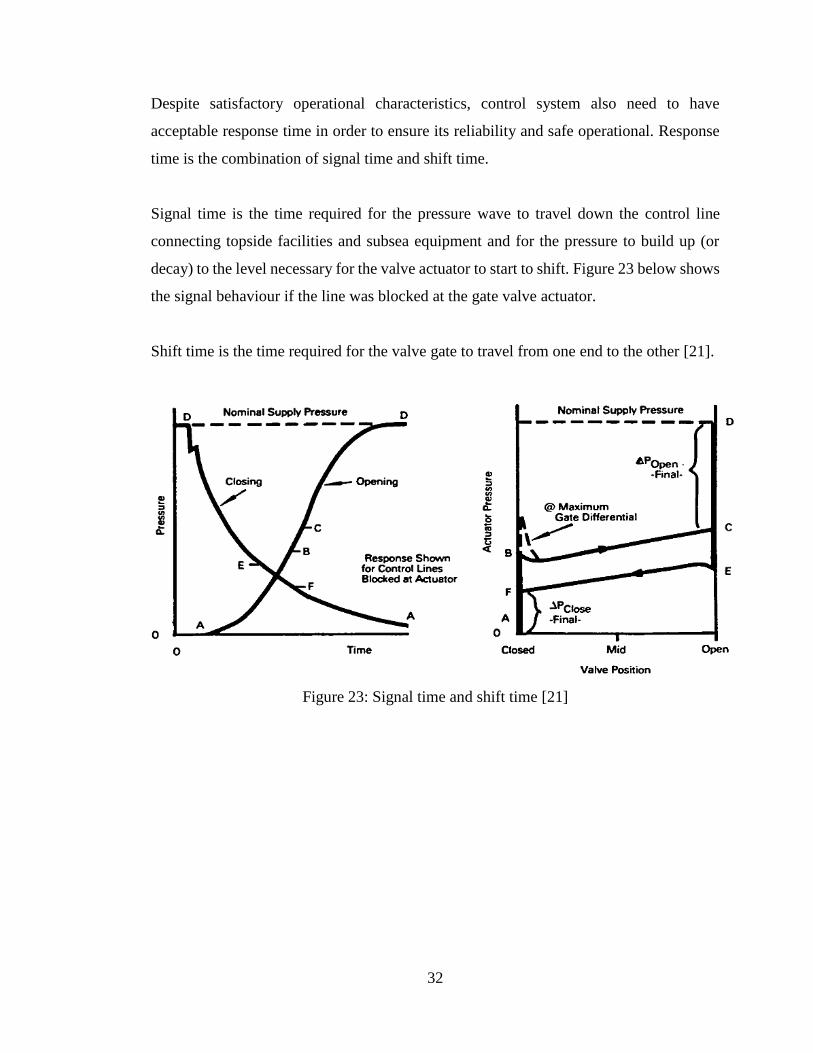
Despite satisfactory operational characteristics, control system also need to have
acceptable response time in order to ensure its reliability and safe operational. Response
time is the combination of signal time and shift time.
Signal time is the time required for the pressure wave to travel down the control line
connecting topside facilities and subsea equipment and for the pressure to build up (or
decay) to the level necessary for the valve actuator to start to shift. Figure 23 below shows
the signal behaviour if the line was blocked at the gate valve actuator.
Shift time is the time required for the valve gate to travel from one end to the other [21].
Figure 23: Signal time and shift time [21]
33
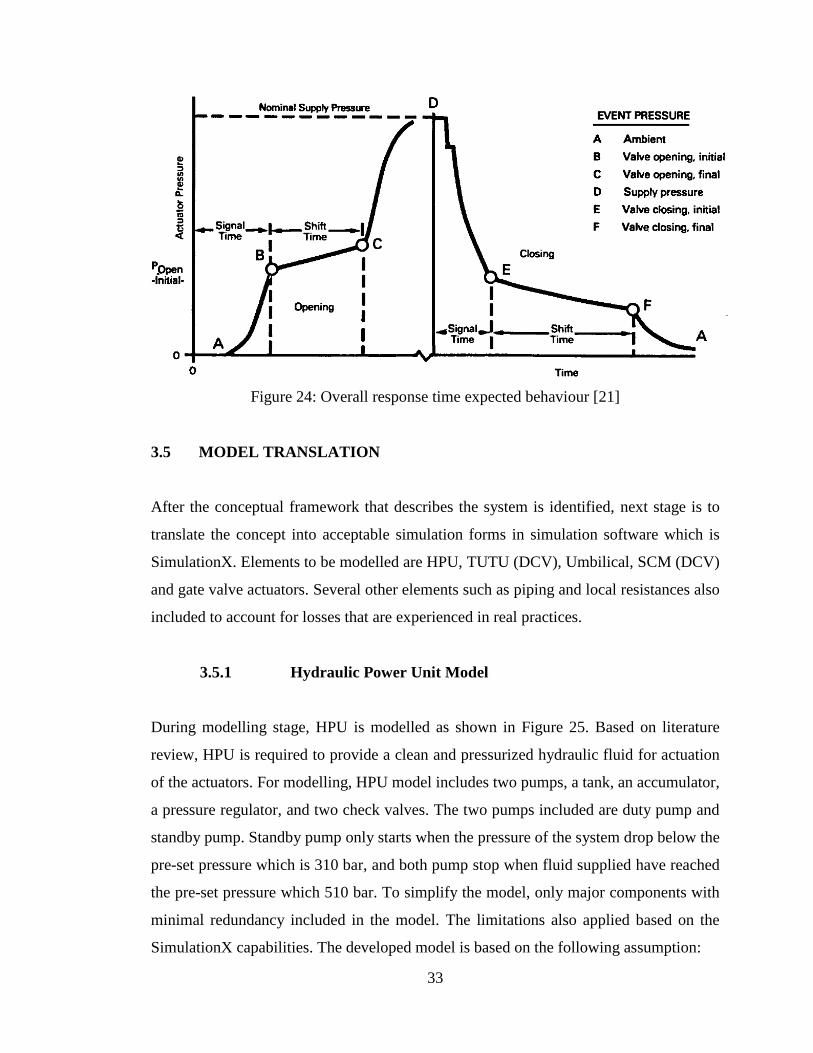
Figure 24: Overall response time expected behaviour [21]
3.5 MODEL TRANSLATION
After the conceptual framework that describes the system is identified, next stage is to
translate the concept into acceptable simulation forms in simulation software which is
SimulationX. Elements to be modelled are HPU, TUTU (DCV), Umbilical, SCM (DCV)
and gate valve actuators. Several other elements such as piping and local resistances also
included to account for losses that are experienced in real practices.
3.5.1 Hydraulic Power Unit Model
During modelling stage, HPU is modelled as shown in Figure 25. Based on literature
review, HPU is required to provide a clean and pressurized hydraulic fluid for actuation
of the actuators. For modelling, HPU model includes two pumps, a tank, an accumulator,
a pressure regulator, and two check valves. The two pumps included are duty pump and
standby pump. Standby pump only starts when the pressure of the system drop below the
pre-set pressure which is 310 bar, and both pump stop when fluid supplied have reached
the pre-set pressure which 510 bar. To simplify the model, only major components with
minimal redundancy included in the model. The limitations also applied based on the
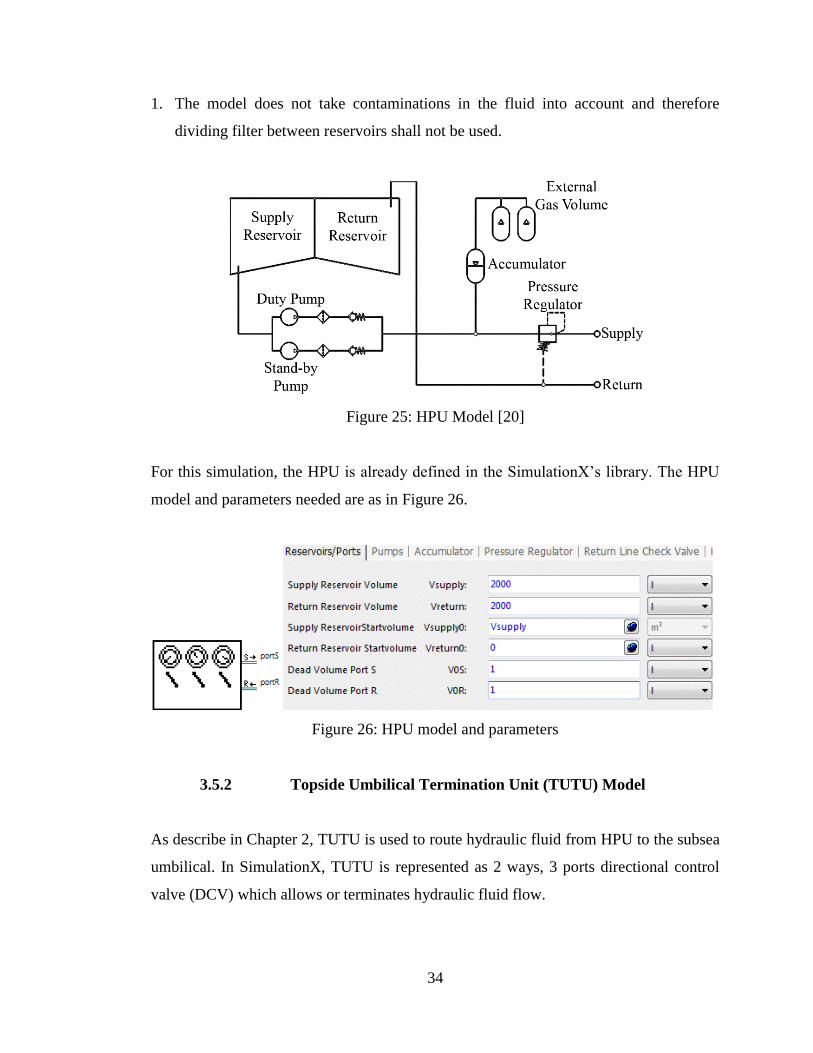
SimulationX capabilities. The developed model is based on the following assumption:
34
1. The model does not take contaminations in the fluid into account and therefore
dividing filter between reservoirs shall not be used.
Figure 25: HPU Model [20]
For this simulation, the HPU is already defined in the SimulationX’s library. The HPU
model and parameters needed are as in Figure 26.
Figure 26: HPU model and parameters
3.5.2 Topside Umbilical Termination Unit (TUTU) Model
As describe in Chapter 2, TUTU is used to route hydraulic fluid from HPU to the subsea
umbilical. In SimulationX, TUTU is represented as 2 ways, 3 ports directional control
valve (DCV) which allows or terminates hydraulic fluid flow.
35
Figure 27: TUTU model and parameters
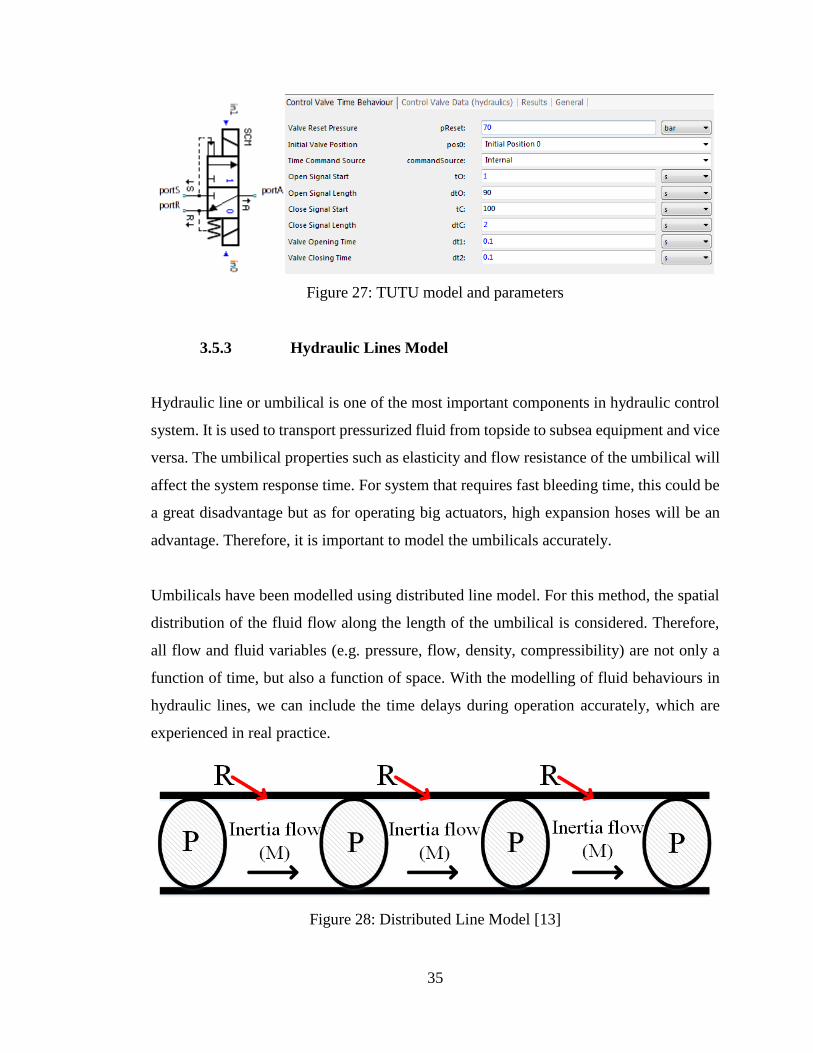
3.5.3 Hydraulic Lines Model
Hydraulic line or umbilical is one of the most important components in hydraulic control
system. It is used to transport pressurized fluid from topside to subsea equipment and vice
versa. The umbilical properties such as elasticity and flow resistance of the umbilical will
affect the system response time. For system that requires fast bleeding time, this could be
a great disadvantage but as for operating big actuators, high expansion hoses will be an
advantage. Therefore, it is important to model the umbilicals accurately.
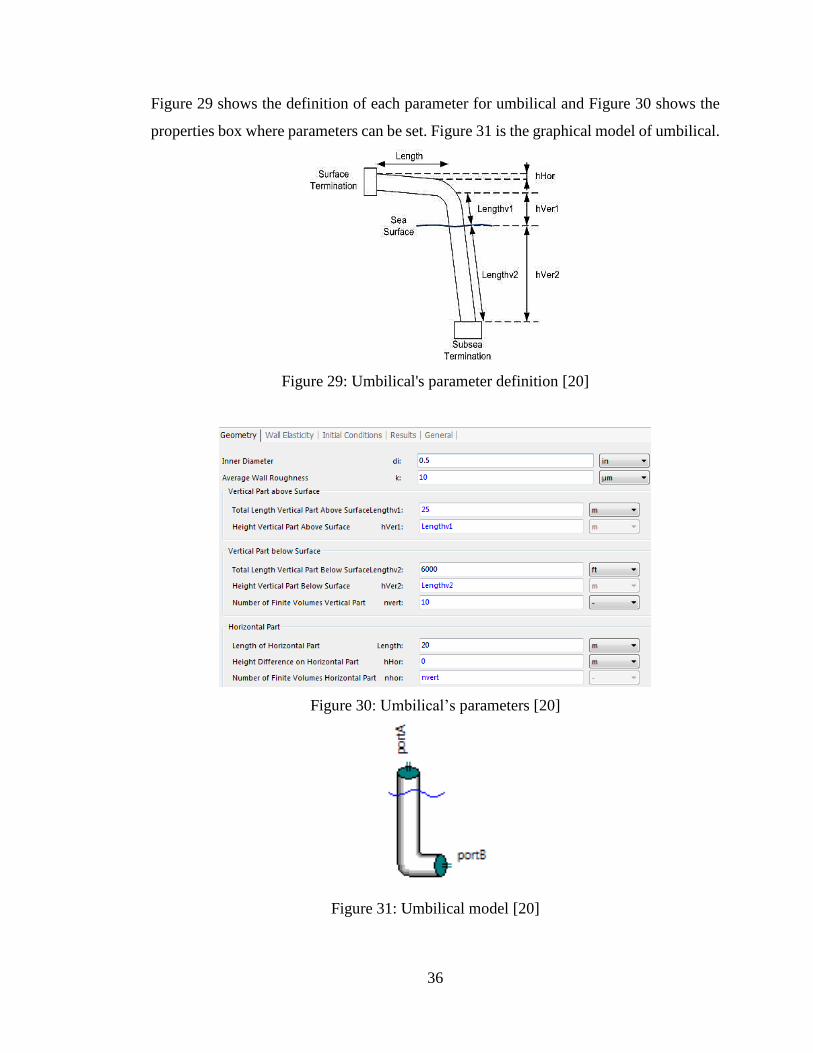
Umbilicals have been modelled using distributed line model. For this method, the spatial
distribution of the fluid flow along the length of the umbilical is considered. Therefore,
all flow and fluid variables (e.g. pressure, flow, density, compressibility) are not only a
function of time, but also a function of space. With the modelling of fluid behaviours in
hydraulic lines, we can include the time delays during operation accurately, which are
experienced in real practice.
Figure 28: Distributed Line Model [13]
36
Figure 29 shows the definition of each parameter for umbilical and Figure 30 shows the
properties box where parameters can be set. Figure 31 is the graphical model of umbilical.
Figure 29: Umbilical's parameter definition [20]
Figure 30: Umbilical’s parameters [20]
Figure 31: Umbilical model [20]
37
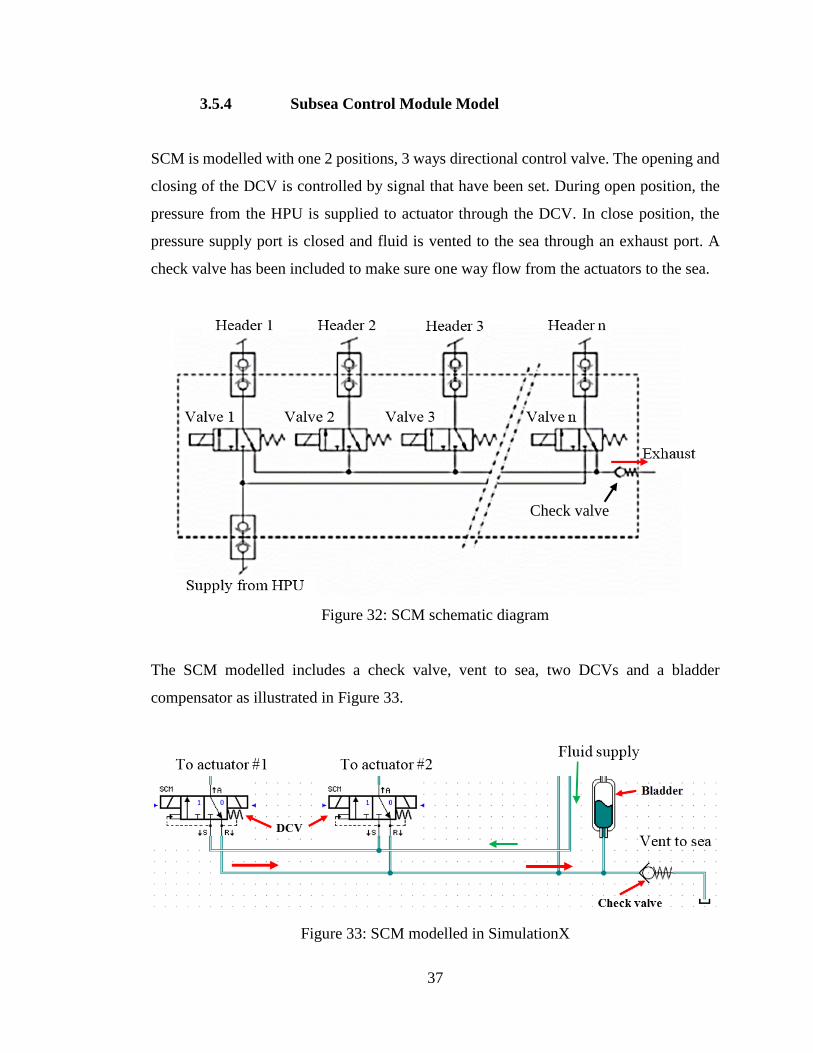
3.5.4 Subsea Control Module Model
SCM is modelled with one 2 positions, 3 ways directional control valve. The opening and
closing of the DCV is controlled by signal that have been set. During open position, the
pressure from the HPU is supplied to actuator through the DCV. In close position, the
pressure supply port is closed and fluid is vented to the sea through an exhaust port. A
check valve has been included to make sure one way flow from the actuators to the sea.
Figure 32: SCM schematic diagram
The SCM modelled includes a check valve, vent to sea, two DCVs and a bladder
compensator as illustrated in Figure 33.
Figure 33: SCM modelled in SimulationX
Check valve
38
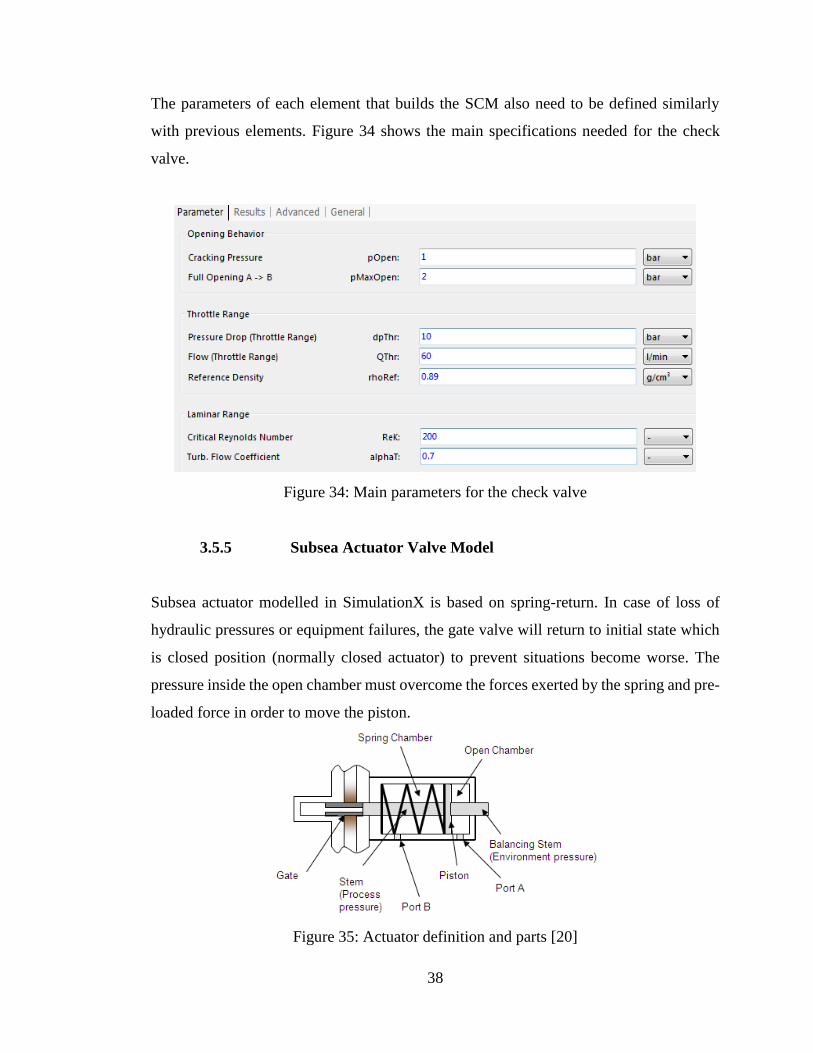
The parameters of each element that builds the SCM also need to be defined similarly
with previous elements. Figure 34 shows the main specifications needed for the check
valve.
Figure 34: Main parameters for the check valve
3.5.5 Subsea Actuator Valve Model
Subsea actuator modelled in SimulationX is based on spring-return. In case of loss of
hydraulic pressures or equipment failures, the gate valve will return to initial state which
is closed position (normally closed actuator) to prevent situations become worse. The
pressure inside the open chamber must overcome the forces exerted by the spring and pre-
loaded force in order to move the piston.
Figure 35: Actuator definition and parts [20]
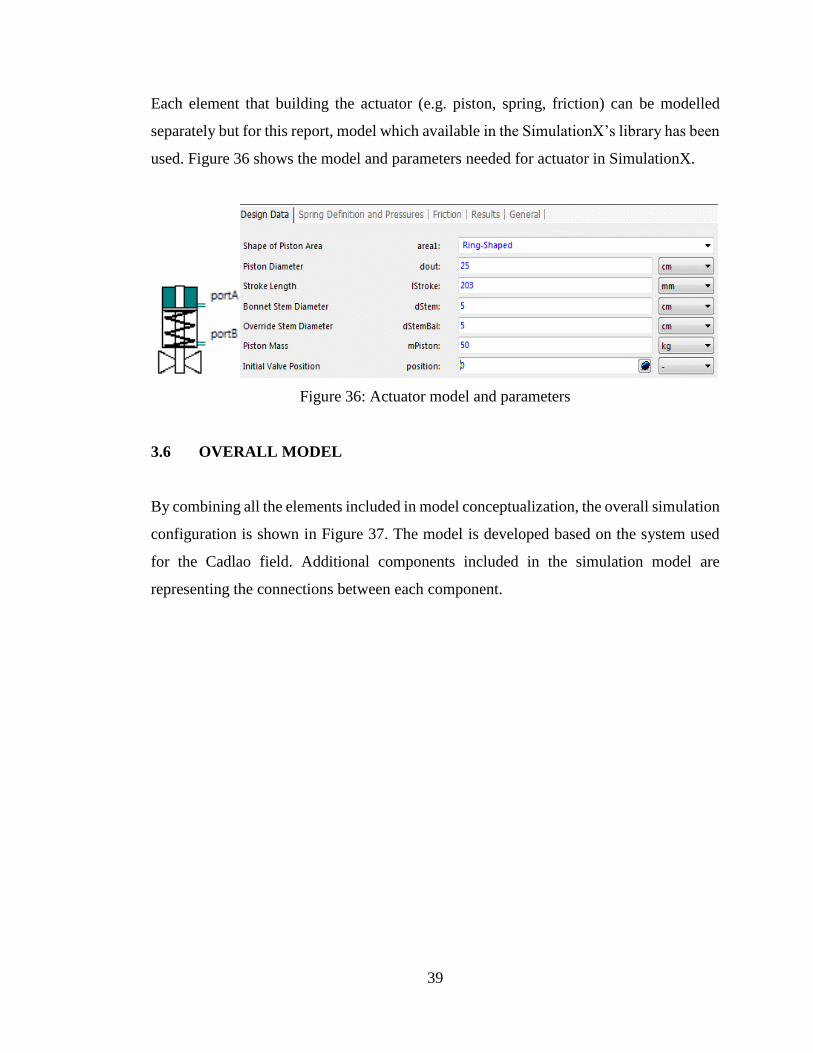
39
Each element that building the actuator (e.g. piston, spring, friction) can be modelled
separately but for this report, model which available in the SimulationX’s library has been
used. Figure 36 shows the model and parameters needed for actuator in SimulationX.
Figure 36: Actuator model and parameters
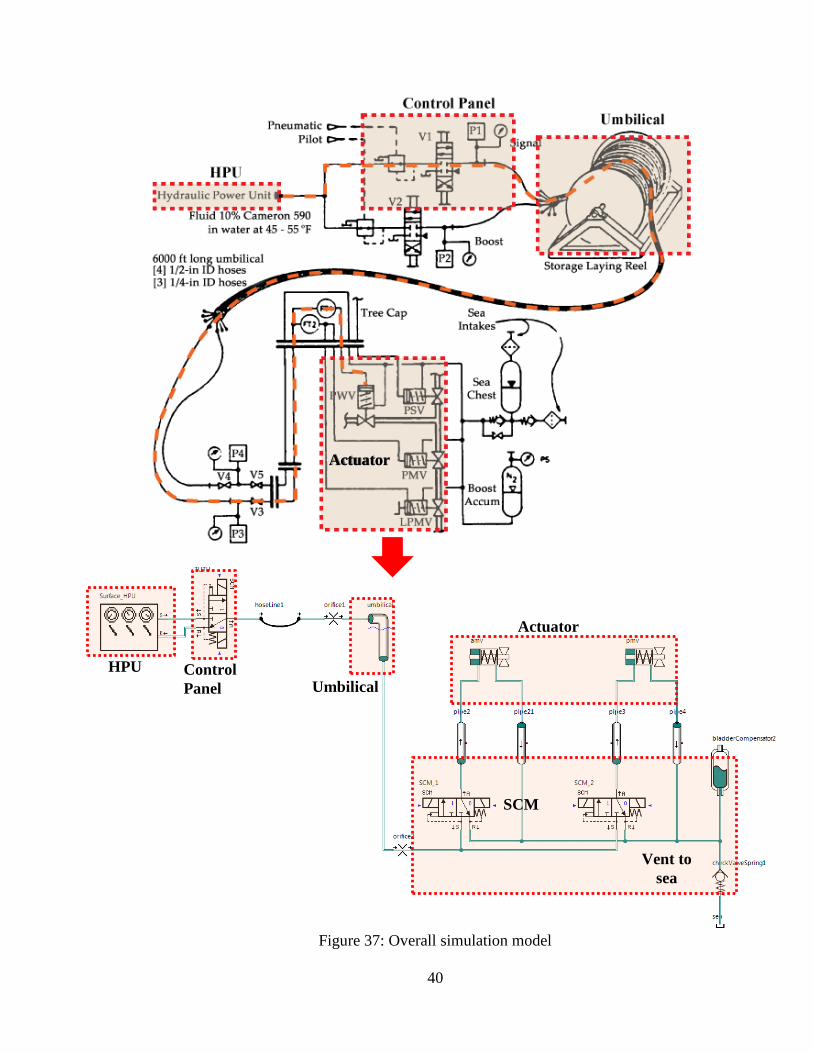
3.6 OVERALL MODEL
By combining all the elements included in model conceptualization, the overall simulation
configuration is shown in Figure 37. The model is developed based on the system used
for the Cadlao field. Additional components included in the simulation model are
representing the connections between each component.
40
Figure 37: Overall simulation model
Actuator
Control
Panel Umbilical
Actuator
Vent to
sea
HPU
SCM
41
3.7 MODEL VALIDATION
Validation of the simulation model build is important to ensure the model assumptions are
correct, complete and consistent. Additionally, validation is also done to prove that the
simulation model developed is acceptable and can be used to represent the actual system,
and will able to behave similarly to the real system. To validate the model, the simulation
model used variables from Cadlao field as recorded in Table 6, 7, and 8. Additional
variables are taken from the default values available in the SimulationX. The reason why
default values are used because SimulationX’s specialization is in subsea modelling.
Therefore all the default values in the SimulationX are the typical dimensions for subsea
applications. Another reasons is, due to time constrain. Specification sheets from online
source does not provide enough parameters and mostly only provide the working pressures
and maximum working pressures. To get full specifications, request have to be made to
the manufacturers which will need more time. The parameters used are as in the following
tables:
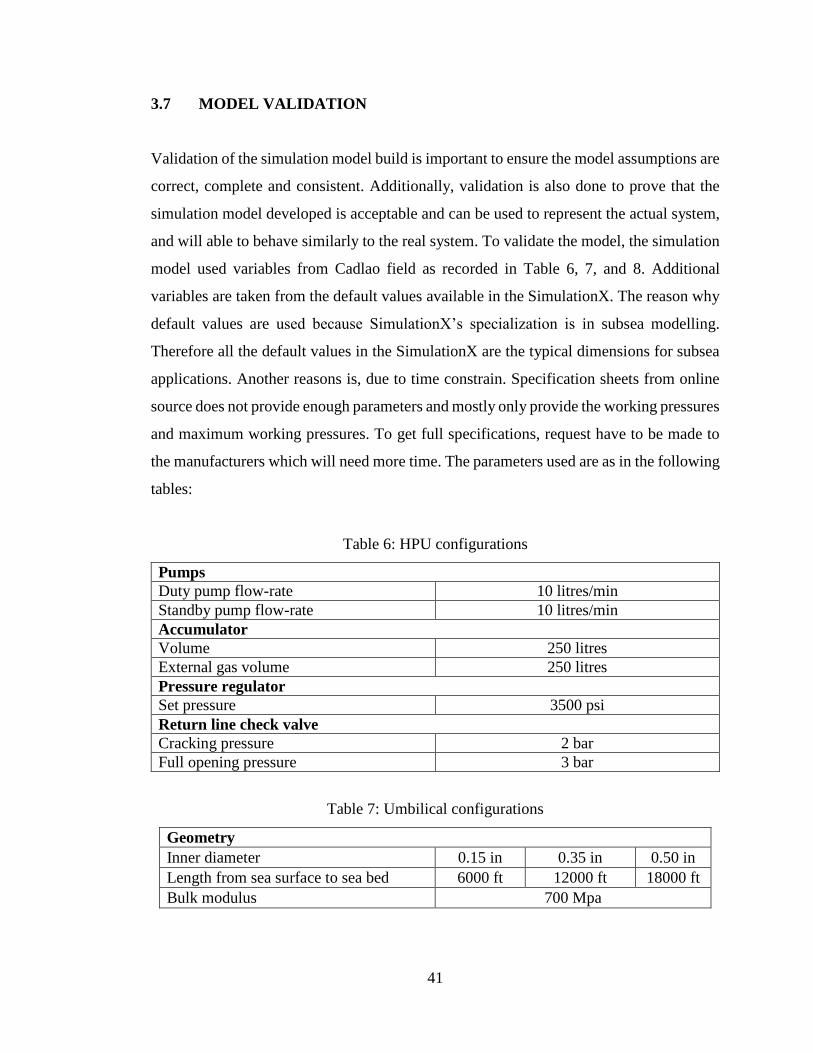
Table 6: HPU configurations
Pumps
Duty pump flow-rate 10 litres/min
Standby pump flow-rate 10 litres/min
Accumulator
Volume 250 litres
External gas volume 250 litres
Pressure regulator
Set pressure 3500 psi
Return line check valve
Cracking pressure 2 bar
Full opening pressure 3 bar
Table 7: Umbilical configurations
Geometry
Inner diameter 0.15 in 0.35 in 0.50 in
Length from sea surface to sea bed 6000 ft 12000 ft 18000 ft
Bulk modulus 700 Mpa
42
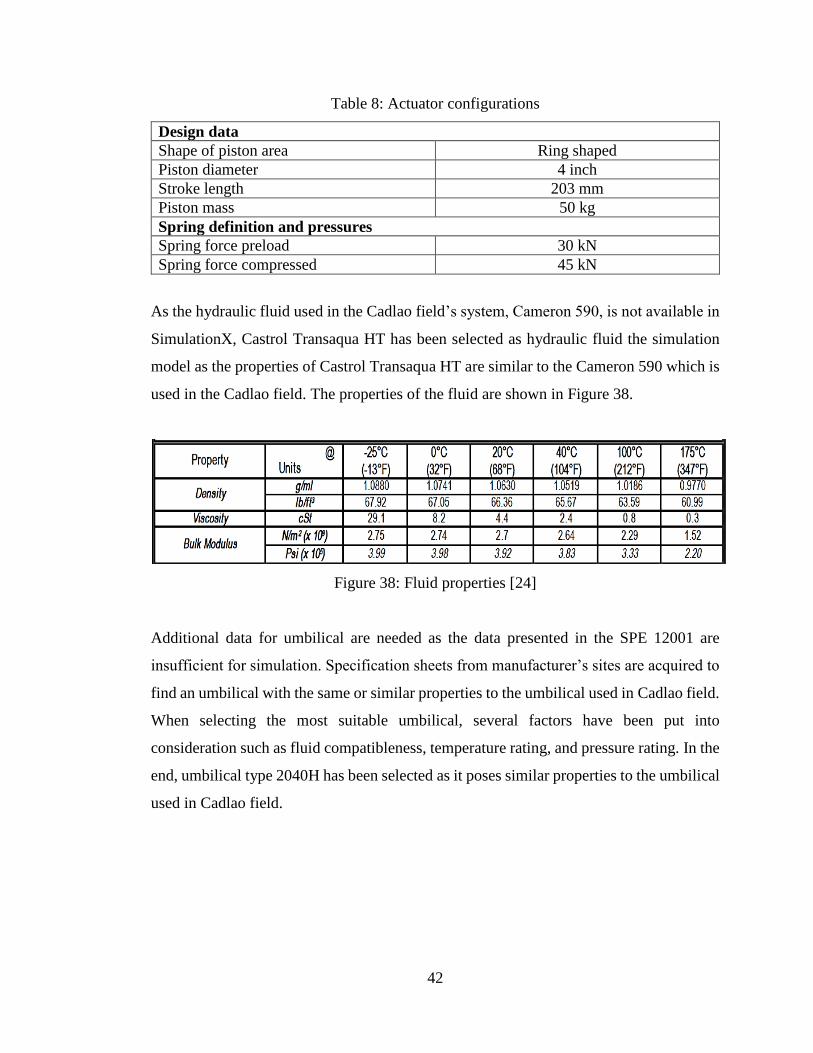
Table 8: Actuator configurations
Design data
Shape of piston area Ring shaped
Piston diameter 4 inch
Stroke length 203 mm
Piston mass 50 kg
Spring definition and pressures
Spring force preload 30 kN
Spring force compressed 45 kN
As the hydraulic fluid used in the Cadlao field’s system, Cameron 590, is not available in
SimulationX, Castrol Transaqua HT has been selected as hydraulic fluid the simulation
model as the properties of Castrol Transaqua HT are similar to the Cameron 590 which is
used in the Cadlao field. The properties of the fluid are shown in Figure 38.
Figure 38: Fluid properties [24]
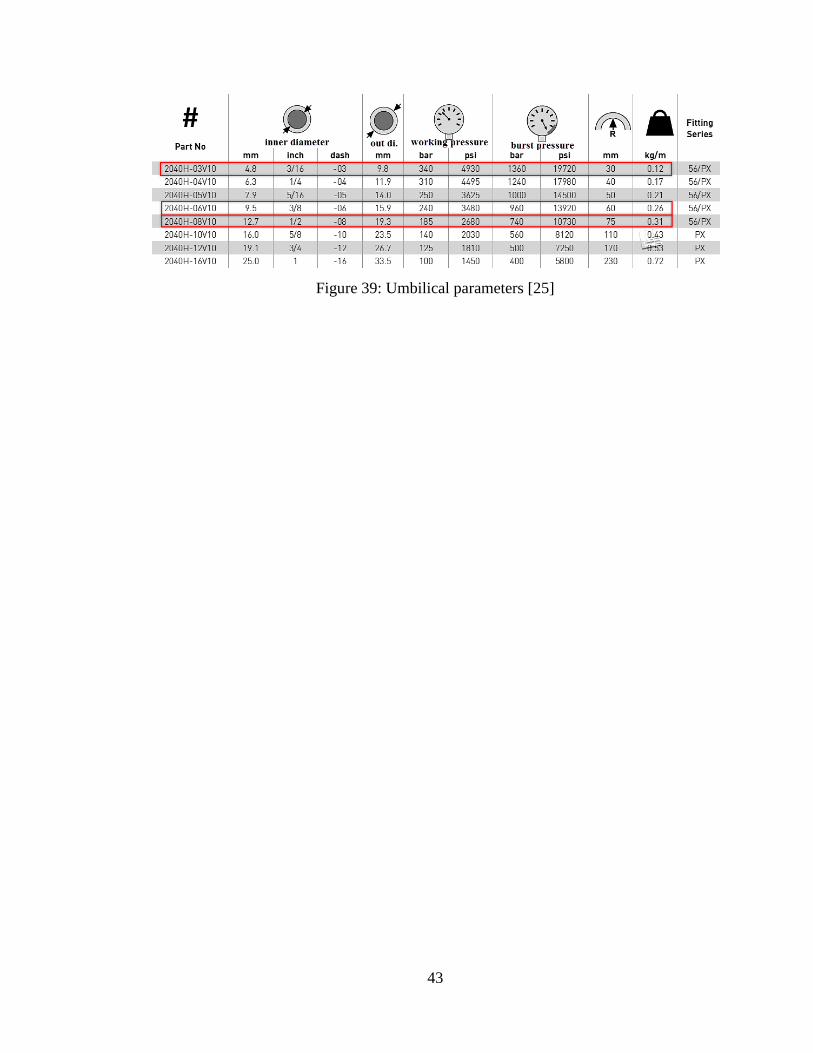
Additional data for umbilical are needed as the data presented in the SPE 12001 are
insufficient for simulation. Specification sheets from manufacturer’s sites are acquired to
find an umbilical with the same or similar properties to the umbilical used in Cadlao field.
When selecting the most suitable umbilical, several factors have been put into
consideration such as fluid compatibleness, temperature rating, and pressure rating. In the
end, umbilical type 2040H has been selected as it poses similar properties to the umbilical
used in Cadlao field.
43
Figure 39: Umbilical parameters [25]
44
CHAPTER 4
RESULT AND DISCUSSION
This chapter presents the simulation results obtained. Firstly, the system is verified by
simulating the simulation model using parameters from the Cadlao oil field to show
whether the model behave accordingly or not. Performance curves of Cadlao field are then
compared to the acquired curves from simulation.
After the model have been validated, simulation model is simulated using different
operating conditions. Due to time constrain in developing simulation model, only
parameters of the umbilical and actuator are changed for this project simulation.
Additional simulation test on the effect of umbilical’s bulk modulus also included. The
aims for simulation testing are to study the effect of changing these parameters on the
system performance. The simulation system is simulated using three conditions as the
following:
1. Varying umbilical length
2. Varying umbilical inner diameter
3. Varying valve piston actuator size
An Emergency Shut Down (ESD) simulation done to show how quick the system can
recover to its initial safe position after the hydraulic supply from the topside is terminated.
This feature is included in control system because it is considered critical in determining
the reliability and boost confidence in the control system. ESD also a requirement for
SPCS.
45
The results obtained are compared to case study’s results showed similar behaviours and
getting an exact results are not possible mainly due to lack of data. Only critical data such
as working pressures and hose lengths are presented in the reference paper. At the same
time, when developing simulation model, many other parameters are still need to be set.
Therefore, assumptions made by author influence the acquired results.
4.1 SYSTEM BEHAVIOUR
4.1.1 Gate Valve
Before proceed to the simulation testing using different parameters, validation has to be
done first. For the validation purpose, developed simulation model is simulated using
default values which are used in Cadlao field. The results acquired from simulation are
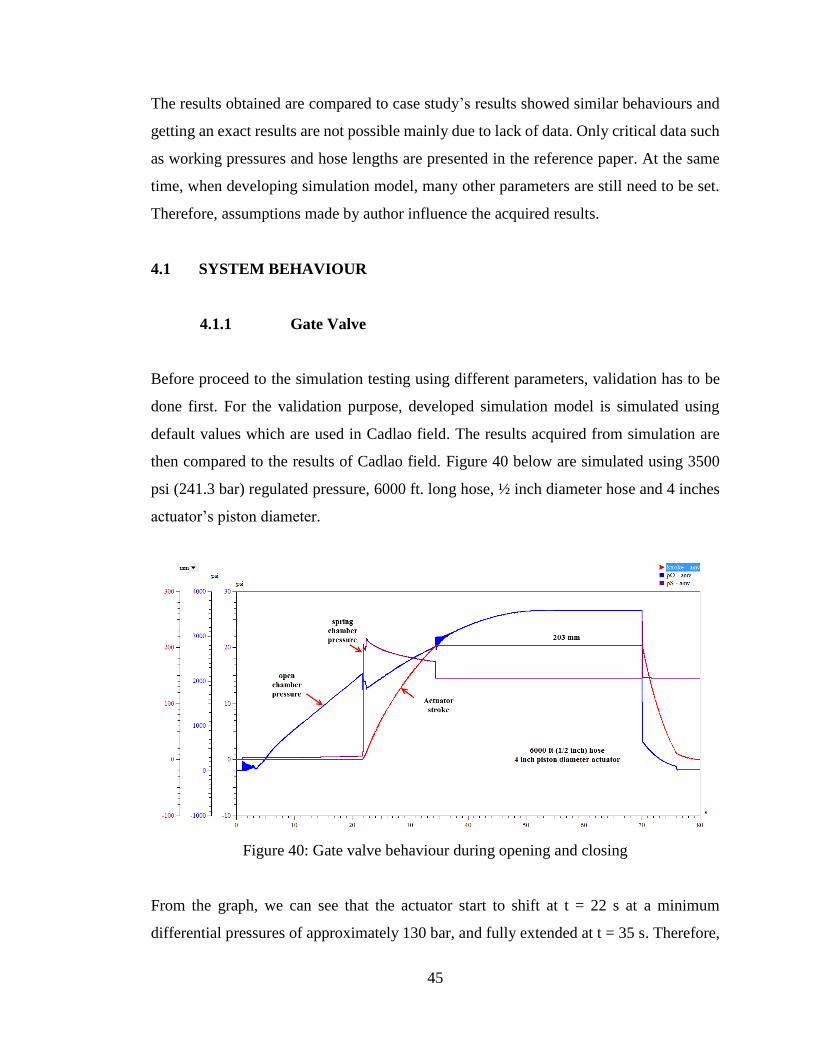
then compared to the results of Cadlao field. Figure 40 below are simulated using 3500
psi (241.3 bar) regulated pressure, 6000 ft. long hose, ½ inch diameter hose and 4 inches
actuator’s piston diameter.
Figure 40: Gate valve behaviour during opening and closing
From the graph, we can see that the actuator start to shift at t = 22 s at a minimum
differential pressures of approximately 130 bar, and fully extended at t = 35 s. Therefore,
46
shift time is 13 s. The Cadlao field’s shift time recorded was 25 s, a disparity of 12 s are
observed. The difference is due to the insufficient data provided for the case study
especially for actuator. Assumpations and calculations have been made to predict the
appropriate values for the missing dimensions. The system seem to experience
disturbances during pressure build up but the system has completely actuating the gate
valve.
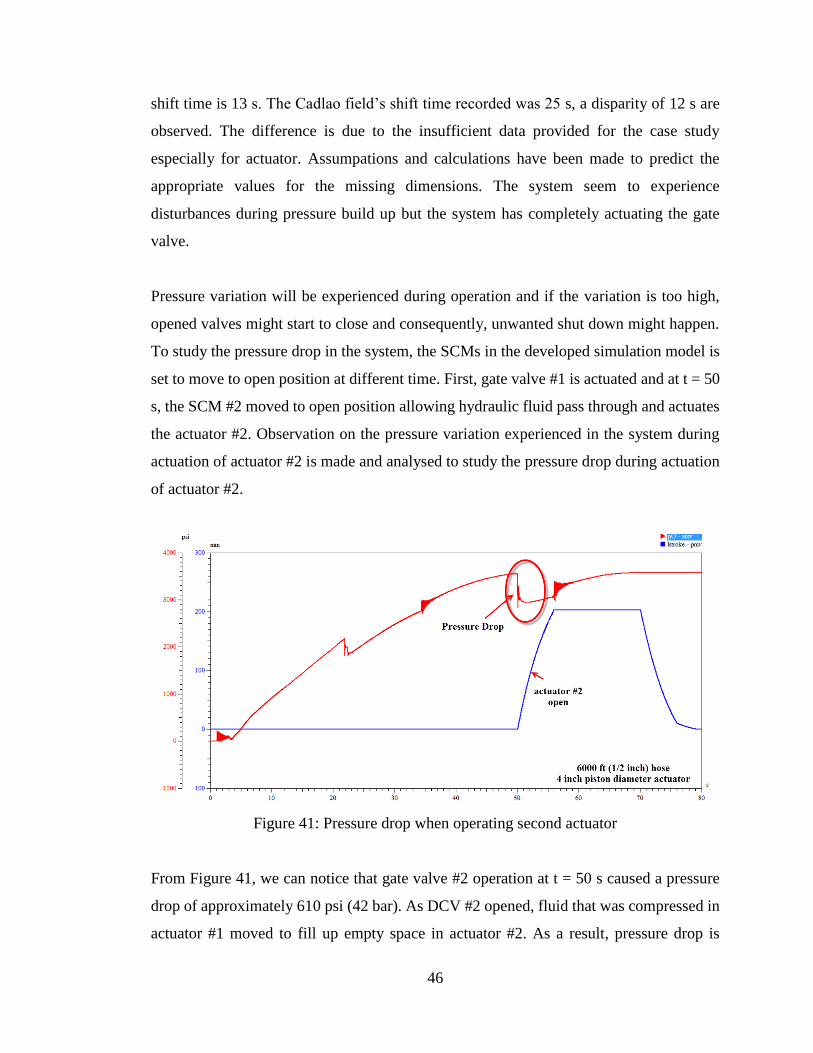
Pressure variation will be experienced during operation and if the variation is too high,
opened valves might start to close and consequently, unwanted shut down might happen.
To study the pressure drop in the system, the SCMs in the developed simulation model is
set to move to open position at different time. First, gate valve #1 is actuated and at t = 50
s, the SCM #2 moved to open position allowing hydraulic fluid pass through and actuates
the actuator #2. Observation on the pressure variation experienced in the system during
actuation of actuator #2 is made and analysed to study the pressure drop during actuation
of actuator #2.
Figure 41: Pressure drop when operating second actuator
From Figure 41, we can notice that gate valve #2 operation at t = 50 s caused a pressure
drop of approximately 610 psi (42 bar). As DCV #2 opened, fluid that was compressed in
actuator #1 moved to fill up empty space in actuator #2. As a result, pressure drop is
47
experienced in the system. If the pressure drop is too great, the opened actuator #1 might
start to close, but for this system, pressure did not fall below the reset pressure of DCV
#1. In real practices, operator usually used subsea accumulator or increase the hose size
to reduce the effect of pressure drop but consequently, the time needed for umbilical
pressurization and bleed it when shutting down will be affected.
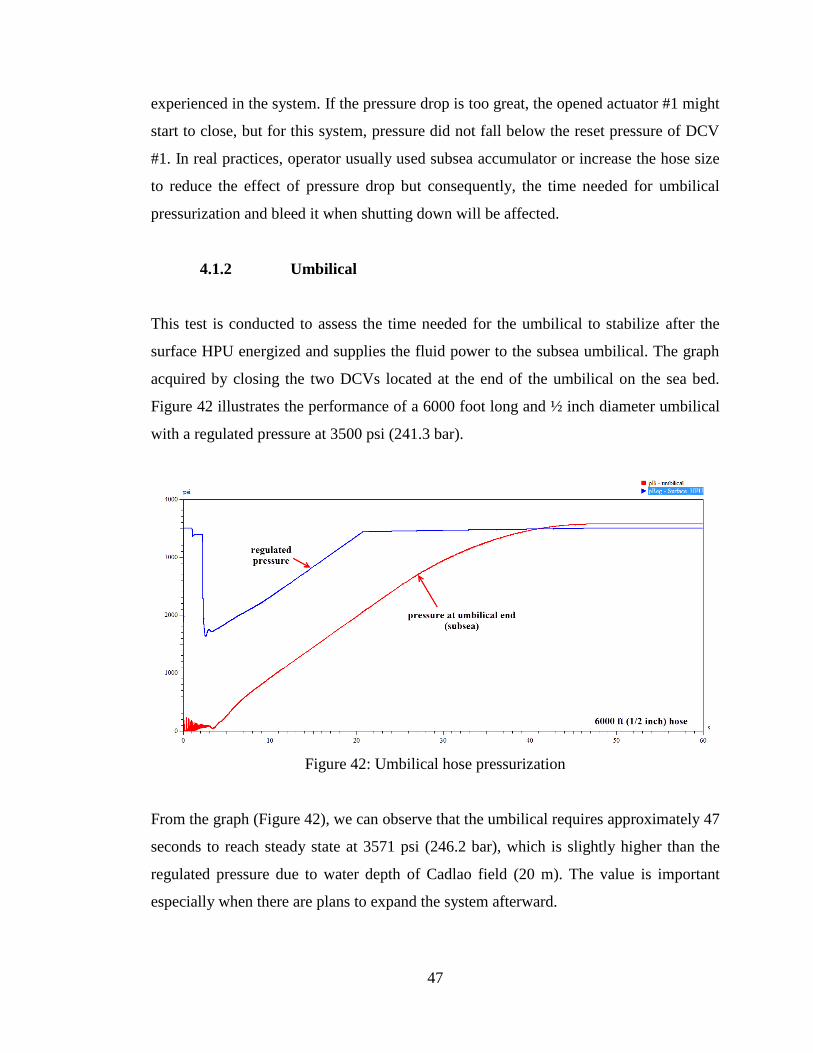
4.1.2 Umbilical
This test is conducted to assess the time needed for the umbilical to stabilize after the
surface HPU energized and supplies the fluid power to the subsea umbilical. The graph
acquired by closing the two DCVs located at the end of the umbilical on the sea bed.
Figure 42 illustrates the performance of a 6000 foot long and ½ inch diameter umbilical
with a regulated pressure at 3500 psi (241.3 bar).
Figure 42: Umbilical hose pressurization
From the graph (Figure 42), we can observe that the umbilical requires approximately 47
seconds to reach steady state at 3571 psi (246.2 bar), which is slightly higher than the
regulated pressure due to water depth of Cadlao field (20 m). The value is important
especially when there are plans to expand the system afterward.
48
4.2 SIGNAL TIME
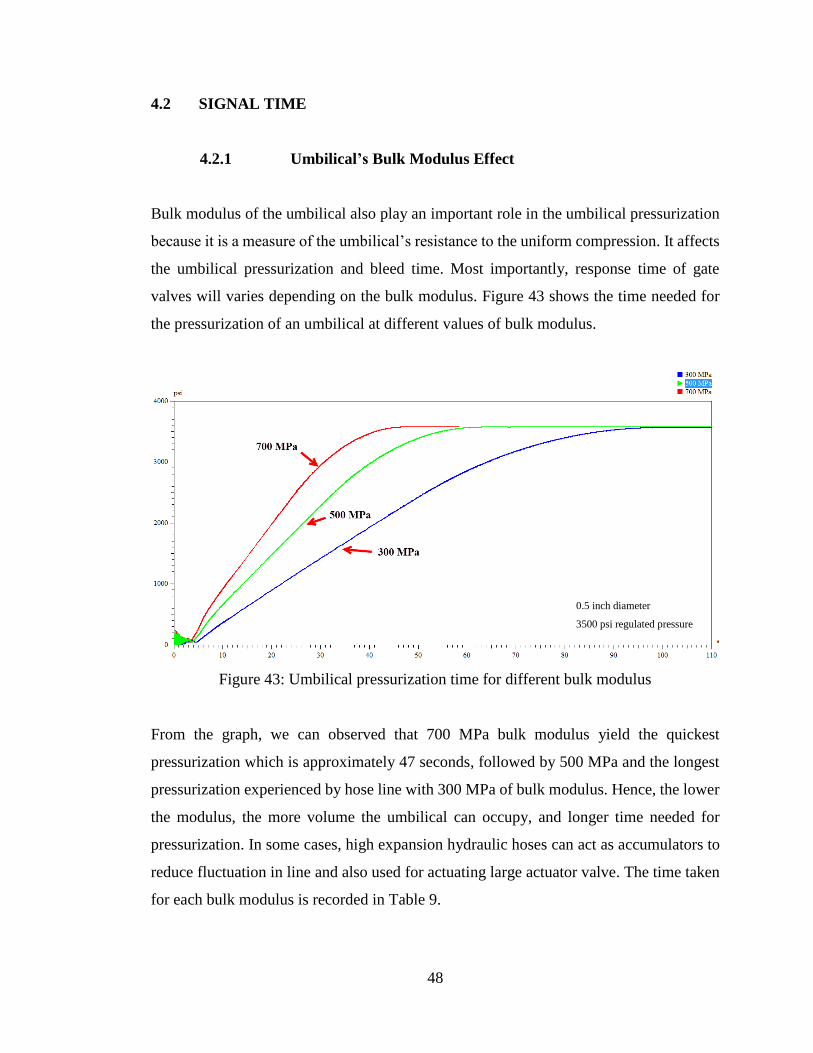
4.2.1 Umbilical’s Bulk Modulus Effect
Bulk modulus of the umbilical also play an important role in the umbilical pressurization
because it is a measure of the umbilical’s resistance to the uniform compression. It affects
the umbilical pressurization and bleed time. Most importantly, response time of gate
valves will varies depending on the bulk modulus. Figure 43 shows the time needed for
the pressurization of an umbilical at different values of bulk modulus.
Figure 43: Umbilical pressurization time for different bulk modulus
From the graph, we can observed that 700 MPa bulk modulus yield the quickest
pressurization which is approximately 47 seconds, followed by 500 MPa and the longest
pressurization experienced by hose line with 300 MPa of bulk modulus. Hence, the lower
the modulus, the more volume the umbilical can occupy, and longer time needed for
pressurization. In some cases, high expansion hydraulic hoses can act as accumulators to
reduce fluctuation in line and also used for actuating large actuator valve. The time taken
for each bulk modulus is recorded in Table 9.
0.5 inch diameter
3500 psi regulated pressure
49
Table 9: Effect of varying bulk modulus of hose pressurization
Bulk Modulus (MPa) Time (seconds)
700 47
500 63
300 100
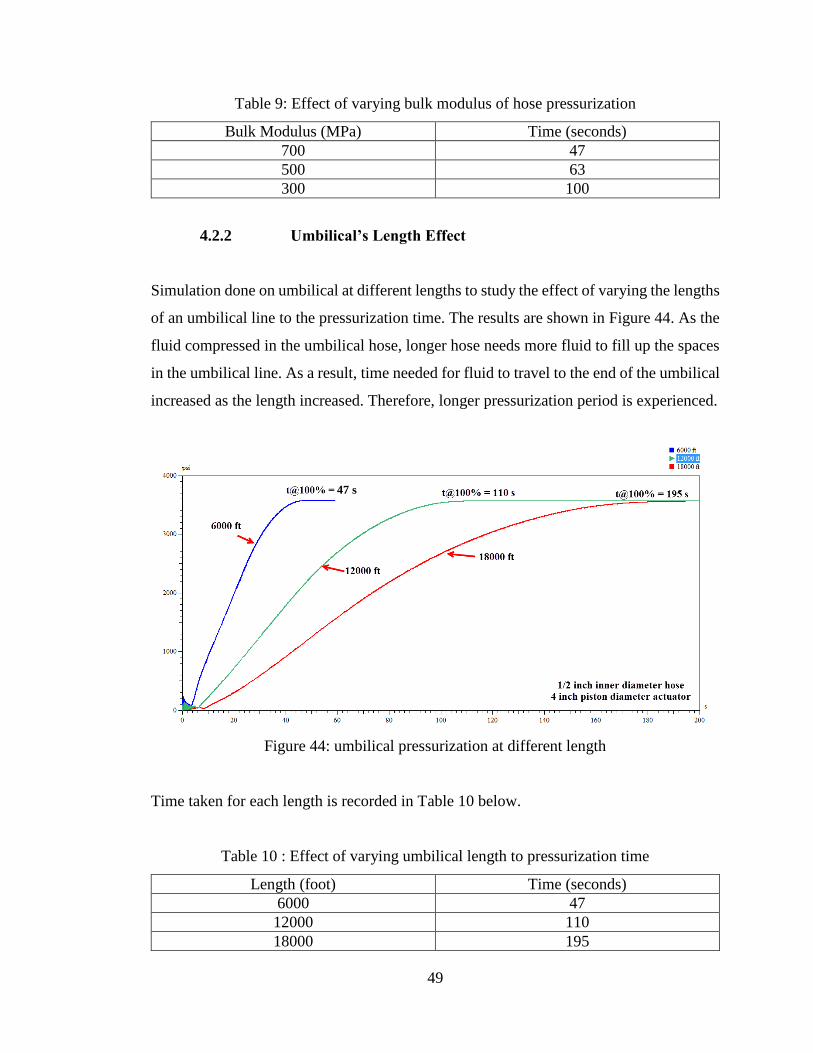
4.2.2 Umbilical’s Length Effect
Simulation done on umbilical at different lengths to study the effect of varying the lengths
of an umbilical line to the pressurization time. The results are shown in Figure 44. As the
fluid compressed in the umbilical hose, longer hose needs more fluid to fill up the spaces
in the umbilical line. As a result, time needed for fluid to travel to the end of the umbilical
increased as the length increased. Therefore, longer pressurization period is experienced.
Figure 44: umbilical pressurization at different length
Time taken for each length is recorded in Table 10 below.
Table 10 : Effect of varying umbilical length to pressurization time
Length (foot) Time (seconds)
6000 47
12000 110
18000 195
47 s
50
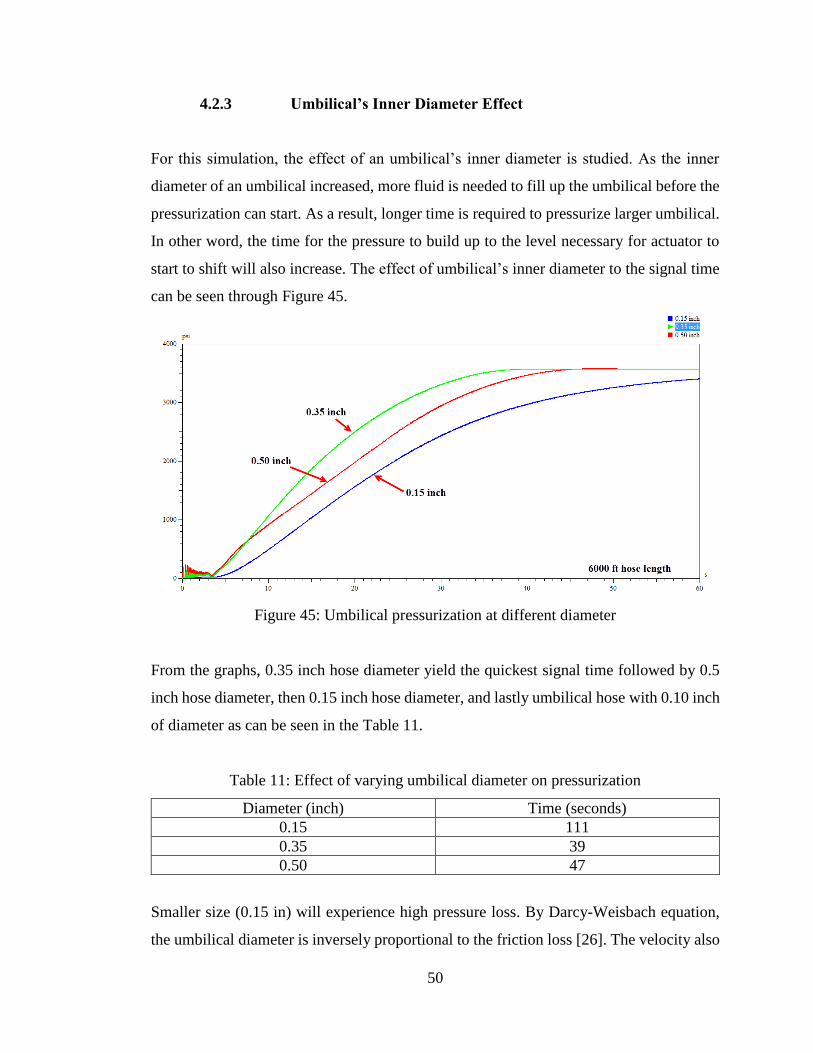
4.2.3 Umbilical’s Inner Diameter Effect
For this simulation, the effect of an umbilical’s inner diameter is studied. As the inner
diameter of an umbilical increased, more fluid is needed to fill up the umbilical before the
pressurization can start. As a result, longer time is required to pressurize larger umbilical.
In other word, the time for the pressure to build up to the level necessary for actuator to
start to shift will also increase. The effect of umbilical’s inner diameter to the signal time
can be seen through Figure 45.
Figure 45: Umbilical pressurization at different diameter
From the graphs, 0.35 inch hose diameter yield the quickest signal time followed by 0.5
inch hose diameter, then 0.15 inch hose diameter, and lastly umbilical hose with 0.10 inch
of diameter as can be seen in the Table 11.
Table 11: Effect of varying umbilical diameter on pressurization
Diameter (inch) Time (seconds)
0.15 111
0.35 39
0.50 47
Smaller size (0.15 in) will experience high pressure loss. By Darcy-Weisbach equation,
the umbilical diameter is inversely proportional to the friction loss [26]. The velocity also
51
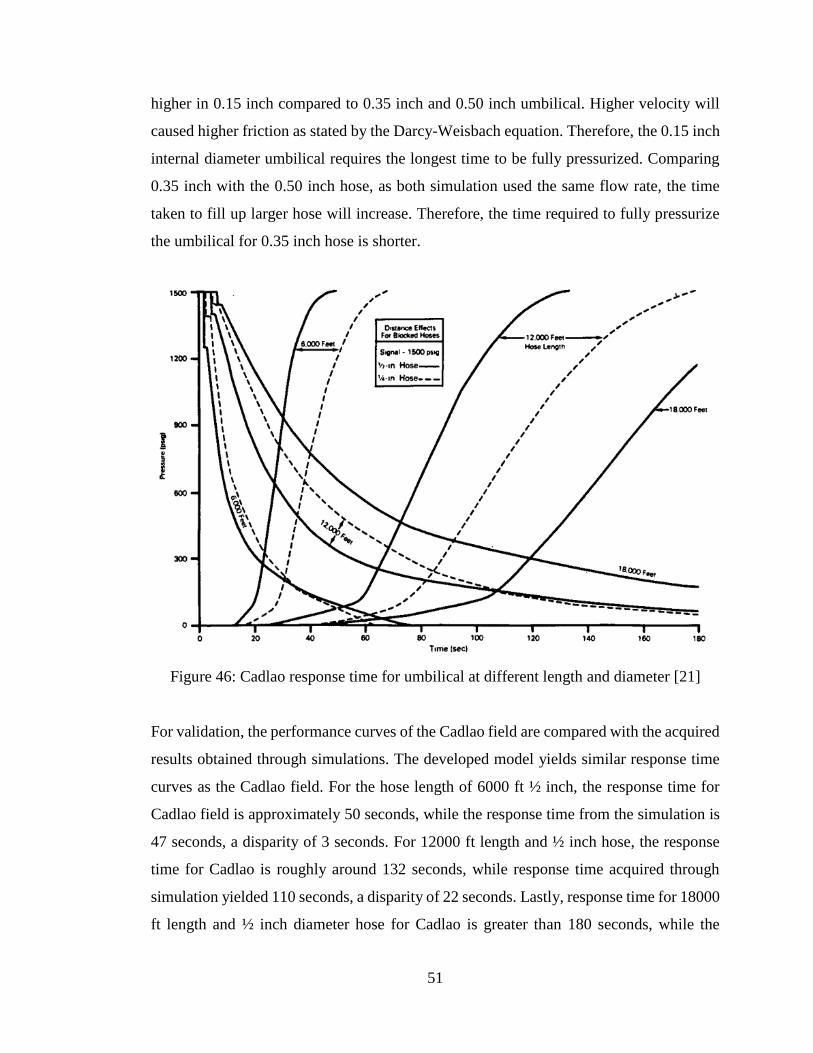
higher in 0.15 inch compared to 0.35 inch and 0.50 inch umbilical. Higher velocity will
caused higher friction as stated by the Darcy-Weisbach equation. Therefore, the 0.15 inch
internal diameter umbilical requires the longest time to be fully pressurized. Comparing
0.35 inch with the 0.50 inch hose, as both simulation used the same flow rate, the time
taken to fill up larger hose will increase. Therefore, the time required to fully pressurize
the umbilical for 0.35 inch hose is shorter.
Figure 46: Cadlao response time for umbilical at different length and diameter [21]
For validation, the performance curves of the Cadlao field are compared with the acquired
results obtained through simulations. The developed model yields similar response time
curves as the Cadlao field. For the hose length of 6000 ft ½ inch, the response time for
Cadlao field is approximately 50 seconds, while the response time from the simulation is
47 seconds, a disparity of 3 seconds. For 12000 ft length and ½ inch hose, the response
time for Cadlao is roughly around 132 seconds, while response time acquired through
simulation yielded 110 seconds, a disparity of 22 seconds. Lastly, response time for 18000
ft length and ½ inch diameter hose for Cadlao is greater than 180 seconds, while the
52
simulation yield more or less 195 seconds. From all the simulations done, a disparity of
less than 30% between the acquired results and Cadlao field’s response time. Therefore,
the simulation model is valid to represent the system used in Cadlao field.
The simulation is not exactly yield an exact result as from the Cadlao field, but the system
behave as predicted and similar to the actual system. The main reason for this is due to
the incomplete data. Therefore, assumptions are made to predict the values for the missing
variables based on calculations and from the specification sheets found online.
4.3 SHIFT TIME
Second objective for this project is to find the effect of varying parameters to the system’s
signal time and shift time. The simulations to study the effect of varying parameters to the
signal time are done in the previous section (Section 4.2). For this section, the effect of
varying the parameters to the system’s shift time is studied. The simulations are done by
using different values for these properties:
1. Umbilical length
2. Umbilical size
3. Actuator size
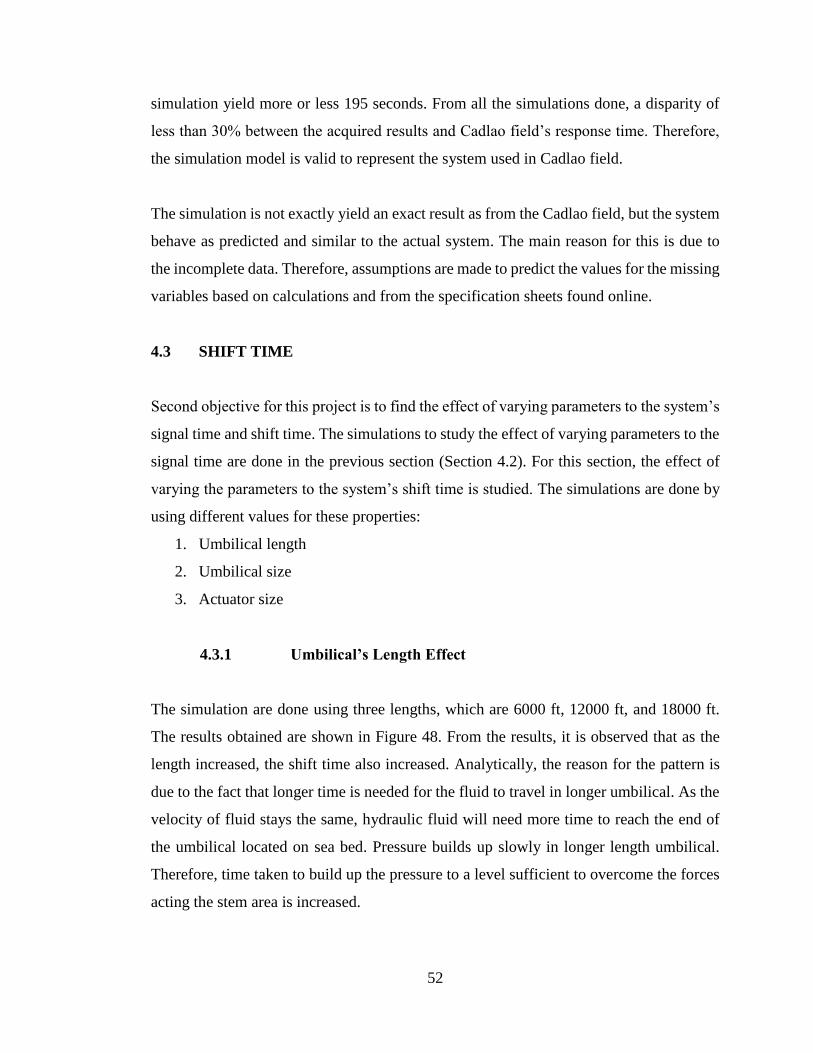
4.3.1 Umbilical’s Length Effect
The simulation are done using three lengths, which are 6000 ft, 12000 ft, and 18000 ft.
The results obtained are shown in Figure 48. From the results, it is observed that as the
length increased, the shift time also increased. Analytically, the reason for the pattern is
due to the fact that longer time is needed for the fluid to travel in longer umbilical. As the
velocity of fluid stays the same, hydraulic fluid will need more time to reach the end of
the umbilical located on sea bed. Pressure builds up slowly in longer length umbilical.
Therefore, time taken to build up the pressure to a level sufficient to overcome the forces
acting the stem area is increased.
53
Figure 47: Shift time for different umbilical length
Table 12: Time taken to fully open actuator valve using different hose length
Length (ft.) Time to fully open (s)
6000 13
12000 21
18000 31
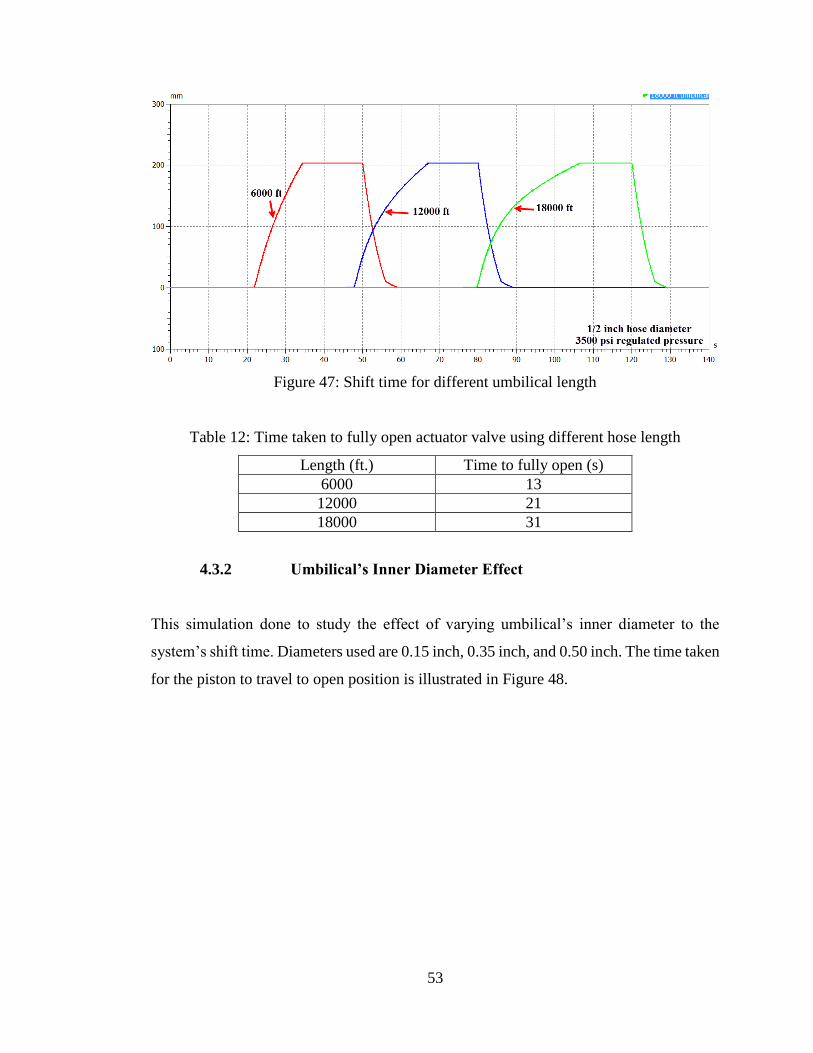
4.3.2 Umbilical’s Inner Diameter Effect
This simulation done to study the effect of varying umbilical’s inner diameter to the
system’s shift time. Diameters used are 0.15 inch, 0.35 inch, and 0.50 inch. The time taken
for the piston to travel to open position is illustrated in Figure 48.
54
Figure 48: Effect of varying hose diameter
Table 13: Recorded time for piston to fully shift to the other end
Diameter (inch) Time to fully shift (s)
0.15 113
0.35 19
0.50 13
From the results, we can observed that 0.15 inch inner diameter umbilical yields the
longest time for the actuator to be fully opened. The reason for this behaviour is, only
small amount of hydraulic fluid can be transferred at a time and huge pressure losses are
experienced in a smaller umbilical’s diameter. As a conclusion, The bigger the diameter,
the shorter the shift time experienced.
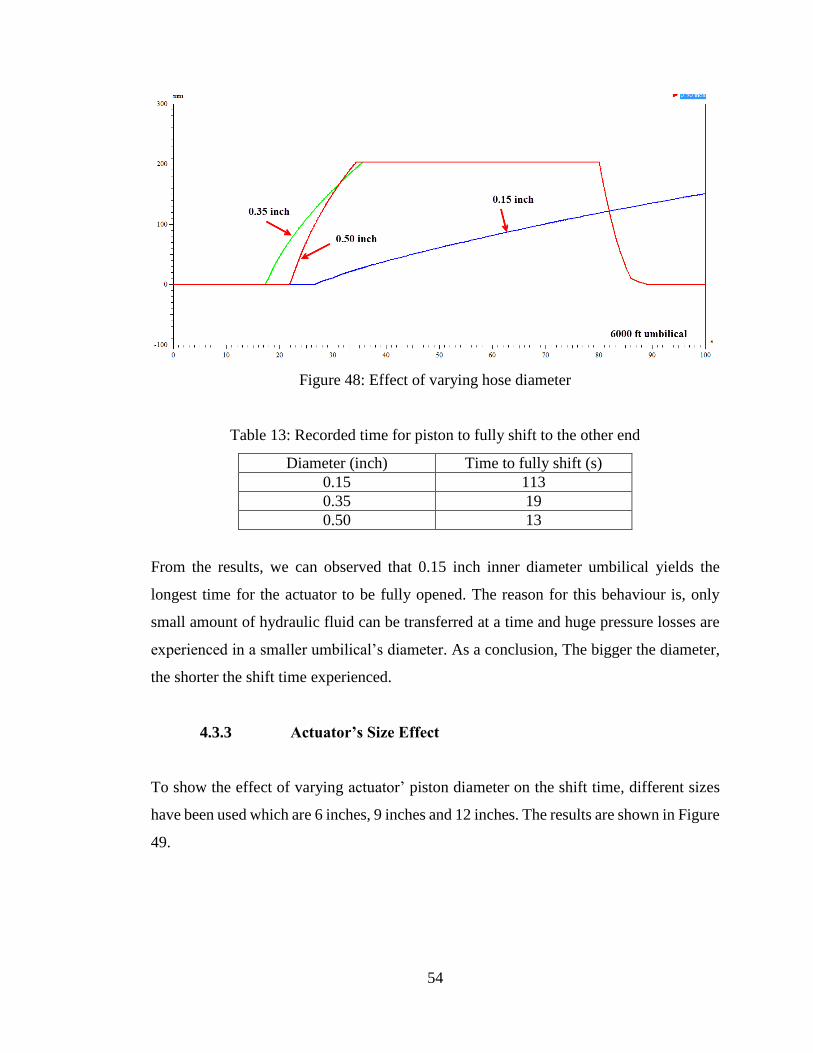
4.3.3 Actuator’s Size Effect
To show the effect of varying actuator’ piston diameter on the shift time, different sizes
have been used which are 6 inches, 9 inches and 12 inches. The results are shown in Figure
49.
55
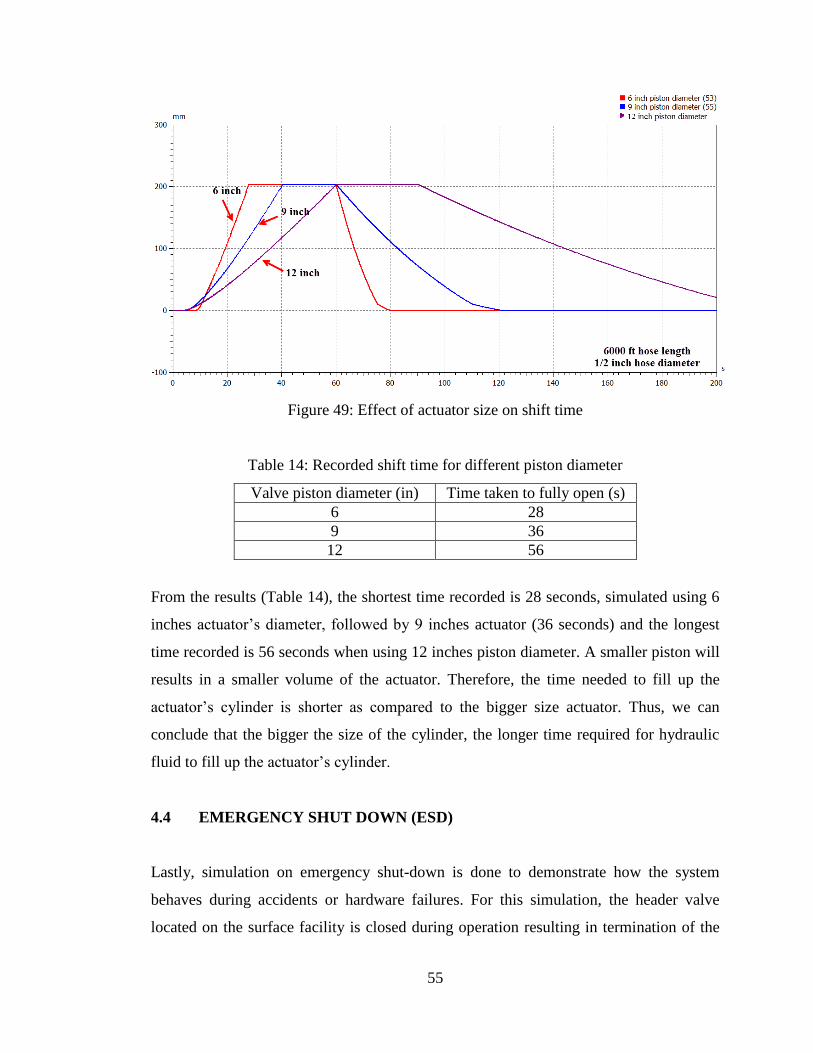
Figure 49: Effect of actuator size on shift time
Table 14: Recorded shift time for different piston diameter
Valve piston diameter (in) Time taken to fully open (s)
6 28
9 36
12 56
From the results (Table 14), the shortest time recorded is 28 seconds, simulated using 6
inches actuator’s diameter, followed by 9 inches actuator (36 seconds) and the longest
time recorded is 56 seconds when using 12 inches piston diameter. A smaller piston will
results in a smaller volume of the actuator. Therefore, the time needed to fill up the
actuator’s cylinder is shorter as compared to the bigger size actuator. Thus, we can
conclude that the bigger the size of the cylinder, the longer time required for hydraulic
fluid to fill up the actuator’s cylinder.
4.4 EMERGENCY SHUT DOWN (ESD)
Lastly, simulation on emergency shut-down is done to demonstrate how the system
behaves during accidents or hardware failures. For this simulation, the header valve
located on the surface facility is closed during operation resulting in termination of the
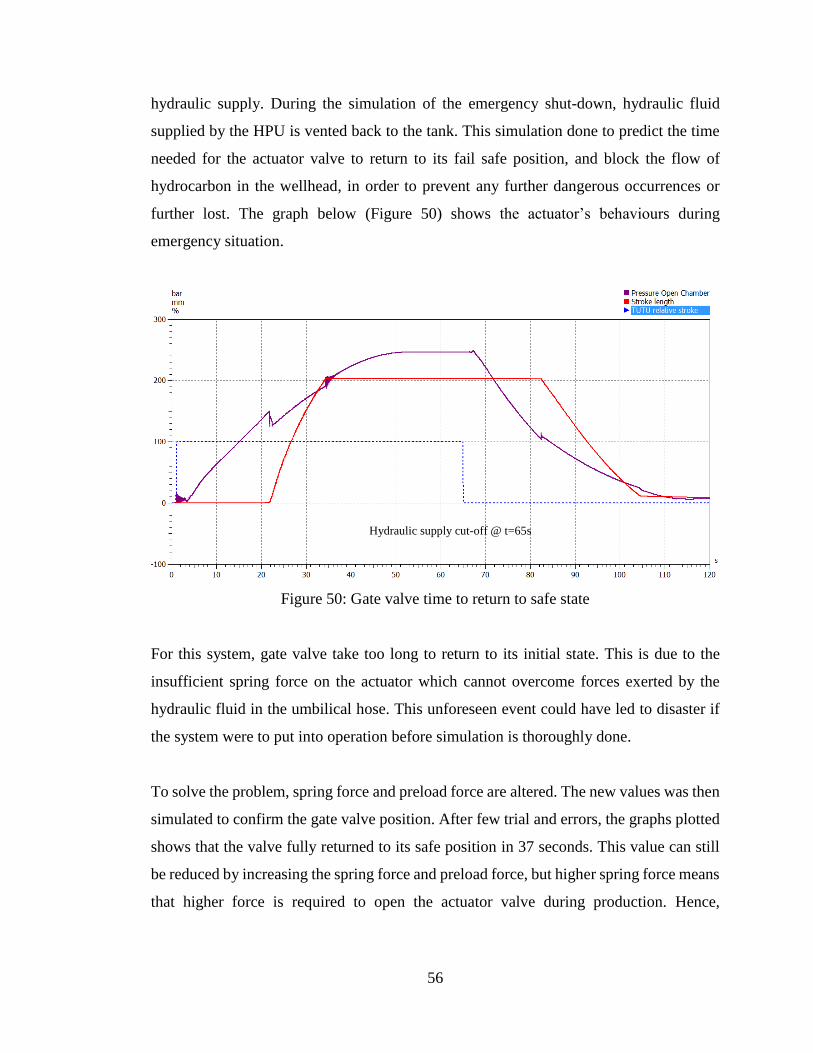
56
hydraulic supply. During the simulation of the emergency shut-down, hydraulic fluid
supplied by the HPU is vented back to the tank. This simulation done to predict the time
needed for the actuator valve to return to its fail safe position, and block the flow of
hydrocarbon in the wellhead, in order to prevent any further dangerous occurrences or
further lost. The graph below (Figure 50) shows the actuator’s behaviours during
emergency situation.
Figure 50: Gate valve time to return to safe state
For this system, gate valve take too long to return to its initial state. This is due to the
insufficient spring force on the actuator which cannot overcome forces exerted by the
hydraulic fluid in the umbilical hose. This unforeseen event could have led to disaster if
the system were to put into operation before simulation is thoroughly done.
To solve the problem, spring force and preload force are altered. The new values was then
simulated to confirm the gate valve position. After few trial and errors, the graphs plotted
shows that the valve fully returned to its safe position in 37 seconds. This value can still
be reduced by increasing the spring force and preload force, but higher spring force means
that higher force is required to open the actuator valve during production. Hence,
Hydraulic supply cut-off @ t=65s
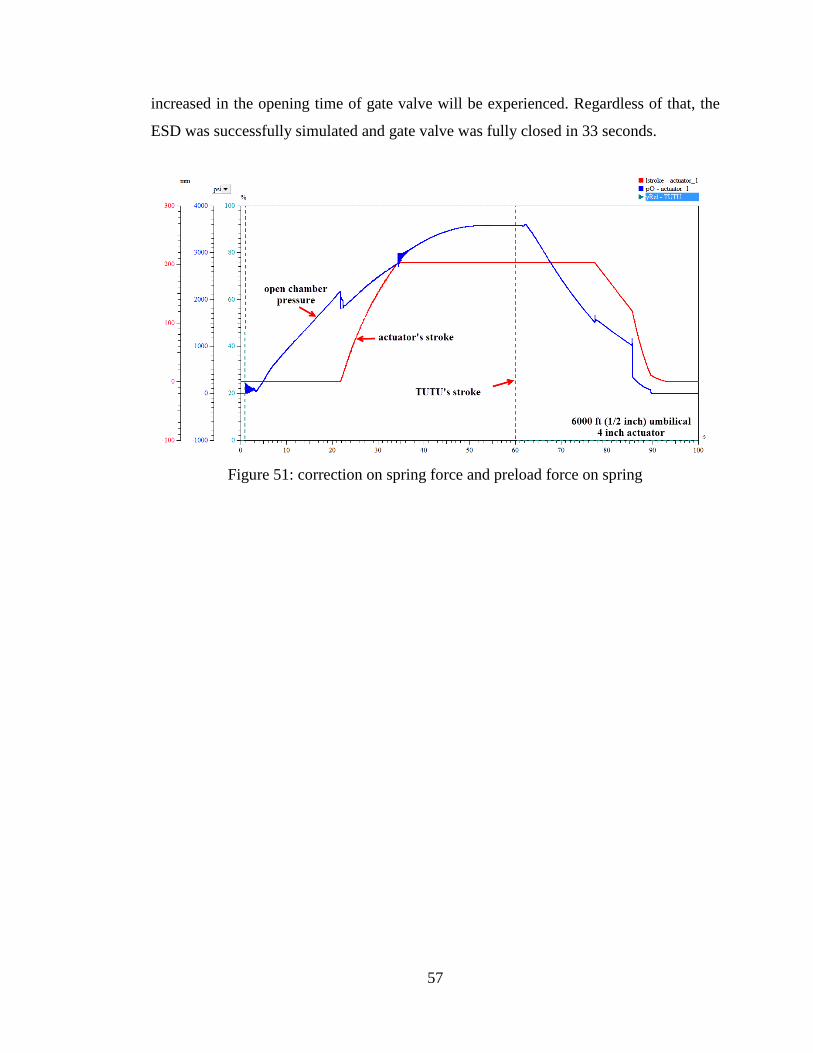
57
increased in the opening time of gate valve will be experienced. Regardless of that, the
ESD was successfully simulated and gate valve was fully closed in 33 seconds.
Figure 51: correction on spring force and preload force on spring
58
CHAPTER 5
CONCLUSION AND RECOMENDATION
5.1 CONCLUSION
As the conclusion, simulation offers great help in analysing the subsea production control
system. All the components in a system can be tested in various ways to analyse their
integrities and behaviours. The influence of a component to the overall system’s
performance can be studied and appropriate actions can be taken to improve the system.
This is important for newly designed system. Before putting the system into operation, the
system can be virtually tested first to increase confidence or to understand the operation
of the system.
For this project, the first objective is successfully achieved as illustrated in Figure 37
which is to develop a simulation model for a direct hydraulic control system. Several
guidelines and steps have been strictly followed in order to design a model for the direct
hydraulic control system. Simulation model is build based on the model used in the case
study for this project, which is Cadlao field. While studying the case study, literature
review is done on the direct control system and various components in the system are
identified. After the critical components are recognized, further study done to understand
the concepts and functions of each component. At the same time, the conceptualized
components are translated to acceptable form in the simulation software. During this stage,
simulation model developed are constantly tested and simulated to verify whether the
developed model can be simulated properly or not. During this stage, the configurations
of the system are frequently changed. After the developed model is verified and all main
components that build a direct hydraulic control system are included, real field data are
59
used to simulate the developed system and validation is done during this stage. After
validation is completed and the developed model is proved to behave similar to the real
system in Cadlao field, simulations are continued to study the effect of varying parameters
to the shift time and signal time, which is the second objective for this project work.
To achieve second objective for this project work, the developed model is simulated using
different values for three main parameters in the system, which are the umbilical length,
umbilical inner diameter, and actuator size. The simulation are successfully done and the
effect of varying the parameters are analysed and discussed in the previous chapter, which
is Chapter 4. The conclusions made about the effect of the varying parameters to the
system’s signal time and shift time are as the following:
1. Pressure drop is experienced when operating neighbouring actuators. Therefore, a
thorough consideration is needed when designing the operation of the system.
2. Delay is experienced when a function is initiated at the topside and executed at the
seabed. Careful contemplations for the system’s design will help in reducing the
effect of the delay.
3. Subsea production control system’s signal time is directly proportional to the
umbilical length, and is inversely proportional to umbilical inner diameter.
4. Subsea production control system’s shift time is directly proportional to umbilical
length and inner diameter, but inversely proportional to the actuator size
(diameter).
Lastly, the third objective is also successfully accomplished which is to demonstrate the
emergency shut down (ESD) feature which is a requirement for subsea control system.
The ESD simulation showed that the personnel on the topside facility are exposed to risk
within the 33 seconds recorded in Figure 51. Quicker fail safe time is preferred for the
subsea system in order to reduce or eliminate the risk but the period is still acceptable as
the requirement for ESD for work over control system is less than 60s [27]. If this
developed model is used in real field, there should be a plan and set of actions to be done
during the emergency shut down. The time for the actuator to return to its fail safe position
should be used to plan appropriate actions that can be done during emergency. The steps
60
or actions taken will decide the life of the personnel on the surface platform. Hopefully,
the tragedy of Piper Alpha which caused 167 personnel died will not happened again as
proper actions planned to make sure everything is in control during the 33 s.
5.2 RECOMMENDATION
Simulation model developed showed similar behaviour to system in Cadlao field.
Regardless of that, there are few things that, in my opinion, can be done to improve the
outcomes of this project. My recommendations are as follows:
1. SimulationX should include recommendation on how to solve an error during
simulation. This will help beginners such as myself to troubleshoot error quicker.
As for now, only the cause of error is shown, and length calculation or
consideration have to be made to find the problematic parameter or component.
2. Other factors should be investigated rather than umbilical size and length, and
actuator size as it is already done in this project. Other parameters can be used for
future works such as bulk modulus and water depth.
3. Future works should model and simulate newer control system such as multiplexed
control system so that alternative solution can be suggested to improvise current
limitations in the system.
4. As all the operators are aiming for low cost and reliable system, all-electric subsea
systems are introduced. Future works may include studying the all-electric subsea
control system which seem to have huge potentials and can be further improved.
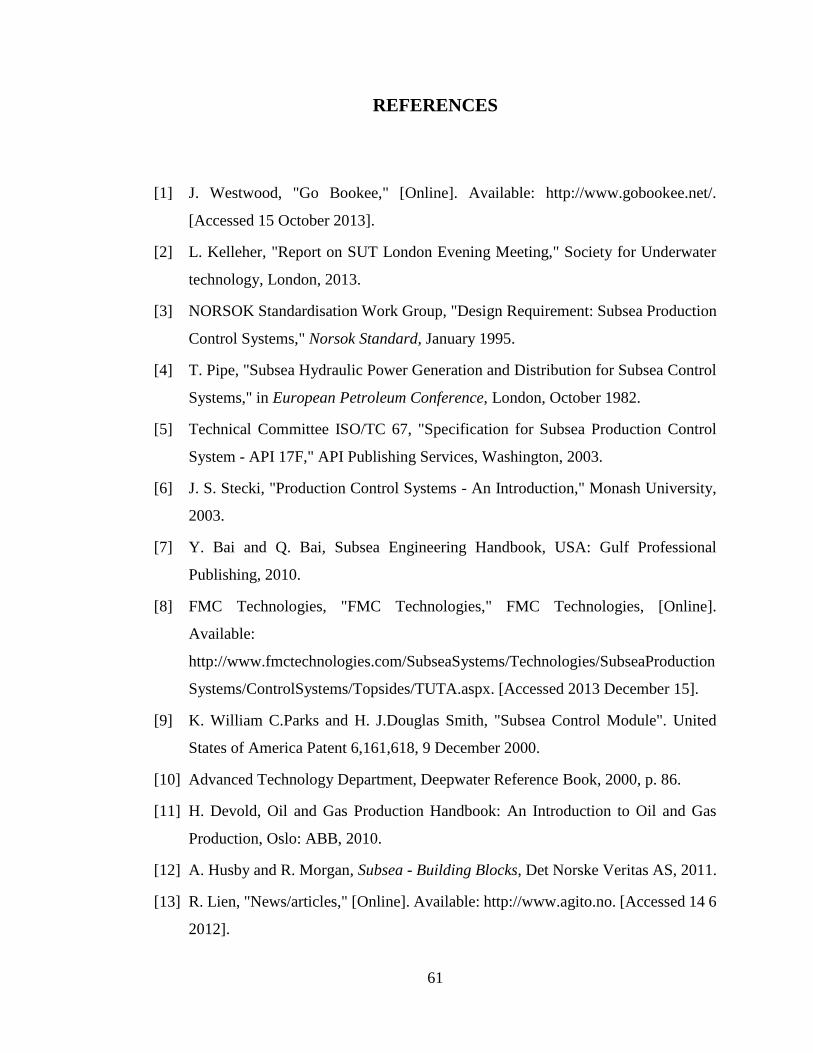
61
REFERENCES
[1] J. Westwood, "Go Bookee," [Online]. Available: http://www.gobookee.net/.
[Accessed 15 October 2013].
[2] L. Kelleher, "Report on SUT London Evening Meeting," Society for Underwater
technology, London, 2013.
[3] NORSOK Standardisation Work Group, "Design Requirement: Subsea Production
Control Systems," Norsok Standard, January 1995.
[4] T. Pipe, "Subsea Hydraulic Power Generation and Distribution for Subsea Control
Systems," in European Petroleum Conference, London, October 1982.
[5] Technical Committee ISO/TC 67, "Specification for Subsea Production Control
System - API 17F," API Publishing Services, Washington, 2003.
[6] J. S. Stecki, "Production Control Systems - An Introduction," Monash University,
2003.
[7] Y. Bai and Q. Bai, Subsea Engineering Handbook, USA: Gulf Professional
Publishing, 2010.
[8] FMC Technologies, "FMC Technologies," FMC Technologies, [Online].
Available:
http://www.fmctechnologies.com/SubseaSystems/Technologies/SubseaProduction
Systems/ControlSystems/Topsides/TUTA.aspx. [Accessed 2013 December 15].
[9] K. William C.Parks and H. J.Douglas Smith, "Subsea Control Module". United
States of America Patent 6,161,618, 9 December 2000.
[10] Advanced Technology Department, Deepwater Reference Book, 2000, p. 86.
[11] H. Devold, Oil and Gas Production Handbook: An Introduction to Oil and Gas
Production, Oslo: ABB, 2010.
[12] A. Husby and R. Morgan, Subsea - Building Blocks, Det Norske Veritas AS, 2011.
[13] R. Lien, "News/articles," [Online]. Available: http://www.agito.no. [Accessed 14 6
2012].
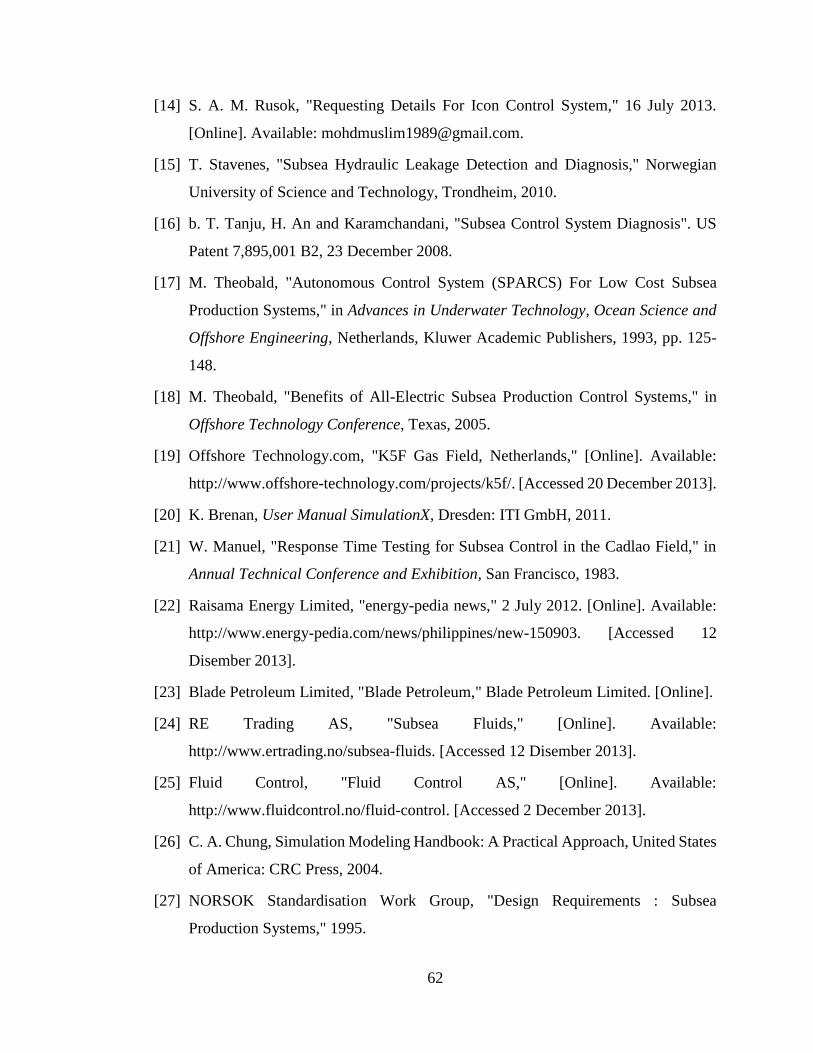
62
[14] S. A. M. Rusok, "Requesting Details For Icon Control System," 16 July 2013.
[Online]. Available: [email protected].
[15] T. Stavenes, "Subsea Hydraulic Leakage Detection and Diagnosis," Norwegian
University of Science and Technology, Trondheim, 2010.
[16] b. T. Tanju, H. An and Karamchandani, "Subsea Control System Diagnosis". US
Patent 7,895,001 B2, 23 December 2008.
[17] M. Theobald, "Autonomous Control System (SPARCS) For Low Cost Subsea
Production Systems," in Advances in Underwater Technology, Ocean Science and
Offshore Engineering, Netherlands, Kluwer Academic Publishers, 1993, pp. 125-
148.
[18] M. Theobald, "Benefits of All-Electric Subsea Production Control Systems," in
Offshore Technology Conference, Texas, 2005.
[19] Offshore Technology.com, "K5F Gas Field, Netherlands," [Online]. Available:
http://www.offshore-technology.com/projects/k5f/. [Accessed 20 December 2013].
[20] K. Brenan, User Manual SimulationX, Dresden: ITI GmbH, 2011.
[21] W. Manuel, "Response Time Testing for Subsea Control in the Cadlao Field," in
Annual Technical Conference and Exhibition, San Francisco, 1983.
[22] Raisama Energy Limited, "energy-pedia news," 2 July 2012. [Online]. Available:
http://www.energy-pedia.com/news/philippines/new-150903. [Accessed 12
Disember 2013].
[23] Blade Petroleum Limited, "Blade Petroleum," Blade Petroleum Limited. [Online].
[24] RE Trading AS, "Subsea Fluids," [Online]. Available:
http://www.ertrading.no/subsea-fluids. [Accessed 12 Disember 2013].
[25] Fluid Control, "Fluid Control AS," [Online]. Available:
http://www.fluidcontrol.no/fluid-control. [Accessed 2 December 2013].
[26] C. A. Chung, Simulation Modeling Handbook: A Practical Approach, United States
of America: CRC Press, 2004.
[27] NORSOK Standardisation Work Group, "Design Requirements : Subsea
Production Systems," 1995.
63
[28] A. Akers, M. Grassman and R. Smith, Hydraulic Power System Analysis, US:
Taylor & Francis Group, 2006.
[29] FMC Technologies, "Subsea Control Systems," FMC Technologies.
[30] W. Bolton, Mechatronics: A Multidisciplinary Approach, Great Britain: Pearson
Education Limited, 2008.
[31] J. R. Daines, Fluid Power: Hydraulics and Pneumatics, Illinois: G-W Publisher,
2009.
[32] A. Maria, "Introduction To Modeling And Simulation," in Simulation Conference,
Binghamton, 1997.
[33] W. D. K. Averill M. Law, Simulation Modeling and Analysis, United States of
America: McGraw-Hill Companies, Inc, 2000.
[34] O. K. Aziz, "Subsea Production Systems Control Modelling," Tronoh, 2013.
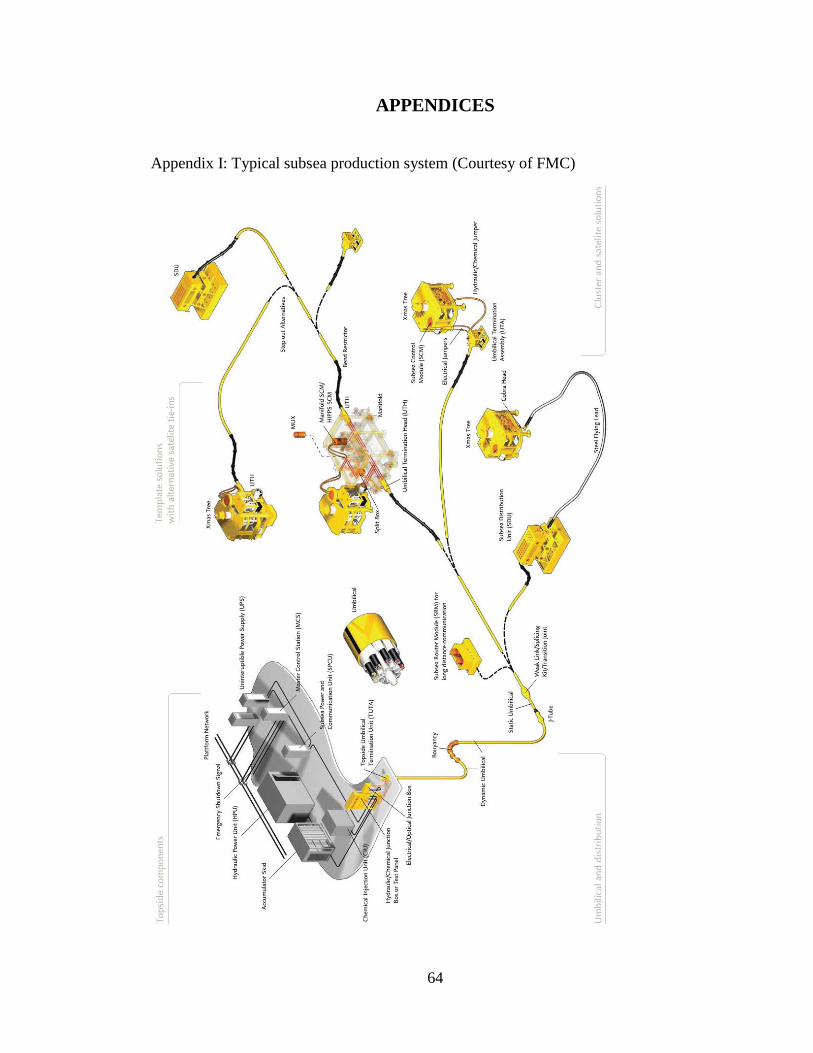
64
APPENDICES
Appendix I: Typical subsea production system (Courtesy of FMC)
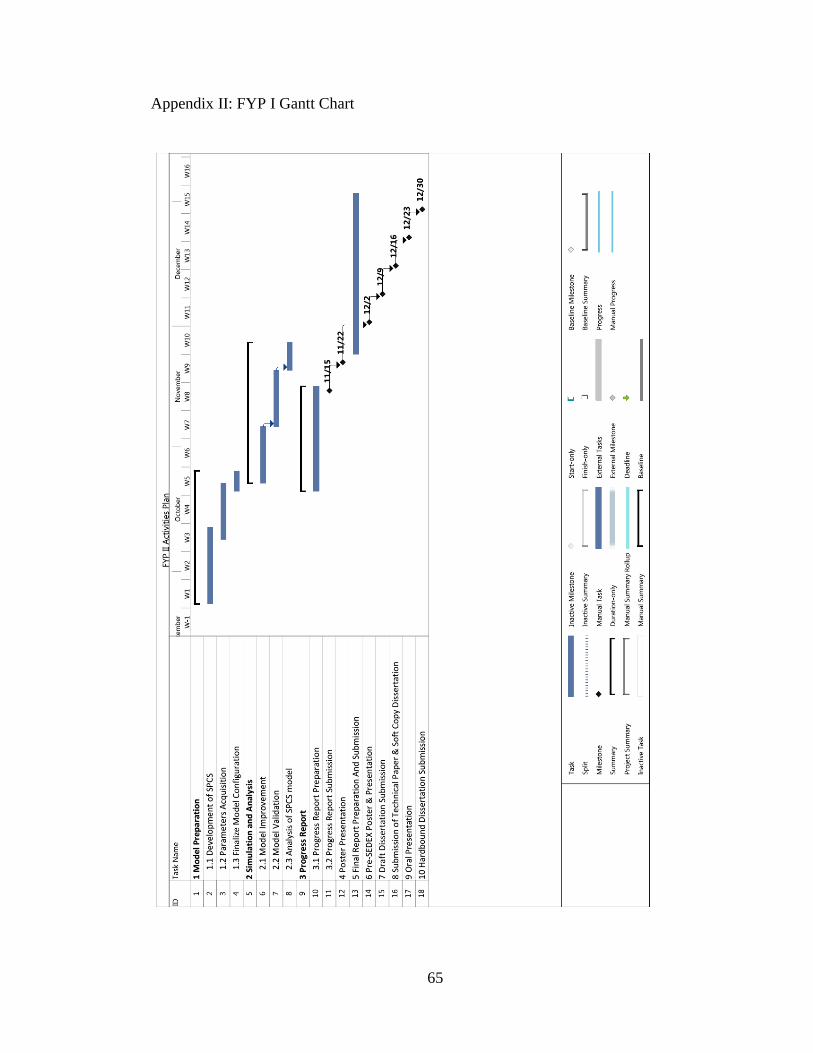
65
Appendix II: FYP I Gantt Chart
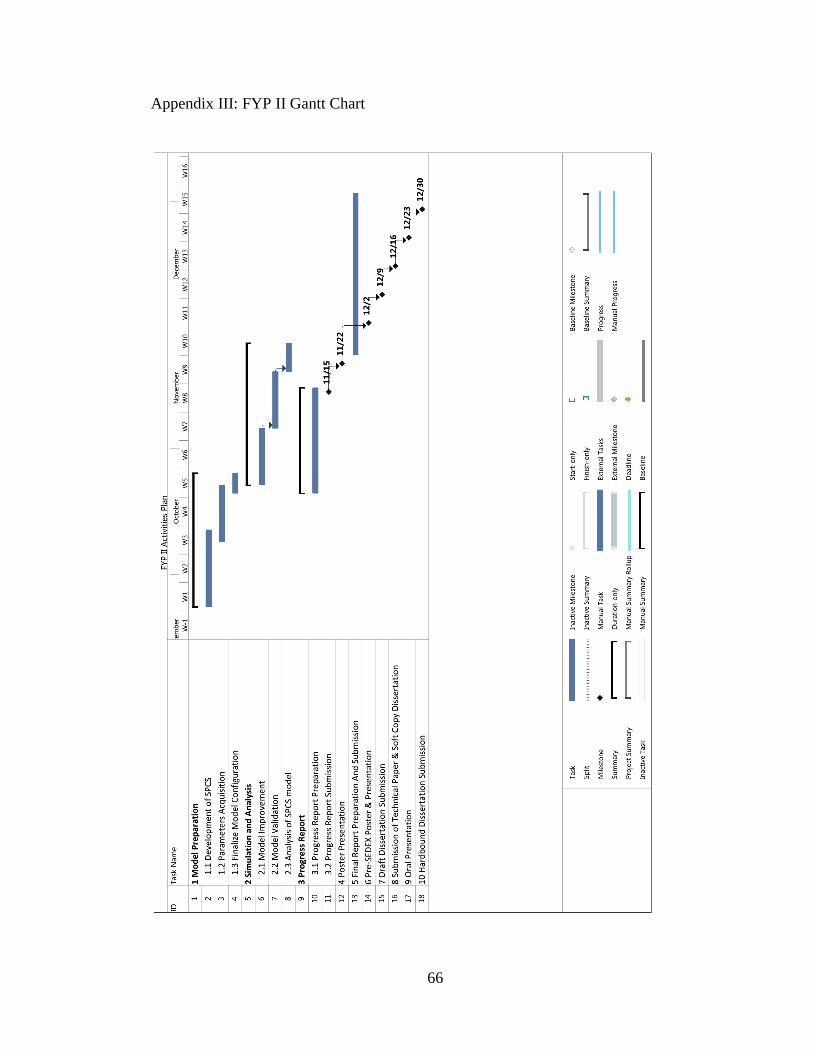
66
Appendix III: FYP II Gantt Chart

67