membrane fluidity determines sensitivity of filamentous fungi to chitosan
TRANSCRIPT
Membrane fluidity determines sensitivity of filamentousfungi to chitosanmmi_7039 1021..1032
J. Palma-Guerrero,1* J. A. Lopez-Jimenez,2
A. J. Pérez-Berná,3 I.-C. Huang,4 H.-B. Jansson,1
J. Salinas,1 J. Villalaín,3 N. D. Read4 andL. V. Lopez-Llorca1
1Laboratory of Plant Pathology, Multidisciplinary Institutefor Environmental Studies (MIES) Ramón Margalef,Department of Marine Sciences and Applied Biology,University of Alicante, E-03080 Alicante, Spain.2Physiology Department, Faculty of Biology, Universityof Murcia, E-30100 Murcia, Spain.3Instituto de Biología Molecular y Celular, UniversidadMiguel Hernández, E-03202 Elche-Alicante, Spain.4Fungal Cell Biology Group, Institute of Cell Biology,University of Edinburgh, Rutherford Building, EdinburghEH9 3JH, UK.
Summary
The antifungal mode of action of chitosan has beenstudied for the last 30 years, but is still little under-stood. We have found that the plasma membraneforms a barrier to chitosan in chitosan-resistant butnot chitosan-sensitive fungi. The plasma membranesof chitosan-sensitive fungi were shown to have morepolyunsaturated fatty acids than chitosan-resistantfungi, suggesting that their permeabilization by chito-san may be dependent on membrane fluidity. A fattyacid desaturase mutant of Neurospora crassawith reduced plasma membrane fluidity exhibitedincreased resistance to chitosan. Steady-state fluo-rescence anisotropy measurements on artificial mem-branes showed that chitosan binds to negativelycharged phospholipids that alter plasma membranefluidity and induces membrane permeabilization,which was greatest in membranes containing morepolyunsaturated lipids. Phylogenetic analysis of fungiwith known sensitivity to chitosan suggests that chi-tosan resistance may have evolved in nematophagousand entomopathogenic fungi, which naturally encoun-ter chitosan during infection of arthropods and nema-todes. Our findings provide a method to predict thesensitivity of a fungus to chitosan based on its plasma
membrane composition, and suggests a new strategyfor antifungal therapy, which involves treatments thatincrease plasma membrane fluidity to make fungimore sensitive to fungicides such as chitosan.
Introduction
Chitosan is a partly deacetylated form of chitin, theb-(1,4)-D-linked polymer of N-acetylglucosamine. Chitin isa natural polymer which is only second in abundance tocellulose (Kumar, 2000), and is a common constituentof arthropod exoskeletons, nematode eggshells, mostfungal cell walls, some algal cell walls, and some proto-zoan cysts (Cohen, 1987). Chitosan has a pKa value of~6.3 and thus it is cationic at lower pH values due toprotonation of its amino groups. Chitosan’s positivecharge confers it with biological properties that give itgreat potential in medicine and agriculture (Kumar, 2000).Chitosan is non-toxic to mammals and higher animals(Dodane and Vilivalam, 1998) and elicits plant defencemechanisms (Benhamou et al., 1994; Trotel-aziz et al.,2006). Other positively charged polymers, such as poly-L-lysine, protamine and histones (Hadwiger et al., 1977),and many cationic peptides from insects, humans andplants (Selitrennikoff, 2001), also have antifungalproperties. Chitosan has the advantage over cationic anti-fungal peptides that chitin provides an unlimited naturalsource for chitosan production, and peptides are suscep-tible to protease digestion. Most commercial chitosan isobtained by chemical deacetylation of crustacean chitinfrom shellfish waste (Kumar, 2000).
Since Allan and Hadwiger in 1979 (Allan and Hadwiger,1979) first showed the fungicidal effect of chitosan it hasattracted much research, and several studies haveattempted to elucidate its mode of action (Rabea et al.,2003). The inhibitory activity of chitosan against phyto-pathogenic fungi depends on it having a low molecularweight, high degree of deacetylation and being underacidic conditions for its amino groups to be charged(Stössel and Leuba, 1984). Chitosan also exhibits antibi-otic activity against bacteria and yeasts, and has beenreported to damage their plasma membranes (Helanderet al., 2001; Liu et al., 2004; Zakrzewska et al., 2005). Thefungicidal effects of chitosan on filamentous fungi haverecently been shown to involve energy-dependent plasma
Accepted 21 December, 2009. *For correspondence. E-mail [email protected]; Tel. (+34) 965903400 ext 2223; Fax (+34) 965909897.
Molecular Microbiology (2010) 75(4), 1021–1032 � doi:10.1111/j.1365-2958.2009.07039.xFirst published online 15 January 2010
© 2010 Blackwell Publishing Ltd

membrane permeabilization (Palma-Guerrero et al.,2009).
We recently showed that most plant pathogenic fungiare chitosan-sensitive, whereas nematophagous andentomopathogenic fungi are chitosan-resistant (Palma-Guerrero et al., 2008). In the present study we haveanalysed the basis of this sensitivity and resistance tochitosan. We have characterized plasma membranecomponents of both chitosan-resistant and chitosan-sensitive fungi and determined the lipid components ofthe plasma membrane that confer chitosan sensitivity.Based on these data, we propose a model for chitosan-induced membrane permeabilization and suggest anevolutionary explanation for chitosan resistance in nem-atophagous and entomopathogenic fungi. Our resultsalso suggest a new strategy for the design of antifungalagents.
Results
The plasma membrane forms a barrier to chitosan inchitosan-resistant fungi
Rhodamine-labelled chitosan (R-chitosan) has been pre-viously shown to enter the spores (conidia) of thechitosan-sensitive fungi after causing plasma membranepermeabilization (Palma-Guerrero et al., 2009). We com-pared R-chitosan uptake by conidia of chitosan-sensitiveand chitosan-resistant fungi. Chitosan-sensitive speciesused were the saprotroph N. crassa and the plant patho-gen Fusarium oxysporum f. sp. radicis-lycopersici; thenematophagous fungus Pochonia chlamydosporia andthe entomopathogenic fungus Beauveria bassiana wereselected for being chitosan-resistant (Palma-Guerreroet al., 2008; 2009). Fifteen minutes after application,R-chitosan fluorescence was detected both on thesurface and within all conidia of the two chitosan-sensitivespecies (Fig. 1) as shown previously (Palma-Guerreroet al., 2008; 2009). In the chitosan-resistant fungi P.chlamydosporia and B. bassiana, however, R-chitosanfluorescence was only detected on the conidial surface
(Fig. 1) and less than 30% of these conidia showed intra-cellular R-chitosan fluorescence.
Plasma membrane composition of chitosan-sensitivefungi exhibit increased fluidity
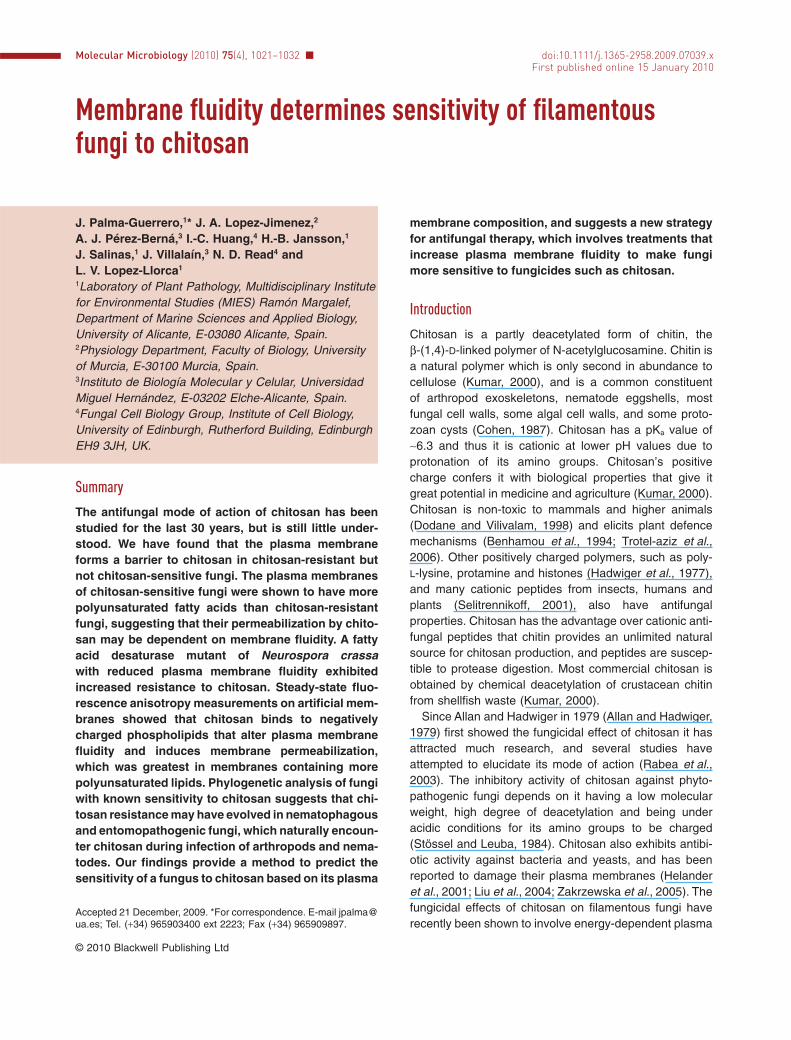
To assess the importance of fungal plasma membranecomposition on chitosan sensitivity, we analysed the mainfatty acids, ergosterol, phospholipids and acidic glycosph-ingolipids in chitosan-sensitive and resistant-fungi. Fattyacid analyses revealed that both chitosan-sensitive fungihave significantly higher levels of the polyunsaturatedfatty acid linolenic acid (C18:3 w-3), but lower levels ofsaturated palmitic (C16:0) and stearic (C18:0) acids andthe mono-unsaturated oleic acid (C18:1 w-9) than the twochitosan-resistant fungi (Table 1). The linoleic acidcontent was similar in both types of fungi. The fatty acidunsaturation indexes (Thompson et al., 1992) of N.crassa and F. oxysporum were 148 � 0.7 and 157 � 1.7respectively, which were significantly higher than those ofthe resistant P. chlamydosporia (121 � 7.9) and B. bassi-ana (111 � 5.1). Phospholipid head groups have previ-ously been proposed as the possible target for chitosanbinding (El Ghaouth and Arul, 1992). In this way, thedifferent chitosan sensitivities of different fungi have beenspeculated to be due to differences in phospholipid com-position, and particularly the nature of the charged phos-pholipid heads (Laflamme et al., 1999). We found nocorrelation between phospholipid composition and chito-san sensitivity; similar relative amounts of the negativelycharged phospholipids were found in all four species(Table 2). The phospholipids from chitosan-sensitivefungi, however, had increased amounts of polyunsatu-rated fatty acids (Table 3), confirming the results obtainedin the fatty acid analysis. Ergosterol is an important com-ponent of fungal plasma membranes, contributing to theirrigidity, stability and resistance to physical stresses (Parksand Casey, 1995). The ergosterol content of the fourspecies varied, but no correlation was found with chitosansensitivity (Fig. 2A). GIPCs are acidic glycosphingolipids
Fig. 1. Uptake of rhodamine-chitosan bychitosan-sensitive fungi (Neurospora crassa,Fusarium oxysporum f.sp. radicis-lycopersici ),but not chitosan-resistant fungi (Pochoniachlamydosporia, Beauveria bassiana).Bar = 2 mm.
1022 J. Palma-Guerrero et al. �
© 2010 Blackwell Publishing Ltd, Molecular Microbiology, 75, 1021–1032
that contain ionizable functional groups and are localizedin the plasma membranes of fungi, plants and protozoa,but have not been found in cells or tissues of mammals orother higher animals (Patton and Lester, 1991). In fungithey constitute 20–30% of total lipids, and have beenpreviously proposed as a possible target for chitosanbinding (Zakrzewska et al., 2005). Again, no clear corre-lation between GIPC profiles and differences in chitosansensitivity between fungi could be established (Fig. 2B).
Chitosan sensitivity can be modified by altering plasmamembrane fluidity
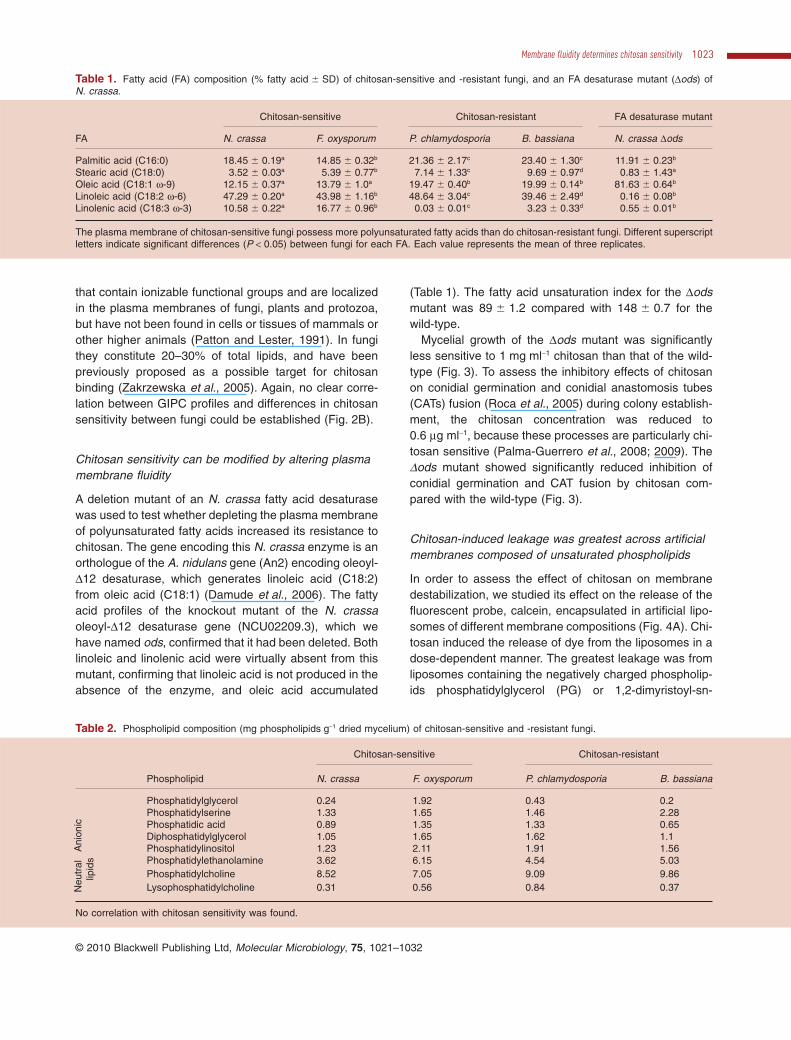
A deletion mutant of an N. crassa fatty acid desaturasewas used to test whether depleting the plasma membraneof polyunsaturated fatty acids increased its resistance tochitosan. The gene encoding this N. crassa enzyme is anorthologue of the A. nidulans gene (An2) encoding oleoyl-D12 desaturase, which generates linoleic acid (C18:2)from oleic acid (C18:1) (Damude et al., 2006). The fattyacid profiles of the knockout mutant of the N. crassaoleoyl-D12 desaturase gene (NCU02209.3), which wehave named ods, confirmed that it had been deleted. Bothlinoleic and linolenic acid were virtually absent from thismutant, confirming that linoleic acid is not produced in theabsence of the enzyme, and oleic acid accumulated
(Table 1). The fatty acid unsaturation index for the Dodsmutant was 89 � 1.2 compared with 148 � 0.7 for thewild-type.
Mycelial growth of the Dods mutant was significantlyless sensitive to 1 mg ml-1 chitosan than that of the wild-type (Fig. 3). To assess the inhibitory effects of chitosanon conidial germination and conidial anastomosis tubes(CATs) fusion (Roca et al., 2005) during colony establish-ment, the chitosan concentration was reduced to0.6 mg ml-1, because these processes are particularly chi-tosan sensitive (Palma-Guerrero et al., 2008; 2009). TheDods mutant showed significantly reduced inhibition ofconidial germination and CAT fusion by chitosan com-pared with the wild-type (Fig. 3).
Chitosan-induced leakage was greatest across artificialmembranes composed of unsaturated phospholipids
In order to assess the effect of chitosan on membranedestabilization, we studied its effect on the release of thefluorescent probe, calcein, encapsulated in artificial lipo-somes of different membrane compositions (Fig. 4A). Chi-tosan induced the release of dye from the liposomes in adose-dependent manner. The greatest leakage was fromliposomes containing the negatively charged phospholip-ids phosphatidylglycerol (PG) or 1,2-dimyristoyl-sn-
Table 1. Fatty acid (FA) composition (% fatty acid � SD) of chitosan-sensitive and -resistant fungi, and an FA desaturase mutant (Dods) ofN. crassa.
FA
Chitosan-sensitive Chitosan-resistant FA desaturase mutant
N. crassa F. oxysporum P. chlamydosporia B. bassiana N. crassa Dods
Palmitic acid (C16:0) 18.45 � 0.19a 14.85 � 0.32b 21.36 � 2.17c 23.40 � 1.30c 11.91 � 0.23b
Stearic acid (C18:0) 3.52 � 0.03a 5.39 � 0.77b 7.14 � 1.33c 9.69 � 0.97d 0.83 � 1.43a
Oleic acid (C18:1 w-9) 12.15 � 0.37a 13.79 � 1.0a 19.47 � 0.40b 19.99 � 0.14b 81.63 � 0.64b
Linoleic acid (C18:2 w-6) 47.29 � 0.20a 43.98 � 1.16b 48.64 � 3.04c 39.46 � 2.49d 0.16 � 0.08b
Linolenic acid (C18:3 w-3) 10.58 � 0.22a 16.77 � 0.96b 0.03 � 0.01c 3.23 � 0.33d 0.55 � 0.01b
The plasma membrane of chitosan-sensitive fungi possess more polyunsaturated fatty acids than do chitosan-resistant fungi. Different superscriptletters indicate significant differences (P < 0.05) between fungi for each FA. Each value represents the mean of three replicates.
Table 2. Phospholipid composition (mg phospholipids g-1 dried mycelium) of chitosan-sensitive and -resistant fungi.
Phospholipid
Chitosan-sensitive Chitosan-resistant
N. crassa F. oxysporum P. chlamydosporia B. bassiana
Ani
onic
Phosphatidylglycerol 0.24 1.92 0.43 0.2Phosphatidylserine 1.33 1.65 1.46 2.28Phosphatidic acid 0.89 1.35 1.33 0.65Diphosphatidylglycerol 1.05 1.65 1.62 1.1Phosphatidylinositol 1.23 2.11 1.91 1.56
Neu
tral
lipid
s Phosphatidylethanolamine 3.62 6.15 4.54 5.03Phosphatidylcholine 8.52 7.05 9.09 9.86Lysophosphatidylcholine 0.31 0.56 0.84 0.37
No correlation with chitosan sensitivity was found.
Membrane fluidity determines chitosan sensitivity 1023
© 2010 Blackwell Publishing Ltd, Molecular Microbiology, 75, 1021–1032

glycero-3-[phospho-rac-(1-glycerol)] (DMPG). Leakagefrom liposomes composed of the neutral phospholipidsphosphatidylcholine (PC) or 1,2-dimyristoyl-sn-glycero-3-phosphocholine (DMPC) was significantly lower. We alsoassayed the effect of chitosan on membranes containingdifferent ergosterol concentrations and observed thatergosterol decreased chitosan-induced leakage (Fig. 4A)possibly due to an increase in membrane stability. Unsat-urated fatty acids in neutral membranes containing18:3(cis)phosphatidlycholine significantly increased theleakage, whereas for negatively charged membranescontaining 18:3(cis)phosphatidylglycerol the leakageincrease was much lower.
The effect of chitosan on the structural and temperature-dependent properties of phospholipid membranes wasinvestigated by measuring the steady-state fluorescenceanisotropy of the fluorescent probes diphenyl-1,3,5-hexatriene (DPH) and 1-(4-trimethylammoniumphenyl)-6-phenyl-1,3,5-hexatriene (TMA-DPH) incorporated intoartificial membranes composed of either negativelycharged DMPG or neutral DMPC (Fig. 4B–E). These satu-rated, synthetic phospholipids were used because theyhave optimal properties for analysing temperature-dependent phospholipid anisotropy and structural order inmembranes when used in combination with DPH andTMA-DPH (Lentz, 1993). The location of these fluorescentprobes in the membrane differs: TMA-DPH localizes closeto the water/lipid interface and its fluorophore is located in
the upper part of the acyl chain region, while DPH (lackinga polar group) is embedded deeper in the hydrophobic partof the bilayer (Mateo et al., 1991). The influence of chitosanon DMPC and DMPG vesicles was assessed at differenttemperatures (Fig. 4B–E). Chitosan did not have a signifi-cant effect on the main phospholipid transition in DMPCmembranes (Fig. 4D and E), although a slight increase inanisotropy values in the gel phase and a decrease in theliquid-crystalline phase for the TMA-DPH probe were found(Fig. 4E). However, in the case of the negative phospho-lipid DMPG, the presence of chitosan dramatically affectedthe cooperativity and the anisotropy of the gel and liquid-crystalline phases of DMPG, increasing the anisotropyvalues in the liquid-crystalline phase and decreasing themin the gel phase (Fig. 4B and C). This effect was moresignificant for TMA-DPH than DPH. These results suggestthat chitosan is located close to the TMA-DPH along themembrane surface, decreasing the cooperativity of themain phospholipids transition and changing the anisotropyvalues to a point where a gel-to-liquid-crystalline phasetransition can hardly be detected.
Discussion
In this study we have investigated the mode-of-action ofthe antifungal agent chitosan, a topic that has beenstudied for more than 30 years but was little understooduntil now. Our multidisciplinary approach, combining cell
Table 3. Phospholipid fatty acid composition (% total fatty acid content) of chitosan-sensitive and chitosan-resistant fungi.
Fungus Fatty acid
Anionic phospholipids Neutral phospholipids
PG PS PA DPG PI PE PC LysoPC
Chi
tosa
n-se
nsiti
ve
N. crassa 16:0 32.70 43.76 31.55 21.20 43.47 27.89 8.71 29.0718:0 38.90 2.42 13.27 16.38 3.83 2.78 2.70 37.1418:1 (w-9) 10.03 10.08 9.66 11.65 8.81 10.03 14.37 12.0318:2 (w-6) 9.39 37.73 36.04 38.80 36.50 50.75 60.60 8.2018:3 (w-3) 1.27 3.56 4.18 5.72 3.52 4.96 8.91 0.00
F. oxysporum 16:0 40.35 41.75 24.76 11.69 39.55 20.75 7.33 28.8818:0 12.71 5.77 11.70 15.47 9.74 6.36 7.97 46.0818:1 (w-9) 13.66 11.59 14.28 10.23 9.13 16.21 13.59 8.1418:2 (w-6) 21.17 30.80 33.84 38.18 27.51 43.07 47.07 4.2618:3 (w-3) 5.60 8.26 11.30 20.73 8.63 10.79 20.93 0.65
Chi
tosa
n-re
sist
ant
P. chlamydosporia 16:0 34.71 45.30 26.34 21.41 45.05 25.82 7.55 30.7718:0 31.74 4.22 13.63 20.39 5.59 4.17 3.00 44.1818:1 (w-9) 10.04 9.41 10.99 8.17 7.52 14.14 8.72 9.2618:2 (w-6) 9.83 40.43 46.12 46.34 40.04 54.87 79.53 4.0718:3 (w-3) 0.00 0.00 0.00 0.00 0.00 0.00 0.00 0.00
B. bassiana 16:0 28.03 44.38 32.23 18.20 43.88 23.75 6.96 32.0118:0 40.95 5.56 35.16 21.79 10.83 5.93 4.02 30.6618:1 (w-9) 8.56 18.82 12.59 13.92 13.37 25.94 23.67 13.8718:2 (w-6) 4.00 29.88 15.11 41.52 29.80 42.08 61.80 8.3618:3 (w-3) 0.00 0.43 0.67 1.20 0.38 0.98 1.60 0.00
The phospholipids of chitosan-sensitive fungi had increased amounts of polyunsaturated fatty acids. No correlation between the type ofphospholipid present and chitosan sensitivity was found in the different fungi.DPG, diphosphatidylglycerol; LysoPC, lysophospatidylcholine; PA, phosphatidic acid; PC, phosphatidylcholine; PE, phosphatidylethanolamine;PG, phosphatidylglycerol; PI, phosphatidylinositol; PS, phosphatidylserine.
1024 J. Palma-Guerrero et al. �
© 2010 Blackwell Publishing Ltd, Molecular Microbiology, 75, 1021–1032
biology, biochemical, genetic and biophysics techniques,has demonstrated that the antifungal activity of chitosandepends on the fluidity of the fungal plasma membrane,which is determined by its polyunsaturated fatty acidcomposition.
By imaging fluorescently labelled chitosan using confo-cal microscopy we have shown that chitosan binds to theconidial surfaces of all species tested, but only consis-tently permeabilizes the plasma membranes of chitosan-sensitive fungi. This suggests that the plasma membraneforms a barrier to chitosan in chitosan-resistant fungi. Theanalysis of the main plasma membrane componentsrevealed important differences in fatty acid compositionbetween chitosan-sensitive and chitosan-resistant fungi.A higher content of the polyunsaturated fatty acid linolenicacid and a higher unsaturation index was measured in themembranes of chitosan-sensitive fungi. This indicates that
the plasma membranes of chitosan-sensitive fungi have ahigher fluidity than those of chitosan-resistant ones. Nocorrelation between chitosan sensitivity and phospholipid,ergosterol or GIPC composition was found.
The importance of fatty acid composition on chitosansensitivity was confirmed using an N. crassa Dods mutant,which lacks the enzyme oleoyl-D12 desaturase and pos-sesses membranes without linoleic and linolenic acid. TheDods mutant showed increased resistance to chitosan interms of mycelial growth, conidial germination and CATfusion. This finding further supports the conclusion thatthe polyunsaturated fatty acid composition of the plasmamembrane, and thus membrane fluidity, is important forconferring chitosan sensitivity. These results confirm theresult observed by Zakrzewska et al. (2007) in the yeastS. cerevisiae, who observed that treatments that increaseplasma membrane fluidity, such as increased growth tem-perature or ergosterol synthesis inhibition by miconazole,sensitize S. cerevisiae to chitosan (Zakrzewska et al.,2007). We found no changes in chitosan sensitivity in N.crassa grown at different temperatures (unpublishedresults). This is perhaps not surprising because N. crassahas previously been shown to be able to maintain itsmembrane fluidity constant by modifying its membranefatty acid composition at different temperatures (Vokt andBrody, 1985).
Experiments with artificial membranes indicated thatmembrane disruption involves electrostatic interactionsbetween positively charged chitosan and the negativephospholipid headgroups, as has been previously sug-gested (El Ghaouth and Arul, 1992). We found thatleakage caused by chitosan was significantly higher from
Fig. 2. Ergosterol and glycosphingolipids (GIPCs) content ofchitosan-sensitive and chitosan-resistant fungi.A. Ergosterol content (�SE). Letters show statistical differencesbetween fungi. Values with different letters are significantly different(P < 0.05). Each value represents the mean of three replicates.B. HPTLC profiles of GIPCs. Labels on the left show relativemigrations in solvent F of inositol-, mannosylinositol-,mannosyldiinositol- and mannosyltriinositolphosphorylceramide[IPC, MIPC, M(IP2)C and M(IP3)C respectively] according toreferences (Bennion et al., 2003; Ferket et al., 2003). B.b.,Beauveria bassiana (chitosan resistant); Forl, Fusarium oxysporumf.sp. radicis-lycopersici (chitosan sensitive); N.c., Neurosporacrassa (chitosan sensitive); P.c., Pochonia chlamydosporia(chitosan resistant).
Fig. 3. Resistance to chitosan of a fatty acid desaturase mutant(Dods) of N. crassa. Figure shows chitosan inhibition of mycelialgrowth (1 mg ml-1 chitosan), conidial germination (0.6 mg ml-1
chitosan) and CAT fusion (0.6 mg ml-1 chitosan). Values arepercentage mycelial growth/conidial germination/CAT fusion relativeto corresponding control values without chitosan. The mutant wassignificantly more resistant (P < 0.05) for each treatment. Eachvalue (�SE) represents the mean of three replicates.
Membrane fluidity determines chitosan sensitivity 1025
© 2010 Blackwell Publishing Ltd, Molecular Microbiology, 75, 1021–1032

liposomes composed of membranes with negativelycharged phospholipids than from liposomes composed ofneutral phospholipids. Unsaturated fatty acids in neutralmembranes also increased leakage, which was also con-sistent with our data indicating that unsaturated fatty acidsand increased fluidity of the plasma membrane conferchitosan sensitivity to fungi. Furthermore, the steady-statefluorescence anisotropy experiments suggested that chi-tosan binds to the membrane surface affecting the coop-erativity and anisotropy of the gel and liquid-crystallinephases.
Taken together, our combined data suggest that chito-san first binds to the target membrane surface and coversit in a carpet-like manner as has been reported for otherpositively charged antimicrobial peptides (Chan et al.,2006). Initial interaction with the negatively charged targetmembrane is electrostatically driven because of the posi-tive charge of the chitosan. In a second step, after athreshold concentration has been reached, chitosan willcause membrane permeabilization. The effect on themembrane surface will depend on the chitosan concentra-tion and the composition of the target membrane. Ourresults indicate that the level of fatty acid unsaturation andthe extent of membrane fluidity may explain the differencesin chitosan sensitivity found in the fungi studied. In a highlypolyunsaturated membrane exhibiting high fluidity, chito-san binding should induce an increase in membrane rigid-ity in the membrane regions to which it attaches. Sincenegatively charged membrane lipids are not uniformlydistributed within the plasma membrane (Alvarez et al.,2007; Jean-francois et al., 2008), this interaction willenhance differences in fluidity between different mem-brane regions, causing membrane permeabilization. In asaturated, more rigid membrane, the changes in rigidityinduced by chitosan binding would be much lower and littlepermeabilization, even in the presence of negativelycharged phospholipids headgroups, should be induced.
It has been previously shown that fatty acid compositionis a robust taxonomic tool for classifying fungi belowfamily level (Ruess et al., 2002). The differences in fattyacid profiles observed here are consistent with the resis-
Fig. 4. Effect of chitosan on liposomes of different lipidcomposition.A. Percentage leakage (�SE) of calcein dye encapsulated withindifferent liposomes.B–E. Steady-state fluorescence anisotropy (r value) as a function oftemperature of DMPC- and DMPG-containing membranes in theabsence or presence of chitosan. Chitosan to lipid molar ratio was15:1 in the four graphs. PC, L-a-phosphatidylcholine; PG,L-a-phosphatidylglycerol; ERG, ergosterol; DMPC,1,2-dimyristoyl-sn-glycero-3-phosphocholine; 18:3 (Cis) PC,1,2-dilinolenoyl-sn-glycero-3-phosphocholine; DMPG,1,2-dimyristoyl-sn-glycero-3-[phospho-rac-(1-glycerol)]; 18:3 (Cis)PG, 1,2-dilinolenoyl-sn-glycero-3-phospho-(1′-rac-glycerol); DPH,1,6-diphenyl-1,3,5-hexatriene; TMA-DPH,1-(4-trimethylammoniumphenyl)-6-phenyl-1,3,5-hexatriene.
1026 J. Palma-Guerrero et al. �
© 2010 Blackwell Publishing Ltd, Molecular Microbiology, 75, 1021–1032

tant and sensitive fungi belonging to different fungalfamilies. The chitosan-resistant fungi form a paraphyleticgroup composed of entomopathogenic fungi (Cordycipita-ceae family) and nematophagous egg-parasitic fungi(Clavicipitaceae family) (Fig. 5). Hosts of both groups offungi have cuticles and egg-shells with a high chitincontent (Wharton, 1980; Bird and Bird, 1991) that thesefungi have to degrade to penetrate the host (Lopez-Llorcaand Duncan, 1988). It has been recently shown that ento-mopathogenic fungi transform chitin in the host cuticle tochitosan using chitin deacetylases, and this chitosan islater degraded by fungal chitosanases during host pen-etration (Nahar et al., 2004). We previously found that theonly chitosan-resistant species that was neither nem-atophagous nor entomopathogenic, out of 11 speciestested, was the root pathogen Gaeumannomyces grami-nis var. tritici. However, in contrast to the entomopatho-genic and nematophagous fungi, which showed high
chitosanolytic activity, G. graminis var. tritici was unable todegrade chitosan (Palma-Guerrero et al., 2008), suggest-ing that it has evolved a different method of chitosanresistance. We propose that chitosan-resistant ento-mopathogenic and nematophagous fungi may haveevolved to survive the antifungal chitosan residues gen-erated during host penetration by modifying their plasmamembrane fluidity to reduce chitosan damage.
Our findings provide important new insights into themechanism by which chitosan permeablizes fungalplasma membranes, and into the basis of chitosan resis-tance and its evolution in fungi. Our conclusions alsoprovide a method for predicting the sensitivity of a fungusto chitosan based on its plasma membrane composition.Perhaps most importantly, our results suggest a new strat-egy for antifungal therapy, which involves treatments thatincrease plasma membrane fluidity to make fungi moresensitive to fungicides with similar modes of action to
Fig. 5. Phylogenetic analysis of chitosan-sensitive and chitosan-resistant fungi and oomycetes (14,15) based on rDNA ITS sequences fromGenBank. Fungi: Beauveria bassiana (Accession No. FJ468000), Lecanicillium psalliotae (Accession No. AB160994), Pochonia rubescens(Accession No. DQ516078), Paecilomyces lilacinus (Accession No. EU306174), Pochonia chlamydosporia (Accession No. AJ291804),Trichoderma atroviride (Accession No. AF278794), Trichoderma harzianum (Accession No. FJ442681), Fusarium oxysporum f. sp.radicis-lycopersici (Accession No. AY354387), Fusarium equiseti (Accession No. FJ439592), Verticillium dahliae (Accession No. EF015891),Gaeumannomyces graminis var. tritici (Accession No. AJ969262), Neurospora crassa (Accession No. AY681193), Botrytis cinerea (AccessionNo. AB444949), Rhizoctonia solani (Accession No. FJ534556). Oomycetes: Pythium ultimum (Accession No. EU792322).(�) = chitosan-resistant fungi; (�) = chitosan-sensitive fungi; E = entomopathogenic fungi; N = nematophagous fungi; M = mycoparasitic fungi;P = plant pathogenic fungi; S = saprotrophic fungi.
Membrane fluidity determines chitosan sensitivity 1027
© 2010 Blackwell Publishing Ltd, Molecular Microbiology, 75, 1021–1032

chitosan (e.g. positively charged antimicrobial agents;Jean-francois et al., 2008).
Experimental procedures
Strains and culture conditions
Beauveria bassiana, P. chlamydosporia and F. oxysporumf.sp. radicis-lycopersici (strain collection at the Plant Pathol-ogy Laboratory, University of Alicante) were maintained oncorn meal agar (CMA, Becton Dickinson and Company,Sparks, MD, USA). The Neurospora crassa wild-type strain74-OR23-IVA (FGSC #2489) and the N. crassa fatty aciddesaturase mutant (FGSC #16054), which we have namedDods, were maintained on solid Vogel’s agar medium (Davis,2000).
For fatty acid, ergosterol and lipid analyses, fungi weregrown on 1% PDB (Potato Dextrose Broth, Becton Dickinsonand Company, Sparks, MD, USA) for 5 days, at 25°C withshaking at 100 r.p.m. The resultant mycelium was vacuum-filtered and lyophilized prior to extraction.
Chitosan preparation
Chitosan (T8s) with a molecular weight of 70 kDa and exhib-iting 79.6% deacetylation was obtained from Marine BioProd-ucts GmbH (Bremerhaven, Germany). Chitosan wasdissolved in 0.25 mol l-1 HCl and the pH adjusted to 5.6 withNaOH. The resulting solution was dialysed for salt removal,and the dialysed chitosan was autoclaved at 120°C for20 min (Palma-Guerrero et al., 2008).
Rhodamine-labelled T8s chitosan (R-chitosan) was kindlyprovided by Dr V. Tikhonov (Laboratory of PhysiologicallyActive Biopolymers, A.N. Nesmeyanov Institute of Organo-element Compounds, Russian Academy of Sciences,Moscow, Russia), and was prepared as described above forT8s chitosan.
Staining of conidia with rhodamine-chitosan
Conidia from the different fungi were collected in sterile dis-tilled water, their concentration was adjusted to 106 conidi-a ml-1, and then they were treated with 0.1 mg ml-1
rhodamine-chitosan (final concentration) for 15 min at roomtemperature. The resultant conidial suspension was then dis-pensed as 25 ml droplets onto glass coverslips, and conidiawere immobilized by the inverted agar block method (Hickeyet al., 2005) and imaged by confocal microscopy with a 60¥oil immersion objective. Confocal laser scanning microscopywas performed using an inverted DM IRBE2 microscope(Leica). Rhodamine-chitosan was imaged using excitationwavelength at 543 nm and fluorescence detection at 555–700 nm. Simultaneous brightfield images were captured witha transmitted light detector. Images were captured with aresolution of 512 ¥ 512 pixels. Confocal images were pro-cessed using Image J (version 1.38¥ for Mac Os) and AdobePhotoshop (version 10.0; Adobe Systems) software.
Fatty acid analysis
After tissue homogenization, the fatty acid composition of thetotal lipid fraction was determined by fat extraction with a
mixture of chloroform and methanol (1:1 and 2:1 proportionsfor the first and second extractions respectively) following themethod of Folch et al. (1957). Fatty acid methyl esters(FAME) samples were analysed according to the method ofStoffel et al. (1959). Samples were analysed by gas-liquidchromatography using a SPTM 2560 flexible fused silicacapillary column (100 m length and 0.25 mm internal diam-eter and 0.20 mm of film thickness) in a Hewlett-Packard 5890gas chromatograph (Waldbronn, Germany). The oven tem-perature was programmed for 5 min at an initial temperatureof 140°C, was increased at a rate of 4°C per minute to 230°C,was further increased at a rate of 1°C per minute to 240°Cand then was held at this temperature for 6 min. The injectorand flame ionization detector were set at 250°C. Helium wasused as the carrier gas at a pressure of 290 kPa, and peakswere identified by comparison of their retention times withappropriate FAME standards purchased from Sigma Chemi-cal Company (St Louis, MO, USA). Individual fatty acid con-centrations were expressed as percentages of the totalcontent. The fatty acid unsaturation index of each samplewas calculated by multiplying the percentage of each fattyacid (relative to the total fatty acids present in the sample) bythe number of double bonds it contains and adding the resultsfor all the fatty acids identified in the sample.
Ergosterol analysis
The alkaline ergosterol extraction was performed asdescribed previously (Van leeuwen et al., 2008) with someminor modifications. Mycelium (50 mg dry weight) washomogenized in a 15 ml polypropylene screw-cap centrifugetube containing 4 ml 10% KOH in methanol (Sigma) and anequal amount of 0.5 mm glass beads. The mixture was vor-texed for 15 min and sonicated in a bath for another 15 min.The preparation was then heated for 90 min at 70°C in awater bath. For extraction, 1 ml distilled water and 2 mln-hexane (Sigma) were added at room temperature, vortexedfor 30 s, and centrifuged at 3200 g for 10 min. The top(n-hexane) fraction was removed and the aqueous fractionwas shaken with fresh n-hexane for an additional extraction.The pooled n-hexane fractions were evaporated overnight ina water bath at 45°C. After evaporation the precipitates weredissolved in 1 ml methanol by vortexing and sonication for10 min. The samples were filtered through an Acrodisc0.2 mm PTFE syringe filter (Sigma) and loaded for HPLCanalysis. Ergosterol was measured using a LiChospher 100RP-18 (5 mm) column (Agilent Technologies). The mobilephase consisted of methanol at a flow rate of 1.5 ml min-1 andergosterol was detected at 282 nm. The peak area at thiswavelength was used for quantification using an externalstandard (Sigma).
Phospholipid analysis
Phospholipid extraction and analysis were carried out byMylnefield Lipid Analysis (Dundee, UK). Total lipids wereextracted following a method similar to that described for fatextraction prior to fatty acid analysis but with minor modifi-cations (Moilanen and Nikkari, 1981). Two-dimensional thinlayer chromatography (TLC) was used to separate the indi-
1028 J. Palma-Guerrero et al. �
© 2010 Blackwell Publishing Ltd, Molecular Microbiology, 75, 1021–1032
vidual phospholipids in each fungal sample. TLC plateswere run in the first dimension in a mobile phase of65:22:2.6 chloroform/methanol/water (v/v/v) for 1 h. Whendeveloped, the TLC plates were left to dry in an oven at25°C for 1 h before being turned through 90° and placedback into the developing tank containing a second mobilephase of 80:12:15:4 chloroform/methanol/acetic acid/water(v/v/v/v) for 1 h. When developed, the plates were removedfrom the tank and incubated at 25°C for 15 min. The plateswere then sprayed with 0.01% primulin solution and incu-bated 25°C for a further 15 min. The plates were viewedunder UV light and the individual phospholipid spots wereidentified and circled with pencil before being scraped offthe silica plate into individually labelled test tubes. Toluene(1 ml) and 1% sulphuric acid-methanol solution (2 ml) wereadded, and the test tubes were then incubated overnight ina heating block at 50°C. After removal from the heating 5%aqueous sodium chloride (5 ml) and iso-hexane (2 ml) wereadded and the sample was shaken. Once the sample hadsettled into two layers, the upper iso-hexane layer wasdrawn off into another test tube with a Pasteur pipette. Theoriginal test tube was extracted again with iso-hexane(2 ml), and both iso-hexane fractions (4 ml) were collectedin the same test tube. After extraction, 2% aqueous potas-sium hydrogen carbonate (3 ml) was added to the iso-hexane fractions and the sample was shaken. Whensettled, the upper iso-hexane fraction was drawn off andpassed through a sodium sulphate column, into a centrifugetube in order to assist the removal of residual water. Thecentrifuge tube was placed in a centrifugal evaporator toremove the solvent. After the solvent had been removed theremaining oil was re-immersed in a calculated volume ofiso-hexane and butylhydroxytoluene, and placed on the gascromatograph for fatty acid analysis.
Acidic glycosphingolipid analysis
Extraction and analysis of acidic glycosphingolipids werecarried out as described previously (Toledo et al., 1999;Bennion et al., 2003; Ferket et al., 2003) with minor modifi-cations. Mycelium (0.5 g dry weight) was homogenized in a15 ml polypropylene screw-cap centrifuge tube by vortexingfor 15 min and sonication in a bath for a further 15 min,once with 10 ml of solvent A (chloroform/methanol 1:1, v/v),and then twice with 10 ml of solvent B (isopropanol/hexane/water 55:25:20, v/v/v). The upper phase was discarded andthe sample was once more similarly vortexed and sonicatedwith 10 ml of solvent A. The four extracts were pooled anddried on a rotary evaporator. The dried residue was parti-tioned between water and 1-butanol pre-saturated withwater (10 ml each) with vigorous shaking in a separatoryfunnel. The lower (water) layer was removed, and similarlyextracted four more times with equal volumes of water-saturated 1-butanol. The five 1-butanol extracts were com-bined in a round-bottom flask and evaporated to dryness ona rotary evaporator. The dried residue was then treated with20 ml methanol/water/1-butanol (4:3:1 v/v/v) containing25–30% methylamine at 55°C for 4 h in a tightly stopperedflask, with occasional shaking. After removal of the reagentsolution by rotary evaporation, the residue was resus-pended in a minimal volume of solvent C (chloroform/
methanol/water 30:60:8, v/v/v) and applied to a column ofDEAE-Sephadex A-25 pre-equilibrated with 0.05 M sodiumacetate (Ac- form). Neutral lipids were eluted with fivevolumes of solvent C. Acidic lipids, including glycosylinosi-tolphosphorylceramides (GIPCs), were eluted with fivevolumes of 0.5 M sodium acetate in methanol. The acidicfraction was dried by rotary evaporation, resuspended in aminimal volume of methanol, dialysed exhaustively againstdeionized water, redried by lyophilization, and taken up insolvent B prior to analytical high performance TLC. HPTLCwere performed on silica gel 60 plates (Merck, Darmstadt,Germany) using solvent F (chloroform/methanol/water(50:47:14 v/v/v, containing 0.035% w/v CaCl2). Sampleswere dissolved in solvent B and applied with 10 ml micro-caps. Detection was made by spraying TLC plates withBial’s orcinol reagent [orcinol 0.55% (w/v) and H2SO4 5.5%(v/v) in ethanol/water 9:1 (v/v)] and heating them briefly to200–250°C.
Chitosan inhibition of mycelial growth, conidialgermination and CAT fusion
Assessment of the inhibitory effects of chitosan on mycelialgrowth of N. crassa wild-type strain and the Dods fatty aciddesaturase mutant was carried out on PDA plates supple-mented with 1 mg ml-1 chitosan, as described previously(Palma-Guerrero et al., 2008). PDA plates without chitosanserved as controls. Four plates per treatment were inoculatedin the centre with a plug (5 mm diameter) from the edge of a24-h-old colony of the fungus to be tested, and the colonyradius was measured after 10 h of growth for each plate. Thepercentage colony extension in the presence of 1 mg ml-1
chitosan relative to the untreated control was calculated. Theexperiment was performed three times.
For conidial germination and CAT fusion assays conidiawere collected from 4- to 5-day-old wild-type or mutant cul-tures of N. crassa by adding 1 ml sterile distilled water andremoving the conidial suspension with a pipette. Theconidia were counted using a haemocytometer, diluted tothe appropriate concentration and immediately used in thebioassays. Conidial germination and CAT fusion assayswere carried as described previously (Palma-Guerreroet al., 2009). Conidial germination and CAT fusion assayswere carried out in 8-well slide culture chambers (NalgeNunc International, Rochester, NY). Each well was filledwith 200 ml of conidial suspension at a final concentration of106 conidia ml-1 in Vogel’s medium (Davis, 2000) diluted100 times. After incubation at 24°C in continuous light, thepercentage of conidia that had germinated was quantified(percentage germination was defined as the percentage ofconidia possessing one or more germ tubes and/or CATs).A 20¥ dry or a 60¥ water immersion plan apo objective withdifferential interference contrast (DIC) optics on an invertedTE2000E microscope (Nikon, Kingston-Upon-Thames, UK)was used for the analysis of conidial germination. CATfusion was assessed with the 60¥ objective on the invertedmicroscope and CAT fusion was quantified as the percent-age of conidia/conidial germlings involved in fusion. Threewells per treatment, with 10 fields of view per well (eachcontaining 100–300 conidia) were assessed, and eachexperiment was performed twice.
Membrane fluidity determines chitosan sensitivity 1029
© 2010 Blackwell Publishing Ltd, Molecular Microbiology, 75, 1021–1032
Membrane leakage by chitosan
To study the effect of chitosan on artifical membranes,membrane leakage experiments, based on the release ofthe fluorescent probe calcein encapsulated in artificial lipo-somes of different membrane compositions, were per-formed. L-a-phosphatidylcholine (from chicken egg) (PC),L-a-phosphatidylglycerol (from chicken egg; sodium salt)(PG), 1,2-dimyristoyl-sn-glycero-3-phosphocholine (DMPC),1,2-dimyristoyl-sn-glycero-3-[phospho-rac-(1-glycerol)](DMPG), 1,2-dilinolenoyl-sn-glycero-3-phosphocholine (18:3(Cis) PC), 1,2-dilinolenoyl-sn-glycero-3-phospho-(1′-rac-glycerol) (18:3 (Cis) PG) and ergosterol (ERG) wereobtained from Avanti Polar Lipids (Alabaster, AL, USA).Calcein was obtained from Sigma. 1,6-diphenyl-1,3,5-hexatriene (DPH) and 1-(4-trimethylammoniumphenyl)-6-phenyl-1,3,5-hexatriene (TMA-DPH) were obtained fromMolecular Probes (Eugene, OR, USA). All other reagentsused were of analytical grade from Merck (Darmstadt,Germany). Water was deionized, twice distilled and passedthrough a Milli-Q equipment (Millipore Iberica, Madrid,Spain) to a resistivity lower than 18 MW cm.
Aliquots containing the appropriate amount of lipids inchloroform/methanol (2:1, v/v) were placed in a test tube, thesolvents removed by evaporation under a stream of O2-freenitrogen, and finally, traces of solvents were eliminated undervacuum in the dark for 3 h. The lipid films were resuspendedin an appropriate buffer and incubated either at 25°C or 10°Cabove the gel-to-liquid-crystal-phase transition temperature(Tm) with intermittent vortexing for 30 min to hydrate thesamples and obtain multilamellar vesicles (MLV). Thesamples were frozen and thawed five times to ensure com-plete homogenization and maximization of chitosan/lipid con-tacts, with occasional vortexing. Large unilamellar vesicles(LUV) with a mean diameter of 0.1 mm were prepared fromMLVs by the extrusion method (Mayer et al., 1986), usingpolycarbonate filters with a pore size of 0.1 mm (NucleporeCorp., Cambridge, CA, USA). The phospholipid concentra-tion was measured by methods described previously (Bot-tcher et al., 1961). For membrane leakage measurementsLUVs with a mean diameter of 0.1 mm were prepared asindicated above in a buffer consisting of 20 mM citrate,20 mM NaCl and 40 mM calcein; pH 5.4 (Perez-berna et al.,2006). Non-encapsulated calcein was separated from thevesicle suspension through a Sephadex G-75 filtrationcolumn (Pharmacia, Uppsala, Sweden) and eluted with abuffer containing 20 mM citrate, 100 mM NaCl and 0.1 mMEDTA; pH 5.4. Membrane rupture (leakage) of intraliposomalcalcein was assayed by treating the probe-loaded liposomes(final lipid concentration, 0.125 mM) with the appropriateamounts of chitosan using a 5 ¥ 5 mm fluorescence cuvetteat a final volume of 400 ml on a Cary Eclipse spectrofluorom-eter (Varian, San Carlos, CA, USA), stabilized at 25°C. Themedium in the cuvettes was continuously stirred to allow fora rapid mixing of chitosan and vesicles. Leakage wasassayed until no more change in fluorescence was obtainedat excitation and emission wavelengths of 492 and 517 nmrespectively. Excitation and emission slits were set at 5 nm.One hundred per cent release was achieved by adding TritonX-100 to the cuvette to a final concentration of 0.5% (v/v).Fluorescence measurements were made initially with probe-loaded liposomes, afterwards by adding chitosan solution,
and finally by adding Triton X-100 to obtain 100% leakage.Leakage was quantified on a percentage basis (% L) accord-ing to the equation, %L = [(Ff - Fo) ¥ 100]/(F100 - Fo); where Ff
is the equilibrium value of fluorescence after chitosan addi-tion, F0 is the initial fluorescence of the vesicle suspension,and F100 is the fluorescence value after the addition of TritonX-100. Although chitosan induced the release of the internalcontents of the liposomes in a dose-dependent manner, wechose a chitosan-to-lipid molar ratio of 15:1 as it was optimalfor analysis.
Steady-state fluorescence anisotropy
The effect of chitosan on the structural and temperature-dependent properties of phospholipid membranes wasstudied using steady-state fluorescence anisotropy. MLVswere formed in 20 mM citrate, 100 mM NaCl and 0.1 mMEDTA, pH 5.4. Aliquots of TMA-DPH or DPH in N,N9-dimethylformamide (2 ¥ 10-4 M) were directly added into thelipid dispersion to obtain a probe/lipid molar ratio of 1:500.Samples were incubated for 15 or 60 min for TMA-DPH andDPH, respectively, at 10°C above the Tm of the phospholipid.Afterwards, chitosan was added to obtain a chitosan/lipidmolar ratio of 15:1, and was incubated at 10°C above the Tm ofeach phospholipid for 1 h, with occasional vortexing. All fluo-rescence studies were carried using 5 ¥ 5 mm quartz cuvettesin a final volume of 400 ml (315 mM lipid concentration). Alldata were corrected for background intensities. The steady-state fluorescence anisotropy, ⟨r⟩, was measured with anautomated polarization accessory using a Varian Cary Eclipsefluorescence spectrometer, coupled to a Peltier device forautomatic temperature change. The vertically and horizontallypolarized emission intensities, elicited by vertically polarizedexcitation, were corrected for background scattering by sub-tracting the corresponding polarized intensities of a phospho-lipid preparation lacking probes. The G-factor, accounting fordifferential polarization sensitivity, was determined by measur-ing the polarized components of the fluorescence of the probewith horizontally polarized excitation (G = IHV/IHH). Sampleswere excited at 360 nm (slit width, 5 nm) and fluorescenceemission was recorded at 430 nm (slit width, 5 nm). Thevalues were calculated from the equation by Lakowicz (1999).The steady-state anisotropy was defined by ⟨r⟩ = (Ivv - GIVH)/(Ivv + 2GIVH); where IVV and IVH are the fluorescence intensitiesmeasured (after appropriate background subtraction) with theexcitation polarizer vertically oriented and the emission polar-izer horizontally oriented.
Phylogenetic analysis
A total of 15 rDNA ITS sequences, containing the internaltranscribed spacer 1, the 5.8S ribosomal RNA gene and theinternal transcribed spacer 2, were retrieved from GeneBankfor fungal species known to be sensitive or resistant to chi-tosan (Palma-Guerrero et al., 2008; 2009). Sequences werealigned using ClustalX, and were corrected by visualalignment. A neighbour-joining (NJ) tree was produced fol-lowing the Kimura two-parameter model, using the MEGAprogram version 4 (Tamura et al., 2007). The tree was resa-mpled 1000 times for bootstrap analysis.
1030 J. Palma-Guerrero et al. �
© 2010 Blackwell Publishing Ltd, Molecular Microbiology, 75, 1021–1032

Statistical analyses
Statistical analyses of the data were performed using SPSS16.0 for Mac OS. To test possible differences betweensamples we carried out raw data (e.g. fatty acid composition)analyses. To study differences in chitosan sensitivity ofmutants (e.g. hyphal growth) we analysed percentagesrespect to control to normalize the data. One-way ANOVA
analysis was used in every case, assuming a P-value of 0.05.After that, post hoc tests, using the least significant differencemethod or Tamhane’s T2 tests, were used to detect signifi-cant differences between treatments.
Acknowledgements
We thank Dr V. Tikhonov for providing the R-chitosan, and DrJ. Martin-Nieto for critical reading of the manuscript. Theresearch was supported by the Spanish Ministry of Scienceand Innovation (AGL2008-00716) and UK Biotechnologicaland Biological Science Research Council (BB/E010741/1).
References
Allan, C.R., and Hadwiger, L.A. (1979) The funcidal effect ofchitosan on fungi of varying cell wall composition. ExpMycol 3: 285–287.
Alvarez, F.J., Douglas, L.M., and Konopka, J.B. (2007)Sterol-rich plasma membrane domains in Fungi. EukaryotCell 6: 755–763.
Benhamou, N., Lafontaine, P.J., and Nicole, M. (1994) Induc-tion of systemic resistance to Fusarium crown and root rotin tomato plants by seed treatment with chitosan. Phyto-pathology 84: 1432–1444.
Bennion, B., Park, C., Fuller, M., Lindsey, R., Momany, M.,Jennemann, R., and Levery, S.B. (2003) Glycosphingolip-ids of the model fungus Aspergillus nidulans: characteriza-tion of GIPCs with oligo-alpha-mannose-type glycans.J Lipid Res 44: 2073–2088.
Bird, A.F., and Bird, J. (1991) The Structure of Nematodes.San Diego, CA: Academic Press.
Bottcher, C.S.F., Van Gent, C.M., and Fries, C. (1961) A rapidand sensitive sub-micro phosphorus determination. AnalChim Acta 1061: 203–204.
Chan, D.I., Prenner, E.J., and Vogel, H.J. (2006) Tryptophan-and arginine-rich antimicrobial peptides: structures andmechanisms of action. Biochim Biophys Acta 1758: 1184–1202.
Cohen, E. (1987) Chitin biochemistry: synthesis andinhibition. Annu Rev Entomol 32: 71–92.
Damude, H.G., Zhang, H., Farrall, L., Ripp, K.G., Tomb, J.F.,Hollerbach, D., and Yadav, N.S. (2006) Identification ofbifunctional delta12/omega3 fatty acid desaturases forimproving the ratio of omega3 to omega6 fatty acids inmicrobes and plants. Proc Natl Acad Sci USA 103: 9446–9451.
Davis, R.H. (2000) Neurospora: Contributions of a ModelOrganism. Oxford: Oxford University Press.
Dodane, V., and Vilivalam, V.D. (1998) Pharmaceutical appli-cations of chitosan. Pharm Sci Technolo Today 1: 246–253.
El Ghaouth, A., and Arul, J. (1992) Antifungal activity ofchitosan on post-harvest pathogens: induction of morpho-
logical and cytological alterations in Rhizopus stolonifer.Mycol Res 96: 769–772.
Ferket, K.K., Levery, S.B., Park, C., Cammue, B.P., and The-vissen, K. (2003) Isolation and characterization of Neuro-spora crassa mutants resistant to antifungal plantdefensins. Fungal Genet Biol 40: 176–185.
Folch, J., Lees, M., and Sanley, G.A. (1957) A simple methodfor the isolation and purification of total lipids from animaltissues. J Biol Chem 226: 497–509.
Hadwiger, L.A., Loschke, D.C., and Teasdale, J.R. (1977) Anevaluation of pea histones and disease resistance factors.Phytopathology 67: 755–758.
Helander, I.M., Nurmiaho-Lassila, E.L., Ahvenainen, R.,Rhoades, J., and Roller, S. (2001) Chitosan disrupts thebarrier properties of the outer membrane of gram-negativebacteria. Int J Food Microbiol 71: 235–244.
Hickey, P.C., Swift, S.R., Roca, M.G., and Read, N.D.(2005) Live-cell imaging of filamentous fungi usingvital fluorescent dyes and confocal microscopy. In:Methods in Microbiology, Vol. 35, Microbial Imaging.Savidge, T., and Pothoulakis, C. (eds). London: Elsevier,pp. 63–87.
Jean-Francois, F., Castano, S., Desbat, B., Odaert, B., Roux,M., Metz-Boutigue, M.H., and Dufourc, E.J. (2008) Aggre-gation of cateslytin beta-sheets on negatively chargedlipids promotes rigid membrane domains. A new mode ofaction for antimicrobial peptides? Biochemistry 47: 6394–6402.
Kumar, M.N.V.R. (2000) A review of chitin and chitosanapplications. React Funct Polym 46: 1–27.
Laflamme, P., Benhamou, N., Bussieres, G., and Des-sureault, M. (1999) Differential effect of chitosan on root rotfungal pathogens in forest nurseries. Can J Bot 77: 1460–1468.
Lakowicz, J. (1999) Principles of FluorescenceSpectroscopy. New York: Kluwer-Plenum Press.
Lentz, B.R. (1993) Use of fluorescent probes to monitormolecular order and motions within liposome bilayers.Chem Phys Lipids 64: 99–116.
Liu, H., Du, Y.M., Wang, X.H., and Sun, L.P. (2004) Chitosankills bacteria through cell membrane damage. Int J FoodMicrobiol 95: 147–155.
Lopez-Llorca, L.V., and Duncan, G.H. (1988) A study offungal endoparasitism of the cereal cyst nematode Het-erodera avenae by scanning electron microscopy. Can JMicrobiol 34: 613–619.
Mateo, C.R., Lillo, M.P., Gonzalez-Rodriguez, J., and Acuna,A.U. (1991) Molecular order and fluidity of the plasmamembrane of human platelets from time-resolved fluores-cence depolarization. Eur Biophys J 20: 41–52.
Mayer, L.D., Hope, M.J., and Cullis, P.R. (1986) Vesicles ofvariable sizes produced by a rapid extrusion procedure.Biochim Biophys Acta 858: 161–168.
Moilanen, T., and Nikkari, T. (1981) The effect of storage onthe fatty acid composition of human serum. Clin Chim Acta114: 111–116.
Nahar, P., Ghormade, V., and Deshpande, M.V. (2004) Theextracellular constitutive production of chitin deacetylase inMetarhizium anisopliae: possible edge to entomopatho-genic fungi in the biological control of insect pests.J Invertebr Pathol 85: 80–88.
Membrane fluidity determines chitosan sensitivity 1031
© 2010 Blackwell Publishing Ltd, Molecular Microbiology, 75, 1021–1032
Palma-Guerrero, J., Jansson, H.-B., Salinas, J., and Lopez-Llorca, L.V. (2008) Effect of chitosan on hyphal growth andspore germination of plant pathogenic and biocontrol fungi.J Appl Microbiol 104: 541–553.
Palma-Guerrero, J., Huang, I.C., Jansson, H.-B., Salinas, J.,Lopez-Llorca, L.V., and Read, N.D. (2009) Chitosan per-meabilizes the plasma membrane and kills cells of Neuro-spora crassa in an energy dependent manner. FungalGenet Biol 46: 585–594.
Parks, L.W., and Casey, W.M. (1995) Physiological implica-tions of sterol biosynthesis in yeast. Annu Rev Microbiol49: 95–116.
Patton, J.L., and Lester, R.L. (1991) The phosphoinositolsphingolipids of Saccharomyces cerevisiae are highly local-ized in the plasma membrane. J Bacteriol 173: 3101–3108.
Perez-Berna, A.J., Moreno, M.R., Guillen, J., Bernabeu, A.,and Villalain, J. (2006) The membrane-active regions of thehepatitis C virus E1 and E2 envelope glycoproteins. Bio-chemistry 45: 3755–3768.
Rabea, E.I., Badawy, M.E., Stevens, C.V., Smagghe, G., andSteurbaut, W. (2003) Chitosan as antimicrobial agent:applications and mode of action. Biomacromolecules 4:1457–1465.
Roca, M.G., Arlt, J., Jeffree, C.E., and Read, N.D. (2005) Cellbiology of conidial anastomosis tubes in Neurosporacrassa. Eukaryot Cell 4: 911–919.
Ruess, L., Häggblom, M.M., García Zapata, E.J., andDighton, J. (2002) Fatty acids of fungi and nematodes –possible biomarkers in the soil food chain. Soil BiolBiochem 34: 745–756.
Selitrennikoff, C.P. (2001) Antifungal proteins. Appl EnvironMicrobiol 67: 2883–2894.
Stoffel, W., Chu, F., and Ahrens, E.H.J. (1959) Analysis oflong-chain fatty acids by gas-liquid chromatography.Micromethod for preparation of methyl esters. Anal Chem31: 307–308.
Stössel, P., and Leuba, J.L. (1984) Effect of chitosan, chitinand some aminosugars on growth of various soilbornephytopathogenic fungi. J Phytopathol 111: 82–90.
Tamura, K., Dudley, J., Nei, M., and Kumar, S. (2007)MEGA4: Molecular Evolutionary Genetics Analysis(MEGA) software version 4.0. Mol Biol Evol 24: 1596–1599.
Thompson, P.A., Guo, M., Harrison, P.J., and Whyte, J.N.C.(1992) Effects of variation in temperature on the fatty acidcomposition of eight species of marine phytoplankton.J Phycol 28: 488–496.
Toledo, M.S., Levery, S.B., Straus, A.H., Suzuki, E., Momany,M., Glushka, J., et al. (1999) Characterization of sphin-golipids from mycopathogens: factors correlating withexpression of 2-hydroxy fatty acyl (E)-Delta 3-unsaturationin cerebrosides of Paracoccidioides brasiliensis andAspergillus fumigatus. Biochemistry 38: 7294–7306.
Trotel-Aziz, P., Couderchet, M., Vernet, G., and Aziz, A.(2006) Chitosan stimulates defense reactions in grapevineleaves and inhibits development of Botrytis cinerea. Eur JPlant Pathol 114: 405–413.
Van Leeuwen, M.R., Smant, W., de Boer, W., and Dijkster-huis, J. (2008) Filipin is a reliable in situ marker of ergos-terol in the plasma membrane of germinating conidia(spores) of Penicillium discolor and stains intensively at thesite of germ tube formation. J Microbiol Methods 74:64–73.
Vokt, J.P., and Brody, S. (1985) The kinetics of changes in thefatty acid composition of Neurospora crassa lipids after atemperature increase. Biochim Biophys Acta 835: 176–182.
Wharton, D.A. (1980) Nematode egg-shells. Parasitology 81:447–463.
Zakrzewska, A., Boorsma, A., Brul, S., Hellingwerf, K.J., andKlis, F.M. (2005) Transcriptional response of Saccharomy-ces cerevisiae to the plasma membrane-perturbing com-pound chitosan. Eukaryot Cell 4: 703–715.
Zakrzewska, A., Boorsma, A., Delneri, D., Brul, S., Oliver,S.G., and Klis, F.M. (2007) Cellular processes and path-ways that protect Sacharomyces cerevisiae against theplasma membrane-perturbing compound chitosan.Eukaryot Cell 6: 600–608.
1032 J. Palma-Guerrero et al. �
© 2010 Blackwell Publishing Ltd, Molecular Microbiology, 75, 1021–1032