effect of free fatty acids on erythrocyte morphology and membrane fluidity
TRANSCRIPT
Vol. 42, No. 1, June 1997 BIOCHEMISTRY and MOLECULAR BIOLOGY INTERNATIONAL Pages 123-133
EFFECT OF FREE FATTY ACIDS ON ERYTHROCYTE MORPHOLOGY AND MEMBRANE FLUIDITY
tlya B. Zavodnik*, Andrzej Zahorowski, Andrzej Niekurzak, Maria Bryszewska
Institute of Biophysics, University of Lodz, 12/16 Banacha St., 90-237 Lodz, Poland, *Institute of Biochemistry, Academy of Sciences of Belarus, BLK - 50, 230017, Grodno, Belarus
Received February 10, 1997 Received after revision February 27. 1997
Summary: Changes in red blood cell shape and membrane properties in response to the interaction with free fatty acids and their derivatives were studied by light scattering at small and large angles, light microscopy and fluorescence anisotropy. The influence of these agents depended on the end groups and increased with increasing chain length. The fatty acids exerted a biphasic effect on the cell size, shape and surface properties, and induced erythrocyte aggregation. After transient size alteration with a reduction in diameter, caused by low free fatty acid concentrations (up to 5-10 gM in the case of palmitic acid), fatty acids increased the erythrocyte diameter at higher concentrations (20-60 gM in the case of palmitic acid). The aliphatic aldehydes and methyl esters of fatty acids significantly decreased the cell diameter at the concentrations used. Changes in erythrocyte shape and size were accompanied by changes in membrane microviscosity. Palmitic acid decreased the rotational diffusion of the fluorescence probe incorporated into the membrane whereas methyl ester of palmitic acid and lauric aldehyde increased probe mobility. Also the erythrocyte modification by malondialdehyde influenced cell morphology and highly decreased membrane fluidity.
Key Words: red blood cells; morphology; membrane; free fatty acids.
Introduction
Interactions of the free fatty acids (FFA), their derivatives and various other amphiphilic
molecules with red blood cells have been studied in many laboratories. Since the early papers of
Seeman et al. [1] it has been known that agents with an amphiphilic character interact with the
erythrocyte membrane in a biphasic way. They protect erythrocytes against hypotonic haemolysis
and induce lysis of the cells in isotonic medium [1-4]. At the same time, the mechanism (or
mechanisms) underlying the haemolytic and antihaemolytic effects of FFA and their derivatives as
well as the common mechanisms of cell changes due to the interactions with FFA are not fully
understood.
For correspondence: Dr. Maria Bryszewska, University Biophysics, 12/16 Banacha St., 90-237 Lodz, Poland tel. +48 42 35 44 81, e-mail <[email protected]>
123
of Lodz, Department of Medical
10.39-9712/97/010123- I I $05.00/0 (-;ol~yl'ighl ~2~ 1997 hy Academic Pivss Australia
All rights <!/repiod.<'fioJz in any f inm resel l'ed
Vol. 42, No. 1, 1997 BIOCHEMISTRY and MOLECULAR BIOLOGY INTERNATIONAL
A membrane/aqueous phase partition is the mechanism whereby the amphiphile monomers
intercalate into the membrane [2]. At antihaemolytic concentrations amphiphiles increase potassium
permeability of the erythrocyte membrane [2] and induce a release of exo- and endovesicles as a
result of detachment of the cytoskeleton network from the membrane [3-5]. Palmitic, oleic and
linoleic acids can be incorporated into the membrane at concentrations up to 1000 nmol of FFA / ml
packed cells without causing any significant haemolysis and without any significant changes in the
activity of the sodium pump of human erythrocyte membranes [6].
The marked shape changes of the erythrocytes in the presence of amphiphiles precede
vcsiculation [3,5]. Loading of erythrocytes with phosphatidylcholine, lysophosphatidylcholine or
stearic acid induces an appreciable crenation of the red blood cells and causes inhibition of glucose
transport across the membrane. This effect of the loaded lipids on glucose transport may not have a
direct connection with the change of the cell shape [7]. At the same time, the antihaemolytic
potency of the amphiphiles is not related to the type and extent of shape changes induced by these
agents [3].
The aim of this work was to study the changes of the red blood cell shape, size and refractive
properties in the presence of FFA and their derivatives, using the methods of flow cytometry and
fluorescence anisotropy. The effect of long chain effectors was compared with the effect of
malondialdehyde (MDA), the highly toxic and stable end - product of lipid peroxidation, which
induces nonenzymic modification of the proteins and membrane constituents [8].
Materials and methods Chemicals of analytical grade were obtained from POCH (Gliwice, Poland), Molecular
Probes, Eugene, Oregon, USA (1-[4-trimethylammoniumphenyl]-6-phenylhexa-l,3,5-triene, TMA- DPH), Reachim, Russia (fatty acids and their methyl esters ), Ferak, Berlin (lauric aldehyde). Malondialdehyde was obtained [8] by acid hydrolysis of 1,1,3,3-tetramethoxypropane (Aldrich, Germany).
Blood samples from healthy individuals were obtained from the Central Blood Bank of Lodz. Erythrocytes were washed three times with sodium phosphate-buffered saline (PBS: 0.15 M NaC1, 1.9 mM NaH2PQ, 8.1 mM Na2HPQ, pH 7.4) and suspended in PBS. Fatty acids and their derivatives were added to red blood cell suspensions as concentrated ethanolic solutions. The final ethanol concentration did not exceed 1%. The erythrocytes were modified by MDA by incubation of cell suspensions (haematocrit of 1% ) in PBS with various concentrations of MDA at 37 ~ for 1 hour. The suspensions were then diluted with cold PBS up to haematocrit of 0.05%.
Flow cytometry. The analytical technique of flow cytometry has become essential for studies of cells by means of light scattering and fluorescence spectrophotometry. Detection of scattered light yields information about cell size and shape. When a cell passes through the excitation beam in a flow cytometer, it scatters light in all directions. The light is typically detected
124
Vol. 42, No. ]., ] 997 BIOCHE.MISTRYond MOLECULAR BIOLOGY IN'I'ERNA1]ONAL
in the forward direction and at right angles to the incident beam. The scattered irradiance near the forward direction depends on cell size and is approximately independent of cell refractive index and shape [9]. The scattered irradiance at larger angles is more sensitive to internal structural differences, refractive index differences and cell shape.
In order to evaluate the size and shape changes of a red blood cell as affected by free fatty acids and their derivatives, we used a Scatron Argus (Norway) arc lamp-based compact flow cytometer with simultaneous separate detection of low angle (LS1) and right angle (LS2) light scattering. Erythrocyte suspensions at a haematocrit of 0.05% were incubated with fatty acids or their derivatives for 15 min and light scattering diagrams of samples were registered.
Membrane fluidity. The suspensions of erythrocytes (haematocrit of 0.05%) were labelled with the fluorescent probe TMA-DPH by incubating at room temperature for 5 min. The final concentration of the fluorescent label was 1 ~tM. The steady-state fluorescence anisotropy of the label was determined in a Perkin-Elmer LS-5B spectrofluorimeter. Polarizers select the vertical and horizontal components of both the excitation (356 nm) and the emission (428 nm) beams, The anisotropy was calculated according to:
r = (Ivy - Ivu x G)/(Ivv + Ivnx G) where Ivv and Ivn are the components of emitted light intensity, parallel and perpendicular respectively, with reference to the direction of polarization of the excitation light, and G is the correction factor (G = I.v/Irm ) used to correct for unequal transmission in the optics.
Light microscopy. Erythrocyte suspensions in PBS (10% haematocrit) at time zero and after 15 rain of incubation with FFA were fixed and dyed on glass surfaces by the method of May-Grunwald and Giemsa [11]. Then cell samples were viewed under Olympus (Japan) phase contrast microscope using a magnification of 500x.
Statistics. The results are expressed as mean + SD; statistical significance of the differences was evaluated using Student's t-test.
Results
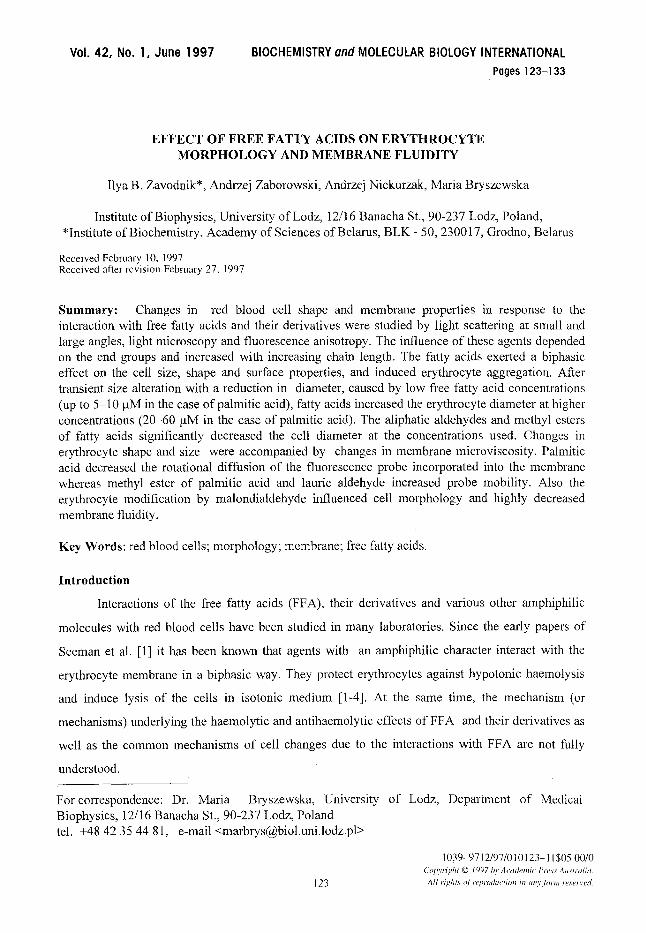
Flow eytometry. Typical scatter histograms for a control sample are shown in Figure 1. LS1
is the distribution of light scattered- in the forward direction; LS2 is the distribution at a right angle;
and LS 1/LS2 is a dual parameter contour plot. LS 1 depends on cell size, whereas LS2 is sensitive to
cell shape and internal structural differences. For each histogram, the data within the region defined
by the cursors were continously scanned for computation of the number of events registered and
percentage relative to total (w/t). Peak (P) channel position was also displayed. Cursors were set in
fixed positions in scatter histograms for a control (untreated erythrocytes) sample to identify the
possible appearance of various subpopulations of red blood cells as influenced by FFA and their
derivatives. Figs. 2, 3 and 4 summarize the results obtained.
The biphasic effect of FFA on the erythrocyte shape and morphological properties can be
seen. At low concentrations ofpalmitic acid (up to 5-10 ~M) the position of the peak of the LS1 and
LS2 histograms moves to the left relative to the control cells (more so in the LS1 histogram)
(Fig. 2). At higher palmitate concentrations the peak moves to the right. The percentage of ceils
125
Vol. 42, No. 1, 1997 BIOCHEMISTRYond MOLECULAR BIOLOGY INTERNATIONAL
E
- I
2O
Q
I ' 'LS1 --
76 channe~
c"
ID r - e
c-
2O
d g
LS1 LS1
76 channel 76 channel
I -I 'tlJ
20
G G 0 c- O
. o
E c
o
\ i
87
b e h
, ' s 2 - - ' LS2 -
channe[
o
2 -fl
J o
87 channel. 3 87 channel
c- c 0 t - O
@
N o
LSI
0
c [
LS2 LS2
Ls1 f 0 kS2 0
.. i
Fig. 1. Typical scattering histograms from control erythrocytes (a-c), erythrocytes in the presence of 50 txM palmitic acid (d-f) and of 200 I_tM palmitic acid (g-i). a, d, g - Low-angle light scattering (LS1); b, i, h - right-angle light scattering (LS2); c, f , i - LS1/LS2 dual parameter contour plots (planar view).
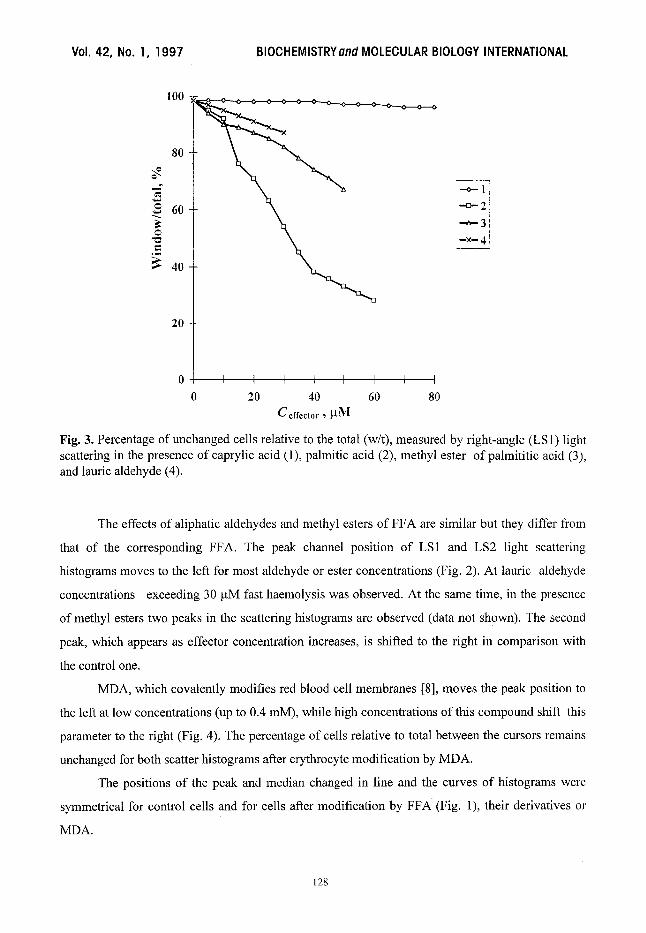
relative to total (w/t) between the cursors (the percentage of cells within fixed boundaries)
decreases dramatically from 98.5% to 28% for 60 ~tM of palmitic acid (Fig. 3). The effect of FFA
on the w/t parameter is higher for right angle light scattering (LS2) than for forward scatter (LS 1).
At high concentrations of FFA (200 ~tM for palmitic acid) cell haemolysis and ghost formation can
be observed (Fig. 1). The effect of FFA increases concurrently with the increase of the length of
effector acyl chain. Caprylic acid has an effect on light scattering parameters of red blood cells only
at very high concentrations (400 ~tM, results not shown).
126
Vol. 42, No. 1, 1997 BIOCHEMISTRY and MOLECULAR BIOLOGY INTERNATIONAL
70
60
5O
40
30
2O
10
L [ I I t I [ I -
2 0 40 60 80
C effector, I~M
--c-2 -a--3
60
50
= 40
~ 30
~ 20
10
[-'~- 11 !-o-21
i--*--3 i-:x,41
0 I [ I I [ [ I t 0 20 40 60 80
Ceffector , ~,~/~
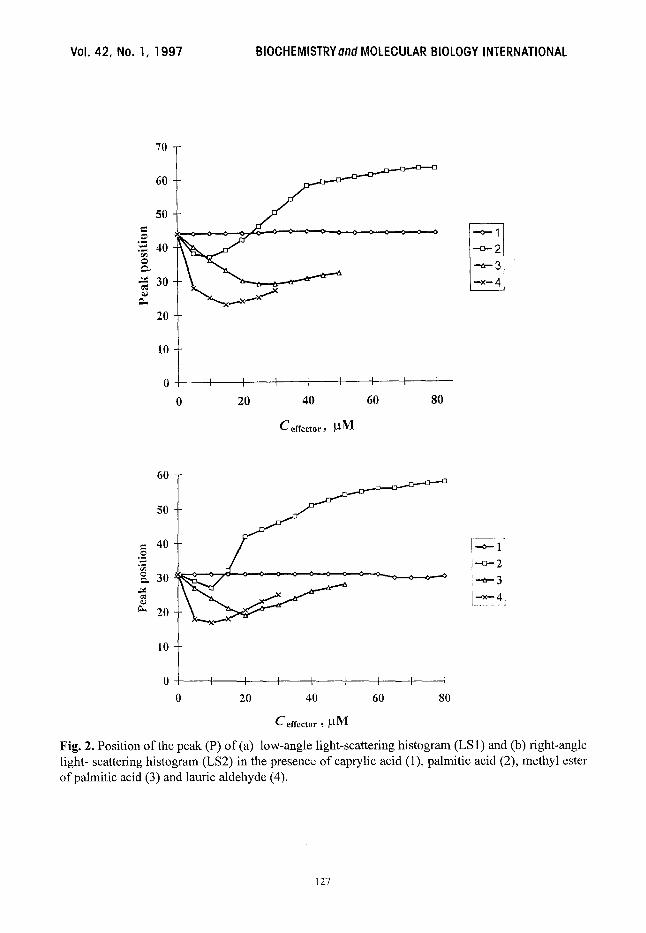
Fig. 2. Position of the peak (P) of (a) low-angle light-scattering histogram (LS l) and (b) right-angle light- scattering histogram (LS2) in the presence of caprylic acid (1), palmitic acid (2), methyl ester of palmitic acid (3) and laurie aldehyde (4).
127
Vol. 42, No. 1, 1997 BIOCHEMISTRY and MOLECULAR BIOLOGY INTERNATIONAL
100
80
60
. m
40
20
i ---o-- 1 ,
i--o-2! , i
!-•
0 I 1 I L I 1 [ I
0 20 40 60 80 Cefrector, gM
Fig. 3. Percentage of unchanged cells relative to the total (w/t), measured by right-angle (LS1) light scattering in the presence of caprylic acid (1), palmitic acid (2), methyl ester of palmititic acid (3), and laurie aldehyde (4).
The effects of aliphatic aldehydes and methyl esters of FFA are similar but they differ from
that of the corresponding FFA. The peak channel position of LS1 and LS2 light scattering
histograms moves to the left for most aldehyde or ester concentrations (Fig. 2). At lauric aldehyde
concentrations exceeding 30 ~M fast haemolysis was observed. At the same time, in the presence
of methyl esters two peaks in the scattering histograms are observed (data not shown). The second
peak, which appears as effector concentration increases, is shifted to the right in comparison with
the control one.
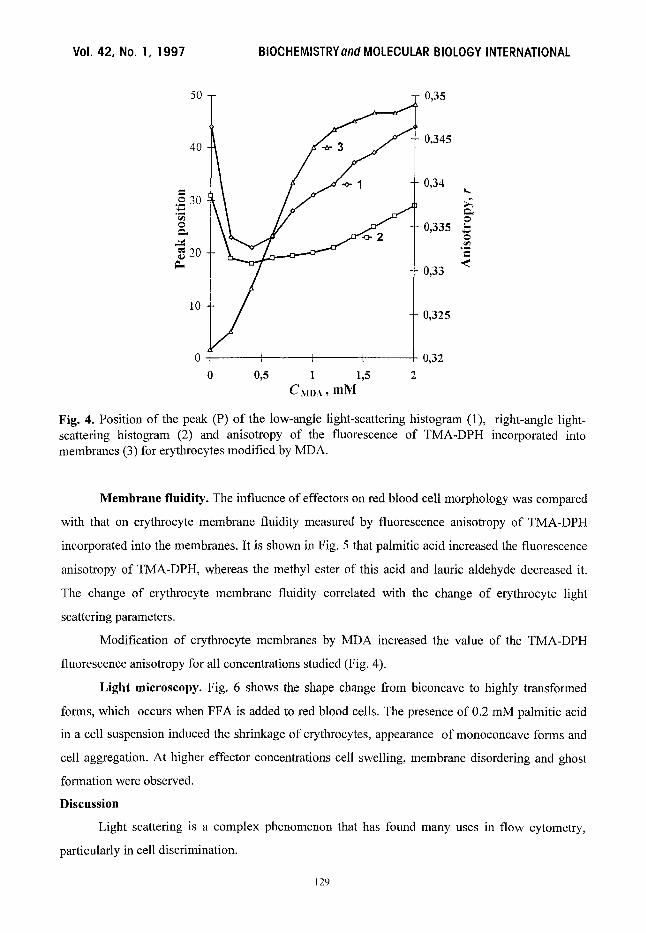
MDA, which covalently modifies red blood cell membranes [8], moves the peak position to
the left at low concentrations (up to 0.4 mM), while high concentrations of this compound shift this
parameter to the right (Fig. 4). The percentage of cells relative to total between the cursors remains
unchanged for both scatter histograms after erythrocyte modification by MDA.
The positions of the peak and median changed in line and the curves of histograms were
symmetrical for control cells and for cells after modification by FFA (Fig. 1), their derivatives or
MDA.
128
Vol. 42, No. 1, 1997 BIOCHEMISTRYand MOLECULAR BIOLOGY INTERNATIONAL 501 0 3 40 0,345
o t/ ~30
20
l 0L/ 0 ~ 0,32
0 0,5 1 1,5 2 CMDA, mM
Fig. 4. Position of the peak (P) of the low-angle light-scattering histogram (1), right-angle light- scattering histogram (2) and anisotropy of the fluorescence of TMA-DPH incorporated into membranes (3) for erythrocytes modified by MDA.
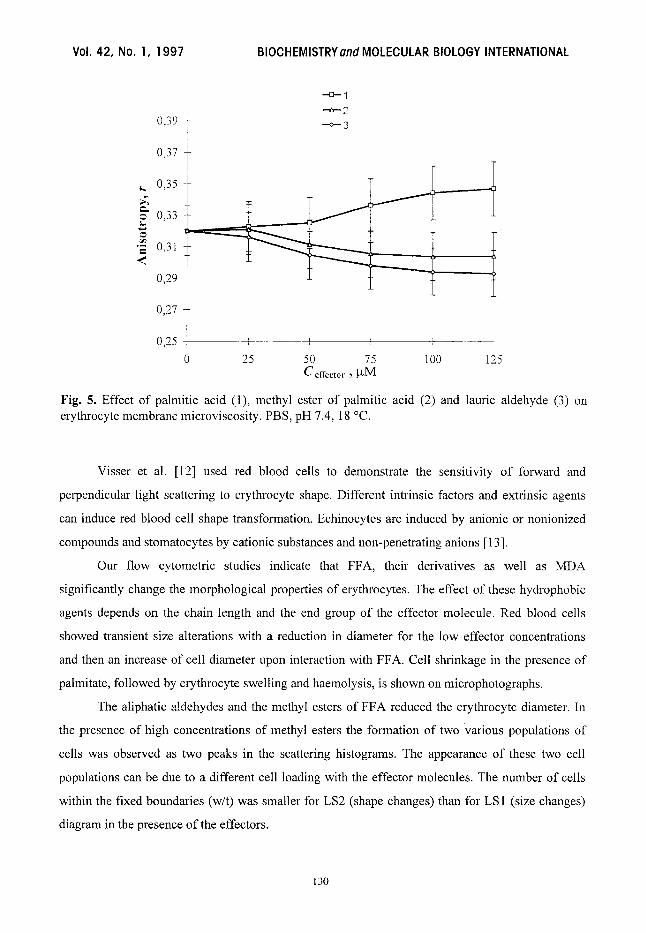
Membrane fluidity. The influence of effectors on red blood cell morphology was compared
with that on erythrocyte membrane fluidity measured by fluorescence anisotropy of TMA-DPH
incorporated into the membranes. It is shown in Fig. 5 that palmitic acid increased the fluorescence
anisotropy of TMA-DPH, whereas the methyl ester of this acid and lauric aldehyde decreased it.
The change of erythrocyte membrane fluidity correlated with the change of erythrocyte light
scattering parameters.
Modification of erythrocyte membranes by MDA increased the value of the TMA-DPH
fluorescence anisotropy for all concentrations studied (Fig. 4).
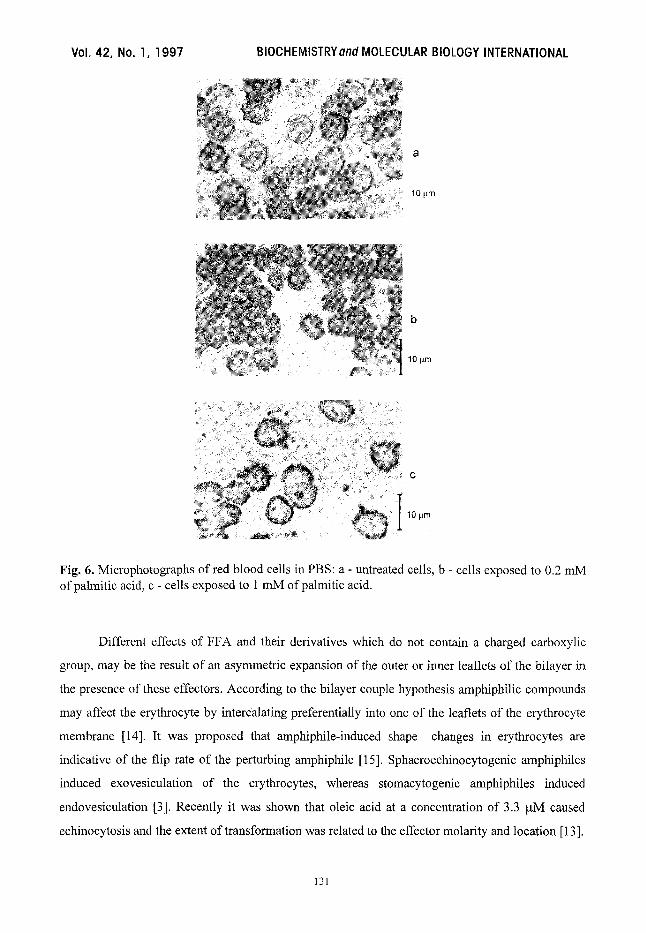
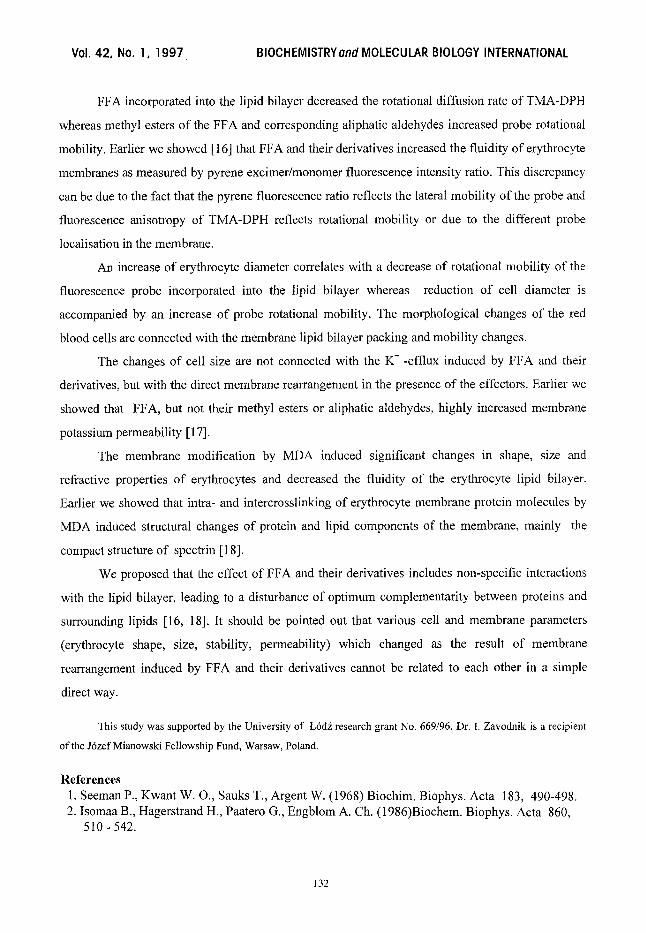
Light microscopy. Fig. 6 shows the shape change from biconcave to highly transformed
forms, which occurs when FFA is added to red blood cells. The presence of 0.2 mM palmitic acid
in a cell suspension induced the shrinkage of erythrocytes, appearance of monoconcave forms and
cell aggregation. At higher effector concentrations cell swelling, membrane disordering and ghost
formation were observed.
Discussion
Light scattering is a complex phenomenon that has found many uses in flow cytometry,
particularly in cell discrimination.
129
Vol. 42, No. 1, 1997 BIOCHEMISTRYond MOLECULAR BIOLOGY INTERNATIONAL
�9 ..o- 1
0,39 i - o -3 i i
0,37 +
i ~., 0,35-~
~ 0,33
�9 r. 0,31
0,29 I
i 0,27 +
0,251 ~ ! ~
0 25 50 75 100 Ceffector ~ ~M
125
Fig. 5. Effect of palmitic acid (1), methyl ester of pahnitic acid (2) and lauric aldehyde (3) on erythrocyte membrane microviscosity. PBS, pH 7.4, 18 ~
Visser et al. [12] used red blood cells to demonstrate the sensitivity of forward and
perpendicular light scattering to erythrocyte shape. Different intrinsic factors and extrinsic agents
can induce red blood cell shape transformation. Echinocytes are induced by anionic or nonionized
compounds and stomatocytes by cationic substances and non-penetrating anions [13].
Our flow cytometric studies indicate that FFA, their derivatives as well as MDA
significantly change the morphological properties of erythrocytes. The effect of these hydrophobic
agents depends on the chain length and the end group of the effector molecule. Red blood cells
showed transient size alterations with a reduction in diameter for the low effector concentrations
and then an increase of cell diameter upon interaction with FFA. Cell shrinkage in the presence of
palmitate, followed by erythrocyte swelling and haemolysis, is shown on microphotographs.
The aliphatic aldehydes and the methyl esters of FFA reduced the erythrocyte diameter. In
the presence of high concentrations of methyl esters the formation of two various populations of
cells was observed as two peaks in the scattering histograms. The appearance of these two cell
populations can be due to a different cell loading with the effector molecules. The number of cells
within the fixed boundaries (w/t) was smaller for LS2 (shape changes) than for LS 1 (size changes)
diagram in the presence of the effectors.
1 3 0
Vol. 42, No. 1, 1997 BIOCHEMISTRY and MOLECULAR BIOLOGY INTERNATIONAL
10 gm
10 gm
C
10 u,m
Fig. 6. Microphotographs of red blood cells in PBS: a - untreated cells, b - cells exposed to 0.2 mM of palmitic acid, c - cells exposed to 1 mM of palmitic acid.
Different effects of FFA and their derivatives which do not contain a charged carboxylic
group, may be the result of an asymmetric expansion of the outer or inner leaflets of the bilayer in
the presence of these effectors. According to the bilayer couple hypothesis amphiphilic compounds
may affect the erythrocyte by intercalating preferentially into one of the leaflets of the erythrocyte
membrane [14]. It was proposed that amphiphile-induced shape changes in erythrocytes are
indicative of the flip rate of the perturbing amphiphile [15]. Sphaeroechinocytogenic amphiphiles
induced exovesiculation of the erythrocytes, whereas stomacytogenic amphiphiles induced
endovesiculation [3]. Recently it was shown that oleic acid at a concentration of 3.3 ~tM caused
echinocytosis and the extent of transformation was related to the effector molarity and location [13].
131
Vol. 42, No. 1, 1997 BIOCHEMISTRY and MOLECULAR BIOLOGY INTERNATIONAL
FFA incorporated into the lipid bilayer decreased the rotational diffusion rate of TMA-DPH
whereas methyl esters of the FFA and corresponding aliphatic aldehydes increased probe rotational
mobility. Earlier we showed [ 16] that FFA and their derivatives increased the fluidity of erythrocyte
membranes as measured by pyrene excimer/monomer fluorescence intensity ratio. This discrepancy
can be due to the fact that the pyrene fluorescence ratio reflects the lateral mobility of the probe and
fluorescence anisotropy of TMA-DPH reflects rotational mobility or due to the different probe
localisation in the membrane.
An increase of erythrocyte diameter correlates with a decrease of rotational mobility of the
fluorescence probe incorporated into the lipid bilayer whereas reduction of cell diameter is
accompanied by an increase of probe rotational mobility. The morphological changes of the red
blood cells are connected with the membrane lipid bilayer packing and mobility changes.
The changes of cell size are not connected with the K + -efflux induced by FFA and their
derivatives, but with the direct membrane rearrangement in the presence of the effectors. Earlier we
showed that FFA, but not their methyl esters or aliphatic aldehydes, highly increased membrane
potassium permeability [ 17].
The membrane modification by MDA induced significant changes in shape, size and
refractive properties of erythrocytes and decreased the fluidity of the erythrocyte lipid bilayer.
Earlier we showed that intra- and intercrosslinking of erythrocyte membrane protein molecules by
MDA induced structural changes of protein and lipid components of the membrane, mainly the
compact structure of spectrin [18].
We proposed that the effect of FFA and their derivatives includes non-specific interactions
with the lipid bilayer, leading to a disturbance of optimum complementarity between proteins and
surrounding lipids [16, 18]. It should be pointed out that various cell and membrane parameters
(erythrocyte shape, size, stability, permeability) which changed as the result of membrane
rearrangement induced by FFA and their derivatives cannot be related to each other in a simple
direct way.
This study was supported by the University of Ldd~ research grant No. 669/96. Dr. 1. Zavodnik is a recipient
of the J6zef Mianowski Fellowship Fund, Warsaw, Poland.
References 1. Seeman P., Kwant W. O., Sauks T., Argent W. (1968) Biochim. Bi0phys. Acta 183, 490-498. 2. Isomaa B., Hagerstrand H., Paatero G., Engblom A. Ch. (1986)Biochem. Biophys. Acta 860,
510 - 542.
132

Vol. 42, No. 1, 1997 BIOCHEMISTRY and MOLECULAR BIOLOGY INTERNATIONAL
3. Hagerstrand H., Isomaa B. (1991) Chem. - Biol. Interact. 79, 335 - 347. 4. Lovstad R. A. (1986) Int. J. Biochem. 18, N9, 771-775. 5. Hagerstrand H., Isomaa B. (1994) Biochem. Biophys. Acta 1190, 409-415. 6. Dwight J. F. St., Mendes Ribeiro A. S., Hendry B. M. (1992) Clin. Sci. 82, 99 - 104. 7. Fujii T., Tamura A., Fujii H., Miwa I., Okuda J. (1986) Biochem. Int. 12, N6, 873 - 875. 8. Esterbauer H., Schaur R. T., Zollner H. (1991) Free Rad. Biol. Med. 11, 81 - 128. 9. Salzman G. S., Singham S. B., Johnston R. G., Bohren C. F. (1990) In : ,,Flow Cytometry and
Sorting". Wiley - Liss, Inc., 81 - 107. 10. Van Blitterswijk W. J., Van Hoewen R. P., Van Der Meet B. W. (1981) Biochim. Biophys. Acta
664, 323 - 332. 11. Baginski S. (1965) "Methods of microscopy". PWN, Warsaw, 236 - 237. 12. Visser J. W. M., van den Engh G. J., van Bekkum D. W. (1980) Blood Cells 6, 391 - 407. 13. Sprandel U., Kirscher T. (1994) Adv. Biosci. 92, 1 - 6,. 14. Sheetz M. P., Singer S. (1974) J. Proc. Natl. Acad. Sci. USA 71, 4457 - 4461. 15. Hagerstrand H., Bobrowska-Hagerstrand M., Isomaa B. (1996)Cell. Mol. Biol. Letters 1, 3 - 14. 16. Lapshina E. A., Zavodnik I. B., Bryszewska M. (1995) Scand. J. Clin. Lab. Invest. 55, 391 -
397. 17. Zavodnik I. B., Lapshina E. A., Palecz D., Bryszewska M. (1996) Scan& J. Clin. Lab. Invest.
56, 401 - 407. 18. Zavodnik I., Lapshina E., Bryszewska M. (1994) Curt. Topics Biophys. 18(2), 168 - 171.
133