what determines banks' market power
TRANSCRIPT
What Determines Banks’ MarketPower?
Akerlof versus Herfindahl
Moshe KimUniversity of Haifa
Eirik Gaard KristiansenNorwegian School of Economics and Business Administration
Bent Vale∗
Norges Bank (The central bank of Norway)
April 14, 2005
Abstract
We introduce a model analyzing how asymmetric information problemsin a bank-loan market may evolve over the age of a borrowing firm. Themodel predicts a life-cycle pattern for banks’ interest rate markup. Youngfirms pay a low or negative markup, thereafter the markup increases untilit falls for old firms. Furthermore, the pattern of the life-cycle depends onthe informational advantage of the inside bank and when bank competitionyields more dispersed borrower information. By applying a new measureof the informational advantage of inside banks and a large sample of smallNorwegian firms, we find support for the predicted markup pattern. Wedisentangle effects of asymmetric information from effects of a concentratedbank market. Our results give some support for the hypothesis that banksmake more valuable relationship-loans in a less concentrated bank market.
JEL code: G21, L15Keywords: Banking, risk-pricing, lock-in
∗ Correpsonding author address: Norges Bank, C51, Box 1179, Sentrum, N-0107 Oslo Norway.Fax: +47 22 42 40 62, e-mail: [email protected]

1. Introduction
We analyze how competition and asymmetric information problems are interlinked in
credit markets. During the course of a lending relationship a bank obtains privileged
information about borrowers. The privileged information is a two-edged sword seen
from borrowers’ point of view. Privileged information reduces frictions in credit
markets, but creates lock-in effects and market power for the inside bank, i.e., the
bank with which the firm has a relationship.
The major contribution of this paper is in offering a dynamic structure which
generates a life cycle of bank- borrower relationships. This structure, by endogeniz-
ing the timing when outside banks start monitoring, generates a life cycle pattern
of asymmetric information, lock-in, and interest rate markups throughout the age
of the borrowing firms.
We propose a simple model which endogenizes the number of monitoring banks
and thereby the time span and the strength of lock-in effects. The model shows how
the life-cycle of the lock-in effect depends on the inside banks’ information advantage
and monitoring costs. There exists theoretical literature analyzing how banks’ in-
formation advantage may yield lock-in or hold-up problems for firms (Sharpe (1990)
and Rajan (1992)). In contrast to the existing theoretical literature1, we develop a
model not only explaining why informational lock-in effects exist, but also how and
when it is resolved. Our theoretical model is closely related to other models also
explaining how firms can mitigate hold-up problems or lock-in effects by establish-
ing several bank relationships (Detragiache, Garella, and Guiso (2000)).2 However,
these models focus on situations where firms decide, in the first period, on the num-
ber of bank relationships. In contrast, our setup makes multiple monitoring of young
firms unprofitable. We argue that fixed monitoring costs cannot initially be covered
by more than one bank. Other researchers have argued that multiple monitoring is
infeasible due to free-riding problems (Thakor (1996)).3 We show that as firms ma-
1See Gorton and Winton (2003) for a review.2Ongena and Smith (2000) show in an empirical study, that multiple relationships reduce the
hold-up problem, but can worsen the availability of credit.3Carletti (2004) endogenizes banks’ monitoring intensities and shows how firms by choosing to
borrow from more than one bank can induce a preferred monitoring intensity. In contrast to ourmodel, Carletti does not introduce a dynamic model that allows the number of monitoring banksto change as the firms mature.
2
ture, more banks (or other monitors) find it profitable to monitor them and thereby
alleviate firms’ hold-up or lock-in problem. Existing literature allows firms to deter-
mine the number of banks from which they borrow. In contrast, we let improvement
in the pool of loan applicants as the firms mature and bank competition determine
when lock-in problems are resolved.
Our model starts by demonstrating the cyclical pattern of lock-in in bank credit
markets.4 As the lock-in effect becomes stronger the bank is able to extract rents
from the borrower by increasing the interest rate it charges above the risk-adjusted
interest rate, i.e., the one that gives the lender zero expected profits. However, as
the firm matures, specific soft information about the firm gets more dispersed. this
occurs when outside banks find it profitable to make credit assessments and offer
loans to the firm. Consequently the market power of the initial bank which has em-
anated from its informational advantage over outside banks decreases.5 Hence the
theoretical model predicts a cyclical pattern of the markup over the risk-adjusted
interest rate: The markup is low — or even negative — at the beginning, it reaches
a maximum after which it starts decreasing. This cyclical pattern of the interest
rate markup is affected by the time when outside banks start making credit as-
sessment and, consequently, resolve the informational advantage of the inside bank.
The model predicts that the interest rate markup for firms with severe asymmetric
information problems follows a more pronounced life cycle pattern, with larger de-
viations from the risk-adjusted interest rate than for firms with smaller asymmetric
information problems. Furthermore, our model predicts that the time span before
interest markup starts decreasing — the lock-in period — expands with the severeness
of the asymmetric information problem.
To empirically capture the severeness of asymmetric information problems in an
industry, we calculate the average volatility of firms’ creditworthiness in the partic-
ular industry. We assume that in industries where firms’ creditworthiness fluctuates
considerably over time, inside banks obtain important informational advantages
4See Rajan (1992), Sharpe (1990) and, von Thadden (2004) for discussion of informationallock-in effects.
5Also Hauswald and Marquez (2004) study rivaling banks’ incentives to conduct credit assess-ments in order to "poach" customers from competing banks. In contrast to us, they focus on howproduct differentiation in credit markets may affect investments in monitoring while we focus onthe life-cycle of bank-borrower relationships.
3
over outside banks. In these industries, information about firms’ creditworthiness
is quickly outdated and lenders must spend more resources on monitoring than in
industries where firms’ creditworthiness moves slowly. Since an inside bank often
gets access to credit information about borrowers before the rest of the market, in-
side banks have a larger informational advantage in industries with highly volatile
creditworthiness than in markets with less volatile creditworthiness. The strength of
this informational advantage determines the inside bank’s markup on interest rates.
By introducing empirical variables capturing the degree of asymmetric informa-
tion, we hope to control for potential effects from asymmetric information on banks’
pricing of loans. This enables us to also study the pure effects of increased market
concentration on pricing of loans. There is a growing literature arguing that com-
petition intensity also influences banks investments in borrower-bank relationships.
Boot and Thakor (2000), Elsas (2005), Dell’Ariccia and Marquez (2004), and De-
gryse and Ongena (2004) show that competition may have an important impact on
banks’ investments in industry expertise and relationship development. If fiercer
competition induces banks on average to provide more valuable services to their
borrowers, we might expect to see that equilibrium interest rates are higher in more
competitive markets. Boot and Thakor (2000) show in their theoretical model how
fierce bank competition may induce banks to substitute transactional lending with
relationship lending thereby insulating a larger share of their loan portfolio from
competition induced by rivalling banks. The average borrower may, due to this
substitution effect, increase his willingness to pay high interest rates. In the empiri-
cal part of the present study, we examine whether competition increases borrowers’
willingness to pay high interest rates.
We test the predictions from our theoretical model using panel data of small
Norwegian firms during the 2000-2001 period with a total of 60,362 observations.
We find empirical support for the cyclical pattern of interest rate markups over the
age of a firm as predicted by our model. In the empirical model we include the
suggested variable representing the severeness of asymmetric information between
a bank and a new borrowing firm, as described above. In accordance with the
theoretical model, results show that firms with more severe asymmetric information
problems face a more pronounced life cycle pattern in interest rate markups and
4

longer lock-in periods than firms with less severe asymmetric information problems.
We also find some support for the hypothesis that less concentrated credit markets
yield on average more valuable bank services and slightly higher interest rates than
is the case in more concentrated markets.
There are several papers that are closely related to ours. Petersen and Rajan
(1995) examine the impact of bank market power on the possibility to intertem-
porally share risks in long-term bank relationships. Their key insight is that bank
competition makes banks less inclined to engage in long-term relationships because
short-term losses seldom can be recouped later. In contrast to Petersen and Rajan
(1995) where market power is exogenous, we let the degree of asymmetric informa-
tion problems determine banks’ market power over firms’ life cycle. We show that
independently of market concentration in the bank-loan market, asymmetric infor-
mation problems in credit markets may allow banks to engage in long term surplus
sharing. Asymmetric information problems between inside and outside banks yield
an inside bank latitude to share surplus intertemporally.
The paper is organized as follow: In Section 2 we present a theoretical model
showing how the severity of asymmetric information affects borrower lock-in and
hence competition between banks and interest rate markups. The empirical model
which is facilitated to test both the predictions regarding markups and asymmetric
information from our theoretical model as well as the aforementioned potential re-
lationships between markups and market concentration, is presented along with the
data in Section 3. The empirical results are presented and discussed in Section 4.
Section 5 concludes.
2. Theory
In this section we introduce a theoretical model that shows how the lifecycle of the
interest rate markup depends on two types of asymmetric information problems.
Firstly, there is an asymmetric information problem between banks and borrowers
and, secondly, there is a potential asymmetric information problem between inside
and outside banks when they "bid" for a borrower with an established bank relation-
ship. The model endogenizes the number of monitoring banks in order to show how
5
firm information gets dispersed and lock-in effects weaken. The theoretical model
allows us to derive predictions about how the two types of asymmetric information
problems influence the length of the lock-in period and the timing and size of the
minimum and maximum interest rate markup charged by banks.
In what follows we outline the model in detail.
2.1. The borrowing firm
A firm is modelled as a sequence of projects all requiring investment of 1. For sim-
plicity, we assume that the firm does not have own funds and needs to borrow 1 from
a bank in each period t, t ≥ 1 (see Rajan (1992) for why asymmetric informationproblems may imply that only short-term loan contracts are used in equilibrium).
In our adverse-selection model, in each period the current project is either good or
bad independently of the quality of the previous project. The good project succeeds
with probability θ + β while the bad project succeeds with probability θ − β. A
successful project is worth R while a failure is worth 0. Apart from Proposition
4 which concerns credit availability, we assume that both good and bad projects
have positive NPV, i.e. (θ − β)R > 1. The probability of having a good project
in period t is common knowledge and denoted s(t). We assume that the average
quality of borrowers is improving as the firms mature ("survival of the fittest"), i.e.
s0(t) > 0. Consequently, we assume that experienced firms are more likely to have
good projects than young and unexperienced firms.
2.2. Banks
There are two banks that consider monitoring the firm.6 Let F > 0 denote per-
period monitoring cost. Although, the monitoring cost incurs in each period, we
assume that monitoring decisions are long-term commitments; a monitoring bank
will continue to do monitoring although a rivaling bank starts monitoring. Fur-
thermore, it is assumed that F is sufficiently large compared with expected profit
to make it unprofitable for both banks to start monitoring in period 0. The inside
bank monitors the firm and with probability λ it is revealed to the bank whether
6We endogenize when the second bank starts monitoring. A straight forward generalization ofour model would be to endogenize when n > 2 start monitoring.
6
the project is good or bad. The outside and inside banks have access to the same
information about the project with probability (1 − λ). Notice, however, that the
outside bank does not know whether the inside bank has obtained privileged infor-
mation or not. An outside bank knows only the probability of the firm being of a
good type, i.e. s(t).
The competition between the two banks is considered as an ”English auction”
where banks decrease their interest rates until one bank is active and this bank
captures the borrower. If the two banks’ lowest interest rates are identical and they
both monitor the borrower, they capture the borrower with equal probability. If
only one bank does monitoring, the borrower will weakly favour the existing lender.
This assumption ensures that, in equilibrium, there will not be change of lender
as long as only one bank does monitoring, but the rivaling outside bank limits the
interest-rate markup the inside bank can obtain.7
For simplicity, we assume that firms and banks are risk neutral and that the
risk-free interest rate is 0.
2.3. Equilibrium
We will show that there exists a pure strategy subgame perfect Nash equilibrium
where one bank lends to and monitors a firm from date 0 and the second bank starts
monitoring at date T > 0. Let π denote the profit obtained by the first bank until
the second bank start monitoring (π will be analyzed later).
In equilibrium the banks set their interest rates, re, as described by Proposition
1.
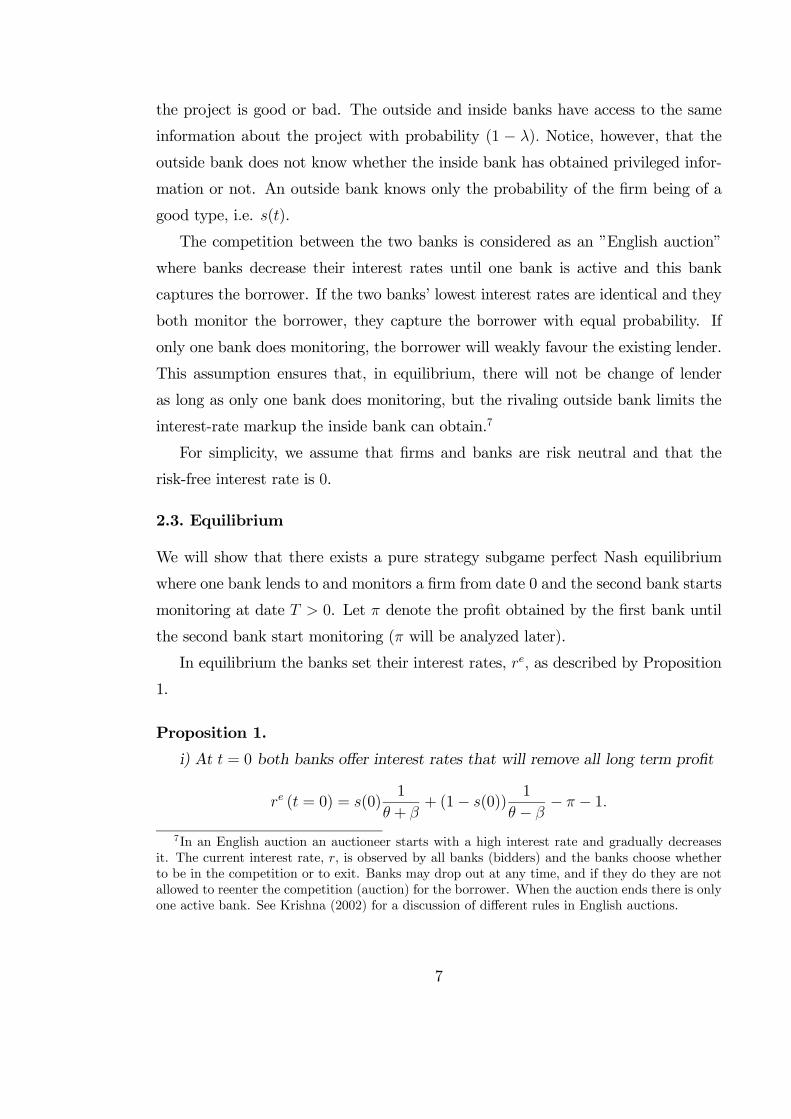
Proposition 1.
i) At t = 0 both banks offer interest rates that will remove all long term profit
re (t = 0) = s(0)1
θ + β+ (1− s(0))
1
θ − β− π − 1.
7In an English auction an auctioneer starts with a high interest rate and gradually decreasesit. The current interest rate, r, is observed by all banks (bidders) and the banks choose whetherto be in the competition or to exit. Banks may drop out at any time, and if they do they are notallowed to reenter the competition (auction) for the borrower. When the auction ends there is onlyone active bank. See Krishna (2002) for a discussion of different rules in English auctions.
7

ii) At t ∈ [1, T − 1] the outside bank expects to capture only bad projects andoffers interest rates, re, reflecting the risk of bad projects
re (1 < t ≤ T − 1) = 1
θ − β− 1
and the inside bank will keep the borrower by offering the same interest rate as the
outside bank.
iii) At t ∈ [T,∞i both banks may acquire privileged information. Interest ratecharged a borrower having a good project depends on whether more than one bank
has this information (probability λ2),
reG (T ≤ t) =
½ 1θ+β− 1
1θ−β − 1
with probability λ2
with probability 1− λ2
while the interest rate charged a borrower with a bad project reflects its credit risk
reB (T ≤ t) =1
θ − β− 1
Proof. Part i): Straightforward.
Part ii): Note that the bidding behaviour of the informed inside bank is such
that its lowest bid implies zero profit. The outside bank will correctly expect that
it only will capture borrowers with bad projects if it improves its interest rate bid
from r = 1θ−β − 1 and this will make a better interest bid nonprofitable.
Part iii): The same argument as for Part ii) can be applied for Part iii).
Proposition 1 describes bank competition taking the second bank’s monitoring
decision as given (T is taken as given). We will now analyze T and study when
the second bank starts monitoring. First, note that the second bank’s expected
one-period profit is
λ (1− λ) s(t)
½(θ + β)
1
θ − β− 1¾− F
or
λ (1− λ) s(t)
½2β
θ − β
¾− F
if it monitors. In the above expression, λ (1− λ) denotes the probability of obtaining
exclusive privileged information, s(t) is the probability that the project is good and
succeeds with probability (θ+ β). In case of success, the firm is able to pay the face
8

value of debt which is³
1θ−β´if the other bank fears that the borrower has a bad
project.8
The second bank finds it profitable to start monitoring when the per-period profit
exceeds the monitoring costs. More formally, the following condition (2.1) describes
when the second bank starts monitoring (T ).
λ (1− λ) s(T )
½2β
θ − β
¾> F > λ (1− λ) s(T − 1)
½2β
θ − β
¾(2.1)
Condition (2.1) states that it is non-profitable to start monitoring in period T − 1but profitable in period T . Since s0(t) > 0 it follows that T is uniquely defined by
condition (2.1).
We can now calculate the profit from capturing the borrower in period 0 instead
of waiting until period T and then start monitoring;
π =2β
θ − β
t=T−1Xt=1
s(t)− TF
The banks compete away this potential profit by subsidizing the loan in period 0 by
π.
We can now compare the equilibrium interest rate with the interest rate yield-
ing zero-bank profit provided that the bank has only access to public information.
Denote this benchmark interest rate r∗(t),
r∗(t) = s(t)1
θ + β+ (1− s(t))
1
θ − β− 1. (2.2)
Consequently, the markup on the benchmark interest rate in period t ismt = re(t)−r∗(t). From the definition of r∗(t) and Proposition 1 it follows directly that:
Proposition 2. The markup, mt, follows a life cycle;
i) in period t = 0, we have mt < 0
ii) in the following periods, t ∈ [1, T − 1] , mt is increasing in t.
iii) in period T, we have mT < mT−1.
8The inside bank offers a loan contract that makes the entrepreneur indifferent between accept-ing the contract from the inside bank and accepting the contract from the outside bank. Since theoutside bank offers a contract reflecting that only the low type borrowers will switch banks, the
difference is³R−
³R− 1
θ−β´´= 1
θ−β .
9

Note that the equilibrium interest rate at T−1 is 1θ−β −1, while at T it decreases
to¡1− λ2s(t)
¢1
θ−β + λ2s(t) 1θ+β− 1 where λ2s(t) is the probability that both banks
have discovered that the project is good.
In Proposition 3 we show that the life cycle of the markup may depend on the
size of the monitoring costs which we associate with the prevalence of asymmetric
information problems in the credit market. Industries with more asymmetric infor-
mation problems and, consequently, higher monitoring costs may have a different
markup cycle than industries with lower monitoring costs.
Proposition 3. Industries with high monitoring costs (F ),
i) have a longer lock-in period (T ) than industries with low monitoring costs.
ii) have a higher maximum markup (mT ) than industries with low monitoring
costs.
Proof. Part i) follows directly from (2.1) and the assumption that s0 (t) > 0.
Part ii): Note that the markup for period t ∈ [1, T − 1] is given by
mt =
µ1
θ − β− 1¶−µs(t− 1) 1
θ + β+ (1− s(t− 1)) 1
θ − β− 1
=2β
(θ + β) (θ − β)s (t− 1)
and that s0 (t) > 0. Part ii) follows from observing that mt reaches its maximum
at t = T − 1 and that T is increasing in F (follows from part i).
Not only markups but also credit availability may depend on asymmetric infor-
mation problems in credit markets. In order to focus on potential effects on credit
availability we will allow firms to have negative NPV projects in the first period.
Consequently, we divert from the set up above by making one new assumption; in
the first period the success probability is between 0 and 1 or more formally in period
1 we let θ = θ0 ∈ [β, 1− β]. A bank is willing to lend to all borrowers in period 0
with θ0 > θ̂ where θ̂ is defined by
1 = s(0)³θ̂ + β
´R+ (1− s(0))
³θ̂ − β
´R+Π
where Π is total profit banks expect to earn on a borrower (may contain profit after
the lock-in period ends). By observing that a longer lock-in period increases Π, we
have Proposition 4
10

Proposition 4. A bank accepts borrowers with lower first-period success probabil-
ities (lower θ̂) if the profits from lock-in, Π, increases.
In the empirical section to follow, we show how the asymmetric information
problems and lock-in effects evolve for a large sample of Norwegian firms.
3. Data and empirical investigation
In this section we specify an empirical model in order to test the empirical implica-
tions or hypotheses derived from the theoretical model in section 2:
I The interest rate markup follows a life cycle pattern over the firm’s age: young
firms pay a low or negative markup, thereafter the markup increases until it
falls for old firms (see Proposition 2).
II The life cycle pattern described in I is more pronounced for more opaque firms,
i.e. firms with more severe asymmetric information problems (see Proposition
3 ii).
III Banks will on average lend to firms with higher bankruptcy probability if the
lock-in effect is stronger (see Proposition 4).
IV More opaque firms have a longer lock-in period (see Proposition 3 i).
Our empirical model allows us to distinguish effects originating from asymmetric
information from those originating from market concentration. Unlike the existing
literature we examine the effect of market concentration on interest rate markups
keeping the effect from asymmetric information constant. In their much cited pa-
per, Petersen and Rajan (1995) examine pricing and credit availability associated
with concentrated credit markets. They introduce a theoretical model which they
use to show how credit availability and intertemporal pricing of loans may depend
on market concentration. Consistent with their theoretical model they find that
concentrated credit markets allow banks to take a loss initially in order to bene-
fit from a long-term relationship with a borrower. In Petersen and Rajan (1995)
market concentration determines to what extent firms can establish long-term re-
lationships. In contrast, we examine directly whether asymmetrically dispersed
11
information between inside and outside banks is crucial for establishing long-term
bank relationships. In order to make our study comparable with Petersen and Ra-
jan (1995) we introduce market concentration variables in addition to asymmetric
information variables. By controlling for asymmetric information problems, we can
examine whether market concentration has a separate effect on the intertemporal
pricing of loans (see Hypothesis V below).
Petersen and Rajan (1995) assume that bank loans are homogenous. In con-
trast, Boot and Thakor (2000) suggest that banks may change their type of lending
when the competitive environment changes. They present a theoretical model where
banks strategically choose how much of their lending they want to do as transaction
based lending compared with relationship lending. Relationship lending increases
the success probability of borrowers projects and therefore makes borrowers willing
to pay higher interest rates. If reduced market concentration induces banks to pro-
vide more valuable relationship loans, average interest rate markups may increase.
This suggests Hypothesis VI below. To summarize, by including a market concen-
tration measure in our empirical model we are able to also test the following two
opposing hypotheses:
V Reduced market concentration leads to lower interest rate markups for mature
firms and higher markups for de novo firms. This effect of market concentra-
tion on interest rate markup will lend support to the findings by Petersen and
Rajan (1995).
VI Reduced market concentration leads to higher interest rate markup for an aver-
age borrower. Assuming higher interest rate markups in relationship banking
compared with transaction based banking, this finding will lend support to
Boot and Thakor (2000).
To test the above hypotheses I to VI, we present an econometric model with the
actual interest rate markup (i.e., the actual interest rate minus the risk adjusted
zero expected profits interest rate) paid by firms as the LHS variable. For RHS
variables we use the age of the firm (represented by two dummies for three different
age groups: young, middle aged, and mature firms), a variable representing the
12

degree of asymmetric information, and a variable measuring market concentration
in the different credit markets covered by the data.
We specify the risk-adjusted zero-expected profits interest rate as the interest
rate a borrowing firm would pay in an ideal world with a risk neutral competitive
banking industry in the following way:
1 + rf,t = pi,t(1− LGB) + (1− pi,t) · (1 + r∗i,t)
r∗i,t =rf,t + pi,tLGB
1− pi,t
where rf,t is the risk-free money market interest rate, pi,t is the probability at time t
that firm i will go bankrupt, LGB is the loss given bankruptcy, i.e., the fraction of
the principal of the loan that the bank will have to write off in case of bankruptcy.9
r∗i,t is then defined as the risk-adjusted interest rate.
Our LHS variable, the interest rate markup is thus
mi,t = ri,t − r∗i,t , (3.1)
where ri,t is the actual interest rate firm i pays in year t. r∗i,t is the average of the risk-
adjusted interest rate for year t based on the bankruptcy probability pi,t−1 and the
risk-adjusted interest rate for year t based on the bankruptcy probability pi,t. Our
motivation for using this average is the fact that during year t only the information
from balance sheet and income statements for year t − 1 are publicly available.However, a bank lending to a firm in year t will also seek current information from
the firm’s books to further help assessing the bankruptcy probability of the firm.
The general form of our empirical model is
mi,t = (AINFO,dAGE;i,t, concentration, i,t) , (3.2)
AINFO is a variable representing the severity of asymmetric information. dAGE;i,t
is a vector of the dummies representing the age group for firm i in year t. It will
9In the actual empirical model LGB is set at 0.6. The Basel Committee suggests in its ThirdConsultative Paper, Basel Committee on Banking Supervision (2003), that loss given default (LGD)is set to 45% for senior unsecured debt and 75 % for subordinated claims without specific collateral(the IRB Foundation approach). Note however that we look at bankruptcy which is more ‘severe’than default.
13
enable us to test how the interest rate markup differs between firms of various ages.
concentration captures the degree of concentration in the credit market from which
the firm demands credit. i,t is the stochastic residual.
3.1. Data
Our data are collected from the SEBRA-database covering all limited liability firms
in Norway.10 This database contains annual financial statements (balance sheets
and income statements) from 1988 to 2001. It also contains information about
firms’ characteristics such as the industrial sector code, the geographical location of
the firms’ head offices, and firms’ age. In addition, we apply results from a model
predicting bankruptcy probability for each firm and each year (see Appendix B).
In this model, bankruptcy is defined as the event in which a firm declares itself
bankrupt within the next three years. The predicted bankruptcy probabilities from
the model are added to the database.11 In our empirical model we use these predicted
bankruptcy probabilities.
From year 2000 the SEBRA-database allows us to separate bank loans from
other debt. Hence, we use data from year 2000 and 2001. The database contains
information for approximately 130,000 firms each year, and initially we are left with
a quarter of a million observations. Of those, however, we only consider non-financial
firms. Since we are particularly interested in the asymmetric information aspect in
relationship lending we have removed firms that have issued bonds and thus often
have a bond rating. Furthermore we drop firms that either lend to or borrow from
other companies in a conglomerate. Lending inside a conglomerate is not associated
with significant asymmetric information problems. We also exclude large firms,
those with an annual operating income above 100 NOK million, leaving us with a
sample of rather small firms, firms about which there is little public information.
Actual paid interest rates are calculated from firms’ income statements and bal-
ance sheets by dividing each firm’s interest cost by the unweighted average of bank
loans outstanding at the end of year t − 1 and t.12 Since most loans extended by10The SEBRA-database is owned by Norges Bank (The central bank of Norway), and is based
on data supplied and quality tested by Dun and Bradstreet.11This model is described in Eklund, Larsen, and Bernhardsen (2001), and a more comprehensive
description is given in Bernhardsen (2001).12Some firms have large changes in their lending during the beginning or the end of the year.
14
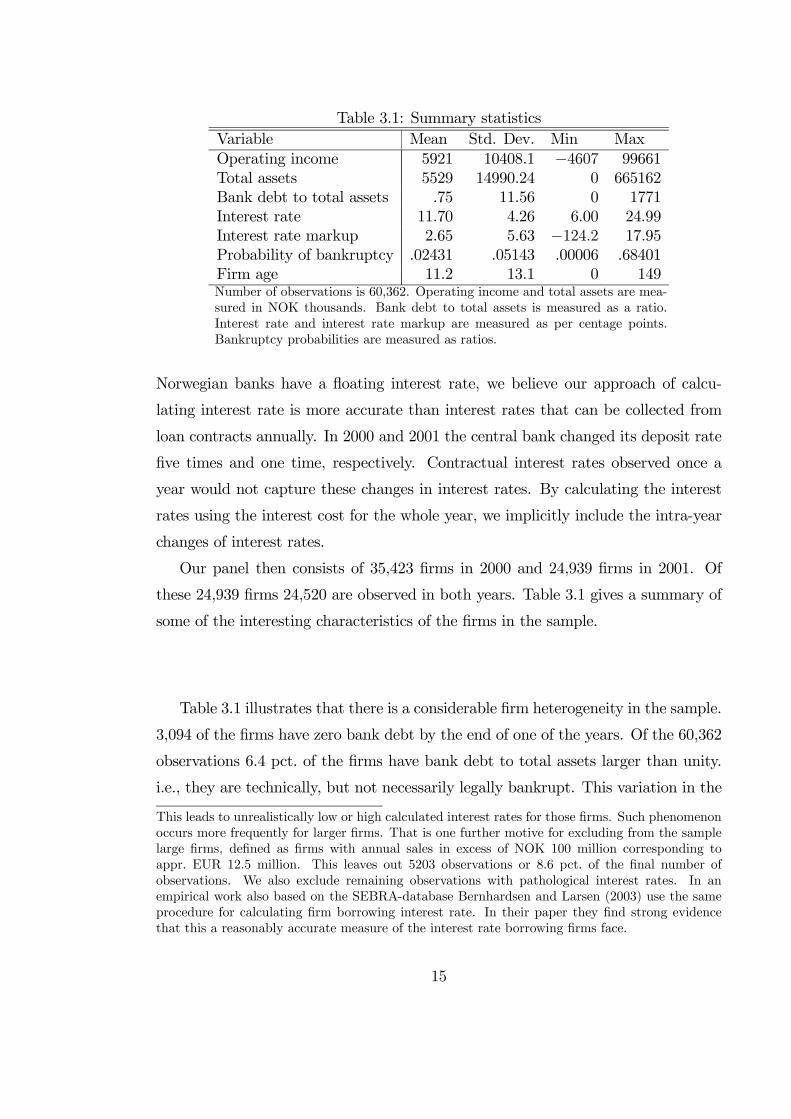
Table 3.1: Summary statisticsVariable Mean Std. Dev. Min MaxOperating income 5921 10408.1 −4607 99661Total assets 5529 14990.24 0 665162Bank debt to total assets .75 11.56 0 1771Interest rate 11.70 4.26 6.00 24.99Interest rate markup 2.65 5.63 −124.2 17.95Probability of bankruptcy .02431 .05143 .00006 .68401Firm age 11.2 13.1 0 149Number of observations is 60,362. Operating income and total assets are mea-sured in NOK thousands. Bank debt to total assets is measured as a ratio.Interest rate and interest rate markup are measured as per centage points.Bankruptcy probabilities are measured as ratios.
Norwegian banks have a floating interest rate, we believe our approach of calcu-
lating interest rate is more accurate than interest rates that can be collected from
loan contracts annually. In 2000 and 2001 the central bank changed its deposit rate
five times and one time, respectively. Contractual interest rates observed once a
year would not capture these changes in interest rates. By calculating the interest
rates using the interest cost for the whole year, we implicitly include the intra-year
changes of interest rates.
Our panel then consists of 35,423 firms in 2000 and 24,939 firms in 2001. Of
these 24,939 firms 24,520 are observed in both years. Table 3.1 gives a summary of
some of the interesting characteristics of the firms in the sample.
Table 3.1 illustrates that there is a considerable firm heterogeneity in the sample.
3,094 of the firms have zero bank debt by the end of one of the years. Of the 60,362
observations 6.4 pct. of the firms have bank debt to total assets larger than unity.
i.e., they are technically, but not necessarily legally bankrupt. This variation in the
This leads to unrealistically low or high calculated interest rates for those firms. Such phenomenonoccurs more frequently for larger firms. That is one further motive for excluding from the samplelarge firms, defined as firms with annual sales in excess of NOK 100 million corresponding toappr. EUR 12.5 million. This leaves out 5203 observations or 8.6 pct. of the final number ofobservations. We also exclude remaining observations with pathological interest rates. In anempirical work also based on the SEBRA-database Bernhardsen and Larsen (2003) use the sameprocedure for calculating firm borrowing interest rate. In their paper they find strong evidencethat this a reasonably accurate measure of the interest rate borrowing firms face.
15
probability of bankruptcy also spills over to the interest rate markup. There are
a few firms in the sample with large negative markups. These are firms with high
bankruptcy probabilities for which the risk-adjusted interest rates are correspond-
ingly high. Large negative markups can be due to banks aggressive pricing of loans
to new borrowers as suggested by our theory model. 13
There is also considerable variation in the age of firms. The average firm in the
sample is just below 12 years, and the oldest firm is 149 years. The age distribution
in the sample is illustrated in Figure 3.1.
Figure 3.1 shows that the peak age of firms in our sample is 3 years. The
median age is 7 years and the mean just above 11 years. This skewed distribution
is typical for the age of firms in large samples. Many of the relatively young firms
will not survive as independent entities because they go bankrupt, are closed before
bankruptcy, or are acquired by other firms. Nevertheless 7,646 or 12.7 pct of the
observations in the sample relate to firms 20 years or older.
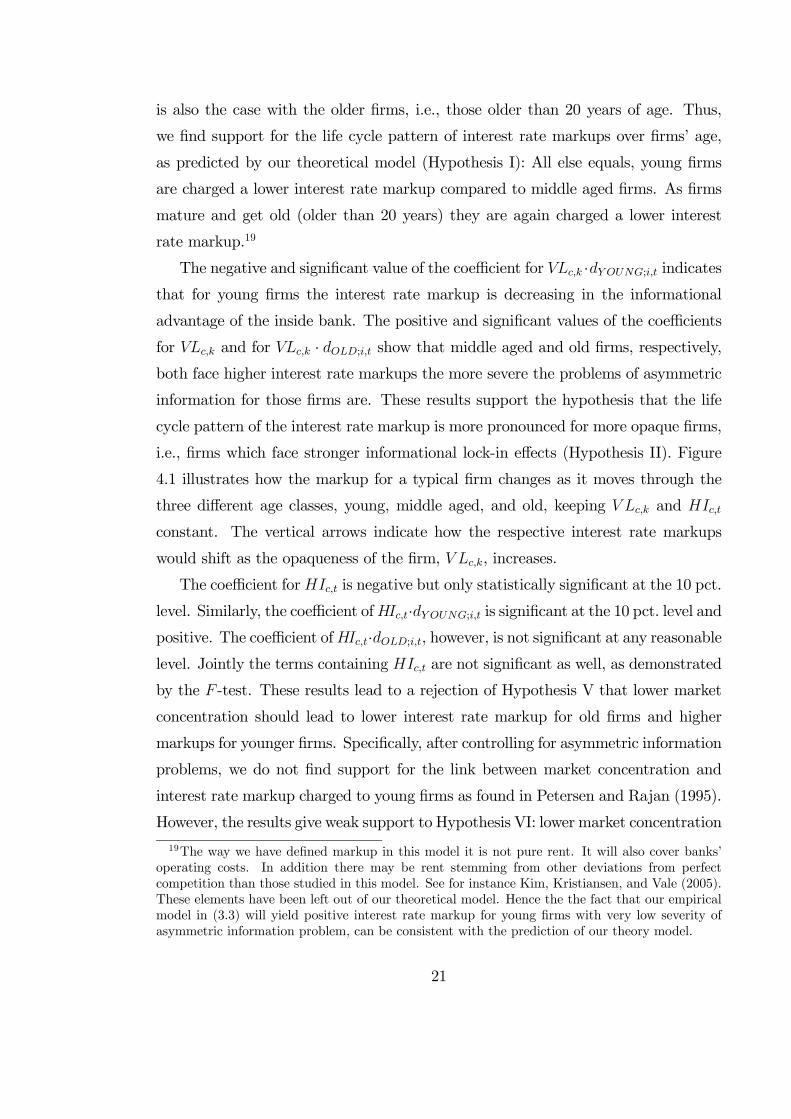
We suggest a novel measure of the severity of asymmetric information problems
between inside and outside banks. In line with our theoretical model, we assume
that an inside bank obtains information about firms credit worthiness before out-
side banks. This information advantage of inside banks is particularly valuable in
industries where firms’ credit worthiness change quickly. Hence we propose the
volatility of bankruptcy probability in the industry to which the firm belongs, as
a measure of the inside banks’ information advantage over outside banks. Figure
3.2 illustrates the change in bankruptcy probability for three different firms in our
sample.14 Consider a firm belonging to an industry where firms’ bankruptcy proba-
bilities and credit ratings vary considerably over time. Soft information about firms’
prospects acquired through a bank relationship is particularly valuable in such in-
13Alternatively, a large negative markup can be due to firms’ moral hazard problems whichprevent banks from increasing the interest rate (see Stiglitz and Weiss (1981) and Williamson(1987)).14For the high volatility firm the volatility of bankruptcy probability is just below the 95 pct.
fractile. For the low volatility low bankruptcy probability firm both the bankruptcy probabilityand its volatility are below the 5 pct. fractile. The low volatility high bankruptcy probability firmhas for three concecutive years a bankruptcy probability around the 85 pct. fractile which falls andafter a few years remains below the lower quartile. Its volatility, however is around the 15 pct.fractile.
16

0.0
5.1
Den
sity
0 50 100 150Firm age
Figure 3.1: Distribution of firm age. Number of observations 60,362.
17

0.1
.2.3
1988 1992 1997 2001
High volatility Low vol. low prob. Low vol. high prob.
Three different examplesBankruptcy probability
Figure 3.2: Volatility of bankruptcy probabilities.
dustries. This informational advantage of the inside bank exposes the firms in this
industry to considerable informational lock-in effects.
3.2. Empirical model
Our theoretical model predicts that the interest rate markup is lower for younger
firms, than for middle aged firms. For older, or more mature firms, it will again be
lower. Furthermore, the model predicts that firms facing severe asymmetric infor-
mation problems (more costly monitoring) experience a more pronounced markup
cycle. In order to test these hypotheses we assign firms into three different age
groups; young firms, middle aged firms, and old firms. Age groups are represented
by dummies. Furthermore we allow the age dummies to interact with our measure-
ment of the severity of asymmetric information.
As alluded to earlier, we want our empirical model to also enable a test of the two
alternative predictions set out by Petersen and Rajan (1995) and Boot and Thakor
(2000). In the paper by Petersen and Rajan the potential lock-in phenomenon of
borrowers in relationship banking may stem from the exogenous competitiveness of
18

the credit market, represented by the market concentration. In Boot and Thakor
market concentration leads to more transactional lending and lower average interest
rates.15 Therefore we include a measure of credit market concentration and allow it
to interact with firm age dummies in the same way as our measure of asymmetric
information. Consequently, our empirical model can be used to test whether asym-
metric information, credit market concentration, or both determine how the interest
rate markup evolves over a firm’s age.
We apply the following empirical model:
mi,t = β0 + β1dY OUNG;i,t + β2dOLD;i,t + β3VLc,k + β4VLc,k · dY OUNG;i,t (3.3)
+β5VLc,k · dOLD;i,t + β6HIc,t + β7HIc,t · dY OUNG;i,t + β8HIc,t · dOLD;i,t + i,t ,
where:
dY OUNG;i,t is a dummy taking value 1 if the firm is 10 year old or younger, 0 other-
wise.16
dOLD;i,t is a dummy taking value 1 if the firm is older than 20 years, 0 otherwise.
∆pi,t is the change in bankruptcy probability of firm i from year t− 1 to year t.
σ(∆pi) is the standard deviation over time of∆pi,t, i.e., a measure of the volatility in
the bankruptcy probability of firm i. As discussed above, we use this volatility
measure as a proxy for the asymmetric information problems related to lend-
ing to firm i. Higher volatility implies more severe asymmetric information
problems.
VLc,k is the mean of σ(∆pi) for all firms in industry sector k in county c. Essentially
it captures the volatility of the bankruptcy probability of firms in the specific
industry and county. We regard it as a proxy for the severity of the ex ante
asymmetric information problem in lending to a firm within this particular
group of firms.17
15Note that Boot and Thakor (2000) introduce a static model which does not have implicationfor the dynamic structure of interest rate markups.16Cf. (Petersen and Rajan, 1995, p. 420) who also classify firms 10 years and younger as young
firms.17To calculate V Lc,k we use observations spanning the whole period of the SEBRA-database,
1988 to 2001.
19
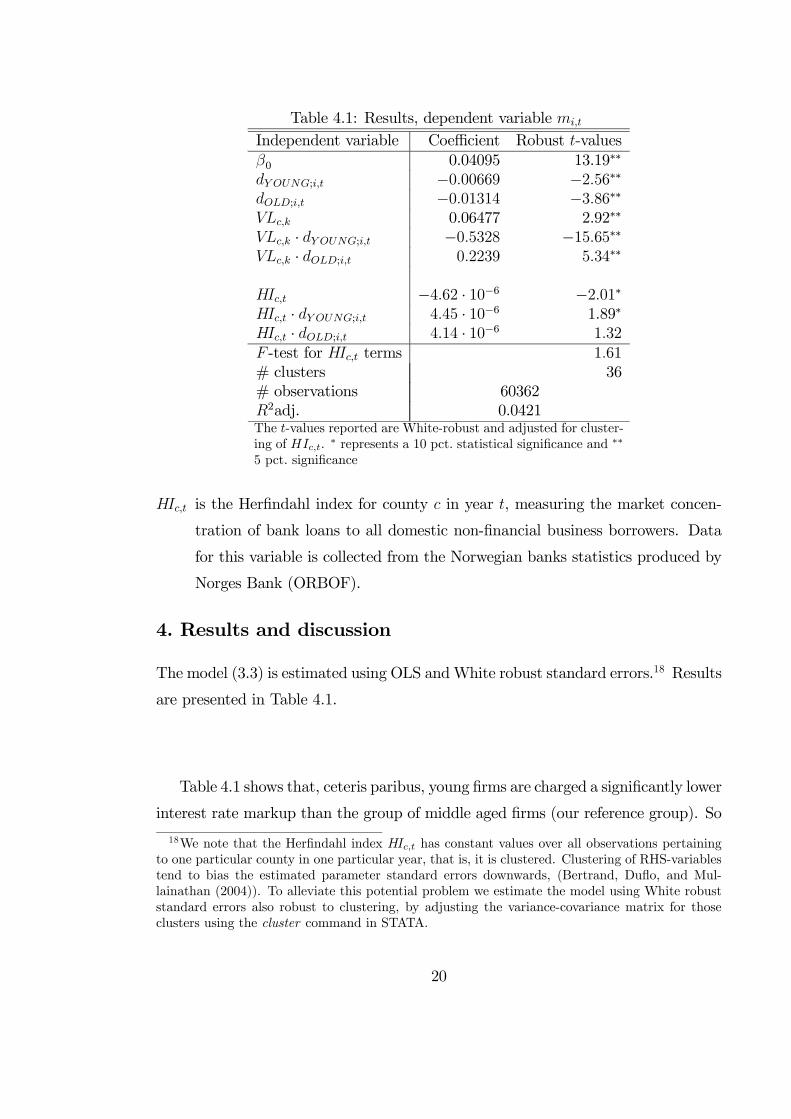
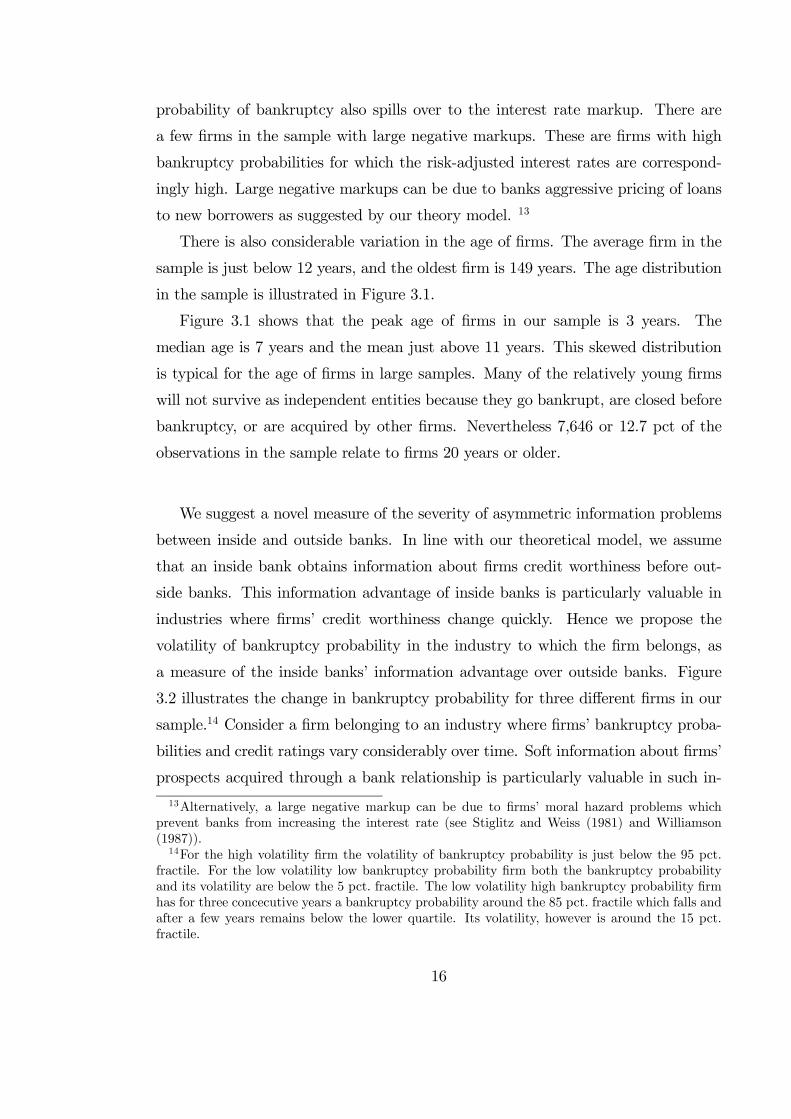
Table 4.1: Results, dependent variable mi,t
Independent variable Coefficient Robust t-valuesβ0 0.04095 13.19∗∗
dY OUNG;i,t −0.00669 −2.56∗∗dOLD;i,t −0.01314 −3.86∗∗VLc,k 0.06477 2.92∗∗
VLc,k · dY OUNG;i,t −0.5328 −15.65∗∗VLc,k · dOLD;i,t 0.2239 5.34∗∗
HIc,t −4.62 · 10−6 −2.01∗HIc,t · dY OUNG;i,t 4.45 · 10−6 1.89∗
HIc,t · dOLD;i,t 4.14 · 10−6 1.32F -test for HIc,t terms 1.61# clusters 36# observations 60362R2adj. 0.0421The t-values reported are White-robust and adjusted for cluster-ing of HIc,t. ∗ represents a 10 pct. statistical significance and ∗∗
5 pct. significance
HIc,t is the Herfindahl index for county c in year t, measuring the market concen-
tration of bank loans to all domestic non-financial business borrowers. Data
for this variable is collected from the Norwegian banks statistics produced by
Norges Bank (ORBOF).
4. Results and discussion
The model (3.3) is estimated using OLS andWhite robust standard errors.18 Results
are presented in Table 4.1.
Table 4.1 shows that, ceteris paribus, young firms are charged a significantly lower
interest rate markup than the group of middle aged firms (our reference group). So
18We note that the Herfindahl index HIc,t has constant values over all observations pertainingto one particular county in one particular year, that is, it is clustered. Clustering of RHS-variablestend to bias the estimated parameter standard errors downwards, (Bertrand, Duflo, and Mul-lainathan (2004)). To alleviate this potential problem we estimate the model using White robuststandard errors also robust to clustering, by adjusting the variance-covariance matrix for thoseclusters using the cluster command in STATA.
20
is also the case with the older firms, i.e., those older than 20 years of age. Thus,
we find support for the life cycle pattern of interest rate markups over firms’ age,
as predicted by our theoretical model (Hypothesis I): All else equals, young firms
are charged a lower interest rate markup compared to middle aged firms. As firms
mature and get old (older than 20 years) they are again charged a lower interest
rate markup.19
The negative and significant value of the coefficient for VLc,k ·dY OUNG;i,t indicates
that for young firms the interest rate markup is decreasing in the informational
advantage of the inside bank. The positive and significant values of the coefficients
for VLc,k and for VLc,k · dOLD;i,t show that middle aged and old firms, respectively,both face higher interest rate markups the more severe the problems of asymmetric
information for those firms are. These results support the hypothesis that the life
cycle pattern of the interest rate markup is more pronounced for more opaque firms,
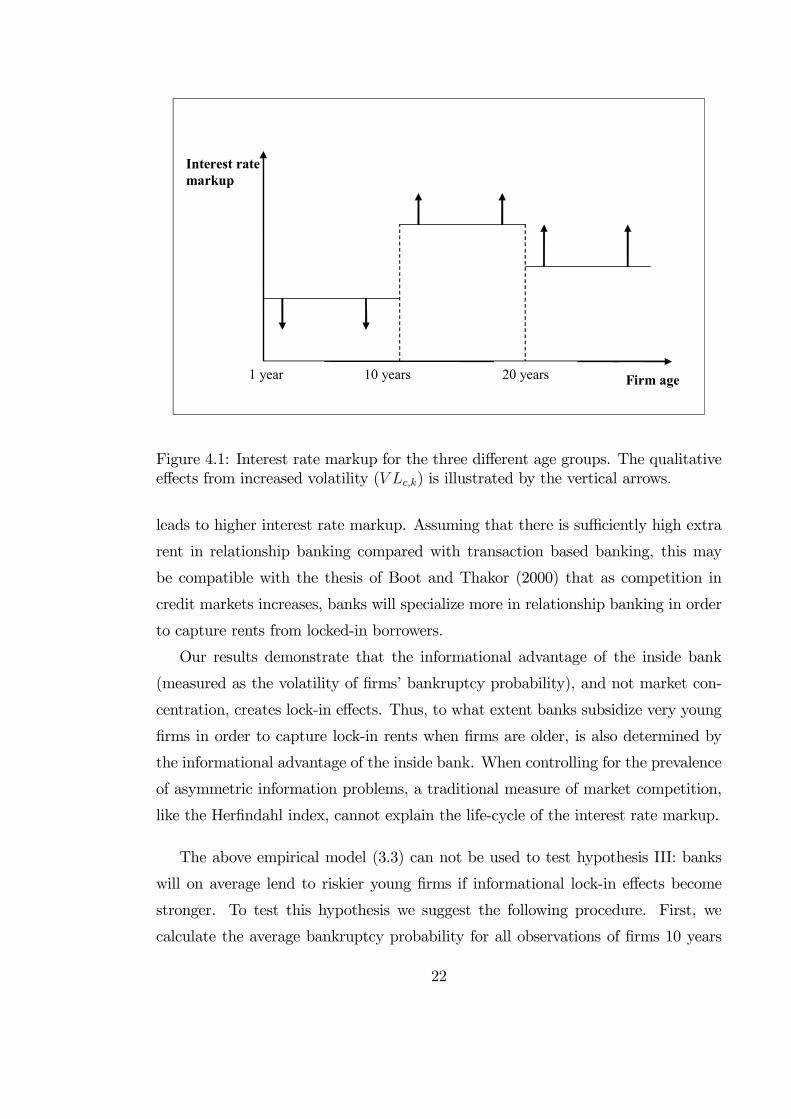
i.e., firms which face stronger informational lock-in effects (Hypothesis II). Figure
4.1 illustrates how the markup for a typical firm changes as it moves through the
three different age classes, young, middle aged, and old, keeping V Lc,k and HIc,t
constant. The vertical arrows indicate how the respective interest rate markups
would shift as the opaqueness of the firm, V Lc,k, increases.
The coefficient forHIc,t is negative but only statistically significant at the 10 pct.
level. Similarly, the coefficient ofHIc,t·dY OUNG;i,t is significant at the 10 pct. level and
positive. The coefficient ofHIc,t·dOLD;i,t, however, is not significant at any reasonablelevel. Jointly the terms containing HIc,t are not significant as well, as demonstrated
by the F -test. These results lead to a rejection of Hypothesis V that lower market
concentration should lead to lower interest rate markup for old firms and higher
markups for younger firms. Specifically, after controlling for asymmetric information
problems, we do not find support for the link between market concentration and
interest rate markup charged to young firms as found in Petersen and Rajan (1995).
However, the results give weak support to Hypothesis VI: lower market concentration
19The way we have defined markup in this model it is not pure rent. It will also cover banks’operating costs. In addition there may be rent stemming from other deviations from perfectcompetition than those studied in this model. See for instance Kim, Kristiansen, and Vale (2005).These elements have been left out of our theoretical model. Hence the the fact that our empiricalmodel in (3.3) will yield positive interest rate markup for young firms with very low severity ofasymmetric information problem, can be consistent with the prediction of our theory model.
21
Interest rate markup
10 years 20 years Firm age 1 year
Figure 4.1: Interest rate markup for the three different age groups. The qualitativeeffects from increased volatility (V Lc,k) is illustrated by the vertical arrows.
leads to higher interest rate markup. Assuming that there is sufficiently high extra
rent in relationship banking compared with transaction based banking, this may
be compatible with the thesis of Boot and Thakor (2000) that as competition in
credit markets increases, banks will specialize more in relationship banking in order
to capture rents from locked-in borrowers.
Our results demonstrate that the informational advantage of the inside bank
(measured as the volatility of firms’ bankruptcy probability), and not market con-
centration, creates lock-in effects. Thus, to what extent banks subsidize very young
firms in order to capture lock-in rents when firms are older, is also determined by
the informational advantage of the inside bank. When controlling for the prevalence
of asymmetric information problems, a traditional measure of market competition,
like the Herfindahl index, cannot explain the life-cycle of the interest rate markup.
The above empirical model (3.3) can not be used to test hypothesis III: banks
will on average lend to riskier young firms if informational lock-in effects become
stronger. To test this hypothesis we suggest the following procedure. First, we
calculate the average bankruptcy probability for all observations of firms 10 years
22
and younger within each industry sector k in each county c, pY OUNG;c,k. For the same
groups of observations we calculate the average interest rate markup, mY OUNG;c,k.
We use these data to run the following simple regression
pY OUNG;c,k = α0 + α1mY OUNG;c,k + c,k (4.1)
Hypothesis III suggests a negative sign of α1, i.e., a more pronounced lock-in effect,
measured as lower markup for young firms, implies that the average credit worthi-
ness for young firms decreases. The estimated α1 coefficient is −0.6856, and theWhite robust t-value is −34.70.20 This result indicates that increased lock-in due toasymmetric information improves the credit availability for young high-risk firms.
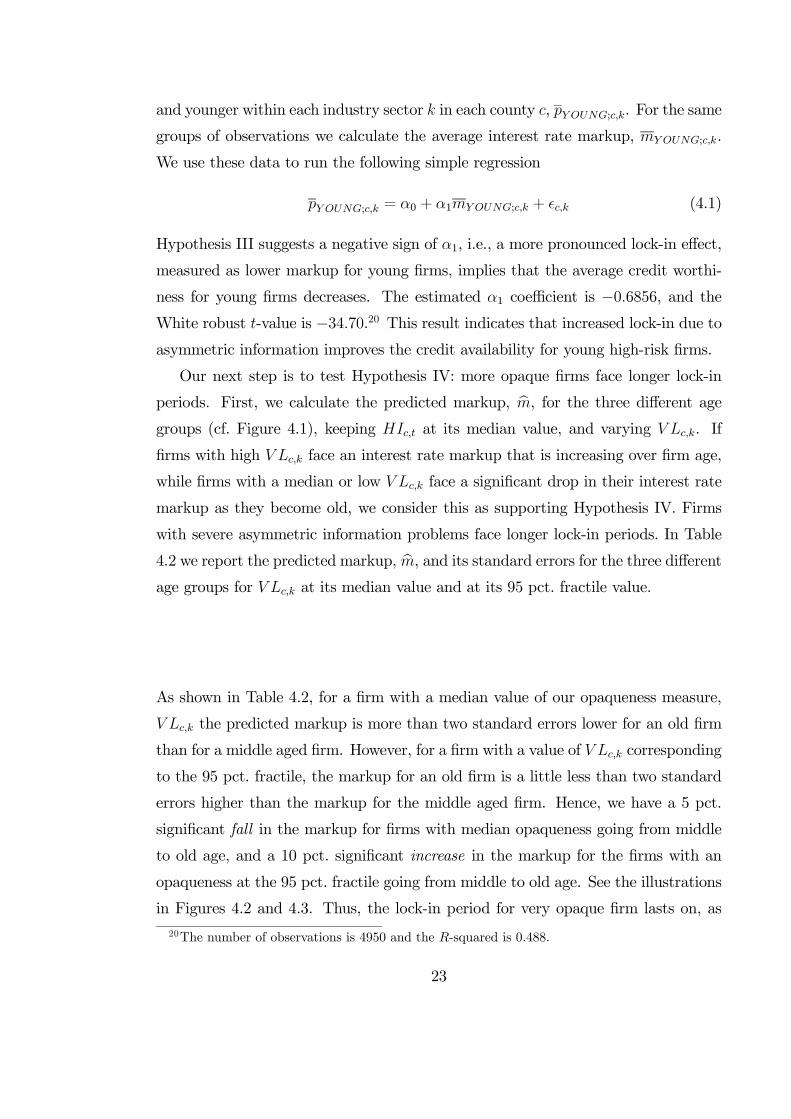
Our next step is to test Hypothesis IV: more opaque firms face longer lock-in
periods. First, we calculate the predicted markup, bm, for the three different agegroups (cf. Figure 4.1), keeping HIc,t at its median value, and varying V Lc,k. If
firms with high V Lc,k face an interest rate markup that is increasing over firm age,
while firms with a median or low V Lc,k face a significant drop in their interest rate
markup as they become old, we consider this as supporting Hypothesis IV. Firms
with severe asymmetric information problems face longer lock-in periods. In Table
4.2 we report the predicted markup, bm, and its standard errors for the three differentage groups for V Lc,k at its median value and at its 95 pct. fractile value.
As shown in Table 4.2, for a firm with a median value of our opaqueness measure,
V Lc,k the predicted markup is more than two standard errors lower for an old firm
than for a middle aged firm. However, for a firm with a value of V Lc,k corresponding
to the 95 pct. fractile, the markup for an old firm is a little less than two standard
errors higher than the markup for the middle aged firm. Hence, we have a 5 pct.
significant fall in the markup for firms with median opaqueness going from middle
to old age, and a 10 pct. significant increase in the markup for the firms with an
opaqueness at the 95 pct. fractile going from middle to old age. See the illustrations
in Figures 4.2 and 4.3. Thus, the lock-in period for very opaque firm lasts on, as
20The number of observations is 4950 and the R-squared is 0.488.
23
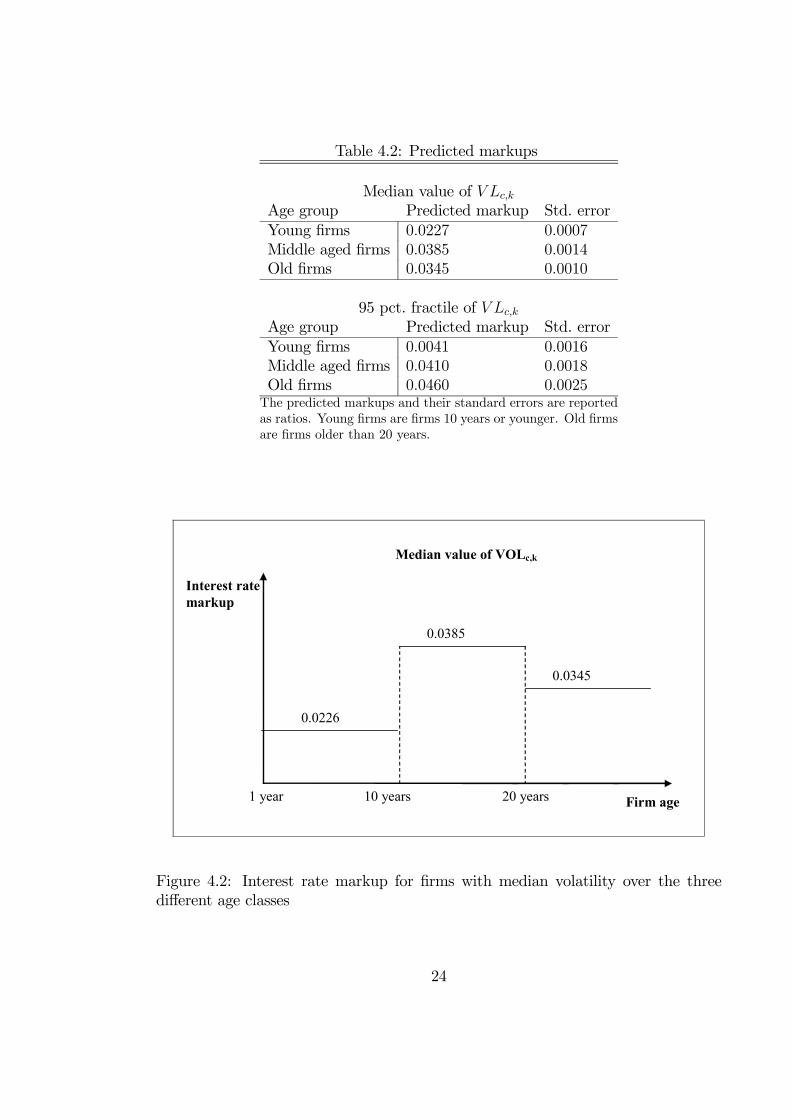
Table 4.2: Predicted markups
Median value of V Lc,k
Age group Predicted markup Std. errorYoung firms 0.0227 0.0007Middle aged firms 0.0385 0.0014Old firms 0.0345 0.0010
95 pct. fractile of V Lc,k
Age group Predicted markup Std. errorYoung firms 0.0041 0.0016Middle aged firms 0.0410 0.0018Old firms 0.0460 0.0025The predicted markups and their standard errors are reportedas ratios. Young firms are firms 10 years or younger. Old firmsare firms older than 20 years.
0.0385
0.0345
20 years 1 year
0.0226
Interest rate markup
10 years Firm age
Median value of VOLc,k
Figure 4.2: Interest rate markup for firms with median volatility over the threedifferent age classes
24
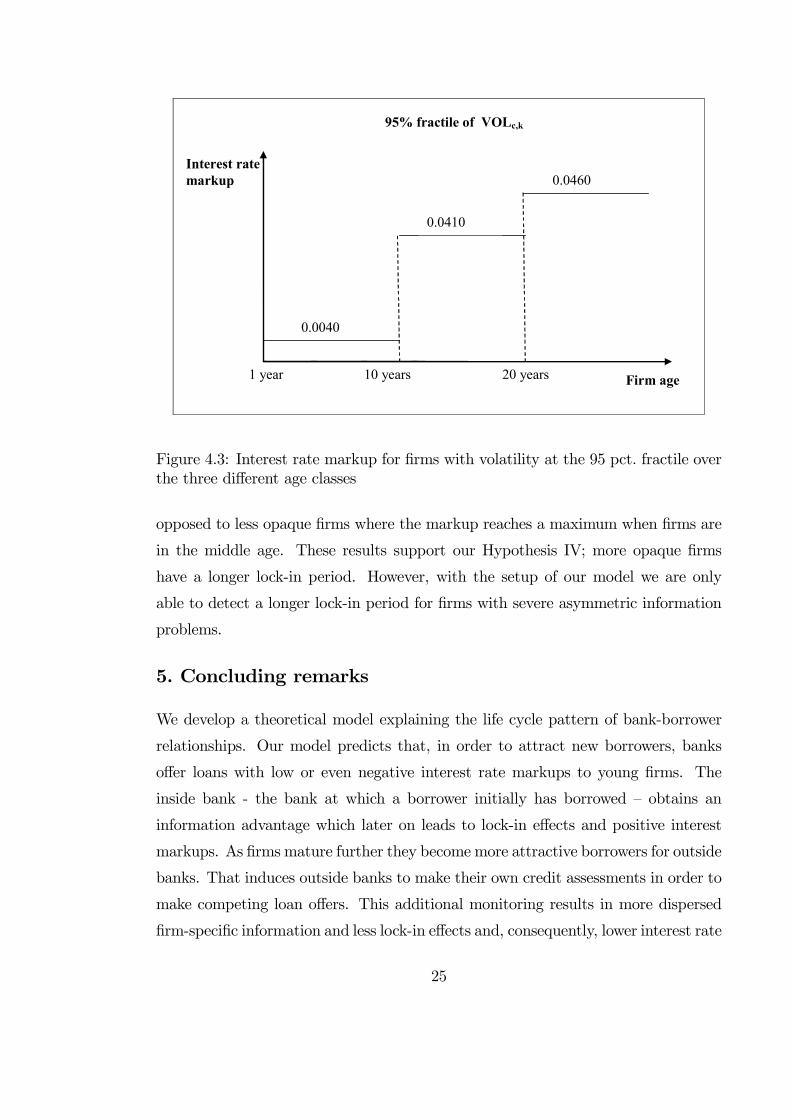
0.0040
0.0460
1 year 10 years 20 years
Interest rate markup
Firm age
0.0410
95% fractile of VOLc,k
Figure 4.3: Interest rate markup for firms with volatility at the 95 pct. fractile overthe three different age classes
opposed to less opaque firms where the markup reaches a maximum when firms are
in the middle age. These results support our Hypothesis IV; more opaque firms
have a longer lock-in period. However, with the setup of our model we are only
able to detect a longer lock-in period for firms with severe asymmetric information
problems.
5. Concluding remarks
We develop a theoretical model explaining the life cycle pattern of bank-borrower
relationships. Our model predicts that, in order to attract new borrowers, banks
offer loans with low or even negative interest rate markups to young firms. The
inside bank - the bank at which a borrower initially has borrowed — obtains an
information advantage which later on leads to lock-in effects and positive interest
markups. As firms mature further they become more attractive borrowers for outside
banks. That induces outside banks to make their own credit assessments in order to
make competing loan offers. This additional monitoring results in more dispersed
firm-specific information and less lock-in effects and, consequently, lower interest rate
25

markups. Our theoretical model predicts that a stronger information advantage of
the inside bank leads to a more pronounced life-cycle of interest rate markups and
longer lock-in period. Using a large sample of Norwegian small firms and a novel
measure of asymmetric information related to lending to each firm, we find empirical
support for these hypotheses.
A large share of the existing literature has used market concentration in the
loan market to explain interest rate markups. Our approach allows us to distin-
guish market-concentration effects from informational lock-in effects. In contrast to
Petersen and Rajan (1995) which focus on market concentration variables, we find
that our asymmetric information variables better explain the interest rate markup
charged to young firms. By including our asymmetric information variable we do
not find any significant effect of market concentration on interest rate markups as
predicted by Petersen and Rajan. Our study illustrates that banks market power is
more closely related to the banks’ information advantage than to its market share.
However, we find weak support for Boot and Thakor (2000) hypothesis that reduced
market concentration induce banks to invest more in relationship banking and make
less transactional loans and therefore charge higher average interest rate markups.
In addition we find that stronger lock-in effects makes banks more willing to lend
to young high-risk firms. Thus, lock-in may contribute to the availability of bank
credit to such firms.21 This may have implications concerning financial stability. In
a recession we would expect to see that banks experience more loan losses in market
segments with significant lock-in effects than in other market segments.
The model we introduced contributes to the further understanding of the in-
teraction and relationships established between banks and their borrowers. The
specific methods by which a bank obtains soft information about a borrower during
a relationship remains, however, to be further explored.
21See Petersen and Rajan (1995) which in their empirical analysis examine how credit availabilityis associated with market concentration in the credit market.
26
Appendix
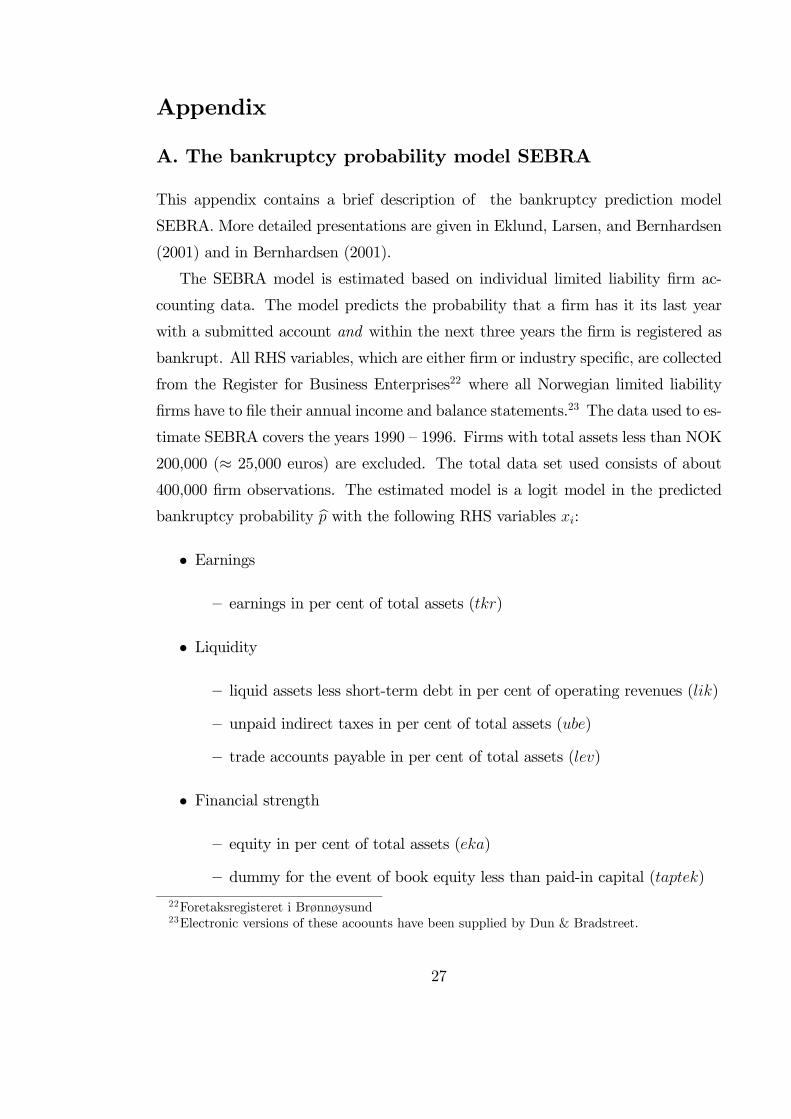
A. The bankruptcy probability model SEBRA
This appendix contains a brief description of the bankruptcy prediction model
SEBRA. More detailed presentations are given in Eklund, Larsen, and Bernhardsen
(2001) and in Bernhardsen (2001).
The SEBRA model is estimated based on individual limited liability firm ac-
counting data. The model predicts the probability that a firm has it its last year
with a submitted account and within the next three years the firm is registered as
bankrupt. All RHS variables, which are either firm or industry specific, are collected
from the Register for Business Enterprises22 where all Norwegian limited liability
firms have to file their annual income and balance statements.23 The data used to es-
timate SEBRA covers the years 1990 — 1996. Firms with total assets less than NOK
200,000 (≈ 25,000 euros) are excluded. The total data set used consists of about400,000 firm observations. The estimated model is a logit model in the predicted
bankruptcy probability bp with the following RHS variables xi:• Earnings
— earnings in per cent of total assets (tkr)
• Liquidity
— liquid assets less short-term debt in per cent of operating revenues (lik)
— unpaid indirect taxes in per cent of total assets (ube)
— trade accounts payable in per cent of total assets (lev)
• Financial strength
— equity in per cent of total assets (eka)
— dummy for the event of book equity less than paid-in capital (taptek)
22Foretaksregisteret i Brønnøysund23Electronic versions of these acoounts have been supplied by Dun & Bradstreet.
27

— dummy for dividend payments the last accounting year (div)
• Industry variables
— industry average for eka (meaneka)
— industry average for lev (meanlev)
— industry standard deviation for tkr (stdtkr)
• Age
— dummy variable for each of the first 8 years of the firm’s age
• Size
— total assets (size)
The structure of the model is as follow:
bp =1
1 + e−ywhere
by = bβ0 + bβ1T1(x1) + bβ2T2(x2) + . . .+ bβkTk(xk) and
Ti(xi) =
1
1 + e− xi−αi
δi
if xi ∈ {eka, tkr, lik, lev, ube}
xi if xi /∈ {eka, tkr, lik, lev, ube}The values of the estimated coefficients are reported in Eklund, Larsen, and
Bernhardsen (2001). As expected bp is decreasing in tkr, eka, and lik, and it is
increasing in lev and ube. For the first 8 years of a firm’s life the model predicts
lower bankruptcy probability by each year, except from the first to the second year.
After 8 years age has by construction no effect on the bankruptcy probability. For
the 5 non-linearly transformed variables the marginal effect on bp is non-linear inthe sense that the absolute value of the marginal effect has a peak around a certain
value of xi.
28
Syversten (2004) compares the predictive power of the SEBRA model with that
of Moody’s KMV Private Firm model for Norway — hereafter referred to as KMV.24
He uses "power curves" and their corresponding "accuracy ratios" to compare the
bankruptcy predictions of SEBRA and the default probability predictions of KMV
to actual bankruptcies for the four years 1998 — 2001. Syversten concludes that
SEBRA’s accuracy is as good as or somewhat better than the accuracy of KMV.
24As KMV for Norway only covers about 3,500 firms and the SEBRA model covers more than100,000 firms the comparison is based on only a relatively small sample of the frims in the SEBRAmodel.
29
References
Basel Committee on Banking Supervision (2003): “Consultative Document: TheNew Basel Capital Accord,” http://www.bis.org/bcbs/bcbscp3.htm.
Bernhardsen, E. (2001): “A model of bankruptcy prediction,” Working Paper2001/10, Norges Bank, Oslo.
Bernhardsen, E., and K. Larsen (2003): “Banks’ pricing of risk associated withcorporate lending,” Norges Bank, Economic Bulletin, 54, 24—34.
Bertrand, M., E. Duflo, and S. Mullainathan (2004): “How much should we trustthe differences-in-differences estimates?,” Quarterly Journal of Economics, 119,249—275.
Boot, A. W., and A. V. Thakor (2000): “Can Relationship banking Survive Com-petition?,” Journal of Finance, 55, 679—713.
Carletti, E. (2004): “The structure of bank relationships, endogenous monitoring,and loan rates,” Journal of Financial Intermediation, 13, 58—86.
Degryse, H., and S. Ongena (2004): “The Impact of Competition on Bank Orienta-tion and Specialization,” Discussion paper, Tilburg University.
Dell’Ariccia, G., and R. Marquez (2004): “Information and Bank Credit Allocation,”Journal of Financial Economics, 72, 185—214.
Detragiache, E., P. Garella, and L. Guiso (2000): “Multiple versus Single BankingRelationships: Theory and Evidence,” Journal of Finance, 55, 1133—1161.
Eklund, T., K. Larsen, and E. Bernhardsen (2001): “Model for analysing credit riskin the enterprise sector,” Norges Bank, Economic Bulletin, 72(3), 99—106.
Elsas, R. (2005): “Emprical Determinants of Relationship Lending,” Journal ofFinancial Intermediation, 14, 32—57.
Gorton, G., and A. Winton (2003): “Financial Intermediation,” in Handbook ofEconomics of Finance, ed. by G. M. Constantinides, M. Harris, and R. M. Stulz.North-Holland, Amsterdam.
Hauswald, R., and R. Marquez (2004): “Competition and strategic informationacquisition in credit markets,” Manuscript, Robert H. Smith School of Business,University of Maryland.
30
Kim, M., E. G. Kristiansen, and B. Vale (2005): “Endogenous product differentiationin credit markets: What do borrowers pay for?,” Journal of Banking and Finance,29, 681—699.
Krishna, V. (2002): Auction Theory. Academic Press.
Ongena, S., and D. C. Smith (2000): “What determines the number of bank re-lationships? Cross-country evidence,” Journal of Financial Intermediation, 9,26—56.
Petersen, M., and R. Rajan (1995): “The effect of credit market competition onlending relationships,” Quarterly Journal of Economics, 110, 406—443.
Rajan, R. G. (1992): “Insiders and Outsiders, the Choice Between Informed andArm’s-length Debt,” Journal of Finance, 47, 1367—1400.
Sharpe, S. A. (1990): “Asymmetric information, bank lending, and implicit con-tracts: A stylized model of customer relationships,” Journal of Finance, 45, 1069—1087.
Stiglitz, J. E., and A. Weiss (1981): “Credit Rationing in Markets with ImperfectInformation,” American Economic Review, 71, 393—410.
Syversten, B.-D. (2004): “How accurate are credit risk models for Norwegian firms?,”Norges Bank, Economic Bulletin, LXXV, Forthcoming.
Thakor, A. (1996): “Capital requirements, monetary policy and aggregate banklending: Theory and empirical evidence,” Journal of Finance, 51, 279—324.
von Thadden, E.-L. (2004): “Asymmetric Information, Bank Lending, and ImplicitContracts: The Winner’s Curse,” Finance Research Letters, 1, 11—23.
Williamson, S. D. (1987): “Costly monitoring, loan contracts, and equilibrium creditrationing,” Quarterly Journal of Economics, 102, 135—145.
31