measures of vocal function during changes in vocal effort level
TRANSCRIPT
Journal of Voice Vol. 9. No. 4, pp. 429--438 e3 1995 Lippincott-Raven Publishers. Philadelphia
Measures of Vocal Function During Changes in Vocal Effort Level
Daniel Zaoming Huang, Fred D. Minifie, tHidelzi Kasuya, and *Sarah Xiao Lin
Department of Speech and Hearing Sciences, University of Washington, and *Tiger Electronics, Inc., Seattle, Washington, U.S.A.; and tDepartment of Electrical and Electronic Engineering, Utsunomiya University,
Utsunomiya, Japan
Summary: The purpose of this article is to present the results of a controlled study of the day-to-day variabilities of three acoustic parameters (jitter, shim- mer, and normalized noise energy), and two electroglottographic parameters (contact quotient and contact quotient perturbation) for vowels produced at three vocal efforts (low, normal, high). Data were obtained with use of a sophisticated bilinear interpolation pitch detection method. A repeated mea- sures design required subjects to produce the vowels/2e/and/a/five times a day over 3 days at each vocal effort level. The jitter, shimmer, and normalized noise energy values from acoustic measures and contact quotient and contact quotient perturbation values varied significantly among the three vocal effort levels. The clinical implication of this finding is that vocal effort must be controlled in order to obtain consistent clinical measures. Furthermore, day- to-day variability must be taken into account if representative measures are to be obtained for clinical use. Key Words: Jitter--Shimmer--Glottal noise-- Perturbation--Contact quotient--Contact quotient perturbation--Vocal ef- for t-Vocal function--Pitch period detection.
Scientists have long known that clinical use of acoustic and electroglottographic (EGG) measures provides a convenient and noninvasive way to eval- uate laryngeal function (1-6). The three acoustic perturbation measures that have received the most at tention in the l i terature as indicators of vocal function are cycle- to-cycle variations in fundamen- tal period (jitter), cycle-to-cycle variations in peak- to-peak amplitude (shimmer), and normalized noise energy (NNE) (7,8). There are four EGG measures that also provide useful information about normal and pathological vocal funct ion. The four EGG measures are contact quotient (CQ), the percentage of time the vocal folds are in contact (closed) during each cycle of vocal fold vibration, contact quotient
Accepted October 25, 1994. Address correspondence and reprint requests to D. Z. Huang,
Department of Speech and Hearing Sciences, University of Washington, JG-15, Seattle, WA 98195, U.S.A.
per turbat ion (CQP), which is the cyc le - to-cyc le variation in contact quotient (CQ), cycle- to-cycle fundamental period variations from the EGG signal (EGG-jitter), and cycle-to-cycle peak-to-peak vari- ations from the EGG signal (EGG-shimmer) (2,9, I0). The usefulness of such measures as indicators of vocal function is dependent upon their reliability and the sensitivity of the measures to changes in vocalizations. Previous studies have looked at in- trasubject variability of vocal j i t ter in voice signals from day to day (11,12), the relationship of vocal j i t ter to voice intensi ty levels (13), vocal j i t t e r changes with the aging voice (14), and differences in vocal j i t ter from vowel to vowel (15). Similar stud- ies need to be done to indicate the relative stability of each of the acoustic measures and EGG mea- sures used to evaluate vocal function.
Accurate characterizat ion of acoustic and EGG measures is essential not only in the evaluation of vocal pathologies, but also in the accurate modeling
429
430 D. Z. HUANG ET AL.
of the voice source for the speech synthesis (16). Two of the major questions about acoustic mea- sures and EGG measures remain unresolved: (a) how do these measures change with changes in vo- cal effort level, and (b) what is the day-to-day vari- ability in these measures? A better understanding of the variability of voice perturbation of normal speakers at different vocal efforts over time is needed, therefore, before the use of acoustic mea- sures and EGG measures can be used appropriately as clinical measures for voice assessments.
There are three purposes for this study: (a) to introduce a bilinear interpolation pitch detection method, (b) to use the new pitch period detection method to evaluate the stability of acoustic and EGG measures of vocal function during changes in vocal effort level, and (c) to evaluate the stability of such measures from day to day. Therefore, before discussing the data from analyses of normal vowel production, this article will provide a discussion of the development and evaluation of the accuracy of the bilinear interpolation algorithm for application to quasi-periodic signals.
METHOD OF ANALYSIS
Algorithm and terminology If acoustic and EGG measures are to be used as
indicators of laryngeal function, it is crucial to have an accurate cycle-to-cycle pitch period detection method. This is because nearly all aspects of acous- tic and EGG measures are based on the accuracy of pitch detection. For example, since perturbation measures rely on the accurate identification of each pitch period, measures of jitter and shimmer are dependent on the precision of pitch period detec- tion. Similarly, the detection of glottal noise re- quires an accurate pitch period marker in order to match adjacent waveshape cycles.
Various fundamental frequency (Fo) extraction methods have been summarized by Hess (17). They can be classified in two major categories: (a) event- detection methods, such as the peak-picking and zero-crossing methods; and (b) short-time averag- ing methods, such as autocorrelation, minimal dis- tances, amplitude magnitude difference function, cepstral analysis, and harmonic compress ion. Milenkovic (18) found that greater reliability and accuracy could be obtained by matching the entire waveshape across adjacent cycles rather than by identifying isolated events, like zero-crossing and
peak-picking. Kasuya et al. (8) developed a rather accurate pitch detection method based on a cycle- to-cycle average magnitude difference function (AMDF). This pitch detection method compares the sampled data points from one cycle of the wave- form with those from adjacent cycles.
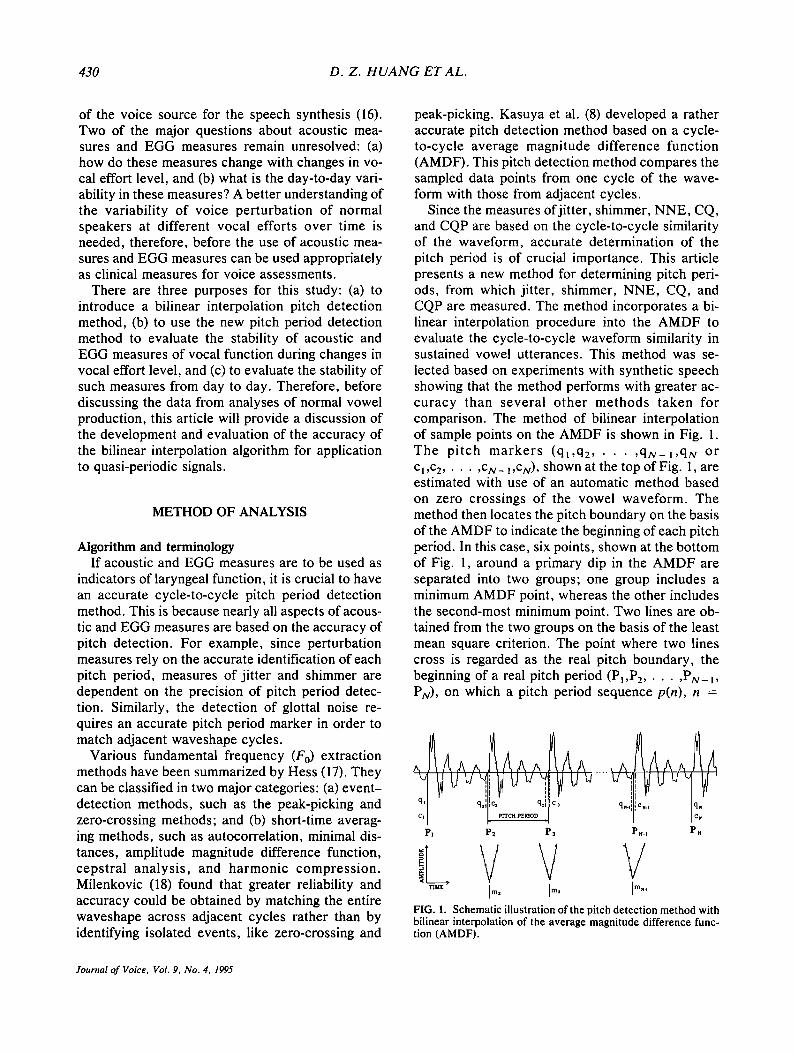
Since the measures of jitter, shimmer, NNE, CQ, and CQP are based on the cycle-to-cycle similarity of the waveform, accurate determination of the pitch period is of crucial importance. This article presents a new method for determining pitch peri- ods, from which jitter, shimmer, NNE, CQ, and CQP are measured. The method incorporates a bi- linear interpolation procedure into the AMDF to evaluate the cycle-to-cycle waveform similarity in sustained vowel utterances. This method was se- lected based on experiments with synthetic speech showing that the method performs with greater ac- curacy than several other methods taken for comparison. The method of bilinear interpolation of sample points on the AMDF is shown in Fig. I. The pi tch markers (ql,q2 . . . . . q N - I , q N or ct,c2 . . . . . cN_ ~,cN), shown at the top of Fig. 1, are estimated with use of an automatic method based on zero crossings of the vowel waveform. The method then locates the pitch boundary on the basis of the AMDF to indicate the beginning of each pitch period. In this case, six points, shown at the bottom of Fig. l, around a primary dip in the AMDF are separated into two groups; one group includes a minimum AMDF point, whereas the other includes the second-most minimum point. Two lines are ob- tained from the two groups on the basis of the least mean square criterion. The point where two lines cross is regarded as the real pitch boundary, the beginning of a real pitch period (Pj,P2 . . . . . PN- l, PN), on which a pitch period sequence p(n), n =
, 1 PcHpooo Pi P2 P3 PN-~ PN
V V Y FIG, 1. Schematic illustration of the pitch detection method with bilinear interpolation of the average magnitude difference func- tion (AMDF).
Journal of Voice, Vol. 9, No. 4, 1995
MEASURES OF VOCAL FUNCTION 431
1,2 . . . . . N, is defined as an interval of (P,+I - Pn). A p e a k - t o - p e a k a m p l i t u d e a(n) , n = 1,2 . . . . . N, is obtained by finding a peak-to-peak amplitude value within each pitch period.
For a sequence x(n), n = 1,2 . . . . . M, the per- turbation quotient [PQ (%)] is, in general, defined as
M - k + l 100
P Q - M - k + I Z n= 1
k * x ( n + m - 1) 1 -
k
Z x(n + j - I) j = l
(i)
where k is the length of moving average (an odd integer >1) and m = (k + 1)/2. In our system k = 5 and m = 3. If x(n) is the pitch period p(n) of the acoustic signal, then PQ is the pitch period pertur- bation quotient (jitter), and if x(n) is the peak-to- peak amplitude a(n) of the acoustic signal, then PQ is the peak-to-peak amplitude PQ (shimmer). Ifx(n) is the contact quotient sequence of the EGG signal, then PQ is the CQP quotient.
These jitter and shimmer values are measured from the pitch period and peak-to-peak amplitudes, respectively. More than 50 cycles were used for each perturbation analysis, beyond the number of cycles recommended by Titze et al. (13). Only seg- ments that had pitch period fluctuations within 10% in either a positive or negative direction of the mean pitch period (calculated in milliseconds) were ana- lyzed. This criterion was used so that only very steady waveform segments would be analyzed for all subjects, thus minimizing variability due to se- lection of cycles for analysis. If no segment consist- ing of at least 50 cycles could be found to fit this cnterron, no perturbation values were computed for that vowel production. Less than 1% of the normal vowel prolongations were rejected by following this criterion. This criterion is more problematic in anal- yses of pathological voices because some abnormal voices have relatively few stable segments with pitch period fluctuations within 10% of the mean pitch period. Such extremely variant voices cannot be analyzed, because the nonlinear aberrations in perturbation measures yield results that cannot be interpreted meaningfully. Accuracy of the new pitch detection method will be discussed with syn- thesized steady vowels later.
With r e spec t to the EGG-j i t te r and EGG- shimmer, Haji et al. (19) found that the EGG-jitter
was nearly equivalent to the jitter and shimmer ob- tained from acoustic signal, so that the EGG-jitter and EGG-shimmer data are not reported here. The CQ measure from the EGG signal provides unique information about the percentage of each cycle of vocal fold vibration during which the vocal folds are in contact (closed). This information is, for the most part, invisible to other available techniques (20). The CQP measure provides precise information about the rate, symmetry, and regularity of the vo- cal fold contact phase during vocal fold vibration (21). It is for these reasons that the CQ and CQP measures were chosen in our study. Rothenberg and Mahshie (21) suggested the use of variable baseline crossings with interpolation of a criterion level to demarcate the EGG contact phase. In the present study, a baseline of 25% of the peak-to-peak EGG amplitude of each wave is associated with the EGG minimal contact phase and is selected for measuring the CQ and CQP.
The method of noise energy measurement used in this experiment provides more insight into pertur- bation measurement. The relative magnitude of noise included in the voice signal is evaluated with use of an acoustic measurement, NNE, described by Kasuya et al. (8). We have chosen to use the NNE measure because it can differentiate among normal and pathological voices more sensitively than does the harmonic-to-noise ratio (8,22). An adaptive comb filtering method is used in NNE for estimating vocal noise in normal and pathological voices. (This procedure was initially investigated for the enhancement of degraded speech due to ad- ditive white noise.) The NNE (decibels) is given by the equation:
w(n) z
n
NNE = I0 log Z x(n)2
n
+ BL (2)
where w(n) and x(n) are, respectively, an estimated vocal turbulent noise component and an original voice waveform, and BL is a constant for compen- sating for the amount of noise energy removed by the comb filter, as described by Kasuya et al. (8).
Test signals The accuracy of the pitch detection method was
tested with use of periodic synthesized signals with-
Journal o f Voice, Vol. 9, No. 4, 1995
432 D. Z. HUANG ET AL.
out additive noise, which were produced by the fol- lowing equation:
M [2wnk ) y(n) = E A(k)sinL-- f - + q~(k)
k=l
(3)
where A(k) is the amplitude of k-th harmonic com- ponent that simulates a vowel/ae/as in "ba t , " d~(k) is the phase of k-th harmonic component, M is the number of harmonics, and T is the normalized pitch period (points). In our experiment, d~(k) = 0 and M = 23. T is defined by the following equation:
T = F s x P (4)
where F S is the sampling frequency (44 kHz), and P is the pitch period in seconds. For simulating a child voice, T is allowed to vary from 133 to 134 points with a step 0.2, which corresponds to a change from 3.325 to 3.35 ms. For simulating a female voice, T is allowed to vary from 174 to 175 points, which cor- responds to a change from 4.35 to 4.375 ms. Simi- larly, for simulating a male voice, T is allowed to vary from 333 to 334 points, corresponding to a change from 8.325 to 8.35 ms.
Accuracy of the pitch detection methods In the present study, two interpolation methods
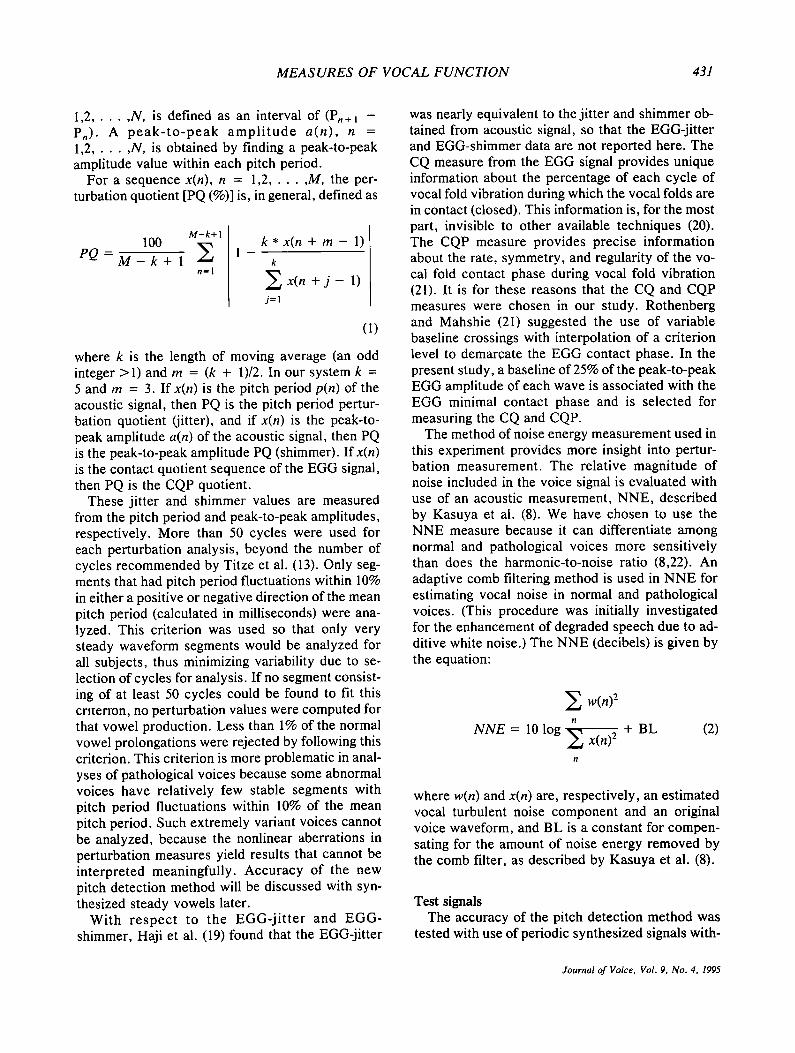
were applied to the AMDF in order to determine the most precise method of pitch period extraction. The two methods employed were parabolic interpola- tion and interpolation with bilinear approximation. Measures obtained with use of these interpolation methods were compared to measures derived from the AMDF when no interpolation was employed. Results showing the accuracy of the pitch detection method, with and without interpolation, are pro- vided in Table 1.
Results obtained from test signals, which include constant pitch periods from integer multiples and noninteger multiples, allow us to draw the following conclusions about pitch period detection. First, the standard deviations of data obtained via the para- bolic and bilinear interpolation methods were al- ways smaller than the standard deviation when no interpolation was used. The second observation from Table 1 is that the bias of the interpolation methods was generally smaller than the bias ob- tained with the "no interpolation" method. Third, the bias of bilinear interpolation method was always smaller than the bias obtained with the parabolic method. Thus, it appears clear from Table 1 that the
TABLE 1. Comparison o f accuracy o f the pitch extraction method with or without interpolation on the
average magnitude difference fimction
Pitch period error (point)
Parabolic Bilinear No int. int. int.
Pitch period (point) Bias SD Bias SD Bias SD
133.0 .032 .183 .001 .001 .000 .000 133.2 .007 .402 .077 .078 .004 .006 133.4 .013 .495 .069 .070 .001 .004 133.6 .013 .495 .065 .066 .005 .006 133.8 .007 .402 .073 .075 .009 .010 134.0 .032 .183 .00! .001 .000 .000 174.0 .032 .183 .001 .001 .000 .000 174.2 .020 .402 .072 .073 .012 .011 174.4 .013 .495 .064 .065 .010 .010 174.6 .013 .495 .070 .072 .007 .007 174.8 .007 .402 .078 .080 .004 .005 175.0 .032 .183 .003 .003 .000 .000 333.0 .032 .183 .001 .001 .000 .000 333.2 .027 .385 .076 .077 .001 .003 333.4 .021 .494 .067 .069 .001 .002 333.6 .014 .501 .066 .067 .002 .002 333.8 .007 .412 .074 .076 .002 .005 334.0 .035 .189 .001 .001 .000 .000 Mean .020 .360 .048 .049 .003 .004
Bias is the difference of an average of measured pitch periods from the true value, and SD is the standard deviation of mea- sured pitch period values, lnt,, interpolation.
bilinear method is more accurate than the parabolic method. In addition, Table l indicates that both of the interpolation methods are more accurate than the results obtained with no interpolation.
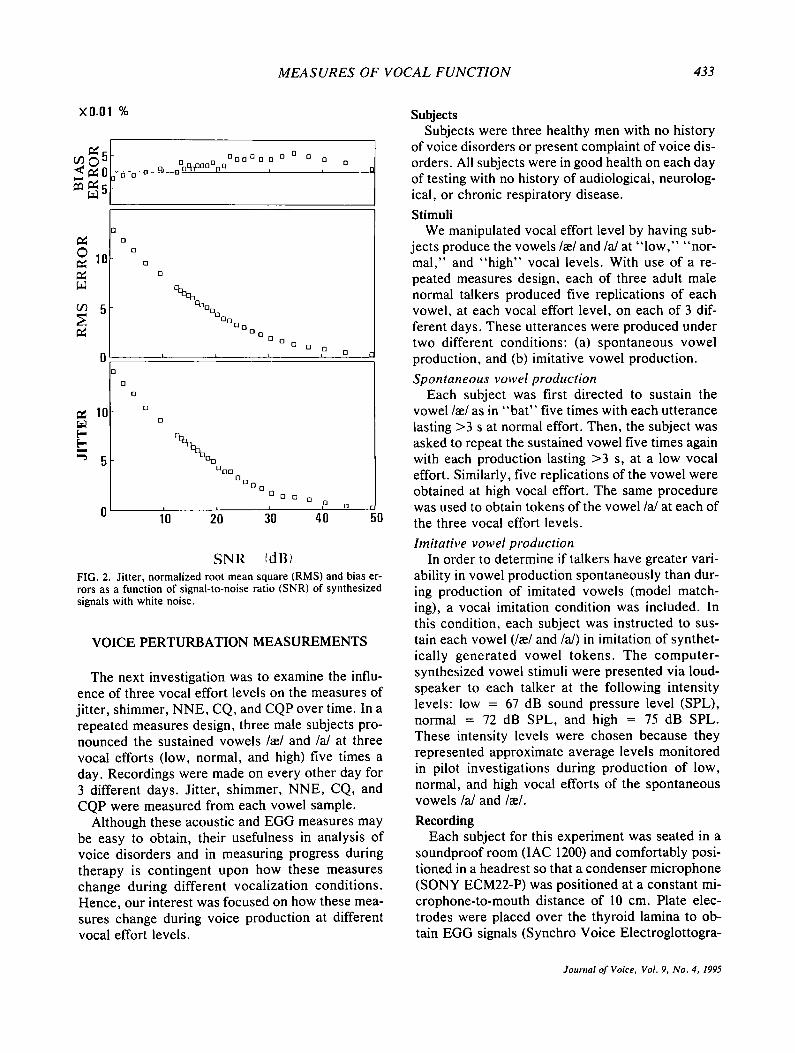
In order to estimate the sensitivity of the bilinear interpolation method of pitch measurement, white- noise signals were scaled appropriately and then added point-for-point with the above periodic syn- thesized signals y(n). As the signal-to-noise ratio (SNR) decreased, reflected by increasing the amount of white noise added point-for-point on syn- thesized signals, jitter and the value of normalized root mean square (RMS) error of the pitch period clearly increased, as shown in Fig. 2. It is also clear that variations in jitter imposed by noise are rela- tively small when SNRs are >45 dB. These data provide support for the use of a bilinear interpola- tion of the AMDF as a pitch detection algorithm. It appears to be an accurate method for pitch period measurement.
Therefore, in this study, pitch detection for both acoustic and EGG signals was obtained by in- corporating bilinear interpolation of sample data points on the AMDF. Perturbation measures were obtained with use of a 5-point moving average procedure.
Journal of Voice, Vol. 9, No. 4, 1995
MEASURES OF VOCAL FUNCTION 433
XO.OI %
0 0 0 0 0 0 0 0 0 o%000000 o o o, ~, i i ol 0 ~
p~ ©
10
5 p~
0 0
I • 0 0 0 0 0 0 0 0 0 O 0 n 0
L I i 0 0
,,~ 10 [.-
5
O
13
0 10 50
n o 0
0 0 0 0
[] 0 [ ] 0 0
20 30 40
S N R IdB) FIG. 2. Jitter, normalized root mean square (RMS) and bias er- rors as a function of signal-to-noise ratio (SNR) of synthesized signals with white noise.
VOICE PERTURBATION MEASUREMENTS
The next investigation was to examine the influ- ence of three vocal effort levels on the measures of jitter, shimmer, NNE, CQ, and CQP over time. In a repeated measures design, three male subjects pro- nounced the sustained v o w e l s / ~ e / a n d / a / a t three vocal efforts (low, normal, and high) five times a day. Recordings were made on every other day for 3 different days. Jitter, shimmer, NNE, CQ, and CQP were measured from each vowel sample.
Although these acoustic and EGG measures may be easy to obtain, their usefulness in analysis of voice disorders and in measuring progress during therapy is contingent upon how these measures change during different vocalization conditions. Hence, our interest was focused on how these mea- sures change during voice production at different vocal effort levels.
Subjects Subjects were three healthy men with no history
of voice disorders or present complaint of voice dis- orders. All subjects were in good health on each day of testing with no history of audiological, neurolog- ical, or chronic respiratory disease.
Stimuli We manipulated vocal effort level by having sub-
jects produce the vowels &e/ and /a/ at " low," "nor- mal," and "high" vocal levels. With use of a re- peated measures design, each of three adult male normal talkers produced five replications of each vowel, at each vocal effort level, on each of 3 dif- ferent days. These utterances were produced under two different conditions: (a) spontaneous vowel production, and (b) imitative vowel production.
Spontaneous vowel production Each subject was first directed to sustain the
vowel &e/as in "ba t " five times with each utterance lasting >3 s at normal effort. Then, the subject was asked to repeat the sustained vowel five times again with each production lasting >3 s, at a low vocal effort. Similarly, five replications of the vowel were obtained at high vocal effort. The same procedure was used to obtain tokens of the vowel /a /a t each of the three vocal effort levels.
hnitative vowel production In order to determine if talkers have greater vari-
ability in vowel production spontaneously than dur- ing production of imitated vowels (model match- ing), a vocal imitation condition was included. In this condition, each subject was instructed to sus- tain each vowel (/~e/ and /a/) in imitation of synthet- ically generated vowel tokens. The computer- synthesized vowel stimuli were presented via loud- speaker to each talker at the following intensity levels: low = 67 dB sound pressure level (SPL), normal = 72 dB SPL, and high = 75 dB SPL. These intensity levels were chosen because they represented approximate average levels monitored in pilot investigations during production of low, normal, and high vocal efforts of the spontaneous vowels/a/and/~e/.
Recording Each subject for this experiment was seated in a
soundproof room (IAC 1200) and comfortably posi- tioned in a headrest so that a condenser microphone (SONY ECM22-P) was positioned at a constant mi- crophone-to-mouth distance of 10 cm. Plate elec- trodes were placed over the thyroid lamina to ob- tain EGG signals (Synchro Voice Electroglottogra-
Journal of Voice, Vol. 9, No. 4, 1995
434 D. Z. H U A N G ET AL.
phy). During the recording of both acoustic and EGG signals into a computer, no attempt was made to control Fo at any of the vocal efforts, although F o remained reasonably constant throughout produc- tion of sustained vowels at each vocal effort level. F 0 did not vary greatly from one vocal effort level to another.
Analysis of samples Each vocal token produced by the subjects in this
experiment was digitized at a sampling frequency of 22,050 Hz/channel, with an accuracy of 16 bits/ sample and analyzed by using the software Voice Evaluation and Therapy (VET 2.00, Tiger Electron- ics) (10). Only the middle portions of the vowel at each vocal effort were used for analysis. Following bilinear interpolation of the AMDF, jitter, shimmer, and NNE were obtained from the acoustic signals, and CQ and CQP from the EGG signals.
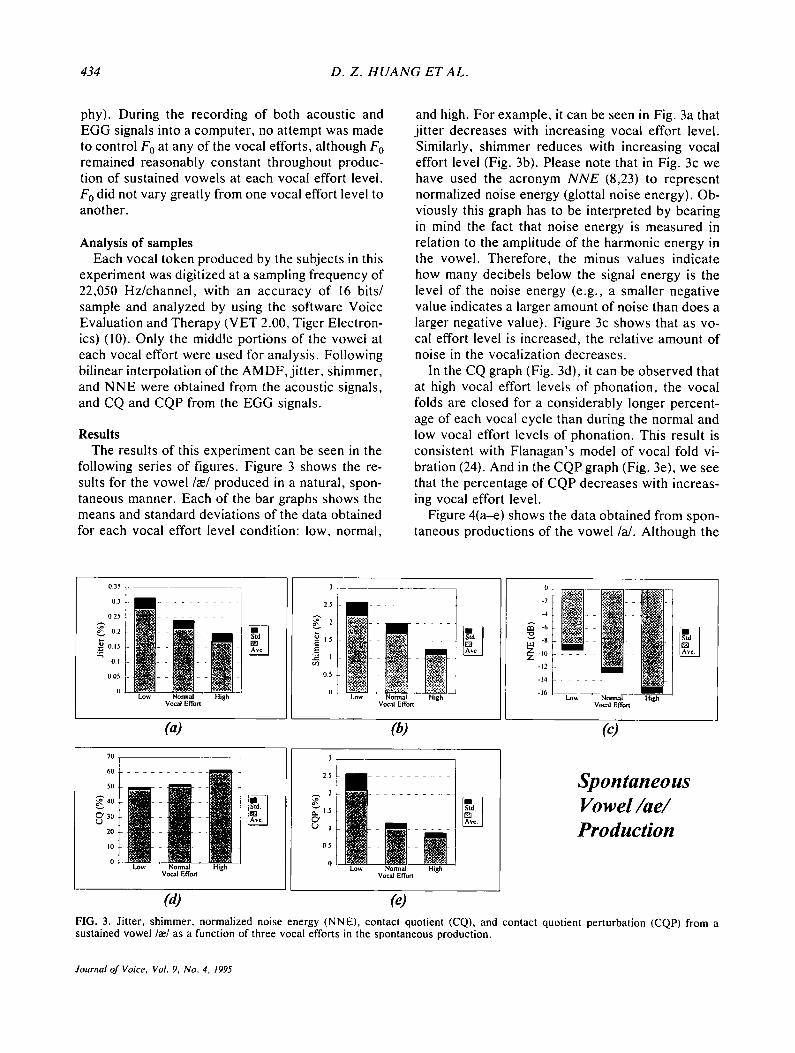
Results The results of this experiment can be seen in the
following series of figures. Figure 3 shows the re- suits for the vowel/~e/produced in a natural, spon- taneous manner. Each of the bar graphs shows the means and standard deviations of the data obtained for each vocal effort level condition: low, normal,
and high. For example, it can be seen in Fig. 3a that jitter decreases with increasing vocal effort level. Similarly, shimmer reduces with increasing vocal effort level (Fig. 3b). Please note that in Fig. 3c we have used the acronym N N E (8,23) to represent normalized noise energy (glottal noise energy). Ob- viously this graph has to be interpreted by bearing in mind the fact that noise energy is measured in relation to the amplitude of the harmonic energy in the vowel. Therefore, the minus values indicate how many decibels below the signal energy is the level of the noise energy (e.g., a smaller negative value indicates a larger amount of noise than does a larger negative value). Figure 3c shows that as vo- cal effort level is increased, the relative amount of noise in the vocalization decreases.
In the CQ graph (Fig. 3d), it can be observed that at high vocal effort levels of phonation, the vocal folds are closed for a considerably longer percent- age of each vocal cycle than during the normal and low vocal effort levels of phonation. This result is consistent with Flanagan's model of vocal fold vi- bration (24). And in the CQP graph (Fig. 3e), we see that the percentage of CQP decreases with increas- ing vocal effort level.
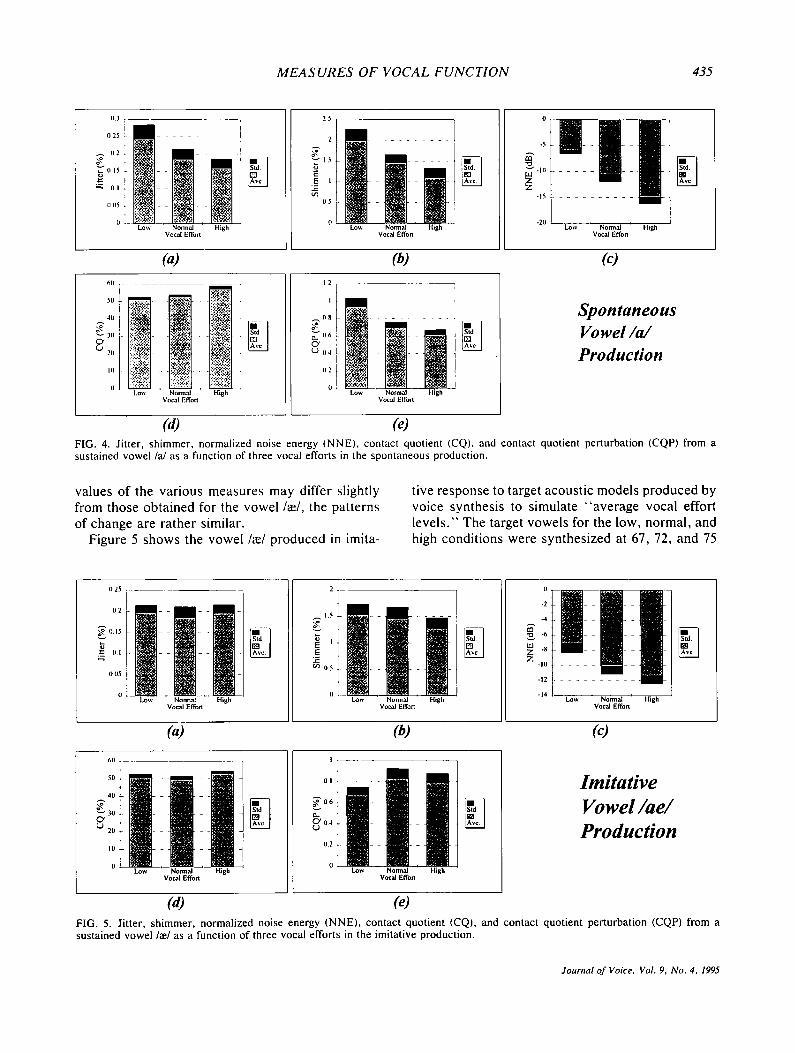
Figure 4(a---e) shows the data obtained from spon- taneous productions of the vowel/a/. Although the
035
03
025
~'- 02
~ 0 1 5
OI
o 05
o Low Normal High
Vocal Effort
3
2.5
~ 2
05
o
Vocal Effort
o
-2
-4
-10
-12
- I I
-16 Lo~ Normal Hzgh
Vocal Effon
(c)
7O
6O
5O
20
10
o i l l Lob Normal High
Vocal Effon
3
25
2
115
0 Lov,. Normal High
Vocal Effort
Spontaneous Vowel/ae/ Production
(d) (e) FIG. 3. Jitter, shimmer, normalized noise energy (NNE), contact quotient (CQ), and contact quotient perturbation (CQP) from a sustained vowel I~el as a function of three vocal efforts in the spontaneous production.
Journal of Voice, Vol. 9, No. 4, 1995
MEASURES OF VOCAL FUNCTION 435
0 3
o 25
{I 2
(115
OI
o o5
{I Low Normal High
Vocal Effort
"l
2 5 o
- - i t)
~ -t5 . . . . . . . 0 5
0 - - 2 D .
L .... v ~ow ~ o ~ a l r t
60
I (I •
0 Lot~ Normal
Vocal Effort
l
High
12
08
( ' ~ 0 4 1
(12 t
(I ! Low Normal High
Vocal Effort
"t Spontaneous Vowel~a~ Production
(d) (e) FIG. 4. Jitter, shimmer, normalized noise energy (NNE), contact quotient (CQ), and contact quotient perturbation (CQP) from a sustained vowel/aJ as a function of three vocal efforts in the spontaneous production.
values of the various measures may differ slightly from those obtained for the vowel/~e/, the patterns of change are rather similar.
Figure 5 shows the vowel/~e/produced in imita-
tive response to target acoustic models produced by voice synthesis to simulate "average vocal effort levels." The target vowels for the low, normal, and high conditions were synthesized at 67, 72, and 75
o 25
, ~ 0.15
0 I -
OO5
~ " v ? ~ - o r t H,gh
2
~ 1 5
"S
-r- ~ 0 5
{I !v!!!
0
-t2 . . . . . . . .
14 Low V oNeaOln~o rt H,gh
(a) ~ (c) 6(1 , - I
5 o ~ f f ! og Imitative 40 I 706 0~ ~ Vowel/ae/ ~3°i ~04 2o L Production 10 ~- 0 2
0 L - 0 . * .
Vocal Effort Vocal Effort
(a) (e) FIG. 5. Jitter, shimmer, normalized noise energy (NNE), contact quotient (CQ), and contact quotient perturbation (CQP) from a sustained vowel /m/as a function of three vocal efforts in the imitative production.
Journal of Voice. Vol. 9, No. 4, 1995
436 D. Z. H U A N G ET AL.
0 2 5
0 . 1 5 - - "S
0.05 . . . . ! H 2 0
° ~ 0 5 - - -4 ..
o -5 Lot',. Normal Lov,,
Vocal Effort
. . . . . i i
N o r m a l High V o c a l Effon
(a) (/,) (c)
6 0 0 8
0 . 6
411
~ 0 2 0 ~ r O
0 2
10
0 0 . t
V o c a l E f f o r t
Imitative Vowel~a~ Production
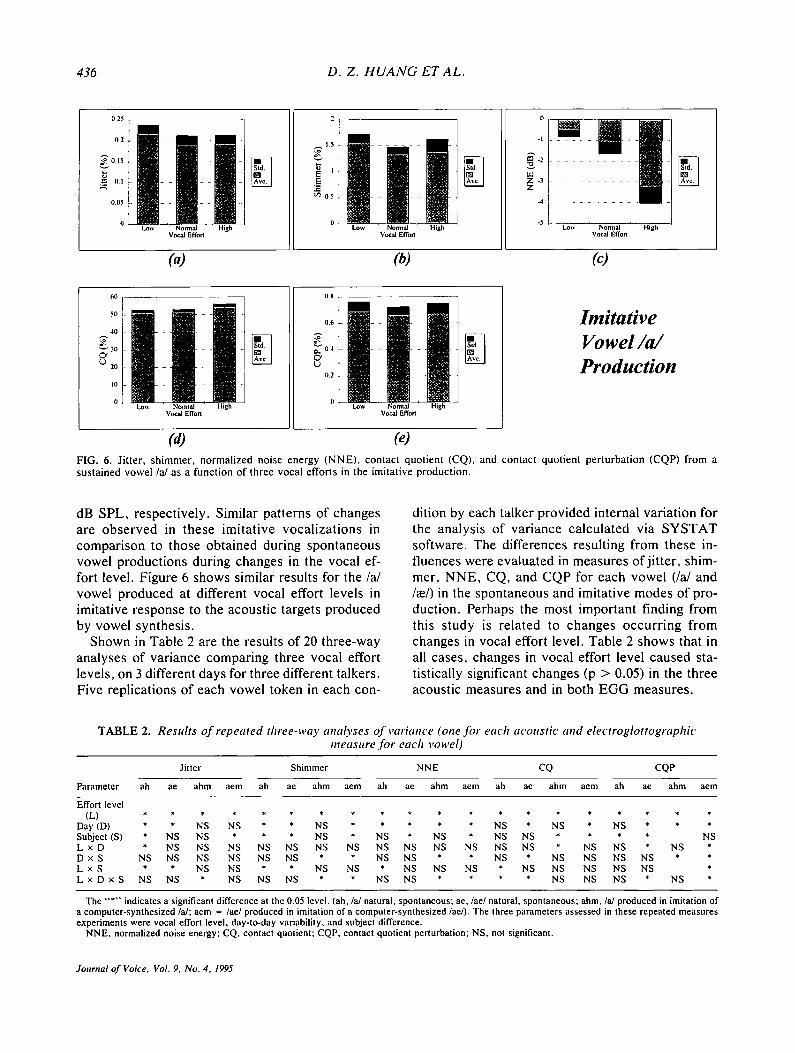
(a) (e) F I G . 6. J i t t e r , s h i m m e r , n o r m a l i z e d n o i s e e n e r g y ( N N E ) . c o n t a c t q u o t i e n t ( C Q ) , a n d c o n t a c t q u o t i e n t p e r t u r b a t i o n ( C Q P ) f r o m a
s u s t a i n e d v o w e l / a / a s a f u n c t i o n o f t h r e e v o c a l e f f o r t s in t he i m i t a t i v e p r o d u c t i o n .
dB SPL, respectively. Similar patterns of changes are observed in these imitative vocalizations in comparison to those obtained during spontaneous vowel productions during changes in the vocal ef- fort level. Figure 6 shows similar results for the/a/ vowel produced at different vocal effort levels in imitative response to the acoustic targets produced by vowel synthesis.
Shown in Table 2 are the results of 20 three-way analyses of variance comparing three vocal effort levels, on 3 different days for three different talkers. Five replications of each vowel token in each con-
dition by each talker provided internal variation for the analysis of variance calculated via SYSTAT software. The differences resulting from these in- fluences were evaluated in measures of jitter, shim- mer, NNE, CQ, and CQP for each vowel (/a/and /~e/) in the spontaneous and imitative modes of pro- duction. Perhaps the most important finding from this study is related to changes occurring from changes in vocal effort level. Table 2 shows that in all cases, changes in vocal effort level caused sta- tistically significant changes (p > 0.05) in the three acoustic measures and in both EGG measures.
T A B L E 2. Results o f repeated three-way analyses o f variance (one for each acoustic and electroglottographic measure fi)r each vowel)
Ji t ter Shimmer N N E CQ CQP
Parameter ah ae ahm aem ah ae ahm aem ah ae ahm aem ah ae ahm aem ah ae ahm aem
E f f o ~ l e v e l (L) * * * * * * * * * * * * * * * * * * * *
D a y ( D ) * * NS NS * * NS * * * * * NS * NS * NS * * * S u ~ e c t ( S ) * NS NS * * * NS * NS * NS * NS NS * * * * NS L x D * NS NS NS NS NS NS NS NS NS NS NS NS NS * NS NS * NS * D x S NS NS NS NS NS NS * * NS NS * * NS * NS NS NS NS * * L x S * * NS NS * * NS NS * NS NS NS * NS NS NS NS NS * L x D x S NS NS * NS NS NS * * NS NS * * * * NS NS NS * NS *
The "'*" indicates a significant difference at the 0.05 level. (ah, /a/ natural, spontaneous; a e , / a e / n a t u r a l , spontaneous; ahm, /a/ produced in imitat ion of a compute r - syn thes ized /a / ; aem = / ae /p roduced in imitat ion of a computer-synthes ized/ae / ) . The three parameters assessed in these repeated measures exper iments were vocal effort level , day-to-day variabil i ty, and subject difference.
N N E , normalized noise energy; CQ, contact quot ient ; CQP, contact quotient per turbat ion; NS, not significant.
Journal of Voice, Vol. 9. No. 4, 1995
MEASURES OF VOCAL FUNCTION 437
DISCUSSION
In this paper, we have discussed the development of a computer program for the measurement of vo- cal pitch perturbation, peak-to-peak amplitude per- turbation, normalized noise energy, contact quo- tient, and contact quotient perturbation (jitter, shimmer, NNE, CQ, and CQP, respectively) on the basis of pitch detection methods using interpolation of the AMDF. Both parabolic and bilinear interpo- lation methods of the AMDF were evaluated in pilot investigations. Both of these methods provide an obvious advantage for the estimation of pitch period when compared with the "no interpolation" condi- tion. If a relatively low sampling rate is used, such as 11,025 Hz, interpolations will provide an even greater advantage over procedures requiring no interpolation.
Our primary interest was to investigate the influ- ence of vocal effort level during vowel production on perturbations of j i t ter and shimmer, glottal noise, CQ, and CQP measurements and to study the day-to-day variability of each influence. We ob- served consistent effects of vocal effort level, namely that the high vocal effort condition pro- duced the lowest values for each measure. As a result of our "every-other-day" sampling proce- dure for obtaining the jitter, shimmer, NNE, CQ, and CQP values associated with the three vocal ef- forts, we observed that, in most cases, these mea- sures varied significantly from day to day. Two hy- potheses may be proposed: either the actual vocal effort levels used by the talkers varied from day to day or the subjects were variant in the amount of perturbation employed at the same vocal effort level from day to day. The first hypothesis seems to be supported by the trend of fewer significant dif- ferences among measures of imitated vocalizations from day to day.
The first conclusion to be drawn from these data is that it is very important to control vocal effort level when analyzing vocalizations for research or clinical purposes. Widely variant measures of jitter, shimmer, NNE, CQ, and CQP can be obtained from the same talker merely by having the talker produce the same vowel at different levels of vocal effort. It appears that standardization of vocalization in terms of vocal effort level will be required before intra- and intersubject comparisons will be useful (meaningful). We assume that the same conclusion would apply to vocalizations produced by healthy and pathological subjects. On the other hand, it ap-
pears reasonable to analyze only very steady utter- ances from subjects in order to get a better approx- imation of a speaker's typical perturbation values. This criterion may make it impossible to measure the vowel productions of some pathological speak- ers. As Titze et al. (13) have suggested, it appears best to use a voice sample of at least 20-30 cycles in duration when measuring jitter and shimmer in healthy speakers. A smaller sample provides an in- sufficient number of cycles for calculating pertur- bation data. Whether or not 20-30 cycles is suffi- cient with some, or all, pathological speakers is un- certain. What is clear is that a sufficiently long sample duration is needed to obtain a stable esti- mate of perturbation measures. Certainly, longer vowel duration is desirable, but at a cost of in- creased processing time. The results of the present study suggest that more vowel repetitions are help- ful in determining a speaker's typical production of a given vowel. Furthermore, it is our observation that the first vowel produced during a recording ses- sion usually yields the highest amount of variability, presumably because of psychological influences. Letting the subject acclimate to the recording situ- ation during practice trials may be useful in obtain- ing stable performance during vowel production.
By way of suggestions for future research, it should be noted that when tokens are recorded on a high-quality digital audiotape recorder or digitized directly into a computer prior to analysis it appears to have a noticeable and salutary effect on the mea- sures obtained. Poor quality audio recordings intro- duce greater amounts of background noise that con- tribute to measured values of jitter, shimmer, and NNE. We believe future studies should employ di- rect recording into the computer to minimize the effects of audiotape noise, thereby improving the stability of perturbation data reported.
CONCLUSIONS
The take-home message from this experiment is that if these acoustic and EGG measures are to be taken in the clinic and used to compare the patient's performance from one point in time to another, it is important to have the vocalizations produced at the same vocal effort level. Second, as Table 2 shows, in most cases there was variability in these mea- sures from day to day. Thus, it may be important to obtain recordings from several days in order to ob- tain a good indication of "average" subject perfor- mance. Finally, it should be pointed out that this
Journal of Voice, Vol. 9, No. 4, 1995
438 D. Z. HUANG ET AL.
experiment was designed to investigate how these measures varied during vocalizations produced by normal talkers, under the prescribed conditions. It would be of considerable clinical importance to de- termine whether patients with voice disorders pro- duce similar changes. Further investigations with both normal and pathological speakers should begin to provide an answer.
Acknowledgment: We would like to thank Dr. Y. Kiku- chi at Tsukuba Junior College and Dr. Robert Orlikoff at Memphis State University for their suggestions regarding this research project.
REFERENCES
1. Aronson AE. Clinical voice disorders: an interdisciplinary approach. New York: Thieme-Stratton, 1980.
2. Baken RJ. Clinical measurement o f speech and voice. San Diego: College-Hill, 1987.
3. Boone DR, McFarlane S. The voice and voice therapy. 4th ed. Englewood Cliffs, N J: Prentice Hall, 1988.
4. Davis S. Computer evaluation of laryngeal pathology based on inverse filtering of speech. SCRL Monograph 1976:13.
5. Hirano M. Clinical examination o f voice. Wien, New York: Springer-Verlag, 1981.
6. Hirano M. Objective evaluation of the human voice: clinical aspects. Folia Phoniatr (Basel) 1989;41:89-144.
7. Hirano M, Matsushita H, Hiki S. Acoustic analysis for voice disorders: a basic conception for the use of acoustic mea- surements for the diagnosis in voice disorders. Practical Otolal3,ngology (Kyoto) 1976;69:267-71.
8. Kasuya H, Ogawa S, Kikuchi Y. An adaptive comb filtering method as applied to acoustic analyses of pathological voice. Proceedings of International Conference on Acoustics, Speech, and Signal Processing 1986;1:669-72.
9. Huang Z. A review of speech analysis and synthesis system to evaluate pathological voices. Journal o f Shanghai Televi- sion University 1988;10:87-91.
10. Huang Z, Minifie F, Lin X. An integrated clinical program for voice evaluation and therapy. Paper presented at Amer- ican Spech-Language-Hearing Assocaition Conference, San Antonio, Texas, November 1992.
I1. Linville SE. Intraspeaker variability in fundamental fre- quency stability: an age-related phenomenon? J Acoust Soc Am 1988;83:741-5.
12. Higgins MB, Saxman JH. A comparison of intrasubject vari- ation across sessions of three vocal frequency perturbation indices. J Acoust Sac Am 1989;86:91 I-6.
13. Titze 1, Horii Y, Scherer R. Some technical considerations in voice perturbation measurements. J Speech Hear Res 1987;30:252-9.
14. Brown WS, Morris RJ, Micheal JF. Vocal jit ter in young adult and aged female voice. J Voice 1989;3:113-9.
15. Orlikoff RF, Huang Z. Influence of vowel production on acoustic and electroglottographic perturbation measures. Paper presented at American Speech-Language-Hearing As- sociation Conference, Atlanta, Georgia, November 1991.
16. Fant G. Voice source dynamics. Speech Transmission Labs- Quarterly Progress Status Reports 1980;2-3:17-37.
17. Hess W. Pitch determination o f speech signals. Berlin: Springer-Verlag, 1983.
18. Milenkovic P. Least mean square measures of voice pertur- bation. J Speech Heat" Res 1987;30:529-38.
19. Haji T, Horiguchi S, Bear T, Gold WJ. Frequency and am- plitude perturbation analysis of electroglottograph during sustained phonation. J Acoust Soc Am 1986;80:58-62.
20. Orlikoff RF, Baken RJ. Consideration of the relationship between the fundamental frequency of phonation and vocal jitter. Folia Phoniatr (Basel) 1990;42:31--40.
21. Rothenberg M, Mahshie JJ. Monitoring vocal fold abduction through vocal fold contact area. J Speech Heat" Res 1988; 31:338-51.
22. Kasuya H, Zue W, Endo Y. Measurements of laryngeal tur- bulent noise in pathological voice. Paper presented at Amer- ican Speech-Language-Hearing Association Conference, Anaheim, California, November 1993.
23. Kasuya H, Ogawa S. Normalized noise energy as an acous- tic measure to evaluate pathologic voice. J Acoust Soc Am 1986 ;80:1329-34.
24. Flanagan JL. Speech analysis, synthesis and perception. 2rid ed. New York, Berlin: Springer Verlag, 1972.
Journal of Voice, t/ol. 9, No. 4, 1995