mbank sa group - ifrs condensed consolidated financial
TRANSCRIPT
mBank S.A. Group
IFRS Condensed Consolidated Financial Statements for the fourth quarter of 2016
mBank S.A. Group IFRS Condensed Consolidated Financial Statements for the fourth quarter of 2016 PLN (000’s)
2
Contents
Selected financial data ................................................................................................................................ 4
Introduction ................................................................................................................................................ 6
Macroeconomic environment in Q4 2016 ..................................................................................................... 7
Financial position of mBank Group in Q4 2016 .......................................................................................... 11
Performance of segments and the business lines ...................................................................................... 16
Condensed consolidated income statement ............................................................................................... 23
Condensed consolidated statement of comprehensive income .................................................................. 24
Condensed consolidated statement of financial position ........................................................................... 25
Condensed consolidated statement of changes in equity ........................................................................... 26
Condensed consolidated statement of cash flows ...................................................................................... 28
mBank S.A. stand-alone financial information ........................................................................................... 29
Income statement ......................................................................................................................................... 29 Statement of comprehensive income ................................................................................................................ 30 Statement of financial position ........................................................................................................................ 31 Statement of changes in equity ....................................................................................................................... 32 Statement of cash flows ................................................................................................................................. 33 Explanatory notes to the condensed consolidated financial statements .................................................... 34
1. Information regarding the Group of mBank S.A.......................................................................................... 34 2. Description of the relevant accounting policies ........................................................................................... 36 3. Major estimates and judgments made in connection with the application of accounting policy principles............ 61 4. Business segments ................................................................................................................................. 62 5. Net interest income ................................................................................................................................ 67 6. Net fee and commission income ............................................................................................................... 67 7. Dividend income .................................................................................................................................... 68 8. Net trading income ................................................................................................................................. 68 9. Gains and losses from investment securities and investments in subsidiaries and associates ........................... 69 10. Other operating income .......................................................................................................................... 69 11. Net impairment losses on loans and advances ........................................................................................... 70 12. Overhead costs ...................................................................................................................................... 70 13. Other operating expenses ....................................................................................................................... 71 14. Earnings per share ................................................................................................................................. 71 15. Trading securities ................................................................................................................................... 72 16. Derivative financial instruments ............................................................................................................... 72 17. Derivatives held for hedges ..................................................................................................................... 73 18. Loans and advances to customers ............................................................................................................ 74 19. Investment securities ............................................................................................................................. 76 20. Intangible assets .................................................................................................................................... 76 21. Tangible assets ...................................................................................................................................... 76 22. Amounts due to customers ...................................................................................................................... 77 23. Provisions ............................................................................................................................................. 77 24. Assets and provisions for deferred income tax ........................................................................................... 78 25. Fair value of financial assets and liabilities ................................................................................................. 78 26. Capital ratios ......................................................................................................................................... 85 Selected explanatory information .............................................................................................................. 86
1. Compliance with international financial reporting standards ......................................................................... 86 2. Consistency of accounting principles and calculation methods applied to the drafting of the quarterly report
and the last annual financial statements ................................................................................................... 86 3. Seasonal or cyclical nature of the business ................................................................................................ 86 4. Nature and values of items affecting assets, liabilities, equity, net profit/(loss) or cash flows, which are
extraordinary in terms of their nature, magnitude or exerted impact ............................................................ 86 5. Nature and amounts of changes in estimate values of items, which were presented in previous interim periods
of the current reporting year, or changes of accounting estimates indicated in prior reporting years, if they bear a substantial impact upon the current interim period ........................................................................... 87
mBank S.A. Group IFRS Condensed Consolidated Financial Statements for the fourth quarter of 2016 PLN (000’s)
3
6. Issues, redemption and repayment of non-equity and equity securities ......................................................... 87 7. Dividends paid (or declared) altogether or broken down by ordinary shares and other shares .......................... 87 8. Significant events after the end of the fourth quarter of 2016, which are not reflected in the financial
statements ............................................................................................................................................ 87 9. Effect of changes in the structure of the entity in the fourth quarter of 2016, including business combinations,
acquisitions or disposal of subsidiaries, long-term investments, restructuring, and discontinuation of business activities ............................................................................................................................................... 87
10. Changes in contingent liabilities and commitments ..................................................................................... 87 11. Write-offs of the value of inventories down to net realisable value and reversals of such write-offs................... 87 12. Revaluation write-offs on account of impairment of tangible fixed assets, intangible assets, or other assets
as well as reversals of such write-offs ....................................................................................................... 88 13. Revaluation write-offs on account of impairment of financial assets .............................................................. 88 14. Reversals of provisions against restructuring costs ..................................................................................... 88 15. Acquisitions and disposals of tangible fixed asset items ............................................................................... 88 16. Material liabilities assumed on account of acquisition of tangible fixed assets ................................................. 88 17. Information about changing the process (method) of measurement the fair value of financial instruments ........ 88 18. Changes in the classification of financial assets due to changes of purpose or use of these assets .................... 88 19. Corrections of errors from previous reporting periods ................................................................................. 88 20. Default or infringement of a loan agreement or failure to initiate composition proceedings .............................. 88 21. Position of the management on the probability of performance of previously published profit/loss forecasts
for the year in light of the results presented in the quarterly report compared to the forecast .......................... 88 22. Registered share capital .......................................................................................................................... 88 23. Material share packages .......................................................................................................................... 89 24. Change in Bank shares and rights to shares held by managers and supervisors ............................................. 90 25. Proceedings before a court, arbitration body or public administration authority .............................................. 90 26. Off-balance sheet liabilities ...................................................................................................................... 93 27. Transactions with related entities ............................................................................................................. 93 28. Credit and loan guarantees, other guarantees granted in excess of 10% of the equity .................................... 94 29. Other information which the issuer deems necessary to assess its human resources, assets, financial position,
financial performance and their changes as well as information relevant to an assessment of the issuer’s capacity to meet its liabilities ................................................................................................................... 94
30. Factors affecting the results in the coming quarter ..................................................................................... 95 31. Other information................................................................................................................................... 95
mBank S.A. Group IFRS Condensed Consolidated Financial Statements for the fourth quarter of 2016 PLN (000’s)
4
Selected financial data
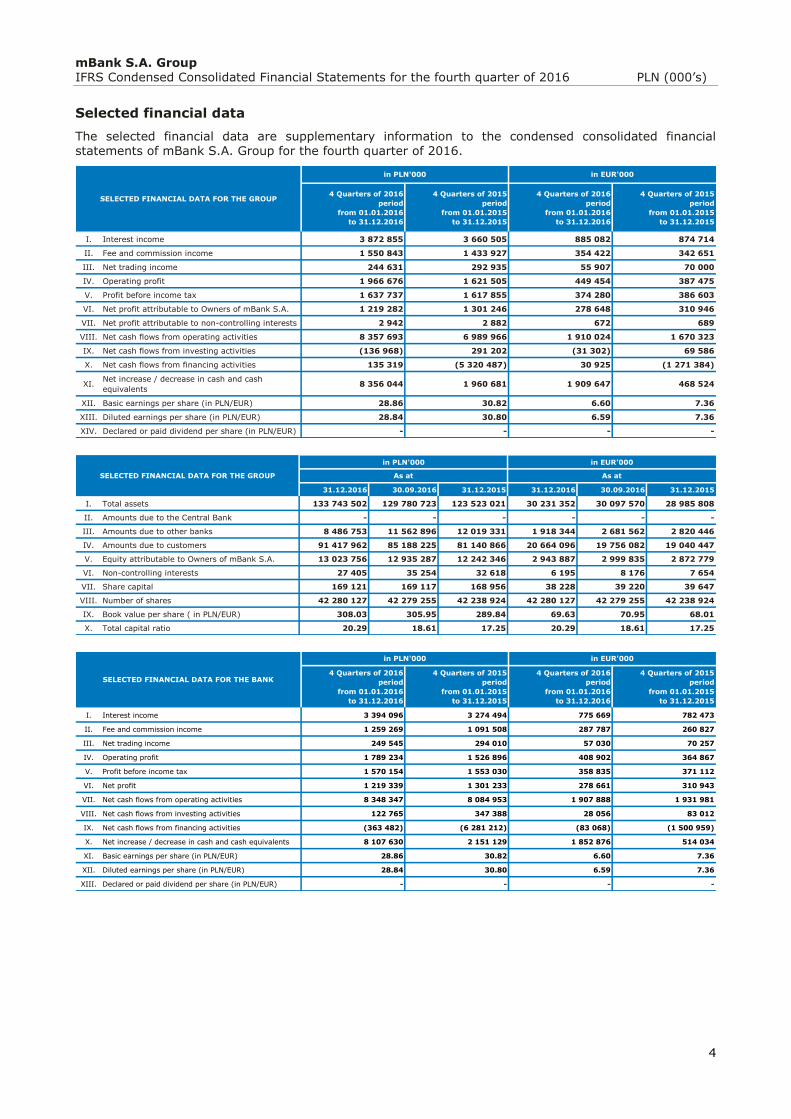
The selected financial data are supplementary information to the condensed consolidated financial statements of mBank S.A. Group for the fourth quarter of 2016.
4 Quarters of 2016
period
from 01.01.2016
to 31.12.2016
4 Quarters of 2015
period
from 01.01.2015
to 31.12.2015
4 Quarters of 2016
period
from 01.01.2016
to 31.12.2016
4 Quarters of 2015
period
from 01.01.2015
to 31.12.2015
I. Interest income 3 872 855 3 660 505 885 082 874 714
II. Fee and commission income 1 550 843 1 433 927 354 422 342 651
III. Net trading income 244 631 292 935 55 907 70 000
IV. Operating profit 1 966 676 1 621 505 449 454 387 475
V. Profit before income tax 1 637 737 1 617 855 374 280 386 603
VI. Net profit attributable to Owners of mBank S.A. 1 219 282 1 301 246 278 648 310 946
VII. Net profit attributable to non-controlling interests 2 942 2 882 672 689
VIII. Net cash flows from operating activities 8 357 693 6 989 966 1 910 024 1 670 323
IX. Net cash flows from investing activities (136 968) 291 202 (31 302) 69 586
X. Net cash flows from financing activities 135 319 (5 320 487) 30 925 (1 271 384)
XI.Net increase / decrease in cash and cash
equivalents8 356 044 1 960 681 1 909 647 468 524
XII. Basic earnings per share (in PLN/EUR) 28.86 30.82 6.60 7.36
XIII. Diluted earnings per share (in PLN/EUR) 28.84 30.80 6.59 7.36
XIV. Declared or paid dividend per share (in PLN/EUR) - - - -
in PLN'000 in EUR'000
SELECTED FINANCIAL DATA FOR THE GROUP
in PLN'000 in EUR'000
31.12.2016 30.09.2016 31.12.2015 31.12.2016 30.09.2016 31.12.2015
I. Total assets 133 743 502 129 780 723 123 523 021 30 231 352 30 097 570 28 985 808
II. Amounts due to the Central Bank - - - - - -
III. Amounts due to other banks 8 486 753 11 562 896 12 019 331 1 918 344 2 681 562 2 820 446
IV. Amounts due to customers 91 417 962 85 188 225 81 140 866 20 664 096 19 756 082 19 040 447
V. Equity attributable to Owners of mBank S.A. 13 023 756 12 935 287 12 242 346 2 943 887 2 999 835 2 872 779
VI. Non-controlling interests 27 405 35 254 32 618 6 195 8 176 7 654
VII. Share capital 169 121 169 117 168 956 38 228 39 220 39 647
VIII. Number of shares 42 280 127 42 279 255 42 238 924 42 280 127 42 279 255 42 238 924
IX. Book value per share ( in PLN/EUR) 308.03 305.95 289.84 69.63 70.95 68.01
X. Total capital ratio 20.29 18.61 17.25 20.29 18.61 17.25
As at As atSELECTED FINANCIAL DATA FOR THE GROUP
4 Quarters of 2016
period
from 01.01.2016
to 31.12.2016
4 Quarters of 2015
period
from 01.01.2015
to 31.12.2015
4 Quarters of 2016
period
from 01.01.2016
to 31.12.2016
4 Quarters of 2015
period
from 01.01.2015
to 31.12.2015
I. Interest income 3 394 096 3 274 494 775 669 782 473
II. Fee and commission income 1 259 269 1 091 508 287 787 260 827
III. Net trading income 249 545 294 010 57 030 70 257
IV. Operating profit 1 789 234 1 526 896 408 902 364 867
V. Profit before income tax 1 570 154 1 553 030 358 835 371 112
VI. Net profit 1 219 339 1 301 233 278 661 310 943
VII. Net cash flows from operating activities 8 348 347 8 084 953 1 907 888 1 931 981
VIII. Net cash flows from investing activities 122 765 347 388 28 056 83 012
IX. Net cash flows from financing activities (363 482) (6 281 212) (83 068) (1 500 959)
X. Net increase / decrease in cash and cash equivalents 8 107 630 2 151 129 1 852 876 514 034
XI. Basic earnings per share (in PLN/EUR) 28.86 30.82 6.60 7.36
XII. Diluted earnings per share (in PLN/EUR) 28.84 30.80 6.59 7.36
XIII. Declared or paid dividend per share (in PLN/EUR) - - - -
in PLN'000 in EUR'000
SELECTED FINANCIAL DATA FOR THE BANK
mBank S.A. Group IFRS Condensed Consolidated Financial Statements for the fourth quarter of 2016 PLN (000’s)
5
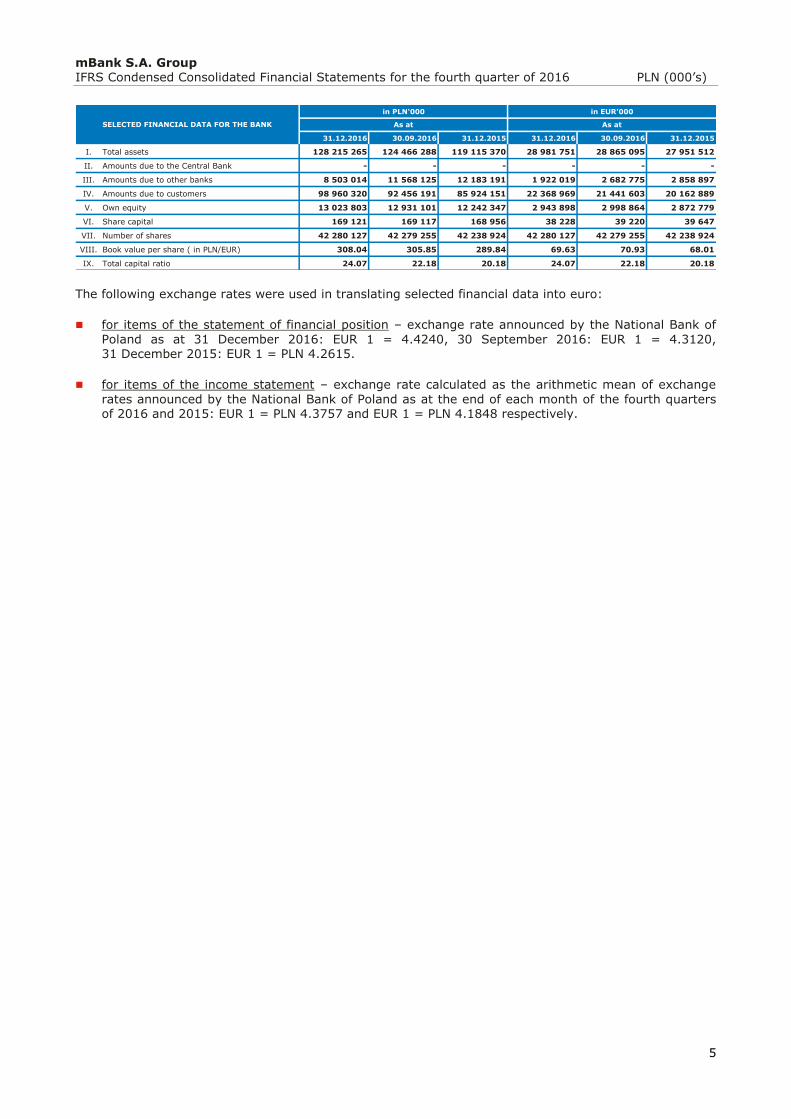
The following exchange rates were used in translating selected financial data into euro:
for items of the statement of financial position – exchange rate announced by the National Bank of
Poland as at 31 December 2016: EUR 1 = 4.4240, 30 September 2016: EUR 1 = 4.3120, 31 December 2015: EUR 1 = PLN 4.2615.
for items of the income statement – exchange rate calculated as the arithmetic mean of exchange
rates announced by the National Bank of Poland as at the end of each month of the fourth quarters of 2016 and 2015: EUR 1 = PLN 4.3757 and EUR 1 = PLN 4.1848 respectively.
in PLN'000 in EUR'000
31.12.2016 30.09.2016 31.12.2015 31.12.2016 30.09.2016 31.12.2015
I. Total assets 128 215 265 124 466 288 119 115 370 28 981 751 28 865 095 27 951 512
II. Amounts due to the Central Bank - - - - - -
III. Amounts due to other banks 8 503 014 11 568 125 12 183 191 1 922 019 2 682 775 2 858 897
IV. Amounts due to customers 98 960 320 92 456 191 85 924 151 22 368 969 21 441 603 20 162 889
V. Own equity 13 023 803 12 931 101 12 242 347 2 943 898 2 998 864 2 872 779
VI. Share capital 169 121 169 117 168 956 38 228 39 220 39 647
VII. Number of shares 42 280 127 42 279 255 42 238 924 42 280 127 42 279 255 42 238 924
VIII. Book value per share ( in PLN/EUR) 308.04 305.85 289.84 69.63 70.93 68.01
IX. Total capital ratio 24.07 22.18 20.18 24.07 22.18 20.18
As at As atSELECTED FINANCIAL DATA FOR THE BANK
mBank S.A. Group IFRS Condensed Consolidated Financial Statements for the fourth quarter of 2016 PLN (000’s)
6
Introduction
Despite difficult operating conditions under which financial entities have been operating in Poland, mBank Group recorded good financial results in Q4 2016. Core income increased quarter on quarter thanks to
positive trends both in net interest income and net fee and commission income, and consequently was at a historical high.
mBank Group generated a profit before tax of PLN 420.3 million in Q4 2016, which represents an increase by 35.8% compared with Q3 2016. Net profit attributable to the shareholders of mBank increased by 26.9% quarter on quarter to PLN 292.5 million.
The main factors determining changes in the Group’s financial results in Q4 2016 were as follows:
Higher income at PLN 1,044.7 million, i.e. +0.6% compared with Q3 2016, mainly due to the record high level of core income. Net interest income went up by PLN 34.6 million, i.e. 4.8%, while net fee and commission income rose by PLN 16.3 million, i.e. 6.9%, compared with Q3 2016. Net trading income decreased significantly by PLN 47.8 million, i.e. 64.2% quarter on quarter.
Decrease in operating expenses (including amortisation) by 1.6% compared with Q3 to PLN 491.9 million was triggered by lower material costs by PLN 14.9 million, i.e. 8.1%, while contributions
and transfers to the Bank Guarantee Fund increased due to the bankruptcy of Cooperative Bank in Nadarzyn.
Net impairment losses on loans and advances fell to PLN 39.7 million thanks to the release of provisions on several corporate exposures. As a consequence the cost of risk reached 20 basis points in Q4 2016, compared with 69 basis points a quarter earlier.
Tax on balance sheet items of the Group increased slightly compared with Q3 and amounted to PLN 92.8 million.
Continued organic growth and business expansion as demonstrated by:
increase in the retail customer base to 5,347.9 thousand (+97.6 thousand customers compared with the end of September),
increase in the number of corporate customers to 20,940 customers (+245 customers compared with the end of September).
As at the end of December 2016, net loans and advances stood at PLN 81,763.3 million and were up by
PLN 753.6 million, i.e. 0.9% compared with the end of September (excluding reverse repo/buy-sell-back transactions and the FX effect, the value of loans and advances went down by 1.1%).
In Q4 2016, the value of customer deposits increased by 7.3% compared with the previous quarter and
totalled PLN 91,418.0 million with amounts due to individuals rising by 5.4% in the reported period and amounts due to corporate clients by 10.5% compared to the end of September.
As a result of the changes discussed above, the loan to deposit ratio of mBank Group stood at 89.4%.
The changes in the Group’s results translated into the following profitability ratios:
Gross ROE of 14.1% (compared with 10.2% in Q3),
Net ROE of 9.8% (compared with 7.6% in Q3).
The level of mBank Group’s capital ratios increased in Q4 2016. As at the end of December 2016, the
Total Capital Ratio stood at 20.3% and the Common Equity Tier 1 ratio at 17.3%. Factors behind the increased levels of mBank Group’s capital ratios include:
the way of recognizing the regulatory floor was adapted to the requirements stipulated in Article 500 of CRR,
the changed internal model for LGD was implemented in the corporate area, after fulfilling the conditions precedent,
on July 26, 2016, the Bank received the confirmation from the European Central Bank and the Polish Financial Supervision Authority that it had met the requirements of high significance defined in the conditional approval regarding the use of the internal ratings-based approach for the calculation of the capital requirement for credit risk for credit exposures of mLeasing, which further allowed to recognize a decrease of risk-weighted assets after adjustment of accounting method for regulatory floor.
mBank S.A. Group IFRS Condensed Consolidated Financial Statements for the fourth quarter of 2016 PLN (000’s)
7
More information on the capital ratios can be found in Note 26 to the financial statements for Q4 2016.
Awards and distinctions
Similarly to the previous quarters, in Q4 2016, the Bank and the mBank Group subsidiaries received a number of prizes. The most important awards include the following:
mBank is the best bank in Poland in Trade Finance
Trade & Forfaiting Review (TFR), the leading industry information service uniting world’s biggest banks which offer Trade Finance products, hailed mBank as the best bank in Poland operating in this area. The key criteria taken into consideration by TFR were the reviews of clients and counterparties, business size, as well as the comprehensiveness of the offer.
mBank named the Best Private Bank in Poland
mBank’s private banking has yet again been recognised as the best in Poland by the
prestigious magazines PWM and The Banker. The jury grants the award basing on a thorough analysis of the information prepared by banks. The factors taken into consideration are financial data from the last 3 years (among others, profits, assets under management, number of clients), as well as the manner of offering private banking services (product offer, development plans, innovative solutions).
mKsięgowość takes second place in the “Best product” category
mKsięgowość, a unique service which combines accounting with a bank account and allows clients to keep accounting books smoothly, almost automatically and independently, was awarded in the international Innovation Awards contest organised by Efma together with Accenture. Victory in the competition is determined by votes of financiers from 88 Efma countries.
mBank’s MasterCard Me credit card climbed the podium twice
During the Polish Card Gala, which took place in December, the MasterCard Me
credit card won two awards in the following categories: the most innovative
Polish card of 2016 and the best advertisement for a card product in Polish media in 2016.
The Polish Card Gala is not only the biggest meeting of people shaping the Polish card market but also a part of the Central European Electronic Card International Conference taking place since 2001.
mFactoring won the award for customer service quality
Factors Chain International, the biggest industry organisation, hailed mFactoring as the best company in terms of the customer service quality in import factoring. In 2016, companies which vaunt the highest standard of customer service were awarded for the second time. The distinction is granted by the factor environment itself.
Macroeconomic environment in Q4 2016
End of slowdown, Polish economy gains momentum in Q4
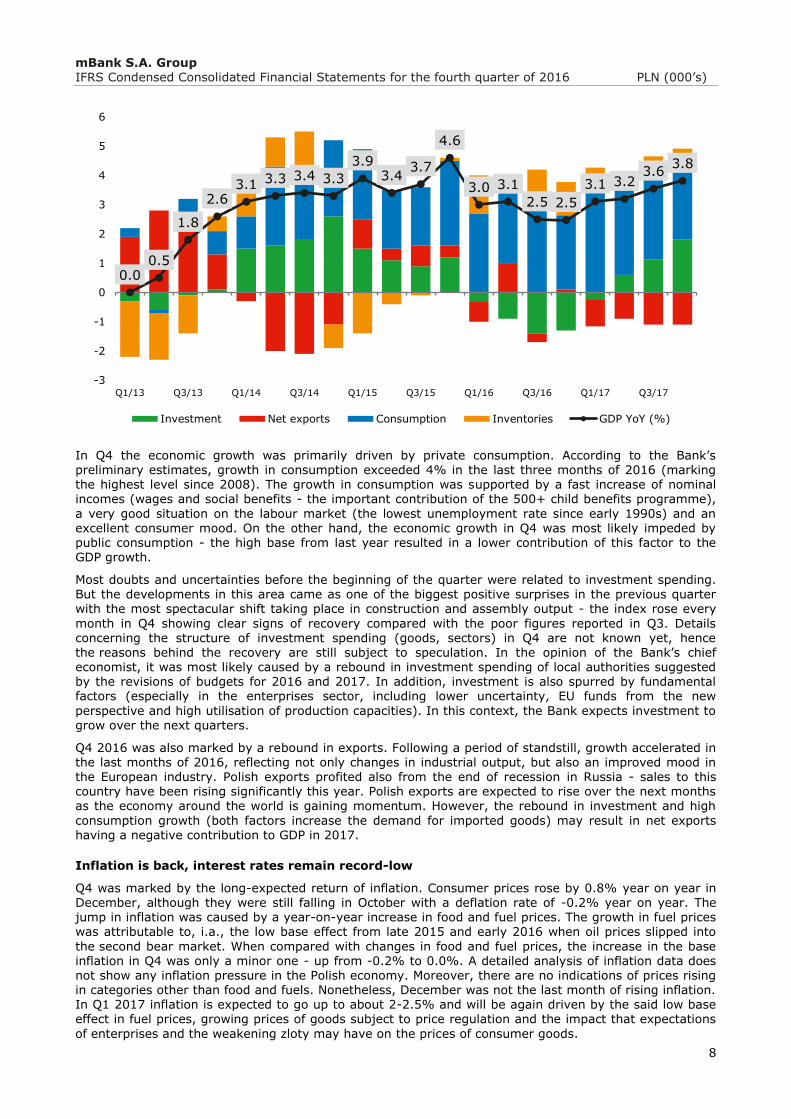
In Q4 2016 the Polish economy stopped slowing down. On the basis of available data, the Bank estimates the GDP growth to reach ca. 2.5% year on year (unchanged compared with Q3). At the same time, monthly data (industrial output, construction and assembly output and retail sales) give clear signs of much faster quarter-on-quarter growth - it might even have exceeded 1%. This shift came as a surprise to many in the context of October data which seemed to confirm the continuation of the downward trend in the Polish economy. However, the positive surprise caused by November and December readings
resulted in an upward revision for the Polish economy.
mBank S.A. Group IFRS Condensed Consolidated Financial Statements for the fourth quarter of 2016 PLN (000’s)
8
In Q4 the economic growth was primarily driven by private consumption. According to the Bank’s preliminary estimates, growth in consumption exceeded 4% in the last three months of 2016 (marking the highest level since 2008). The growth in consumption was supported by a fast increase of nominal incomes (wages and social benefits - the important contribution of the 500+ child benefits programme),
a very good situation on the labour market (the lowest unemployment rate since early 1990s) and an excellent consumer mood. On the other hand, the economic growth in Q4 was most likely impeded by public consumption - the high base from last year resulted in a lower contribution of this factor to the GDP growth.
Most doubts and uncertainties before the beginning of the quarter were related to investment spending. But the developments in this area came as one of the biggest positive surprises in the previous quarter with the most spectacular shift taking place in construction and assembly output - the index rose every
month in Q4 showing clear signs of recovery compared with the poor figures reported in Q3. Details concerning the structure of investment spending (goods, sectors) in Q4 are not known yet, hence the reasons behind the recovery are still subject to speculation. In the opinion of the Bank’s chief economist, it was most likely caused by a rebound in investment spending of local authorities suggested by the revisions of budgets for 2016 and 2017. In addition, investment is also spurred by fundamental factors (especially in the enterprises sector, including lower uncertainty, EU funds from the new
perspective and high utilisation of production capacities). In this context, the Bank expects investment to grow over the next quarters.
Q4 2016 was also marked by a rebound in exports. Following a period of standstill, growth accelerated in the last months of 2016, reflecting not only changes in industrial output, but also an improved mood in the European industry. Polish exports profited also from the end of recession in Russia - sales to this country have been rising significantly this year. Polish exports are expected to rise over the next months as the economy around the world is gaining momentum. However, the rebound in investment and high
consumption growth (both factors increase the demand for imported goods) may result in net exports having a negative contribution to GDP in 2017.
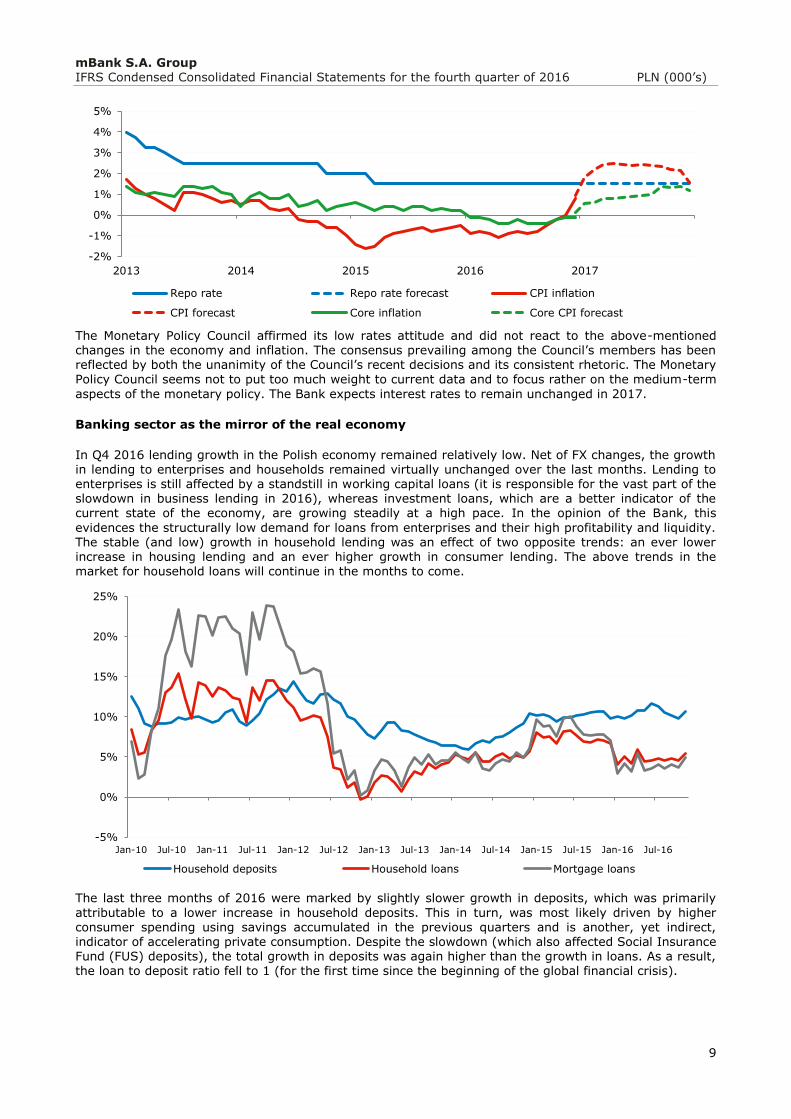
Inflation is back, interest rates remain record-low
Q4 was marked by the long-expected return of inflation. Consumer prices rose by 0.8% year on year in December, although they were still falling in October with a deflation rate of -0.2% year on year. The jump in inflation was caused by a year-on-year increase in food and fuel prices. The growth in fuel prices was attributable to, i.a., the low base effect from late 2015 and early 2016 when oil prices slipped into
the second bear market. When compared with changes in food and fuel prices, the increase in the base inflation in Q4 was only a minor one - up from -0.2% to 0.0%. A detailed analysis of inflation data does not show any inflation pressure in the Polish economy. Moreover, there are no indications of prices rising in categories other than food and fuels. Nonetheless, December was not the last month of rising inflation. In Q1 2017 inflation is expected to go up to about 2-2.5% and will be again driven by the said low base effect in fuel prices, growing prices of goods subject to price regulation and the impact that expectations
of enterprises and the weakening zloty may have on the prices of consumer goods.
0.00.5
1.8
2.63.1 3.3 3.4 3.3
3.93.4
3.7
4.6
3.0 3.1
2.5 2.5
3.1 3.23.6
3.8
-3
-2
-1
0
1
2
3
4
5
6
Q1/13 Q3/13 Q1/14 Q3/14 Q1/15 Q3/15 Q1/16 Q3/16 Q1/17 Q3/17
Investment Net exports Consumption Inventories GDP YoY (%)
mBank S.A. Group IFRS Condensed Consolidated Financial Statements for the fourth quarter of 2016 PLN (000’s)
9
The Monetary Policy Council affirmed its low rates attitude and did not react to the above-mentioned changes in the economy and inflation. The consensus prevailing among the Council’s members has been reflected by both the unanimity of the Council’s recent decisions and its consistent rhetoric. The Monetary
Policy Council seems not to put too much weight to current data and to focus rather on the medium-term
aspects of the monetary policy. The Bank expects interest rates to remain unchanged in 2017.
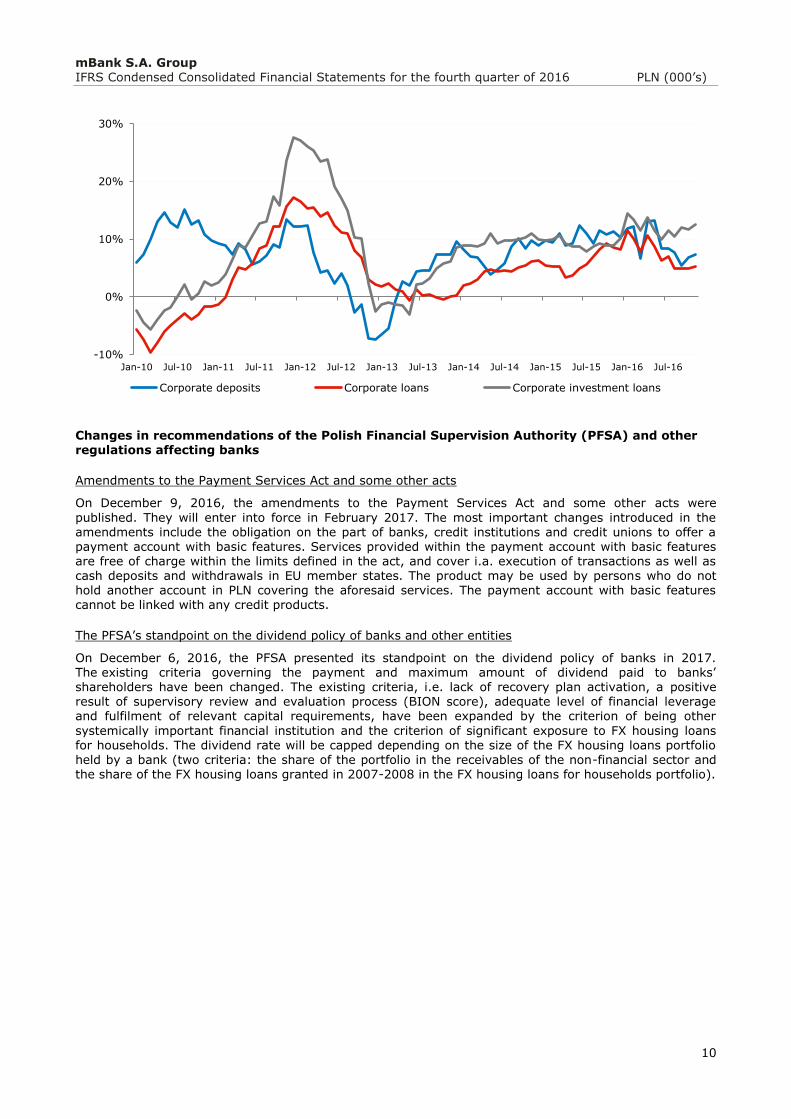
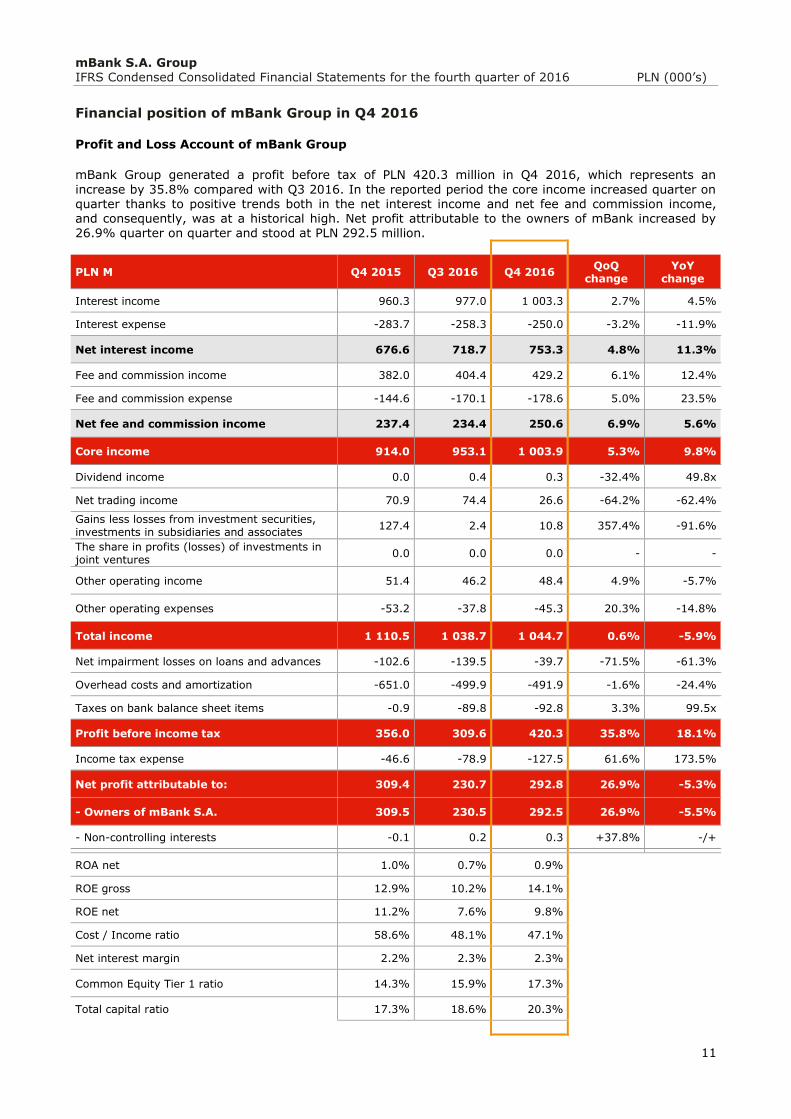
Banking sector as the mirror of the real economy
In Q4 2016 lending growth in the Polish economy remained relatively low. Net of FX changes, the growth in lending to enterprises and households remained virtually unchanged over the last months. Lending to enterprises is still affected by a standstill in working capital loans (it is responsible for the vast part of the slowdown in business lending in 2016), whereas investment loans, which are a better indicator of the current state of the economy, are growing steadily at a high pace. In the opinion of the Bank, this
evidences the structurally low demand for loans from enterprises and their high profitability and liquidity. The stable (and low) growth in household lending was an effect of two opposite trends: an ever lower increase in housing lending and an ever higher growth in consumer lending. The above trends in the market for household loans will continue in the months to come.
The last three months of 2016 were marked by slightly slower growth in deposits, which was primarily
attributable to a lower increase in household deposits. This in turn, was most likely driven by higher consumer spending using savings accumulated in the previous quarters and is another, yet indirect, indicator of accelerating private consumption. Despite the slowdown (which also affected Social Insurance Fund (FUS) deposits), the total growth in deposits was again higher than the growth in loans. As a result, the loan to deposit ratio fell to 1 (for the first time since the beginning of the global financial crisis).
-2%
-1%
0%
1%
2%
3%
4%
5%
2013 2014 2015 2016 2017
Repo rate Repo rate forecast CPI inflation
CPI forecast Core inflation Core CPI forecast
-5%
0%
5%
10%
15%
20%
25%
Jan-10 Jul-10 Jan-11 Jul-11 Jan-12 Jul-12 Jan-13 Jul-13 Jan-14 Jul-14 Jan-15 Jul-15 Jan-16 Jul-16
Household deposits Household loans Mortgage loans
mBank S.A. Group IFRS Condensed Consolidated Financial Statements for the fourth quarter of 2016 PLN (000’s)
10
Changes in recommendations of the Polish Financial Supervision Authority (PFSA) and other regulations affecting banks
Amendments to the Payment Services Act and some other acts
On December 9, 2016, the amendments to the Payment Services Act and some other acts were
published. They will enter into force in February 2017. The most important changes introduced in the amendments include the obligation on the part of banks, credit institutions and credit unions to offer a payment account with basic features. Services provided within the payment account with basic features are free of charge within the limits defined in the act, and cover i.a. execution of transactions as well as cash deposits and withdrawals in EU member states. The product may be used by persons who do not hold another account in PLN covering the aforesaid services. The payment account with basic features cannot be linked with any credit products.
The PFSA’s standpoint on the dividend policy of banks and other entities
On December 6, 2016, the PFSA presented its standpoint on the dividend policy of banks in 2017. The existing criteria governing the payment and maximum amount of dividend paid to banks’ shareholders have been changed. The existing criteria, i.e. lack of recovery plan activation, a positive result of supervisory review and evaluation process (BION score), adequate level of financial leverage and fulfilment of relevant capital requirements, have been expanded by the criterion of being other
systemically important financial institution and the criterion of significant exposure to FX housing loans for households. The dividend rate will be capped depending on the size of the FX housing loans portfolio held by a bank (two criteria: the share of the portfolio in the receivables of the non-financial sector and the share of the FX housing loans granted in 2007-2008 in the FX housing loans for households portfolio).
-10%
0%
10%
20%
30%
Jan-10 Jul-10 Jan-11 Jul-11 Jan-12 Jul-12 Jan-13 Jul-13 Jan-14 Jul-14 Jan-15 Jul-15 Jan-16 Jul-16
Corporate deposits Corporate loans Corporate investment loans
mBank S.A. Group IFRS Condensed Consolidated Financial Statements for the fourth quarter of 2016 PLN (000’s)
11
Financial position of mBank Group in Q4 2016
Profit and Loss Account of mBank Group
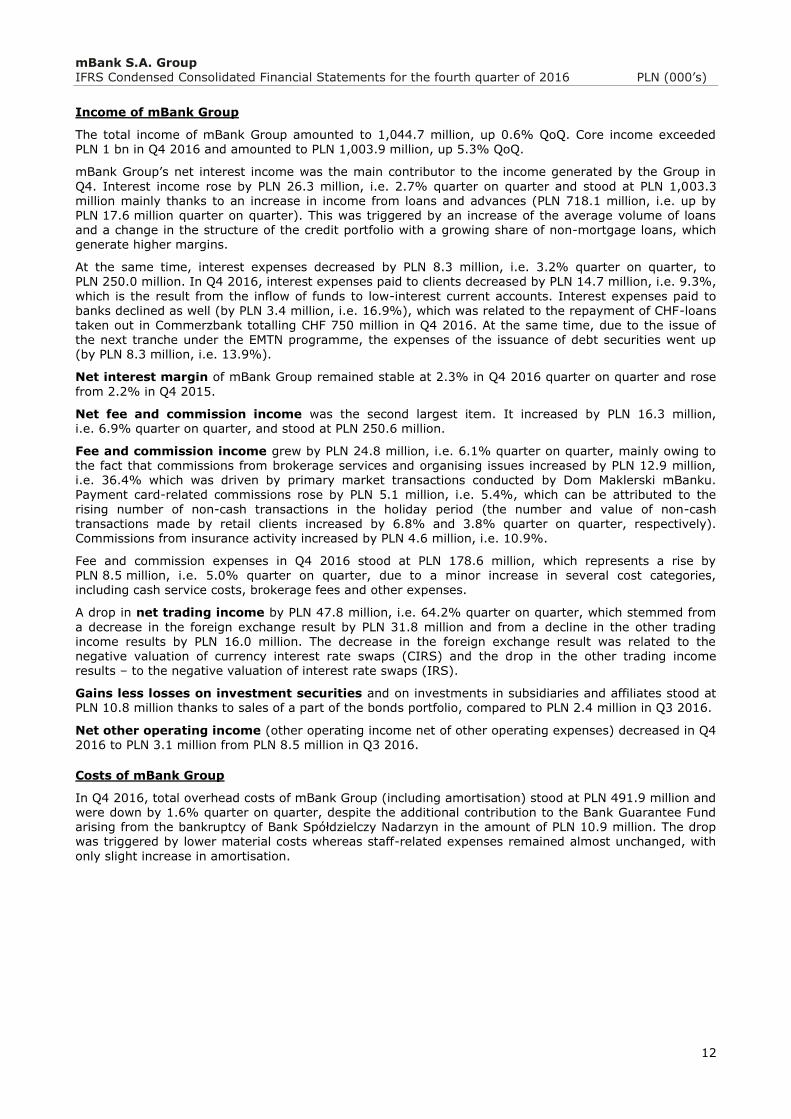
mBank Group generated a profit before tax of PLN 420.3 million in Q4 2016, which represents an
increase by 35.8% compared with Q3 2016. In the reported period the core income increased quarter on quarter thanks to positive trends both in the net interest income and net fee and commission income, and consequently, was at a historical high. Net profit attributable to the owners of mBank increased by 26.9% quarter on quarter and stood at PLN 292.5 million.
PLN M Q4 2015 Q3 2016 Q4 2016 QoQ
change YoY
change
Interest income 960.3 977.0 1 003.3 2.7% 4.5%
Interest expense -283.7 -258.3 -250.0 -3.2% -11.9%
Net interest income 676.6 718.7 753.3 4.8% 11.3%
Fee and commission income 382.0 404.4 429.2 6.1% 12.4%
Fee and commission expense -144.6 -170.1 -178.6 5.0% 23.5%
Net fee and commission income 237.4 234.4 250.6 6.9% 5.6%
Core income 914.0 953.1 1 003.9 5.3% 9.8%
Dividend income 0.0 0.4 0.3 -32.4% 49.8x
Net trading income 70.9 74.4 26.6 -64.2% -62.4%
Gains less losses from investment securities, investments in subsidiaries and associates
127.4 2.4 10.8 357.4% -91.6%
The share in profits (losses) of investments in joint ventures
0.0 0.0 0.0 - -
Other operating income 51.4 46.2 48.4 4.9% -5.7%
Other operating expenses -53.2 -37.8 -45.3 20.3% -14.8%
Total income 1 110.5 1 038.7 1 044.7 0.6% -5.9%
Net impairment losses on loans and advances -102.6 -139.5 -39.7 -71.5% -61.3%
Overhead costs and amortization -651.0 -499.9 -491.9 -1.6% -24.4%
Taxes on bank balance sheet items -0.9 -89.8 -92.8 3.3% 99.5x
Profit before income tax 356.0 309.6 420.3 35.8% 18.1%
Income tax expense -46.6 -78.9 -127.5 61.6% 173.5%
Net profit attributable to: 309.4 230.7 292.8 26.9% -5.3%
- Owners of mBank S.A. 309.5 230.5 292.5 26.9% -5.5%
- Non-controlling interests -0.1 0.2 0.3 +37.8% -/+
ROA net 1.0% 0.7% 0.9%
ROE gross 12.9% 10.2% 14.1%
ROE net 11.2% 7.6% 9.8%
Cost / Income ratio 58.6% 48.1% 47.1%
Net interest margin 2.2% 2.3% 2.3%
Common Equity Tier 1 ratio 14.3% 15.9% 17.3%
Total capital ratio 17.3% 18.6% 20.3%
mBank S.A. Group IFRS Condensed Consolidated Financial Statements for the fourth quarter of 2016 PLN (000’s)
12
Income of mBank Group
The total income of mBank Group amounted to 1,044.7 million, up 0.6% QoQ. Core income exceeded PLN 1 bn in Q4 2016 and amounted to PLN 1,003.9 million, up 5.3% QoQ.
mBank Group’s net interest income was the main contributor to the income generated by the Group in
Q4. Interest income rose by PLN 26.3 million, i.e. 2.7% quarter on quarter and stood at PLN 1,003.3 million mainly thanks to an increase in income from loans and advances (PLN 718.1 million, i.e. up by PLN 17.6 million quarter on quarter). This was triggered by an increase of the average volume of loans and a change in the structure of the credit portfolio with a growing share of non-mortgage loans, which generate higher margins.
At the same time, interest expenses decreased by PLN 8.3 million, i.e. 3.2% quarter on quarter, to PLN 250.0 million. In Q4 2016, interest expenses paid to clients decreased by PLN 14.7 million, i.e. 9.3%,
which is the result from the inflow of funds to low-interest current accounts. Interest expenses paid to banks declined as well (by PLN 3.4 million, i.e. 16.9%), which was related to the repayment of CHF-loans taken out in Commerzbank totalling CHF 750 million in Q4 2016. At the same time, due to the issue of the next tranche under the EMTN programme, the expenses of the issuance of debt securities went up (by PLN 8.3 million, i.e. 13.9%).
Net interest margin of mBank Group remained stable at 2.3% in Q4 2016 quarter on quarter and rose
from 2.2% in Q4 2015.
Net fee and commission income was the second largest item. It increased by PLN 16.3 million, i.e. 6.9% quarter on quarter, and stood at PLN 250.6 million.
Fee and commission income grew by PLN 24.8 million, i.e. 6.1% quarter on quarter, mainly owing to the fact that commissions from brokerage services and organising issues increased by PLN 12.9 million, i.e. 36.4% which was driven by primary market transactions conducted by Dom Maklerski mBanku. Payment card-related commissions rose by PLN 5.1 million, i.e. 5.4%, which can be attributed to the
rising number of non-cash transactions in the holiday period (the number and value of non-cash transactions made by retail clients increased by 6.8% and 3.8% quarter on quarter, respectively). Commissions from insurance activity increased by PLN 4.6 million, i.e. 10.9%.
Fee and commission expenses in Q4 2016 stood at PLN 178.6 million, which represents a rise by PLN 8.5 million, i.e. 5.0% quarter on quarter, due to a minor increase in several cost categories, including cash service costs, brokerage fees and other expenses.
A drop in net trading income by PLN 47.8 million, i.e. 64.2% quarter on quarter, which stemmed from
a decrease in the foreign exchange result by PLN 31.8 million and from a decline in the other trading income results by PLN 16.0 million. The decrease in the foreign exchange result was related to the negative valuation of currency interest rate swaps (CIRS) and the drop in the other trading income results – to the negative valuation of interest rate swaps (IRS).
Gains less losses on investment securities and on investments in subsidiaries and affiliates stood at PLN 10.8 million thanks to sales of a part of the bonds portfolio, compared to PLN 2.4 million in Q3 2016.
Net other operating income (other operating income net of other operating expenses) decreased in Q4 2016 to PLN 3.1 million from PLN 8.5 million in Q3 2016.
Costs of mBank Group
In Q4 2016, total overhead costs of mBank Group (including amortisation) stood at PLN 491.9 million and were down by 1.6% quarter on quarter, despite the additional contribution to the Bank Guarantee Fund arising from the bankruptcy of Bank Spółdzielczy Nadarzyn in the amount of PLN 10.9 million. The drop was triggered by lower material costs whereas staff-related expenses remained almost unchanged, with
only slight increase in amortisation.
mBank S.A. Group IFRS Condensed Consolidated Financial Statements for the fourth quarter of 2016 PLN (000’s)
13
PLN M Q4 2015 Q3 2016 Q4 2016 QoQ
change YoY
change
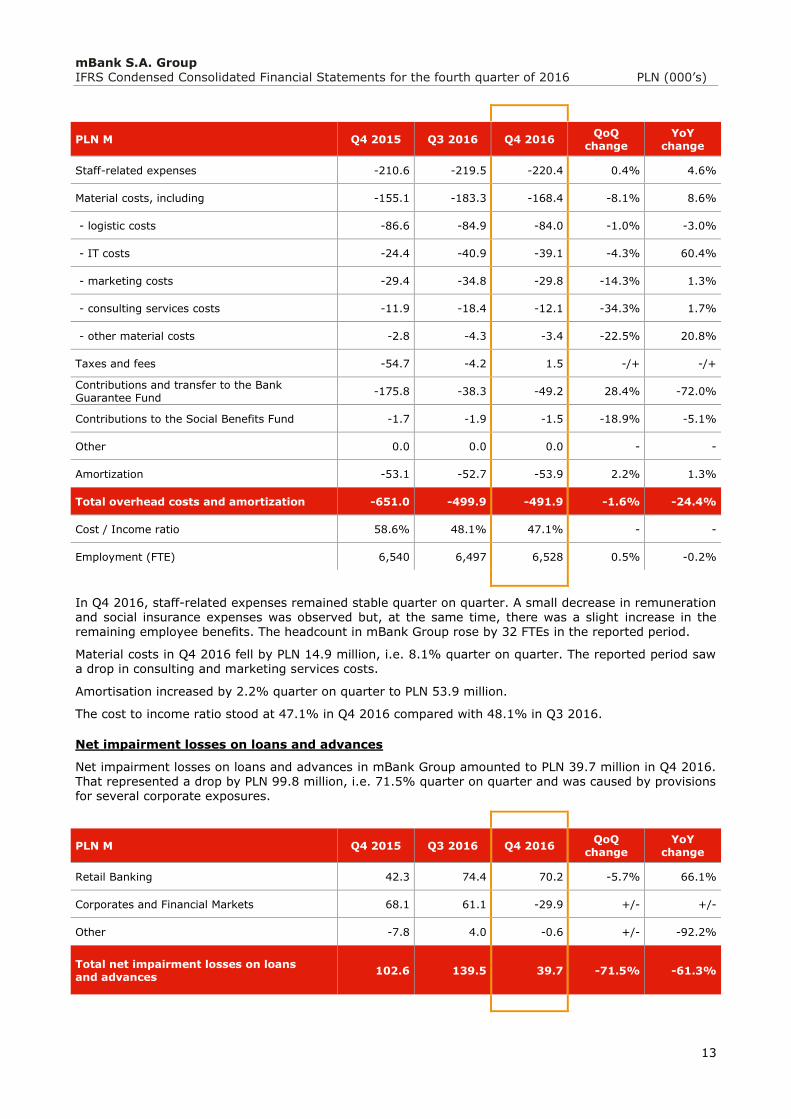
Staff-related expenses -210.6 -219.5 -220.4 0.4% 4.6%
Material costs, including -155.1 -183.3 -168.4 -8.1% 8.6%
- logistic costs -86.6 -84.9 -84.0 -1.0% -3.0%
- IT costs -24.4 -40.9 -39.1 -4.3% 60.4%
- marketing costs -29.4 -34.8 -29.8 -14.3% 1.3%
- consulting services costs -11.9 -18.4 -12.1 -34.3% 1.7%
- other material costs -2.8 -4.3 -3.4 -22.5% 20.8%
Taxes and fees -54.7 -4.2 1.5 -/+ -/+
Contributions and transfer to the Bank Guarantee Fund
-175.8 -38.3 -49.2 28.4% -72.0%
Contributions to the Social Benefits Fund -1.7 -1.9 -1.5 -18.9% -5.1%
Other 0.0 0.0 0.0 - -
Amortization -53.1 -52.7 -53.9 2.2% 1.3%
Total overhead costs and amortization -651.0 -499.9 -491.9 -1.6% -24.4%
Cost / Income ratio 58.6% 48.1% 47.1% - -
Employment (FTE) 6,540 6,497 6,528 0.5% -0.2%
In Q4 2016, staff-related expenses remained stable quarter on quarter. A small decrease in remuneration and social insurance expenses was observed but, at the same time, there was a slight increase in the
remaining employee benefits. The headcount in mBank Group rose by 32 FTEs in the reported period.
Material costs in Q4 2016 fell by PLN 14.9 million, i.e. 8.1% quarter on quarter. The reported period saw a drop in consulting and marketing services costs.
Amortisation increased by 2.2% quarter on quarter to PLN 53.9 million.
The cost to income ratio stood at 47.1% in Q4 2016 compared with 48.1% in Q3 2016.
Net impairment losses on loans and advances
Net impairment losses on loans and advances in mBank Group amounted to PLN 39.7 million in Q4 2016. That represented a drop by PLN 99.8 million, i.e. 71.5% quarter on quarter and was caused by provisions for several corporate exposures.
PLN M Q4 2015 Q3 2016 Q4 2016 QoQ
change YoY
change
Retail Banking 42.3 74.4 70.2 -5.7% 66.1%
Corporates and Financial Markets 68.1 61.1 -29.9 +/- +/-
Other -7.8 4.0 -0.6 +/- -92.2%
Total net impairment losses on loans and advances
102.6 139.5 39.7 -71.5% -61.3%
mBank S.A. Group IFRS Condensed Consolidated Financial Statements for the fourth quarter of 2016 PLN (000’s)
14
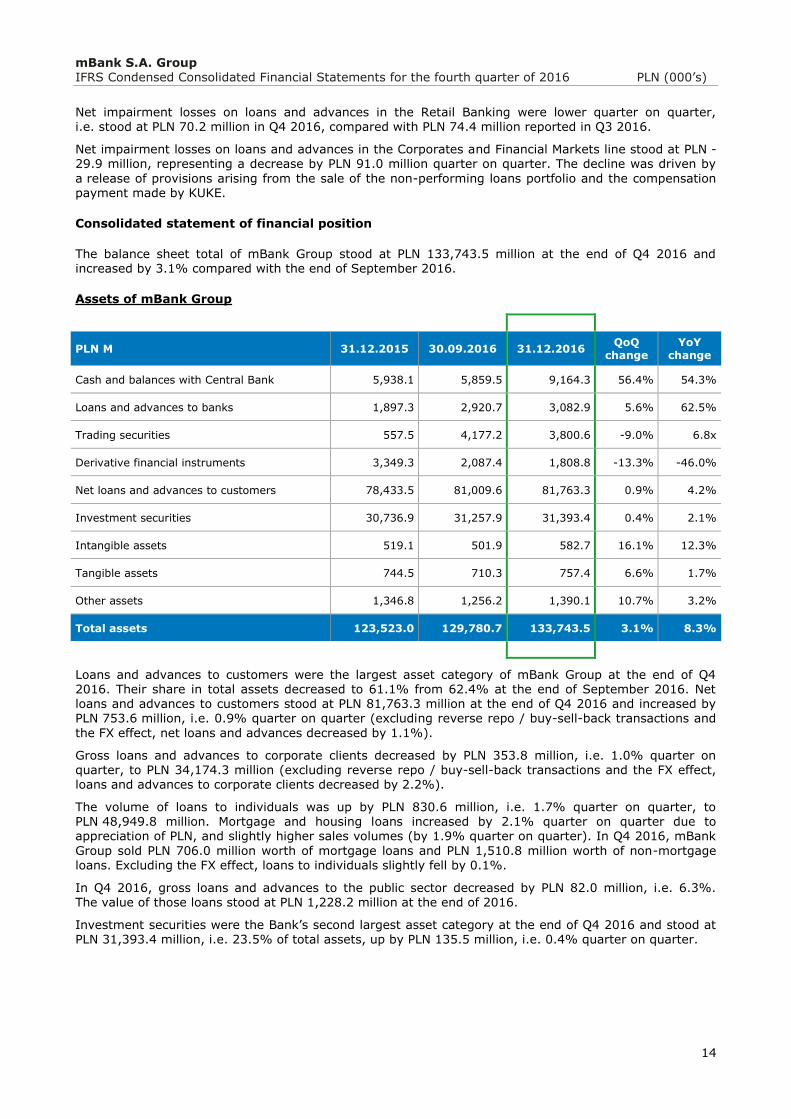
Net impairment losses on loans and advances in the Retail Banking were lower quarter on quarter,
i.e. stood at PLN 70.2 million in Q4 2016, compared with PLN 74.4 million reported in Q3 2016.
Net impairment losses on loans and advances in the Corporates and Financial Markets line stood at PLN -29.9 million, representing a decrease by PLN 91.0 million quarter on quarter. The decline was driven by
a release of provisions arising from the sale of the non-performing loans portfolio and the compensation payment made by KUKE.
Consolidated statement of financial position
The balance sheet total of mBank Group stood at PLN 133,743.5 million at the end of Q4 2016 and increased by 3.1% compared with the end of September 2016.
Assets of mBank Group
PLN M 31.12.2015 30.09.2016 31.12.2016 QoQ
change YoY
change
Cash and balances with Central Bank 5,938.1 5,859.5 9,164.3 56.4% 54.3%
Loans and advances to banks 1,897.3 2,920.7 3,082.9 5.6% 62.5%
Trading securities 557.5 4,177.2 3,800.6 -9.0% 6.8x
Derivative financial instruments 3,349.3 2,087.4 1,808.8 -13.3% -46.0%
Net loans and advances to customers 78,433.5 81,009.6 81,763.3 0.9% 4.2%
Investment securities 30,736.9 31,257.9 31,393.4 0.4% 2.1%
Intangible assets 519.1 501.9 582.7 16.1% 12.3%
Tangible assets 744.5 710.3 757.4 6.6% 1.7%
Other assets 1,346.8 1,256.2 1,390.1 10.7% 3.2%
Total assets 123,523.0 129,780.7 133,743.5 3.1% 8.3%
Loans and advances to customers were the largest asset category of mBank Group at the end of Q4 2016. Their share in total assets decreased to 61.1% from 62.4% at the end of September 2016. Net loans and advances to customers stood at PLN 81,763.3 million at the end of Q4 2016 and increased by PLN 753.6 million, i.e. 0.9% quarter on quarter (excluding reverse repo / buy-sell-back transactions and
the FX effect, net loans and advances decreased by 1.1%).
Gross loans and advances to corporate clients decreased by PLN 353.8 million, i.e. 1.0% quarter on quarter, to PLN 34,174.3 million (excluding reverse repo / buy-sell-back transactions and the FX effect, loans and advances to corporate clients decreased by 2.2%).
The volume of loans to individuals was up by PLN 830.6 million, i.e. 1.7% quarter on quarter, to PLN 48,949.8 million. Mortgage and housing loans increased by 2.1% quarter on quarter due to appreciation of PLN, and slightly higher sales volumes (by 1.9% quarter on quarter). In Q4 2016, mBank
Group sold PLN 706.0 million worth of mortgage loans and PLN 1,510.8 million worth of non-mortgage loans. Excluding the FX effect, loans to individuals slightly fell by 0.1%.
In Q4 2016, gross loans and advances to the public sector decreased by PLN 82.0 million, i.e. 6.3%. The value of those loans stood at PLN 1,228.2 million at the end of 2016.
Investment securities were the Bank’s second largest asset category at the end of Q4 2016 and stood at PLN 31,393.4 million, i.e. 23.5% of total assets, up by PLN 135.5 million, i.e. 0.4% quarter on quarter.
mBank S.A. Group IFRS Condensed Consolidated Financial Statements for the fourth quarter of 2016 PLN (000’s)
15
mBank Group’s total liabilities and equity
PLN M 31.12.2015 30.09.2016 31.12.2016 QoQ
change YoY
change
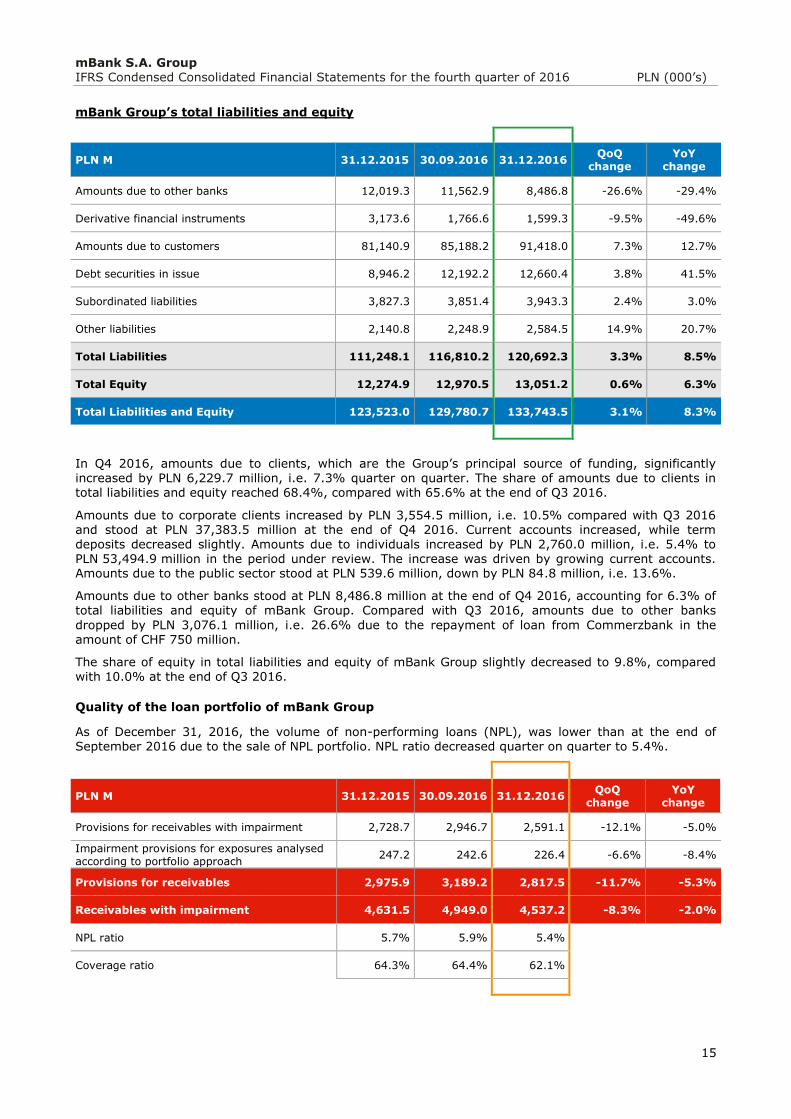
Amounts due to other banks 12,019.3 11,562.9 8,486.8 -26.6% -29.4%
Derivative financial instruments 3,173.6 1,766.6 1,599.3 -9.5% -49.6%
Amounts due to customers 81,140.9 85,188.2 91,418.0 7.3% 12.7%
Debt securities in issue 8,946.2 12,192.2 12,660.4 3.8% 41.5%
Subordinated liabilities 3,827.3 3,851.4 3,943.3 2.4% 3.0%
Other liabilities 2,140.8 2,248.9 2,584.5 14.9% 20.7%
Total Liabilities 111,248.1 116,810.2 120,692.3 3.3% 8.5%
Total Equity 12,274.9 12,970.5 13,051.2 0.6% 6.3%
Total Liabilities and Equity 123,523.0 129,780.7 133,743.5 3.1% 8.3%
In Q4 2016, amounts due to clients, which are the Group’s principal source of funding, significantly increased by PLN 6,229.7 million, i.e. 7.3% quarter on quarter. The share of amounts due to clients in total liabilities and equity reached 68.4%, compared with 65.6% at the end of Q3 2016.
Amounts due to corporate clients increased by PLN 3,554.5 million, i.e. 10.5% compared with Q3 2016 and stood at PLN 37,383.5 million at the end of Q4 2016. Current accounts increased, while term deposits decreased slightly. Amounts due to individuals increased by PLN 2,760.0 million, i.e. 5.4% to PLN 53,494.9 million in the period under review. The increase was driven by growing current accounts. Amounts due to the public sector stood at PLN 539.6 million, down by PLN 84.8 million, i.e. 13.6%.
Amounts due to other banks stood at PLN 8,486.8 million at the end of Q4 2016, accounting for 6.3% of total liabilities and equity of mBank Group. Compared with Q3 2016, amounts due to other banks
dropped by PLN 3,076.1 million, i.e. 26.6% due to the repayment of loan from Commerzbank in the amount of CHF 750 million.
The share of equity in total liabilities and equity of mBank Group slightly decreased to 9.8%, compared with 10.0% at the end of Q3 2016.
Quality of the loan portfolio of mBank Group
As of December 31, 2016, the volume of non-performing loans (NPL), was lower than at the end of September 2016 due to the sale of NPL portfolio. NPL ratio decreased quarter on quarter to 5.4%.
PLN M 31.12.2015 30.09.2016 31.12.2016 QoQ
change YoY
change
Provisions for receivables with impairment 2,728.7 2,946.7 2,591.1 -12.1% -5.0%
Impairment provisions for exposures analysed according to portfolio approach
247.2 242.6 226.4 -6.6% -8.4%
Provisions for receivables 2,975.9 3,189.2 2,817.5 -11.7% -5.3%
Receivables with impairment 4,631.5 4,949.0 4,537.2 -8.3% -2.0%
NPL ratio 5.7% 5.9% 5.4%
Coverage ratio 64.3% 64.4% 62.1%
mBank S.A. Group IFRS Condensed Consolidated Financial Statements for the fourth quarter of 2016 PLN (000’s)
16
Provisions for loans and advances to customers decreased by PLN 371.7 million quarter on quarter to
PLN 2,817.5 million. At the same time, the provision for IBNI (Incurred But Not Identified) losses dropped from PLN 242.6 million to PLN 226.4 million in Q4 2016.
The coverage ratio (including IBNI provisions) decreased from 64.4% to 62.1% quarter on quarter.
Performance of segments and the business lines
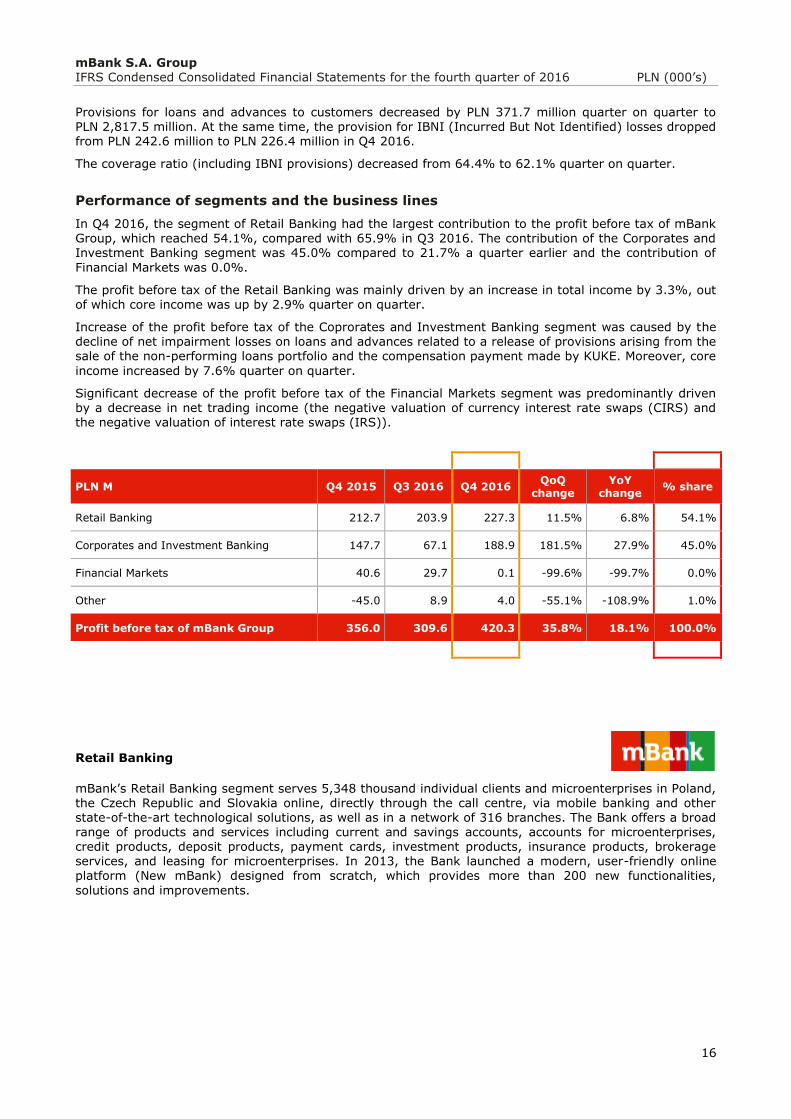
In Q4 2016, the segment of Retail Banking had the largest contribution to the profit before tax of mBank Group, which reached 54.1%, compared with 65.9% in Q3 2016. The contribution of the Corporates and Investment Banking segment was 45.0% compared to 21.7% a quarter earlier and the contribution of
Financial Markets was 0.0%.
The profit before tax of the Retail Banking was mainly driven by an increase in total income by 3.3%, out of which core income was up by 2.9% quarter on quarter.
Increase of the profit before tax of the Coprorates and Investment Banking segment was caused by the decline of net impairment losses on loans and advances related to a release of provisions arising from the sale of the non-performing loans portfolio and the compensation payment made by KUKE. Moreover, core
income increased by 7.6% quarter on quarter.
Significant decrease of the profit before tax of the Financial Markets segment was predominantly driven by a decrease in net trading income (the negative valuation of currency interest rate swaps (CIRS) and the negative valuation of interest rate swaps (IRS)).
PLN M Q4 2015 Q3 2016 Q4 2016 QoQ
change YoY
change % share
Retail Banking 212.7 203.9 227.3 11.5% 6.8% 54.1%
Corporates and Investment Banking 147.7 67.1 188.9 181.5% 27.9% 45.0%
Financial Markets 40.6 29.7 0.1 -99.6% -99.7% 0.0%
Other -45.0 8.9 4.0 -55.1% -108.9% 1.0%
Profit before tax of mBank Group 356.0 309.6 420.3 35.8% 18.1% 100.0%
Retail Banking
mBank’s Retail Banking segment serves 5,348 thousand individual clients and microenterprises in Poland, the Czech Republic and Slovakia online, directly through the call centre, via mobile banking and other state-of-the-art technological solutions, as well as in a network of 316 branches. The Bank offers a broad range of products and services including current and savings accounts, accounts for microenterprises, credit products, deposit products, payment cards, investment products, insurance products, brokerage services, and leasing for microenterprises. In 2013, the Bank launched a modern, user-friendly online
platform (New mBank) designed from scratch, which provides more than 200 new functionalities,
solutions and improvements.
mBank S.A. Group IFRS Condensed Consolidated Financial Statements for the fourth quarter of 2016 PLN (000’s)
17
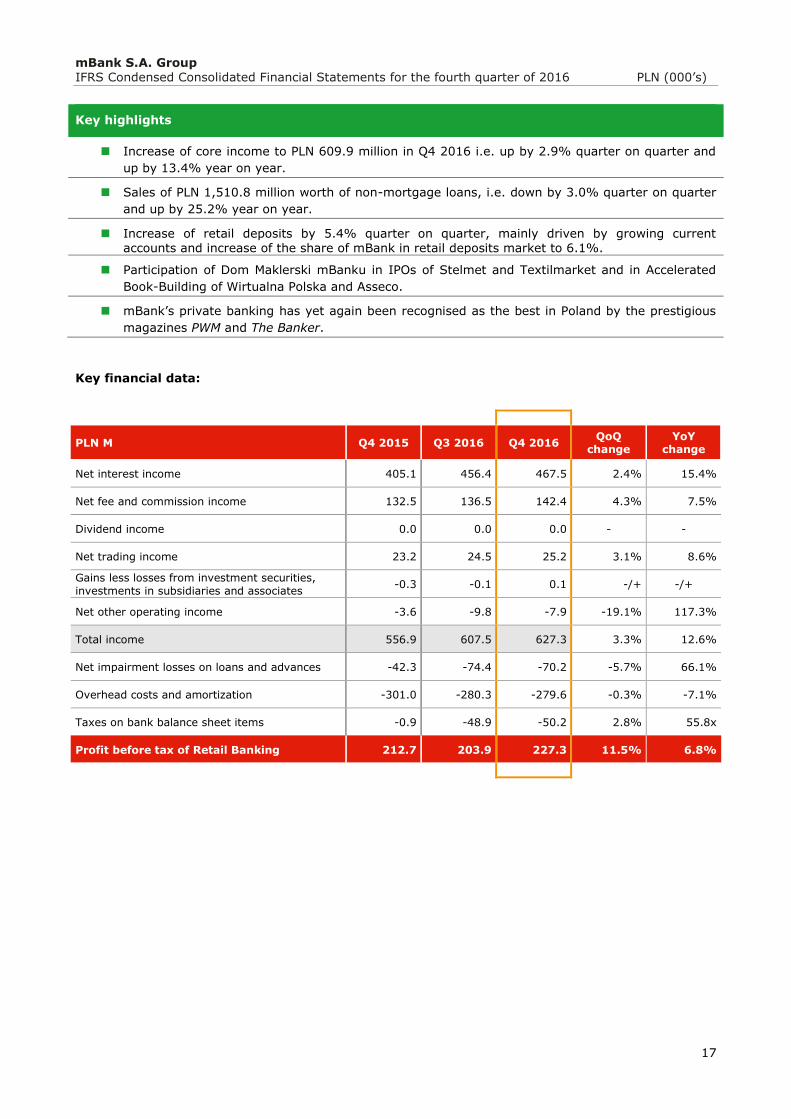
Key highlights
Increase of core income to PLN 609.9 million in Q4 2016 i.e. up by 2.9% quarter on quarter and
up by 13.4% year on year.
Sales of PLN 1,510.8 million worth of non-mortgage loans, i.e. down by 3.0% quarter on quarter
and up by 25.2% year on year.
Increase of retail deposits by 5.4% quarter on quarter, mainly driven by growing current accounts and increase of the share of mBank in retail deposits market to 6.1%.
Participation of Dom Maklerski mBanku in IPOs of Stelmet and Textilmarket and in Accelerated
Book-Building of Wirtualna Polska and Asseco.
mBank’s private banking has yet again been recognised as the best in Poland by the prestigious
magazines PWM and The Banker.
Key financial data:
PLN M Q4 2015 Q3 2016 Q4 2016 QoQ
change YoY
change
Net interest income 405.1 456.4 467.5 2.4% 15.4%
Net fee and commission income 132.5 136.5 142.4 4.3% 7.5%
Dividend income 0.0 0.0 0.0 - -
Net trading income 23.2 24.5 25.2 3.1% 8.6%
Gains less losses from investment securities,
investments in subsidiaries and associates -0.3 -0.1 0.1 -/+ -/+
Net other operating income -3.6 -9.8 -7.9 -19.1% 117.3%
Total income 556.9 607.5 627.3 3.3% 12.6%
Net impairment losses on loans and advances -42.3 -74.4 -70.2 -5.7% 66.1%
Overhead costs and amortization -301.0 -280.3 -279.6 -0.3% -7.1%
Taxes on bank balance sheet items -0.9 -48.9 -50.2 2.8% 55.8x
Profit before tax of Retail Banking 212.7 203.9 227.3 11.5% 6.8%
mBank S.A. Group IFRS Condensed Consolidated Financial Statements for the fourth quarter of 2016 PLN (000’s)
18
Key business data:
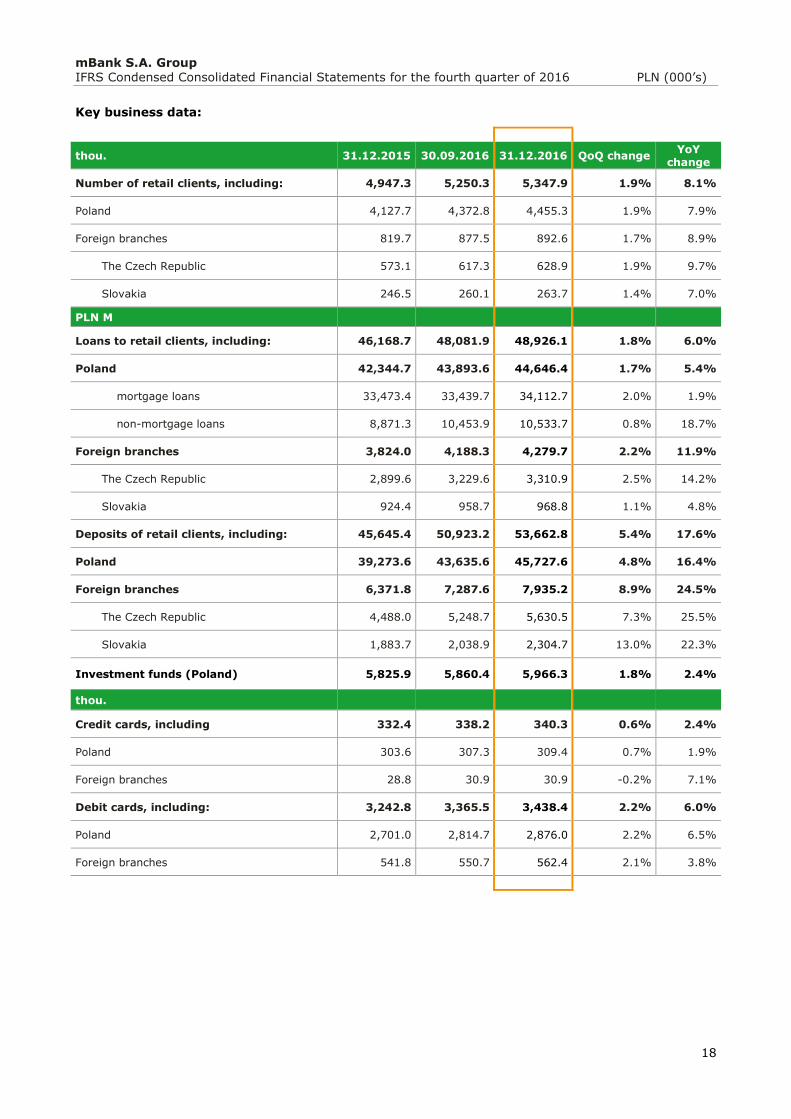
thou. 31.12.2015 30.09.2016 31.12.2016 QoQ change YoY
change
Number of retail clients, including: 4,947.3 5,250.3 5,347.9 1.9% 8.1%
Poland 4,127.7 4,372.8 4,455.3 1.9% 7.9%
Foreign branches 819.7 877.5 892.6 1.7% 8.9%
The Czech Republic 573.1 617.3 628.9 1.9% 9.7%
Slovakia 246.5 260.1 263.7 1.4% 7.0%
PLN M
Loans to retail clients, including: 46,168.7 48,081.9 48,926.1 1.8% 6.0%
Poland 42,344.7 43,893.6 44,646.4 1.7% 5.4%
mortgage loans 33,473.4 33,439.7 34,112.7 2.0% 1.9%
non-mortgage loans 8,871.3 10,453.9 10,533.7 0.8% 18.7%
Foreign branches 3,824.0 4,188.3 4,279.7 2.2% 11.9%
The Czech Republic 2,899.6 3,229.6 3,310.9 2.5% 14.2%
Slovakia 924.4 958.7 968.8 1.1% 4.8%
Deposits of retail clients, including: 45,645.4 50,923.2 53,662.8 5.4% 17.6%
Poland 39,273.6 43,635.6 45,727.6 4.8% 16.4%
Foreign branches 6,371.8 7,287.6 7,935.2 8.9% 24.5%
The Czech Republic 4,488.0 5,248.7 5,630.5 7.3% 25.5%
Slovakia 1,883.7 2,038.9 2,304.7 13.0% 22.3%
Investment funds (Poland) 5,825.9 5,860.4 5,966.3 1.8% 2.4%
thou.
Credit cards, including 332.4 338.2 340.3 0.6% 2.4%
Poland 303.6 307.3 309.4 0.7% 1.9%
Foreign branches 28.8 30.9 30.9 -0.2% 7.1%
Debit cards, including: 3,242.8 3,365.5 3,438.4 2.2% 6.0%
Poland 2,701.0 2,814.7 2,876.0 2.2% 6.5%
Foreign branches 541.8 550.7 562.4 2.1% 3.8%
mBank S.A. Group IFRS Condensed Consolidated Financial Statements for the fourth quarter of 2016 PLN (000’s)
19
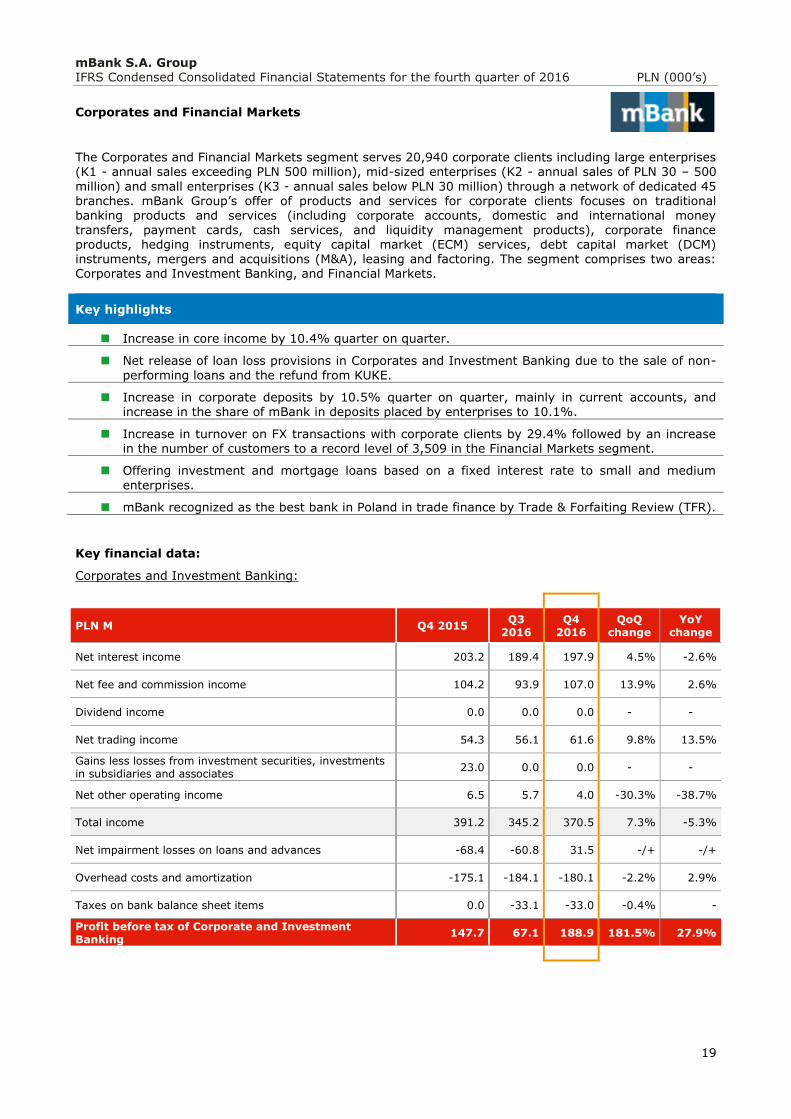
Corporates and Financial Markets
The Corporates and Financial Markets segment serves 20,940 corporate clients including large enterprises (K1 - annual sales exceeding PLN 500 million), mid-sized enterprises (K2 - annual sales of PLN 30 – 500
million) and small enterprises (K3 - annual sales below PLN 30 million) through a network of dedicated 45 branches. mBank Group’s offer of products and services for corporate clients focuses on traditional banking products and services (including corporate accounts, domestic and international money transfers, payment cards, cash services, and liquidity management products), corporate finance products, hedging instruments, equity capital market (ECM) services, debt capital market (DCM) instruments, mergers and acquisitions (M&A), leasing and factoring. The segment comprises two areas: Corporates and Investment Banking, and Financial Markets.
Key highlights
Increase in core income by 10.4% quarter on quarter.
Net release of loan loss provisions in Corporates and Investment Banking due to the sale of non-
performing loans and the refund from KUKE.
Increase in corporate deposits by 10.5% quarter on quarter, mainly in current accounts, and increase in the share of mBank in deposits placed by enterprises to 10.1%.
Increase in turnover on FX transactions with corporate clients by 29.4% followed by an increase in the number of customers to a record level of 3,509 in the Financial Markets segment.
Offering investment and mortgage loans based on a fixed interest rate to small and medium
enterprises.
mBank recognized as the best bank in Poland in trade finance by Trade & Forfaiting Review (TFR).
Key financial data:
Corporates and Investment Banking:
PLN M Q4 2015 Q3
2016 Q4
2016 QoQ
change YoY
change
Net interest income 203.2 189.4 197.9 4.5% -2.6%
Net fee and commission income 104.2 93.9 107.0 13.9% 2.6%
Dividend income 0.0 0.0 0.0 - -
Net trading income 54.3 56.1 61.6 9.8% 13.5%
Gains less losses from investment securities, investments in subsidiaries and associates
23.0 0.0 0.0 - -
Net other operating income 6.5 5.7 4.0 -30.3% -38.7%
Total income 391.2 345.2 370.5 7.3% -5.3%
Net impairment losses on loans and advances -68.4 -60.8 31.5 -/+ -/+
Overhead costs and amortization -175.1 -184.1 -180.1 -2.2% 2.9%
Taxes on bank balance sheet items 0.0 -33.1 -33.0 -0.4% -
Profit before tax of Corporate and Investment Banking
147.7 67.1 188.9 181.5% 27.9%
mBank S.A. Group IFRS Condensed Consolidated Financial Statements for the fourth quarter of 2016 PLN (000’s)
20
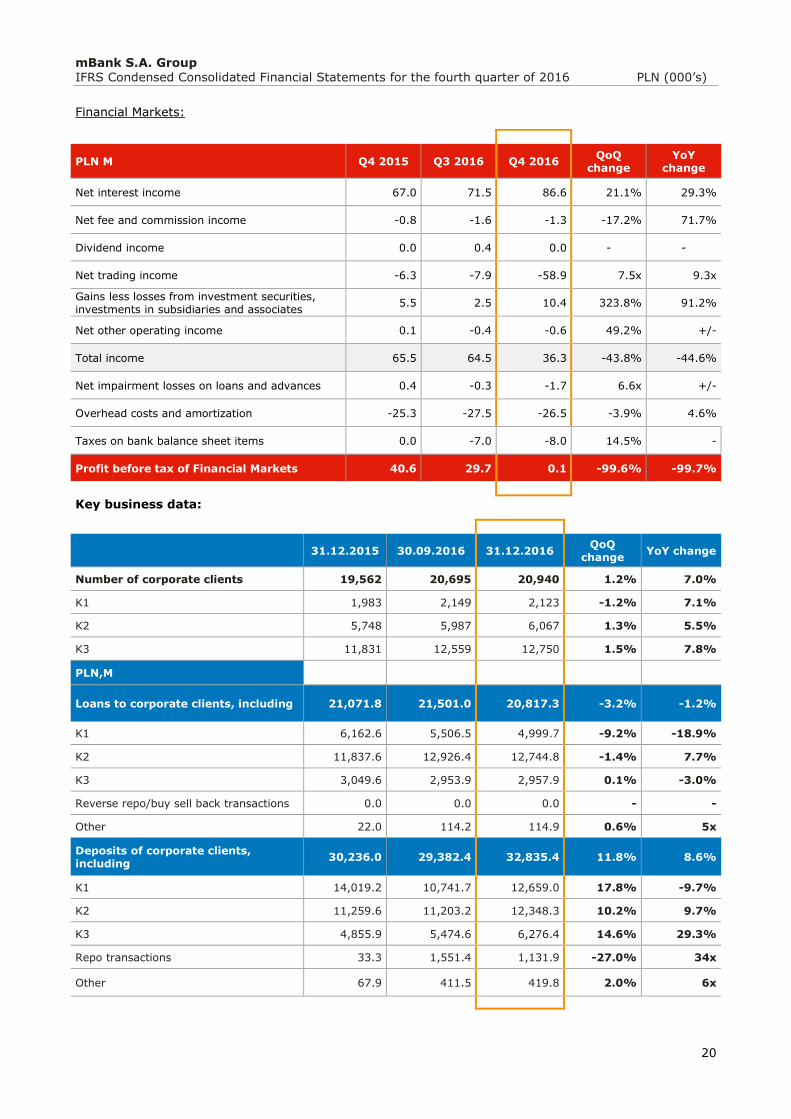
Financial Markets:
PLN M Q4 2015 Q3 2016 Q4 2016 QoQ
change YoY
change
Net interest income 67.0 71.5 86.6 21.1% 29.3%
Net fee and commission income -0.8 -1.6 -1.3 -17.2% 71.7%
Dividend income 0.0 0.4 0.0 - -
Net trading income -6.3 -7.9 -58.9 7.5x 9.3x
Gains less losses from investment securities, investments in subsidiaries and associates
5.5 2.5 10.4 323.8% 91.2%
Net other operating income 0.1 -0.4 -0.6 49.2% +/-
Total income 65.5 64.5 36.3 -43.8% -44.6%
Net impairment losses on loans and advances 0.4 -0.3 -1.7 6.6x +/-
Overhead costs and amortization -25.3 -27.5 -26.5 -3.9% 4.6%
Taxes on bank balance sheet items 0.0 -7.0 -8.0 14.5% -
Profit before tax of Financial Markets 40.6 29.7 0.1 -99.6% -99.7%
Key business data:
31.12.2015 30.09.2016 31.12.2016 QoQ
change YoY change
Number of corporate clients 19,562 20,695 20,940 1.2% 7.0%
K1 1,983 2,149 2,123 -1.2% 7.1%
K2 5,748 5,987 6,067 1.3% 5.5%
K3 11,831 12,559 12,750 1.5% 7.8%
PLN,M , , , , ,
Loans to corporate clients, including 21,071.8 21,501.0 20,817.3 -3.2% -1.2%
K1 6,162.6 5,506.5 4,999.7 -9.2% -18.9%
K2 11,837.6 12,926.4 12,744.8 -1.4% 7.7%
K3 3,049.6 2,953.9 2,957.9 0.1% -3.0%
Reverse repo/buy sell back transactions 0.0 0.0 0.0 - -
Other 22.0 114.2 114.9 0.6% 5x
Deposits of corporate clients, including
30,236.0 29,382.4 32,835.4 11.8% 8.6%
K1 14,019.2 10,741.7 12,659.0 17.8% -9.7%
K2 11,259.6 11,203.2 12,348.3 10.2% 9.7%
K3 4,855.9 5,474.6 6,276.4 14.6% 29.3%
Repo transactions 33.3 1,551.4 1,131.9 -27.0% 34x
Other 67.9 411.5 419.8 2.0% 6x
mBank S.A. Group IFRS Condensed Consolidated Financial Statements for the fourth quarter of 2016 PLN (000’s)
21
Summary of results of mBank Group’s subsidiaries
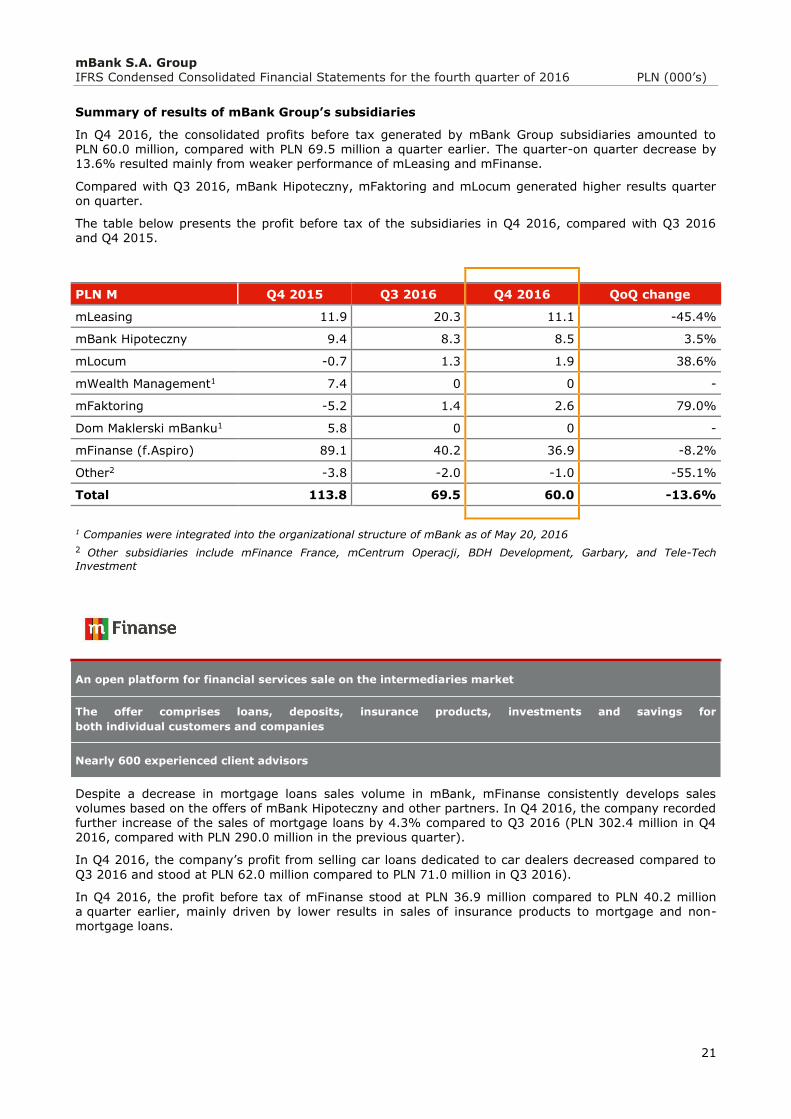
In Q4 2016, the consolidated profits before tax generated by mBank Group subsidiaries amounted to PLN 60.0 million, compared with PLN 69.5 million a quarter earlier. The quarter-on quarter decrease by 13.6% resulted mainly from weaker performance of mLeasing and mFinanse.
Compared with Q3 2016, mBank Hipoteczny, mFaktoring and mLocum generated higher results quarter on quarter.
The table below presents the profit before tax of the subsidiaries in Q4 2016, compared with Q3 2016 and Q4 2015.
PLN M Q4 2015 Q3 2016 Q4 2016 QoQ change
mLeasing 11.9 20.3 11.1 -45.4%
mBank Hipoteczny 9.4 8.3 8.5 3.5%
mLocum -0.7 1.3 1.9 38.6%
mWealth Management1 7.4 0 0 -
mFaktoring -5.2 1.4 2.6 79.0%
Dom Maklerski mBanku1 5.8 0 0 -
mFinanse (f.Aspiro) 89.1 40.2 36.9 -8.2%
Other2 -3.8 -2.0 -1.0 -55.1%
Total 113.8 69.5 60.0 -13.6%
1 Companies were integrated into the organizational structure of mBank as of May 20, 2016
2 Other subsidiaries include mFinance France, mCentrum Operacji, BDH Development, Garbary, and Tele-Tech
Investment
An open platform for financial services sale on the intermediaries market
The offer comprises loans, deposits, insurance products, investments and savings for
both individual customers and companies
Nearly 600 experienced client advisors
Despite a decrease in mortgage loans sales volume in mBank, mFinanse consistently develops sales volumes based on the offers of mBank Hipoteczny and other partners. In Q4 2016, the company recorded further increase of the sales of mortgage loans by 4.3% compared to Q3 2016 (PLN 302.4 million in Q4 2016, compared with PLN 290.0 million in the previous quarter).
In Q4 2016, the company’s profit from selling car loans dedicated to car dealers decreased compared to
Q3 2016 and stood at PLN 62.0 million compared to PLN 71.0 million in Q3 2016).
In Q4 2016, the profit before tax of mFinanse stood at PLN 36.9 million compared to PLN 40.2 million a quarter earlier, mainly driven by lower results in sales of insurance products to mortgage and non-mortgage loans.
mBank S.A. Group IFRS Condensed Consolidated Financial Statements for the fourth quarter of 2016 PLN (000’s)
22
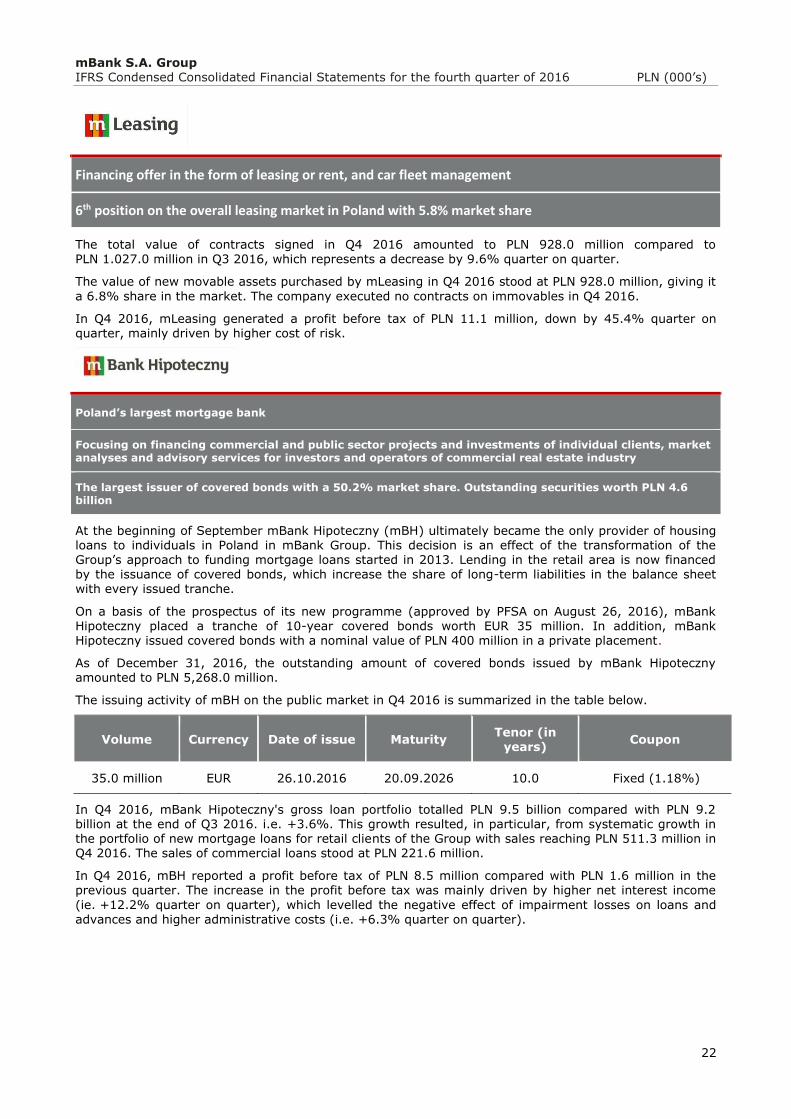
Financing offer in the form of leasing or rent, and car fleet management
6th position on the overall leasing market in Poland with 5.8% market share
The total value of contracts signed in Q4 2016 amounted to PLN 928.0 million compared to PLN 1.027.0 million in Q3 2016, which represents a decrease by 9.6% quarter on quarter.
The value of new movable assets purchased by mLeasing in Q4 2016 stood at PLN 928.0 million, giving it
a 6.8% share in the market. The company executed no contracts on immovables in Q4 2016.
In Q4 2016, mLeasing generated a profit before tax of PLN 11.1 million, down by 45.4% quarter on quarter, mainly driven by higher cost of risk.
Poland’s largest mortgage bank
Focusing on financing commercial and public sector projects and investments of individual clients, market analyses and advisory services for investors and operators of commercial real estate industry
The largest issuer of covered bonds with a 50.2% market share. Outstanding securities worth PLN 4.6 billion
At the beginning of September mBank Hipoteczny (mBH) ultimately became the only provider of housing loans to individuals in Poland in mBank Group. This decision is an effect of the transformation of the Group’s approach to funding mortgage loans started in 2013. Lending in the retail area is now financed by the issuance of covered bonds, which increase the share of long-term liabilities in the balance sheet with every issued tranche.
On a basis of the prospectus of its new programme (approved by PFSA on August 26, 2016), mBank
Hipoteczny placed a tranche of 10-year covered bonds worth EUR 35 million. In addition, mBank Hipoteczny issued covered bonds with a nominal value of PLN 400 million in a private placement.
As of December 31, 2016, the outstanding amount of covered bonds issued by mBank Hipoteczny amounted to PLN 5,268.0 million.
The issuing activity of mBH on the public market in Q4 2016 is summarized in the table below.
Volume Currency Date of issue Maturity Tenor (in
years) Coupon
35.0 million EUR 26.10.2016 20.09.2026 10.0 Fixed (1.18%)
In Q4 2016, mBank Hipoteczny's gross loan portfolio totalled PLN 9.5 billion compared with PLN 9.2 billion at the end of Q3 2016. i.e. +3.6%. This growth resulted, in particular, from systematic growth in the portfolio of new mortgage loans for retail clients of the Group with sales reaching PLN 511.3 million in Q4 2016. The sales of commercial loans stood at PLN 221.6 million.
In Q4 2016, mBH reported a profit before tax of PLN 8.5 million compared with PLN 1.6 million in the previous quarter. The increase in the profit before tax was mainly driven by higher net interest income
(ie. +12.2% quarter on quarter), which levelled the negative effect of impairment losses on loans and advances and higher administrative costs (i.e. +6.3% quarter on quarter).
mBank S.A. Group IFRS Condensed Consolidated Financial Statements for the fourth quarter of 2016 PLN (000’s)
23
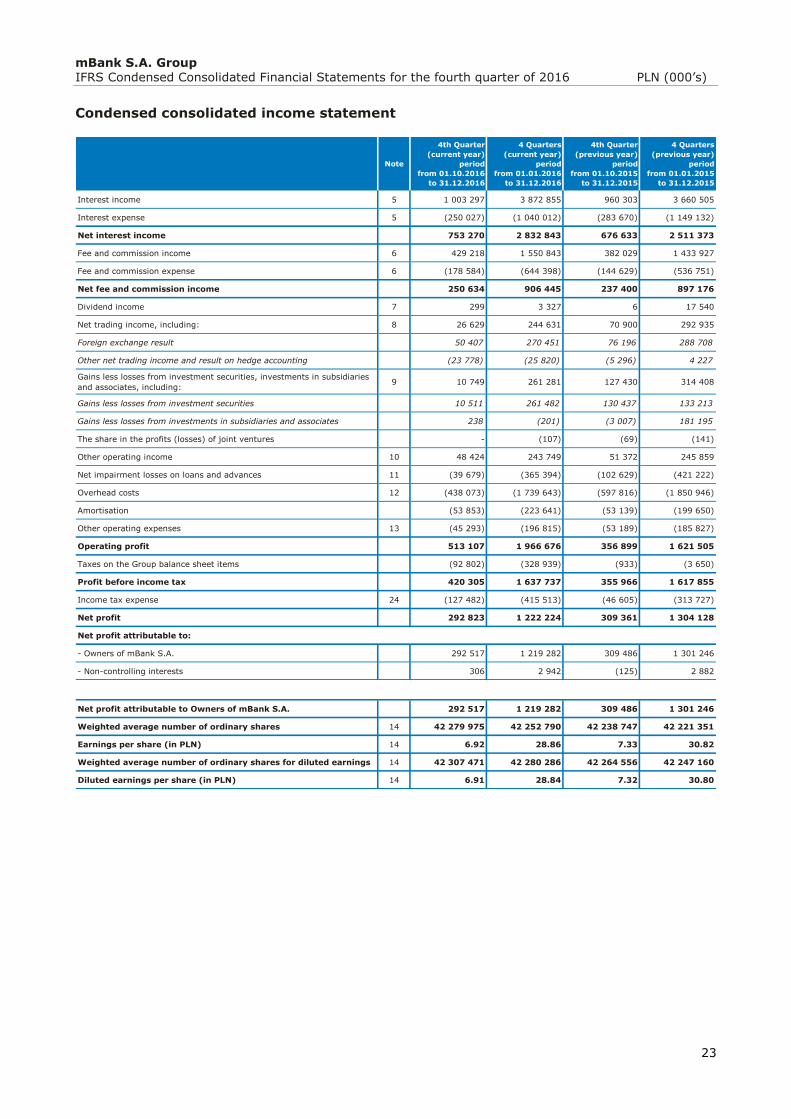
Condensed consolidated income statement
Note
4th Quarter
(current year)
period
from 01.10.2016
to 31.12.2016
4 Quarters
(current year)
period
from 01.01.2016
to 31.12.2016
4th Quarter
(previous year)
period
from 01.10.2015
to 31.12.2015
4 Quarters
(previous year)
period
from 01.01.2015
to 31.12.2015
Interest income 5 1 003 297 3 872 855 960 303 3 660 505
Interest expense 5 (250 027) (1 040 012) (283 670) (1 149 132)
Net interest income 753 270 2 832 843 676 633 2 511 373
Fee and commission income 6 429 218 1 550 843 382 029 1 433 927
Fee and commission expense 6 (178 584) (644 398) (144 629) (536 751)
Net fee and commission income 250 634 906 445 237 400 897 176
Dividend income 7 299 3 327 6 17 540
Net trading income, including: 8 26 629 244 631 70 900 292 935
Foreign exchange result 50 407 270 451 76 196 288 708
Other net trading income and result on hedge accounting (23 778) (25 820) (5 296) 4 227
Gains less losses from investment securities, investments in subsidiaries
and associates, including:9 10 749 261 281 127 430 314 408
Gains less losses from investment securities 10 511 261 482 130 437 133 213
Gains less losses from investments in subsidiaries and associates 238 (201) (3 007) 181 195
The share in the profits (losses) of joint ventures - (107) (69) (141)
Other operating income 10 48 424 243 749 51 372 245 859
Net impairment losses on loans and advances 11 (39 679) (365 394) (102 629) (421 222)
Overhead costs 12 (438 073) (1 739 643) (597 816) (1 850 946)
Amortisation (53 853) (223 641) (53 139) (199 650)
Other operating expenses 13 (45 293) (196 815) (53 189) (185 827)
Operating profit 513 107 1 966 676 356 899 1 621 505
Taxes on the Group balance sheet items (92 802) (328 939) (933) (3 650)
Profit before income tax 420 305 1 637 737 355 966 1 617 855
Income tax expense 24 (127 482) (415 513) (46 605) (313 727)
Net profit 292 823 1 222 224 309 361 1 304 128
Net profit attributable to:
- Owners of mBank S.A. 292 517 1 219 282 309 486 1 301 246
- Non-controlling interests 306 2 942 (125) 2 882
Net profit attributable to Owners of mBank S.A. 292 517 1 219 282 309 486 1 301 246
Weighted average number of ordinary shares 14 42 279 975 42 252 790 42 238 747 42 221 351
Earnings per share (in PLN) 14 6.92 28.86 7.33 30.82
Weighted average number of ordinary shares for diluted earnings 14 42 307 471 42 280 286 42 264 556 42 247 160
Diluted earnings per share (in PLN) 14 6.91 28.84 7.32 30.80
mBank S.A. Group IFRS Condensed Consolidated Financial Statements for the fourth quarter of 2016 PLN (000’s)
24
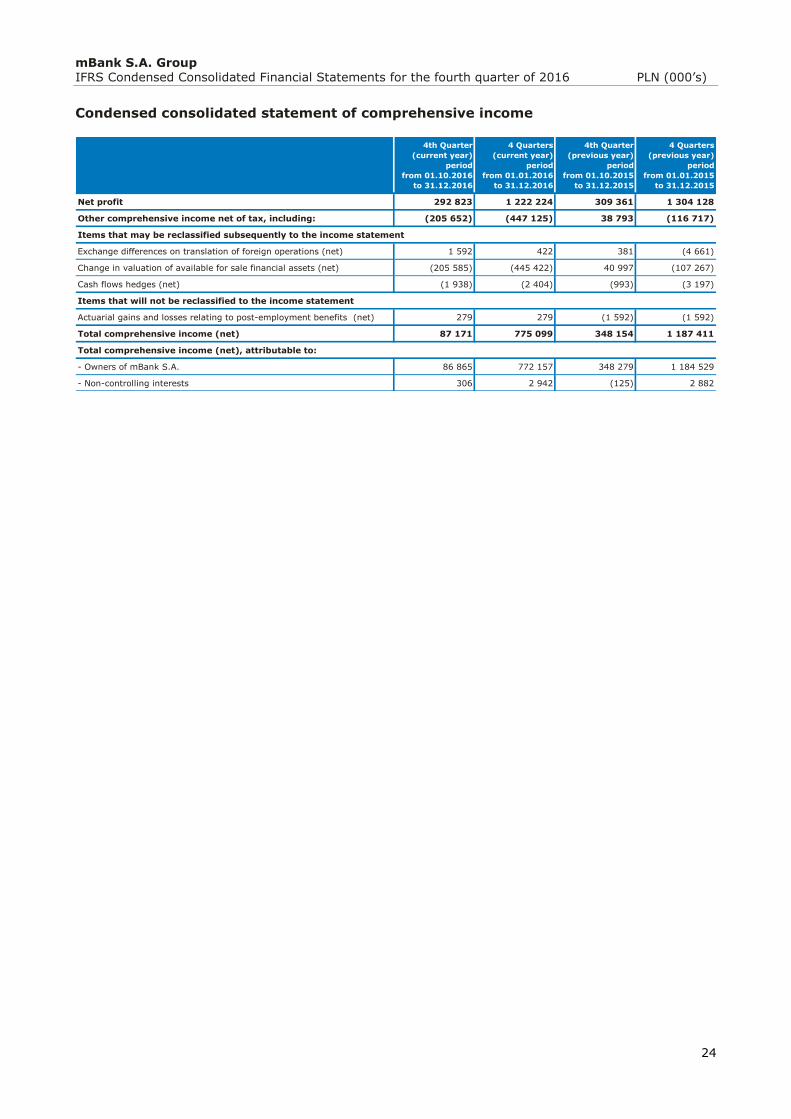
Condensed consolidated statement of comprehensive income
4th Quarter
(current year)
period
from 01.10.2016
to 31.12.2016
4 Quarters
(current year)
period
from 01.01.2016
to 31.12.2016
4th Quarter
(previous year)
period
from 01.10.2015
to 31.12.2015
4 Quarters
(previous year)
period
from 01.01.2015
to 31.12.2015
Net profit 292 823 1 222 224 309 361 1 304 128
Other comprehensive income net of tax, including: (205 652) (447 125) 38 793 (116 717)
Items that may be reclassified subsequently to the income statement
Exchange differences on translation of foreign operations (net) 1 592 422 381 (4 661)
Change in valuation of available for sale financial assets (net) (205 585) (445 422) 40 997 (107 267)
Cash flows hedges (net) (1 938) (2 404) (993) (3 197)
Items that will not be reclassified to the income statement
Actuarial gains and losses relating to post-employment benefits (net) 279 279 (1 592) (1 592)
Total comprehensive income (net) 87 171 775 099 348 154 1 187 411
Total comprehensive income (net), attributable to:
- Owners of mBank S.A. 86 865 772 157 348 279 1 184 529
- Non-controlling interests 306 2 942 (125) 2 882
mBank S.A. Group IFRS Condensed Consolidated Financial Statements for the fourth quarter of 2016 PLN (000’s)
25
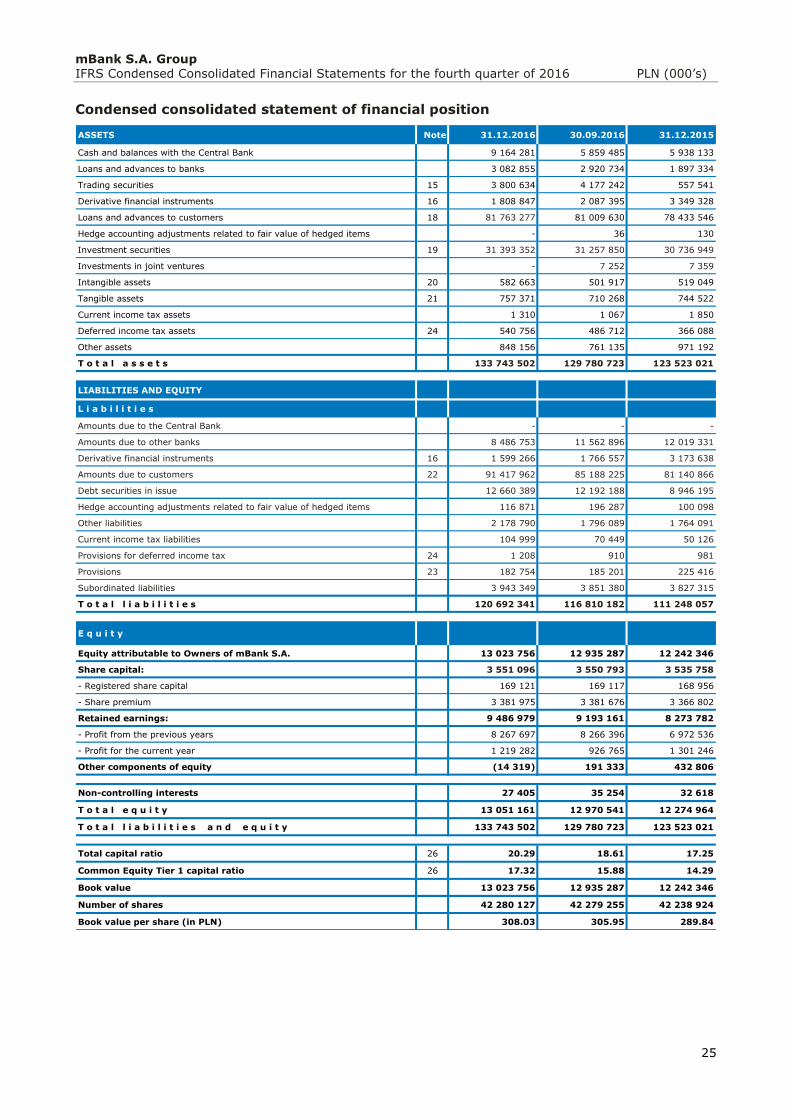
Condensed consolidated statement of financial position
ASSETS Note 31.12.2016 30.09.2016 31.12.2015
Cash and balances with the Central Bank 9 164 281 5 859 485 5 938 133
Loans and advances to banks 3 082 855 2 920 734 1 897 334
Trading securities 15 3 800 634 4 177 242 557 541
Derivative financial instruments 16 1 808 847 2 087 395 3 349 328
Loans and advances to customers 18 81 763 277 81 009 630 78 433 546
Hedge accounting adjustments related to fair value of hedged items - 36 130
Investment securities 19 31 393 352 31 257 850 30 736 949
Investments in joint ventures - 7 252 7 359
Intangible assets 20 582 663 501 917 519 049
Tangible assets 21 757 371 710 268 744 522
Current income tax assets 1 310 1 067 1 850
Deferred income tax assets 24 540 756 486 712 366 088
Other assets 848 156 761 135 971 192
T o t a l a s s e t s 133 743 502 129 780 723 123 523 021
LIABILITIES AND EQUITY
L i a b i l i t i e s
Amounts due to the Central Bank - - -
Amounts due to other banks 8 486 753 11 562 896 12 019 331
Derivative financial instruments 16 1 599 266 1 766 557 3 173 638
Amounts due to customers 22 91 417 962 85 188 225 81 140 866
Debt securities in issue 12 660 389 12 192 188 8 946 195
Hedge accounting adjustments related to fair value of hedged items 116 871 196 287 100 098
Other liabilities 2 178 790 1 796 089 1 764 091
Current income tax liabilities 104 999 70 449 50 126
Provisions for deferred income tax 24 1 208 910 981
Provisions 23 182 754 185 201 225 416
Subordinated liabilities 3 943 349 3 851 380 3 827 315
T o t a l l i a b i l i t i e s 120 692 341 116 810 182 111 248 057
E q u i t y
Equity attributable to Owners of mBank S.A. 13 023 756 12 935 287 12 242 346
Share capital: 3 551 096 3 550 793 3 535 758
- Registered share capital 169 121 169 117 168 956
- Share premium 3 381 975 3 381 676 3 366 802
Retained earnings: 9 486 979 9 193 161 8 273 782
- Profit from the previous years 8 267 697 8 266 396 6 972 536
- Profit for the current year 1 219 282 926 765 1 301 246
Other components of equity (14 319) 191 333 432 806
Non-controlling interests 27 405 35 254 32 618
T o t a l e q u i t y 13 051 161 12 970 541 12 274 964
T o t a l l i a b i l i t i e s a n d e q u i t y 133 743 502 129 780 723 123 523 021
Total capital ratio 26 20.29 18.61 17.25
Common Equity Tier 1 capital ratio 26 17.32 15.88 14.29
Book value 13 023 756 12 935 287 12 242 346
Number of shares 42 280 127 42 279 255 42 238 924
Book value per share (in PLN) 308.03 305.95 289.84
mBank S.A. Group IFRS Condensed Consolidated Financial Statements for the fourth quarter of 2016 PLN (000’s)
26
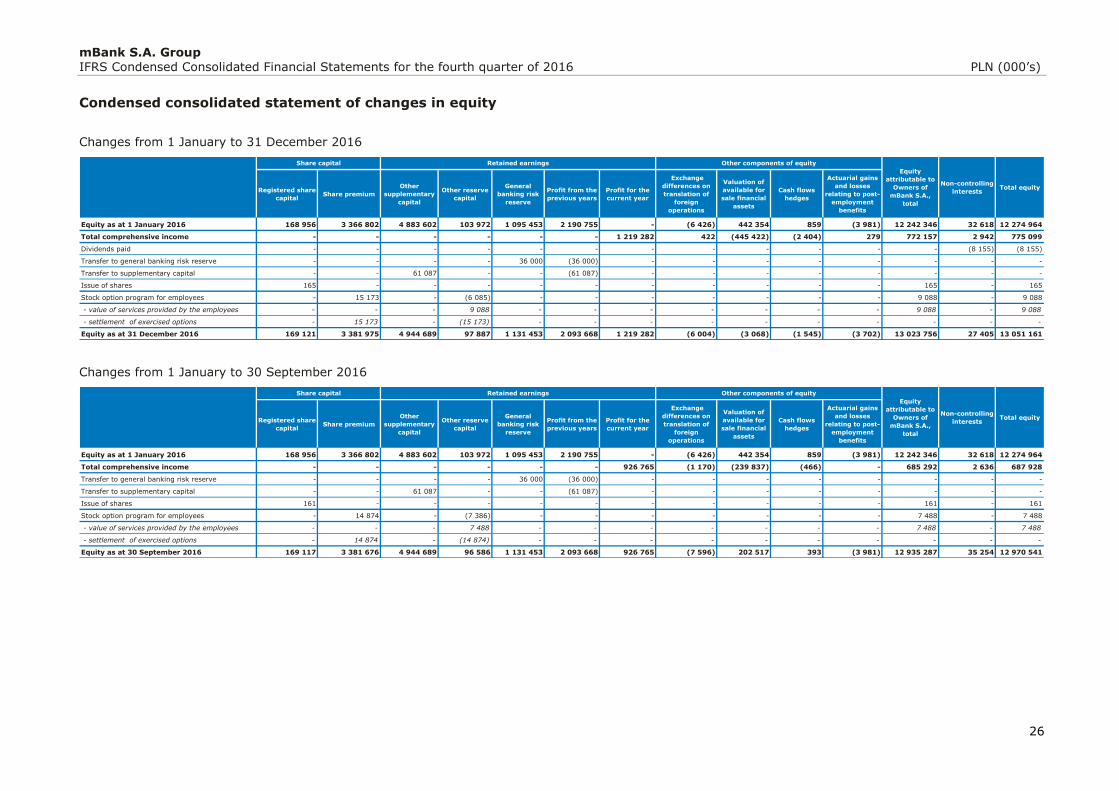
Condensed consolidated statement of changes in equity
Changes from 1 January to 31 December 2016
Changes from 1 January to 30 September 2016
Registered share
capitalShare premium
Other
supplementary
capital
Other reserve
capital
General
banking risk
reserve
Profit from the
previous years
Profit for the
current year
Exchange
differences on
translation of
foreign
operations
Valuation of
available for
sale financial
assets
Cash flows
hedges
Actuarial gains
and losses
relating to post-
employment
benefits
Equity as at 1 January 2016 168 956 3 366 802 4 883 602 103 972 1 095 453 2 190 755 - (6 426) 442 354 859 (3 981) 12 242 346 32 618 12 274 964
Total comprehensive income - - - - - - 1 219 282 422 (445 422) (2 404) 279 772 157 2 942 775 099
Dividends paid - - - - - - - - - - - - (8 155) (8 155)
Transfer to general banking risk reserve - - - - 36 000 (36 000) - - - - - - - -
Transfer to supplementary capital - - 61 087 - - (61 087) - - - - - - - -
Issue of shares 165 - - - - - - - - - - 165 - 165
Stock option program for employees - 15 173 - (6 085) - - - - - - - 9 088 - 9 088
- value of services provided by the employees - - - 9 088 - - - - - - - 9 088 - 9 088
- settlement of exercised options - 15 173 - (15 173) - - - - - - - - - -
Equity as at 31 December 2016 169 121 3 381 975 4 944 689 97 887 1 131 453 2 093 668 1 219 282 (6 004) (3 068) (1 545) (3 702) 13 023 756 27 405 13 051 161
Total equity
Share capital Retained earnings Other components of equity
Equity
attributable to
Owners of
mBank S.A.,
total
Non-controlling
interests
Registered share
capitalShare premium
Other
supplementary
capital
Other reserve
capital
General
banking risk
reserve
Profit from the
previous years
Profit for the
current year
Exchange
differences on
translation of
foreign
operations
Valuation of
available for
sale financial
assets
Cash flows
hedges
Actuarial gains
and losses
relating to post-
employment
benefits
Equity as at 1 January 2016 168 956 3 366 802 4 883 602 103 972 1 095 453 2 190 755 - (6 426) 442 354 859 (3 981) 12 242 346 32 618 12 274 964
Total comprehensive income - - - - - - 926 765 (1 170) (239 837) (466) - 685 292 2 636 687 928
Transfer to general banking risk reserve - - - - 36 000 (36 000) - - - - - - - -
Transfer to supplementary capital - - 61 087 - - (61 087) - - - - - - - -
Issue of shares 161 - - - - - - - - - - 161 - 161
Stock option program for employees - 14 874 - (7 386) - - - - - - - 7 488 - 7 488
- value of services provided by the employees - - - 7 488 - - - - - - - 7 488 - 7 488
- settlement of exercised options - 14 874 - (14 874) - - - - - - - - - -
Equity as at 30 September 2016 169 117 3 381 676 4 944 689 96 586 1 131 453 2 093 668 926 765 (7 596) 202 517 393 (3 981) 12 935 287 35 254 12 970 541
Share capital Retained earnings Other components of equity
Equity
attributable to
Owners of
mBank S.A.,
total
Non-controlling
interestsTotal equity
mBank S.A. Group IFRS Condensed Consolidated Financial Statements for the fourth quarter of 2016 PLN (000’s)
27
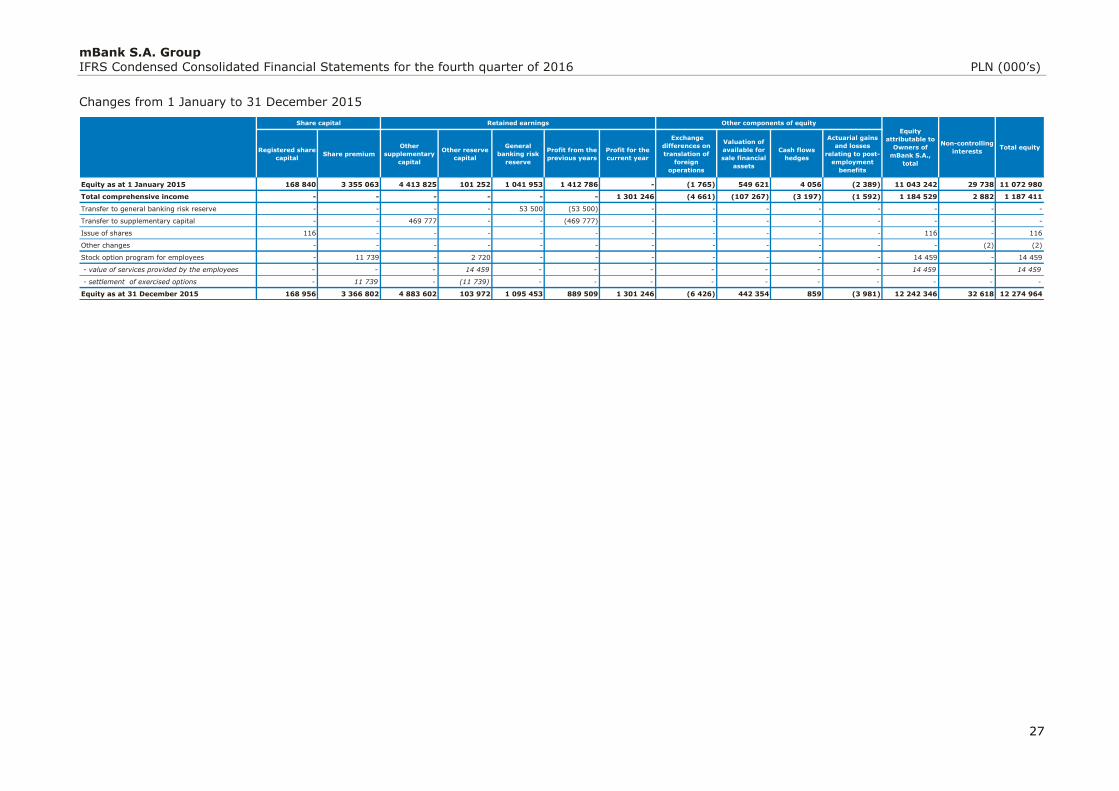
Changes from 1 January to 31 December 2015
Registered share
capitalShare premium
Other
supplementary
capital
Other reserve
capital
General
banking risk
reserve
Profit from the
previous years
Profit for the
current year
Exchange
differences on
translation of
foreign
operations
Valuation of
available for
sale financial
assets
Cash flows
hedges
Actuarial gains
and losses
relating to post-
employment
benefits
Equity as at 1 January 2015 168 840 3 355 063 4 413 825 101 252 1 041 953 1 412 786 - (1 765) 549 621 4 056 (2 389) 11 043 242 29 738 11 072 980
Total comprehensive income - - - - - - 1 301 246 (4 661) (107 267) (3 197) (1 592) 1 184 529 2 882 1 187 411
Transfer to general banking risk reserve - - - - 53 500 (53 500) - - - - - - - -
Transfer to supplementary capital - - 469 777 - - (469 777) - - - - - - - -
Issue of shares 116 - - - - - - - - - - 116 - 116
Other changes - - - - - - - - - - - - (2) (2)
Stock option program for employees - 11 739 - 2 720 - - - - - - - 14 459 - 14 459
- value of services provided by the employees - - - 14 459 - - - - - - - 14 459 - 14 459
- settlement of exercised options - 11 739 - (11 739) - - - - - - - - - -
Equity as at 31 December 2015 168 956 3 366 802 4 883 602 103 972 1 095 453 889 509 1 301 246 (6 426) 442 354 859 (3 981) 12 242 346 32 618 12 274 964
Share capital Retained earnings Other components of equity
Equity
attributable to
Owners of
mBank S.A.,
total
Non-controlling
interestsTotal equity
mBank S.A. Group IFRS Condensed Consolidated Financial Statements for the fourth quarter of 2016 PLN (000’s)
28
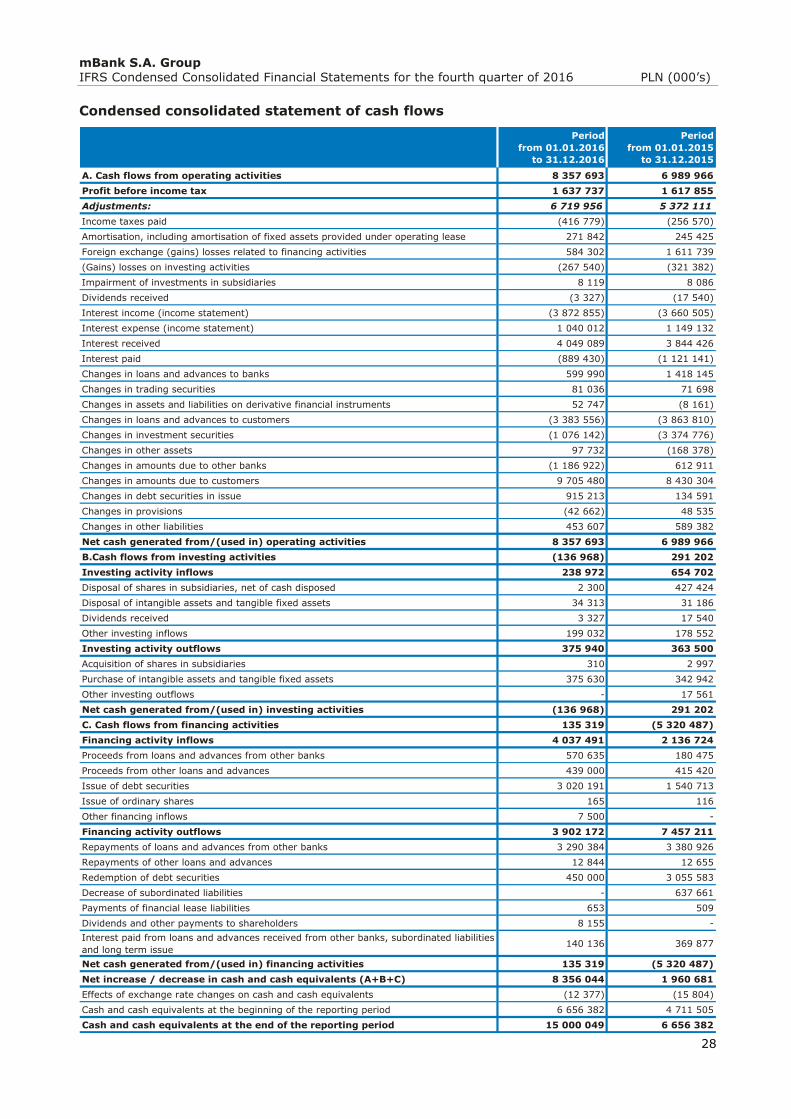
Condensed consolidated statement of cash flows
Period
from 01.01.2016
to 31.12.2016
Period
from 01.01.2015
to 31.12.2015
A. Cash flows from operating activities 8 357 693 6 989 966
Profit before income tax 1 637 737 1 617 855
Adjustments: 6 719 956 5 372 111
Income taxes paid (416 779) (256 570)
Amortisation, including amortisation of fixed assets provided under operating lease 271 842 245 425
Foreign exchange (gains) losses related to financing activities 584 302 1 611 739
(Gains) losses on investing activities (267 540) (321 382)
Impairment of investments in subsidiaries 8 119 8 086
Dividends received (3 327) (17 540)
Interest income (income statement) (3 872 855) (3 660 505)
Interest expense (income statement) 1 040 012 1 149 132
Interest received 4 049 089 3 844 426
Interest paid (889 430) (1 121 141)
Changes in loans and advances to banks 599 990 1 418 145
Changes in trading securities 81 036 71 698
Changes in assets and liabilities on derivative financial instruments 52 747 (8 161)
Changes in loans and advances to customers (3 383 556) (3 863 810)
Changes in investment securities (1 076 142) (3 374 776)
Changes in other assets 97 732 (168 378)
Changes in amounts due to other banks (1 186 922) 612 911
Changes in amounts due to customers 9 705 480 8 430 304
Changes in debt securities in issue 915 213 134 591
Changes in provisions (42 662) 48 535
Changes in other liabilities 453 607 589 382
Net cash generated from/(used in) operating activities 8 357 693 6 989 966
B.Cash flows from investing activities (136 968) 291 202
Investing activity inflows 238 972 654 702
Disposal of shares in subsidiaries, net of cash disposed 2 300 427 424
Disposal of intangible assets and tangible fixed assets 34 313 31 186
Dividends received 3 327 17 540
Other investing inflows 199 032 178 552
Investing activity outflows 375 940 363 500
Acquisition of shares in subsidiaries 310 2 997
Purchase of intangible assets and tangible fixed assets 375 630 342 942
Other investing outflows - 17 561
Net cash generated from/(used in) investing activities (136 968) 291 202
C. Cash flows from financing activities 135 319 (5 320 487)
Financing activity inflows 4 037 491 2 136 724
Proceeds from loans and advances from other banks 570 635 180 475
Proceeds from other loans and advances 439 000 415 420
Issue of debt securities 3 020 191 1 540 713
Issue of ordinary shares 165 116
Other financing inflows 7 500 -
Financing activity outflows 3 902 172 7 457 211
Repayments of loans and advances from other banks 3 290 384 3 380 926
Repayments of other loans and advances 12 844 12 655
Redemption of debt securities 450 000 3 055 583
Decrease of subordinated liabilities - 637 661
Payments of financial lease liabilities 653 509
Dividends and other payments to shareholders 8 155 -
Interest paid from loans and advances received from other banks, subordinated liabilities
and long term issue140 136 369 877
Net cash generated from/(used in) financing activities 135 319 (5 320 487)
Net increase / decrease in cash and cash equivalents (A+B+C) 8 356 044 1 960 681
Effects of exchange rate changes on cash and cash equivalents (12 377) (15 804)
Cash and cash equivalents at the beginning of the reporting period 6 656 382 4 711 505
Cash and cash equivalents at the end of the reporting period 15 000 049 6 656 382
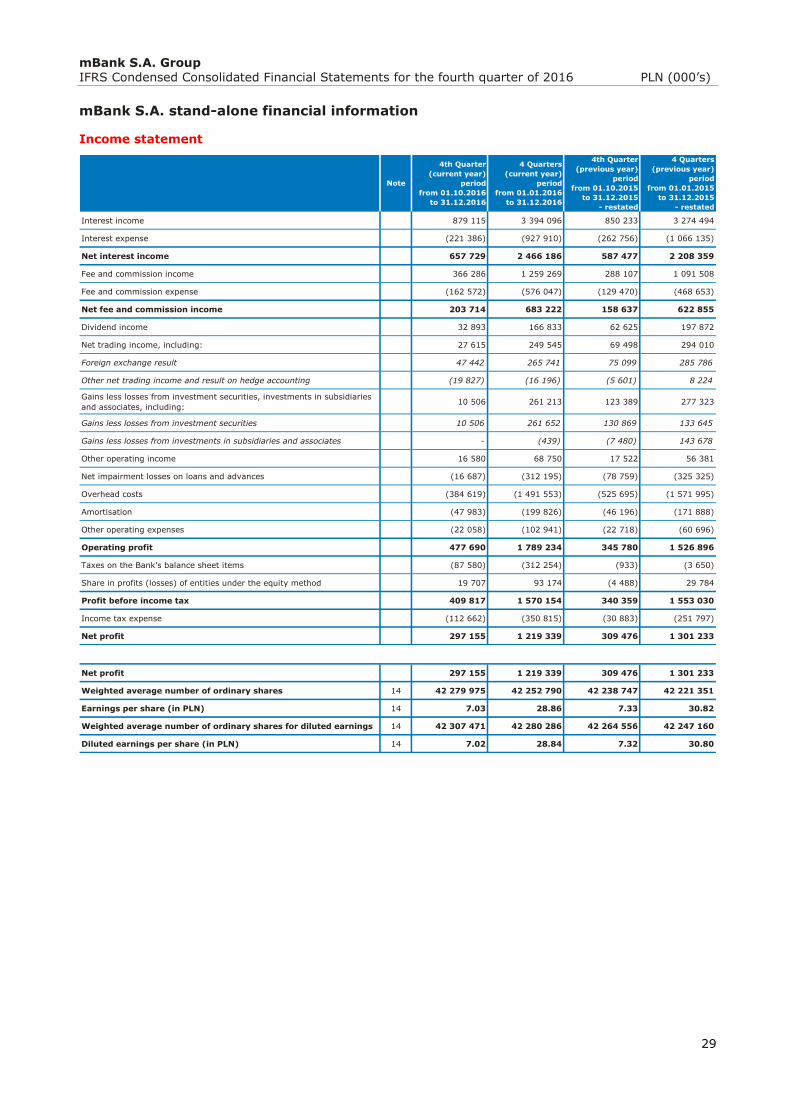
mBank S.A. Group IFRS Condensed Consolidated Financial Statements for the fourth quarter of 2016 PLN (000’s)
29
mBank S.A. stand-alone financial information
Income statement
Note
4th Quarter
(current year)
period
from 01.10.2016
to 31.12.2016
4 Quarters
(current year)
period
from 01.01.2016
to 31.12.2016
4th Quarter
(previous year)
period
from 01.10.2015
to 31.12.2015
- restated
4 Quarters
(previous year)
period
from 01.01.2015
to 31.12.2015
- restated
Interest income 879 115 3 394 096 850 233 3 274 494
Interest expense (221 386) (927 910) (262 756) (1 066 135)
Net interest income 657 729 2 466 186 587 477 2 208 359
Fee and commission income 366 286 1 259 269 288 107 1 091 508
Fee and commission expense (162 572) (576 047) (129 470) (468 653)
Net fee and commission income 203 714 683 222 158 637 622 855
Dividend income 32 893 166 833 62 625 197 872
Net trading income, including: 27 615 249 545 69 498 294 010
Foreign exchange result 47 442 265 741 75 099 285 786
Other net trading income and result on hedge accounting (19 827) (16 196) (5 601) 8 224
Gains less losses from investment securities, investments in subsidiaries
and associates, including:10 506 261 213 123 389 277 323
Gains less losses from investment securities 10 506 261 652 130 869 133 645
Gains less losses from investments in subsidiaries and associates - (439) (7 480) 143 678
Other operating income 16 580 68 750 17 522 56 381
Net impairment losses on loans and advances (16 687) (312 195) (78 759) (325 325)
Overhead costs (384 619) (1 491 553) (525 695) (1 571 995)
Amortisation (47 983) (199 826) (46 196) (171 888)
Other operating expenses (22 058) (102 941) (22 718) (60 696)
Operating profit 477 690 1 789 234 345 780 1 526 896
Taxes on the Bank's balance sheet items (87 580) (312 254) (933) (3 650)
Share in profits (losses) of entities under the equity method 19 707 93 174 (4 488) 29 784
Profit before income tax 409 817 1 570 154 340 359 1 553 030
Income tax expense (112 662) (350 815) (30 883) (251 797)
Net profit 297 155 1 219 339 309 476 1 301 233
Net profit 297 155 1 219 339 309 476 1 301 233
Weighted average number of ordinary shares 14 42 279 975 42 252 790 42 238 747 42 221 351
Earnings per share (in PLN) 14 7.03 28.86 7.33 30.82
Weighted average number of ordinary shares for diluted earnings 14 42 307 471 42 280 286 42 264 556 42 247 160
Diluted earnings per share (in PLN) 14 7.02 28.84 7.32 30.80
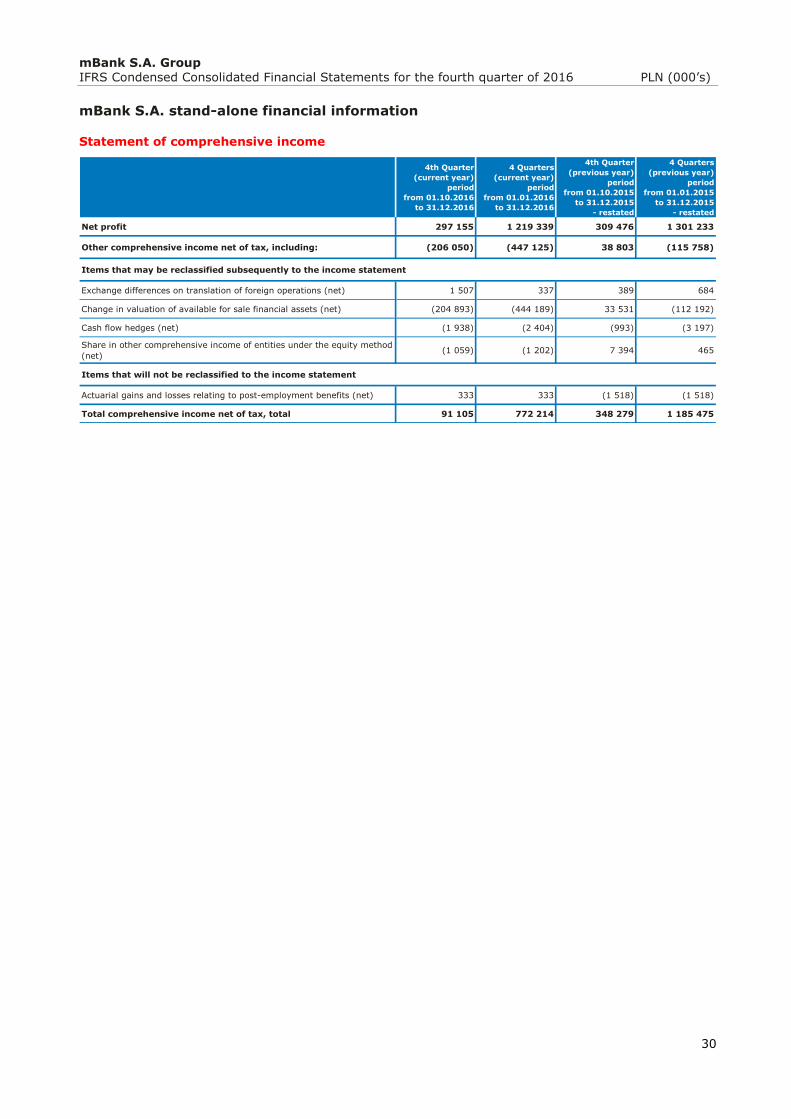
mBank S.A. Group IFRS Condensed Consolidated Financial Statements for the fourth quarter of 2016 PLN (000’s)
30
mBank S.A. stand-alone financial information
Statement of comprehensive income
4th Quarter
(current year)
period
from 01.10.2016
to 31.12.2016
4 Quarters
(current year)
period
from 01.01.2016
to 31.12.2016
4th Quarter
(previous year)
period
from 01.10.2015
to 31.12.2015
- restated
4 Quarters
(previous year)
period
from 01.01.2015
to 31.12.2015
- restated
Net profit 297 155 1 219 339 309 476 1 301 233
Other comprehensive income net of tax, including: (206 050) (447 125) 38 803 (115 758)
Items that may be reclassified subsequently to the income statement
Exchange differences on translation of foreign operations (net) 1 507 337 389 684
Change in valuation of available for sale financial assets (net) (204 893) (444 189) 33 531 (112 192)
Cash flow hedges (net) (1 938) (2 404) (993) (3 197)
Share in other comprehensive income of entities under the equity method
(net)(1 059) (1 202) 7 394 465
Items that will not be reclassified to the income statement
Actuarial gains and losses relating to post-employment benefits (net) 333 333 (1 518) (1 518)
Total comprehensive income net of tax, total 91 105 772 214 348 279 1 185 475
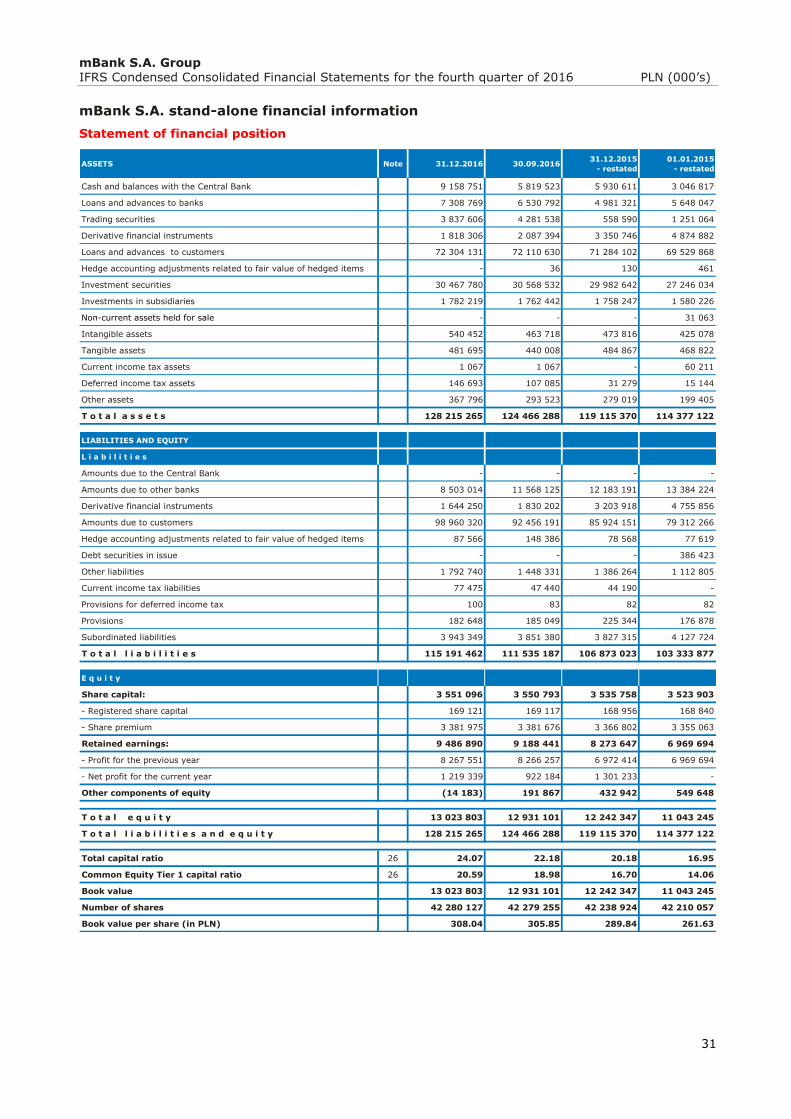
mBank S.A. Group IFRS Condensed Consolidated Financial Statements for the fourth quarter of 2016 PLN (000’s)
31
mBank S.A. stand-alone financial information
Statement of financial position
ASSETS Note 31.12.2016 30.09.201631.12.2015
- restated
01.01.2015
- restated
Cash and balances with the Central Bank 9 158 751 5 819 523 5 930 611 3 046 817
Loans and advances to banks 7 308 769 6 530 792 4 981 321 5 648 047
Trading securities 3 837 606 4 281 538 558 590 1 251 064
Derivative financial instruments 1 818 306 2 087 394 3 350 746 4 874 882
Loans and advances to customers 72 304 131 72 110 630 71 284 102 69 529 868
Hedge accounting adjustments related to fair value of hedged items - 36 130 461
Investment securities 30 467 780 30 568 532 29 982 642 27 246 034
Investments in subsidiaries 1 782 219 1 762 442 1 758 247 1 580 226
Non-current assets held for sale - - - 31 063
Intangible assets 540 452 463 718 473 816 425 078
Tangible assets 481 695 440 008 484 867 468 822
Current income tax assets 1 067 1 067 - 60 211
Deferred income tax assets 146 693 107 085 31 279 15 144
Other assets 367 796 293 523 279 019 199 405
T o t a l a s s e t s 128 215 265 124 466 288 119 115 370 114 377 122
LIABILITIES AND EQUITY
L i a b i l i t i e s
Amounts due to the Central Bank - - - -
Amounts due to other banks 8 503 014 11 568 125 12 183 191 13 384 224
Derivative financial instruments 1 644 250 1 830 202 3 203 918 4 755 856
Amounts due to customers 98 960 320 92 456 191 85 924 151 79 312 266
Hedge accounting adjustments related to fair value of hedged items 87 566 148 386 78 568 77 619
Debt securities in issue - - - 386 423
Other liabilities 1 792 740 1 448 331 1 386 264 1 112 805
Current income tax liabilities 77 475 47 440 44 190 -
Provisions for deferred income tax 100 83 82 82
Provisions 182 648 185 049 225 344 176 878
Subordinated liabilities 3 943 349 3 851 380 3 827 315 4 127 724
T o t a l l i a b i l i t i e s 115 191 462 111 535 187 106 873 023 103 333 877
E q u i t y
Share capital: 3 551 096 3 550 793 3 535 758 3 523 903
- Registered share capital 169 121 169 117 168 956 168 840
- Share premium 3 381 975 3 381 676 3 366 802 3 355 063
Retained earnings: 9 486 890 9 188 441 8 273 647 6 969 694
- Profit for the previous year 8 267 551 8 266 257 6 972 414 6 969 694
- Net profit for the current year 1 219 339 922 184 1 301 233 -
Other components of equity (14 183) 191 867 432 942 549 648
T o t a l e q u i t y 13 023 803 12 931 101 12 242 347 11 043 245
T o t a l l i a b i l i t i e s a n d e q u i t y 128 215 265 124 466 288 119 115 370 114 377 122
Total capital ratio 26 24.07 22.18 20.18 16.95
Common Equity Tier 1 capital ratio 26 20.59 18.98 16.70 14.06
Book value 13 023 803 12 931 101 12 242 347 11 043 245
Number of shares 42 280 127 42 279 255 42 238 924 42 210 057
Book value per share (in PLN) 308.04 305.85 289.84 261.63
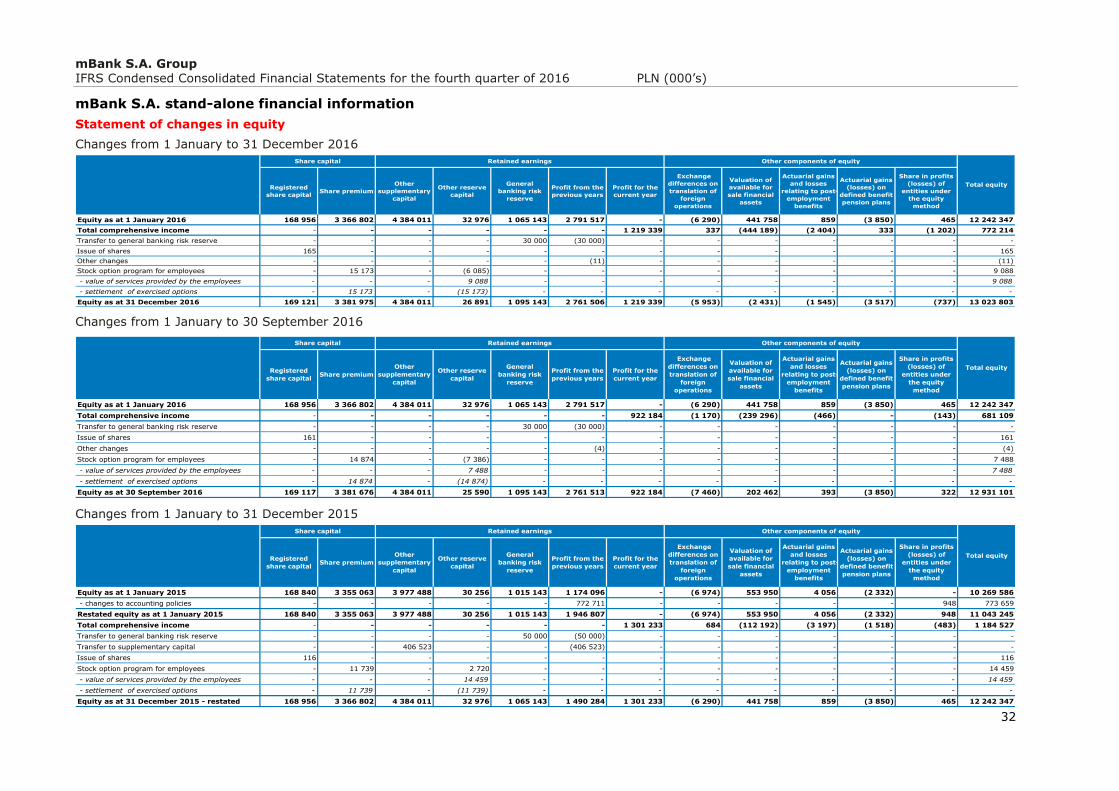
mBank S.A. Group IFRS Condensed Consolidated Financial Statements for the fourth quarter of 2016 PLN (000’s)
32
mBank S.A. stand-alone financial information
Statement of changes in equity
Changes from 1 January to 31 December 2016
Changes from 1 January to 30 September 2016
Changes from 1 January to 31 December 2015
Registered
share capitalShare premium
Other
supplementary
capital
Other reserve
capital
General
banking risk
reserve
Profit from the
previous years
Profit for the
current year
Exchange
differences on
translation of
foreign
operations
Valuation of
available for
sale financial
assets
Actuarial gains
and losses
relating to post-
employment
benefits
Actuarial gains
(losses) on
defined benefit
pension plans
Share in profits
(losses) of
entities under
the equity
method
Equity as at 1 January 2016 168 956 3 366 802 4 384 011 32 976 1 065 143 2 791 517 - (6 290) 441 758 859 (3 850) 465 12 242 347
Total comprehensive income - - - - - - 1 219 339 337 (444 189) (2 404) 333 (1 202) 772 214
Transfer to general banking risk reserve - - - - 30 000 (30 000) - - - - - - -
Issue of shares 165 - - - - - - - - - - - 165
Other changes - - - - - (11) - - - - - - (11)
Stock option program for employees - 15 173 - (6 085) - - - - - - - - 9 088
- value of services provided by the employees - - - 9 088 - - - - - - - - 9 088
- settlement of exercised options - 15 173 - (15 173) - - - - - - - - -
Equity as at 31 December 2016 169 121 3 381 975 4 384 011 26 891 1 095 143 2 761 506 1 219 339 (5 953) (2 431) (1 545) (3 517) (737) 13 023 803
Share capital Retained earnings Other components of equity
Total equity
Registered
share capitalShare premium
Other
supplementary
capital
Other reserve
capital
General
banking risk
reserve
Profit from the
previous years
Profit for the
current year
Exchange
differences on
translation of
foreign
operations
Valuation of
available for
sale financial
assets
Actuarial gains
and losses
relating to post-
employment
benefits
Actuarial gains
(losses) on
defined benefit
pension plans
Share in profits
(losses) of
entities under
the equity
method
Equity as at 1 January 2016 168 956 3 366 802 4 384 011 32 976 1 065 143 2 791 517 - (6 290) 441 758 859 (3 850) 465 12 242 347
Total comprehensive income - - - - - - 922 184 (1 170) (239 296) (466) - (143) 681 109
Transfer to general banking risk reserve - - - - 30 000 (30 000) - - - - - - -
Issue of shares 161 - - - - - - - - - - - 161
Other changes - - - - - (4) - - - - - - (4)
Stock option program for employees - 14 874 - (7 386) - - - - - - - - 7 488
- value of services provided by the employees - - - 7 488 - - - - - - - - 7 488
- settlement of exercised options - 14 874 - (14 874) - - - - - - - - -
Equity as at 30 September 2016 169 117 3 381 676 4 384 011 25 590 1 095 143 2 761 513 922 184 (7 460) 202 462 393 (3 850) 322 12 931 101
Share capital Retained earnings Other components of equity
Total equity
Registered
share capitalShare premium
Other
supplementary
capital
Other reserve
capital
General
banking risk
reserve
Profit from the
previous years
Profit for the
current year
Exchange
differences on
translation of
foreign
operations
Valuation of
available for
sale financial
assets
Actuarial gains
and losses
relating to post-
employment
benefits
Actuarial gains
(losses) on
defined benefit
pension plans
Share in profits
(losses) of
entities under
the equity
method
Equity as at 1 January 2015 168 840 3 355 063 3 977 488 30 256 1 015 143 1 174 096 - (6 974) 553 950 4 056 (2 332) - 10 269 586
- changes to accounting policies - - - - - 772 711 - - - - - 948 773 659
Restated equity as at 1 January 2015 168 840 3 355 063 3 977 488 30 256 1 015 143 1 946 807 - (6 974) 553 950 4 056 (2 332) 948 11 043 245
Total comprehensive income - - - - - - 1 301 233 684 (112 192) (3 197) (1 518) (483) 1 184 527
Transfer to general banking risk reserve - - - - 50 000 (50 000) - - - - - - -
Transfer to supplementary capital - - 406 523 - - (406 523) - - - - - - -
Issue of shares 116 - - - - - - - - - - - 116
Stock option program for employees - 11 739 - 2 720 - - - - - - - - 14 459
- value of services provided by the employees - - - 14 459 - - - - - - - - 14 459
- settlement of exercised options - 11 739 - (11 739) - - - - - - - - -
Equity as at 31 December 2015 - restated 168 956 3 366 802 4 384 011 32 976 1 065 143 1 490 284 1 301 233 (6 290) 441 758 859 (3 850) 465 12 242 347
Retained earnings
Total equity
Share capital Other components of equity
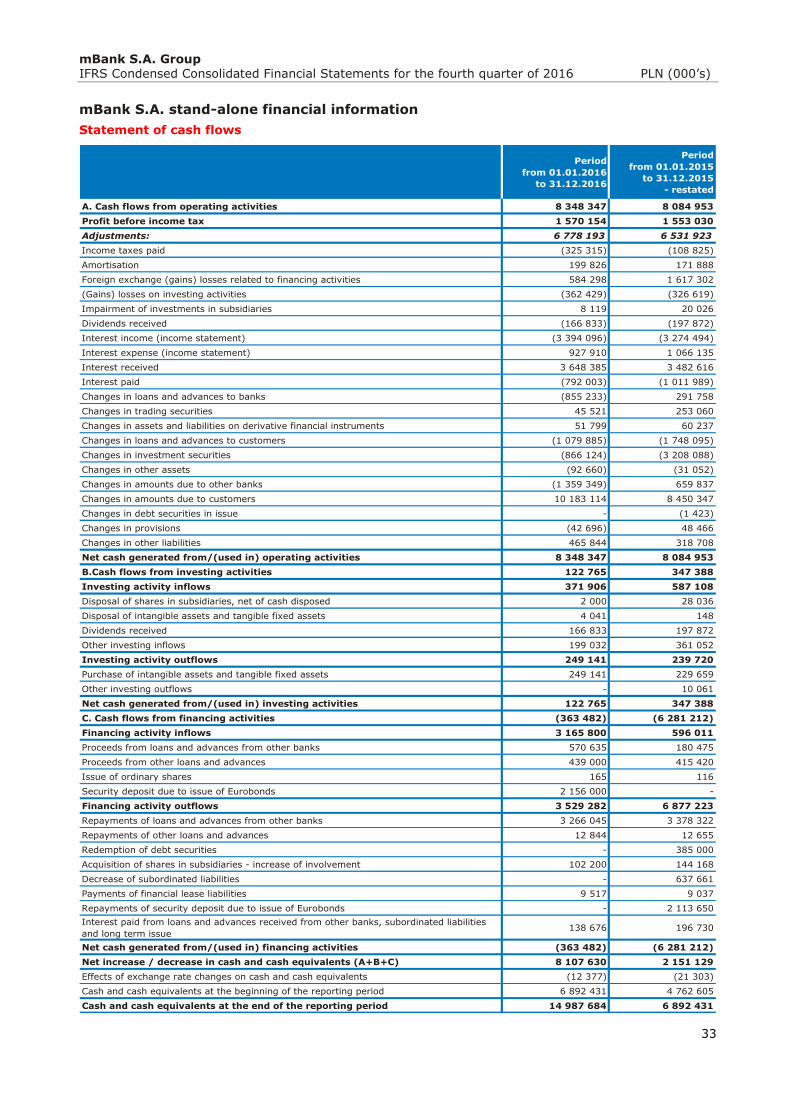
mBank S.A. Group IFRS Condensed Consolidated Financial Statements for the fourth quarter of 2016 PLN (000’s)
33
mBank S.A. stand-alone financial information
Statement of cash flows
Period
from 01.01.2016
to 31.12.2016
Period
from 01.01.2015
to 31.12.2015
- restated
A. Cash flows from operating activities 8 348 347 8 084 953
Profit before income tax 1 570 154 1 553 030
Adjustments: 6 778 193 6 531 923
Income taxes paid (325 315) (108 825)
Amortisation 199 826 171 888
Foreign exchange (gains) losses related to financing activities 584 298 1 617 302
(Gains) losses on investing activities (362 429) (326 619)
Impairment of investments in subsidiaries 8 119 20 026
Dividends received (166 833) (197 872)
Interest income (income statement) (3 394 096) (3 274 494)
Interest expense (income statement) 927 910 1 066 135
Interest received 3 648 385 3 482 616
Interest paid (792 003) (1 011 989)
Changes in loans and advances to banks (855 233) 291 758
Changes in trading securities 45 521 253 060
Changes in assets and liabilities on derivative financial instruments 51 799 60 237
Changes in loans and advances to customers (1 079 885) (1 748 095)
Changes in investment securities (866 124) (3 208 088)
Changes in other assets (92 660) (31 052)
Changes in amounts due to other banks (1 359 349) 659 837
Changes in amounts due to customers 10 183 114 8 450 347
Changes in debt securities in issue - (1 423)
Changes in provisions (42 696) 48 466
Changes in other liabilities 465 844 318 708
Net cash generated from/(used in) operating activities 8 348 347 8 084 953
B.Cash flows from investing activities 122 765 347 388
Investing activity inflows 371 906 587 108
Disposal of shares in subsidiaries, net of cash disposed 2 000 28 036
Disposal of intangible assets and tangible fixed assets 4 041 148
Dividends received 166 833 197 872
Other investing inflows 199 032 361 052
Investing activity outflows 249 141 239 720
Purchase of intangible assets and tangible fixed assets 249 141 229 659
Other investing outflows - 10 061
Net cash generated from/(used in) investing activities 122 765 347 388
C. Cash flows from financing activities (363 482) (6 281 212)
Financing activity inflows 3 165 800 596 011
Proceeds from loans and advances from other banks 570 635 180 475
Proceeds from other loans and advances 439 000 415 420
Issue of ordinary shares 165 116
Security deposit due to issue of Eurobonds 2 156 000 -
Financing activity outflows 3 529 282 6 877 223
Repayments of loans and advances from other banks 3 266 045 3 378 322
Repayments of other loans and advances 12 844 12 655
Redemption of debt securities - 385 000
Acquisition of shares in subsidiaries - increase of involvement 102 200 144 168
Decrease of subordinated liabilities - 637 661
Payments of financial lease liabilities 9 517 9 037
Repayments of security deposit due to issue of Eurobonds - 2 113 650
Interest paid from loans and advances received from other banks, subordinated liabilities
and long term issue138 676 196 730
Net cash generated from/(used in) financing activities (363 482) (6 281 212)
Net increase / decrease in cash and cash equivalents (A+B+C) 8 107 630 2 151 129
Effects of exchange rate changes on cash and cash equivalents (12 377) (21 303)
Cash and cash equivalents at the beginning of the reporting period 6 892 431 4 762 605
Cash and cash equivalents at the end of the reporting period 14 987 684 6 892 431
mBank S.A. Group IFRS Condensed Consolidated Financial Statements for the fourth quarter of 2016 PLN (000’s)
34
Explanatory notes to the condensed consolidated financial statements
1. Information regarding the Group of mBank S.A.
The Group of mBank S.A. (“Group”, “mBank Group”) consists of entities under the control of mBank S.A.
(“Bank”, “mBank”) of the following nature:
strategic: shares and equity interests in companies supporting particular business lines of mBank S.A. (corporates and financial markets segment, retail banking segment and other) with an investment horizon not shorter than 3 years. The formation or acquisition of these companies was intended to expand the range of services offered to the clients of the Bank;
other: shares and equity interests in companies acquired in exchange for receivables, in transactions
resulting from composition and work out agreements with debtors, with the intention to recover a part or all claims to loan receivables and insolvent companies under liquidation or receivership.
The parent entity of the Group is mBank S.A., which is a joint stock company registered in Poland and a part of Commerzbank AG Group.
The head office of the Bank is located at 18 Senatorska St., Warsaw.
The shares of the Bank are listed on the Warsaw Stock Exchange.
As at 31 December 2016, mBank S.A. Group covered by the condensed consolidated financial statements comprised the following companies:
mBank S.A., the parent entity
mBank S.A. was established under the name of Bank Rozwoju Eksportu SA by Resolution of the Council of Ministers N 99 of 20 June 1986. The Bank was registered pursuant to the legally valid decision of the
District Court for the Capital City of Warsaw, 16th Economic Registration Division, on 23 December 1986 in the Business Register under the number RHB 14036. The 9th Extraordinary Meeting of Shareholders held on 4 March 1999 adopted the resolution changing the Bank’s name to BRE Bank S.A. The new name
of the Bank was entered in the Business Register on 23 March 1999. On 11 July 2001, the District Court in Warsaw issued the decision on the entry of the Bank in the National Court Register (KRS) under number KRS 0000025237.
On 22 November 2013, the District Court for the Capital City of Warsaw, 12th Commercial Division of the National Court Register, registered the amendments to the Bank’s By-lows arising from Resolutions N26 and Resolutions N27 of the 26th Annual General Meeting of mBank S.A., which was held on
11 April 2013. With the registration of changes in By-lows, the name of the Bank has changed from the
current BRE Bank Spółka Akcyjna on mBank Spółka Akcyjna (abbreviated mBank S.A.).
According to the Polish Classification of Business Activities, the business of the Bank was classified as “Other monetary intermediation” under number 6419Z. According to the Stock Exchange Quotation, the Bank is classified as “Banks” sector as part of the “Finance” macro-sector.
According to the By-laws of the Bank, the scope of its business consists of providing banking services and consulting and advisory services in financial matters, as well as of conducting business activities within the scope described in its By-laws. The Bank operates within the scope of corporate, institutional and retail banking (including private banking) throughout the whole country and operates trade and investment activities as well as brokerage activities.
The Bank provides services to Polish and international corporations and individuals, both in the local currency (Polish Zloty, PLN) and in foreign currencies.
The Bank may open and maintain accounts in Polish and foreign banks, and can possess foreign
exchange assets and trade in them.
The Bank conducts retail banking business in Czech Republic and Slovakia through its foreign mBank branches in these countries.
As at 31 December 2016 the headcount of mBank S.A. amounted to 5 364 FTEs (Full Time Equivalents) and of the Group to 6 528 FTEs (31 December 2015: Bank to 5 151 FTEs, Group 6 540 FTEs).
As at 31 December 2016 the employment in mBank S.A. was 6 313 persons and in the Group 8 401
persons (31 December 2015: Bank 6 336 persons, Group 8 587 persons).
mBank S.A. Group IFRS Condensed Consolidated Financial Statements for the fourth quarter of 2016 PLN (000’s)
35
The business activities of the Group are conducted in the following business segments presented in detail
under Note 4.
Corporates and Financial Markets Segment, including:
Corporate and Investment Banking
mBank Hipoteczny S.A., subsidiary (the corporate segment of the company’s activity)
mFaktoring S.A., subsidiary
mLeasing Sp. z o.o., subsidiary (the corporate segment of the company’s activity)
Garbary Sp. z o.o., subsidiary
Tele-Tech Investment Sp. z o.o., subsidiary
Financial Markets
mFinance France S.A., subsidiary
mBank Hipoteczny S.A., subsidiary (with regard to activities concerning funding)
mLeasing Sp. z o.o., subsidiary (with regard to activities concerning funding)
Retail Banking Segment (including Private Banking)
mFinanse S.A. (previously Aspiro S.A.), subsidiary
mBank Hipoteczny S.A., subsidiary (the retail segment of the company’s activity)
mLeasing Sp. z o.o., subsidiary (the retail segment of the company’s activity)
Other
mCentrum Operacji Sp. z o.o., subsidiary
mLocum S.A., subsidiary
BDH Development Sp. z o.o., subsidiary
Other information concerning companies of the Group
On 30 September 2016, the Company Aspiro S.A. changed its name to mFinanse S.A.
On 20 May 2016, there was a division of Dom Maklerski mBanku S.A. ("mDM") and mWealth Management S.A. ("mWM"), the Group entities.
The division of mDM was effected in accordance with the procedure specified in Art. 529 § 1.1 of the
Commercial Companies Code (“CCC”), i.e. through a transfer to:
the Bank of a part of the assets and liabilities of mDM in the form of an organised part of the enterprise of mDM connected with the provision of brokerage services;
mCentrum Operacji sp. z o.o., of a part of the assets and liabilities of mDM in the form of an organised part of the enterprise of mDM connected with the servicing of and rendering of human
resources and payroll services.
The division of mWM was effected in accordance with the procedure specified in Art. 529 § 1.1 of the CCC, i.e. through a transfer to:
the Bank of a part of the assets and liabilities of mWM in the form of an organised part of the enterprise of mWM connected with the provision of brokerage services, as well as other activities that do not constitute the Operations of the Office of the Real Estate Market and Alternative
Investments as defined below; and
through a transfer to BRE Property Partner sp. z o.o., the subsidiary of mBank, of a part of the assets and liabilities of mWM in the form of an organised part of the enterprise of mWM connected with advisory and intermediation services, within the scope of acquiring and investing in real estate as well as other alternative investments (investment gold, investment silver, fine art), in favour of
natural persons as well as the performance of an analysis within the scope of the real estate
market.
With reference to the mDM division and the mWM division, on 20 May 2016 the striking off took place:
of mDM from the National Court Register by the District Court for the Capital City of Warsaw in Warsaw, XII Commercial Division of the National Court Register;
of mWM from the National Court Register by the District Court for the Capital City of Warsaw in
Warsaw, XII Commercial Division of the National Court Register.
mBank S.A. Group IFRS Condensed Consolidated Financial Statements for the fourth quarter of 2016 PLN (000’s)
36
Consequently, pursuant to Art. 530 § 1 of the CCC, as a result of the mDM division and the mWM
division, mDM and mWM were wound up without going into liquidation on the date on which they were struck off the register while their activities were taken over and continued by mBank and other Group entities.
Information concerning the business conducted by the Group’s entities is presented under Note 4 “Business Segments” of these condensed consolidated financial statements.
2. Description of the relevant accounting policies
The most important accounting policies applied to the drafting of these condensed consolidated financial statements are presented below. These principles were applied consistently over all presented periods.
2.1. Accounting basis
The condensed consolidated financial statements of mBank S.A. Group have been prepared for the 12-month period ended 31 December 2016.
The presented condensed consolidated financial statements for the fourth quarter of 2016 fulfill the
requirements of the International Accounting Standard (IAS) 34 “Interim Financial Reporting”, concerning interim financial statements and adopted for application by the European Union.
The condensed consolidated financial statements do not include all the information and disclosures
required in the annual financial statements and, therefore, the presented condensed consolidated financial statements for the fourth quarter of 2016 should be read in conjunction with the mBank S.A. Group Consolidated Financial Statements for the year 2015, which have been prepared in accordance with IFRSs adopted for application by the European Union, on 25 February 2016 approved by the Bank’s Management Board. Accounting policies applied to the preparation of the condensed consolidated financial statements are consistent with those applied in the annual consolidated financial statements for
the year ended 31 December 2015, with the exception of the application of new or amended standards and interpretations binding for annual periods beginning on or after 1 January 2016 and described in Note 2.33.
The data presented in the mBank S.A. Group condensed consolidated financial statements for the year
2015 was audited by the auditor.
The preparation of the financial statements in compliance with IFRS requires the application of specific accounting estimates. It also requires the Management Board to use its own judgment when applying the accounting policies adopted by the Bank. The issues in relation to which a greater degree of judgment is required, more complex issues, or such issues where estimates or judgments are material to
the financial statements are disclosed in Note 3.
These condensed consolidated financial statements were prepared under the assumption that the Bank continues as a going concern in the foreseeable future, i.e. in the period of at least 12 months following the reporting date.
The Management Board of mBank S.A. approved these condensed consolidated financial statements for issue on 8 February 2017.
2.2. Consolidation
Subsidiaries
Subsidiaries comprise entities, regardless of the nature of the involvement with an entity (including
special purpose vehicles) over which the Group controls the investee. The control is achieved when the Group has power over the investee, is exposed or has rights, to variable returns from its involvement with the investee and has the ability to use its power over the investee to affect its returns. When the Group has less than a majority of the voting rights of an investee, it considers all relevant facts and
circumstances in assessing whether it has power over the investee, including a contractual arrangements between the Group and other vote holders, rights arising from other contractual arrangements, the Group’s voting rights and potential voting rights. If facts and circumstances indicate that there are
changes in at least one of the three elements of control listed above, the Group reassess whether it controls an investee. The consolidation of a subsidiary begins when the Group obtains control over the subsidiary and ceases when the Group loses control of the subsidiary. The consolidated financial statements combine items of assets, liabilities, equity, income and expenses of the parent with those of
its subsidiaries eliminating the carrying amount of the parent’s investment in each subsidiary and the parent’s portion of equity of each subsidiary. Thus arises goodwill. If goodwill has negative value, it is recognised directly in the income statement (see Note 2.20). The profit or loss and each component of other comprehensive income is attributed to the Group’s owners and to the non-controlling interests even if this results in the non-controlling interests having a deficit balance. If the Group loses control of a subsidiary, it shall account for all amounts previously recognised in other comprehensive income in
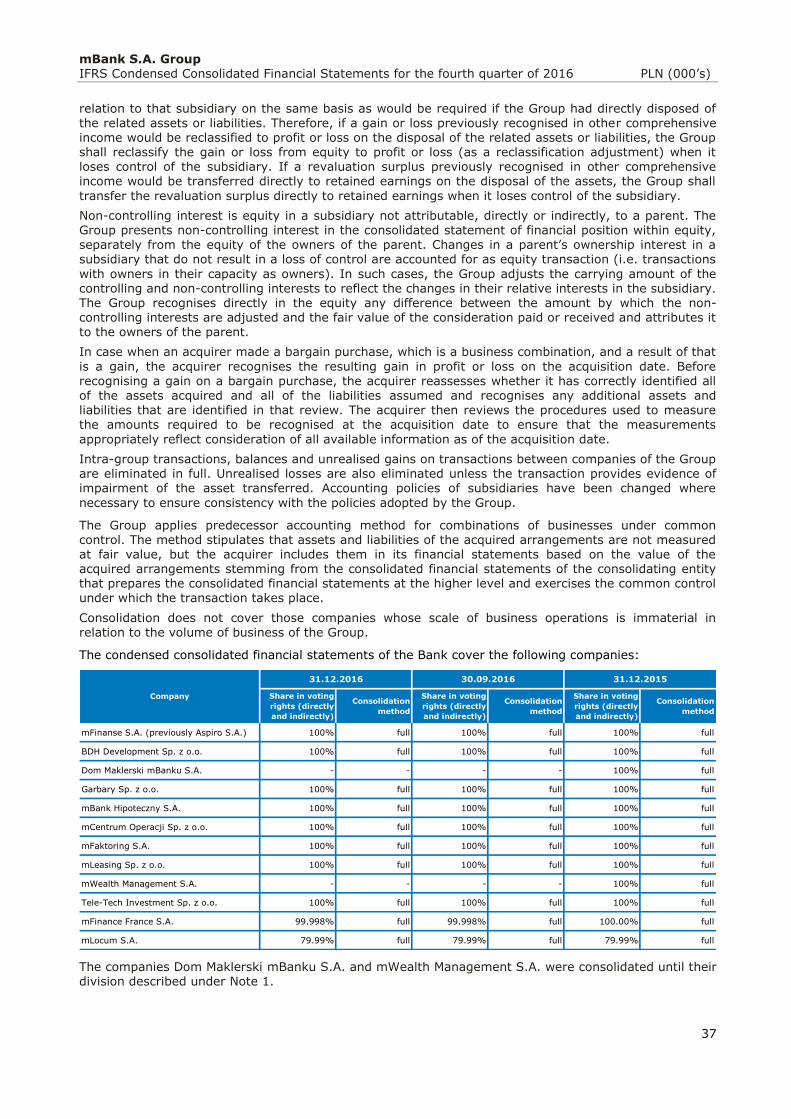
mBank S.A. Group IFRS Condensed Consolidated Financial Statements for the fourth quarter of 2016 PLN (000’s)
37
relation to that subsidiary on the same basis as would be required if the Group had directly disposed of
the related assets or liabilities. Therefore, if a gain or loss previously recognised in other comprehensive income would be reclassified to profit or loss on the disposal of the related assets or liabilities, the Group shall reclassify the gain or loss from equity to profit or loss (as a reclassification adjustment) when it loses control of the subsidiary. If a revaluation surplus previously recognised in other comprehensive income would be transferred directly to retained earnings on the disposal of the assets, the Group shall
transfer the revaluation surplus directly to retained earnings when it loses control of the subsidiary.
Non-controlling interest is equity in a subsidiary not attributable, directly or indirectly, to a parent. The Group presents non-controlling interest in the consolidated statement of financial position within equity, separately from the equity of the owners of the parent. Changes in a parent’s ownership interest in a subsidiary that do not result in a loss of control are accounted for as equity transaction (i.e. transactions
with owners in their capacity as owners). In such cases, the Group adjusts the carrying amount of the controlling and non-controlling interests to reflect the changes in their relative interests in the subsidiary. The Group recognises directly in the equity any difference between the amount by which the non-controlling interests are adjusted and the fair value of the consideration paid or received and attributes it to the owners of the parent.
In case when an acquirer made a bargain purchase, which is a business combination, and a result of that
is a gain, the acquirer recognises the resulting gain in profit or loss on the acquisition date. Before
recognising a gain on a bargain purchase, the acquirer reassesses whether it has correctly identified all of the assets acquired and all of the liabilities assumed and recognises any additional assets and liabilities that are identified in that review. The acquirer then reviews the procedures used to measure the amounts required to be recognised at the acquisition date to ensure that the measurements
appropriately reflect consideration of all available information as of the acquisition date.
Intra-group transactions, balances and unrealised gains on transactions between companies of the Group are eliminated in full. Unrealised losses are also eliminated unless the transaction provides evidence of impairment of the asset transferred. Accounting policies of subsidiaries have been changed where
necessary to ensure consistency with the policies adopted by the Group.
The Group applies predecessor accounting method for combinations of businesses under common control. The method stipulates that assets and liabilities of the acquired arrangements are not measured at fair value, but the acquirer includes them in its financial statements based on the value of the acquired arrangements stemming from the consolidated financial statements of the consolidating entity that prepares the consolidated financial statements at the higher level and exercises the common control under which the transaction takes place.
Consolidation does not cover those companies whose scale of business operations is immaterial in
relation to the volume of business of the Group.
The condensed consolidated financial statements of the Bank cover the following companies:
The companies Dom Maklerski mBanku S.A. and mWealth Management S.A. were consolidated until their division described under Note 1.
Share in voting
rights (directly
and indirectly)
Consolidation
method
Share in voting
rights (directly
and indirectly)
Consolidation
method
Share in voting
rights (directly
and indirectly)
Consolidation
method
mFinanse S.A. (previously Aspiro S.A.) 100% full 100% full 100% full
BDH Development Sp. z o.o. 100% full 100% full 100% full
Dom Maklerski mBanku S.A. - - - - 100% full
Garbary Sp. z o.o. 100% full 100% full 100% full
mBank Hipoteczny S.A. 100% full 100% full 100% full
mCentrum Operacji Sp. z o.o. 100% full 100% full 100% full
mFaktoring S.A. 100% full 100% full 100% full
mLeasing Sp. z o.o. 100% full 100% full 100% full
mWealth Management S.A. - - - - 100% full
Tele-Tech Investment Sp. z o.o. 100% full 100% full 100% full
mFinance France S.A. 99.998% full 99.998% full 100.00% full
mLocum S.A. 79.99% full 79.99% full 79.99% full
31.12.2016 31.12.201530.09.2016
Company
mBank S.A. Group IFRS Condensed Consolidated Financial Statements for the fourth quarter of 2016 PLN (000’s)
38
2.3. Associates and joint ventures
Associates are all entities over which the Group has ignificant influence but not control or joint control, generally accompanying a shareholding of between 20% and 50% of the voting rights. Significant
influence is the power to participate in the financial and operating policy decisions of the investee but is
not control or joint control of those policies.
A joint venture is a joint arrangement whereby the parties that have joint control of the arrangement have rights to the net assets of the arrangement. Joint control is the contractually agreed sharing of
control of an arrangement, which exists only when decisions about the relevant activities require the
unanimous consent of the parties sharing control.
Investments in associates and joint ventures are settled using the equity method of accounting. Under
the equity method, on initial recognition the investment in an associate or a joint venture is recognised at cost. The carrying amount is increased or decreased to recognise the investor’s share of the profit or loss of the investee after the date of acquisition. Goodwill forms part of the carrying amount of an investment in an associate or a joint venture and it is neither amortised nor tested for impairment.
After application of the equity method, the Group determines whether it is necessary to recognise any additional impairment with respect to its net investment in the associate or joint venture. At the
reporting date the Group determines whether there was an objective evidence for impairment of an
investment in an associate or a joint venture. If there was an objective evidence for impairment, the Group calculates impairment comparing the recoverable amount of the investment with its carrying
value. Investments in associates and joint ventures are settled using the equity method of accounting
and they are initially recognised at cost.
The share of the Group in the profits (losses) of associates since the date of acquisition is recognised in the income statement, whereas its share in other comprehensive income since the date of acquisition – in other comprehensive income. The carrying amount of the investment is adjusted by the total changes
of share of net assets. When the share of the Group in the losses of an associate becomes equal to or greater than the share of the Group in that associate, possibly covering receivables other than secured claims, the Group discontinues the recognition of any further losses, unless it has assumed obligations or has settled payments on behalf of the respective associate.
Unrealised gains on transactions between the Group and its associates are eliminated proportionally to the extent of the Group’s interest in the respective associate. Unrealised losses are also eliminated,
unless the transaction provides evidence of an impairment of the transferred asset. Accounting policies applied by associates have been adjusted, wherever necessary, to assure consistency with the accounting principles applied by the Group.
The Group discontinues the use of the equity method from the date when its investment ceases to be an associate or a joint venture. If the retained interest in the former associate or joint venture is a financial asset, the Group measures the retained interest at fair value. The Group recognises in profit or loss any difference between the carrying amount of the investment at the date the equity method was
discontinued and the fair value of any retained interest and any proceeds from disposing of a part interest in the associate or joint venture.
2.4. Interest income and expenses
All interest income on financial instruments carried at amortised cost using the effective interest rate method is recognised in the income statement as well as interest income from financial assets held for trading and available for sale.
The effective interest rate method is a method of calculation of the amortised initial value of financial
assets or financial liabilities and allocation of interest income or interest expense to the proper periods. The effective interest rate is the interest rate at which the discounted future payments or future cash inflows in the expected life of the financial instrument, are equal to the net present carrying value of the respective financial asset or liability. When calculating the effective interest rate, the Group estimates
the cash flows taking into account all the contractual terms of the financial instrument, but without taking into account possible future losses on account of non-recovered loans and advances. This
calculation takes into account all the fees paid or received between the parties to the contract, which constitute an integral component of the effective interest rate, as well as transaction expenses and any other premiums or discounts.
Following the recognition of an impairment loss on a financial asset or a group of similar financial assets, the interest income is calculated on the net value of financial assets and recognised using the interest rate at which the future cash flows were discounted for the purpose of valuation of impairment.
mBank S.A. Group IFRS Condensed Consolidated Financial Statements for the fourth quarter of 2016 PLN (000’s)
39
Interest income includes interest and commissions received or due on account of loans, inter-bank
deposits or investment securities recognised in the calculation of the effective interest rate.
Interest income, including interest on loans, is recognised in the income statement and on the other side in the statement of financial position as part of receivables from banks or from other customers.
The calculation of the effective interest rate takes into account the cash flows resulting from only those embedded derivatives, which are strictly linked to the underlying contract.
Income and expenses related to the interest component of the result on interest rate derivatives and resulting from current calculation of swap points on currency derivatives classified into banking book are presented in the interest results in the position Interest income/expense on derivatives classified into banking book. The banking book includes transactions, which are not concluded for trading purposes i.e. not aimed at generating a profit in a short-term period (up to 6 months) and those that do not constitute hedging a risk arising from the operations assigned into trading book.
Interest income and interest expenses related to the interest measurement component of derivatives
concluded as hedging instruments under fair value hedge are presented in the interest result in the position interest income/expense on derivatives under the fair value hedge accounting.
Interest income related to the interest measurement component of derivatives concluded as hedging
instruments under cash flow hedge are presented in the interest result in the position interest income on derivatives under the cash flow hedge accounting.
2.5. Fee and commission income
Income on account of fees and commissions is recognised on the accrual basis, at the time of
performance of the respective services. Fees charged for the granting of loans which are likely to be drawn down are deferred (together with the related direct costs) and recognised as adjustments of the effective interest rate charge on the loan. Fees on account of syndicated loans are recognised as income at the time of closing of the process of organisation of the respective syndicate, if the Group has not retained any part of the credit risk on its own account or has retained a part of the risk of a similar level as other participants. Commissions and fees on account of negotiation or participation in the negotiation
of a transaction on behalf of a third party, such as the acquisition of shares or other securities, or the acquisition or disposal of an enterprise, are recognised at the time of realisation of the transaction. The same principle is applied in the case of management of client assets, financial planning and custody services, which are continuously provided over an extended period of time.
Fee and commissions collected by the Group on account of issuance, renewal and change in the limit of
credit and payment cards, guarantees granted as well as opening, extension and increase of letters of
credit are accounted for a straight-line basis.
Fee and commissions collected by the Group on account of cash management operations, keeping of customer accounts, money transfers and brokerage business activities are recognised directly in the
income statement.
In addition, revenue from fee and commission include income from a fee on insurance products sold through the Internet platform for the distribution of premium in installments. The fee for the distribution of premium installment is settled in time in accordance with the duration of the policy.
The Group's fee and commission income comprises also income from offering insurance products of third
parties. In case of selling insurance products that are not bundled with loans, the revenues are recognized as upfront income or in majority of cases settled on a monthly basis.
2.6. Revenue and expenses from sale of insurance products bundled with loans
The Group treats insurance products as bundled with loans, in particular when insurance product was
offered to the customer only with the loan, i.e. it was not possible to purchase from the Group the insurance product which is identical in a legal form, content and economic conditions without purchasing the loan.
Revenue and expenses from sale of insurance products bundled with loans are split into interest income and fee and commission income based on the relative fair value analysis of each of these products.
The remuneration included in interest income is recognised over time as part of effective interest rate calculation for the bundled loan. The remuneration included in fee and commission income is recognised partly as upfront income and partly including deferring over time based on the analysis of the stage of completion of the service.
Expenses directly linked to the sale of insurance products are recognised using the same pattern as in case of income observing the matching concept. A part of expenses is treated as an element adjusting
mBank S.A. Group IFRS Condensed Consolidated Financial Statements for the fourth quarter of 2016 PLN (000’s)
40
the calculation of effective interest rate for interest income and the remaining part of expenses is
recognised in fee and commission expenses as upfront cost or as cost accrued over time.
The Group estimates also the part of remuneration which in the future will be returned due to early termination of insurance contract and appropriately decreases interest income or fee and commission
income to be recognised.
In connection with entry into force of Recommendation U concerning best practices in the area of bancassurance, starting from 31 March 2015 the Bank does not receive remuneration from the sale of insurance products which would have been treated as boundled with loans.
2.7. Insurance premium revenue
Insurance premium revenue accomplished upon insurance activity is recognised at the policy issue date and calculated proportionally over the period of insurance cover. Insurance premium revenue is recognised under other operating income in the consolidated financial statements of the Group.
2.8. Compensations and benefits, net
Compensations and benefits, net relate to insurance activity. They comprise payoffs and charges made in the reporting period due to compensations and benefits for events arising in the current and previous
periods, together with costs of claims handling and costs of enforcement of recourses, less received
returns, recourses and any recoveries, including recoveries from sale of remains after claims and reduced by reinsurers’ share in these positions. Costs of claims handling and costs of enforcement of recourses also comprise costs of legal proceedings. The item also comprises compensations and benefits due to co-insurance activity in the part related to the share of the Group. Compensations and benefits, net are recognised together with insurance premium revenue recognition under other operating income in the consolidated financial statements of the Group.
2.9. Segment reporting
An operating segment is a component of the Group that engages in business activities from which it may earn revenues and incur expenses (including revenues and expenses relating to transactions with other components of the Group), whose operating results are regularly reviewed by the Group's chief operating decision-maker to make decisions about resources to be allocated to the segment and assess its performance, and for which discrete financial information is available.
Operating segments are reported in a manner consistent with the internal reporting provided to the chief
operating decision-maker. The chief operating decision-maker is the person or group that allocates resources to and assesses the performance of the operating segments of an entity. As defined in IFRS 8,
the Group has determined the Management Board of the Bank as its chief operating decision-maker.
In accordance with IFRS 8, the Group has the following business segments: Corporates and Financial
Markets including the sub-segments Corporate and Investment Banking as well as Financial Markets, Retail Banking (including Private Banking), and the Other business.
2.10. Financial assets
The Group classifies its financial assets to the following categories: financial assets valued at fair value through the income statement; loans and receivables; financial assets held to maturity; financial assets available for sale. The classification of financial assets is determined by the Management at the time of their initial recognition.
Standardised purchases and sales of financial assets at fair value through the income statement, held to maturity and available for sale are recognised on the settlement date – the date on which the Group delivers or receives the asset. Changes in fair value in the period between trade and settlement date with respect to assets carried at fair value is recognised in profit or loss or in other components of equity. Loans are recognised when cash is advanced to the borrowers. Derivative financial instruments are recognised beginning from the date of transaction.
A financial asset is de-recognized if Group loses control over any contractual rights attached to that asset, which usually takes place if the financial instrument is disposed of or if all cash flows attached to the instrument are transferred to an independent third party.
Financial assets valued at fair value through the income statement
This category comprises two subcategories: financial assets held for trading and financial assets designated at fair value through the income statement upon initial recognition. A financial asset is classified in this category if it was acquired principally for the purpose of short-term resale or if it was
classified in this category by the companies of the Group. Derivative instruments are also classified as “held for trading”, unless they were designated for hedging according to IAS 39.
mBank S.A. Group IFRS Condensed Consolidated Financial Statements for the fourth quarter of 2016 PLN (000’s)
41
Disposals of debt and equity securities held for trading are accounted according to the weighted average
method.
The Group classifies financial assets/financial liabilities as measured at fair value through the income statement if they meet either of the following conditions:
assets/liabilities are classified as held for trading i.e. they are acquired or incurred principally for the purpose of selling or repurchasing them in the near term, they are a part of a portfolio of identified
financial instruments that are managed together and for which there is evidence of a recent actual pattern of short-term profit making or they are derivatives (except for derivatives that are designated as and being effective hedging instruments and financial guarantee contracts),
upon initial recognition, assets/liabilities are designated by the entity at fair value through the income statement according to IAS 39.
If a contract contains one or more embedded derivatives, the Group designates the entire hybrid
(combined) contract as a financial asset or financial liability at fair value through the income statement unless:
the embedded derivative(s) does not significantly modify the cash flows that otherwise would be required by the contract; or
it is clear with little or no analysis when a similar hybrid instrument is first considered that
separation of the embedded derivative(s) is prohibited, such as a prepayment option embedded in a loan that permits the holder to prepay the loan for approximately its amortised cost.
The Group also designates the financial assets/financial liabilities at fair value through the income statement when doing so results in more relevant information, because either:
it eliminates or significantly reduces a measurement or recognition inconsistency (sometimes referred to as “an accounting mismatch”) that would otherwise arise from measuring assets or liabilities or recognising the gains and losses on them on different bases; or
a group of financial assets, financial liabilities or both is managed and its performance is evaluated on a fair value basis, in accordance with a documented risk management or investment strategy, and information about the group is provided internally on that basis to the entity's key management personnel.
Financial assets and financial liabilities classified to this category are valued at fair value upon initial recognition.
Interest income/expense on financial assets/financial liabilities designated at fair value (Note 2.4),
except for derivatives the recognition of which is discussed in Note 2.17, is recognised in net interest income. The valuation and result on disposal of financial assets/financial liabilities designated at fair value is recognised in trading income.
As presented in this financial statements reporting periods, the Group did not designate any financial instrument on initial recognition as financial assets at fair value through the income statement.
Loans and receivables
Loans and receivables consist of financial assets not classified as derivative instruments, with payments either determined or possible to determine, not listed on an active market. They arise when the Group supplies monetary assets, goods or services directly to the debtor without any intention of trading the receivable.
Financial assets held to maturity
Investments held to maturity comprise listed on active markets financial assets, not classified as derivative instruments, where the payments are determined or possible to determine and with specified maturity dates, and which the Group intends and is capable of holding until their maturity.
In the case of sale by the Group before maturity of a part of assets held to maturity which cannot be
deemed insignificant the held to maturity portfolio is tainted, and there with all the assets of this category are reclassified to the available for sale category.
In reporting periods presented in these financial statements, there were no assets held to maturity at
the Group.
Financial assets available for sale
Available for sale investments consist of investments which the Group intends to hold for an undetermined period of time. They may be sold, e.g., in order to improve liquidity, in reaction to
changes of interest rates, foreign exchange rates, or prices of equity instruments.
mBank S.A. Group IFRS Condensed Consolidated Financial Statements for the fourth quarter of 2016 PLN (000’s)
42
Interest income and expense from available for sale investments are presented in net interest income.
Gains and losses from sale of available for sale investments are presented in gains and losses from investment securities.
Available for sale financial assets and financial assets measured at fair value through the income statement are valued at the end of the reporting period according to their fair value. Loans and receivables, as well as investments held to maturity are measured at adjusted cost of acquisition
(amortised cost), applying the effective interest rate method. Gains and losses resulting from changes in the fair value of “financial assets measured at fair value through the income statement” are recognised in the income statement in the period in which they arise.
Gains and losses arising from changes in the fair value of available for sale financial assets are recognised in other comprehensive income until the derecognition of the respective financial asset in the
statement of financial position or until its impairment: at such time the aggregate net gain or loss previously recognised in other comprehensive income is now recognised in the income statement. However, interest calculated using the effective interest rate is recognised in the income statement. Dividends on available for sale equity instruments are recognised in the income statement when the entity’s right to receive payment is established.
The fair value of quoted investments in active markets is based on current market prices. If the market
for a given financial asset is not an active one, the Group determines the fair value by applying valuation techniques. These comprise recently conducted transactions concluded according to normal market principles, reference to other instruments, discounted cash flow analysis, as well as valuation models for options and other valuation methods generally applied by market participants.
If the application of valuation techniques does not ensure obtaining a reliable fair value of investments in
equity instruments not quoted on an active market, they are stated at cost.
2.11. Reinsurance assets
The Group transfers insurance risks to reinsurers in the course of typical operating activities in insurance activity. Reinsurance assets comprise primarily reinsurers’ share in technical-insurance provisions.
The amounts of settlements with reinsurers are estimated according to relevant reinsured polices and reinsurance agreements.
Tests for impairment of reinsurance assets are carried out if there is objective evidence that the
reinsurance asset is impaired. Impairment loss of reinsurance asset is calculated if either there is an objective evidence that the Group might not receive the receivable in accordance with the agreement or the value of such impairment can be reliably assessed.
If in a subsequent period the impairment loss is decreasing and the decrease can be objectively related to an event occurring after the recognition of impairment, then the previously recognised impairment loss is reversed as an adjustment of the impairment loss through the consolidated income statement.
The reversal cannot cause an increase of the carrying amount of the financial asset more than the amount which would constitute the amortised cost of this asset on the reversal date if the recognition of the impairment did not occur at all.
2.12. Offsetting financial instruments
Financial assets and financial liabilities are offset and the net amount is reported in the statement of financial position when there is a legally enforceable right to offset the recognised amounts and there is an intention to settle on a net basis, or realise the asset and settle the liability simultaneously. The
conditions mentioned above are not satisfied and offsetting is inappropriate when: different financial instruments are used to emulate the features of a single financial instrument, financial assets and liabilities arise from financial instruments having the same primary risk exposure but involve different counterparties, financial or other assets are pledged as collaterals for non-recourse financial liabilities, financial assets are set aside in trust by a debtor for the purpose of discharging an obligation without
those assets having been accepted by the creditor in the settlement of the obligation, or obligations incurred as a result of events giving rise to losses are expected to be recovered from a third party by
virtue of a claim made under an insurance contract.
2.13. Impairment of financial assets
Assets carried at amortised cost
At the end of the reporting period, the Group estimates whether there is objective evidence that a financial asset or group of financial assets is impaired. A financial asset or a group of financial assets is impaired and impairment losses are incurred only if there is objective evidence of impairment as a result
mBank S.A. Group IFRS Condensed Consolidated Financial Statements for the fourth quarter of 2016 PLN (000’s)
43
of one or more events that occurred after the initial recognition of the asset (a “loss event”) and that
loss event (or events) has an impact on the future cash flows of the financial asset or group of financial assets that can be reliably estimated. Loss events were divided into definite (“hard”) loss events of which occurrence requires that there is a need to classify the client into the default category, and indefinite (“soft”) loss events of which occurrence may imply that there is a need to classify the client into the default category.
The Group measures impairment of loan exposures in accordance with the International Accounting Standard 39. The classification of customers to default portfolio and calculation of impairment write-off is as follows:
a) identifying impairment indicator on individual basis (loss events) and if they exist, classifying a customer to a default category;
b) assessing estimated future cash flows (repayments) both from collateral and from repayments by a customer;
c) calculating impairment losses taking into account the current amount of estimated future recovery discounted at the effective interest rate;
d) booking of impairment losses and provisions.
Loss events were divided into definite (‘hard’) loss events of which occurrence requires the client to be classified into the default category, and indefinite (‘soft’) loss events of which occurrence may imply that there is a need to classify the client into the default category. In the case of indefinite loss events, credit analyst assesses additionally whether the event impacted adversely the obligor's creditworthiness. Indefinite loss events have been introduced in order to signal situations that may increase the credit risk of the debtor, which may result in the loss of the debtor's ability to repay loan the Bank.
The list of definite loss events:
1. The number of days past due is above 90 days (14 days in the case of banks) and the overdue
amount exceeds PLN 3 000.
2. The Bank has sold exposures with a significant economic loss related to the decrease of the debtor creditworthiness.
3. The Bank performed enforced restructuring of the exposure, which resulted in the change of the loan/transaction service schedule due to the lack of possibility of the obligor to meet his obligations under loan/transaction agreement, as initially stipulated, which resulted in:
a) remitting part of these obligations, or
b) postponing the repayment of the substantial part of the principal, interest or (if it refers to) commission; provided that the lack of approval for restructuring would cause more than 90 calendar days delay in repayment of substantial part of the obligation.
4. Filing by the Bank, the parent or subsidiary entity of the Bank a bankruptcy motion against debtor or filing similar motion in respect of credit obligations of the debtor towards the Bank, the parent or subsidiary entity of the Bank.
5. Bankruptcy of debtor or acquiring by him a similar legal protection resulting in his evasion of or delay in repayment of credit obligations towards the Bank, the parent or subsidiary entity of the Bank.
6. Termination of part or whole credit agreement by the Bank and the beginning of restructuring/collection procedures.
7. Client’s fraud.
The list of required conditions for indefinite loss events is prepared separately for each following entity type:
a) governments and central banks,
b) banks,
c) corporations, including specialised lending,
d) local government units,
e) insurers,
f) pension fund managing companies, investment fund managing companies.
Defining separately the conditions for indefinite loss events for particular types of entities aims at
reflecting specificity of particular types of entities in identification of loss events.
mBank S.A. Group IFRS Condensed Consolidated Financial Statements for the fourth quarter of 2016 PLN (000’s)
44
In order to assess if the impairment loss has occurred, identification of credit exposures with premises
for impairment is carried out. Subsequently the comparison of the gross balance sheet credit exposure with the value of estimated future cash flows discounted at the original effective interest rate is carried out, which leads to the conclusion whether the impairment loss has occurred. If the discounted value of future cash flow is higher than the gross balance sheet value, the impairment charge is not recognised.
In case of specific situation, when the future cash flows are clearly dependent on individual events
(based on discrete metric), the Bank estimates the probability of such events as the basis for calculating the impairment charge.
The Group first assesses whether objective indications exist individually for financial assets that are individually significant, and individually or collectively for financial assets that are not individually significant. If the Group determines that for the given financial asset assessed individually there are no objective indications of its impairment (regardless of whether that particular item is material or not), the given asset is included in a group of financial assets featuring similar credit risk characteristics, which is
subsequently collectively assessed in terms of its possible impairment. Financial assets that are individually assessed for impairment and for which an impairment loss is or continues to be recognised are not included in a collective assessment of impairment.
Recognition of default in respect of one exposure to a customer leads to recognision of the default status
for all exposures to that customer.
If there is impairment indicator for impairment of loans and receivables or investments held to maturity and recognised at amortised cost, the impairment amount is calculated as the difference between the
carrying value in the statement of financial position of the respective asset and the present value of estimated future cash flows (excluding future credit losses that have not been incurred) discounted at the financial asset’s original effective interest rate. The carrying value of the asset is reduced through the use of an allowance account, and the resulting impairment loss is charged to the income statement. If a loan or held to maturity investment has a variable interest rate, the discount rate for measuring any impairment loss is the current effective interest rate determined under the contract.
The calculation of the present value of estimated future cash flows of a collateralised financial asset reflects the cash flows that may result from foreclosure less costs for obtaining and selling the collateral, whether or not foreclosure is probable.
For the purpose of collective evaluation of impairment, the credit exposures are grouped in order to ensure the uniformity of credit risk attached to the given portfolio. Many different parameters may be applied to the grouping into homogeneous portfolios, e.g., the type of counterparty, the type of
exposure, estimated probability of default, the type of collateral provided, overdue status outstanding,
maturities, and their combinations. Such features influence the estimation of the future cash flows attached to specific groups of assets as they indicate the capabilities of repayment on the part of debtors of their total liabilities in conformity with the terms and conditions of the contracts concerning the assessed assets.
Future cash flows concerning groups of financial assets assessed collectively in terms of their possible impairment are estimated on the basis of contractual cash flows and historical loss experience for assets with credit risk characteristics similar to those in the group.
Historical loss experience is adjusted on the basis of current observable data to reflect the effects of current conditions that did not affect the period on which the historical loss experience is based and to remove the effects of conditions in the historical period that do not exist currently.
For the purpose of calculation of the amount to be provisioned against balance sheet exposures analysed collectively, the probability of default (PD) method has been applied. By calibration of PD values, taking into account characteristics of specific products and emerging periods for losses on those products, such
PD values allow already arisen losses to be identified and cover only the period in which the losses arising at the date of establishment of impairment should crystallise.
When a loan is uncollectible, it is written off against the related provision for impairment. Before any loan is written off, it is necessary to conduct all the procedures required by the Group and sets the amount of the loss. Subsequent recoveries of amounts previously written off reduce the amount of the provision for loan impairment in the income statement.
If in a subsequent period, after the transitional period, the impairment loss amount is decreasing and the
decrease can be related objectively to an event occurring after the impairment was recognised (e.g., improvement of the debtor’s credit rating), then the previously recognised impairment loss is reversed by adjusting the allowance account. The amount of the reversal is recorded in the income statement.
mBank S.A. Group IFRS Condensed Consolidated Financial Statements for the fourth quarter of 2016 PLN (000’s)
45
Assets measured at fair value available for sale
At the end of the reporting period the Group estimates whether there is an objective evidence that a financial asset or a group of financial assets is impaired. In the case of equity instruments classified as assets available for sale, a significant or prolonged decline in the fair value of the security below its cost
resulting from higher credit risk is considered when determining whether the assets are impaired. If such kind of evidence concerning available for sale financial assets exists, the cumulative loss – determined as the difference between the cost of acquisition and the current fair value – is removed from other comprehensive income and recognised in the income statement. The above indicated difference should be reduced by the impairment concerning the given asset which was previously recognised in the income statement. Impairment losses concerning equity instruments recorded in the income statement are not reversed through the income statement, but through other comprehensive income. If the fair value of a
debt instrument classified as available for sale increases in a subsequent period, and such increase can be objectively related to an event occurring after the recording of the impairment loss in the income statement, then the respective impairment loss is reversed in the income statement.
Renegotiated agreements
The Group considers renegotiations on contractual terms of loans and advances as impairment indicator unless the renegotiation was not due to the situation of the debtor but had been carried out on normal
business terms. In such a case the Group makes an assessment whether the impairment should be recognised on either individual or group basis.
2.14. Financial guarantee contracts
The financial guarantee contract is a contract that requires the issuer to make specified payments to reimburse the holder for a loss it incurs because a specified debtor fails to make payment when due in accordance with the original or modified terms of a debt instrument.
When a financial guarantee contract is recognised initially, it is measured at the fair value. After initial
recognition, an issuer of such a contract measures it at the higher of:
the amount determined in accordance with IAS 37 “Provisions, Contingent Liabilities and Contingent Assets”, and
the amount initially recognised less, when appropriate, cumulative amortization recognised in
accordance with IAS 18 “Revenue”.
2.15. Cash and cash equivalents
Cash and cash equivalents comprise items with maturities of up to three months from the date of their
acquisition, including: cash in hand and cash held at the Central Bank with unlimited availability for disposal, treasury bills and other eligible bills, loans and advances to banks, amounts due from other
banks and government securities acquired for the purpose of short-term resale.
2.16. Sell-buy-back, buy-sell-back, reverse repo and repo contracts
Repo and reverse-repo transactions are defined as selling and purchasing securities for which a commitment has been made to repurchase or resell them at a contractual date and for a specified contractual price and are recognised when the money is transferred.
Securities sold with a repurchase clause (repos/sell buy back) are reclassified in the financial statements as pledged assets if the entity receiving them has the contractual or customary right to sell or pledge
them as collateral security. The liability towards the counterparty is recognised as amounts due to other banks, deposits from other banks, other deposits or amounts due to customers, depending on its nature. Securities purchased together with a resale clause (reverse repos/buy sell back) are recognised as loans and advances to other banks or other customers, depending on their nature.
When concluding a repo or reverse repo transaction, mBank S.A. Group sells or buys securities with a repurchase or resale clause specifying a contractual date and price. Such transactions are presented in
the statement of financial position as financial assets held for trading or as investment financial assets, and also as liabilities in the case of “sell-buy-back” transactions and as receivables in the case of “buy-sell-back” transactions.
Securities borrowed by the Group under “sell-buy-back” transactions are not recognised in the financial statements, unless they are sold to third parties. In such case the purchase and sale transactions are recorded with a gain or a loss included in trading income. The obligation to return them is recorded at fair value as amounts due to customers. Securities borrowed under “buy-sell-back” transactions and
then lent under “sell-buy-back” transactions are not recognised as financial assets.
mBank S.A. Group IFRS Condensed Consolidated Financial Statements for the fourth quarter of 2016 PLN (000’s)
46
As a result of “sell-buy-back” transactions concluded on securities held by the Group, financial assets are
transferred in such way that they do not qualify for derecognition. Thus, the Group retains substantially all risks and rewards of ownership of the financial assets.
2.17. Derivative financial instruments and hedge accounting
Derivative financial instruments are recognised at fair value from the date of transaction. Fair value is determined based on prices of instruments listed on active markets, including recent market
transactions, and on the basis of valuation techniques, including models based on discounted cash flows and options pricing models, depending on which method is appropriate in the particular case. All derivative instruments with a positive fair value are recognised in the statement of financial position as assets, those with a negative value as liabilities.
The best fair value indicator for a derivative instrument at the time of its initial recognition is the price of the transaction (i.e., the fair value of the paid or received consideration). If the fair value of the particular instrument may be determined by comparison with other current market transactions
concerning the same instrument (not modified) or relying on valuation techniques based exclusively on market data that are available for observation, then the Group recognises the respective gains or losses from the first day in accordance with the principles described under Note 2.18.
Embedded derivative instruments are treated as separate derivative instruments if the risks attached to them and their characteristics are not strictly linked to the risks and characteristics of the underlying contract and the underlying contract is not measured at fair value through the income statement. Embedded derivative instruments of this kind are measured at fair value and the changes in fair value
are recognised in the income statement.
In accordance with IAS 39 AG 30: (i), there is no need to separate the prepayment option from the host debt instrument for the needs of consolidated financial statements, because the option’s exercise price is approximately equal on each exercise date to the amortised cost of the host debt instrument. If the value of prepayment option was not to be closely related to the underlying debt instrument, the option should be separated and fair valued in the consolidated financial statements of the Group; (ii), exercise
price of a prepayment option reimburses the lender for an amount up to the approximate present value of lost interest for the remaining term of the host contract. Lost interest is the product of the principal amount prepaid multiplied by the interest rate differential. The interest rate differential is the excess of the effective interest rate of the host contract over the effective interest rate the entity would receive at the prepayment date if it reinvested the principal amount prepaid in a similar contract for the remaining term of the host contract.
The assessment of whether the call or put option is closely related to the host debt contract is made
before separating the equity element of a convertible debt instrument in accordance with IAS 32.
The method of recognising the resulting fair value gain or loss depends on whether the given derivative instrument is designated as a hedging instrument, and if it is, it also depends on the nature of the hedged item. The Group designates some derivative instruments either as (1) fair value hedges against a recognised asset or liability or against a binding contractual obligation (fair value hedge), or as (2) hedges against highly probable future cash flows attributable to a recognised asset or liability, or a forecasted transaction (cash flow hedge). Derivative instruments designated as hedges against positions
maintained by the Group are recorded by means of hedge accounting, subject to the fulfilment of the criteria specified in IAS 39:
At the inception of the hedge there is formal designation and documentation of the hedging relationship and the entity’s risk management objective and strategy for undertaking the hedge. That documentation shall include identification of the hedging instrument, the hedged item or transaction, the nature of the risk being hedged and how the entity will assess the hedging
instruments effectiveness in offsetting the exposure to changes in the hedged item’s fair value or cash flows attributable to the hedged risk.
The hedge is expected to be highly effective in offsetting changes in fair value or cash flows attributable to the hedged risk, consistently with the originally documented risk management strategy for that particular hedging relationship.
For cash flow hedges, a forecast transaction that is the subject of the hedge must be highly probable and must present an exposure to variations in cash flows that could ultimately affect profit or loss.
The effectiveness of the hedge can be reliably measured, i.e. the fair value or cash flows of the hedged item that are attributable to the hedged risk and the fair value of the hedging instrument can be reliably measured.
The hedge is assessed on an ongoing basis and determined actually to have been highly effective throughout the financial reporting periods for which the hedge was designated.
mBank S.A. Group IFRS Condensed Consolidated Financial Statements for the fourth quarter of 2016 PLN (000’s)
47
The Group documents the objectives of risk management and the strategy of concluding hedging
transactions, as well as at the time of concluding the respective transactions, the relationship between the hedging instrument and the hedged item. The Group also documents its own assessment of the effectiveness of fair value hedging and cash flow hedging transactions, measured both prospectively and retrospectively from the time of their designation and throughout the period of duration of the hedging relationship between the hedging instrument and the hedged item.
Due to the split of derivatives classified into banking book and into trading book, the Group applies a different approach to the presentation of interest income/expense for each of these groups of derivatives that is described in Note 2.4 “Interest income and expenses”. The remaining result from fair value measurement of derivatives is recognised in “Net trading income”.
Fair value hedges
Changes in the fair value of derivative instruments designated and qualifying as fair value hedges are
recognised in the income statement together with any changes in the fair value of the hedged asset or liability that are attributable to the hedged risk.
In case a hedge has ceased to fulfil the criteria of hedge accounting, the adjustment to the carrying value of the hedged item for which the effective interest method is used is amortised to the income
statement over the period to maturity. The adjustment to the carrying amount of the hedged equity
security remains in other comprehensive income until the disposal of the equity security.
Cash flow hedges
The effective part of the fair value changes of derivative instruments designated and qualifying as cash flow hedges is recognised in other comprehensive income. The gain or loss concerning the ineffective part is recognised in the income statement of the current period.
The amounts recognised in other comprehensive income are transferred to the income statement and recognised as income or cost of the same period in which the hedged item will affect the income statement (e.g., at the time when the forecast sale that is hedged takes place).
In case the hedging instrument has expired or has been sold, or the hedge has ceased to fulfil the criteria of hedge accounting, any aggregate gains or losses recognised at such time in other comprehensive income remain in other comprehensive income until the time of recognition in the income statement of the forecast transaction. When a forecast transaction is no longer expected to occur, the
aggregate gains or losses recorded in other comprehensive income are immediately transferred to the income statement.
Derivative instruments not fulfilling the criteria of hedge accounting
Changes of the fair value of derivative instruments that do not meet the criteria of hedge accounting are
recognised in the income statement of the current period.
The Group holds the following derivative instruments in its portfolio:
Market risk instruments:
Futures contracts for bonds, index futures Options for securities and for stock-market indices Options for futures contracts Forward transactions for securities
Commodity swaps
Interest rate risk instruments:
Forward Rate Agreement (FRA) Interest Rate Swap (IRS), Overnight Index Swap (OIS) Interest Rate Options
Foreign exchange risk instruments:
Currency forwards, fx swap, fx forward Cross Currency Interest Rate Swap (CIRS) Currency options.
2.18. Gains and losses on initial recognition
The best evidence of fair value of a financial instrument at initial recognition is the transaction price (i.e., the fair value of the payment given or received), unless the fair value of that instrument is evidenced by comparison with other observable current market transactions in the same instrument (without
mBank S.A. Group IFRS Condensed Consolidated Financial Statements for the fourth quarter of 2016 PLN (000’s)
48
modification) or based on a valuation technique whose variables include only data from observable
markets.
The transaction for which the fair value determined using a valuation model (where inputs are both observable and non-observable data) and the transaction price differ, the initial recognition is at the transaction price. The Group assumes that the transaction price is the best indicator of fair value, although the value obtained from the valuation model may differ. The difference between the transaction
price and the model value, commonly referred to as “day one profit and loss”, is amortised over the period of time.
The timing of recognition of deferred day one profit and loss is determined individually. It is either amortised over the life of the transaction, deferred until the instrument’s fair value can be determined using market observable date, or realised through settlement. The financial instrument is subsequently measured at fair value, adjusted for the deferred day one profit and loss. Subsequent changes in fair value are recognised immediately in the income statement without reversal of deferred day one profits
and losses.
2.19. Borrowings and deposits taken
Borrowings (including deposits) are initially recognised at fair value reduced by the incurred transaction
costs. After the initial recognition, borrowings are recorded at adjusted cost of acquisition (amortised cost using the effective interest method). Any differences between the amount received (reduced by transaction costs) and the redemption value are recognised in the income statement over the period of duration of the respective agreements according to the effective interest rate method.
2.20. Intangible assets
The Group measures intangible assets initially at cost. After initaial recognition, intangible assets are recognised at their cost of acquisition adjusted by the costs of improvement (rearrangement, development, reconstruction or modernisation) less any accumulated amortization and any accumulated impairment losses. Accumulated amortization is accrued by the straight line method taking into account the expected period of economic useful life of the respective intangible assets.
Goodwill
Goodwill as of the acquisition date is measured as the excess of the aggregate of the consideration transferred, the amount of any non-controlling interest in the acquiree and in a business combination achieved in stages, the acquisition-date fair value of the acquirer's previously held equity interest in the acquire over the net of the acquisition-date amounts of the identifiable assets acquired and the liabilities
assumed.
Goodwill on acquisition of subsidiaries is included in “Intangible assets”. Goodwill is not amortised, but it is tested annually for impairment and if there have been any indication that it may be impaired, and it is carried in the statement of financial position at cost reduced by accumulated impairment losses. The Group assesses at the end of each reporting period whether there is any indication that cash generaing unit to which goodwill is allocated may be impaired. If any such indication exists, the Group estimates
the recoverable amount of the asset. Goodwill impairment losses should not be reversed.
Gains and losses on the disposal of the activity include the carrying amount of goodwill relating to the sold activity. Goodwill is allocated to cash generating units or groups of cash generating units for the purpose of impairment testing. The allocation is made as at the date of purchase to those cash-generating units or groups of cash generating units that are expected to benefit from the business combination in which the goodwill arose, not bigger than operating segments in accordance with IFRS 8 irrespective of whether other assets or liabilities of the acquiree are assigned to those units.
Computer software
Purchased computer software licences are capitalised in the amount of costs incurred for the purchase and adaptation for use of specific computer software. These costs are amortised on the basis of the
expected useful life of the software (2-11 years). Expenses attached to the maintenance of computer software are expensed when incurred. Expenses directly linked to the development of identifiable and
unique proprietary computer programmes controlled by the Group, which are likely to generate economic benefits in excess of such costs expected to be gained over a period exceeding one year, are recognised as intangible assets. Direct costs comprise personnel expenses directly related to the software.
Capitalised costs attached to the development of software are amortised over the period of their estimated useful life.
Computer software directly connected with the functioning of specific information technology hardware is
recognised as “Tangible fixed assets”.
mBank S.A. Group IFRS Condensed Consolidated Financial Statements for the fourth quarter of 2016 PLN (000’s)
49
Development costs
The Group identifies development costs as intangible asset as the asset will generate probable future economic benefits and fulfil the following requirements described in IAS 38, i.e., the Group has the intention and technical feasibility to complete and to use the intangible asset, the availability of adequate
technical, financial and other resources to complete and to use the intangible asset and the ability to measure reliably the expenditure attributable to the intangible asset during its development.
“Development costs” useful lives are finite and the amortization period does not exceed 3 years. Amortization rates are adjusted to the period of economic utilisation. The Group shows separately additions from internal development and separately those acquired through business combinations.
Development expenditure comprises all expenditure that is directly attributable to research and
development activities.
Intangible assets are tested in terms of possible impairment always after the occurrence of events or change of circumstances indicating that their carrying value in the statement of financial position might not be possible to be recovered.
2.21. Tangible fixed assets
Tangible fixed assets are carried at historical cost reduced by accumulated depreciation and accumulated
impairment losses. Historical cost takes into account the expenses directly attached to the acquisition of the respective assets.
Subsequent costs are included in the asset’s carrying amount or are recognised as a separate asset, as appropriate, only where it is probable that future economic benefits associated with the item will flow to the Group and the cost of the item can be measured reliably. Any other expenses incurred on repairs and maintenance are expensed to the income statement in the reporting period in which they were
incurred.
Land is not depreciated. Depreciation of other fixed assets is accounted for according to the straight line method in order to spread their initial value reduced by the residual value over the period of their useful life which is estimated as follows for the particular categories of fixed assets:
Buildings and structures 25-40 years,
Equipment 2-10 years,
Vehicles 5 years,
Information technology hardware 2-5 years,
Investments in third party fixed assets 10-40 years, no longer when the period of the lease contract,
Office equipment, furniture 5-10 years.
Land and buildings consist mainly of branch outlets and offices. Residual values, estimated useful life periods and depreciation method are verified at the end of the reporting period and adjusted
prospectively in accordance with the arrising need.
Group assesses at the end of each reporting period whether there is any indication that tangible asset may be impaired. If any such indication exists, the Group estimates the recoverable amount of the asset. Depreciable fixed assets are tested for impairment always whenever events or changes in circumstances indicate that the carrying value may not be recoverable. The value of a fixed asset carried in the statement of financial position is reduced to the level of its recoverable value if the carrying value in the statement of financial position exceeds the estimated recoverable amount. The recoverable value is the
higher of two amounts: the fair value of the fixed asset reduced by its selling costs and the value in use.
If it is not possible to estimate the recoverable amount of the individual asset, the Group shall determine the recoverable amount of the cash-generating unit to which the asset belongs (cash-generating unit of the asset).
The carrying amount of tangible fixed assets is derecognised on disposal or when no future economic benefits are expected from its use or disposal. The gain or loss arising from from the derecognition of
tangible fixed assets are included in profit or loss when the item is derecognised. Gains are not classified as revenue.
Gains and losses on account of the disposal of fixed assets are determined by comparing the proceeds from their sale against their carrying value in the statement of financial position and they are recognised in the income statement.
mBank S.A. Group IFRS Condensed Consolidated Financial Statements for the fourth quarter of 2016 PLN (000’s)
50
2.22. Inventories
Inventories are stated at the lower of: cost of purchase/cost of construction and net realisable value. Cost of construction of inventories comprises direct construction costs, the relevant portion of fixed indirect production costs incurred in the construction process and the borrowing costs, which can be directly allocated to the purchase or construction of an asset. Net realisable value is the estimated selling price in the ordinary course of business, less applicable variable selling costs. The amount of any
inventory write-downs to the net realisable value and any inventory losses are recorded as costs of the period in which a write-down or a loss occurred and they are classified as other operating costs. Reversals of inventory write-downs resulting from increases in their net realisable value are recorded as a reduction of the inventories recognised as cost of the period in which the reversals took place. Inventory issues are valued through detailed identification of the individual purchase prices or costs of construction of the assets which relate to the realisation of the individual separate undertakings. In particular, inventories comprise land and rights to perpetual usufruct of land designated for use as part
of construction projects carried out. They also comprise assets held for lease as well as assets taken over as a result of terminated lease agreements.
2.23. Non-current assets held for sale and discontinued operations
The Group classifies a non-current asset (or disposal group) as held for sale if its carrying amount will be
recovered principally through a sale transaction rather than through continuing use. For this to be the case, the asset (or disposal group) must be available for immediate sale in its present condition subject only to terms that are usual and customary for sale of such assets (or disposal groups) and its sale must
be highly probable, i.e., the appropriate level of management must be committed to a plan to sell the asset (or disposal group), and an active programme to locate a buyer and complete the plan must have been initiated. Further, the asset must be actively marketed for sale at a price that is reasonable in relation to its current fair value. In addition, the sale should be expected to qualify for recognition as a completed sale within one year from the date of classification.
Non-current assets held for sale are priced at the lower of: carrying value and fair value less costs to
sell. Assets classified in this category are not depreciated.
When criteria for classification to non-current assets held for sale are not met, the Group ceases to classify the assets as held for sale and reclassifies them into appropriate category of assets. The Group measures a non-current asset that ceases to be classified as held for sale (or ceases to be included in a disposal group classified as held for sale) at the lower of:
its carrying amount at a date before the asset (or disposal group) was classified as held for sale,
adjusted for any depreciation, amortization or revaluations that would have been recognised had the
asset (or disposal group) not been classified as held for sale, and
its recoverable amount at the date of the subsequent decision not to sell.
Discontinued operations are a component of the Group that either has been disposed of or is classified as held for sale and represents a separate major line of business or geographical area of operation or is a subsidiary acquired exclusively with a view to resale.
The classification to this category takes places at the moment of sale or when the operation meets criteria of the operation classified as held for sale, if this moment took place previously. Disposal group which is to be taken out of usage may also be classified as discontinued operation.
2.24. Deferred income tax
The Group creates a deferred income tax on the temporary difference arising between the carrying amount of an asset or liability in the statement of financial position and its tax base. A taxable net difference is recognised in liabilities as “Provisions for deferred income tax”. A deductible net difference is recognised under “Deferred income tax assets”. Any change in the balance of the deferred tax assets and liabilities in relation to the previous accounting period is recorded under the item “Income Tax”. The
balance sheet method is applied for the calculation of the deferred corporate income tax.
Liabilities or assets for deferred corporate income tax are recognised in their full amount according to the
balance sheet method in connection with the existence of temporary differences between the tax value of assets and liabilities and their carrying value. Such liabilities or assets are determined by application of the tax rates in force by virtue of law or of actual obligations at the end of the reporting period. According to expectations such tax rates applied will be in force at the time of realisation of the assets or settlement of the liabilities for deferred corporate income tax.
The main temporary differences arise on account of impairment write-offs recognised in relation to the
loss of value of credits and granted guarantees of repayment of loans, amortization of fixed assets and
mBank S.A. Group IFRS Condensed Consolidated Financial Statements for the fourth quarter of 2016 PLN (000’s)
51
intangible assets, finance leases treated as operating leases for tax purposes, revaluation of certain
financial assets and liabilities, including contracts concerning derivative instruments and forward transactions, provisions for retirement benefits and other benefits following the period of employment, and also deductible tax losses.
The Group reviews the carrying amount of a deferred tax assets at the end of each reporting period. The Group reduces the carrying amount of a deferred tax asset to the extent that it is no longer probable
that sufficient taxable profit will be available to allow the benefit of part or all of that deferred tax asset to be utilised. Any such reduction is reversed to the extent that it becomes probable that sufficient taxable profit will be available.
Deferred income tax assets are recognised to the extent it is probable that there will be sufficient taxable profits to allow them to recover. If the forecast amount of income determined for tax purposes does not allow the realisation of the asset for deferred income tax in full or in part, such an asset is recognised to the respective amount, accordingly. The above described principle also applies to tax losses recorded as
part of the deferred tax asset.
The Group presents the deferred income tax assets and liabilities netted in the statement of financial position separately for each subsidiary undergoing consolidation. Such assets and provisions may be netted against each other if the Group possesses the legal rights allowing it to simultaneously account
for them when calculating the amount of the tax liability.
In the case of the Bank, the deferred income tax assets and provisions are netted against each other separately for each country where the Bank conducts its business and is obliged to settle corporate
income tax.
The Group discloses separately the amount of negative temporary differences (mainly on account of unused tax losses or unutilised tax allowances) in connection with which the deferred income tax asset was not recognised in the statement of financial position, and also the amount of temporary differences attached to investments in subsidiaries and associates for which no deferred income tax provision has been formed.
Deferred income tax for the Group is provided on assets or liabilities due to temporary differences arising from investments in subsidiaries and associates, except where, on the basis of any probable evidence, the timing of the reversal of the temporary difference is controlled by the Group and it is possible that the difference will not reverse in the foreseeable future.
Deferred income tax on account of revaluation of available for sale investments and of revaluation of cash flow hedging transactions is accounted for in the same way as any revaluation, directly in other
comprehensive income, and it is subsequently transferred to the income statement when the respective
investment or hedged item affects the income statement.
2.25. Assets repossessed for debt
Repossessed collateral represents financial and non-financial assets acquired by the Group in settlement of overdue loans. The assets are initially recognised at fair value when acquired and included in premises and equipment, financial assets or other assets depending on their nature and the Group's intention in respect of recovery of these assets. In case the fair value of repossessed collateral exceeds the receivable from the debtor, the difference constitutes a liability toward the debtor.
Repossessed assets are subsequently measured and accounted for in accordance with the accounting policies relevant for these categories of assets.
2.26. Prepayments, accruals and deferred income
Prepayments are recorded if the respective expenses concern the months succeeding the month in which they were incurred. Prepayments are presented in the statement of financial position under “Other assets”.
Accruals include costs of supplies delivered to the Group but not yet resulting in its payable liabilities. Deferred income includes received amounts of future benefits. Accruals and deferred income are presented in the statement of financial position under the item “Other liabilities”.
Deferred income comprises reinsurance and co-insurance commissions, resulting from insurance agreements included in reinsurance and co-insurance agreements, which are subject to settlement over the period in the proportional part to the future reporting periods.
Acquisition costs in the part attributable to future reporting periods are subject to settlement,
proportionally to the duration of the relevant insurance agreements.
mBank S.A. Group IFRS Condensed Consolidated Financial Statements for the fourth quarter of 2016 PLN (000’s)
52
2.27. Leasing
A lease is classified as a finance lease if it transfers substantially all the risks and rewards incidental to ownership. Title may or may not eventually be transferred. A lease is classified as an operating lease if it does not transfer substantially all the risks and rewards incidental to ownership.
The Group determines whether an arrangement is, or contains, a lease based on the substance of the arrangement and assessment of whether fulfilment of the arrangement is dependent on the use of a
specific asset and the arrangement conveys a right to use the asset.
mBank S.A. Group as a lessor
In the case of assets in use on the basis of a finance lease agreement, the amount equal to the net investment in the lease is recognised as receivables and presented as “Loans and advances to customers”. The difference between the gross receivable amount and the present value of the
receivables is recognised as unrealised financial income.
Revenue from leasing agreements is recognised as follows:
Interests on finance lease
Revenue from finance lease is recognised on the accruals basis, based on the fixed rate of return
calculated on the basis of all the cash flows related to the realisation of a given lease agreement, discounted using the lease interest rate.
Net revenue from operating lease
Revenue from operating lease and the depreciation cost of fixed assets provided by the Group under operating lease, incurred in order to obtain this revenue are recognised in net amount as other operating
income in the profit and loss account.
Revenue from operating lease is recognised as income on a straight-line basis over the lease period, unless application of a different systematic method better reflects the time allocation of benefits drawn from the leased asset.
mBank S.A. Group as a lessee
The leases entered into by the Group are primarily operating leases. The total payments made under
operating leases are charged to the income statement on a straight-line basis over the period of the lease.
2.28. Provisions
The value of provisions for contingent liabilities such as unutilised guarantees and (import) letters of
credit, as well as for unutilised irreversible unconditionally granted credit limits, is measured in compliance with IAS 37 Provisions, Contingent Liabilities and Contingent Assets.
According to IAS 37, provisions are recognised when the Group has a present legal or constructive
obligation as a result of past events, it is more likely that an outflow of resources will be required to settle the obligation and the amount has been reliably estimated.
Technical-insurance provisions for unpaid claims, benefits and premiums concern insurance activity.
Provision for unpaid claims and benefits is created in the amount of the established or expected final value of future claims and benefits paid in connection with events before the reporting period date, including related claims handling costs.
Provision for unpaid claims and benefits which were notified to the insurer and in relation to which the
information held does not enable to assess the value of claims and benefits is calculated using the lump sum method.
Provision for premiums is created individually for each insurance agreement as premium written, attributed to subsequent reporting periods, proportionally to the period for which the premium was
written on the daily basis. However, in case of insurance agreements whose risk is not evenly apportioned over the period of duration of insurance, provision is created proportionally to the expected risk in subsequent reporting periods.
At each reporting date, the Group tests for adequacy of technical-insurance provisions to ensure whether the provisions deducted by deferred acquisition costs are sufficient. The adequacy test is carried out using up-to-date estimates of future cash flows arising from insurance agreements, including costs of claims handling and policy-related costs.
mBank S.A. Group IFRS Condensed Consolidated Financial Statements for the fourth quarter of 2016 PLN (000’s)
53
If the assessment reveals that the technical-insurance provisions are insufficient in relation to estimated
future cash flows, then the whole disparity is promptly recognised in the consolidated income statement through impairment of deferred acquisition costs or/and supplementary provisions.
2.29. Post-employment employee benefits and other employee benefits
Post-employment employee benefits
The Group forms provisions against future liabilities on account of post-employment benefits determined
on the basis of an estimation of liabilities of that type, using an actuarial model. The Group uses a principle of recognition of actuarial gains or losses from the measurement of post-employment benefits related to changes in actuarial assumptions in other comprehensive income that will not be reclassified to the income statement. The Group recognizes service cost and net interest on the net defined benefit liability in the “Overhead cost” and in other interest expenses, respectively.
Equity-settled share-based payment transactions
The Group runs programmes of remuneration based on and settled in own shares as well as based on
shares of the ultimate parent of the Bank and settled in cash. Equity-settled share-based payment transactions are accounted for in compliance with IFRS 2 Share-based Payment. In case of the part of the programme settled in shares, the fair value of the service rendered by employees in return for
options and shares granted increases the costs of the respective period corresponding to own equity. The total amount which needs to be expensed over the period when the outstanding rights of the employees for their options and shares to become exercisable are vested is determined on the basis of the fair value of the granted options and shares. There are no market vesting conditions that shall be taken into
account when estimating the fair value of share options and shares at the measurement date. Non-market vesting conditions are not taken into account when estimating the fair value of share options and shares but they are taken into account through adjustment on the number of equity instruments. At the end of each reporting period, the Bank revises its estimates of the number of options and shares that are expected to become exercised. In accordance with IFRS 2 it is not necessary to recognise the change in fair value of the share-based payment over the term of the programmes.
Cash-settled share-based payment transactions
In case of the part of the programme based on cash-settled share-based payments based on shares of the ultimate parent of the Bank, the fair value of the service rendered by employees in return for right to options/share appreciation rights increases the costs of the respective period, corresponding to liabilities. Until the liability related to the cash-settled share-based payments transactions is settled, the Bank measures the fair value of the liability at the end of each reporting period and at the date of settlement, with any changes in fair value recognised in profit or loss for the period.
Other employee benefits
From September 2012, in mBank Hipoteczny has been functioning the incentive programme based on phantom shares of this bank which is considered as incentive programme according to IAS 19.
2.30. Equity
Equity consists of capital and own funds attributable to owners of the Bank, and non-controlling interest created in compliance with the respective provisions of the law, i.e., the appropriate legislative acts, the By-laws or the Company Articles of Association.
Registered share capital
Share capital is presented at its nominal value, in accordance with the By-laws and with the entry in the business register.
Own shares
In the case of acquisition of shares in the Bank by the Bank the amount paid reduces the value of equity as own shares until the time when they are cancelled. In the case of sale or reallocation of such shares,
the payment received in return is recognised in equity.
Share premium
Share premium is formed from the share premium obtained from the issue of shares reduced by the attached direct costs incurred with that issue.
Share issue costs
Costs directly connected with the issue of new shares or reduce the proceeds from the issue recognised in equity.
mBank S.A. Group IFRS Condensed Consolidated Financial Statements for the fourth quarter of 2016 PLN (000’s)
54
Retained earnings
Retained earnings include:
other supplementary capital, other reserve capital, general banking risk reserve, undistributed profit for the previous year,
net profit (loss) for the current year.
Other supplementary capital, other reserve capital and general banking risk reserve are formed from allocations of profit and they are assigned to purposes specified in the By-laws or other regulations of the law.
Moreover, other reserve capital comprises valuation of employee options.
Dividends for a given year, which have been approved by the General Meeting but not distributed at the end of the reporting period, are shown under the liabilities on account of dividends payable under the
item “Other liabilities”.
Other components of equity
Other components of equity result from:
valuation of available for sale financial instruments, exchange differences on translation of foreign operations, actuarial gains and losses relating to post-employment benefits, valuation of derivative financial instruments held for cash flow hedging in relation to the effective
portion of the hedge.
2.31. Valuation of items denominated in foreign currencies
Functional currency and presentation currency
The items contained in financial reports of particular entities of the Group, including foreign branches of
the Bank, are valued in the currency of the basic economic environment in which the given entity conducts its business activities (“functional currency”). The financial statements are presented in the Polish zloty, which is the presentation currency of the Group and the functional currency of the Bank.
Transactions and balances
Transactions denominated in foreign currencies are converted to the functional currency at the exchange
rate in force at the transaction date. Foreign exchange gains and losses on such transactions as well as
balance sheet revaluation of monetary assets and liabilities denominated in foreign currency are recognised in the income statement.
Foreign exchange differences arising on account of such monetary items as financial assets measured at fair value through the income statement are recognised under gains or losses arising in connection with changes of fair value. Foreign exchange differences on account of such monetary assets as equity
instruments classified as available for sale financial assets are recognised under other comprehensive income.
At the end of each reporting period non-monetary items that are measured in terms of historical cost in a foreign currency are translated using the exchange rate at the date of the transaction, and non-monetary items that are measured at fair value in a foreign currency are translated using the exchange rates at the date when the fair value was measured.
When a gain or loss on a non-monetary item is recognised in other comprehensive income, any
exchange component of that gain or loss is recognised in other comprehensive income. Coversely, when a gain or loss on a non-monetary item is recognised in profit or loss, any exchange component of that gain or loss is recognised in profit or loss.
Changes in fair value of monetary items available for sale cover foreign exchange differences arising from valuation at amortised cost, which are recognised in the income statement.
Items of the statement of financial position of foreign branches are converted from functional currency to the presentation currency with the application of the average exchange rate as at the end of the
reporting period. Income statement items of these entities are converted to presentation currency with the application of the arithmetical mean of average exchange rates quoted by the National Bank of Poland on the last day of each month of the reporting period. Foreign exchange differences so arisen are recognised in other comprehensive income.
mBank S.A. Group IFRS Condensed Consolidated Financial Statements for the fourth quarter of 2016 PLN (000’s)
55
Companies belonging to the Group
The performance and the financial position of all the entities belonging to the Group, none of which conduct their operations under hyperinflationary conditions, the functional currencies of which differ from the presentation currency, are converted to the presentation currency as follows:
assets and liabilities in each presented statement of financial position are converted at the average rate of exchange of the National Bank of Poland (NBP) in force at the end of this reporting period;
revenues and expenses in each income statement are converted at the rate equal to the arithmetical mean of the average rates quoted by NBP on the last day of each of 12 months of each presented periods; whereas
all resulting foreign exchange differences are recognised as a distinct item of other comprehensive income.
Upon consolidation, foreign exchange differences arising from the conversion of net investments in companies operating abroad are recognised in other comprehensive income. Upon the disposal of a
foreign operation, such foreign exchange differences are recognised in the income statement as part of the profit or loss arising upon disposal.
Leasing business
Gains and losses on foreign exchange differences from the valuation of liabilities on account of credit
financing of purchases of assets under operating leasing schemes are recognised in the income statement. In the operating leasing agreements recognised in the statement of financial position the fixed assets subject to the respective contracts are recognised at the starting date of the appropriate contract as converted to PLN, whereas the foreign currency loans with which they were financed are subject to valuation according to the respective foreign exchange rates.
In the case of finance lease agreements the foreign exchange differences arising from the valuation of leasing receivables and liabilities denominated in foreign currency are recognised through the income
statement at the end of the reporting period.
2.32. Trust and fiduciary activities
mBank S.A. operates trust and fiduciary activities including domestic and foreign securities and services provided to investment and pension funds.
The assets concerned are not shown in these financial statements as they do not belong to the Group.
Other companies belonging to the Group do not conduct any trust or fiduciary activities.
2.33. New standards, interpretations and amendments to published standards
These financial statements include the requirements of all the International Accounting Standards and the International Financial Reporting Standards endorsed by the European Union, and the related with
them interpretations which have been endorsed and binding for annual periods starting on 1 January 2016.
Published Standards and Interpretations which have been issued and binding for the Group for annual periods starting on 1 January 2016
Standards and interpretations approved by the European Union:
IAS 19 (Amended), Defined Benefit Plans: Employee Contributions, published by the International Accounting Standards Board on 21 November 2013, approved by European Union on 17 December 2014 and binding for annual periods starting on or after 1 July 2014, in EU effective at the latest for financial years beginning on or after 1 February 2015.
Improvements to IFRSs 2010 - 2012, published by the International Accounting Standards Board on 12 December 2013, approved by European Union on 17 December 2014, in majority binding for
annual periods starting on or after 1 July 2014 and some effective prospectively for transactions occurring on or after 1 July 2014. In EU improvements are effective at latest for financial years beginning on or after 1 February 2015.
Amendments to IAS 1, Disclosure initiative, published by the International Accounting Standards Board on 18 December 2014 approved by European Union on 18 December 2015 and binding for annual periods starting on or after 1 January 2016.
Amendments to IAS 16 and IAS 38, Clarification of acceptable methods of depreciation and
amortization, published by the International Accounting Standards Board on 12 May 2014, approved
mBank S.A. Group IFRS Condensed Consolidated Financial Statements for the fourth quarter of 2016 PLN (000’s)
56
by European Union on 2 December 2015, binding for annual periods beginning on or after 1 January
2016.
Amendments to IAS 16 and IAS 41 Agriculture: Bearer Plants published by the International Accounting Standards Board on 30 June 2014, approved by European Union on 23 November 2015, binding for annual periods beginning on or after 1 January 2016.
Amendments to IAS 27, Equity method in separate financial statements, published by the
International Accounting Standards Board on 12 August 2014, approved by European Union on 18 December 2015, binding for annual periods beginning on or after 1 January 2016. The impact of applying the amended IAS 27 on the standalone comparative data presented in these financial statements has been presented under Note 2.34 “Comparative data”.
IFRS 11 (Amended), Accounting for acquisitions of interests in joint operations, published by the International Accounting Standards Board on 6 May 2014, approved by European Union on 24 November 2015, binding for annual periods beginning on or after 1 January 2016.
Annual Improvements to IFRSs 2012-2014 Cycle, changing 4 standards, published by the International Accounting Standards Board on 25 September 2014, approved by European Union on 15 December 2015 and binding for annual periods beginning on or after 1 January 2016.
Amendments to IFRS 10, IFRS 12 and IAS 28, Investment entities: applying the consolidation exception, published by the International Accounting Standards Board on 18 December 2014, approved by European Union on 22 September 2016, binding for annual periods starting on or after 1 January 2016.
These financial statements do not include the following standards and interpretations which await endorsement of the European Union or which have been endorsed by the European Union but entered or will enter into force after the balance sheet date.
In relation to standards and interpretations that have been approved by the European Union, but entered or will enter into force after the balance sheet date, the Group did not use the possibility of early application.
Standards and interpretations not yet approved by the European Union:
Amendments to IFRS 10 and IAS 28, Sale or contribution of assets between an investor and its associate or joint venture, published by the International Accounting Standards Board on 11 September 2014, binding for annual periods beginning on or after 1 January 2016, wherein the
term has been initially postponed by the International Accounting Standards Board.
The Group is of the opinion that the application of the amended standards will have no significant impact on the financial statements in the period of its initial application.
IFRS 14, Regulatory Deferral Accounts, published by the International Accounting Standards Board on 30 January 2014, binding for annual periods starting on or after 1 January 2016.
The Group is of the opinion that the application of the standard will have no significant impact on the financial statements in the period of its initial application.
Published Standards and Interpretations which have been issued but are not yet binding or have not been adopted early
Standards and interpretations approved by the European Union:
IFRS 9, Financial Instruments, published by the International Accounting Standards Board on 24 July 2014, approved by European Union on 29 November 2016, represents the final version of the standard, replaces earlier versions of IFRS 9 and completes the International Accounting Standards Board's project to replace IAS 39 Financial Instruments: Recognition and Measurement. The new
standard addresses classification and measurement of financial assets and financial liabilities, impairment methodology and hedge accounting. IFRS 9 does not include macro hedge accounting,
which is a separate project of International Accounting Standards Board. The Group continues to apply IAS 39 accounting for macro hedges. The new standard is effective for annual periods beginning on or after 1 January 2018.
The Group is of the opinion that the application of the standard will have an impact on the presentation and measurement of these instruments in the financial statements.
mBank S.A. Group IFRS Condensed Consolidated Financial Statements for the fourth quarter of 2016 PLN (000’s)
57
Standards and interpretations not yet approved by the European Union:
IFRS 15, Revenue from Contracts with Customers, published by the International Accounting Standards Board on 28 May 2014, binding for annual periods beginning on or after 1 January 2018.
Amendments to IFRS 15 were published by International Accounting Standards Board on 11 September 2015 and are binding for annuals periods starting on or after 1 January 2018.
Amendments to IFRS 15, Clarifications to IFRS 15 Revenue from Contracts with Customers,
published by International Accounting Standards Board on 12 April 2016, binding for annuals periods starting on or after 1 January 2018.
The Group is of the opinion that the application of the standard will have no significant impact on the financial statements in the period of its initial application.
Amendments to IAS 12, Recognition of Deferred Tax Assets for Unrealised Losses, published by the International Accounting Standards Board on 19 January 2016, binding for annual periods beginning on or after 1 January 2017.
The Group is of the opinion that the application of the amended standard will have no significant impact on the financial statements in the period of its initial application
Amendments to IAS 7, Disclosure Initiative, published by the International Accounting Standards Board on 29 January 2016, binding for annual periods beginning on or after 1 January 2017.
The Group is of the opinion that the application of the amended standard will have no significant impact on the financial statements in the period of its initial application.
IFRS 16, Leases, published by the International Accounting Standards Board on 13 January 2016,
binding for annual periods starting on or after 1 January 2019.
IFRS 16 introduces new principles for the recognition of leases. The main amendment is the elimination of the classification of leases as either operating leases or finance leases and instead, the introduction of a single lessee accounting model. Applying a single accounting model, a lessee is required to recognize lease assets and corresponding liability in the statement of financial position, except for leases with a term of less than 12 months and leases with underlying asset of low value.
A lessee is also required to recognize depreciation costs of lease asset separately from interest costs on lease liabilities in the income statement.
IFRS 16 substantially carries forward the lessor accounting approach. It means that lessor continues to classify its leases as operating leases or finance leases, and to account for those two types of
leases differently.
The Group is of the opinion that the application of a new standard will have an impact on the recognition, presentation, measurement and disclosure of lease assets and corresponding liability in
the financial statements of the Group as lessee. The Group is of the opinion that the application of a new standard will have no significant impact on recognition of previous finance lease in the financial statements of the Group.
Amendments to IFRS 2, Classification and measurement of share-based payment transactions, published by International Accounting Standards Board on 20 June 2016, binding for annuals periods starting on or after 1 January 2018
The Group is of the opinion that the application of the amended standard will have no significant
impact on the financial statements in the period of its initial application.
Amendments to IFRS 4, Applying IFRS 9 Financial Instruments with IFRS 4 Insurance Contracts, published by International Accounting Standards Board on 12 September 2016, binding for annuals periods starting on or after 1 January 2018
The Group is of the opinion that the application of the amended standard will have no significant impact on the financial statements in the period of its initial application.
Amendments to IAS 40, Transfers of Investment Property, published by International Accounting Standards Board on 8 December 2016, binding for annuals periods starting on or after 1 January 2018.
The Group is of the opinion that the application of the amended standard will have no significant impact on the financial statements in the period of its initial application.
mBank S.A. Group IFRS Condensed Consolidated Financial Statements for the fourth quarter of 2016 PLN (000’s)
58
IFRIC Interpretation 22 Foreign Currency Transactions and Advance Consideration, published by
International Accounting Standards Board on 8 December 2016, binding for annuals periods starting on or after 1 January 2018.
The Group is of the opinion that the application of interpretation will have no significant impact on the financial statements in the period of its initial application.
Annual Improvements to IFRS Standards 2014-2016 Cycle, changing 3 standards (IFRS 1, IFRS 12,
IAS 28), published by International Accounting Standards Board on 8 December 2016, binding for annuals periods starting on or after 1 January 2017 or on or after 1 January 2018.
The Group is of the opinion that the application of the amended standards will have no significant impact on the financial statements in the period of its initial application.
2.34. Comparative data
Consolidated financial statements
Consolidated data as at 31 December 2015 are comparable with the current accounting period and therefore have not been adjusted except for the presentation of the amount of tax on the Group's
balance sheet items, as described below.
Following the entry into force on 1 February 2016 of the Act on tax on certain financial institutions in the comparative data of the income statement for the period from 1 January to 31 December 2015 and for the period from 1 October to 31 December 2015, the Group reclassified the amount of PLN 3 650 thousand and PLN 933 thousand respectively of the tax paid by the mBank’s branch in Slovakia on its
total amount of liabilities, from overhead costs (from "Taxes and fees") to the new position "Taxes on the Group balance sheet items". This change had no impact on the net income and equity of the Group.
Stand-alone financial statements
Similarly as in case of comparative data of the Group, in connection with the entry into force on 1 February 2016 of the Act on tax on certain financial institutions in the comparative data of the income statement for the period from 1 January to 31 December 2015 and for the period from 1 October to 31
December 2015, the Bank reclassified the amount of PLN 3 650 thousand and PLN 933 thousand respectively of the tax paid by the mBank’s branch in Slovakia on its total amount of liabilities, from overhead costs (from "Taxes and fees") to the new position "Taxes on the Bank's balance sheet items". This change had no impact on the net income and equity of the Bank.
Due to the change in accounting policy regarding to the valuation method of investments in subsidiaries, associates and joint ventures, the Bank made restatement of the stand-alone comparative data as at 1 January 2015 and as at 31 December 2015. Until 31 December 2015, shares in subsidiaries, associates
and joint ventures were recognised at cost method. Starting from 1 January 2016 the Bank applies the equity method to the valuation of such assets following the entry into force of IAS 27 Separate financial statements amendments allowing usage of such a valuation method (IAS 27.10 (c)).
The impact of changes in the accounting policies on the stand-alone comparative data of mBank S.A. presented in these condensed consolidated financial statements are shown in the following tables.
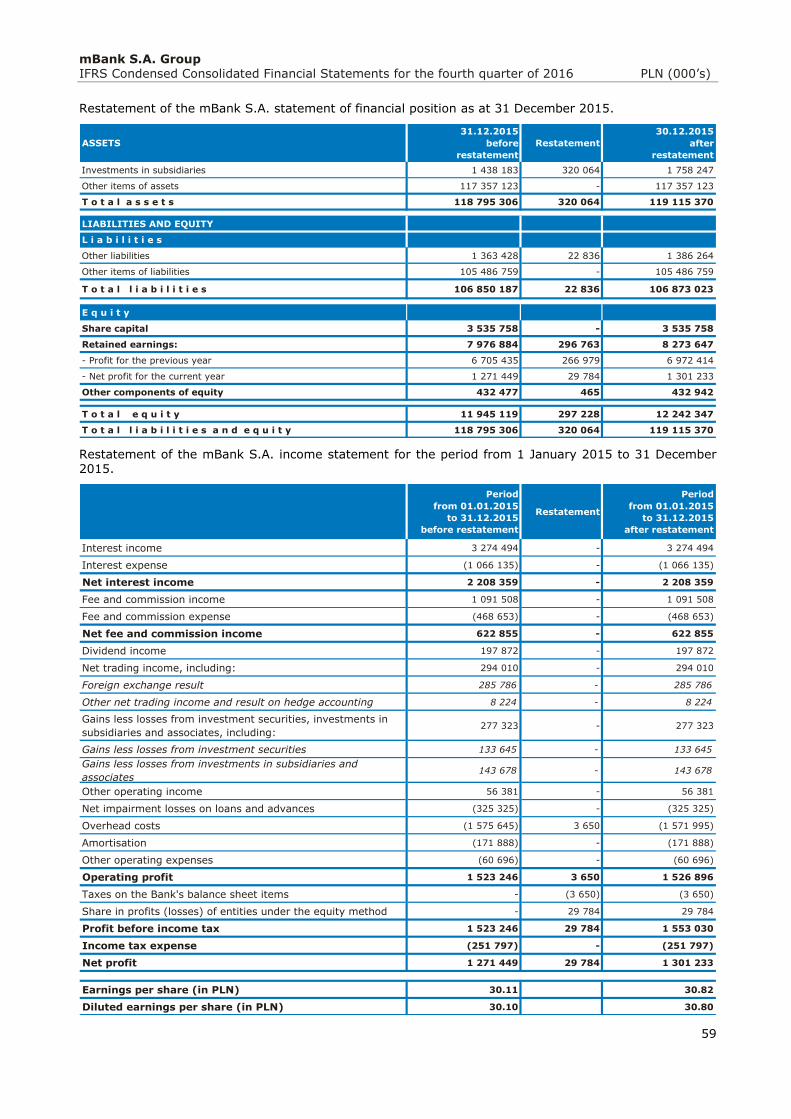
mBank S.A. Group IFRS Condensed Consolidated Financial Statements for the fourth quarter of 2016 PLN (000’s)
59
Restatement of the mBank S.A. statement of financial position as at 31 December 2015.
Restatement of the mBank S.A. income statement for the period from 1 January 2015 to 31 December 2015.
ASSETS
31.12.2015
before
restatement
Restatement
30.12.2015
after
restatement
Investments in subsidiaries 1 438 183 320 064 1 758 247
Other items of assets 117 357 123 - 117 357 123
T o t a l a s s e t s 118 795 306 320 064 119 115 370
LIABILITIES AND EQUITY
L i a b i l i t i e s
Other liabilities 1 363 428 22 836 1 386 264
Other items of liabilities 105 486 759 - 105 486 759
T o t a l l i a b i l i t i e s 106 850 187 22 836 106 873 023
E q u i t y
Share capital 3 535 758 - 3 535 758
Retained earnings: 7 976 884 296 763 8 273 647
- Profit for the previous year 6 705 435 266 979 6 972 414
- Net profit for the current year 1 271 449 29 784 1 301 233
Other components of equity 432 477 465 432 942
T o t a l e q u i t y 11 945 119 297 228 12 242 347
T o t a l l i a b i l i t i e s a n d e q u i t y 118 795 306 320 064 119 115 370
Period
from 01.01.2015
to 31.12.2015
before restatement
Restatement
Period
from 01.01.2015
to 31.12.2015
after restatement
Interest income 3 274 494 - 3 274 494
Interest expense (1 066 135) - (1 066 135)
Net interest income 2 208 359 - 2 208 359
Fee and commission income 1 091 508 - 1 091 508
Fee and commission expense (468 653) - (468 653)
Net fee and commission income 622 855 - 622 855
Dividend income 197 872 - 197 872
Net trading income, including: 294 010 - 294 010
Foreign exchange result 285 786 - 285 786
Other net trading income and result on hedge accounting 8 224 - 8 224
Gains less losses from investment securities, investments in
subsidiaries and associates, including:277 323 - 277 323
Gains less losses from investment securities 133 645 - 133 645
Gains less losses from investments in subsidiaries and
associates143 678 - 143 678
Other operating income 56 381 - 56 381
Net impairment losses on loans and advances (325 325) - (325 325)
Overhead costs (1 575 645) 3 650 (1 571 995)
Amortisation (171 888) - (171 888)
Other operating expenses (60 696) - (60 696)
Operating profit 1 523 246 3 650 1 526 896
Taxes on the Bank's balance sheet items - (3 650) (3 650)
Share in profits (losses) of entities under the equity method - 29 784 29 784
Profit before income tax 1 523 246 29 784 1 553 030
Income tax expense (251 797) - (251 797)
Net profit 1 271 449 29 784 1 301 233
Earnings per share (in PLN) 30.11 30.82
Diluted earnings per share (in PLN) 30.10 30.80
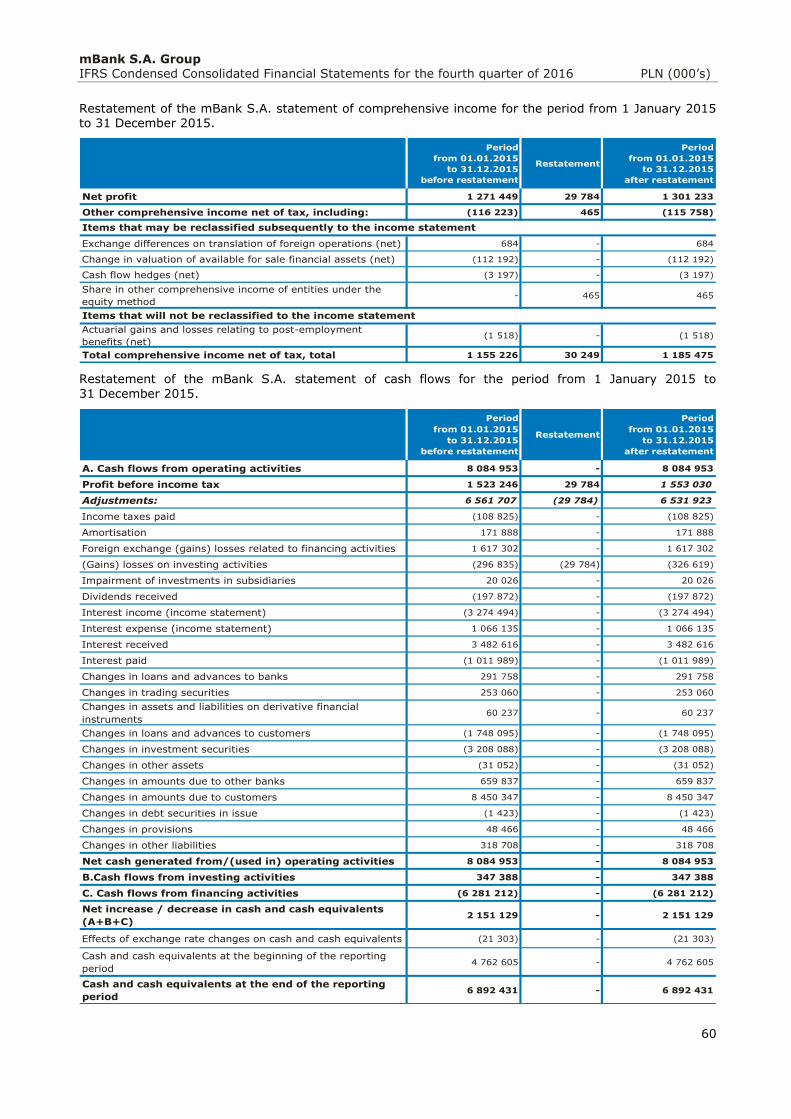
mBank S.A. Group IFRS Condensed Consolidated Financial Statements for the fourth quarter of 2016 PLN (000’s)
60
Restatement of the mBank S.A. statement of comprehensive income for the period from 1 January 2015
to 31 December 2015.
Restatement of the mBank S.A. statement of cash flows for the period from 1 January 2015 to
31 December 2015.
Period
from 01.01.2015
to 31.12.2015
before restatement
Restatement
Period
from 01.01.2015
to 31.12.2015
after restatement
Net profit 1 271 449 29 784 1 301 233
Other comprehensive income net of tax, including: (116 223) 465 (115 758)
Exchange differences on translation of foreign operations (net) 684 - 684
Change in valuation of available for sale financial assets (net) (112 192) - (112 192)
Cash flow hedges (net) (3 197) - (3 197)
Share in other comprehensive income of entities under the
equity method- 465 465
Actuarial gains and losses relating to post-employment
benefits (net)(1 518) - (1 518)
Total comprehensive income net of tax, total 1 155 226 30 249 1 185 475
Items that may be reclassified subsequently to the income statement
Items that will not be reclassified to the income statement
Period
from 01.01.2015
to 31.12.2015
before restatement
Restatement
Period
from 01.01.2015
to 31.12.2015
after restatement
A. Cash flows from operating activities 8 084 953 - 8 084 953
Profit before income tax 1 523 246 29 784 1 553 030
Adjustments: 6 561 707 (29 784) 6 531 923
Income taxes paid (108 825) - (108 825)
Amortisation 171 888 - 171 888
Foreign exchange (gains) losses related to financing activities 1 617 302 - 1 617 302
(Gains) losses on investing activities (296 835) (29 784) (326 619)
Impairment of investments in subsidiaries 20 026 - 20 026
Dividends received (197 872) - (197 872)
Interest income (income statement) (3 274 494) - (3 274 494)
Interest expense (income statement) 1 066 135 - 1 066 135
Interest received 3 482 616 - 3 482 616
Interest paid (1 011 989) - (1 011 989)
Changes in loans and advances to banks 291 758 - 291 758
Changes in trading securities 253 060 - 253 060
Changes in assets and liabilities on derivative financial
instruments60 237 - 60 237
Changes in loans and advances to customers (1 748 095) - (1 748 095)
Changes in investment securities (3 208 088) - (3 208 088)
Changes in other assets (31 052) - (31 052)
Changes in amounts due to other banks 659 837 - 659 837
Changes in amounts due to customers 8 450 347 - 8 450 347
Changes in debt securities in issue (1 423) - (1 423)
Changes in provisions 48 466 - 48 466
Changes in other liabilities 318 708 - 318 708
Net cash generated from/(used in) operating activities 8 084 953 - 8 084 953
B.Cash flows from investing activities 347 388 - 347 388
C. Cash flows from financing activities (6 281 212) - (6 281 212)
Net increase / decrease in cash and cash equivalents
(A+B+C)2 151 129 - 2 151 129
Effects of exchange rate changes on cash and cash equivalents (21 303) - (21 303)
Cash and cash equivalents at the beginning of the reporting
period4 762 605 - 4 762 605
Cash and cash equivalents at the end of the reporting
period 6 892 431 - 6 892 431
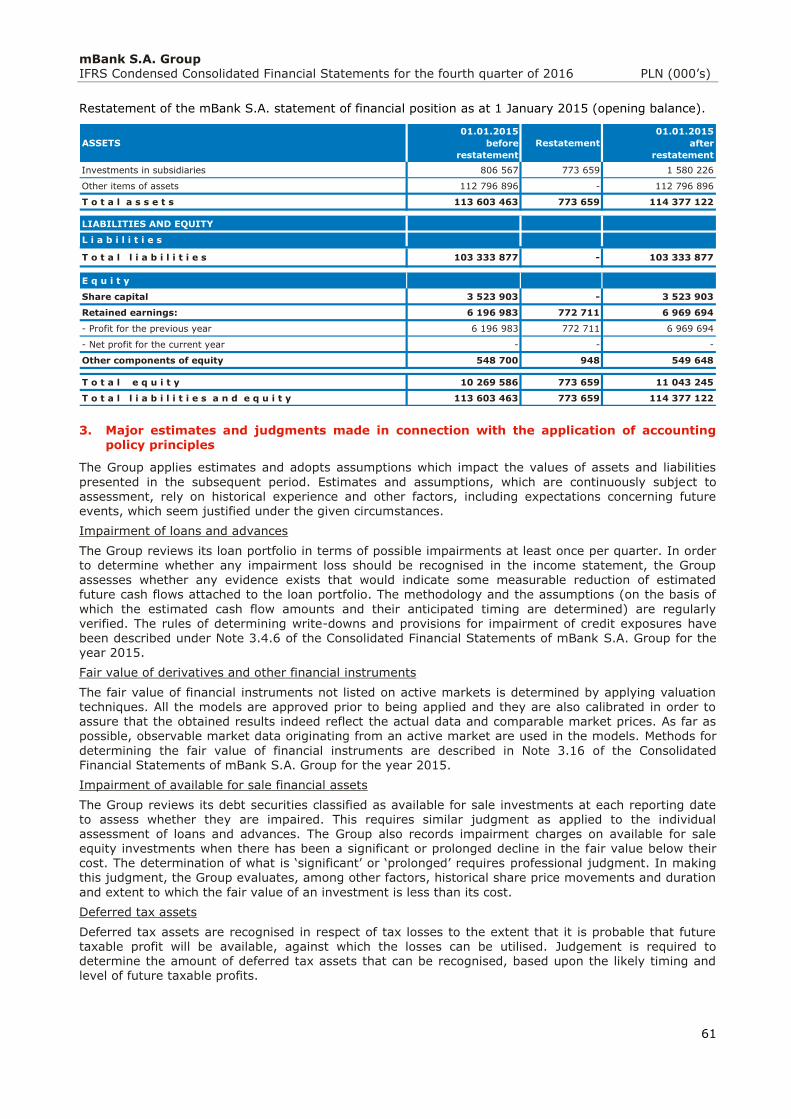
mBank S.A. Group IFRS Condensed Consolidated Financial Statements for the fourth quarter of 2016 PLN (000’s)
61
Restatement of the mBank S.A. statement of financial position as at 1 January 2015 (opening balance).
3. Major estimates and judgments made in connection with the application of accounting policy principles
The Group applies estimates and adopts assumptions which impact the values of assets and liabilities
presented in the subsequent period. Estimates and assumptions, which are continuously subject to assessment, rely on historical experience and other factors, including expectations concerning future events, which seem justified under the given circumstances.
Impairment of loans and advances
The Group reviews its loan portfolio in terms of possible impairments at least once per quarter. In order to determine whether any impairment loss should be recognised in the income statement, the Group assesses whether any evidence exists that would indicate some measurable reduction of estimated future cash flows attached to the loan portfolio. The methodology and the assumptions (on the basis of
which the estimated cash flow amounts and their anticipated timing are determined) are regularly
verified. The rules of determining write-downs and provisions for impairment of credit exposures have been described under Note 3.4.6 of the Consolidated Financial Statements of mBank S.A. Group for the year 2015.
Fair value of derivatives and other financial instruments
The fair value of financial instruments not listed on active markets is determined by applying valuation techniques. All the models are approved prior to being applied and they are also calibrated in order to assure that the obtained results indeed reflect the actual data and comparable market prices. As far as possible, observable market data originating from an active market are used in the models. Methods for
determining the fair value of financial instruments are described in Note 3.16 of the Consolidated Financial Statements of mBank S.A. Group for the year 2015.
Impairment of available for sale financial assets
The Group reviews its debt securities classified as available for sale investments at each reporting date to assess whether they are impaired. This requires similar judgment as applied to the individual assessment of loans and advances. The Group also records impairment charges on available for sale equity investments when there has been a significant or prolonged decline in the fair value below their cost. The determination of what is ‘significant’ or ‘prolonged’ requires professional judgment. In making
this judgment, the Group evaluates, among other factors, historical share price movements and duration
and extent to which the fair value of an investment is less than its cost.
Deferred tax assets
Deferred tax assets are recognised in respect of tax losses to the extent that it is probable that future taxable profit will be available, against which the losses can be utilised. Judgement is required to determine the amount of deferred tax assets that can be recognised, based upon the likely timing and level of future taxable profits.
ASSETS
01.01.2015
before
restatement
Restatement
01.01.2015
after
restatement
Investments in subsidiaries 806 567 773 659 1 580 226
Other items of assets 112 796 896 - 112 796 896
T o t a l a s s e t s 113 603 463 773 659 114 377 122
LIABILITIES AND EQUITY
L i a b i l i t i e s
T o t a l l i a b i l i t i e s 103 333 877 - 103 333 877
E q u i t y
Share capital 3 523 903 - 3 523 903
Retained earnings: 6 196 983 772 711 6 969 694
- Profit for the previous year 6 196 983 772 711 6 969 694
- Net profit for the current year - - -
Other components of equity 548 700 948 549 648
T o t a l e q u i t y 10 269 586 773 659 11 043 245
T o t a l l i a b i l i t i e s a n d e q u i t y 113 603 463 773 659 114 377 122
mBank S.A. Group IFRS Condensed Consolidated Financial Statements for the fourth quarter of 2016 PLN (000’s)
62
Revenue and expenses from sale of insurance products bundled with loans
Revenue and expenses from sale of insurance products bundled with loans are split into interest income and fee and commission income based on the relative fair value analysis of each of these products.
The remuneration included in fee and commission income is recognised partly as upfront income and
partly including deferring over time based on the analysis of the stage of completion of the service.
Now, the Group leads in case of insurance policies bundled with loans to upfront recognition less than 10% of bancassurance income associated with cash and car loans and 0% to approximately 25% of bancassurance income associated with mortgage loans. Recognition of the remaining part of the income is spread over the economic life of the associated loans. Expenses directly linked to the sale of insurance products are recognised using the same pattern.
Liabilities due to post-employment employee benefits
The costs of post-employment employee benefits are determined using an actuarial valuation. The actuarial valuation involves making assumptions about discount rates, future salary increases, mortality
rates and other factors. Due to the long–term nature of these liabilities, such estimates are subject to significant uncertainty.
Leasing classification
The Group makes judgement classifying lease agreements as finance lease or operating lease based on the economic substance of the transaction basing on professional judgment whether substantially all the risk and rewards incidental to ownership of an asset were transferred or not.
Classification for forborne exposures
In accordance with the Group's forbearance policy presented under Note 3.4.7 of the Consolidated
Financial Statements of mBank S.A. Group for the year 2015, the Group classifies exposure / customers which are subject to the forbearance policy on the basis of professional judgment.
4. Business segments
Following the adoption of “management approach” of IFRS 8, operating segments are reported in accordance with the internal reporting provided to the Bank’s Management Board (the chief operating
decision-maker), which is responsible for allocating resources to the reportable segments and assesses their performance.
The classification by business segments is based on client groups and product groups defined by homogenous transaction characteristics. The classification is consistent with sales management and the
philosophy of delivering complex products to the Bank’s clients, including both standard banking
products and more sophisticated investment products. The method of presentation of financial results coupled with the business management model ensures a constant focus on creating added value in relations with clients of the Bank and Group companies and should be seen as a primary division, which serves the purpose of both managing and perceiving business within the Group.
The Group conducts its business through different business segments, which offer specific products and
services targeted at specific client groups and market segments. The Group currently conducts its operations through the following business segments:
The Retail Banking segment, which divides its customers into mBank customers and Private
Banking customers and which offers a full range of the Bank’s banking products and services as well as specialized products offered by a number of subsidiaries belonging to the Retail Banking
segment. The key products in this segment include current and savings accounts (including
accounts in foreign currencies), term deposits, lending products (retail mortgage loans and non-mortgage loans such as cash loans, car loans, overdrafts, credit cards and other loan products),
debit cards, insurance products, investment products, brokerage and leasing services offered to
both individual customers and to micro-businesses. The results of the Retail Banking segment
include the results of foreign branches of mBank in the Czech Republic and Slovakia. The Retail
Banking segment also includes the results of mFinanse S.A. (previously Aspiro S.A.), as well as the
results of retail segments of mLeasing Sp. z o.o. and mBank Hipoteczny S.A. . Moreover this segment includes the result of mWealth Management S.A. and retail segment of Dom Maklerski
mBanku S.A. until the integration with the Bank. In 2015, this segment also includes the results of
BRE Ubezpieczenia TUiR S.A. and AWL I Sp. z o.o. until the date of their sale as well as the result of BRE Ubezpieczenia Sp. z o.o. and BRE Agent Ubezpieczeniowy Sp. z o.o. until the date of their
merger with mFinanse S.A. (previously Aspiro S.A.), as well as the Group’s result on sale of BRE
Ubezpieczenia TUiR S.A.
mBank S.A. Group IFRS Condensed Consolidated Financial Statements for the fourth quarter of 2016 PLN (000’s)
63
The Corporates and Financial Markets segment, which is divided into two sub-segments:
Corporate and Investment Banking sub-segment (business line), which targets small, medium and large-sized companies and public sector entities. The key products offered to these customers include transactional banking products and services including current account products, multi-functional internet banking, tailor-made cash management and trade finance services, term deposits, foreign exchange transactions, a comprehensive offer of short-term financing and
investment loans, cross-border credit, project finance, structured and mezzanine finance services, investment banking products including foreign exchange options, forward contracts, interest rate derivatives and commodity swaps and options, structured deposit products with embedded options (interest on structured deposit products are directly linked to the performance of certain underlying financial instruments such as foreign exchange options, interest rate options and stock options), debt origination for corporate clients, treasury bills and bonds, non-government debt,
medium-term bonds, buy sell back and sell buy back transactions and repo transactions, as well as leasing, factoring and brokerage services. The Corporate and Investment Banking sub-segment includes the results of the following subsidiaries: mFaktoring S.A., Garbary Sp. z o.o., Tele-Tech Investment Sp. z o.o. as well as the results of corporate segments of mLeasing Sp. z o. o. and mBank Hipoteczny S.A. Moreover this segment includes the results of corporate segment of Dom Maklerski mBanku S.A. until the date of integration with the Bank.
Financial Markets sub-segment (business line) consists primarily of treasury, financial markets,
and financial institutions operations, manages the liquidity, interest rate and foreign exchange risks of the Bank, its trading and investment portfolios, and conducts market making in PLN denominated cash and derivative instruments. The Bank also maintains an extensive correspondent banking network and also develops relationships with other banks providing products such as current accounts, overdrafts, stand alone and syndicated loans and loans insured by KUKE to support the Polish export market. This sub-segment also includes the results of mFinance France S.A. as well as the results of mLeasing Sp. z o.o and mBank Hipoteczny S.A. with
regard to activities concerning funding.
Operations which are not included in the Retail Banking segment and the Corporates and Financial Markets segment are reported under "Other". This segment includes the results of mLocum S.A., mCentrum Operacji Sp. z o.o. and BDH Development Sp. z o.o.
The principles of segment classification of the Group’s activities are described below.
Transactions between the business segments are conducted on regular commercial terms.
Allocation of funds to the Group companies and assigning them to particular business segments results
in funding cost transfers. Interest charged for these funds is based on the Group’s weighted average cost of capital and presented in operating income.
Internal fund transfers between the Bank’s units are calculated at transfer rates based on market rates. Transfer rates are determined on the same basis for all operating units of the Bank and their
differentiation results only from currency and maturity structure of assets and liabilities. Internal settlements concerning internal valuation of funds transfers are reflected in the results of each segment.
Assets and liabilities of a business segment comprise operating assets and liabilities, which account for most of the statement of financial position, whereas they do not include such items as taxes or loans.
The separation of the assets and liabilities of a segment, as well as of its income and costs, is done on the basis of internal information prepared at the Bank for the purpose of management accounting.
Assets and liabilities for which the units of the given segment are responsible as well as income and costs related to such assets and liabilities are attributed to individual business segments. The financial result of a business segment takes into account all the income and cost items attributable to it.
The business operations of particular companies of the Group are fully attributed to the appropriate business segments (including consolidation adjustments).
The primary basis used by the Group in the segment reporting is business line division. In addition, the Group’s activity is presented by geographical areas reporting broken down into Poland and foreign
countries because of the place of origin of income and expenses. Foreign countries segment includes activity of mBank’s foreign branches in Czech Republic and Slovakia as well as activity of foreign subsidiary mFinance France S.A. The activity of the company mFinance France S.A., after the elimination of income and expenses and assets and liabilities related to the issue of bonds under the EMTN programme, is presented in the “Foreign countries” segment. The cost of the EMTN programme as well as the related assets and liabilities are presented in the segment “Poland”.
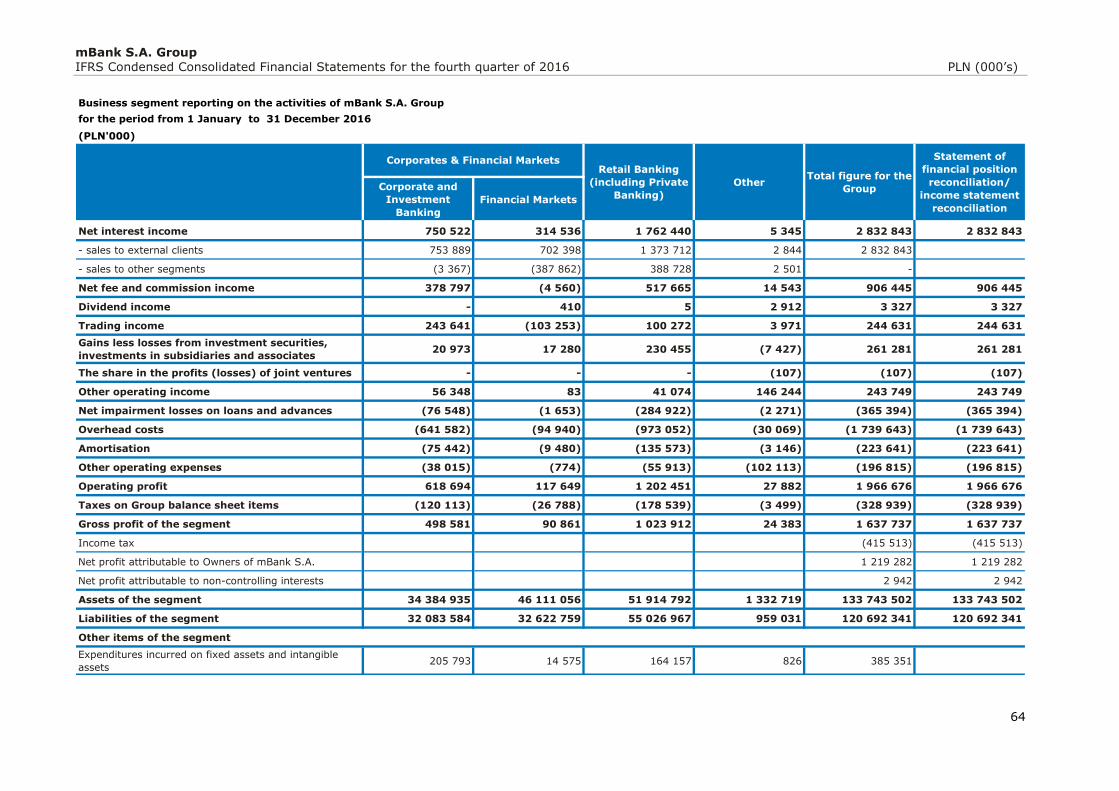
mBank S.A. Group IFRS Condensed Consolidated Financial Statements for the fourth quarter of 2016 PLN (000’s)
64
Business segment reporting on the activities of mBank S.A. Group
(PLN'000)
Corporate and
Investment
Banking
Financial Markets
Net interest income 750 522 314 536 1 762 440 5 345 2 832 843 2 832 843
- sales to external clients 753 889 702 398 1 373 712 2 844 2 832 843
- sales to other segments (3 367) (387 862) 388 728 2 501 -
Net fee and commission income 378 797 (4 560) 517 665 14 543 906 445 906 445
Dividend income - 410 5 2 912 3 327 3 327
Trading income 243 641 (103 253) 100 272 3 971 244 631 244 631
Gains less losses from investment securities,
investments in subsidiaries and associates20 973 17 280 230 455 (7 427) 261 281 261 281
The share in the profits (losses) of joint ventures - - - (107) (107) (107)
Other operating income 56 348 83 41 074 146 244 243 749 243 749
Net impairment losses on loans and advances (76 548) (1 653) (284 922) (2 271) (365 394) (365 394)
Overhead costs (641 582) (94 940) (973 052) (30 069) (1 739 643) (1 739 643)
Amortisation (75 442) (9 480) (135 573) (3 146) (223 641) (223 641)
Other operating expenses (38 015) (774) (55 913) (102 113) (196 815) (196 815)
Operating profit 618 694 117 649 1 202 451 27 882 1 966 676 1 966 676
Taxes on Group balance sheet items (120 113) (26 788) (178 539) (3 499) (328 939) (328 939)
Gross profit of the segment 498 581 90 861 1 023 912 24 383 1 637 737 1 637 737
Income tax (415 513) (415 513)
Net profit attributable to Owners of mBank S.A. 1 219 282 1 219 282
Net profit attributable to non-controlling interests 2 942 2 942
Assets of the segment 34 384 935 46 111 056 51 914 792 1 332 719 133 743 502 133 743 502
Liabilities of the segment 32 083 584 32 622 759 55 026 967 959 031 120 692 341 120 692 341
Other items of the segment
Expenditures incurred on fixed assets and intangible
assets205 793 14 575 164 157 826 385 351
Statement of
financial position
reconciliation/
income statement
reconciliation
for the period from 1 January to 31 December 2016
Corporates & Financial MarketsRetail Banking
(including Private
Banking)
OtherTotal figure for the
Group
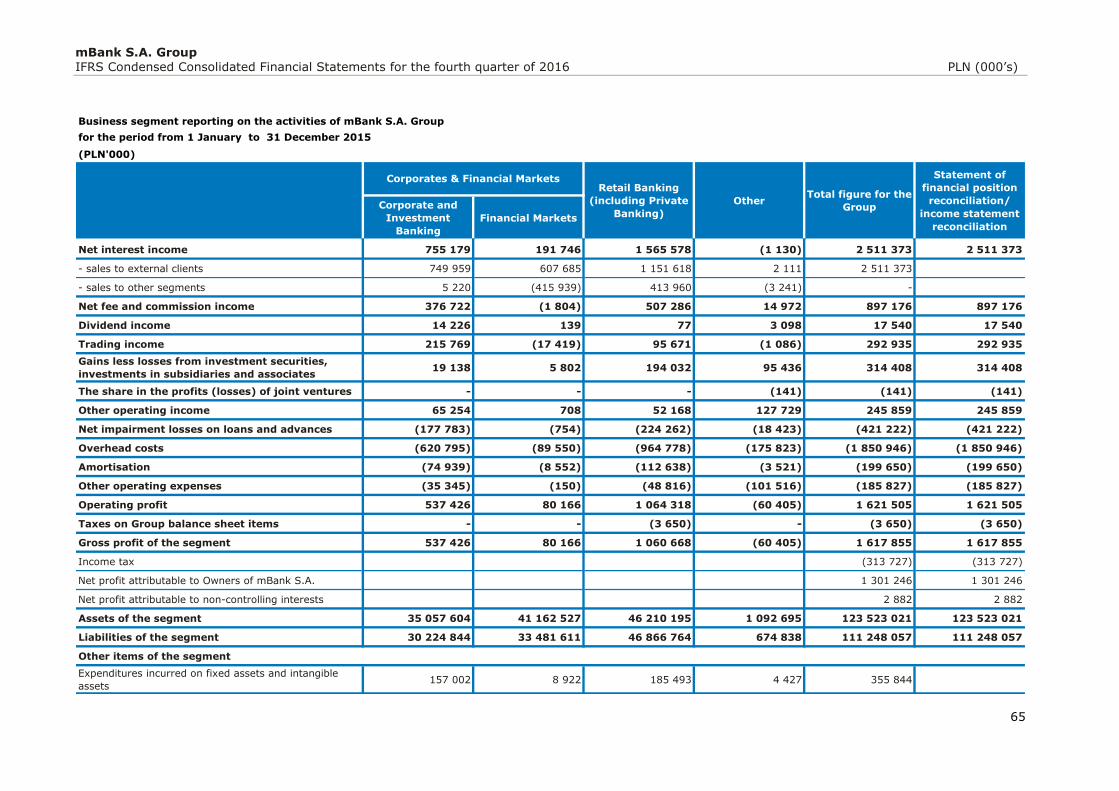
mBank S.A. Group IFRS Condensed Consolidated Financial Statements for the fourth quarter of 2016 PLN (000’s)
65
Business segment reporting on the activities of mBank S.A. Group
(PLN'000)
Corporate and
Investment
Banking
Financial Markets
Net interest income 755 179 191 746 1 565 578 (1 130) 2 511 373 2 511 373
- sales to external clients 749 959 607 685 1 151 618 2 111 2 511 373
- sales to other segments 5 220 (415 939) 413 960 (3 241) -
Net fee and commission income 376 722 (1 804) 507 286 14 972 897 176 897 176
Dividend income 14 226 139 77 3 098 17 540 17 540
Trading income 215 769 (17 419) 95 671 (1 086) 292 935 292 935
Gains less losses from investment securities,
investments in subsidiaries and associates19 138 5 802 194 032 95 436 314 408 314 408
The share in the profits (losses) of joint ventures - - - (141) (141) (141)
Other operating income 65 254 708 52 168 127 729 245 859 245 859
Net impairment losses on loans and advances (177 783) (754) (224 262) (18 423) (421 222) (421 222)
Overhead costs (620 795) (89 550) (964 778) (175 823) (1 850 946) (1 850 946)
Amortisation (74 939) (8 552) (112 638) (3 521) (199 650) (199 650)
Other operating expenses (35 345) (150) (48 816) (101 516) (185 827) (185 827)
Operating profit 537 426 80 166 1 064 318 (60 405) 1 621 505 1 621 505
Taxes on Group balance sheet items - - (3 650) - (3 650) (3 650)
Gross profit of the segment 537 426 80 166 1 060 668 (60 405) 1 617 855 1 617 855
Income tax (313 727) (313 727)
Net profit attributable to Owners of mBank S.A. 1 301 246 1 301 246
Net profit attributable to non-controlling interests 2 882 2 882
Assets of the segment 35 057 604 41 162 527 46 210 195 1 092 695 123 523 021 123 523 021
Liabilities of the segment 30 224 844 33 481 611 46 866 764 674 838 111 248 057 111 248 057
Other items of the segment
Expenditures incurred on fixed assets and intangible
assets157 002 8 922 185 493 4 427 355 844
Statement of
financial position
reconciliation/
income statement
reconciliation
for the period from 1 January to 31 December 2015
Corporates & Financial MarketsRetail Banking
(including Private
Banking)
OtherTotal figure for the
Group
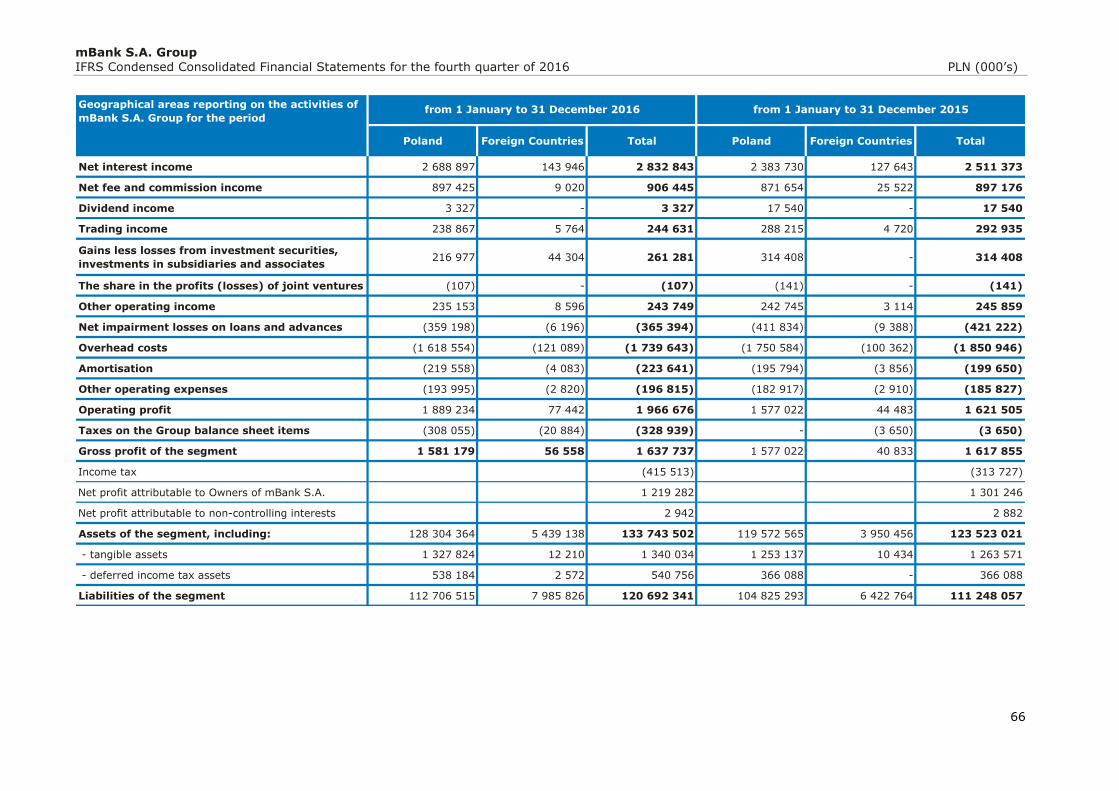
mBank S.A. Group IFRS Condensed Consolidated Financial Statements for the fourth quarter of 2016 PLN (000’s)
66
Poland Foreign Countries Total Poland Foreign Countries Total
Net interest income 2 688 897 143 946 2 832 843 2 383 730 127 643 2 511 373
Net fee and commission income 897 425 9 020 906 445 871 654 25 522 897 176
Dividend income 3 327 - 3 327 17 540 - 17 540
Trading income 238 867 5 764 244 631 288 215 4 720 292 935
Gains less losses from investment securities,
investments in subsidiaries and associates 216 977 44 304 261 281 314 408 - 314 408
The share in the profits (losses) of joint ventures (107) - (107) (141) - (141)
Other operating income 235 153 8 596 243 749 242 745 3 114 245 859
Net impairment losses on loans and advances (359 198) (6 196) (365 394) (411 834) (9 388) (421 222)
Overhead costs (1 618 554) (121 089) (1 739 643) (1 750 584) (100 362) (1 850 946)
Amortisation (219 558) (4 083) (223 641) (195 794) (3 856) (199 650)
Other operating expenses (193 995) (2 820) (196 815) (182 917) (2 910) (185 827)
Operating profit 1 889 234 77 442 1 966 676 1 577 022 44 483 1 621 505
Taxes on the Group balance sheet items (308 055) (20 884) (328 939) - (3 650) (3 650)
Gross profit of the segment 1 581 179 56 558 1 637 737 1 577 022 40 833 1 617 855
Income tax (415 513) (313 727)
Net profit attributable to Owners of mBank S.A. 1 219 282 1 301 246
Net profit attributable to non-controlling interests 2 942 2 882
Assets of the segment, including: 128 304 364 5 439 138 133 743 502 119 572 565 3 950 456 123 523 021
- tangible assets 1 327 824 12 210 1 340 034 1 253 137 10 434 1 263 571
- deferred income tax assets 538 184 2 572 540 756 366 088 - 366 088
Liabilities of the segment 112 706 515 7 985 826 120 692 341 104 825 293 6 422 764 111 248 057
Geographical areas reporting on the activities of
mBank S.A. Group for the period from 1 January to 31 December 2016 from 1 January to 31 December 2015
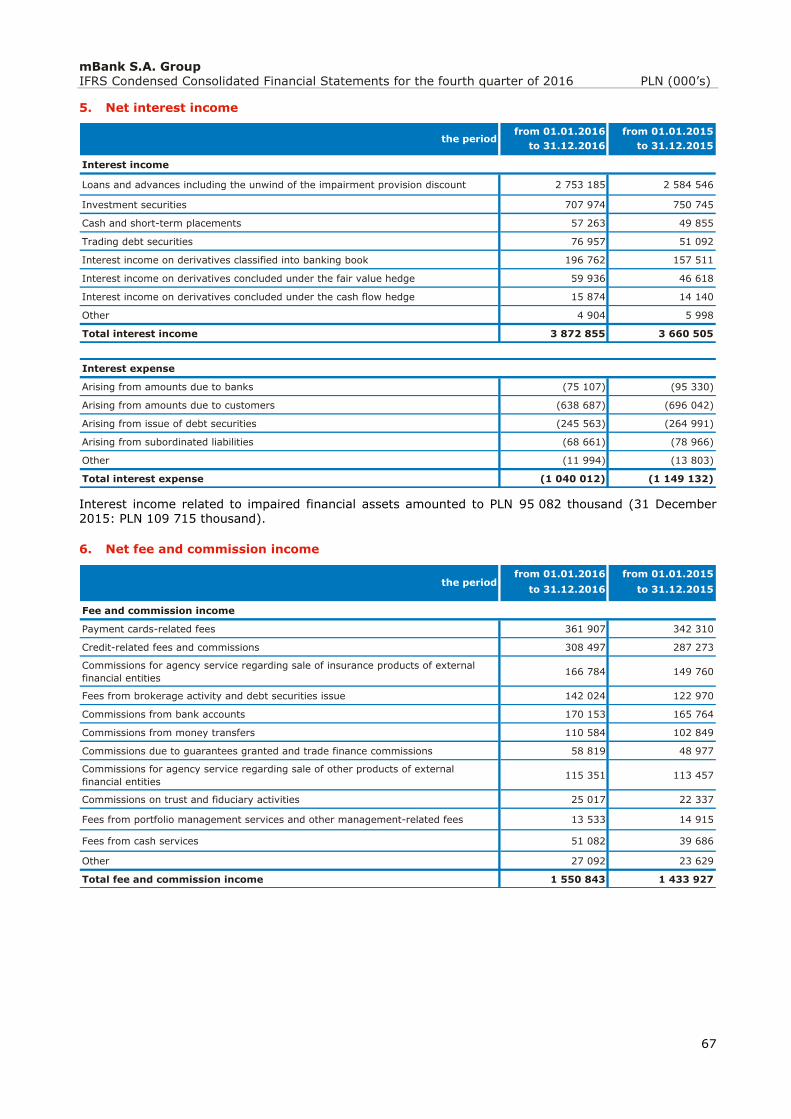
mBank S.A. Group IFRS Condensed Consolidated Financial Statements for the fourth quarter of 2016 PLN (000’s)
67
5. Net interest income
Interest income related to impaired financial assets amounted to PLN 95 082 thousand (31 December 2015: PLN 109 715 thousand).
6. Net fee and commission income
from 01.01.2016 from 01.01.2015
to 31.12.2016 to 31.12.2015
Interest income
Loans and advances including the unwind of the impairment provision discount 2 753 185 2 584 546
Investment securities 707 974 750 745
Cash and short-term placements 57 263 49 855
Trading debt securities 76 957 51 092
Interest income on derivatives classified into banking book 196 762 157 511
Interest income on derivatives concluded under the fair value hedge 59 936 46 618
Interest income on derivatives concluded under the cash flow hedge 15 874 14 140
Other 4 904 5 998
Total interest income 3 872 855 3 660 505
the period
Interest expense
Arising from amounts due to banks (75 107) (95 330)
Arising from amounts due to customers (638 687) (696 042)
Arising from issue of debt securities (245 563) (264 991)
Arising from subordinated liabilities (68 661) (78 966)
Other (11 994) (13 803)
Total interest expense (1 040 012) (1 149 132)
from 01.01.2016 from 01.01.2015
to 31.12.2016 to 31.12.2015
Fee and commission income
Payment cards-related fees 361 907 342 310
Credit-related fees and commissions 308 497 287 273
Commissions for agency service regarding sale of insurance products of external
financial entities166 784 149 760
Fees from brokerage activity and debt securities issue 142 024 122 970
Commissions from bank accounts 170 153 165 764
Commissions from money transfers 110 584 102 849
Commissions due to guarantees granted and trade finance commissions 58 819 48 977
Commissions for agency service regarding sale of other products of external
financial entities115 351 113 457
Commissions on trust and fiduciary activities 25 017 22 337
Fees from portfolio management services and other management-related fees 13 533 14 915
Fees from cash services 51 082 39 686
Other 27 092 23 629
Total fee and commission income 1 550 843 1 433 927
the period
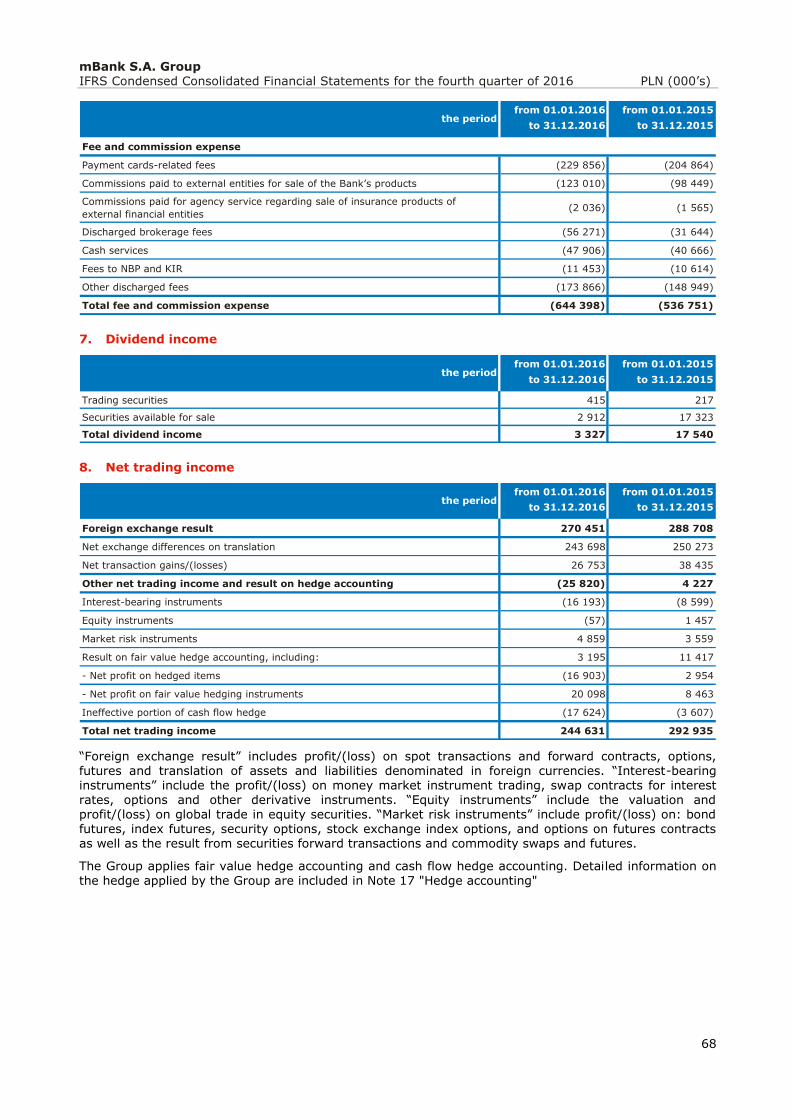
mBank S.A. Group IFRS Condensed Consolidated Financial Statements for the fourth quarter of 2016 PLN (000’s)
68
7. Dividend income
8. Net trading income
“Foreign exchange result” includes profit/(loss) on spot transactions and forward contracts, options, futures and translation of assets and liabilities denominated in foreign currencies. “Interest-bearing instruments” include the profit/(loss) on money market instrument trading, swap contracts for interest rates, options and other derivative instruments. “Equity instruments” include the valuation and profit/(loss) on global trade in equity securities. “Market risk instruments” include profit/(loss) on: bond futures, index futures, security options, stock exchange index options, and options on futures contracts as well as the result from securities forward transactions and commodity swaps and futures.
The Group applies fair value hedge accounting and cash flow hedge accounting. Detailed information on
the hedge applied by the Group are included in Note 17 "Hedge accounting"
from 01.01.2016 from 01.01.2015
to 31.12.2016 to 31.12.2015
Fee and commission expense
Payment cards-related fees (229 856) (204 864)
Commissions paid to external entities for sale of the Bank’s products (123 010) (98 449)
Commissions paid for agency service regarding sale of insurance products of
external financial entities(2 036) (1 565)
Discharged brokerage fees (56 271) (31 644)
Cash services (47 906) (40 666)
Fees to NBP and KIR (11 453) (10 614)
Other discharged fees (173 866) (148 949)
Total fee and commission expense (644 398) (536 751)
the period
from 01.01.2016 from 01.01.2015
to 31.12.2016 to 31.12.2015
Trading securities 415 217
Securities available for sale 2 912 17 323
Total dividend income 3 327 17 540
the period
from 01.01.2016 from 01.01.2015
to 31.12.2016 to 31.12.2015
Foreign exchange result 270 451 288 708
Net exchange differences on translation 243 698 250 273
Net transaction gains/(losses) 26 753 38 435
Other net trading income and result on hedge accounting (25 820) 4 227
Interest-bearing instruments (16 193) (8 599)
Equity instruments (57) 1 457
Market risk instruments 4 859 3 559
Result on fair value hedge accounting, including: 3 195 11 417
- Net profit on hedged items (16 903) 2 954
- Net profit on fair value hedging instruments 20 098 8 463
Ineffective portion of cash flow hedge (17 624) (3 607)
Total net trading income 244 631 292 935
the period
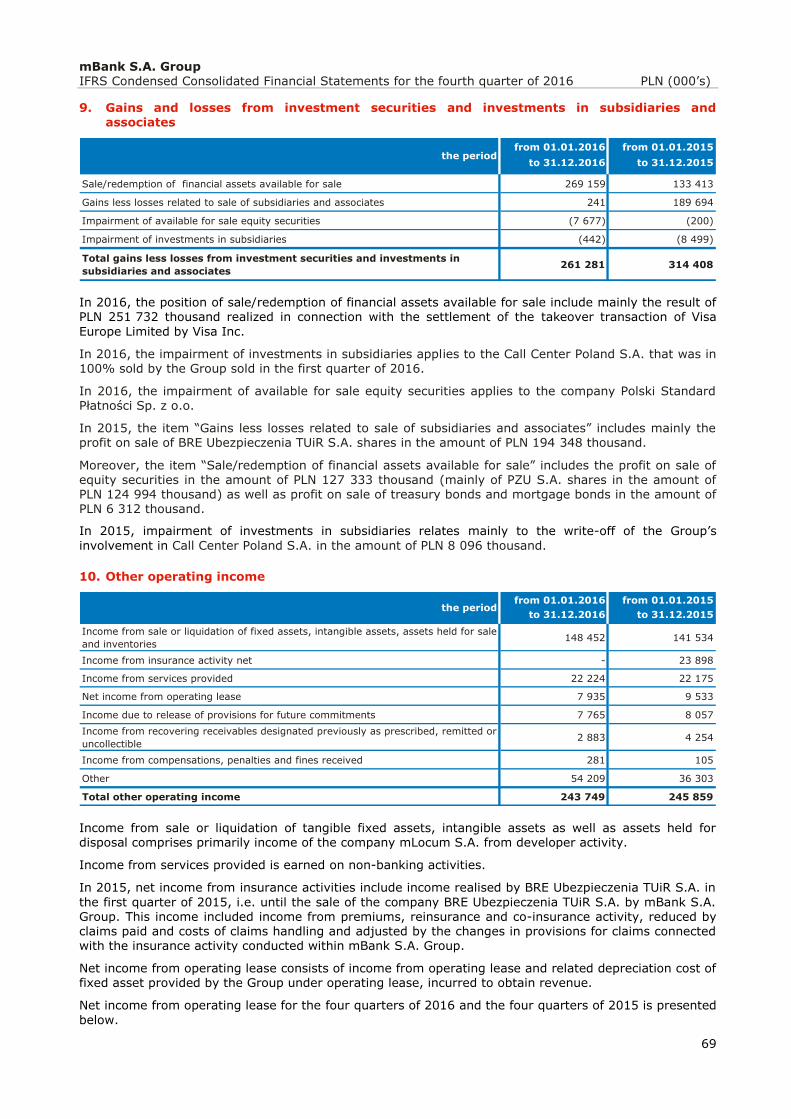
mBank S.A. Group IFRS Condensed Consolidated Financial Statements for the fourth quarter of 2016 PLN (000’s)
69
9. Gains and losses from investment securities and investments in subsidiaries and
associates
In 2016, the position of sale/redemption of financial assets available for sale include mainly the result of PLN 251 732 thousand realized in connection with the settlement of the takeover transaction of Visa
Europe Limited by Visa Inc.
In 2016, the impairment of investments in subsidiaries applies to the Call Center Poland S.A. that was in 100% sold by the Group sold in the first quarter of 2016.
In 2016, the impairment of available for sale equity securities applies to the company Polski Standard Płatności Sp. z o.o.
In 2015, the item “Gains less losses related to sale of subsidiaries and associates” includes mainly the profit on sale of BRE Ubezpieczenia TUiR S.A. shares in the amount of PLN 194 348 thousand.
Moreover, the item “Sale/redemption of financial assets available for sale” includes the profit on sale of equity securities in the amount of PLN 127 333 thousand (mainly of PZU S.A. shares in the amount of PLN 124 994 thousand) as well as profit on sale of treasury bonds and mortgage bonds in the amount of PLN 6 312 thousand.
In 2015, impairment of investments in subsidiaries relates mainly to the write-off of the Group’s
involvement in Call Center Poland S.A. in the amount of PLN 8 096 thousand.
10. Other operating income
Income from sale or liquidation of tangible fixed assets, intangible assets as well as assets held for disposal comprises primarily income of the company mLocum S.A. from developer activity.
Income from services provided is earned on non-banking activities.
In 2015, net income from insurance activities include income realised by BRE Ubezpieczenia TUiR S.A. in
the first quarter of 2015, i.e. until the sale of the company BRE Ubezpieczenia TUiR S.A. by mBank S.A. Group. This income included income from premiums, reinsurance and co-insurance activity, reduced by claims paid and costs of claims handling and adjusted by the changes in provisions for claims connected with the insurance activity conducted within mBank S.A. Group.
Net income from operating lease consists of income from operating lease and related depreciation cost of fixed asset provided by the Group under operating lease, incurred to obtain revenue.
Net income from operating lease for the four quarters of 2016 and the four quarters of 2015 is presented
below.
from 01.01.2016 from 01.01.2015
to 31.12.2016 to 31.12.2015
Sale/redemption of financial assets available for sale 269 159 133 413
Gains less losses related to sale of subsidiaries and associates 241 189 694
Impairment of available for sale equity securities (7 677) (200)
Impairment of investments in subsidiaries (442) (8 499)
Total gains less losses from investment securities and investments in
subsidiaries and associates261 281 314 408
the period
from 01.01.2016 from 01.01.2015
to 31.12.2016 to 31.12.2015
Income from sale or liquidation of fixed assets, intangible assets, assets held for sale
and inventories148 452 141 534
Income from insurance activity net - 23 898
Income from services provided 22 224 22 175
Net income from operating lease 7 935 9 533
Income due to release of provisions for future commitments 7 765 8 057
Income from recovering receivables designated previously as prescribed, remitted or
uncollectible2 883 4 254
Income from compensations, penalties and fines received 281 105
Other 54 209 36 303
Total other operating income 243 749 245 859
the period
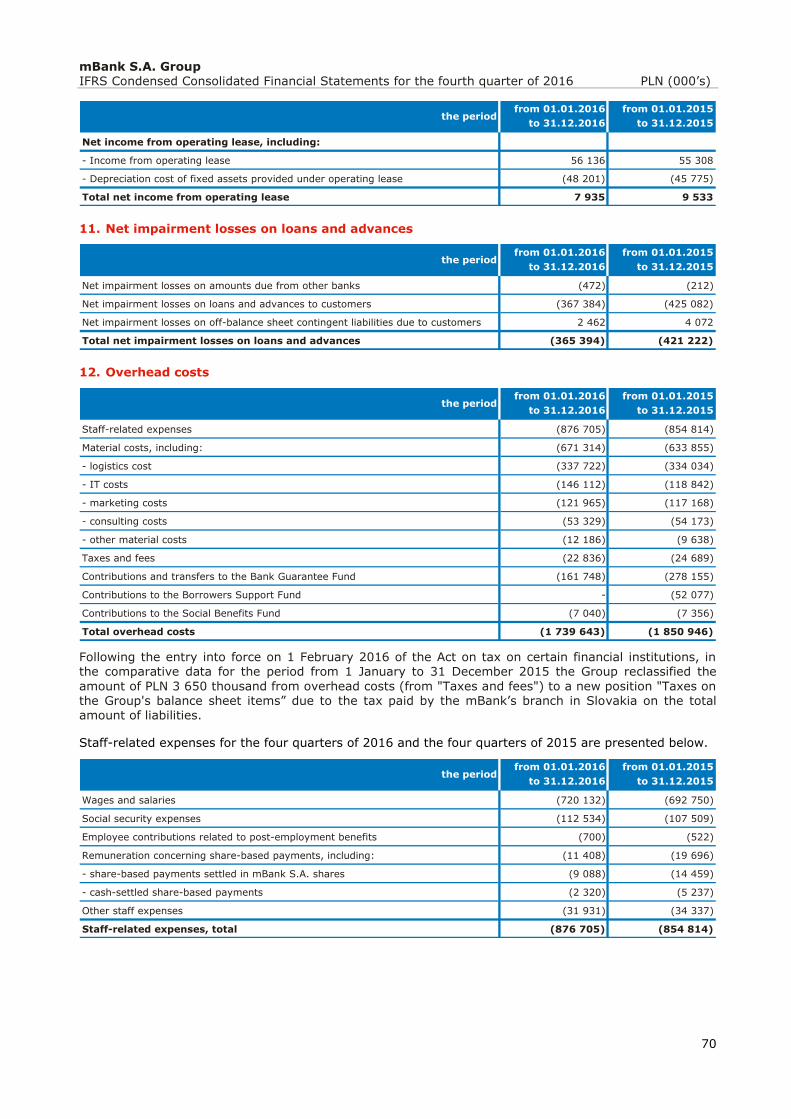
mBank S.A. Group IFRS Condensed Consolidated Financial Statements for the fourth quarter of 2016 PLN (000’s)
70
11. Net impairment losses on loans and advances
12. Overhead costs
Following the entry into force on 1 February 2016 of the Act on tax on certain financial institutions, in the comparative data for the period from 1 January to 31 December 2015 the Group reclassified the
amount of PLN 3 650 thousand from overhead costs (from "Taxes and fees") to a new position "Taxes on the Group's balance sheet items” due to the tax paid by the mBank’s branch in Slovakia on the total amount of liabilities.
Staff-related expenses for the four quarters of 2016 and the four quarters of 2015 are presented below.
from 01.01.2016 from 01.01.2015
to 31.12.2016 to 31.12.2015
Net income from operating lease, including:
- Income from operating lease 56 136 55 308
- Depreciation cost of fixed assets provided under operating lease (48 201) (45 775)
Total net income from operating lease 7 935 9 533
the period
from 01.01.2016 from 01.01.2015
to 31.12.2016 to 31.12.2015
Net impairment losses on amounts due from other banks (472) (212)
Net impairment losses on loans and advances to customers (367 384) (425 082)
Net impairment losses on off-balance sheet contingent liabilities due to customers 2 462 4 072
Total net impairment losses on loans and advances (365 394) (421 222)
the period
from 01.01.2016 from 01.01.2015
to 31.12.2016 to 31.12.2015
Staff-related expenses (876 705) (854 814)
Material costs, including: (671 314) (633 855)
- logistics cost (337 722) (334 034)
- IT costs (146 112) (118 842)
- marketing costs (121 965) (117 168)
- consulting costs (53 329) (54 173)
- other material costs (12 186) (9 638)
Taxes and fees (22 836) (24 689)
Contributions and transfers to the Bank Guarantee Fund (161 748) (278 155)
Contributions to the Borrowers Support Fund - (52 077)
Contributions to the Social Benefits Fund (7 040) (7 356)
Total overhead costs (1 739 643) (1 850 946)
the period
from 01.01.2016 from 01.01.2015
to 31.12.2016 to 31.12.2015
Wages and salaries (720 132) (692 750)
Social security expenses (112 534) (107 509)
Employee contributions related to post-employment benefits (700) (522)
Remuneration concerning share-based payments, including: (11 408) (19 696)
- share-based payments settled in mBank S.A. shares (9 088) (14 459)
- cash-settled share-based payments (2 320) (5 237)
Other staff expenses (31 931) (34 337)
Staff-related expenses, total (876 705) (854 814)
the period
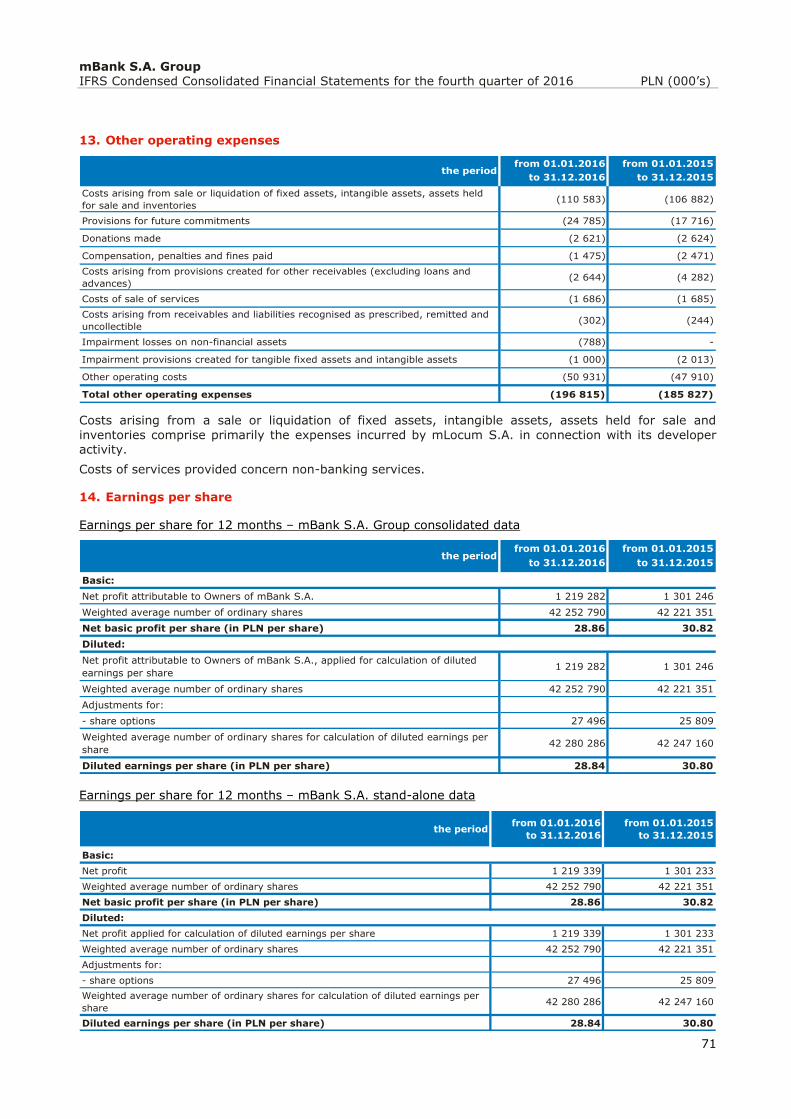
mBank S.A. Group IFRS Condensed Consolidated Financial Statements for the fourth quarter of 2016 PLN (000’s)
71
13. Other operating expenses
Costs arising from a sale or liquidation of fixed assets, intangible assets, assets held for sale and
inventories comprise primarily the expenses incurred by mLocum S.A. in connection with its developer activity.
Costs of services provided concern non-banking services.
14. Earnings per share
Earnings per share for 12 months – mBank S.A. Group consolidated data
Earnings per share for 12 months – mBank S.A. stand-alone data
from 01.01.2016 from 01.01.2015
to 31.12.2016 to 31.12.2015
Costs arising from sale or liquidation of fixed assets, intangible assets, assets held
for sale and inventories(110 583) (106 882)
Provisions for future commitments (24 785) (17 716)
Donations made (2 621) (2 624)
Compensation, penalties and fines paid (1 475) (2 471)
Costs arising from provisions created for other receivables (excluding loans and
advances)(2 644) (4 282)
Costs of sale of services (1 686) (1 685)
Costs arising from receivables and liabilities recognised as prescribed, remitted and
uncollectible(302) (244)
Impairment losses on non-financial assets (788) -
Impairment provisions created for tangible fixed assets and intangible assets (1 000) (2 013)
Other operating costs (50 931) (47 910)
Total other operating expenses (196 815) (185 827)
the period
from 01.01.2016 from 01.01.2015
to 31.12.2016 to 31.12.2015
Basic:
Net profit attributable to Owners of mBank S.A. 1 219 282 1 301 246
Weighted average number of ordinary shares 42 252 790 42 221 351
Net basic profit per share (in PLN per share) 28.86 30.82
Diluted:
Net profit attributable to Owners of mBank S.A., applied for calculation of diluted
earnings per share 1 219 282 1 301 246
Weighted average number of ordinary shares 42 252 790 42 221 351
Adjustments for:
- share options 27 496 25 809
Weighted average number of ordinary shares for calculation of diluted earnings per
share42 280 286 42 247 160
Diluted earnings per share (in PLN per share) 28.84 30.80
the period
the periodfrom 01.01.2016
to 31.12.2016
from 01.01.2015
to 31.12.2015
Basic:
Net profit 1 219 339 1 301 233
Weighted average number of ordinary shares 42 252 790 42 221 351
Net basic profit per share (in PLN per share) 28.86 30.82
Diluted:
Net profit applied for calculation of diluted earnings per share 1 219 339 1 301 233
Weighted average number of ordinary shares 42 252 790 42 221 351
Adjustments for:
- share options 27 496 25 809
Weighted average number of ordinary shares for calculation of diluted earnings per
share42 280 286 42 247 160
Diluted earnings per share (in PLN per share) 28.84 30.80
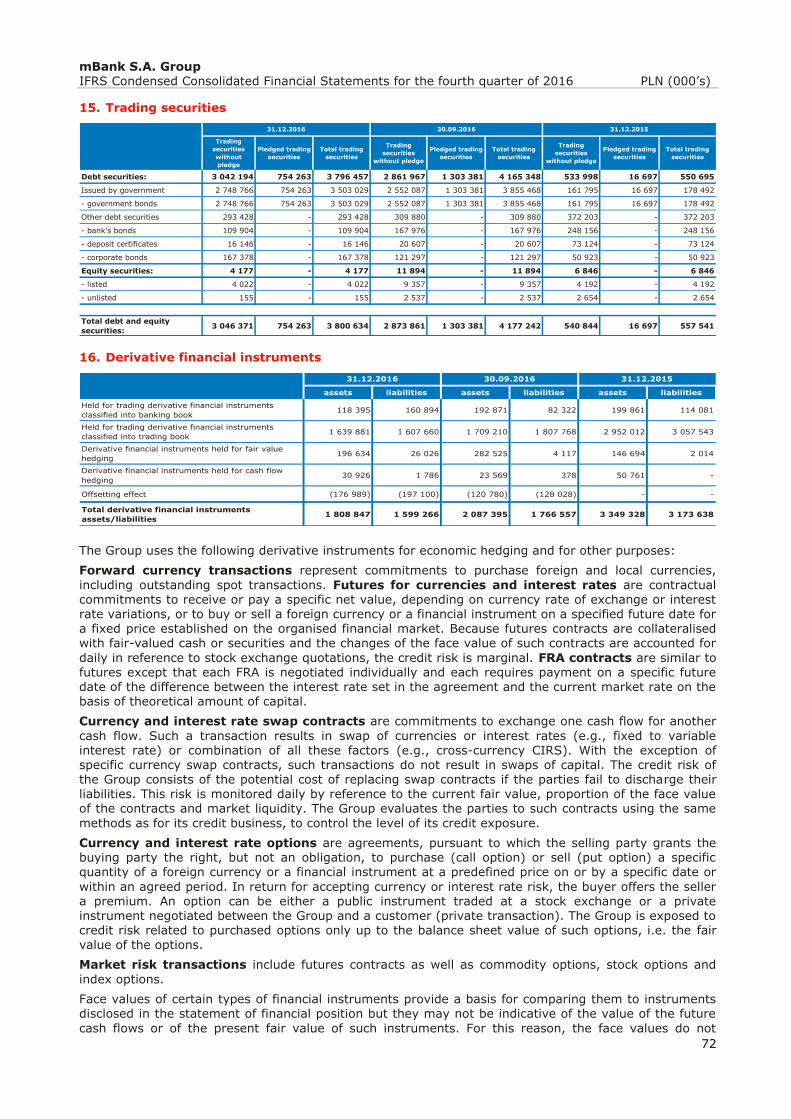
mBank S.A. Group IFRS Condensed Consolidated Financial Statements for the fourth quarter of 2016 PLN (000’s)
72
15. Trading securities
16. Derivative financial instruments
The Group uses the following derivative instruments for economic hedging and for other purposes:
Forward currency transactions represent commitments to purchase foreign and local currencies,
including outstanding spot transactions. Futures for currencies and interest rates are contractual commitments to receive or pay a specific net value, depending on currency rate of exchange or interest rate variations, or to buy or sell a foreign currency or a financial instrument on a specified future date for
a fixed price established on the organised financial market. Because futures contracts are collateralised with fair-valued cash or securities and the changes of the face value of such contracts are accounted for
daily in reference to stock exchange quotations, the credit risk is marginal. FRA contracts are similar to futures except that each FRA is negotiated individually and each requires payment on a specific future date of the difference between the interest rate set in the agreement and the current market rate on the basis of theoretical amount of capital.
Currency and interest rate swap contracts are commitments to exchange one cash flow for another
cash flow. Such a transaction results in swap of currencies or interest rates (e.g., fixed to variable interest rate) or combination of all these factors (e.g., cross-currency CIRS). With the exception of specific currency swap contracts, such transactions do not result in swaps of capital. The credit risk of the Group consists of the potential cost of replacing swap contracts if the parties fail to discharge their liabilities. This risk is monitored daily by reference to the current fair value, proportion of the face value of the contracts and market liquidity. The Group evaluates the parties to such contracts using the same
methods as for its credit business, to control the level of its credit exposure.
Currency and interest rate options are agreements, pursuant to which the selling party grants the buying party the right, but not an obligation, to purchase (call option) or sell (put option) a specific quantity of a foreign currency or a financial instrument at a predefined price on or by a specific date or
within an agreed period. In return for accepting currency or interest rate risk, the buyer offers the seller a premium. An option can be either a public instrument traded at a stock exchange or a private instrument negotiated between the Group and a customer (private transaction). The Group is exposed to credit risk related to purchased options only up to the balance sheet value of such options, i.e. the fair value of the options.
Market risk transactions include futures contracts as well as commodity options, stock options and
index options.
Face values of certain types of financial instruments provide a basis for comparing them to instruments disclosed in the statement of financial position but they may not be indicative of the value of the future
cash flows or of the present fair value of such instruments. For this reason, the face values do not
Trading
securities
without
pledge
Pledged trading
securities
Total trading
securities
Trading
securities
without pledge
Pledged trading
securities
Total trading
securities
Trading
securities
without pledge
Pledged trading
securities
Total trading
securities
Debt securities: 3 042 194 754 263 3 796 457 2 861 967 1 303 381 4 165 348 533 998 16 697 550 695
Issued by government 2 748 766 754 263 3 503 029 2 552 087 1 303 381 3 855 468 161 795 16 697 178 492
- government bonds 2 748 766 754 263 3 503 029 2 552 087 1 303 381 3 855 468 161 795 16 697 178 492
Other debt securities 293 428 - 293 428 309 880 - 309 880 372 203 - 372 203
- bank's bonds 109 904 - 109 904 167 976 - 167 976 248 156 - 248 156
- deposit certificates 16 146 - 16 146 20 607 - 20 607 73 124 - 73 124
- corporate bonds 167 378 - 167 378 121 297 - 121 297 50 923 - 50 923
Equity securities: 4 177 - 4 177 11 894 - 11 894 6 846 - 6 846
- listed 4 022 - 4 022 9 357 - 9 357 4 192 - 4 192
- unlisted 155 - 155 2 537 - 2 537 2 654 - 2 654
Total debt and equity
securities:3 046 371 754 263 3 800 634 2 873 861 1 303 381 4 177 242 540 844 16 697 557 541
31.12.2016 31.12.201530.09.2016
assets liabilities assets liabilities assets liabilities
Held for trading derivative financial instruments
classified into banking book118 395 160 894 192 871 82 322 199 861 114 081
Held for trading derivative financial instruments
classified into trading book1 639 881 1 607 660 1 709 210 1 807 768 2 952 012 3 057 543
Derivative financial instruments held for fair value
hedging196 634 26 026 282 525 4 117 146 694 2 014
Derivative financial instruments held for cash flow
hedging30 926 1 786 23 569 378 50 761 -
Offsetting effect (176 989) (197 100) (120 780) (128 028) - -
Total derivative financial instruments
assets/liabilities1 808 847 1 599 266 2 087 395 1 766 557 3 349 328 3 173 638
31.12.2016 30.09.2016 31.12.2015
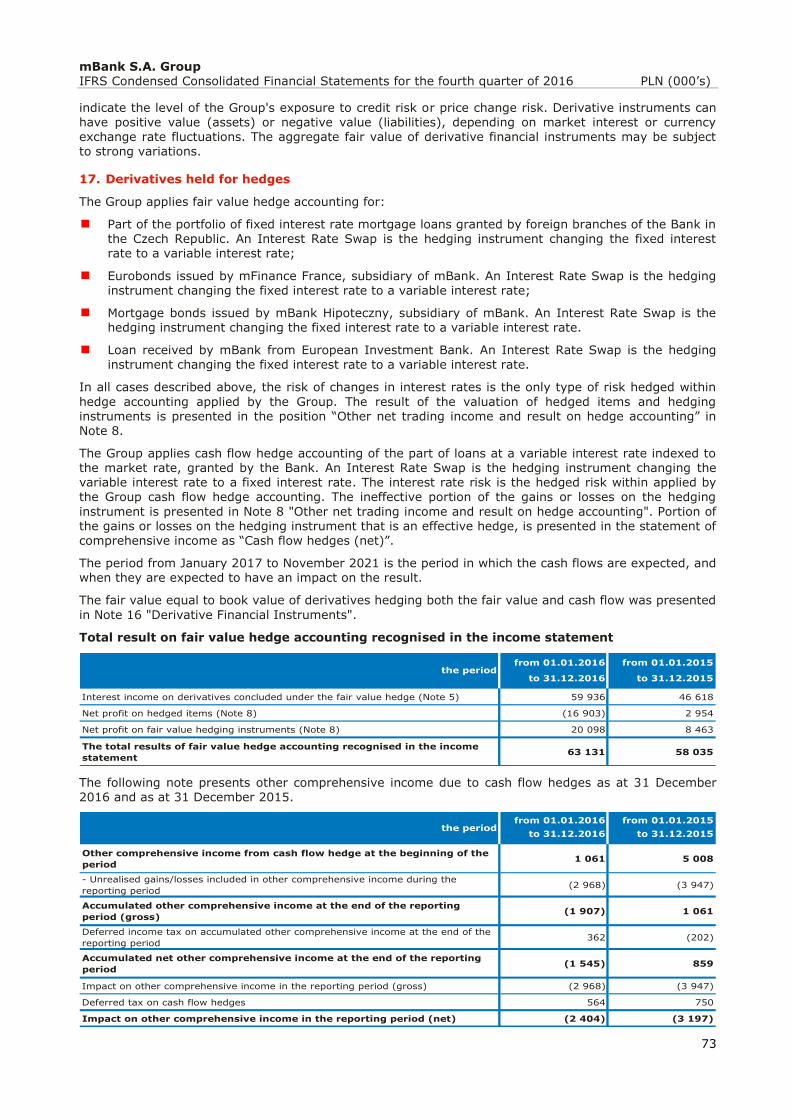
mBank S.A. Group IFRS Condensed Consolidated Financial Statements for the fourth quarter of 2016 PLN (000’s)
73
indicate the level of the Group's exposure to credit risk or price change risk. Derivative instruments can
have positive value (assets) or negative value (liabilities), depending on market interest or currency exchange rate fluctuations. The aggregate fair value of derivative financial instruments may be subject to strong variations.
17. Derivatives held for hedges
The Group applies fair value hedge accounting for:
Part of the portfolio of fixed interest rate mortgage loans granted by foreign branches of the Bank in the Czech Republic. An Interest Rate Swap is the hedging instrument changing the fixed interest rate to a variable interest rate;
Eurobonds issued by mFinance France, subsidiary of mBank. An Interest Rate Swap is the hedging instrument changing the fixed interest rate to a variable interest rate;
Mortgage bonds issued by mBank Hipoteczny, subsidiary of mBank. An Interest Rate Swap is the hedging instrument changing the fixed interest rate to a variable interest rate.
Loan received by mBank from European Investment Bank. An Interest Rate Swap is the hedging instrument changing the fixed interest rate to a variable interest rate.
In all cases described above, the risk of changes in interest rates is the only type of risk hedged within
hedge accounting applied by the Group. The result of the valuation of hedged items and hedging instruments is presented in the position “Other net trading income and result on hedge accounting” in Note 8.
The Group applies cash flow hedge accounting of the part of loans at a variable interest rate indexed to the market rate, granted by the Bank. An Interest Rate Swap is the hedging instrument changing the variable interest rate to a fixed interest rate. The interest rate risk is the hedged risk within applied by the Group cash flow hedge accounting. The ineffective portion of the gains or losses on the hedging
instrument is presented in Note 8 "Other net trading income and result on hedge accounting". Portion of the gains or losses on the hedging instrument that is an effective hedge, is presented in the statement of comprehensive income as “Cash flow hedges (net)”.
The period from January 2017 to November 2021 is the period in which the cash flows are expected, and when they are expected to have an impact on the result.
The fair value equal to book value of derivatives hedging both the fair value and cash flow was presented
in Note 16 "Derivative Financial Instruments".
Total result on fair value hedge accounting recognised in the income statement
The following note presents other comprehensive income due to cash flow hedges as at 31 December 2016 and as at 31 December 2015.
from 01.01.2016 from 01.01.2015
to 31.12.2016 to 31.12.2015
Interest income on derivatives concluded under the fair value hedge (Note 5) 59 936 46 618
Net profit on hedged items (Note 8) (16 903) 2 954
Net profit on fair value hedging instruments (Note 8) 20 098 8 463
The total results of fair value hedge accounting recognised in the income
statement 63 131 58 035
the period
from 01.01.2016 from 01.01.2015
to 31.12.2016 to 31.12.2015
Other comprehensive income from cash flow hedge at the beginning of the
period1 061 5 008
- Unrealised gains/losses included in other comprehensive income during the
reporting period(2 968) (3 947)
Accumulated other comprehensive income at the end of the reporting
period (gross)(1 907) 1 061
Deferred income tax on accumulated other comprehensive income at the end of the
reporting period362 (202)
Accumulated net other comprehensive income at the end of the reporting
period (1 545) 859
Impact on other comprehensive income in the reporting period (gross) (2 968) (3 947)
Deferred tax on cash flow hedges 564 750
Impact on other comprehensive income in the reporting period (net) (2 404) (3 197)
the period
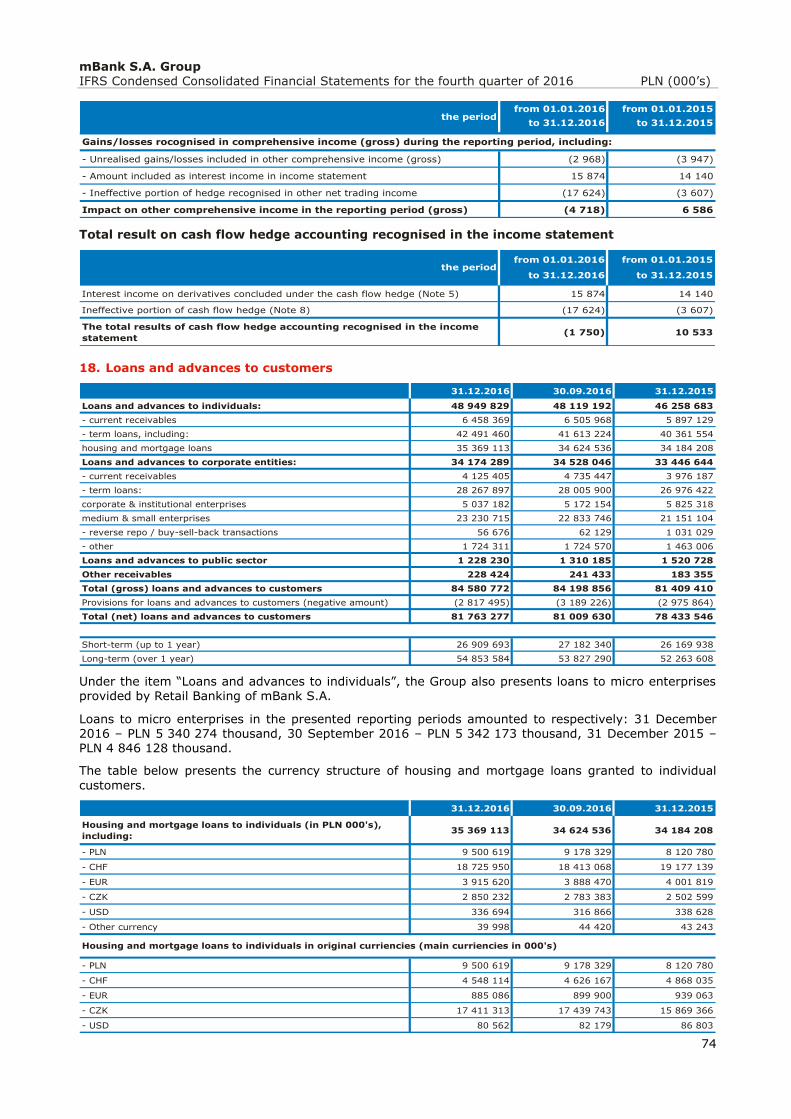
mBank S.A. Group IFRS Condensed Consolidated Financial Statements for the fourth quarter of 2016 PLN (000’s)
74
Total result on cash flow hedge accounting recognised in the income statement
18. Loans and advances to customers
Under the item “Loans and advances to individuals”, the Group also presents loans to micro enterprises provided by Retail Banking of mBank S.A.
Loans to micro enterprises in the presented reporting periods amounted to respectively: 31 December 2016 – PLN 5 340 274 thousand, 30 September 2016 – PLN 5 342 173 thousand, 31 December 2015 – PLN 4 846 128 thousand.
The table below presents the currency structure of housing and mortgage loans granted to individual
customers.
from 01.01.2016 from 01.01.2015
to 31.12.2016 to 31.12.2015
- Unrealised gains/losses included in other comprehensive income (gross) (2 968) (3 947)
- Amount included as interest income in income statement 15 874 14 140
- Ineffective portion of hedge recognised in other net trading income (17 624) (3 607)
Impact on other comprehensive income in the reporting period (gross) (4 718) 6 586
Gains/losses rocognised in comprehensive income (gross) during the reporting period, including:
the period
from 01.01.2016 from 01.01.2015
to 31.12.2016 to 31.12.2015
Interest income on derivatives concluded under the cash flow hedge (Note 5) 15 874 14 140
Ineffective portion of cash flow hedge (Note 8) (17 624) (3 607)
The total results of cash flow hedge accounting recognised in the income
statement(1 750) 10 533
the period
31.12.2016 30.09.2016 31.12.2015
Loans and advances to individuals: 48 949 829 48 119 192 46 258 683
- current receivables 6 458 369 6 505 968 5 897 129
- term loans, including: 42 491 460 41 613 224 40 361 554
housing and mortgage loans 35 369 113 34 624 536 34 184 208
Loans and advances to corporate entities: 34 174 289 34 528 046 33 446 644
- current receivables 4 125 405 4 735 447 3 976 187
- term loans: 28 267 897 28 005 900 26 976 422
corporate & institutional enterprises 5 037 182 5 172 154 5 825 318
medium & small enterprises 23 230 715 22 833 746 21 151 104
- reverse repo / buy-sell-back transactions 56 676 62 129 1 031 029
- other 1 724 311 1 724 570 1 463 006
Loans and advances to public sector 1 228 230 1 310 185 1 520 728
Other receivables 228 424 241 433 183 355
Total (gross) loans and advances to customers 84 580 772 84 198 856 81 409 410
Provisions for loans and advances to customers (negative amount) (2 817 495) (3 189 226) (2 975 864)
Total (net) loans and advances to customers 81 763 277 81 009 630 78 433 546
Short-term (up to 1 year) 26 909 693 27 182 340 26 169 938
Long-term (over 1 year) 54 853 584 53 827 290 52 263 608
31.12.2016 30.09.2016 31.12.2015
Housing and mortgage loans to individuals (in PLN 000's),
including:35 369 113 34 624 536 34 184 208
- PLN 9 500 619 9 178 329 8 120 780
- CHF 18 725 950 18 413 068 19 177 139
- EUR 3 915 620 3 888 470 4 001 819
- CZK 2 850 232 2 783 383 2 502 599
- USD 336 694 316 866 338 628
- Other currency 39 998 44 420 43 243
- PLN 9 500 619 9 178 329 8 120 780
- CHF 4 548 114 4 626 167 4 868 035
- EUR 885 086 899 900 939 063
- CZK 17 411 313 17 439 743 15 869 366
- USD 80 562 82 179 86 803
Housing and mortgage loans to individuals in original curriencies (main curriencies in 000's)
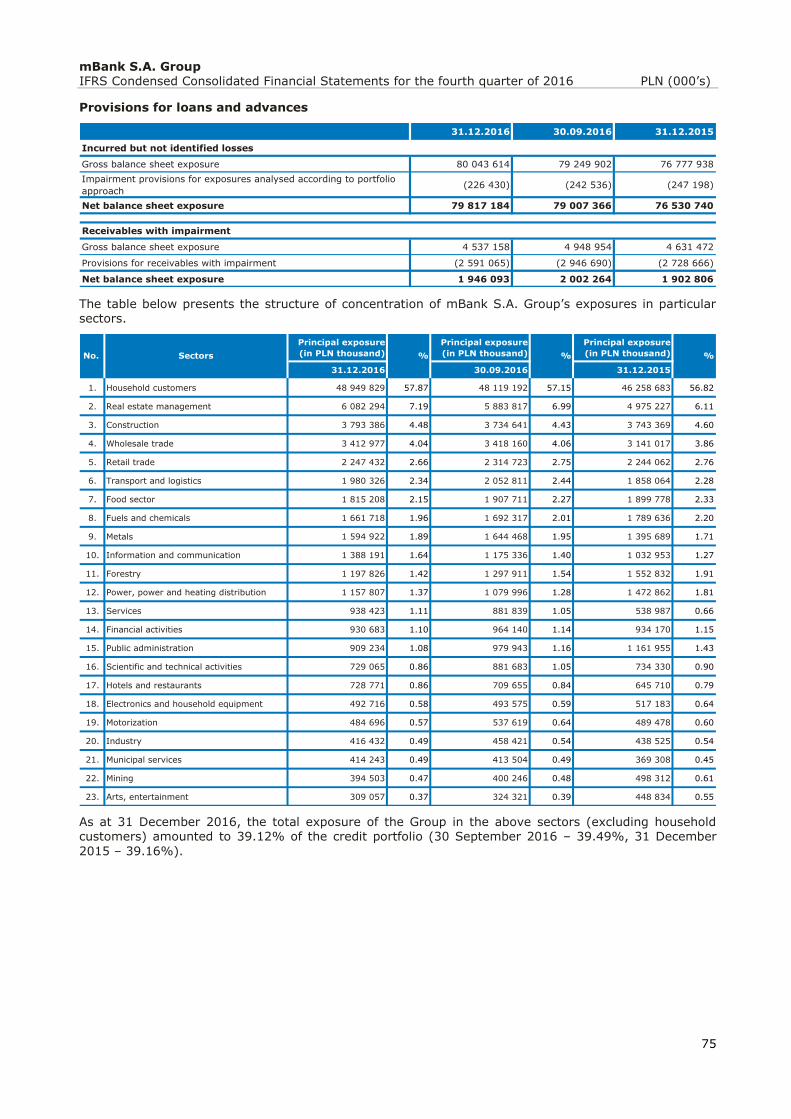
mBank S.A. Group IFRS Condensed Consolidated Financial Statements for the fourth quarter of 2016 PLN (000’s)
75
Provisions for loans and advances
The table below presents the structure of concentration of mBank S.A. Group’s exposures in particular sectors.
As at 31 December 2016, the total exposure of the Group in the above sectors (excluding household customers) amounted to 39.12% of the credit portfolio (30 September 2016 – 39.49%, 31 December
2015 – 39.16%).
31.12.2016 30.09.2016 31.12.2015
Incurred but not identified losses
Gross balance sheet exposure 80 043 614 79 249 902 76 777 938
Impairment provisions for exposures analysed according to portfolio
approach(226 430) (242 536) (247 198)
Net balance sheet exposure 79 817 184 79 007 366 76 530 740
Receivables with impairment
Gross balance sheet exposure 4 537 158 4 948 954 4 631 472
Provisions for receivables with impairment (2 591 065) (2 946 690) (2 728 666)
Net balance sheet exposure 1 946 093 2 002 264 1 902 806
Principal exposure
(in PLN thousand)
Principal exposure
(in PLN thousand)
Principal exposure
(in PLN thousand)
31.12.2016 30.09.2016 31.12.2015
1. Household customers 48 949 829 57.87 48 119 192 57.15 46 258 683 56.82
2. Real estate management 6 082 294 7.19 5 883 817 6.99 4 975 227 6.11
3. Construction 3 793 386 4.48 3 734 641 4.43 3 743 369 4.60
4. Wholesale trade 3 412 977 4.04 3 418 160 4.06 3 141 017 3.86
5. Retail trade 2 247 432 2.66 2 314 723 2.75 2 244 062 2.76
6. Transport and logistics 1 980 326 2.34 2 052 811 2.44 1 858 064 2.28
7. Food sector 1 815 208 2.15 1 907 711 2.27 1 899 778 2.33
8. Fuels and chemicals 1 661 718 1.96 1 692 317 2.01 1 789 636 2.20
9. Metals 1 594 922 1.89 1 644 468 1.95 1 395 689 1.71
10. Information and communication 1 388 191 1.64 1 175 336 1.40 1 032 953 1.27
11. Forestry 1 197 826 1.42 1 297 911 1.54 1 552 832 1.91
12. Power, power and heating distribution 1 157 807 1.37 1 079 996 1.28 1 472 862 1.81
13. Services 938 423 1.11 881 839 1.05 538 987 0.66
14. Financial activities 930 683 1.10 964 140 1.14 934 170 1.15
15. Public administration 909 234 1.08 979 943 1.16 1 161 955 1.43
16. Scientific and technical activities 729 065 0.86 881 683 1.05 734 330 0.90
17. Hotels and restaurants 728 771 0.86 709 655 0.84 645 710 0.79
18. Electronics and household equipment 492 716 0.58 493 575 0.59 517 183 0.64
19. Motorization 484 696 0.57 537 619 0.64 489 478 0.60
20. Industry 416 432 0.49 458 421 0.54 438 525 0.54
21. Municipal services 414 243 0.49 413 504 0.49 369 308 0.45
22. Mining 394 503 0.47 400 246 0.48 498 312 0.61
23. Arts, entertainment 309 057 0.37 324 321 0.39 448 834 0.55
No. Sectors % % %
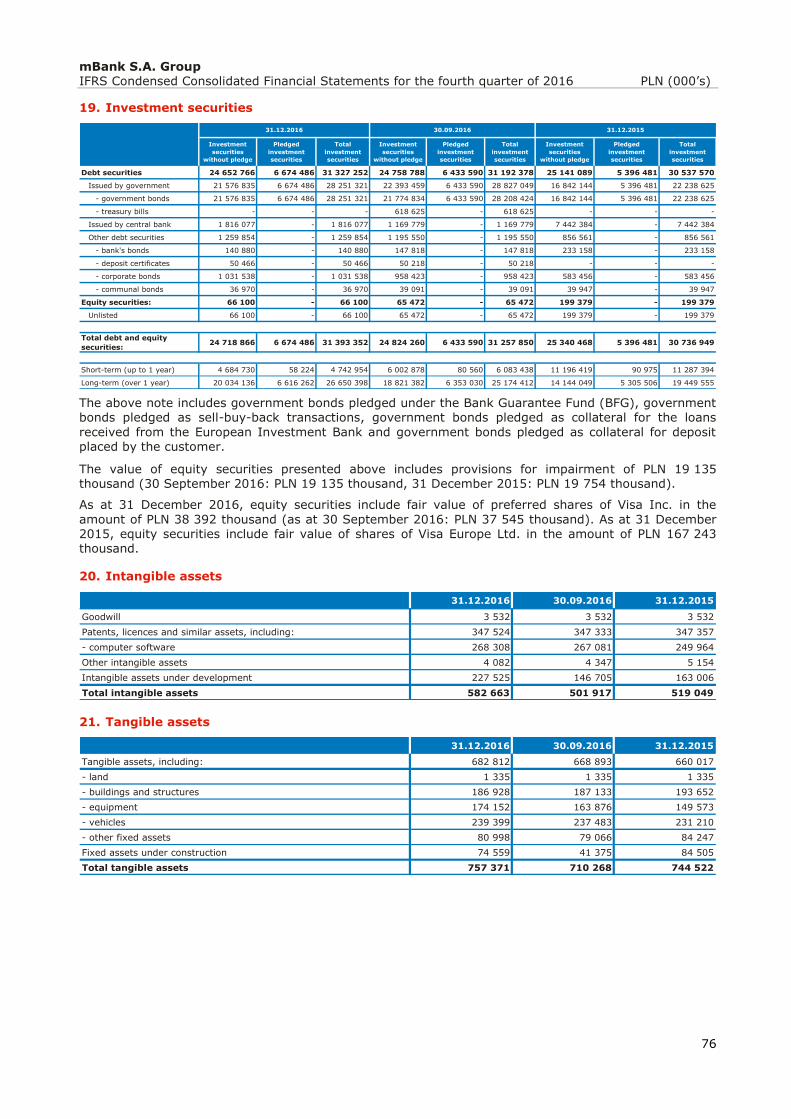
mBank S.A. Group IFRS Condensed Consolidated Financial Statements for the fourth quarter of 2016 PLN (000’s)
76
19. Investment securities
The above note includes government bonds pledged under the Bank Guarantee Fund (BFG), government bonds pledged as sell-buy-back transactions, government bonds pledged as collateral for the loans
received from the European Investment Bank and government bonds pledged as collateral for deposit placed by the customer.
The value of equity securities presented above includes provisions for impairment of PLN 19 135 thousand (30 September 2016: PLN 19 135 thousand, 31 December 2015: PLN 19 754 thousand).
As at 31 December 2016, equity securities include fair value of preferred shares of Visa Inc. in the
amount of PLN 38 392 thousand (as at 30 September 2016: PLN 37 545 thousand). As at 31 December 2015, equity securities include fair value of shares of Visa Europe Ltd. in the amount of PLN 167 243 thousand.
20. Intangible assets
21. Tangible assets
Investment
securities
without pledge
Pledged
investment
securities
Total
investment
securities
Investment
securities
without pledge
Pledged
investment
securities
Total
investment
securities
Investment
securities
without pledge
Pledged
investment
securities
Total
investment
securities
Debt securities 24 652 766 6 674 486 31 327 252 24 758 788 6 433 590 31 192 378 25 141 089 5 396 481 30 537 570
Issued by government 21 576 835 6 674 486 28 251 321 22 393 459 6 433 590 28 827 049 16 842 144 5 396 481 22 238 625
- government bonds 21 576 835 6 674 486 28 251 321 21 774 834 6 433 590 28 208 424 16 842 144 5 396 481 22 238 625
- treasury bills - - - 618 625 - 618 625 - - -
Issued by central bank 1 816 077 - 1 816 077 1 169 779 - 1 169 779 7 442 384 - 7 442 384
Other debt securities 1 259 854 - 1 259 854 1 195 550 - 1 195 550 856 561 - 856 561
- bank's bonds 140 880 - 140 880 147 818 - 147 818 233 158 - 233 158
- deposit certificates 50 466 - 50 466 50 218 - 50 218 - - -
- corporate bonds 1 031 538 - 1 031 538 958 423 - 958 423 583 456 - 583 456
- communal bonds 36 970 - 36 970 39 091 - 39 091 39 947 - 39 947
Equity securities: 66 100 - 66 100 65 472 - 65 472 199 379 - 199 379
Unlisted 66 100 - 66 100 65 472 - 65 472 199 379 - 199 379
Total debt and equity
securities:24 718 866 6 674 486 31 393 352 24 824 260 6 433 590 31 257 850 25 340 468 5 396 481 30 736 949
Short-term (up to 1 year) 4 684 730 58 224 4 742 954 6 002 878 80 560 6 083 438 11 196 419 90 975 11 287 394
Long-term (over 1 year) 20 034 136 6 616 262 26 650 398 18 821 382 6 353 030 25 174 412 14 144 049 5 305 506 19 449 555
31.12.2016 31.12.201530.09.2016
31.12.2016 30.09.2016 31.12.2015
Goodwill 3 532 3 532 3 532
Patents, licences and similar assets, including: 347 524 347 333 347 357
- computer software 268 308 267 081 249 964
Other intangible assets 4 082 4 347 5 154
Intangible assets under development 227 525 146 705 163 006
Total intangible assets 582 663 501 917 519 049
31.12.2016 30.09.2016 31.12.2015
Tangible assets, including: 682 812 668 893 660 017
- land 1 335 1 335 1 335
- buildings and structures 186 928 187 133 193 652
- equipment 174 152 163 876 149 573
- vehicles 239 399 237 483 231 210
- other fixed assets 80 998 79 066 84 247
Fixed assets under construction 74 559 41 375 84 505
Total tangible assets 757 371 710 268 744 522
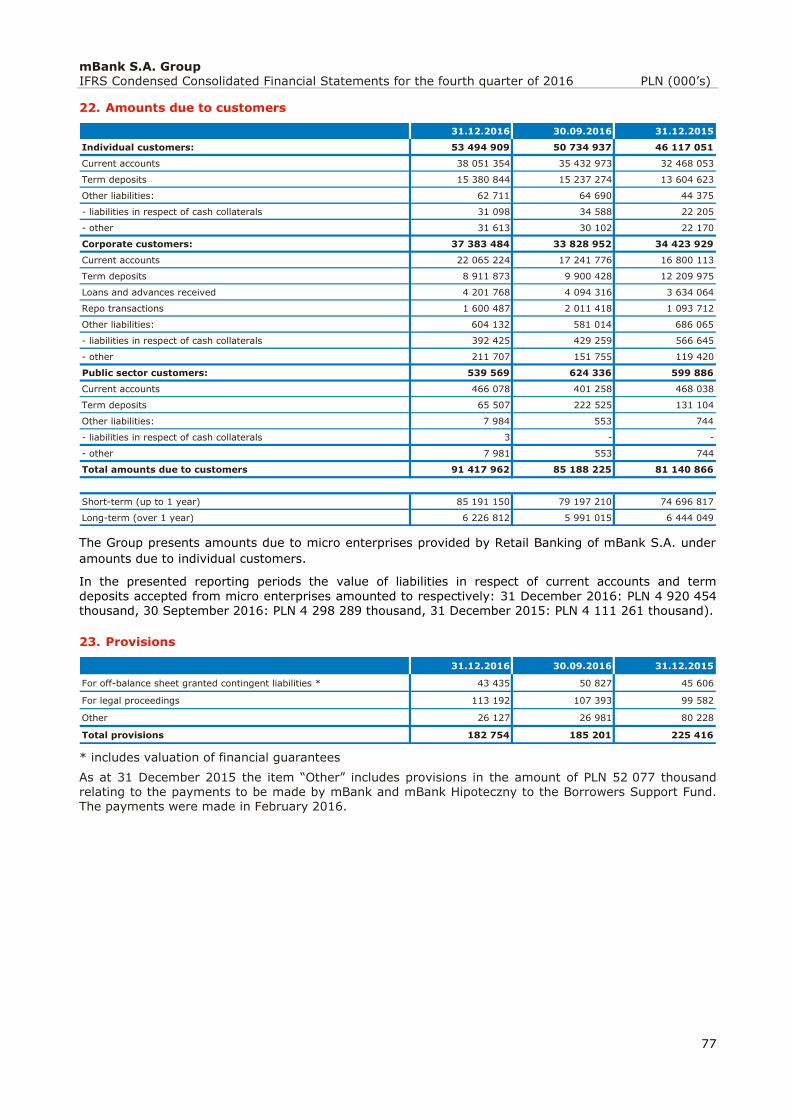
mBank S.A. Group IFRS Condensed Consolidated Financial Statements for the fourth quarter of 2016 PLN (000’s)
77
22. Amounts due to customers
The Group presents amounts due to micro enterprises provided by Retail Banking of mBank S.A. under
amounts due to individual customers.
In the presented reporting periods the value of liabilities in respect of current accounts and term
deposits accepted from micro enterprises amounted to respectively: 31 December 2016: PLN 4 920 454 thousand, 30 September 2016: PLN 4 298 289 thousand, 31 December 2015: PLN 4 111 261 thousand).
23. Provisions
* includes valuation of financial guarantees
As at 31 December 2015 the item “Other” includes provisions in the amount of PLN 52 077 thousand relating to the payments to be made by mBank and mBank Hipoteczny to the Borrowers Support Fund. The payments were made in February 2016.
31.12.2016 30.09.2016 31.12.2015
Individual customers: 53 494 909 50 734 937 46 117 051
Current accounts 38 051 354 35 432 973 32 468 053
Term deposits 15 380 844 15 237 274 13 604 623
Other liabilities: 62 711 64 690 44 375
- liabilities in respect of cash collaterals 31 098 34 588 22 205
- other 31 613 30 102 22 170
Corporate customers: 37 383 484 33 828 952 34 423 929
Current accounts 22 065 224 17 241 776 16 800 113
Term deposits 8 911 873 9 900 428 12 209 975
Loans and advances received 4 201 768 4 094 316 3 634 064
Repo transactions 1 600 487 2 011 418 1 093 712
Other liabilities: 604 132 581 014 686 065
- liabilities in respect of cash collaterals 392 425 429 259 566 645
- other 211 707 151 755 119 420
Public sector customers: 539 569 624 336 599 886
Current accounts 466 078 401 258 468 038
Term deposits 65 507 222 525 131 104
Other liabilities: 7 984 553 744
- liabilities in respect of cash collaterals 3 - -
- other 7 981 553 744
Total amounts due to customers 91 417 962 85 188 225 81 140 866
Short-term (up to 1 year) 85 191 150 79 197 210 74 696 817
Long-term (over 1 year) 6 226 812 5 991 015 6 444 049
31.12.2016 30.09.2016 31.12.2015
For off-balance sheet granted contingent liabilities * 43 435 50 827 45 606
For legal proceedings 113 192 107 393 99 582
Other 26 127 26 981 80 228
Total provisions 182 754 185 201 225 416
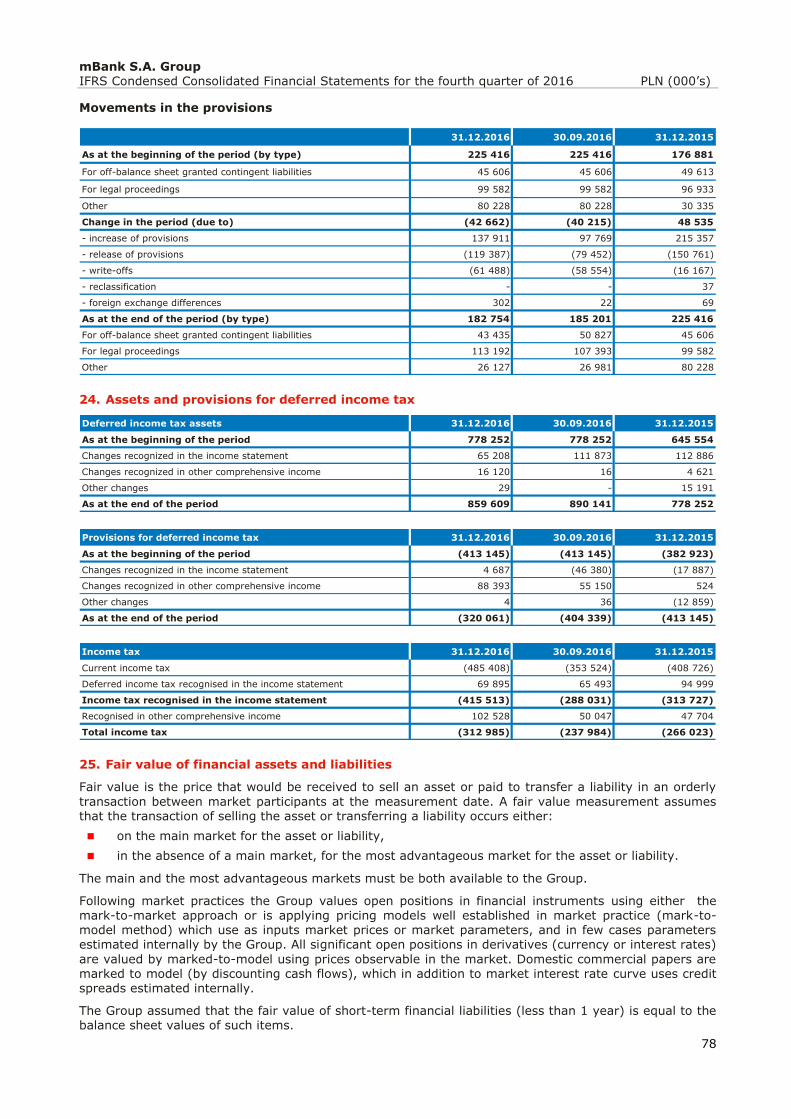
mBank S.A. Group IFRS Condensed Consolidated Financial Statements for the fourth quarter of 2016 PLN (000’s)
78
Movements in the provisions
24. Assets and provisions for deferred income tax
25. Fair value of financial assets and liabilities
Fair value is the price that would be received to sell an asset or paid to transfer a liability in an orderly
transaction between market participants at the measurement date. A fair value measurement assumes that the transaction of selling the asset or transferring a liability occurs either:
on the main market for the asset or liability,
in the absence of a main market, for the most advantageous market for the asset or liability.
The main and the most advantageous markets must be both available to the Group.
Following market practices the Group values open positions in financial instruments using either the mark-to-market approach or is applying pricing models well established in market practice (mark-to-model method) which use as inputs market prices or market parameters, and in few cases parameters estimated internally by the Group. All significant open positions in derivatives (currency or interest rates)
are valued by marked-to-model using prices observable in the market. Domestic commercial papers are marked to model (by discounting cash flows), which in addition to market interest rate curve uses credit spreads estimated internally.
The Group assumed that the fair value of short-term financial liabilities (less than 1 year) is equal to the balance sheet values of such items.
31.12.2016 30.09.2016 31.12.2015
As at the beginning of the period (by type) 225 416 225 416 176 881
For off-balance sheet granted contingent liabilities 45 606 45 606 49 613
For legal proceedings 99 582 99 582 96 933
Other 80 228 80 228 30 335
Change in the period (due to) (42 662) (40 215) 48 535
- increase of provisions 137 911 97 769 215 357
- release of provisions (119 387) (79 452) (150 761)
- write-offs (61 488) (58 554) (16 167)
- reclassification - - 37
- foreign exchange differences 302 22 69
As at the end of the period (by type) 182 754 185 201 225 416
For off-balance sheet granted contingent liabilities 43 435 50 827 45 606
For legal proceedings 113 192 107 393 99 582
Other 26 127 26 981 80 228
Deferred income tax assets 31.12.2016 30.09.2016 31.12.2015
As at the beginning of the period 778 252 778 252 645 554
Changes recognized in the income statement 65 208 111 873 112 886
Changes recognized in other comprehensive income 16 120 16 4 621
Other changes 29 - 15 191
As at the end of the period 859 609 890 141 778 252
Provisions for deferred income tax 31.12.2016 30.09.2016 31.12.2015
As at the beginning of the period (413 145) (413 145) (382 923)
Changes recognized in the income statement 4 687 (46 380) (17 887)
Changes recognized in other comprehensive income 88 393 55 150 524
Other changes 4 36 (12 859)
As at the end of the period (320 061) (404 339) (413 145)
Income tax 31.12.2016 30.09.2016 31.12.2015
Current income tax (485 408) (353 524) (408 726)
Deferred income tax recognised in the income statement 69 895 65 493 94 999
Income tax recognised in the income statement (415 513) (288 031) (313 727)
Recognised in other comprehensive income 102 528 50 047 47 704
Total income tax (312 985) (237 984) (266 023)
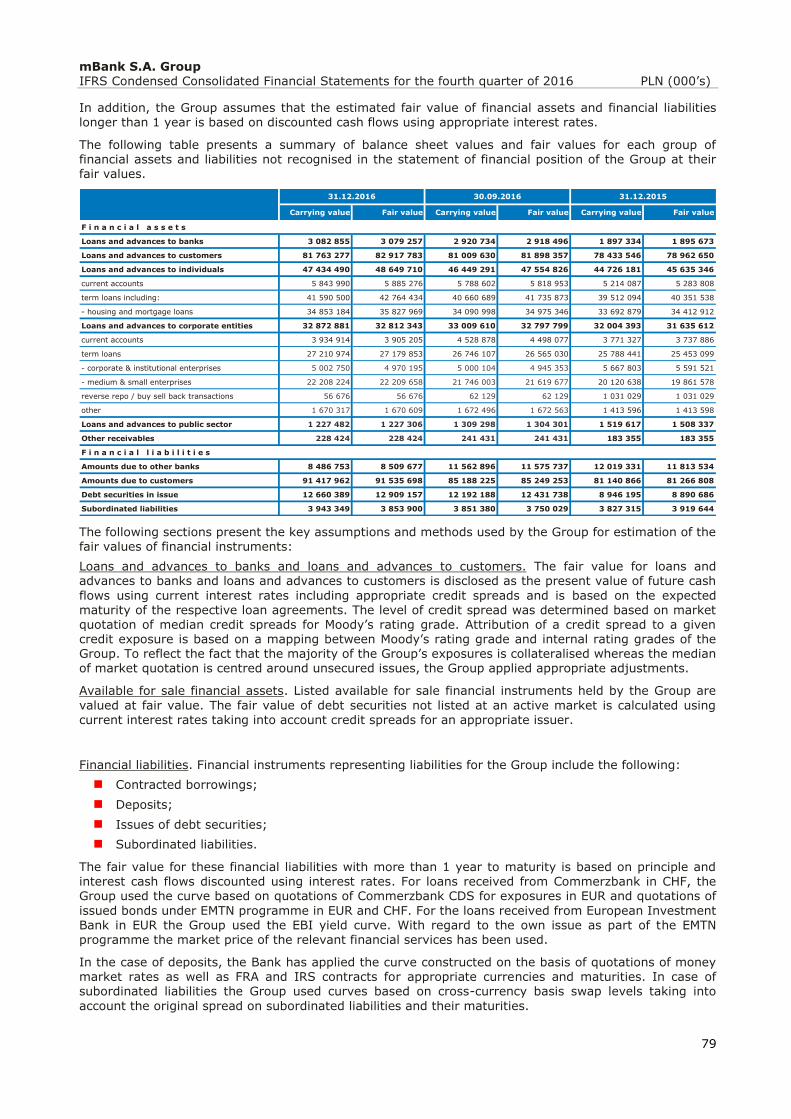
mBank S.A. Group IFRS Condensed Consolidated Financial Statements for the fourth quarter of 2016 PLN (000’s)
79
In addition, the Group assumes that the estimated fair value of financial assets and financial liabilities
longer than 1 year is based on discounted cash flows using appropriate interest rates.
The following table presents a summary of balance sheet values and fair values for each group of financial assets and liabilities not recognised in the statement of financial position of the Group at their fair values.
The following sections present the key assumptions and methods used by the Group for estimation of the fair values of financial instruments:
Loans and advances to banks and loans and advances to customers. The fair value for loans and advances to banks and loans and advances to customers is disclosed as the present value of future cash
flows using current interest rates including appropriate credit spreads and is based on the expected maturity of the respective loan agreements. The level of credit spread was determined based on market
quotation of median credit spreads for Moody’s rating grade. Attribution of a credit spread to a given credit exposure is based on a mapping between Moody’s rating grade and internal rating grades of the Group. To reflect the fact that the majority of the Group’s exposures is collateralised whereas the median of market quotation is centred around unsecured issues, the Group applied appropriate adjustments.
Available for sale financial assets. Listed available for sale financial instruments held by the Group are
valued at fair value. The fair value of debt securities not listed at an active market is calculated using current interest rates taking into account credit spreads for an appropriate issuer.
Financial liabilities. Financial instruments representing liabilities for the Group include the following:
Contracted borrowings;
Deposits;
Issues of debt securities;
Subordinated liabilities.
The fair value for these financial liabilities with more than 1 year to maturity is based on principle and
interest cash flows discounted using interest rates. For loans received from Commerzbank in CHF, the Group used the curve based on quotations of Commerzbank CDS for exposures in EUR and quotations of
issued bonds under EMTN programme in EUR and CHF. For the loans received from European Investment Bank in EUR the Group used the EBI yield curve. With regard to the own issue as part of the EMTN programme the market price of the relevant financial services has been used.
In the case of deposits, the Bank has applied the curve constructed on the basis of quotations of money market rates as well as FRA and IRS contracts for appropriate currencies and maturities. In case of subordinated liabilities the Group used curves based on cross-currency basis swap levels taking into
account the original spread on subordinated liabilities and their maturities.
Carrying value Fair value Carrying value Fair value Carrying value Fair value
F i n a n c i a l a s s e t s
Loans and advances to banks 3 082 855 3 079 257 2 920 734 2 918 496 1 897 334 1 895 673
Loans and advances to customers 81 763 277 82 917 783 81 009 630 81 898 357 78 433 546 78 962 650
Loans and advances to individuals 47 434 490 48 649 710 46 449 291 47 554 826 44 726 181 45 635 346
current accounts 5 843 990 5 885 276 5 788 602 5 818 953 5 214 087 5 283 808
term loans including: 41 590 500 42 764 434 40 660 689 41 735 873 39 512 094 40 351 538
- housing and mortgage loans 34 853 184 35 827 969 34 090 998 34 975 346 33 692 879 34 412 912
Loans and advances to corporate entities 32 872 881 32 812 343 33 009 610 32 797 799 32 004 393 31 635 612
current accounts 3 934 914 3 905 205 4 528 878 4 498 077 3 771 327 3 737 886
term loans 27 210 974 27 179 853 26 746 107 26 565 030 25 788 441 25 453 099
- corporate & institutional enterprises 5 002 750 4 970 195 5 000 104 4 945 353 5 667 803 5 591 521
- medium & small enterprises 22 208 224 22 209 658 21 746 003 21 619 677 20 120 638 19 861 578
reverse repo / buy sell back transactions 56 676 56 676 62 129 62 129 1 031 029 1 031 029
other 1 670 317 1 670 609 1 672 496 1 672 563 1 413 596 1 413 598
Loans and advances to public sector 1 227 482 1 227 306 1 309 298 1 304 301 1 519 617 1 508 337
Other receivables 228 424 228 424 241 431 241 431 183 355 183 355
F i n a n c i a l l i a b i l i t i e s
Amounts due to other banks 8 486 753 8 509 677 11 562 896 11 575 737 12 019 331 11 813 534
Amounts due to customers 91 417 962 91 535 698 85 188 225 85 249 253 81 140 866 81 266 808
Debt securities in issue 12 660 389 12 909 157 12 192 188 12 431 738 8 946 195 8 890 686
Subordinated liabilities 3 943 349 3 853 900 3 851 380 3 750 029 3 827 315 3 919 644
31.12.2016 31.12.201530.09.2016
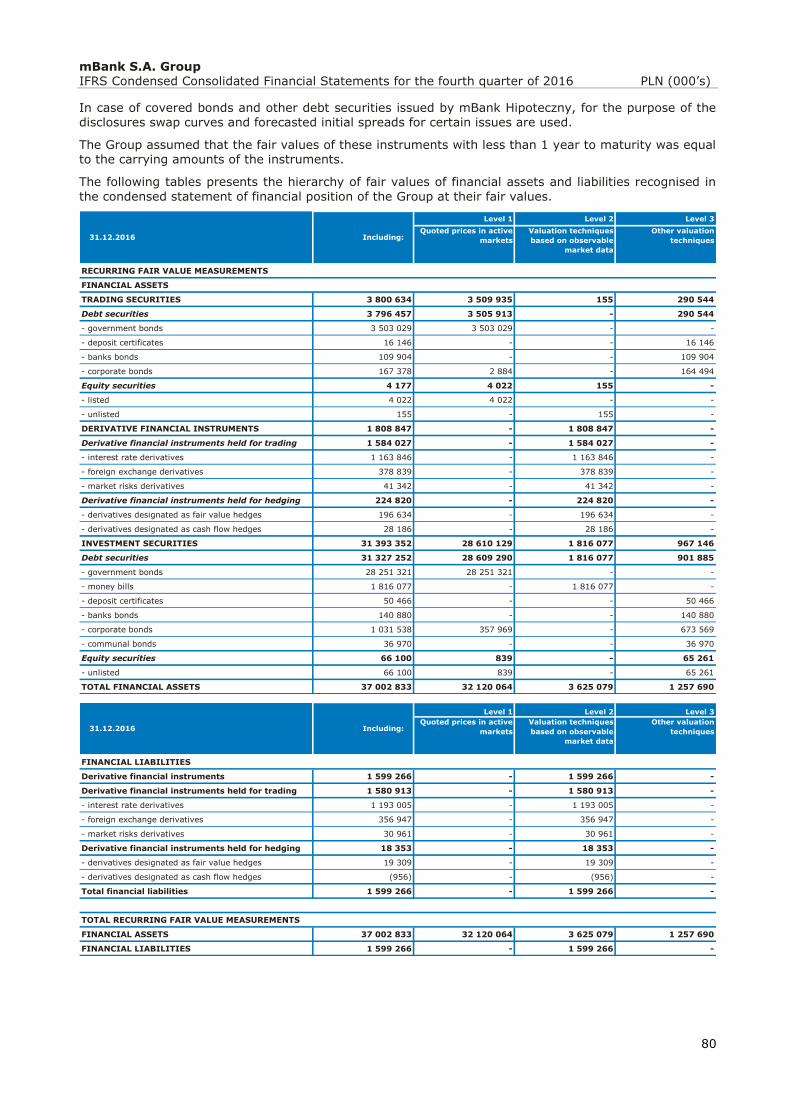
mBank S.A. Group IFRS Condensed Consolidated Financial Statements for the fourth quarter of 2016 PLN (000’s)
80
In case of covered bonds and other debt securities issued by mBank Hipoteczny, for the purpose of the
disclosures swap curves and forecasted initial spreads for certain issues are used.
The Group assumed that the fair values of these instruments with less than 1 year to maturity was equal to the carrying amounts of the instruments.
The following tables presents the hierarchy of fair values of financial assets and liabilities recognised in
the condensed statement of financial position of the Group at their fair values.
Level 1 Level 2 Level 3
Quoted prices in active
markets
Valuation techniques
based on observable
market data
Other valuation
techniques
RECURRING FAIR VALUE MEASUREMENTS
FINANCIAL ASSETS
TRADING SECURITIES 3 800 634 3 509 935 155 290 544
Debt securities 3 796 457 3 505 913 - 290 544
- government bonds 3 503 029 3 503 029 - -
- deposit certificates 16 146 - - 16 146
- banks bonds 109 904 - - 109 904
- corporate bonds 167 378 2 884 - 164 494
Equity securities 4 177 4 022 155 -
- listed 4 022 4 022 - -
- unlisted 155 - 155 -
DERIVATIVE FINANCIAL INSTRUMENTS 1 808 847 - 1 808 847 -
Derivative financial instruments held for trading 1 584 027 - 1 584 027 -
- interest rate derivatives 1 163 846 - 1 163 846 -
- foreign exchange derivatives 378 839 - 378 839 -
- market risks derivatives 41 342 - 41 342 -
Derivative financial instruments held for hedging 224 820 - 224 820 -
- derivatives designated as fair value hedges 196 634 - 196 634 -
- derivatives designated as cash flow hedges 28 186 - 28 186 -
INVESTMENT SECURITIES 31 393 352 28 610 129 1 816 077 967 146
Debt securities 31 327 252 28 609 290 1 816 077 901 885
- government bonds 28 251 321 28 251 321 - -
- money bills 1 816 077 - 1 816 077 -
- deposit certificates 50 466 - - 50 466
- banks bonds 140 880 - - 140 880
- corporate bonds 1 031 538 357 969 - 673 569
- communal bonds 36 970 - - 36 970
Equity securities 66 100 839 - 65 261
- unlisted 66 100 839 - 65 261
TOTAL FINANCIAL ASSETS 37 002 833 32 120 064 3 625 079 1 257 690
31.12.2016 Including:
Level 1 Level 2 Level 3
Quoted prices in active
markets
Valuation techniques
based on observable
market data
Other valuation
techniques
FINANCIAL LIABILITIES
Derivative financial instruments 1 599 266 - 1 599 266 -
Derivative financial instruments held for trading 1 580 913 - 1 580 913 -
- interest rate derivatives 1 193 005 - 1 193 005 -
- foreign exchange derivatives 356 947 - 356 947 -
- market risks derivatives 30 961 - 30 961 -
Derivative financial instruments held for hedging 18 353 - 18 353 -
- derivatives designated as fair value hedges 19 309 - 19 309 -
- derivatives designated as cash flow hedges (956) - (956) -
Total financial liabilities 1 599 266 - 1 599 266 -
TOTAL RECURRING FAIR VALUE MEASUREMENTS
FINANCIAL ASSETS 37 002 833 32 120 064 3 625 079 1 257 690
FINANCIAL LIABILITIES 1 599 266 - 1 599 266 -
31.12.2016 Including:
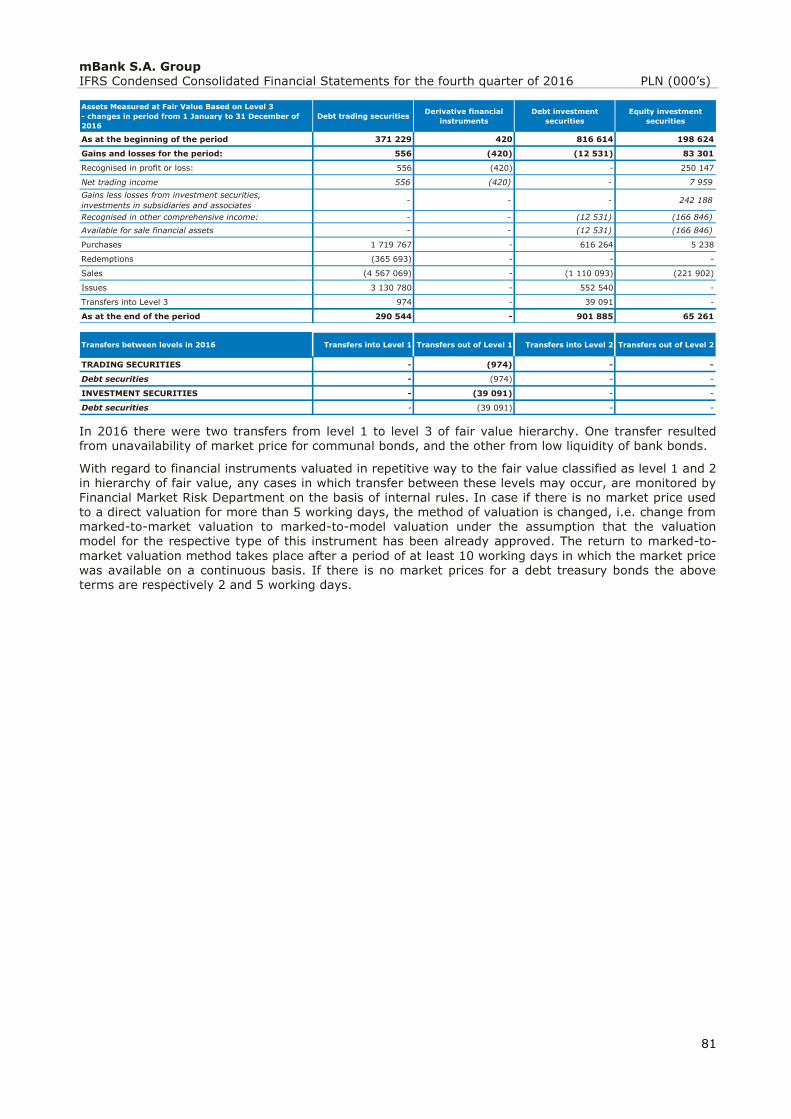
mBank S.A. Group IFRS Condensed Consolidated Financial Statements for the fourth quarter of 2016 PLN (000’s)
81
In 2016 there were two transfers from level 1 to level 3 of fair value hierarchy. One transfer resulted from unavailability of market price for communal bonds, and the other from low liquidity of bank bonds.
With regard to financial instruments valuated in repetitive way to the fair value classified as level 1 and 2 in hierarchy of fair value, any cases in which transfer between these levels may occur, are monitored by Financial Market Risk Department on the basis of internal rules. In case if there is no market price used to a direct valuation for more than 5 working days, the method of valuation is changed, i.e. change from marked-to-market valuation to marked-to-model valuation under the assumption that the valuation model for the respective type of this instrument has been already approved. The return to marked-to-
market valuation method takes place after a period of at least 10 working days in which the market price was available on a continuous basis. If there is no market prices for a debt treasury bonds the above terms are respectively 2 and 5 working days.
Assets Measured at Fair Value Based on Level 3
- changes in period from 1 January to 31 December of
2016
Debt trading securitiesDerivative financial
instruments
Debt investment
securities
Equity investment
securities
As at the beginning of the period 371 229 420 816 614 198 624
Gains and losses for the period: 556 (420) (12 531) 83 301
Recognised in profit or loss: 556 (420) - 250 147
Net trading income 556 (420) - 7 959
Gains less losses from investment securities,
investments in subsidiaries and associates- - - 242 188
Recognised in other comprehensive income: - - (12 531) (166 846)
Available for sale financial assets - - (12 531) (166 846)
Purchases 1 719 767 - 616 264 5 238
Redemptions (365 693) - - -
Sales (4 567 069) - (1 110 093) (221 902)
Issues 3 130 780 - 552 540 -
Transfers into Level 3 974 - 39 091 -
As at the end of the period 290 544 - 901 885 65 261
Transfers between levels in 2016 Transfers into Level 1 Transfers out of Level 1 Transfers into Level 2 Transfers out of Level 2
TRADING SECURITIES - (974) - -
Debt securities - (974) - -
INVESTMENT SECURITIES - (39 091) - -
Debt securities - (39 091) - -
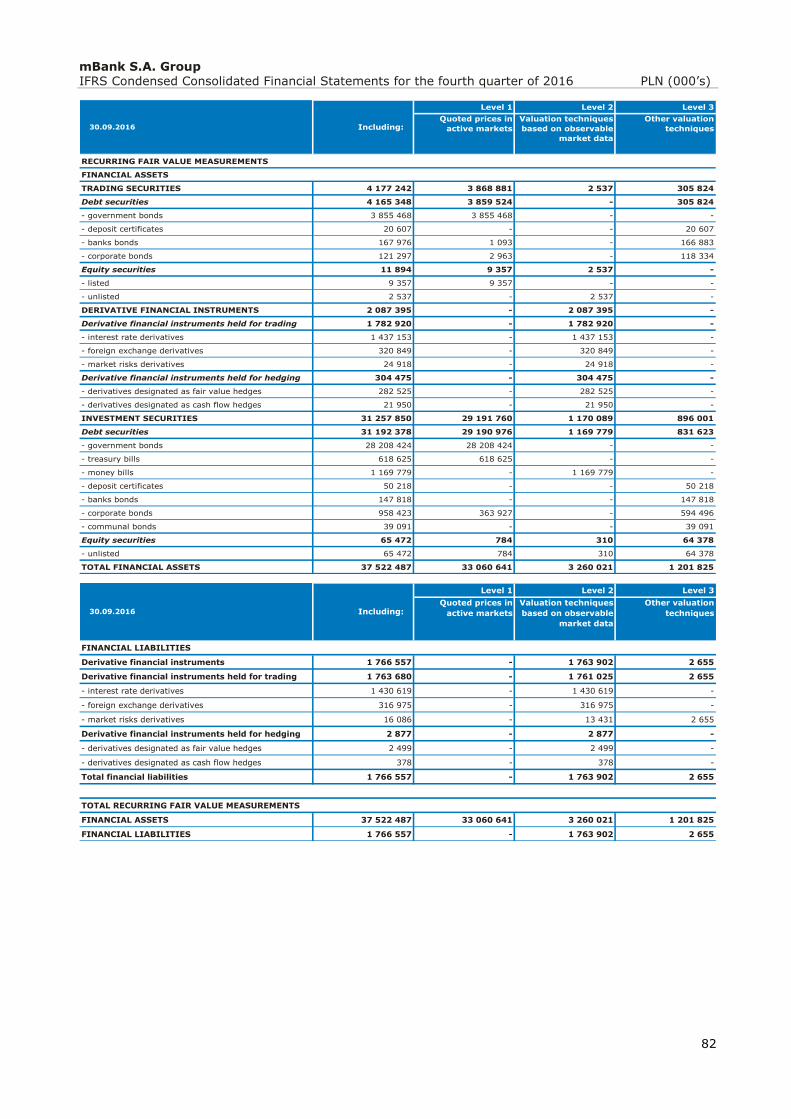
mBank S.A. Group IFRS Condensed Consolidated Financial Statements for the fourth quarter of 2016 PLN (000’s)
82
Level 1 Level 2 Level 3
Quoted prices in
active markets
Valuation techniques
based on observable
market data
Other valuation
techniques
RECURRING FAIR VALUE MEASUREMENTS
FINANCIAL ASSETS
TRADING SECURITIES 4 177 242 3 868 881 2 537 305 824
Debt securities 4 165 348 3 859 524 - 305 824
- government bonds 3 855 468 3 855 468 - -
- deposit certificates 20 607 - - 20 607
- banks bonds 167 976 1 093 - 166 883
- corporate bonds 121 297 2 963 - 118 334
Equity securities 11 894 9 357 2 537 -
- listed 9 357 9 357 - -
- unlisted 2 537 - 2 537 -
DERIVATIVE FINANCIAL INSTRUMENTS 2 087 395 - 2 087 395 -
Derivative financial instruments held for trading 1 782 920 - 1 782 920 -
- interest rate derivatives 1 437 153 - 1 437 153 -
- foreign exchange derivatives 320 849 - 320 849 -
- market risks derivatives 24 918 - 24 918 -
Derivative financial instruments held for hedging 304 475 - 304 475 -
- derivatives designated as fair value hedges 282 525 - 282 525 -
- derivatives designated as cash flow hedges 21 950 - 21 950 -
INVESTMENT SECURITIES 31 257 850 29 191 760 1 170 089 896 001
Debt securities 31 192 378 29 190 976 1 169 779 831 623
- government bonds 28 208 424 28 208 424 - -
- treasury bills 618 625 618 625 - -
- money bills 1 169 779 - 1 169 779 -
- deposit certificates 50 218 - - 50 218
- banks bonds 147 818 - - 147 818
- corporate bonds 958 423 363 927 - 594 496
- communal bonds 39 091 - - 39 091
Equity securities 65 472 784 310 64 378
- unlisted 65 472 784 310 64 378
TOTAL FINANCIAL ASSETS 37 522 487 33 060 641 3 260 021 1 201 825
30.09.2016 Including:
Level 1 Level 2 Level 3
Quoted prices in
active markets
Valuation techniques
based on observable
market data
Other valuation
techniques
FINANCIAL LIABILITIES
Derivative financial instruments 1 766 557 - 1 763 902 2 655
Derivative financial instruments held for trading 1 763 680 - 1 761 025 2 655
- interest rate derivatives 1 430 619 - 1 430 619 -
- foreign exchange derivatives 316 975 - 316 975 -
- market risks derivatives 16 086 - 13 431 2 655
Derivative financial instruments held for hedging 2 877 - 2 877 -
- derivatives designated as fair value hedges 2 499 - 2 499 -
- derivatives designated as cash flow hedges 378 - 378 -
Total financial liabilities 1 766 557 - 1 763 902 2 655
TOTAL RECURRING FAIR VALUE MEASUREMENTS
FINANCIAL ASSETS 37 522 487 33 060 641 3 260 021 1 201 825
FINANCIAL LIABILITIES 1 766 557 - 1 763 902 2 655
30.09.2016 Including:
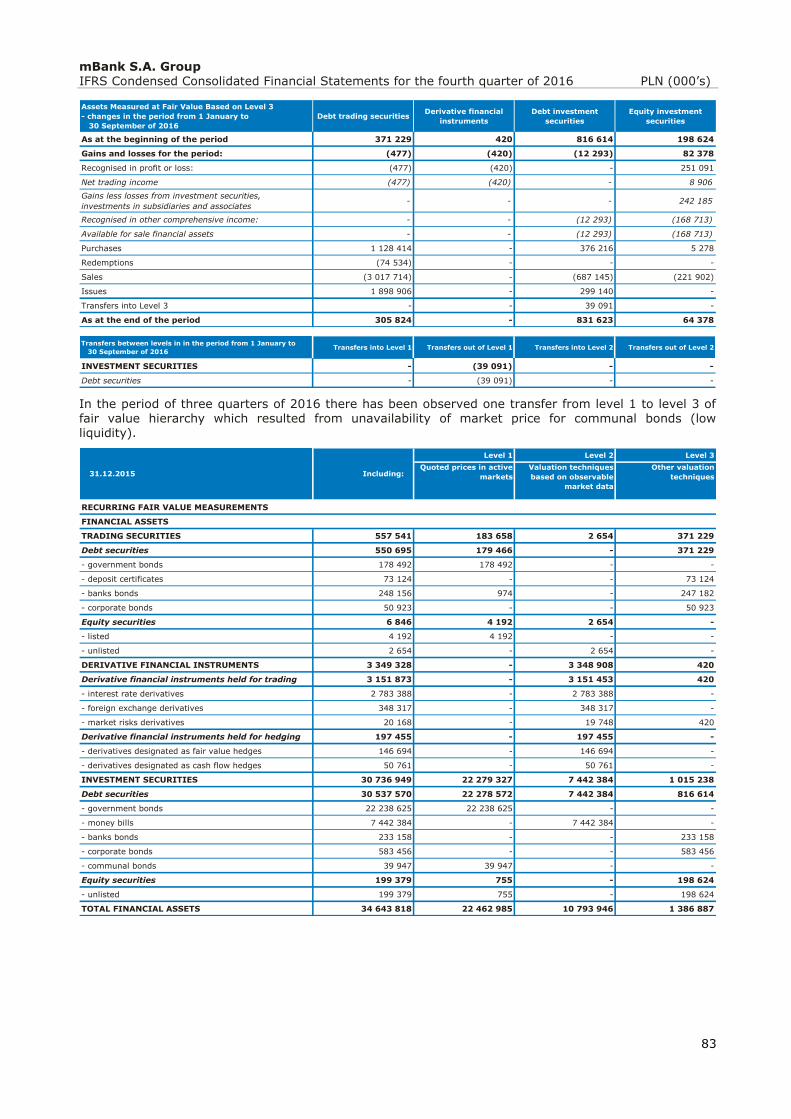
mBank S.A. Group IFRS Condensed Consolidated Financial Statements for the fourth quarter of 2016 PLN (000’s)
83
In the period of three quarters of 2016 there has been observed one transfer from level 1 to level 3 of fair value hierarchy which resulted from unavailability of market price for communal bonds (low liquidity).
Assets Measured at Fair Value Based on Level 3
- changes in the period from 1 January to
30 September of 2016
Debt trading securitiesDerivative financial
instruments
Debt investment
securities
Equity investment
securities
As at the beginning of the period 371 229 420 816 614 198 624
Gains and losses for the period: (477) (420) (12 293) 82 378
Recognised in profit or loss: (477) (420) - 251 091
Net trading income (477) (420) - 8 906
Gains less losses from investment securities,
investments in subsidiaries and associates- - - 242 185
Recognised in other comprehensive income: - - (12 293) (168 713)
Available for sale financial assets - - (12 293) (168 713)
Purchases 1 128 414 - 376 216 5 278
Redemptions (74 534) - - -
Sales (3 017 714) - (687 145) (221 902)
Issues 1 898 906 - 299 140 -
Transfers into Level 3 - - 39 091 -
As at the end of the period 305 824 - 831 623 64 378
Transfers between levels in in the period from 1 January to
30 September of 2016Transfers into Level 1 Transfers out of Level 1 Transfers into Level 2 Transfers out of Level 2
INVESTMENT SECURITIES - (39 091) - -
Debt securities - (39 091) - -
Level 1 Level 2 Level 3
Quoted prices in active
markets
Valuation techniques
based on observable
market data
Other valuation
techniques
RECURRING FAIR VALUE MEASUREMENTS
FINANCIAL ASSETS
TRADING SECURITIES 557 541 183 658 2 654 371 229
Debt securities 550 695 179 466 - 371 229
- government bonds 178 492 178 492 - -
- deposit certificates 73 124 - - 73 124
- banks bonds 248 156 974 - 247 182
- corporate bonds 50 923 - - 50 923
Equity securities 6 846 4 192 2 654 -
- listed 4 192 4 192 - -
- unlisted 2 654 - 2 654 -
DERIVATIVE FINANCIAL INSTRUMENTS 3 349 328 - 3 348 908 420
Derivative financial instruments held for trading 3 151 873 - 3 151 453 420
- interest rate derivatives 2 783 388 - 2 783 388 -
- foreign exchange derivatives 348 317 - 348 317 -
- market risks derivatives 20 168 - 19 748 420
Derivative financial instruments held for hedging 197 455 - 197 455 -
- derivatives designated as fair value hedges 146 694 - 146 694 -
- derivatives designated as cash flow hedges 50 761 - 50 761 -
INVESTMENT SECURITIES 30 736 949 22 279 327 7 442 384 1 015 238
Debt securities 30 537 570 22 278 572 7 442 384 816 614
- government bonds 22 238 625 22 238 625 - -
- money bills 7 442 384 - 7 442 384 -
- banks bonds 233 158 - - 233 158
- corporate bonds 583 456 - - 583 456
- communal bonds 39 947 39 947 - -
Equity securities 199 379 755 - 198 624
- unlisted 199 379 755 - 198 624
TOTAL FINANCIAL ASSETS 34 643 818 22 462 985 10 793 946 1 386 887
31.12.2015 Including:
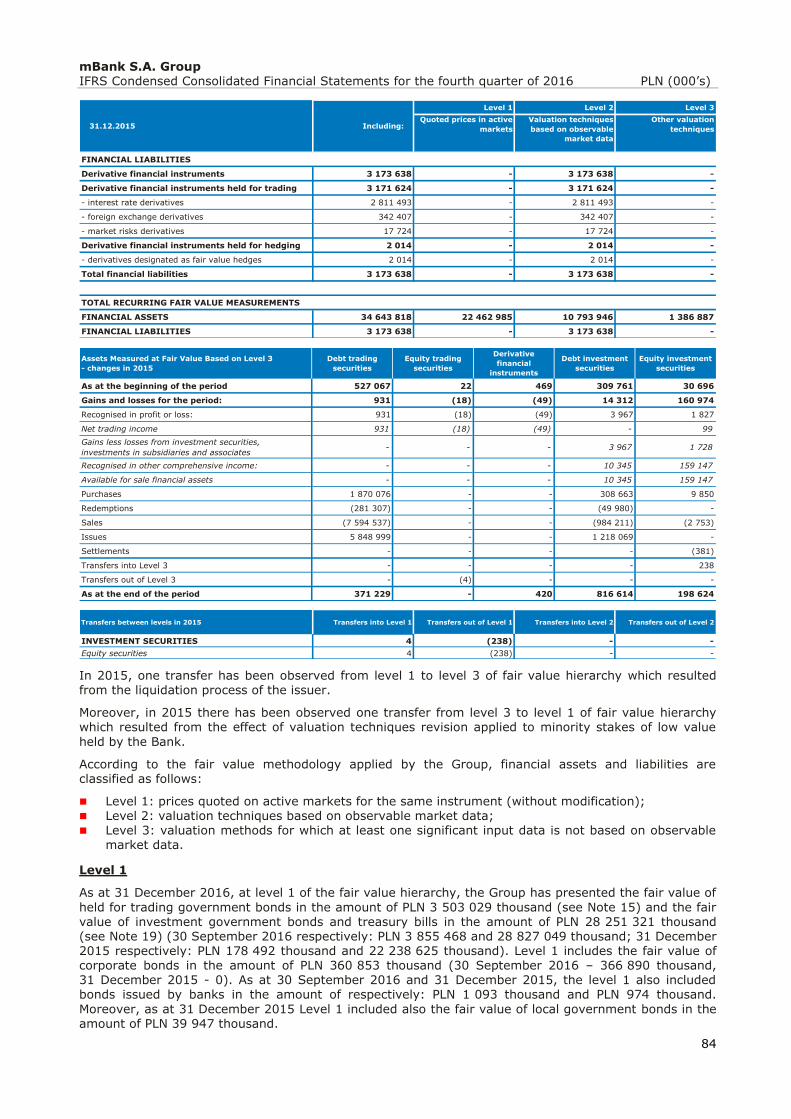
mBank S.A. Group IFRS Condensed Consolidated Financial Statements for the fourth quarter of 2016 PLN (000’s)
84
In 2015, one transfer has been observed from level 1 to level 3 of fair value hierarchy which resulted from the liquidation process of the issuer.
Moreover, in 2015 there has been observed one transfer from level 3 to level 1 of fair value hierarchy which resulted from the effect of valuation techniques revision applied to minority stakes of low value
held by the Bank.
According to the fair value methodology applied by the Group, financial assets and liabilities are classified as follows:
Level 1: prices quoted on active markets for the same instrument (without modification); Level 2: valuation techniques based on observable market data; Level 3: valuation methods for which at least one significant input data is not based on observable
market data.
Level 1
As at 31 December 2016, at level 1 of the fair value hierarchy, the Group has presented the fair value of
held for trading government bonds in the amount of PLN 3 503 029 thousand (see Note 15) and the fair value of investment government bonds and treasury bills in the amount of PLN 28 251 321 thousand (see Note 19) (30 September 2016 respectively: PLN 3 855 468 and 28 827 049 thousand; 31 December 2015 respectively: PLN 178 492 thousand and 22 238 625 thousand). Level 1 includes the fair value of corporate bonds in the amount of PLN 360 853 thousand (30 September 2016 – 366 890 thousand, 31 December 2015 - 0). As at 30 September 2016 and 31 December 2015, the level 1 also included bonds issued by banks in the amount of respectively: PLN 1 093 thousand and PLN 974 thousand.
Moreover, as at 31 December 2015 Level 1 included also the fair value of local government bonds in the amount of PLN 39 947 thousand.
Level 1 Level 2 Level 3
Quoted prices in active
markets
Valuation techniques
based on observable
market data
Other valuation
techniques
FINANCIAL LIABILITIES
Derivative financial instruments 3 173 638 - 3 173 638 -
Derivative financial instruments held for trading 3 171 624 - 3 171 624 -
- interest rate derivatives 2 811 493 - 2 811 493 -
- foreign exchange derivatives 342 407 - 342 407 -
- market risks derivatives 17 724 - 17 724 -
Derivative financial instruments held for hedging 2 014 - 2 014 -
- derivatives designated as fair value hedges 2 014 - 2 014 -
Total financial liabilities 3 173 638 - 3 173 638 -
TOTAL RECURRING FAIR VALUE MEASUREMENTS
FINANCIAL ASSETS 34 643 818 22 462 985 10 793 946 1 386 887
FINANCIAL LIABILITIES 3 173 638 - 3 173 638 -
31.12.2015 Including:
Assets Measured at Fair Value Based on Level 3
- changes in 2015
Debt trading
securities
Equity trading
securities
Derivative
financial
instruments
Debt investment
securities
Equity investment
securities
As at the beginning of the period 527 067 22 469 309 761 30 696
Gains and losses for the period: 931 (18) (49) 14 312 160 974
Recognised in profit or loss: 931 (18) (49) 3 967 1 827
Net trading income 931 (18) (49) - 99
Gains less losses from investment securities,
investments in subsidiaries and associates- - - 3 967 1 728
Recognised in other comprehensive income: - - - 10 345 159 147
Available for sale financial assets - - - 10 345 159 147
Purchases 1 870 076 - - 308 663 9 850
Redemptions (281 307) - - (49 980) -
Sales (7 594 537) - - (984 211) (2 753)
Issues 5 848 999 - - 1 218 069 -
Settlements - - - - (381)
Transfers into Level 3 - - - - 238
Transfers out of Level 3 - (4) - - -
As at the end of the period 371 229 - 420 816 614 198 624
Transfers between levels in 2015 Transfers into Level 1 Transfers out of Level 1 Transfers into Level 2 Transfers out of Level 2
INVESTMENT SECURITIES 4 (238) - -
Equity securities 4 (238) - -
mBank S.A. Group IFRS Condensed Consolidated Financial Statements for the fourth quarter of 2016 PLN (000’s)
85
In addition, as at 31 December 2016 level 1 includes the value of the registered privileged shares of
Giełda Papierów Wartościowych in the amount of PLN 839 thousand (30 September 2016: PLN 784 thousand, 31 December 2015: PLN 755 thousand) and the value of the shares of listed companies in the amount of PLN 4 022 thousand (30 September 2016: PLN 9 357 thousand, 31 December 2015: PLN 4 192 thousand).
These instruments are classified as level 1 because their valuation is directly derived by applying current market prices quoted on active and liquid financial markets.
Level 2
Level 2 of the fair vale hierarchy includes the fair values of short term bills issued by NBP in the amount of PLN 1 816 077 thousand (30 September 2016: PLN 1 169 779 thousand, 31 December 2015: PLN 7 442 384 thousand;), whose valuation is based on a NPV model (discounted future cash flows) fed with interest rate curves generated by transformation of quotations taken directly from active and liquid
financial markets.
In addition, the level 2 category includes the valuation of derivative financial instruments borne on models consistent with market standards and practices, using parameters taken directly from the markets (e.g., foreign exchange rates, implied volatilities of fx options, stock prices and indices) or
parameters which transform quotations taken directly from active and liquid financial markets (e.g., interest rate curves).
As at 31 December 2016, 30 September 2016 and 31 December 2015, level 2 also includes the value of options referencing on the WIG20 index, listed on the Stock Exchange. For the valuation of index options on WIG20 the Bank applied an internal model (based on a model for implied volatility) for which market data have been used as input parameters.
Level 3
Level 3 of the hierarchy presents the fair values of commercial debt securities issued by local banks and companies (bonds and deposit certificates) in the amount of PLN 1 155 459 thousand (30 September
2016: PLN 1 098 356 thousand, 31 December 2015: PLN 1 187 843 thousand).
Level 3 includes also the fair value of local government bonds in the amount of PLN 36 970 thousand (30 September 2016: PLN 39 091 thousand, 31 December 2015 - 0).
The above mentioned debt instruments are classified as level 3 because in addition to parameters which transform quotations taken directly from active and liquid financial markets (interest rate curves), their valuation uses credit spread estimated by the Bank by means of an internal credit risk model and
reflects the credit risk of the issuer. The model uses parameters (e.g., rate of recovery from collateral,
rating migrations, default ratio volatilities) which are not observed on active markets and hence were generated by statistical analysis.
Moreover, level 3 covers mainly the fair value of equity securities amounting to PLN 65 261 thousand (30 September 2016: PLN 64 378 thousand, 31 December 2015: PLN 198 624 thousand). As at 31 December 2016, these amount includes the value of preferred stock in Visa Inc. in the amount of PLN 38 392 thousand (30 September 2016: PLN 37 545 thousand). As at 31 December 2015 this amount
includes the value of Visa Europe Ltd. shares in the amount of PLN 167 243 thousand which was valuated at fair value on the basis on information held by the Bank in connection with the takeover transaction of Visa Europe Ltd by Visa Inc. The other equity securities presented at level 3 have been valuated using the market multiples method. The market multiples method, consists of valuating the equity capital of a company by using a relation between the market values of the own equity capital or market values of the total capital invested in comparable companies (goodwill) and selected economic and financial figures.
26. Capital ratios
The increases of the mBank Group’s total capital ratio (from 18.61% to 20.29%) and common equity Tier 1 ratio (from 15.88% to 17.32%) in the fourth quarter of 2016 were driven by the following factors:
the adjustment of the application of the Basel 1 regulatory floor to the requirements of article 500 of the Regulation (EU) No 575/2013 of the European Parliament and the Council of 26 June 2013 on prudential requirements for credit institutions and investment firms (“CRR Regulation”), also complying with the provisions of Commission Implementing Regulation (EU) No 680/2014 of 16
April 2014 laying down implementing technical standards with regard to the supervisory reporting of institutions according to Regulation (EU) No 575/2013 of the European Parliament and of the Council with further amendments;
mBank S.A. Group IFRS Condensed Consolidated Financial Statements for the fourth quarter of 2016 PLN (000’s)
86
the extensions of the AIRB approach and the changes of the AIRB models:
the implementation of the material change to the internal corporate LGD model (having satisfied the suspensive conditions) for which the Bank obtained the joint consent of the European Central Bank (“ECB”) and of the Polish Financial Supervision Authority (“KNF”) on 15 September 2016;
the receipt on 26 July 2016 of an official confirmation from the ECB and the KNF regarding the
Bank’s fulfilment of the high significance conditions stipulated in the conditional consent to apply the internal rating based approach to the calculation of the capital charge for credit risk for the credit exposures of the subsidiary mLeasing S.A. This, given the adjustment of the application of the Basel 1 regulatory floor, allowed the Bank to recognise a decline in the total value of risk weighted assets.
The increases of the mBank’s total capital ratio (from 22.18% to 24.07%) and common equity Tier 1 ratio (from 18.98% to 20.59%) in the fourth quarter of 2016 were driven by the following factors:
the adjustment of the application of the Basel 1 regulatory floor to the requirements of article 500 CRR Regulation, also complying with the provisions of Commission Implementing Regulation (EU) No 680/2014 of 16 April 2014 laying down implementing technical standards with regard to supervisory reporting of institutions according to CRR Regulation with further amendments;
the implementation of the material change to the internal corporate LGD model (having satisfied the suspensive conditions) for which the Bank obtained the joint consent of the ECB and of the KNF
on 15 September 2016.
Selected explanatory information
1. Compliance with international financial reporting standards
The presented condensed consolidated report for the fourth quarter of 2016 fulfils the requirements of
the International Accounting Standard (IAS) 34 “Interim Financial Reporting” relating to interim financial reports.
In addition, selected explanatory information provide additional information in accordance with Decree of the Minister of Finance dated 19 February 2009 concerning the publication of current and periodic information by issuers of securities and the conditions of acceptance as equal information required by the law of other state, which is not a member state (Journal of Laws No. 33, item 259 with further amendments).
2. Consistency of accounting principles and calculation methods applied to the drafting of the quarterly report and the last annual financial statements
A detailed description of the accounting policy principles of the Group is presented under Note 2 and 3 of these condensed consolidated financial statements. The accounting policies were applied consistently
over all periods presented in these condensed consolidated financial statements.
3. Seasonal or cyclical nature of the business
The business operations of the Group do not involve significant events that would be subject to seasonal or cyclical variations.
4. Nature and values of items affecting assets, liabilities, equity, net profit/(loss) or cash flows, which are extraordinary in terms of their nature, magnitude or exerted impact
Act on tax on certain financial institutions
On 15 January 2016 the Sejm of the Republic of Poland adopted the "Act on tax on certain financial institutions". The Act came into force on 1 February 2016.
The Act regulates the taxation of the assets of certain financial institutions. In the case of the banks, the tax base is the excess of the total value of assets, resulting from the trial balance determined on the basis of the general ledger records as of the last day of the month in accordance with the accounting standards applied by the banks, above the amount of PLN 4 billion, reduced by the value of own funds and treasury securities. The tax rate introduced by the Act is 0.0366% of the tax base per month. The cost of tax on certain financial institutions included in the results and equity of the Bank and of the Group for the twelve months of 2016 amounted to PLN 308 243 thousand and PLN 324 928 thousand
recpectively.
mBank S.A. Group IFRS Condensed Consolidated Financial Statements for the fourth quarter of 2016 PLN (000’s)
87
5. Nature and amounts of changes in estimate values of items, which were presented in
previous interim periods of the current reporting year, or changes of accounting estimates indicated in prior reporting years, if they bear a substantial impact upon the current interim period
In the fourth quarter of 2016, events as indicated above did not occur in the Group.
6. Issues, redemption and repayment of non-equity and equity securities
In the fourth quarter of 2016, mBank Hipoteczny S.A. issued mortgage bonds in the amount of EUR 35 000 thousand and PLN 400 000 thousand as well as bonds in the amount of PLN 998 000 thousand. In the same time the company redeemed mortgage bonds in the amount of PLN 100 000 thousand and
bonds in the amount of PLN 1 016 000 thousand.
7. Dividends paid (or declared) altogether or broken down by ordinary shares and other shares
On 24 March 2016, the 29th Ordinary General Meeting of mBank S.A., adopted the resolution on division of the 2015 net profit which does not provide for the payment of dividend for the year 2015.
8. Significant events after the end of the fourth quarter of 2016, which are not reflected in the financial statements
Recommendations of Financial Stability Committee (“FSC”) on the restructuring of the FX housing loans portfolio
On 31 January 2017, FSC endorsed the resolution No 14/2017 on the recommendation on the restructuring of the FX housing loans portfolio. The resolution includes a list of recommendations, the most important of which are:
- to increase the minimum LGD for exposures secured by mortgages on residential property, the purchase of which was financed by an FX loan by means of a dedicated resolution of the Ministry of Finance (this regulatory measure is addressed to banks that apply internal ratings based approach to the
calculation of the capital charge for credit risk, among others to mBank S.A.);
- to increase by Polish Financial Supervision Authority the additional capital requirements related to FX housing loans by taking into account additional risk types: operational risk, market risk and collective risk of default;
- to impose a systemic risk buffer of 3% by the Ministry of Finance that would apply to all exposures on the territory of the Republic of Poland;
- to increase the risk weight used by the banks to calculate capital requirements to the level of 150% for
FX exposures secured by mortgages on immovable property by means of a dedicated resolution of the Ministry of Finance.
At the date of publication of these financial statements, the final method of implementation of the FSC recommendation is not known. Therefore, the Bank is not able at the moment to estimate the potential impact of the proposed solutions on the capital ratios and financial statements of mBank S.A. and mBank Group.
9. Effect of changes in the structure of the entity in the fourth quarter of 2016, including
business combinations, acquisitions or disposal of subsidiaries, long-term investments, restructuring, and discontinuation of business activities
In the fourth quarter of 2016, events as indicated above did not occur in the Group.
10. Changes in contingent liabilities and commitments
In the fourth quarter of 2016, there were no changes in contingent liabilities and commitments of credit nature, i.e., guarantees, letters of credit or unutilised loan amounts, other than resulting from current
operating activities of the Group. There was no single case of granting of guarantees or any other contingent liability of any material value for the Group.
11. Write-offs of the value of inventories down to net realisable value and reversals of such write-offs
In the fourth quarter of 2016, events as indicated above did not occur in the Group.
mBank S.A. Group IFRS Condensed Consolidated Financial Statements for the fourth quarter of 2016 PLN (000’s)
88
12. Revaluation write-offs on account of impairment of tangible fixed assets, intangible
assets, or other assets as well as reversals of such write-offs
In the fourth quarter of 2016, events as indicated above did not occur in the Group.
13. Revaluation write-offs on account of impairment of financial assets
Data regarding write-offs on account of impairment of financial assets are presented under Note 9 and Note 11 of these condensed consolidated financial statements.
14. Reversals of provisions against restructuring costs
In the fourth quarter of 2016, events as indicated above did not occur in the Group.
15. Acquisitions and disposals of tangible fixed asset items
In the fourth quarter of 2016, there were no material transactions of acquisition or disposal of any tangible fixed assets, with the exception of typical lease and property development operations that are performed by the companies of the Group.
16. Material liabilities assumed on account of acquisition of tangible fixed assets
In the fourth quarter of 2016, events as indicated above did not occur in the Group.
17. Information about changing the process (method) of measurement the fair value of
financial instruments
In the fourth quarter of 2016, events as indicated above did not occur in the Group.
18. Changes in the classification of financial assets due to changes of purpose or use of these
assets
In the fourth quarter of 2016, events as indicated above did not occur in the Group.
19. Corrections of errors from previous reporting periods
In the fourth quarter of 2016, events as indicated above did not occur in the Group.
20. Default or infringement of a loan agreement or failure to initiate composition proceedings
In the fourth quarter of 2016, events as indicated above did not occur in the Group.
21. Position of the management on the probability of performance of previously published
profit/loss forecasts for the year in light of the results presented in the quarterly report compared to the forecast
mBank S.A. did not publish a performance forecast for the year 2016.
22. Registered share capital
The total number of ordinary shares as at 31 December 2016 was 42 280 127 shares (31 December 2015 - 42 238 924 shares) at PLN 4 nominal value each. All issued shares were fully paid up.
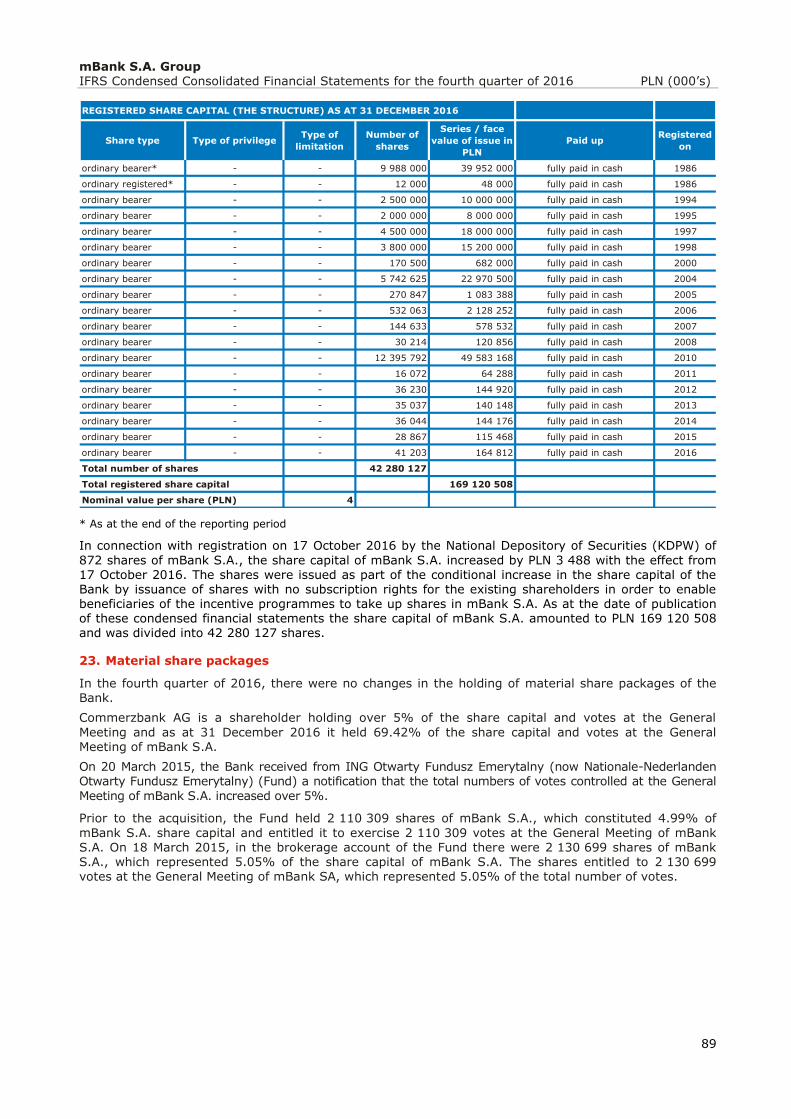
mBank S.A. Group IFRS Condensed Consolidated Financial Statements for the fourth quarter of 2016 PLN (000’s)
89
* As at the end of the reporting period
In connection with registration on 17 October 2016 by the National Depository of Securities (KDPW) of
872 shares of mBank S.A., the share capital of mBank S.A. increased by PLN 3 488 with the effect from 17 October 2016. The shares were issued as part of the conditional increase in the share capital of the Bank by issuance of shares with no subscription rights for the existing shareholders in order to enable beneficiaries of the incentive programmes to take up shares in mBank S.A. As at the date of publication of these condensed financial statements the share capital of mBank S.A. amounted to PLN 169 120 508
and was divided into 42 280 127 shares.
23. Material share packages
In the fourth quarter of 2016, there were no changes in the holding of material share packages of the Bank.
Commerzbank AG is a shareholder holding over 5% of the share capital and votes at the General
Meeting and as at 31 December 2016 it held 69.42% of the share capital and votes at the General Meeting of mBank S.A.
On 20 March 2015, the Bank received from ING Otwarty Fundusz Emerytalny (now Nationale-Nederlanden Otwarty Fundusz Emerytalny) (Fund) a notification that the total numbers of votes controlled at the General
Meeting of mBank S.A. increased over 5%.
Prior to the acquisition, the Fund held 2 110 309 shares of mBank S.A., which constituted 4.99% of
mBank S.A. share capital and entitled it to exercise 2 110 309 votes at the General Meeting of mBank S.A. On 18 March 2015, in the brokerage account of the Fund there were 2 130 699 shares of mBank S.A., which represented 5.05% of the share capital of mBank S.A. The shares entitled to 2 130 699
votes at the General Meeting of mBank SA, which represented 5.05% of the total number of votes.
REGISTERED SHARE CAPITAL (THE STRUCTURE) AS AT 31 DECEMBER 2016
Share type Type of privilegeType of
limitation
Number of
shares
Series / face
value of issue in
PLN
Paid upRegistered
on
ordinary bearer* - - 9 988 000 39 952 000 fully paid in cash 1986
ordinary registered* - - 12 000 48 000 fully paid in cash 1986
ordinary bearer - - 2 500 000 10 000 000 fully paid in cash 1994
ordinary bearer - - 2 000 000 8 000 000 fully paid in cash 1995
ordinary bearer - - 4 500 000 18 000 000 fully paid in cash 1997
ordinary bearer - - 3 800 000 15 200 000 fully paid in cash 1998
ordinary bearer - - 170 500 682 000 fully paid in cash 2000
ordinary bearer - - 5 742 625 22 970 500 fully paid in cash 2004
ordinary bearer - - 270 847 1 083 388 fully paid in cash 2005
ordinary bearer - - 532 063 2 128 252 fully paid in cash 2006
ordinary bearer - - 144 633 578 532 fully paid in cash 2007
ordinary bearer - - 30 214 120 856 fully paid in cash 2008
ordinary bearer - - 12 395 792 49 583 168 fully paid in cash 2010
ordinary bearer - - 16 072 64 288 fully paid in cash 2011
ordinary bearer - - 36 230 144 920 fully paid in cash 2012
ordinary bearer - - 35 037 140 148 fully paid in cash 2013
ordinary bearer - - 36 044 144 176 fully paid in cash 2014
ordinary bearer - - 28 867 115 468 fully paid in cash 2015
ordinary bearer - - 41 203 164 812 fully paid in cash 2016
Total number of shares 42 280 127
Total registered share capital 169 120 508
Nominal value per share (PLN) 4
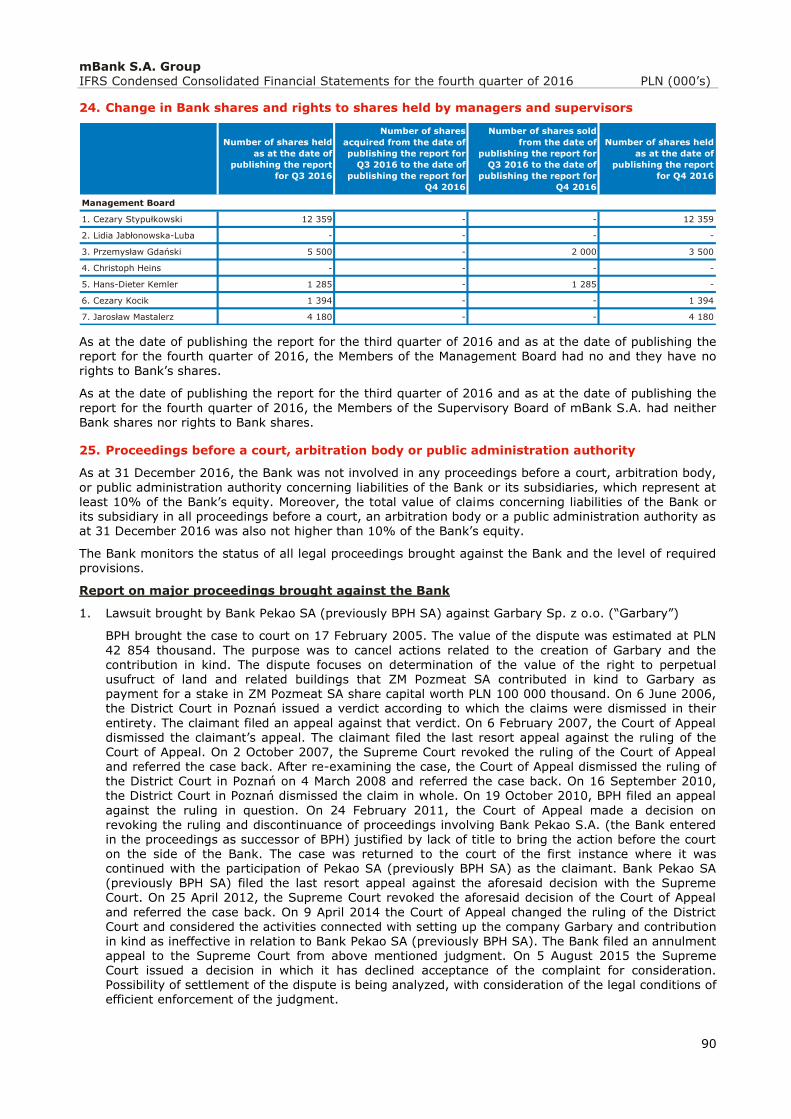
mBank S.A. Group IFRS Condensed Consolidated Financial Statements for the fourth quarter of 2016 PLN (000’s)
90
24. Change in Bank shares and rights to shares held by managers and supervisors
As at the date of publishing the report for the third quarter of 2016 and as at the date of publishing the report for the fourth quarter of 2016, the Members of the Management Board had no and they have no
rights to Bank’s shares.
As at the date of publishing the report for the third quarter of 2016 and as at the date of publishing the
report for the fourth quarter of 2016, the Members of the Supervisory Board of mBank S.A. had neither Bank shares nor rights to Bank shares.
25. Proceedings before a court, arbitration body or public administration authority
As at 31 December 2016, the Bank was not involved in any proceedings before a court, arbitration body,
or public administration authority concerning liabilities of the Bank or its subsidiaries, which represent at least 10% of the Bank’s equity. Moreover, the total value of claims concerning liabilities of the Bank or its subsidiary in all proceedings before a court, an arbitration body or a public administration authority as at 31 December 2016 was also not higher than 10% of the Bank’s equity.
The Bank monitors the status of all legal proceedings brought against the Bank and the level of required provisions.
Report on major proceedings brought against the Bank
1. Lawsuit brought by Bank Pekao SA (previously BPH SA) against Garbary Sp. z o.o. (“Garbary”)
BPH brought the case to court on 17 February 2005. The value of the dispute was estimated at PLN 42 854 thousand. The purpose was to cancel actions related to the creation of Garbary and the contribution in kind. The dispute focuses on determination of the value of the right to perpetual usufruct of land and related buildings that ZM Pozmeat SA contributed in kind to Garbary as payment for a stake in ZM Pozmeat SA share capital worth PLN 100 000 thousand. On 6 June 2006, the District Court in Poznań issued a verdict according to which the claims were dismissed in their
entirety. The claimant filed an appeal against that verdict. On 6 February 2007, the Court of Appeal dismissed the claimant’s appeal. The claimant filed the last resort appeal against the ruling of the Court of Appeal. On 2 October 2007, the Supreme Court revoked the ruling of the Court of Appeal and referred the case back. After re-examining the case, the Court of Appeal dismissed the ruling of the District Court in Poznań on 4 March 2008 and referred the case back. On 16 September 2010, the District Court in Poznań dismissed the claim in whole. On 19 October 2010, BPH filed an appeal
against the ruling in question. On 24 February 2011, the Court of Appeal made a decision on revoking the ruling and discontinuance of proceedings involving Bank Pekao S.A. (the Bank entered in the proceedings as successor of BPH) justified by lack of title to bring the action before the court on the side of the Bank. The case was returned to the court of the first instance where it was continued with the participation of Pekao SA (previously BPH SA) as the claimant. Bank Pekao SA
(previously BPH SA) filed the last resort appeal against the aforesaid decision with the Supreme Court. On 25 April 2012, the Supreme Court revoked the aforesaid decision of the Court of Appeal
and referred the case back. On 9 April 2014 the Court of Appeal changed the ruling of the District Court and considered the activities connected with setting up the company Garbary and contribution in kind as ineffective in relation to Bank Pekao SA (previously BPH SA). The Bank filed an annulment appeal to the Supreme Court from above mentioned judgment. On 5 August 2015 the Supreme Court issued a decision in which it has declined acceptance of the complaint for consideration. Possibility of settlement of the dispute is being analyzed, with consideration of the legal conditions of efficient enforcement of the judgment.
Number of shares held
as at the date of
publishing the report
for Q3 2016
Number of shares
acquired from the date of
publishing the report for
Q3 2016 to the date of
publishing the report for
Q4 2016
Number of shares sold
from the date of
publishing the report for
Q3 2016 to the date of
publishing the report for
Q4 2016
Number of shares held
as at the date of
publishing the report
for Q4 2016
Management Board
1. Cezary Stypułkowski 12 359 - - 12 359
2. Lidia Jabłonowska-Luba - - - -
3. Przemysław Gdański 5 500 - 2 000 3 500
4. Christoph Heins - - - -
5. Hans-Dieter Kemler 1 285 - 1 285 -
6. Cezary Kocik 1 394 - - 1 394
7. Jarosław Mastalerz 4 180 - - 4 180
mBank S.A. Group IFRS Condensed Consolidated Financial Statements for the fourth quarter of 2016 PLN (000’s)
91
2. Lawsuit brought by Bank Pekao SA (previously BPH SA) against the Bank and Tele-Tech
Investment Sp. z o.o. (“TTI”)
On 17 November 2007, BPH brought to court a case for damages in the amount of PLN 34 880 thousand plus statutory interest from 20 November 2004 to the date of payment, due to alleged illegal actions such as the sale by ZM Pozmeat SA to TTI of all shares in the equity of Garbary Sp. z
o.o. (previously Milenium Center Sp. z o.o.), an important part of its assets, while ZM Pozmeat SA was at risk of insolvency.
In its reply to the claim, the Bank petitioned the Court for dismissing the claim on the grounds of there being no legal basis for allowing the claim. On 1 December 2009, the Court decided to
suspend the case until the completion of Pozmeat's bankruptcy proceedings. On 26 January 2011, the court has decided to reinstate suspended proceedings due to the closing of the insolvency procedure. On 5 June 2012, the court once again decided to suspend the proceedings until the case filed by Bank Pekao SA (previously BPH SA) against Garbary Sp. z o.o. is finally settled. In November 2015, a decision to resume the suspended proceedings was made.
3. Claims of clients of Interbrok
From 14 August 2008, 170 entities who were clients of Interbrok Investment E. Dróżdż i Spółka
Spółka jawna (hereinafter referred to as Interbrok) called the Bank for amicable settlement in the
total amount of PLN 385 520 thousand and via the District Court in Warsaw. In addition, 9 legal compensation suits have been delivered to the Bank. Eight of the nine suits where placed by former clients of Interbrok for the total amount of PLN 800 thousand with the reservation that the claims may be extended up to the total amount of PLN 5 950 thousand. The Plaintiffs alleged that the Bank
aided and abetted Interbrok’s illegal activities, which caused damage to the Plaintiffs. Seven of the suits against mBank were dismissed on substantive grounds and thus ended with a valid court order. As regards the 8th case, the Plaintiff withdrew the action and the waiver of claims and the Regional Court discontinued the proceedings. In the 9th case the value of the subject of litigation amounts to PLN 275 423 thousand together with statutory interest and legal costs. The amount set forth in the petition is to cover the receivables, acquired by the Plaintiff by way of assignment, due to parties
aggrieved by Interbrok on account of the reduction (as a result of Interbrok’s bankruptcy) of the receivables by a return of the deposits paid by the aggrieved for making investments on the forex market. The Plaintiff claims the Bank’s liability on the grounds of the Bank’s aiding to commit the illicit act of Interbrok involving the pursuit of brokerage activity without a permit. At present, the case is being heard by the court of first instance.
The Bank moves for dismissal of the claims in entirety and objects to charges raised in the legal
suits. The legal analysis of the abovementioned claims indicates that there are no significant
grounds to state that the Bank bears liability in the said case.
4. Class action against mBank S.A. concerning changes in interest rate clause
On 4 February 2011, the Bank received a class action brought to the District Court in Łódź on 20
December 2010 by the Municipal Ombudsman who represents a group of 835 persons – retail clients of the Bank. The petitioners demand that a responsibility of the Bank is determined for improper performance of mortgage credit agreements. In particular, it was indicated that the Bank improperly applied provisions of the agreements concerning interest rates adjustment, namely that the Bank did not reduce interest rates on loans, although, according to the petitioners, it should have. The Bank rejects the above reasoning. On 18 February 2011, the Bank submitted a formal answer to the
court, in which it applied for a dismissal of the claim as a whole.
On 6 May 2011, the District Court in Łódź decided to reject the application of mBank S.A. for dismissing the claim and decided that the case will proceed as a class action. On 13 June 2011, mBank S.A. lodged a complaint against this decision with the Court of Appeal in Łódź. On 28
September 2011, the Court of Appeal dismissed the complaint of mBank S.A. Currently, the case proceeds as a class action. The time for joining the class ended in March 2012. As at 17 October 2012, the approved class consisted of 1 247 members. Moreover, the District Court in Łódź ruled
against setting up a cash deposit for mBank S.A. requested by the Bank. The Bank lodged a complaint against this ruling. On 29 November 2012, the Court of Appeal in Łódź dismissed the Bank’s complaint about setting up the cash deposit. The ruling is valid and the Plaintiff is not obliged to pay the cash deposit. The final response to the petition was sent in January 2013, while the
Plaintiff replied to it in a pleading filed on 15 February 2013. By a decision dated 18 February 2013, the District Court in Łódź decided to refer the case to mediation. In a letter dated 26 February 2013, the Municipal Consumer Ombudsman raised an objection to the mediation. On 22 June 2013, a trial was conducted, and on 3 July 2013, the Court announced its judgment in which it took into account the action in its entirety acknowledging that the Bank improperly performed the agreement whereby the consumers sustained a loss. On 9 September 2013, the Bank filed an appeal against the
mBank S.A. Group IFRS Condensed Consolidated Financial Statements for the fourth quarter of 2016 PLN (000’s)
92
aforementioned verdict. Under the sentence of 30 April 2014, the Court of Appeal in Łódź dismissed
the appeal of mBank, upholding the decision of the District Court expressed in the appealed verdict. The aforementioned verdict is legally valid, however, after having received its written justification, mBank lodged an annulment appeal to the Supreme Court. The annulment appeal was brought by mBank on 3 October 2014. On 7 October 2014 the Court of Appeal in Łódź ceased the enforceability
of the judgement of District Court in Łódź until consideration of Bank’s annulment appeal. On 18 February 2015, the Supreme Court received the annulment appeal filed by mBank. On 14 May 2015, the Supreme Court revoked the judgments of the Court of Appeal in Łódź and remanded the case to the Court of Appeal in Łódź for re-examination. On 24 September 2015 the Court of Appeal in Łódź admitted evidence from an opinion of an expert in order to verify the correctness of adjustments made by mBank in mortgage loan interest rates subject to class action in the period of 1 January 2009 to 28 February 2010.
The expert witness prepared a principal opinion and a supplementary opinion. The parties now have time to inform each other of their stances on the expert witness’ opinion. The Court of Appeal set the hearing date for 24 February 2017.
5. Class action against mBank S.A. concerning indexation clauses
On 4 April 2016, the Municipal Ombudsman representing a group of 390 individuals, retail banking
clients of mBank, who concluded agreements on CHF-indexed mortgage loans with mBank, filed a class action with the Regional Court in Łódź against mBank. In a letter of 23 May 2016 the claimant added another 144 persons to the list of the group members. The statement of claim included alternative claims for declaring invalidity of the loan agreements in part i.e. in the scope of the provisions related to indexation, or declaring that the agreements in question are invalid in whole, or finding that the provisions of the agreement related to indexation are invalid in the scope where indexation of over 20% and below 20% of the value of the CHF exchange rate from the table of exchange rates of mBank S.A.
from the date of conclusion of each of the loan agreements was permitted. The statement of claim in question was served on mBank on 13 June 2016, the time limit for filing a response expires on 13 August 2016. The date of the first court hearing was set by the Regional Court for 31 August 2016. At the hearing the court agreed with the Bank which objected that the statements on joining the class submitted by the class members were erroneous. The court set a 60-day time limit for the claimants to submit correct statements. The date of the next hearing was set for 19 December 2016. The plaintiff
corrected the formal defects by 19 December 2016. At the hearing the Court decided that the case would proceed as a class action and dismissed the Bank’s application for establishing a cash deposit. In the coming days the Bank will file a complaint against the decision that the case is to proceed as a class action.
As at 31 December 2016, the Bank was not involved in any proceedings before a court, arbitration body, or public administration authority concerning receivables of the Bank or its subsidiaries, which represent at least 10% of the Bank’s equity. The total value of claims concerning receivables of the Bank or its
subsidiaries in all proceedings before a court, an arbitration body or a public administration authority underway at 31 December 2016 was also not higher than 10% of the Bank’s equity.
Information regarding tax audits
From 13 June 2016 to 13 September 2016, the French tax authority conducted tax audit in the company mFinance France in terms of the regularity of tax settlements (including CIT and VAT) for the period from 1 January 2013 to 31 December 2015. The audit did not identify any irregularities.
Within the period from 12 April 2016 to 17 June 2016, the First Mazovian Treasury Office in Warsaw
(Pierwszy Mazowiecki Urząd Skarbowy w Warszawie) carried out control in terms of the legitimacy of tax on goods and services refund in mLeasing Sp. z o. o. for the fourth quarter of 2015. The audit did not identify any relevant irregularities.
On 29 January 2016 mLeasing received a notification of the intention to open an enquiry and an authorisation for the Head of the Treasury Control Office in Warsaw to conduct an enquiry into the
reliability of the declared tax bases and the correctness of the calculation and payment of tax on goods
and services for Q2 2014. The enquiry aims at determining whether the Company is an obligated institution under the Act of 16 November 2000 on Counteracting Money Laundering and Terrorism Financing; if mLeasing is given the status of an obligated institution, the enquiry will also cover its compliance with the obligations arising from the aforesaid act. The enquiry is in progress.
Within the period from 4 to 25 January 2016, Director of the Social Insurance Institution (Zakład Ubezpieczeń Społecznych) conducted an inspection in mLocum S.A. concerning, i.a. the correctness and accuracy of calculating the social security contributions, reporting to the social insurance and health
insurance for the years 2012, 2013 and 2014. The audit did not identify any relevant irregularities.
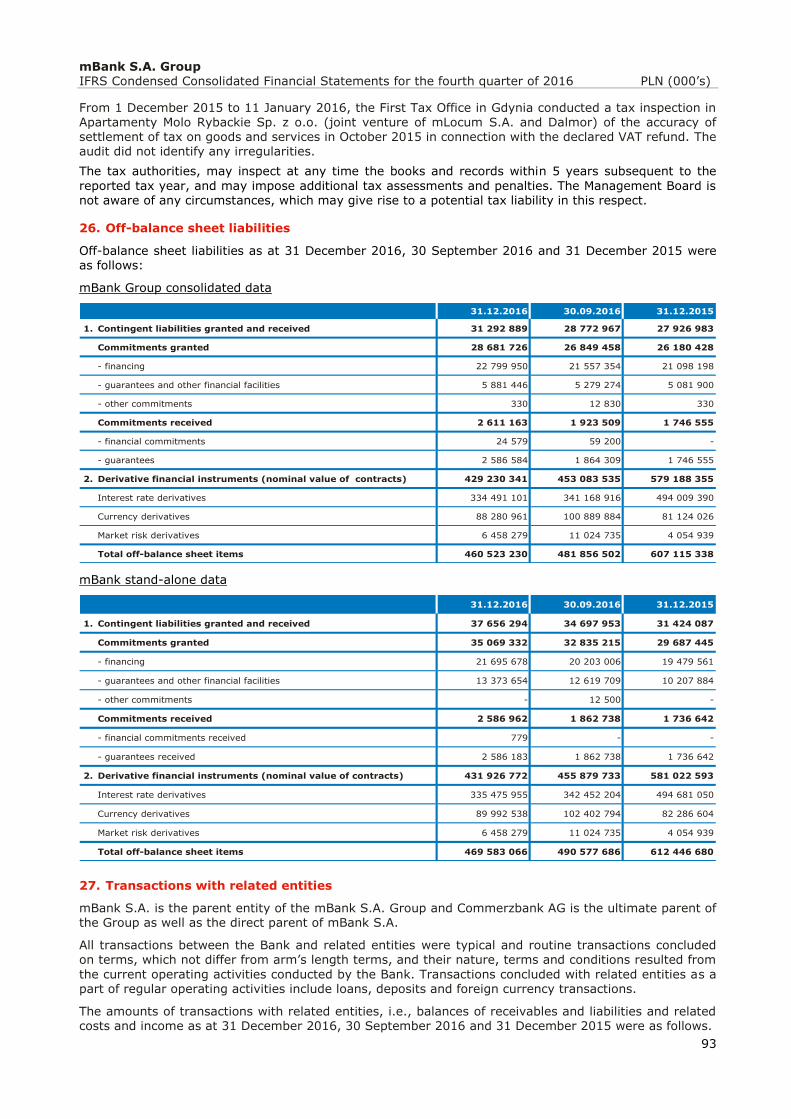
mBank S.A. Group IFRS Condensed Consolidated Financial Statements for the fourth quarter of 2016 PLN (000’s)
93
From 1 December 2015 to 11 January 2016, the First Tax Office in Gdynia conducted a tax inspection in
Apartamenty Molo Rybackie Sp. z o.o. (joint venture of mLocum S.A. and Dalmor) of the accuracy of settlement of tax on goods and services in October 2015 in connection with the declared VAT refund. The audit did not identify any irregularities.
The tax authorities, may inspect at any time the books and records within 5 years subsequent to the
reported tax year, and may impose additional tax assessments and penalties. The Management Board is not aware of any circumstances, which may give rise to a potential tax liability in this respect.
26. Off-balance sheet liabilities
Off-balance sheet liabilities as at 31 December 2016, 30 September 2016 and 31 December 2015 were as follows:
mBank Group consolidated data
mBank stand-alone data
27. Transactions with related entities
mBank S.A. is the parent entity of the mBank S.A. Group and Commerzbank AG is the ultimate parent of the Group as well as the direct parent of mBank S.A.
All transactions between the Bank and related entities were typical and routine transactions concluded on terms, which not differ from arm’s length terms, and their nature, terms and conditions resulted from
the current operating activities conducted by the Bank. Transactions concluded with related entities as a part of regular operating activities include loans, deposits and foreign currency transactions.
The amounts of transactions with related entities, i.e., balances of receivables and liabilities and related costs and income as at 31 December 2016, 30 September 2016 and 31 December 2015 were as follows.
31.12.2016 30.09.2016 31.12.2015
1. Contingent liabilities granted and received 31 292 889 28 772 967 27 926 983
Commitments granted 28 681 726 26 849 458 26 180 428
- financing 22 799 950 21 557 354 21 098 198
- guarantees and other financial facilities 5 881 446 5 279 274 5 081 900
- other commitments 330 12 830 330
Commitments received 2 611 163 1 923 509 1 746 555
- financial commitments 24 579 59 200 -
- guarantees 2 586 584 1 864 309 1 746 555
2. Derivative financial instruments (nominal value of contracts) 429 230 341 453 083 535 579 188 355
Interest rate derivatives 334 491 101 341 168 916 494 009 390
Currency derivatives 88 280 961 100 889 884 81 124 026
Market risk derivatives 6 458 279 11 024 735 4 054 939
Total off-balance sheet items 460 523 230 481 856 502 607 115 338
31.12.2016 30.09.2016 31.12.2015
1. Contingent liabilities granted and received 37 656 294 34 697 953 31 424 087
Commitments granted 35 069 332 32 835 215 29 687 445
- financing 21 695 678 20 203 006 19 479 561
- guarantees and other financial facilities 13 373 654 12 619 709 10 207 884
- other commitments - 12 500 -
Commitments received 2 586 962 1 862 738 1 736 642
- financial commitments received 779 - -
- guarantees received 2 586 183 1 862 738 1 736 642
2. Derivative financial instruments (nominal value of contracts) 431 926 772 455 879 733 581 022 593
Interest rate derivatives 335 475 955 342 452 204 494 681 050
Currency derivatives 89 992 538 102 402 794 82 286 604
Market risk derivatives 6 458 279 11 024 735 4 054 939
Total off-balance sheet items 469 583 066 490 577 686 612 446 680
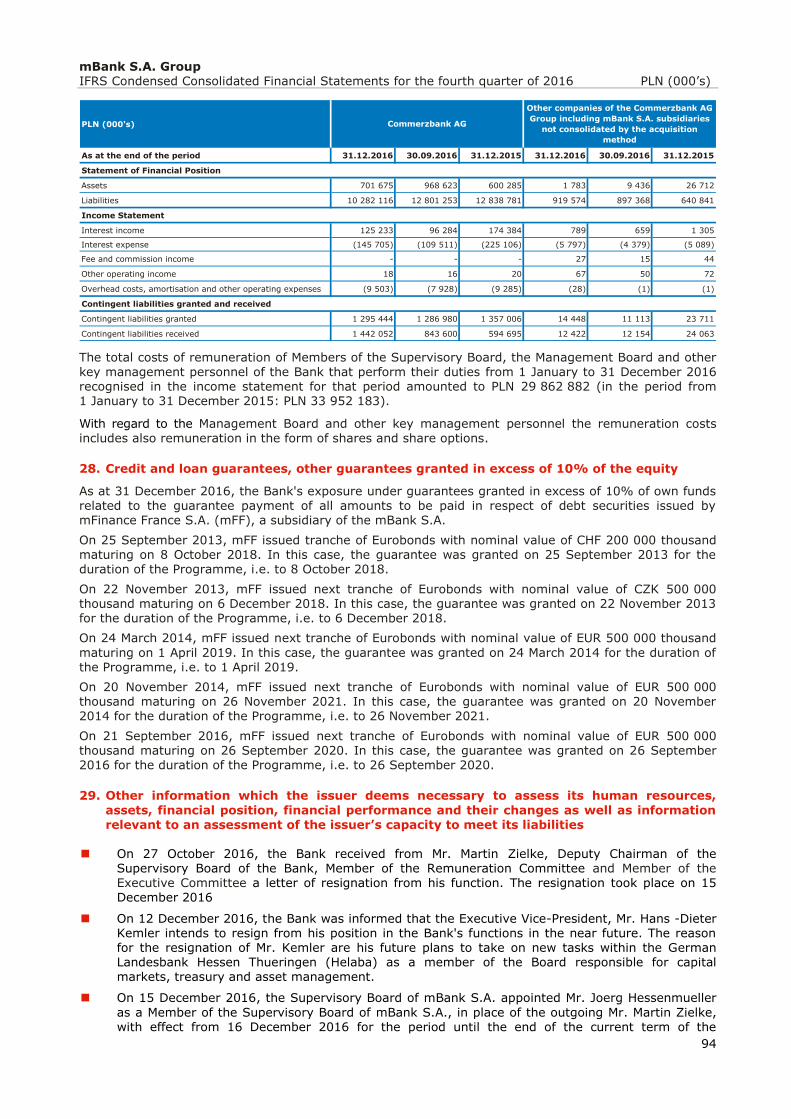
mBank S.A. Group IFRS Condensed Consolidated Financial Statements for the fourth quarter of 2016 PLN (000’s)
94
The total costs of remuneration of Members of the Supervisory Board, the Management Board and other
key management personnel of the Bank that perform their duties from 1 January to 31 December 2016 recognised in the income statement for that period amounted to PLN 29 862 882 (in the period from 1 January to 31 December 2015: PLN 33 952 183).
With regard to the Management Board and other key management personnel the remuneration costs includes also remuneration in the form of shares and share options.
28. Credit and loan guarantees, other guarantees granted in excess of 10% of the equity
As at 31 December 2016, the Bank's exposure under guarantees granted in excess of 10% of own funds related to the guarantee payment of all amounts to be paid in respect of debt securities issued by mFinance France S.A. (mFF), a subsidiary of the mBank S.A.
On 25 September 2013, mFF issued tranche of Eurobonds with nominal value of CHF 200 000 thousand maturing on 8 October 2018. In this case, the guarantee was granted on 25 September 2013 for the duration of the Programme, i.e. to 8 October 2018.
On 22 November 2013, mFF issued next tranche of Eurobonds with nominal value of CZK 500 000 thousand maturing on 6 December 2018. In this case, the guarantee was granted on 22 November 2013 for the duration of the Programme, i.e. to 6 December 2018.
On 24 March 2014, mFF issued next tranche of Eurobonds with nominal value of EUR 500 000 thousand
maturing on 1 April 2019. In this case, the guarantee was granted on 24 March 2014 for the duration of the Programme, i.e. to 1 April 2019.
On 20 November 2014, mFF issued next tranche of Eurobonds with nominal value of EUR 500 000 thousand maturing on 26 November 2021. In this case, the guarantee was granted on 20 November 2014 for the duration of the Programme, i.e. to 26 November 2021.
On 21 September 2016, mFF issued next tranche of Eurobonds with nominal value of EUR 500 000 thousand maturing on 26 September 2020. In this case, the guarantee was granted on 26 September 2016 for the duration of the Programme, i.e. to 26 September 2020.
29. Other information which the issuer deems necessary to assess its human resources,
assets, financial position, financial performance and their changes as well as information relevant to an assessment of the issuer’s capacity to meet its liabilities
On 27 October 2016, the Bank received from Mr. Martin Zielke, Deputy Chairman of the Supervisory Board of the Bank, Member of the Remuneration Committee and Member of the
Executive Committee a letter of resignation from his function. The resignation took place on 15 December 2016
On 12 December 2016, the Bank was informed that the Executive Vice-President, Mr. Hans -Dieter Kemler intends to resign from his position in the Bank's functions in the near future. The reason for the resignation of Mr. Kemler are his future plans to take on new tasks within the German Landesbank Hessen Thueringen (Helaba) as a member of the Board responsible for capital markets, treasury and asset management.
On 15 December 2016, the Supervisory Board of mBank S.A. appointed Mr. Joerg Hessenmueller
as a Member of the Supervisory Board of mBank S.A., in place of the outgoing Mr. Martin Zielke, with effect from 16 December 2016 for the period until the end of the current term of the
PLN (000's)
As at the end of the period 31.12.2016 30.09.2016 31.12.2015 31.12.2016 30.09.2016 31.12.2015
Statement of Financial Position
Assets 701 675 968 623 600 285 1 783 9 436 26 712
Liabilities 10 282 116 12 801 253 12 838 781 919 574 897 368 640 841
Income Statement
Interest income 125 233 96 284 174 384 789 659 1 305
Interest expense (145 705) (109 511) (225 106) (5 797) (4 379) (5 089)
Fee and commission income - - - 27 15 44
Other operating income 18 16 20 67 50 72
Overhead costs, amortisation and other operating expenses (9 503) (7 928) (9 285) (28) (1) (1)
Contingent liabilities granted and received
Contingent liabilities granted 1 295 444 1 286 980 1 357 006 14 448 11 113 23 711
Contingent liabilities received 1 442 052 843 600 594 695 12 422 12 154 24 063
Other companies of the Commerzbank AG
Group including mBank S.A. subsidiaries
not consolidated by the acquisition
method
Commerzbank AG
mBank S.A. Group IFRS Condensed Consolidated Financial Statements for the fourth quarter of 2016 PLN (000’s)
95
Supervisory Board. In the period from April 2012 to June 2016, Mr. Joerg Hessenmueller was the
member of the Management Board of mBank S.A. responsible for the area of finance. Since July 2016, he has been the Managing Director of the Commerzbank Group, responsible for Group Management Development & Strategy.
30. Factors affecting the results in the coming quarter
Entering into force on 1 February 2016 of the "Act on Tax on Certain Financial Institutions", specified in the item 4 above will have a significant negative impact on the financial results of the Bank and the Group in following quarters.
In addition, according to the Act of 10 June 2016 on the Bank Guarantee Fund (BFG), Deposit Guarantee Scheme and Resolution, and in conjunction with the BFG letter dated on 19 January 2017 and addressed to the Polish Bank Association, in the first quarter of 2017 the Group will account the full amount of the annual costs associated with the estimated amount of the contribution to the resolution fund for 2017.
31. Other information
Proposals concerning foreign currency mortgage loans restructuring
Some proposals of restructuring of foreign currency mortgage loans for individuals have been discussed recently, including the solutions presented by the Chancellery of the President of the Republic of Poland.
At its meeting starting on October 19, 2016, the Sejm of the Republic of Poland has begun work on three draft laws governing in different ways the above issue: presented by the President of the Republic of Poland draft law on the principles of reimbursement of certain claims arising from credit and loan agreements and parliamentary drafts of law on restructuring loans denominated in or indexed to a currency other than the Polish currency and to prohibiting granting of such loans and of law on special rules for the restructuring of foreign currency mortgage loans due to changes in foreign currency exchange rates in relation to the Polish currency. At the moment of these financial statements
publication the final form of the proposed solutions is not known yet. Therefore, at the moment, the Bank is not able to estimate reliably either the implementation probability of the discussed solutions or the potential impact of the final solutions on the financial statements of the Bank and the mBank Group.
Recommendations of the Polish Financial Supervision Authority (KNF) regarding additional capital
requirements
On 4 October 2016, Polish Financial Supervision Authority identified mBank S.A. as other systemically important institution and imposed on the Bank - on an individual and consolidated basis - the other
systemically important institution buffer equivalent to 0.5% of the total risk exposure, calculated in accordance with Article 92 (3) of CRR Regulation.
On 20 October 2016, the Bank received the KNF decision concerning the maintenance of mBank S.A. own funds, on the individual basis, to cover the additional capital requirement securing the risk related
to the foreign currency mortgage loans for households at the level of 3.81 p.p. above the total capital ratio level defined in article 92 item 1 letter c of the CRR Regulation, which should be covered at least in 75% by Tier 1 capital (equivalent to capital requirement of 2.86 p.p. above the level of Tier 1 capital ratio defined in article 92 item 1 letter b of the CRR Regulation) and at least in 56% by Common Equity Tier 1 capital (equivalent to capital requirement of 2.13 p.p. above the level of Common Equity Tier 1 capital ratio defined in article 92 item 1 letter a of the CRR Regulation). Earlier, mBank S.A. maintained its own funds covering additional capital requirement securing the risk related to the foreign currency
mortgage loans for households at the level of 4.39 p.p. on the individual basis, covered at least in 75% by Tier 1 capital (equivalent to 3.29 p.p.).
On 15 December 2016, the Bank received the KNF decision concerning the maintenance of mBank S.A. own funds, on the consolidated basis, to cover the additional capital requirement securing the risk related to the foreign currency mortgage loans for households at the level of 3.25 p.p. above the total
capital ratio. Simultaneously, for the Tier 1 capital ratio and Common Equity Tier 1 capital ratio
additional capital requirement amounts to 2.44 p.p. and 1.82 p.p. respectively. Earlier, mBank S.A. maintained its own funds covering additional capital requirement securing the risk related to the foreign currency mortgage loans for households at the level of 3.72 p.p. on the consolidated basis, covered at least in 75% by Tier 1 capital (equivalent to 2.79 p.p.). The KNF also informed that the recommended by the KNF minimum capital ratios for mBank S.A., on the individual basis, amount to 13.61% for the Tier 1 capital ratio and 17.56% for the total capital ratio, while on the consolidated basis, the minimum capital ratios amount to 13.19% for the Tier 1 capital ratio and 17.00% for the total capital ratio.
At the date of publication of these financial statements, mBank S.A. fulfils the KNF requirements related to the minimum capital ratios on both individual and consolidated levels.

mBank S.A. Group IFRS Condensed Consolidated Financial Statements for the fourth quarter of 2016 PLN (000’s)
96
Date First and last
name Position Signature
8.02.2017 Cezary
Stypułkowski
President of the
Management Board
8.02.2017 Lidia Jabłonowska-
Luba
Vice-President of the
Management Board,
Chief Risk Officer
8.02.2017 Przemysław
Gdański
Vice President of the
Management Board,
Head of Corporate &
Investment Banking
8.02.2017 Christoph Heins
Vice-President of the
Management Board,
Chief Financial Officer
8.02.2017 Hans-Dieter Kemler
Vice-President of the
Management Board,
Head of Financial
Markets
8.02.2017 Cezary Kocik
Vice-President of the
Management Board,
Head of Retail Banking
8.02.2017 Jarosław Mastalerz
Vice-President of the
Management Board,
Head of Operations and
IT