september 30, 2014 unaudited condensed consolidated
TRANSCRIPT
September 30, 2014 Unaudited Condensed Consolidated Financial Statements Suite 1188, 550 Burrard Street Vancouver, British Columbia V6C 2B5 Phone: (604) 687-4018 Fax: (604) 687-4026
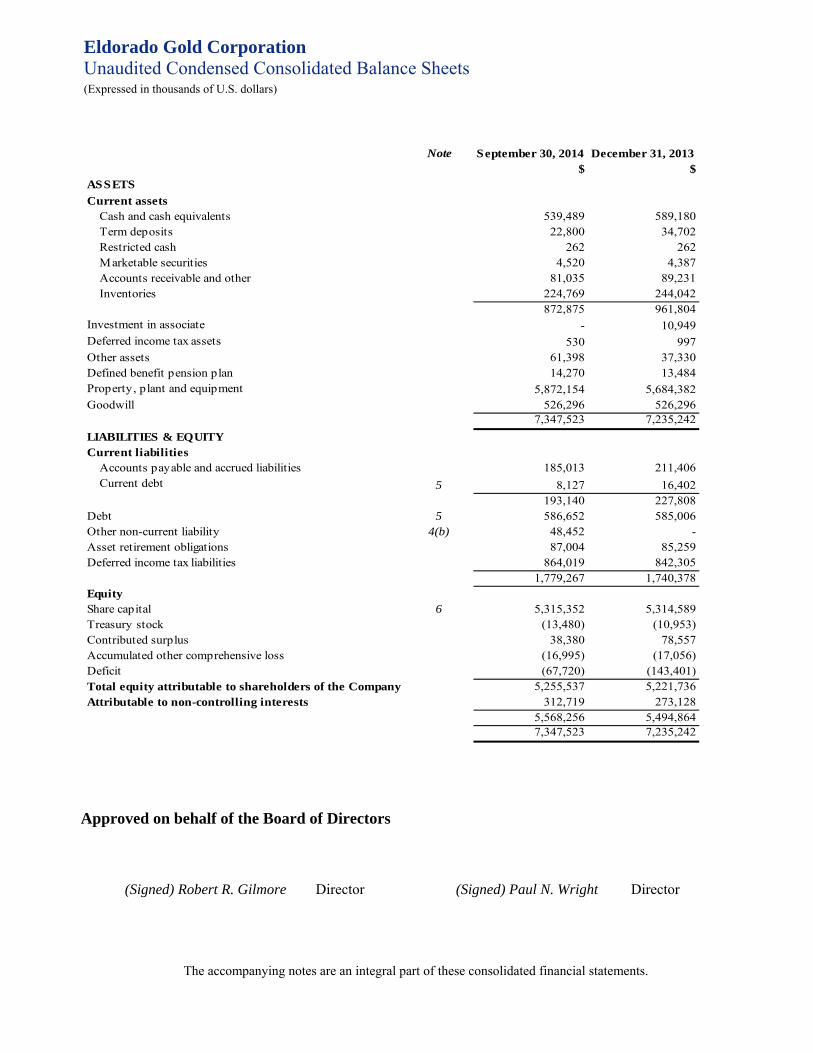
Eldorado Gold Corporation Unaudited Condensed Consolidated Balance Sheets (Expressed in thousands of U.S. dollars)
$ $
539,489 589,180 22,800 34,702 262 262 4,520 4,387 81,035 89,231 224,769 244,042 872,875 961,804 - 10,949 530 997 61,398 37,330 14,270 13,484 5,872,154 5,684,382 526,296 526,296 7,347,523 7,235,242
185,013 211,406 5 8,127 16,402
193,140 227,808 5 586,652 585,006
4(b) 48,452 - 87,004 85,259 864,019 842,305 1,779,267 1,740,378
6 5,315,352 5,314,589 (13,480) (10,953) 38,380 78,557 (16,995) (17,056) (67,720) (143,401) 5,255,537 5,221,736 312,719 273,128 5,568,256 5,494,864 7,347,523 7,235,242
December 31, 2013September 30, 2014
Current assets
Inventories
ASSETS
Cash and cash equivalents
Note
Investment in associate
LIABILITIES & EQUITY
Debt
Total equity attributable to shareholders of the CompanyAttributable to non-controlling interests
Accumulated other comprehensive lossDeficit
Deferred income tax liabilities
Equity
Treasury stockContributed surplus
Term deposits
Accounts receivable and other
Restricted cash Marketable securities
Share capital
Accounts payable and accrued liabilitiesCurrent debt
Goodwill
Other non-current liabilityAsset retirement obligations
Defined benefit pension planOther assets
Property, plant and equipment
Current liabilities
Deferred income tax assets
The accompanying notes are an integral part of these consolidated financial statements.
Approved on behalf of the Board of Directors
(Signed) Robert R. Gilmore Director (Signed) Paul N. Wright Director
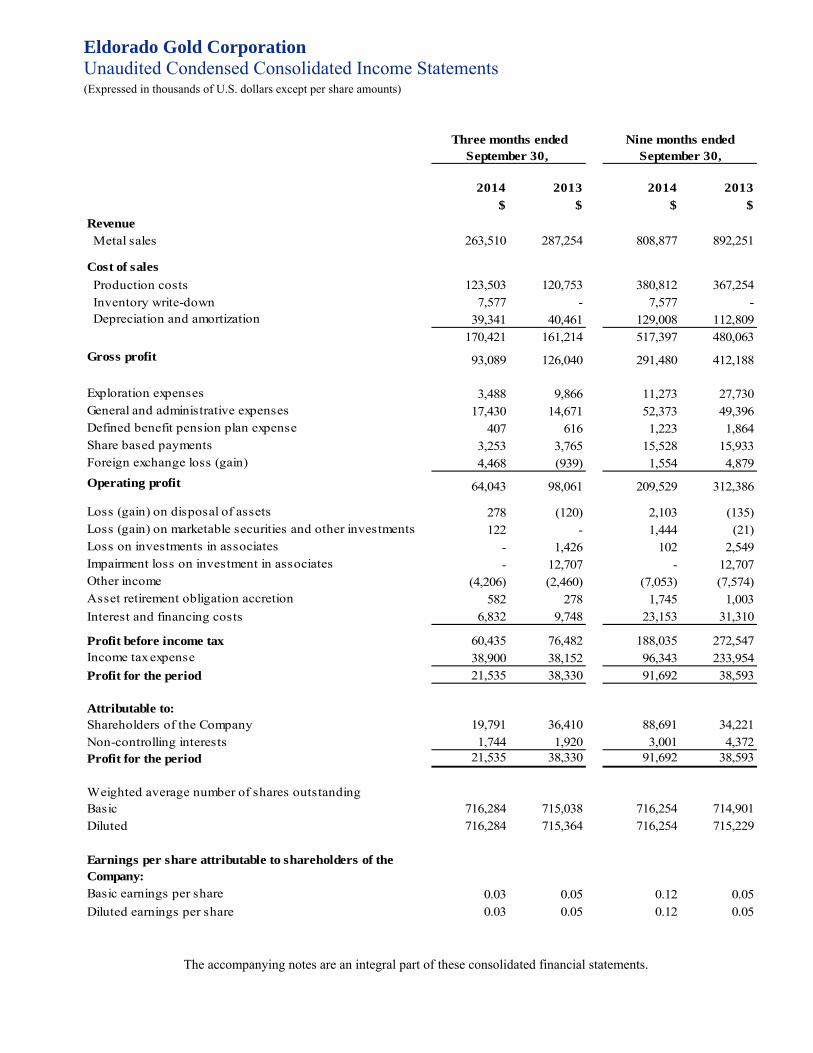
Eldorado Gold Corporation Unaudited Condensed Consolidated Income Statements
(Expressed in thousands of U.S. dollars except per share amounts)
2014 2013 2014 2013$ $ $ $
263,510 287,254 808,877 892,251
123,503 120,753 380,812 367,254 7,577 - 7,577 - 39,341 40,461 129,008 112,809 170,421 161,214 517,397 480,063
93,089 126,040 291,480 412,188
3,488 9,866 11,273 27,730 17,430 14,671 52,373 49,396 407 616 1,223 1,864 3,253 3,765 15,528 15,933 4,468 (939) 1,554 4,879
64,043 98,061 209,529 312,386
278 (120) 2,103 (135) 122 - 1,444 (21) - 1,426 102 2,549 - 12,707 - 12,707
(4,206) (2,460) (7,053) (7,574) 582 278 1,745 1,003 6,832 9,748 23,153 31,310
60,435 76,482 188,035 272,547 38,900 38,152 96,343 233,954 21,535 38,330 91,692 38,593
19,791 36,410 88,691 34,221 1,744 1,920 3,001 4,372 21,535 38,330 91,692 38,593
Weighted average number of shares outstandingBasic 716,284 715,038 716,254 714,901Diluted 716,284 715,364 716,254 715,229
0.03 0.05 0.12 0.05 0.03 0.05 0.12 0.05
Inventory write-down
Diluted earnings per share
Production costs
Loss (gain) on disposal of assets
Loss on investments in associates
Income tax expenseProfit for the period
Operating profit
General and administrative expensesDefined benefit pension plan expenseShare based paymentsForeign exchange loss (gain)
Profit before income tax
Asset retirement obligation accretionInterest and financing costs
Three months ended Nine months endedSeptember 30, September 30,
Revenue
Basic earnings per share
Profit for the period
Earnings per share attributable to shareholders of the Company:
Metal sales
Cost of sales
Depreciation and amortization
Gross profit
Exploration expenses
Other income
Loss (gain) on marketable securities and other investments
Non-controlling interestsShareholders of the CompanyAttributable to:
Impairment loss on investment in associates
The accompanying notes are an integral part of these consolidated financial statements.
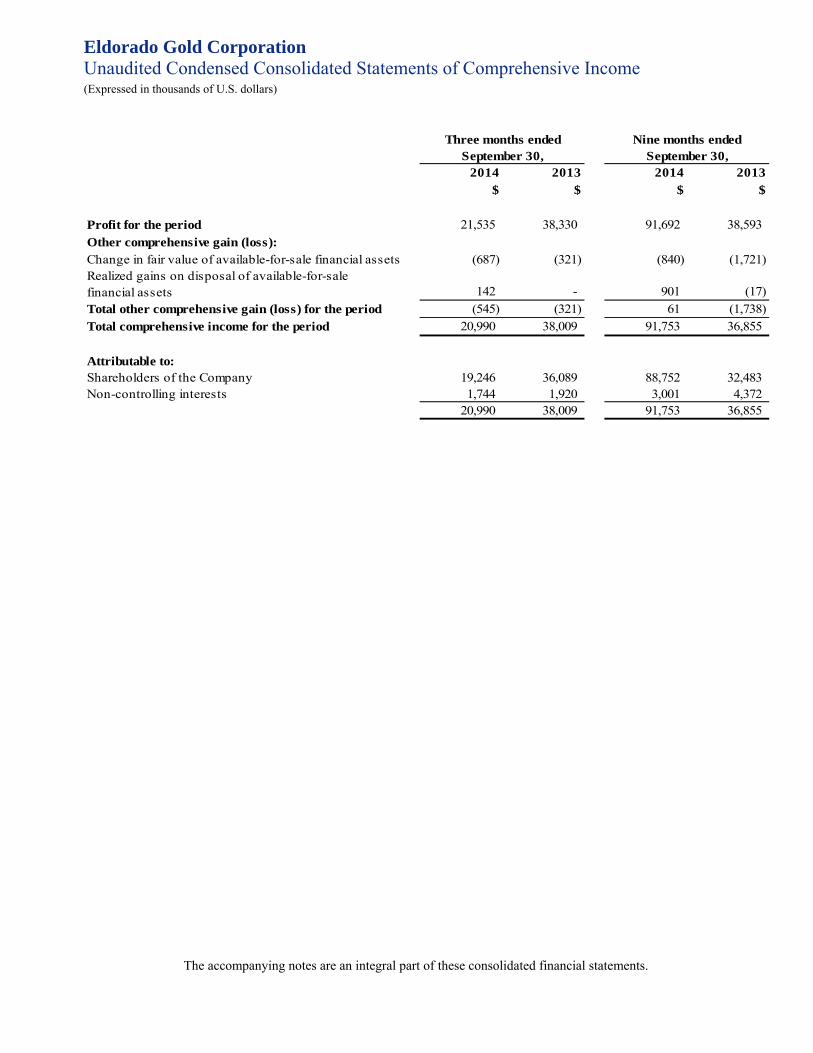
Eldorado Gold Corporation Unaudited Condensed Consolidated Statements of Comprehensive Income (Expressed in thousands of U.S. dollars)
2014 2013 2014 2013$ $ $ $
Profit for the period 21,535 38,330 91,692 38,593 Other comprehensive gain (loss):
(687) (321) (840) (1,721) Realized gains on disposal of available-for-sale financial assets 142 - 901 (17) Total other comprehensive gain (loss) for the period (545) (321) 61 (1,738) Total comprehensive income for the period 20,990 38,009 91,753 36,855
Attributable to:Shareholders of the Company 19,246 36,089 88,752 32,483 Non-controlling interests 1,744 1,920 3,001 4,372
20,990 38,009 91,753 36,855
Change in fair value of available-for-sale financial assets
Three months ended Nine months endedSeptember 30, September 30,
The accompanying notes are an integral part of these consolidated financial statements.
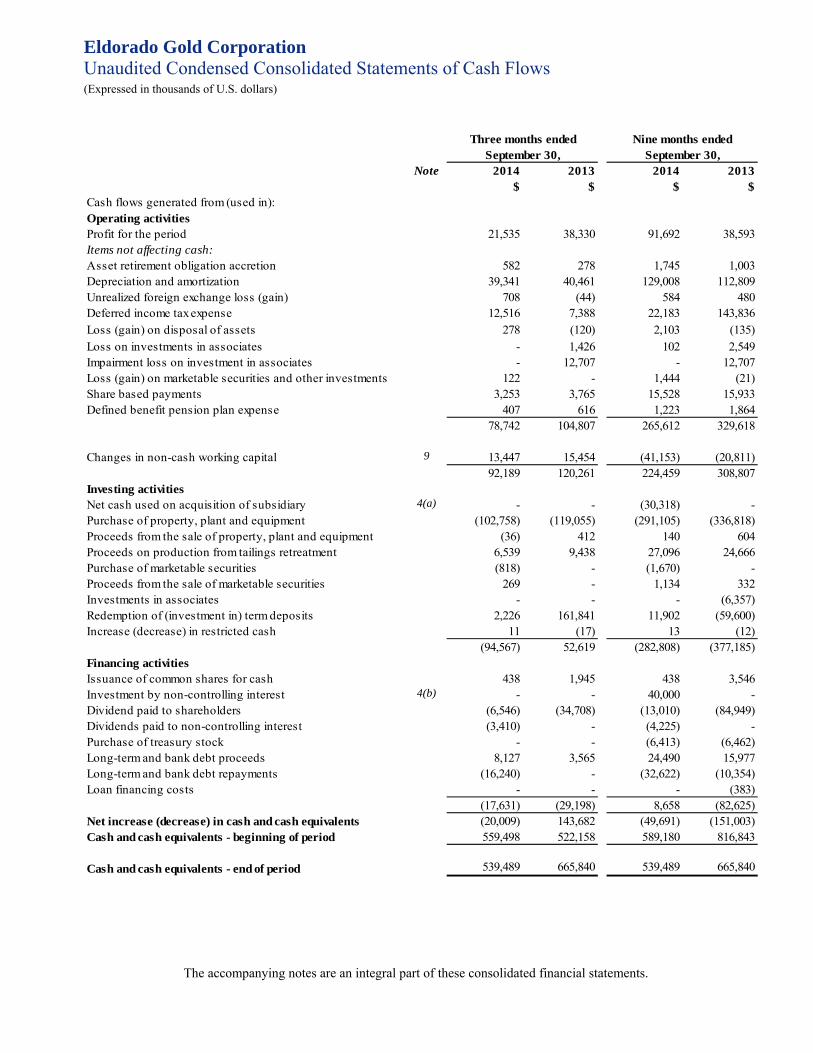
Eldorado Gold Corporation Unaudited Condensed Consolidated Statements of Cash Flows (Expressed in thousands of U.S. dollars)
Note 2014 2013 2014 2013 $ $ $ $
Cash flows generated from (used in):Operating activitiesProfit for the period 21,535 38,330 91,692 38,593 Items not affecting cash:Asset retirement obligation accretion 582 278 1,745 1,003 Depreciation and amortization 39,341 40,461 129,008 112,809 Unrealized foreign exchange loss (gain) 708 (44) 584 480 Deferred income tax expense 12,516 7,388 22,183 143,836 Loss (gain) on disposal of assets 278 (120) 2,103 (135)Loss on investments in associates - 1,426 102 2,549 Impairment loss on investment in associates - 12,707 - 12,707 Loss (gain) on marketable securities and other investments 122 - 1,444 (21)Share based payments 3,253 3,765 15,528 15,933 Defined benefit pension plan expense 407 616 1,223 1,864
78,742 104,807 265,612 329,618
Changes in non-cash working capital 9 13,447 15,454 (41,153) (20,811) 92,189 120,261 224,459 308,807
Investing activitiesNet cash used on acquisition of subsidiary 4(a) - - (30,318) - Purchase of property, plant and equipment (102,758) (119,055) (291,105) (336,818)
(36) 412 140 604 Proceeds on production from tailings retreatment 6,539 9,438 27,096 24,666 Purchase of marketable securities (818) - (1,670) - Proceeds from the sale of marketable securities 269 - 1,134 332 Investments in associates - - - (6,357)Redemption of (investment in) term deposits 2,226 161,841 11,902 (59,600)Increase (decrease) in restricted cash 11 (17) 13 (12)
(94,567) 52,619 (282,808) (377,185)Financing activitiesIssuance of common shares for cash 438 1,945 438 3,546 Investment by non-controlling interest 4(b) - - 40,000 - Dividend paid to shareholders (6,546) (34,708) (13,010) (84,949)Dividends paid to non-controlling interest (3,410) - (4,225) - Purchase of treasury stock - - (6,413) (6,462)Long-term and bank debt proceeds 8,127 3,565 24,490 15,977 Long-term and bank debt repayments (16,240) - (32,622) (10,354)Loan financing costs - - - (383)
(17,631) (29,198) 8,658 (82,625)Net increase (decrease) in cash and cash equivalents (20,009) 143,682 (49,691) (151,003)Cash and cash equivalents - beginning of period 559,498 522,158 589,180 816,843
Cash and cash equivalents - end of period 539,489 665,840 539,489 665,840
Proceeds from the sale of property, plant and equipment
Three months ended Nine months endedSeptember 30, September 30,
The accompanying notes are an integral part of these consolidated financial statements.
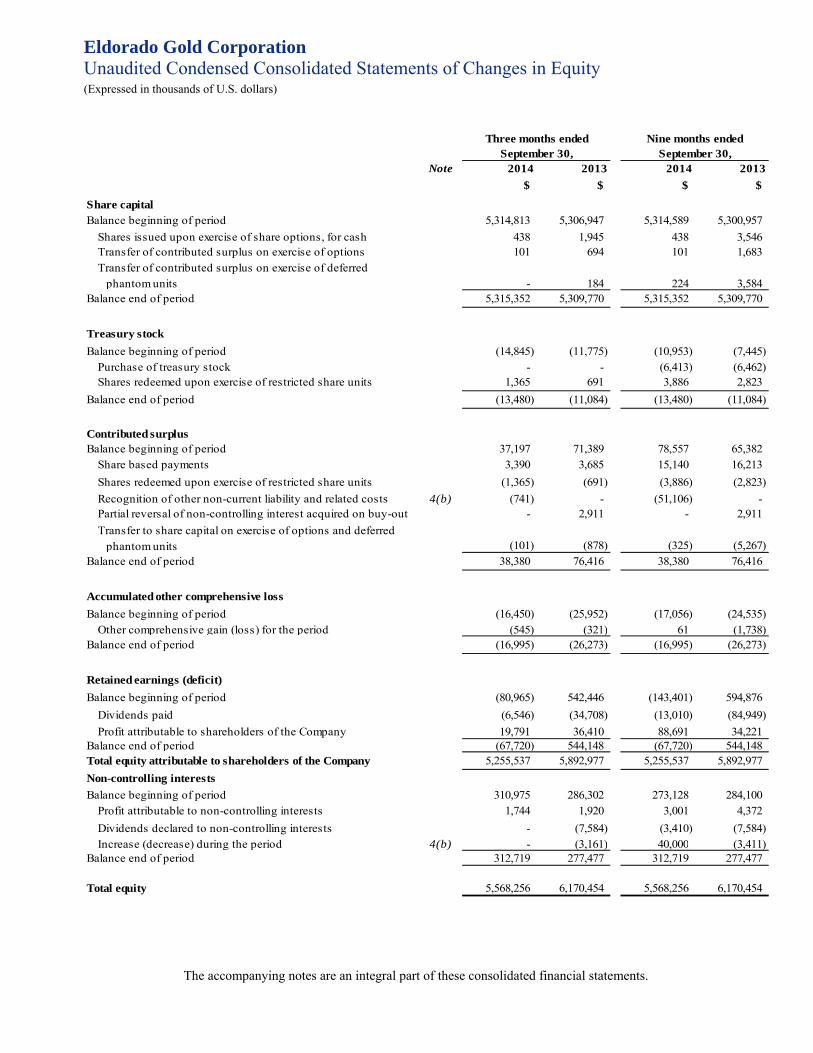
Eldorado Gold Corporation Unaudited Condensed Consolidated Statements of Changes in Equity (Expressed in thousands of U.S. dollars)
Note 2014 2013 2014 2013$ $ $ $
Share capital Balance beginning of period 5,314,813 5,306,947 5,314,589 5,300,957
Shares issued upon exercise of share options, for cash 438 1,945 438 3,546 Transfer of contributed surplus on exercise of options 101 694 101 1,683 Transfer of contributed surplus on exercise of deferred phantom units - 184 224 3,584
Balance end of period 5,315,352 5,309,770 5,315,352 5,309,770
Treasury stockBalance beginning of period (14,845) (11,775) (10,953) (7,445)
Purchase of treasury stock - - (6,413) (6,462) Shares redeemed upon exercise of restricted share units 1,365 691 3,886 2,823
Balance end of period (13,480) (11,084) (13,480) (11,084)
Contributed surplusBalance beginning of period 37,197 71,389 78,557 65,382
Share based payments 3,390 3,685 15,140 16,213 Shares redeemed upon exercise of restricted share units (1,365) (691) (3,886) (2,823) Recognition of other non-current liability and related costs 4(b) (741) - (51,106) - Partial reversal of non-controlling interest acquired on buy-out - 2,911 - 2,911 Transfer to share capital on exercise of options and deferred phantom units (101) (878) (325) (5,267)
Balance end of period 38,380 76,416 38,380 76,416
Accumulated other comprehensive lossBalance beginning of period (16,450) (25,952) (17,056) (24,535)
Other comprehensive gain (loss) for the period (545) (321) 61 (1,738) Balance end of period (16,995) (26,273) (16,995) (26,273)
Retained earnings (deficit)Balance beginning of period (80,965) 542,446 (143,401) 594,876
Dividends paid (6,546) (34,708) (13,010) (84,949) Profit attributable to shareholders of the Company 19,791 36,410 88,691 34,221
Balance end of period (67,720) 544,148 (67,720) 544,148 Total equity attributable to shareholders of the Company 5,255,537 5,892,977 5,255,537 5,892,977 Non-controlling interestsBalance beginning of period 310,975 286,302 273,128 284,100
Profit attributable to non-controlling interests 1,744 1,920 3,001 4,372 Dividends declared to non-controlling interests - (7,584) (3,410) (7,584) Increase (decrease) during the period 4(b) - (3,161) 40,000 (3,411)
Balance end of period 312,719 277,477 312,719 277,477
Total equity 5,568,256 6,170,454 5,568,256 6,170,454
Three months ended Nine months endedSeptember 30, September 30,
The accompanying notes are an integral part of these consolidated financial statements.
Eldorado Gold Corporation Notes to the unaudited condensed consolidated financial statements (Expressed in thousands of U.S. dollars, unless otherwise stated)
(1)
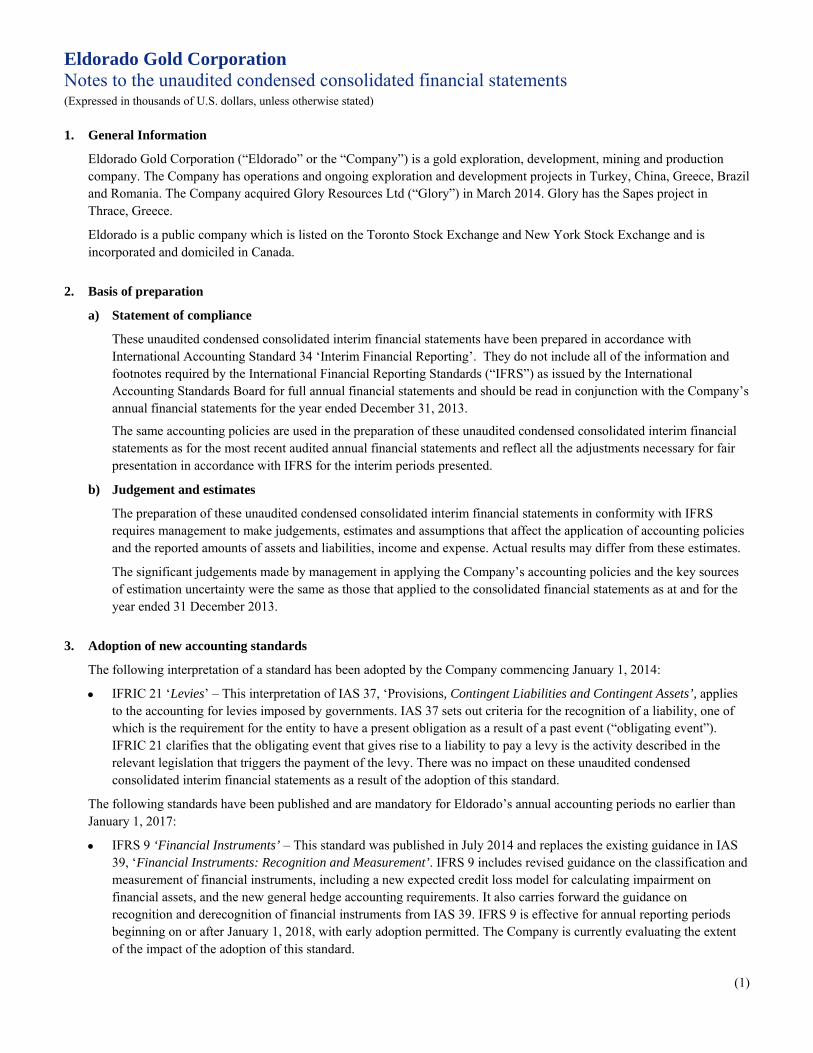
1. General Information
Eldorado Gold Corporation (“Eldorado” or the “Company”) is a gold exploration, development, mining and production company. The Company has operations and ongoing exploration and development projects in Turkey, China, Greece, Brazil and Romania. The Company acquired Glory Resources Ltd (“Glory”) in March 2014. Glory has the Sapes project in Thrace, Greece.
Eldorado is a public company which is listed on the Toronto Stock Exchange and New York Stock Exchange and is incorporated and domiciled in Canada.
2. Basis of preparation
a) Statement of compliance
These unaudited condensed consolidated interim financial statements have been prepared in accordance with International Accounting Standard 34 ‘Interim Financial Reporting’. They do not include all of the information and footnotes required by the International Financial Reporting Standards (“IFRS”) as issued by the International Accounting Standards Board for full annual financial statements and should be read in conjunction with the Company’s annual financial statements for the year ended December 31, 2013.
The same accounting policies are used in the preparation of these unaudited condensed consolidated interim financial statements as for the most recent audited annual financial statements and reflect all the adjustments necessary for fair presentation in accordance with IFRS for the interim periods presented.
b) Judgement and estimates
The preparation of these unaudited condensed consolidated interim financial statements in conformity with IFRS requires management to make judgements, estimates and assumptions that affect the application of accounting policies and the reported amounts of assets and liabilities, income and expense. Actual results may differ from these estimates.
The significant judgements made by management in applying the Company’s accounting policies and the key sources of estimation uncertainty were the same as those that applied to the consolidated financial statements as at and for the year ended 31 December 2013.
3. Adoption of new accounting standards
The following interpretation of a standard has been adopted by the Company commencing January 1, 2014:
• IFRIC 21 ‘Levies’ – This interpretation of IAS 37, ‘Provisions, Contingent Liabilities and Contingent Assets’, applies to the accounting for levies imposed by governments. IAS 37 sets out criteria for the recognition of a liability, one of which is the requirement for the entity to have a present obligation as a result of a past event (“obligating event”). IFRIC 21 clarifies that the obligating event that gives rise to a liability to pay a levy is the activity described in the relevant legislation that triggers the payment of the levy. There was no impact on these unaudited condensed consolidated interim financial statements as a result of the adoption of this standard.
The following standards have been published and are mandatory for Eldorado’s annual accounting periods no earlier than January 1, 2017:
• IFRS 9 ‘Financial Instruments’ – This standard was published in July 2014 and replaces the existing guidance in IAS 39, ‘Financial Instruments: Recognition and Measurement’. IFRS 9 includes revised guidance on the classification and measurement of financial instruments, including a new expected credit loss model for calculating impairment on financial assets, and the new general hedge accounting requirements. It also carries forward the guidance on recognition and derecognition of financial instruments from IAS 39. IFRS 9 is effective for annual reporting periods beginning on or after January 1, 2018, with early adoption permitted. The Company is currently evaluating the extent of the impact of the adoption of this standard.
Eldorado Gold Corporation Notes to the unaudited condensed consolidated financial statements (Expressed in thousands of U.S. dollars, unless otherwise stated)
(2)
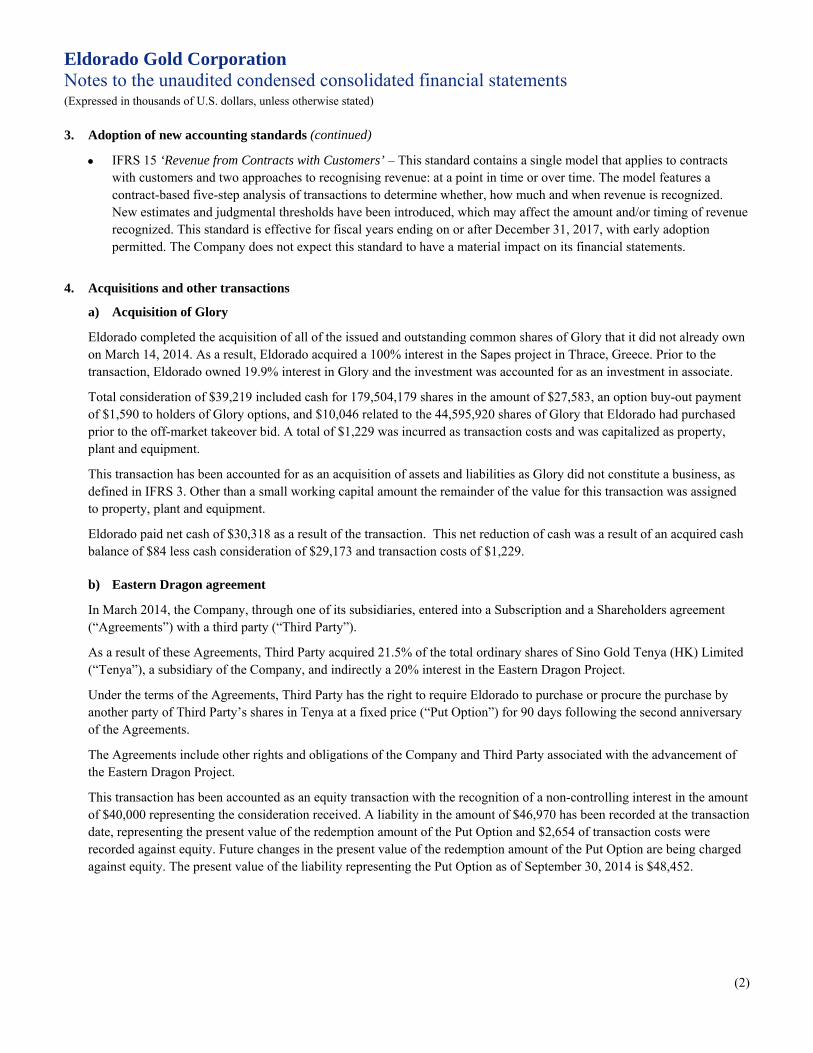
3. Adoption of new accounting standards (continued)
• IFRS 15 ‘Revenue from Contracts with Customers’ – This standard contains a single model that applies to contracts with customers and two approaches to recognising revenue: at a point in time or over time. The model features a contract-based five-step analysis of transactions to determine whether, how much and when revenue is recognized. New estimates and judgmental thresholds have been introduced, which may affect the amount and/or timing of revenue recognized. This standard is effective for fiscal years ending on or after December 31, 2017, with early adoption permitted. The Company does not expect this standard to have a material impact on its financial statements.
4. Acquisitions and other transactions
a) Acquisition of Glory
Eldorado completed the acquisition of all of the issued and outstanding common shares of Glory that it did not already own on March 14, 2014. As a result, Eldorado acquired a 100% interest in the Sapes project in Thrace, Greece. Prior to the transaction, Eldorado owned 19.9% interest in Glory and the investment was accounted for as an investment in associate.
Total consideration of $39,219 included cash for 179,504,179 shares in the amount of $27,583, an option buy-out payment of $1,590 to holders of Glory options, and $10,046 related to the 44,595,920 shares of Glory that Eldorado had purchased prior to the off-market takeover bid. A total of $1,229 was incurred as transaction costs and was capitalized as property, plant and equipment.
This transaction has been accounted for as an acquisition of assets and liabilities as Glory did not constitute a business, as defined in IFRS 3. Other than a small working capital amount the remainder of the value for this transaction was assigned to property, plant and equipment.
Eldorado paid net cash of $30,318 as a result of the transaction. This net reduction of cash was a result of an acquired cash balance of $84 less cash consideration of $29,173 and transaction costs of $1,229.
b) Eastern Dragon agreement
In March 2014, the Company, through one of its subsidiaries, entered into a Subscription and a Shareholders agreement (“Agreements”) with a third party (“Third Party”).
As a result of these Agreements, Third Party acquired 21.5% of the total ordinary shares of Sino Gold Tenya (HK) Limited (“Tenya”), a subsidiary of the Company, and indirectly a 20% interest in the Eastern Dragon Project.
Under the terms of the Agreements, Third Party has the right to require Eldorado to purchase or procure the purchase by another party of Third Party’s shares in Tenya at a fixed price (“Put Option”) for 90 days following the second anniversary of the Agreements.
The Agreements include other rights and obligations of the Company and Third Party associated with the advancement of the Eastern Dragon Project.
This transaction has been accounted as an equity transaction with the recognition of a non-controlling interest in the amount of $40,000 representing the consideration received. A liability in the amount of $46,970 has been recorded at the transaction date, representing the present value of the redemption amount of the Put Option and $2,654 of transaction costs were recorded against equity. Future changes in the present value of the redemption amount of the Put Option are being charged against equity. The present value of the liability representing the Put Option as of September 30, 2014 is $48,452.
Eldorado Gold Corporation Notes to the unaudited condensed consolidated financial statements (Expressed in thousands of U.S. dollars, unless otherwise stated)
(3)
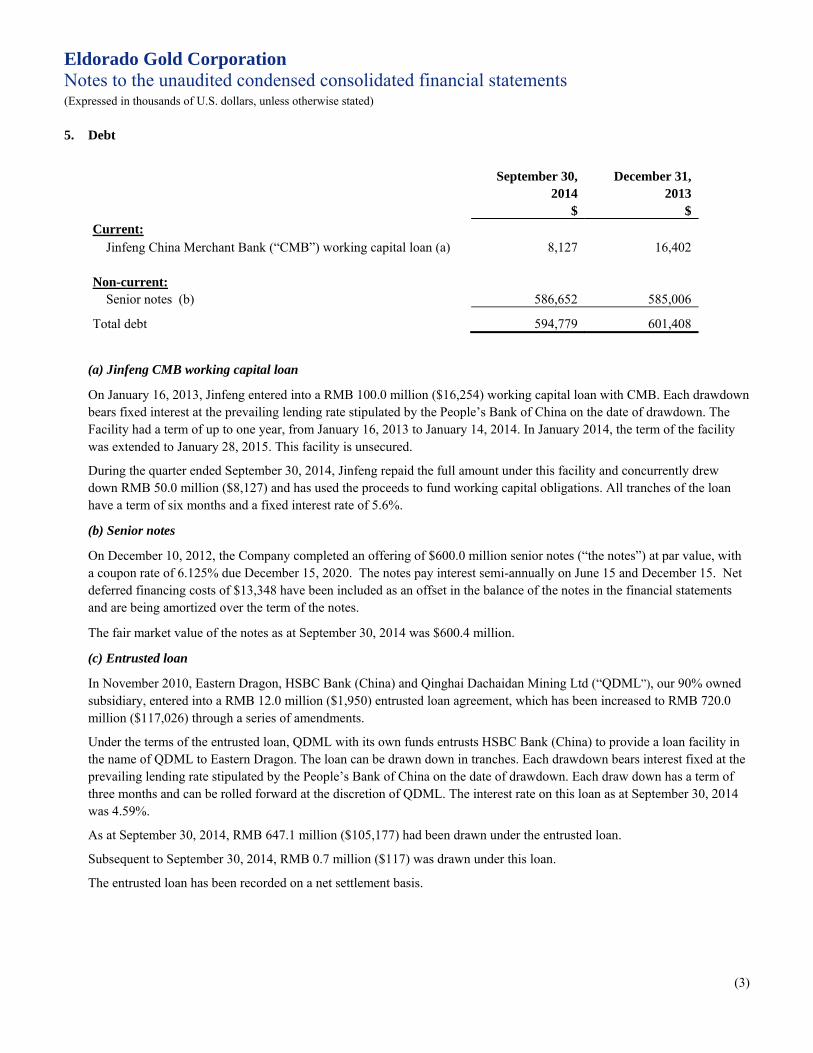
5. Debt
September 30,
2014 $
December 31, 2013
$ Current:
Jinfeng China Merchant Bank (“CMB”) working capital loan (a) 8,127 16,402
Non-current: Senior notes (b) 586,652 585,006
Total debt 594,779 601,408
(a) Jinfeng CMB working capital loan
On January 16, 2013, Jinfeng entered into a RMB 100.0 million ($16,254) working capital loan with CMB. Each drawdown bears fixed interest at the prevailing lending rate stipulated by the People’s Bank of China on the date of drawdown. The Facility had a term of up to one year, from January 16, 2013 to January 14, 2014. In January 2014, the term of the facility was extended to January 28, 2015. This facility is unsecured.
During the quarter ended September 30, 2014, Jinfeng repaid the full amount under this facility and concurrently drew down RMB 50.0 million ($8,127) and has used the proceeds to fund working capital obligations. All tranches of the loan have a term of six months and a fixed interest rate of 5.6%.
(b) Senior notes
On December 10, 2012, the Company completed an offering of $600.0 million senior notes (“the notes”) at par value, with a coupon rate of 6.125% due December 15, 2020. The notes pay interest semi-annually on June 15 and December 15. Net deferred financing costs of $13,348 have been included as an offset in the balance of the notes in the financial statements and are being amortized over the term of the notes.
The fair market value of the notes as at September 30, 2014 was $600.4 million.
(c) Entrusted loan
In November 2010, Eastern Dragon, HSBC Bank (China) and Qinghai Dachaidan Mining Ltd (“QDML”), our 90% owned subsidiary, entered into a RMB 12.0 million ($1,950) entrusted loan agreement, which has been increased to RMB 720.0 million ($117,026) through a series of amendments.
Under the terms of the entrusted loan, QDML with its own funds entrusts HSBC Bank (China) to provide a loan facility in the name of QDML to Eastern Dragon. The loan can be drawn down in tranches. Each drawdown bears interest fixed at the prevailing lending rate stipulated by the People’s Bank of China on the date of drawdown. Each draw down has a term of three months and can be rolled forward at the discretion of QDML. The interest rate on this loan as at September 30, 2014 was 4.59%.
As at September 30, 2014, RMB 647.1 million ($105,177) had been drawn under the entrusted loan.
Subsequent to September 30, 2014, RMB 0.7 million ($117) was drawn under this loan.
The entrusted loan has been recorded on a net settlement basis.
Eldorado Gold Corporation Notes to the unaudited condensed consolidated financial statements (Expressed in thousands of U.S. dollars, unless otherwise stated)
(4)
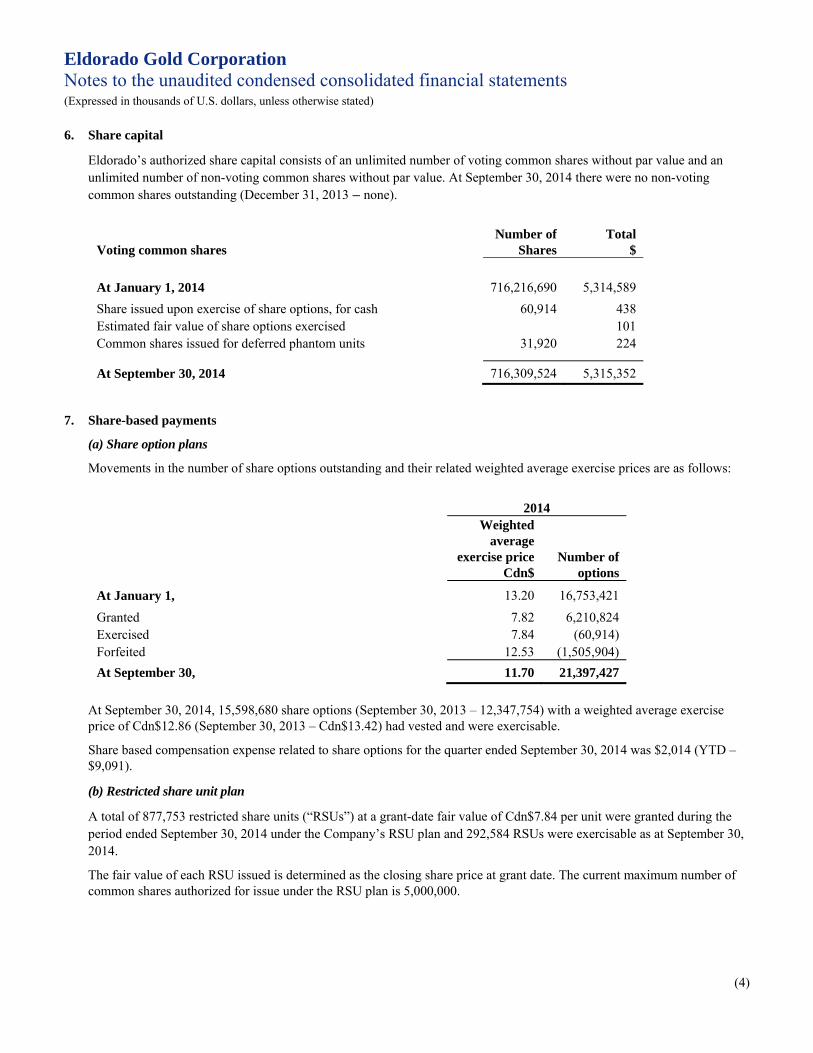
6. Share capital
Eldorado’s authorized share capital consists of an unlimited number of voting common shares without par value and an unlimited number of non-voting common shares without par value. At September 30, 2014 there were no non-voting common shares outstanding (December 31, 2013 – none).
Voting common shares Number of
Shares Total
$ At January 1, 2014 716,216,690 5,314,589 Share issued upon exercise of share options, for cash 60,914 438 Estimated fair value of share options exercised 101 Common shares issued for deferred phantom units 31,920 224
At September 30, 2014 716,309,524 5,315,352
7. Share-based payments
(a) Share option plans
Movements in the number of share options outstanding and their related weighted average exercise prices are as follows:
2014 Weighted
average exercise price
Cdn$ Number of
options
At January 1, 13.20 16,753,421
Granted 7.82 6,210,824 Exercised 7.84 (60,914) Forfeited 12.53 (1,505,904) At September 30, 11.70 21,397,427
At September 30, 2014, 15,598,680 share options (September 30, 2013 – 12,347,754) with a weighted average exercise price of Cdn$12.86 (September 30, 2013 – Cdn$13.42) had vested and were exercisable.
Share based compensation expense related to share options for the quarter ended September 30, 2014 was $2,014 (YTD – $9,091).
(b) Restricted share unit plan
A total of 877,753 restricted share units (“RSUs”) at a grant-date fair value of Cdn$7.84 per unit were granted during the period ended September 30, 2014 under the Company’s RSU plan and 292,584 RSUs were exercisable as at September 30, 2014.
The fair value of each RSU issued is determined as the closing share price at grant date. The current maximum number of common shares authorized for issue under the RSU plan is 5,000,000.
Eldorado Gold Corporation Notes to the unaudited condensed consolidated financial statements (Expressed in thousands of U.S. dollars, unless otherwise stated)
(5)
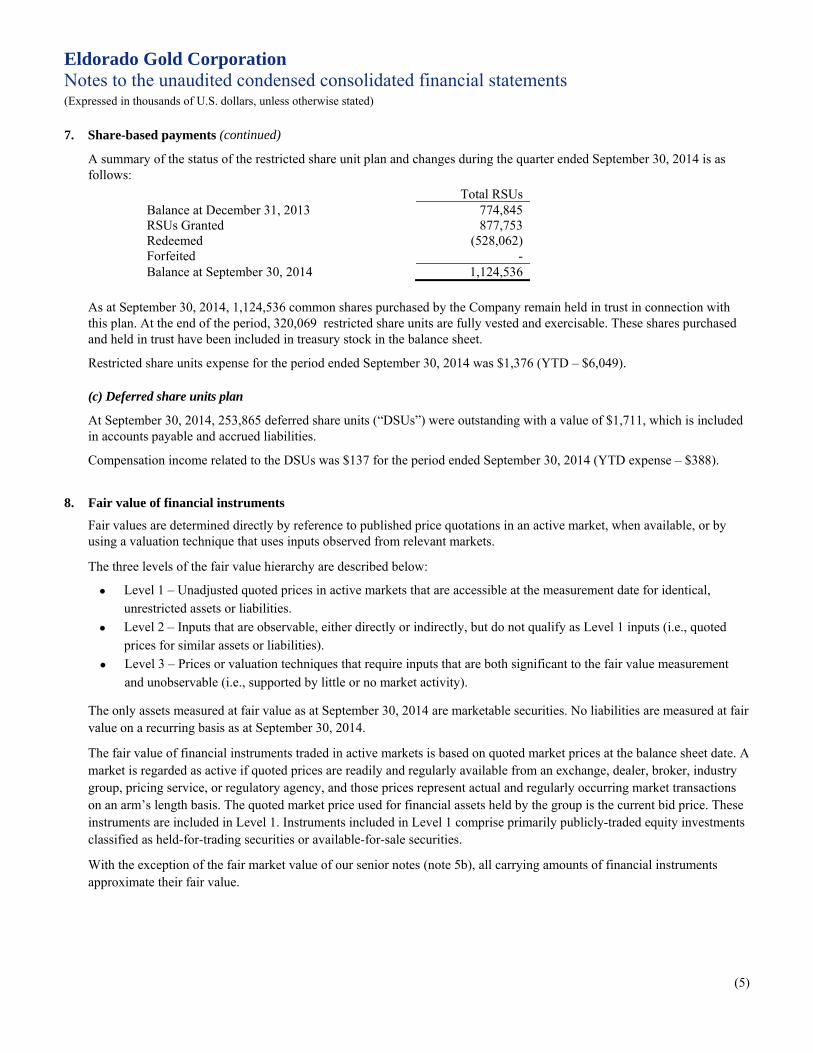
7. Share-based payments (continued)
A summary of the status of the restricted share unit plan and changes during the quarter ended September 30, 2014 is as follows:
Total RSUs Balance at December 31, 2013 774,845 RSUs Granted 877,753 Redeemed (528,062) Forfeited - Balance at September 30, 2014 1,124,536
As at September 30, 2014, 1,124,536 common shares purchased by the Company remain held in trust in connection with this plan. At the end of the period, 320,069 restricted share units are fully vested and exercisable. These shares purchased and held in trust have been included in treasury stock in the balance sheet.
Restricted share units expense for the period ended September 30, 2014 was $1,376 (YTD – $6,049).
(c) Deferred share units plan
At September 30, 2014, 253,865 deferred share units (“DSUs”) were outstanding with a value of $1,711, which is included in accounts payable and accrued liabilities.
Compensation income related to the DSUs was $137 for the period ended September 30, 2014 (YTD expense – $388).
8. Fair value of financial instruments
Fair values are determined directly by reference to published price quotations in an active market, when available, or by using a valuation technique that uses inputs observed from relevant markets.
The three levels of the fair value hierarchy are described below:
• Level 1 – Unadjusted quoted prices in active markets that are accessible at the measurement date for identical, unrestricted assets or liabilities.
• Level 2 – Inputs that are observable, either directly or indirectly, but do not qualify as Level 1 inputs (i.e., quoted prices for similar assets or liabilities).
• Level 3 – Prices or valuation techniques that require inputs that are both significant to the fair value measurement and unobservable (i.e., supported by little or no market activity).
The only assets measured at fair value as at September 30, 2014 are marketable securities. No liabilities are measured at fair value on a recurring basis as at September 30, 2014.
The fair value of financial instruments traded in active markets is based on quoted market prices at the balance sheet date. A market is regarded as active if quoted prices are readily and regularly available from an exchange, dealer, broker, industry group, pricing service, or regulatory agency, and those prices represent actual and regularly occurring market transactions on an arm’s length basis. The quoted market price used for financial assets held by the group is the current bid price. These instruments are included in Level 1. Instruments included in Level 1 comprise primarily publicly-traded equity investments classified as held-for-trading securities or available-for-sale securities.
With the exception of the fair market value of our senior notes (note 5b), all carrying amounts of financial instruments approximate their fair value.
Eldorado Gold Corporation Notes to the unaudited condensed consolidated financial statements (Expressed in thousands of U.S. dollars, unless otherwise stated)
(6)
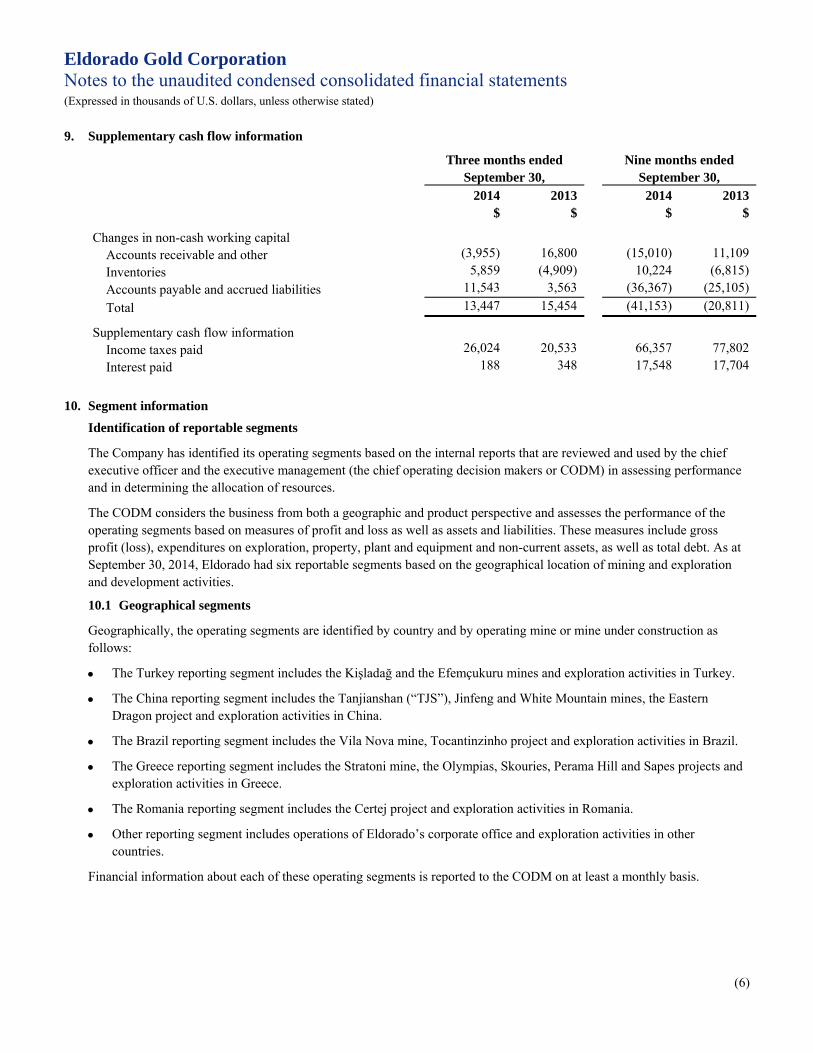
9. Supplementary cash flow information
Three months ended September 30,
Nine months ended September 30,
2014 $
2013 $
2014 $
2013$
Changes in non-cash working capital Accounts receivable and other (3,955) 16,800 (15,010) 11,109 Inventories 5,859 (4,909) 10,224 (6,815) Accounts payable and accrued liabilities 11,543 3,563 (36,367) (25,105) Total 13,447 15,454 (41,153) (20,811)
Supplementary cash flow information Income taxes paid 26,024 20,533 66,357 77,802 Interest paid 188 348 17,548 17,704
10. Segment information
Identification of reportable segments
The Company has identified its operating segments based on the internal reports that are reviewed and used by the chief executive officer and the executive management (the chief operating decision makers or CODM) in assessing performance and in determining the allocation of resources.
The CODM considers the business from both a geographic and product perspective and assesses the performance of the operating segments based on measures of profit and loss as well as assets and liabilities. These measures include gross profit (loss), expenditures on exploration, property, plant and equipment and non-current assets, as well as total debt. As at September 30, 2014, Eldorado had six reportable segments based on the geographical location of mining and exploration and development activities.
10.1 Geographical segments
Geographically, the operating segments are identified by country and by operating mine or mine under construction as follows:
• The Turkey reporting segment includes the Kişladağ and the Efemçukuru mines and exploration activities in Turkey.
• The China reporting segment includes the Tanjianshan (“TJS”), Jinfeng and White Mountain mines, the Eastern Dragon project and exploration activities in China.
• The Brazil reporting segment includes the Vila Nova mine, Tocantinzinho project and exploration activities in Brazil.
• The Greece reporting segment includes the Stratoni mine, the Olympias, Skouries, Perama Hill and Sapes projects and exploration activities in Greece.
• The Romania reporting segment includes the Certej project and exploration activities in Romania.
• Other reporting segment includes operations of Eldorado’s corporate office and exploration activities in other countries.
Financial information about each of these operating segments is reported to the CODM on at least a monthly basis.
Eldorado Gold Corporation Notes to the unaudited condensed consolidated financial statements (Expressed in thousands of U.S. dollars, unless otherwise stated)
(7)
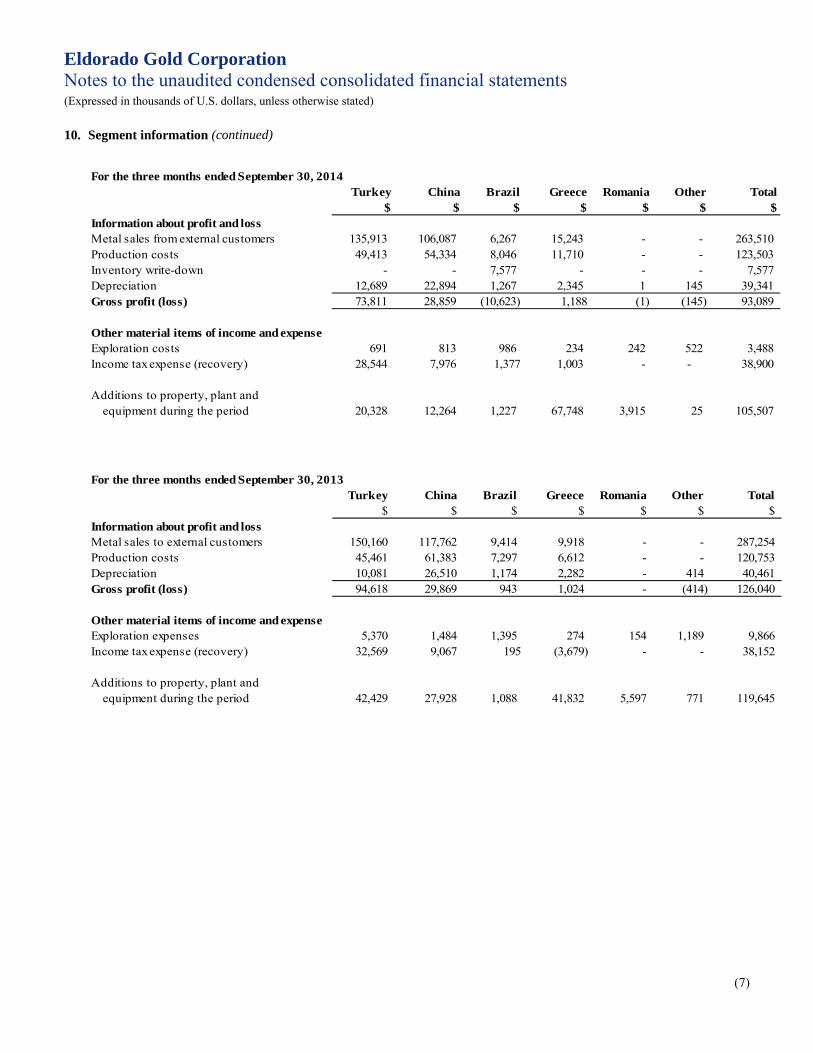
10. Segment information (continued)
For the three months ended September 30, 2014
Turkey China Brazil Greece Romania Other Total$ $ $ $ $ $ $
Information about profit and lossMetal sales from external customers 135,913 106,087 6,267 15,243 - - 263,510 Production costs 49,413 54,334 8,046 11,710 - - 123,503 Inventory write-down - - 7,577 - - - 7,577 Depreciation 12,689 22,894 1,267 2,345 1 145 39,341 Gross profit (loss) 73,811 28,859 (10,623) 1,188 (1) (145) 93,089
Other material items of income and expenseExploration costs 691 813 986 234 242 522 3,488 Income tax expense (recovery) 28,544 7,976 1,377 1,003 - - 38,900
Additions to property, plant andequipment during the period 20,328 12,264 1,227 67,748 3,915 25 105,507
For the three months ended September 30, 2013
Turkey China Brazil Greece Romania Other Total$ $ $ $ $ $ $
Information about profit and lossMetal sales to external customers 150,160 117,762 9,414 9,918 - - 287,254 Production costs 45,461 61,383 7,297 6,612 - - 120,753 Depreciation 10,081 26,510 1,174 2,282 - 414 40,461 Gross profit (loss) 94,618 29,869 943 1,024 - (414) 126,040
Other material items of income and expenseExploration expenses 5,370 1,484 1,395 274 154 1,189 9,866 Income tax expense (recovery) 32,569 9,067 195 (3,679) - - 38,152
Additions to property, plant andequipment during the period 42,429 27,928 1,088 41,832 5,597 771 119,645
Eldorado Gold Corporation Notes to the unaudited condensed consolidated financial statements (Expressed in thousands of U.S. dollars, unless otherwise stated)
(8)
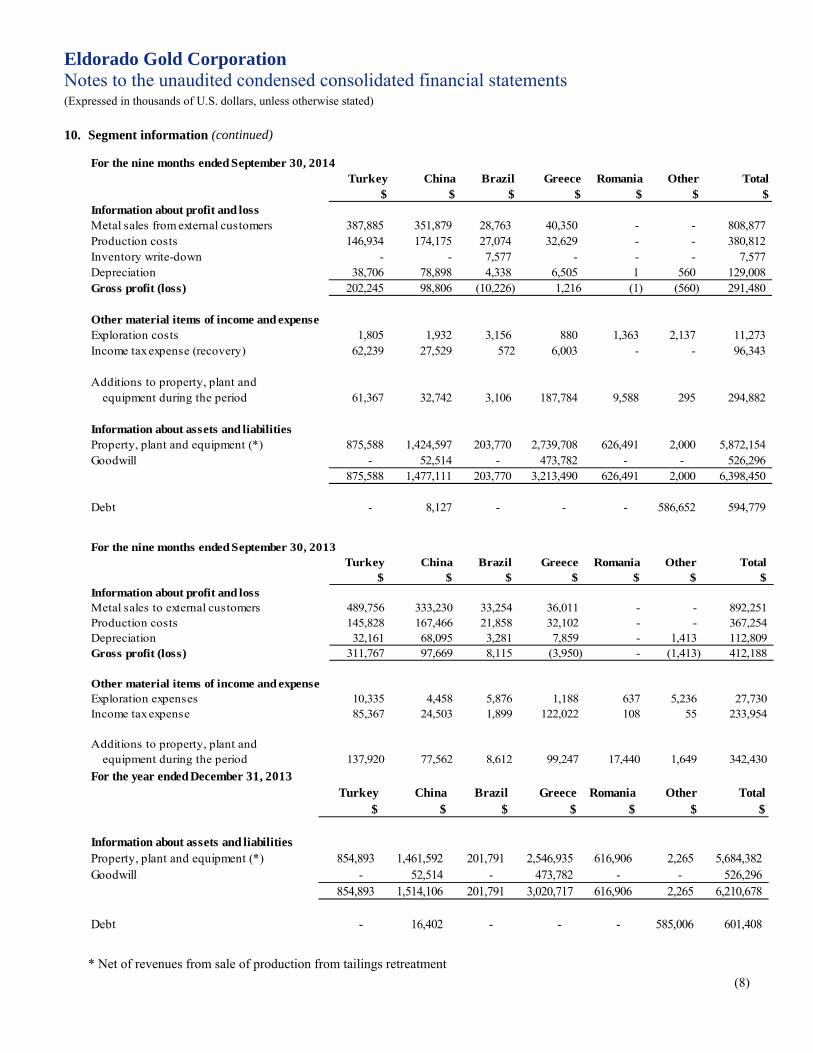
10. Segment information (continued)
For the nine months ended September 30, 2014Turkey China Brazil Greece Romania Other Total
$ $ $ $ $ $ $Information about profit and lossMetal sales from external customers 387,885 351,879 28,763 40,350 - - 808,877 Production costs 146,934 174,175 27,074 32,629 - - 380,812 Inventory write-down - - 7,577 - - - 7,577 Depreciation 38,706 78,898 4,338 6,505 1 560 129,008 Gross profit (loss) 202,245 98,806 (10,226) 1,216 (1) (560) 291,480
Other material items of income and expenseExploration costs 1,805 1,932 3,156 880 1,363 2,137 11,273 Income tax expense (recovery) 62,239 27,529 572 6,003 - - 96,343
Additions to property, plant andequipment during the period 61,367 32,742 3,106 187,784 9,588 295 294,882
Information about assets and liabilitiesProperty, plant and equipment (*) 875,588 1,424,597 203,770 2,739,708 626,491 2,000 5,872,154 Goodwill - 52,514 - 473,782 - - 526,296
875,588 1,477,111 203,770 3,213,490 626,491 2,000 6,398,450
Debt - 8,127 - - - 586,652 594,779
For the nine months ended September 30, 2013Turkey China Brazil Greece Romania Other Total
$ $ $ $ $ $ $Information about profit and lossMetal sales to external customers 489,756 333,230 33,254 36,011 - - 892,251 Production costs 145,828 167,466 21,858 32,102 - - 367,254 Depreciation 32,161 68,095 3,281 7,859 - 1,413 112,809 Gross profit (loss) 311,767 97,669 8,115 (3,950) - (1,413) 412,188
Other material items of income and expenseExploration expenses 10,335 4,458 5,876 1,188 637 5,236 27,730 Income tax expense 85,367 24,503 1,899 122,022 108 55 233,954
Additions to property, plant andequipment during the period 137,920 77,562 8,612 99,247 17,440 1,649 342,430
For the year ended December 31, 2013Turkey China Brazil Greece Romania Other Total
$ $ $ $ $ $ $
Information about assets and liabilitiesProperty, plant and equipment (*) 854,893 1,461,592 201,791 2,546,935 616,906 2,265 5,684,382 Goodwill - 52,514 - 473,782 - - 526,296
854,893 1,514,106 201,791 3,020,717 616,906 2,265 6,210,678
Debt - 16,402 - - - 585,006 601,408
* Net of revenues from sale of production from tailings retreatment
Eldorado Gold Corporation Notes to the unaudited condensed consolidated financial statements (Expressed in thousands of U.S. dollars, unless otherwise stated)
(9)
10. Segment information (continued)
The Turkey and China segments derive their revenues from sales of gold. The Brazil segment derives its revenue from sales of iron ore. The Greece segment derives its revenue from sales of zinc, lead and silver concentrates.
The measure of total debt represents the current and long-term portions of debt.
10.2 Economic dependence
At September 30, 2014, each of our Chinese mines had one major customer, to whom each sells its entire production, as follows:
TJS Mine Henan Zhongyuan Gold Smelter Factory Co. Ltd.of Zhongjin Gold Holding Co. Ltd. Jinfeng Mine China National Gold Group White Mountain Mine Refinery of Shandong Humon Smelting Co. Ltd.
10.3 Seasonality/cyclicality of operations
Management does not consider operations to be of a significant seasonal or cyclical nature.

MANAGEMENT’S DISCUSSION AND ANALYSIS for the three and nine-month periods ended September 30, 2014
1
MANAGEMENT’S DISCUSSION and ANALYSIS OF FINANCIAL CONDITION AND RESULTS OF OPERATIONS (MD&A) for the three and nine-month periods ended September 30, 2014 Throughout this MD&A, Eldorado, we, us, our and the Company mean Eldorado Gold Corporation. This quarter means the third quarter of 2014. All dollar amounts are in United States dollars unless stated otherwise. The information in this MD&A is as of October 30, 2014. You should also read our audited consolidated financial statements for the year ended December 31, 2013 prepared in accordance with International Financial Reporting Standards (IFRS) as issued by the International Accounting Standards Board (IASB) and the unaudited interim condensed consolidated financial statements for the three and nine-month periods ended September 30, 2014 prepared in accordance with International Accounting Standard (IAS) 34 – “Interim Financial Reporting”. We file our financial statements and MD&A with appropriate regulatory authorities in Canada and the United States. You can find more information about Eldorado, including our Annual Information Form, on SEDAR at www.sedar.com. About Eldorado Based in Vancouver, Canada, Eldorado owns and operates gold mines around the world. Its activities involve all facets of the gold mining industry including exploration and evaluation, development, production and reclamation. Operating gold mines: • Kisladag, in Turkey (100%) • Efemcukuru, in Turkey (100%) • Tanjianshan, in China (90%) • Jinfeng, in China (82%) • White Mountain, in China (95%) Gold projects: • Skouries, in Greece (95%) • Olympias, in Greece (95%) • Perama Hill, in Greece (100%) • Sappes, in Greece (100%) • Certej, in Romania (81%) • Eastern Dragon, in China (75%) • Tocantinzinho, in Brazil (100%) Other mines: • Vila Nova – iron ore, in Brazil (100%) • Stratoni – silver, lead, zinc, in Greece (95%) Eldorado’s common shares are listed on the following exchanges: • Toronto Stock Exchange (TSX) under the symbol ELD • New York Stock Exchange (NYSE) under the symbol EGO
ELD is part of the S&P/TSX Global Gold Index. EGO is part of the AMEX Gold BUGS Index.
MANAGEMENT’S DISCUSSION AND ANALYSIS for the three and nine-month periods ended September 30, 2014
2
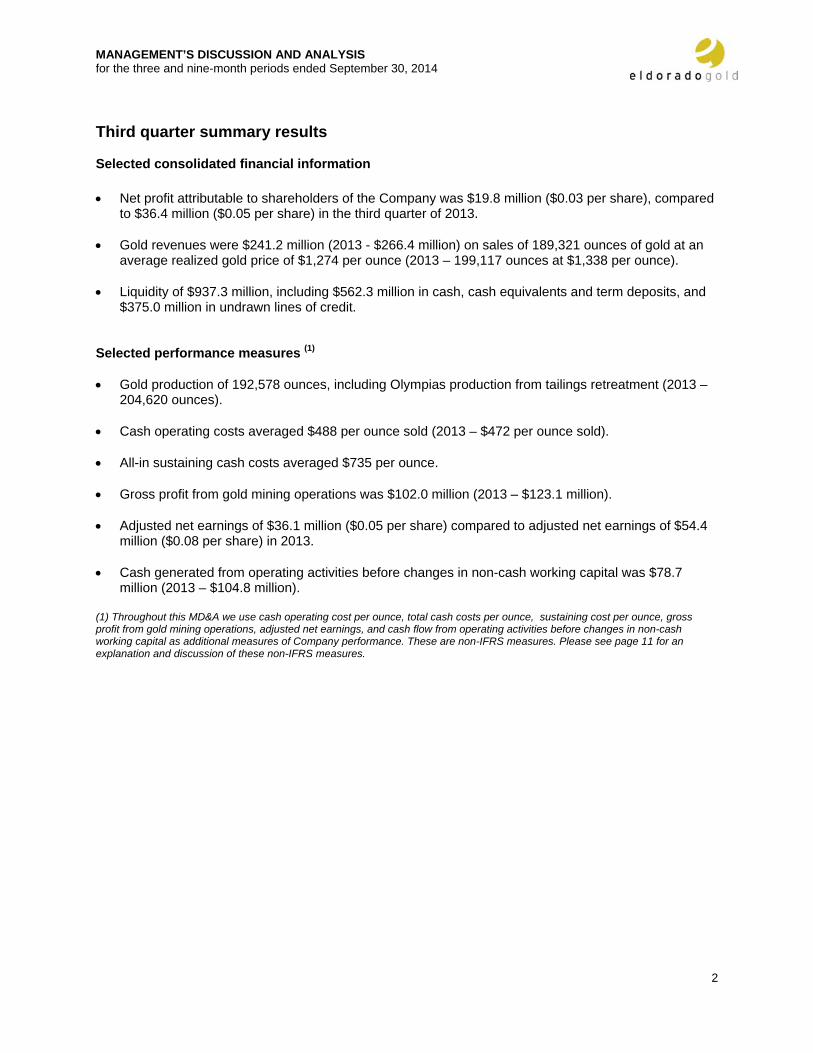
Third quarter summary results Selected consolidated financial information • Net profit attributable to shareholders of the Company was $19.8 million ($0.03 per share), compared
to $36.4 million ($0.05 per share) in the third quarter of 2013.
• Gold revenues were $241.2 million (2013 - $266.4 million) on sales of 189,321 ounces of gold at an average realized gold price of $1,274 per ounce (2013 – 199,117 ounces at $1,338 per ounce).
• Liquidity of $937.3 million, including $562.3 million in cash, cash equivalents and term deposits, and
$375.0 million in undrawn lines of credit.
Selected performance measures (1)
• Gold production of 192,578 ounces, including Olympias production from tailings retreatment (2013 –
204,620 ounces).
• Cash operating costs averaged $488 per ounce sold (2013 – $472 per ounce sold).
• All-in sustaining cash costs averaged $735 per ounce.
• Gross profit from gold mining operations was $102.0 million (2013 – $123.1 million).
• Adjusted net earnings of $36.1 million ($0.05 per share) compared to adjusted net earnings of $54.4 million ($0.08 per share) in 2013.
• Cash generated from operating activities before changes in non-cash working capital was $78.7
million (2013 – $104.8 million).
(1) Throughout this MD&A we use cash operating cost per ounce, total cash costs per ounce, sustaining cost per ounce, gross profit from gold mining operations, adjusted net earnings, and cash flow from operating activities before changes in non-cash working capital as additional measures of Company performance. These are non-IFRS measures. Please see page 11 for an explanation and discussion of these non-IFRS measures.
MANAGEMENT’S DISCUSSION AND ANALYSIS for the three and nine-month periods ended September 30, 2014
3
Review of Financial Results
Summarized financial results 3 months ended September 30,
9 months ended September 30,
2014 2013 2014 2013
Revenues (millions) $263.5 $287.3 $808.9 $892.3
Gold revenues (millions) $241.2 $266.4 $736.4 $817.2
Gold sold (ounces) 189,321 199,117 570,570 564,723
Average realized gold price (US$ per ounce) $1,274 $1,338 $1,291 $1,447
Cash operating costs (US$ per ounce sold) $488 $472 $499 $485
Total cash cost (US$ per ounce sold) $543 $528 $556 $544
All-in sustaining cash cost (US$ per ounce sold) $735 n/a $784 n/a
Gross profit from gold mining operations (millions) $102.0 $123.1 $298.2 $404.2
Adjusted net earnings (millions) $36.1 $54.4 $109.2 $186.0
Net profit (loss) attributable to shareholders of the Company (millions)
$19.8 $36.4 $88.7 $34.2
Earnings (loss) per share attributable to shareholders of the Company – Basic (US$/share)
$0.03 $0.05 $0.12 $0.05
Earnings (loss) per share attributable to shareholders of the Company – Diluted (US$/share)
$0.03 $0.05 $0.12 $0.05
Dividends paid (Cdn$/share) $0.01 $0.05 $0.02 $0.12
Cash flow from operating activities before changes in non-cash working capital (millions)
$78.7 $104.8 $265.6 $329.6
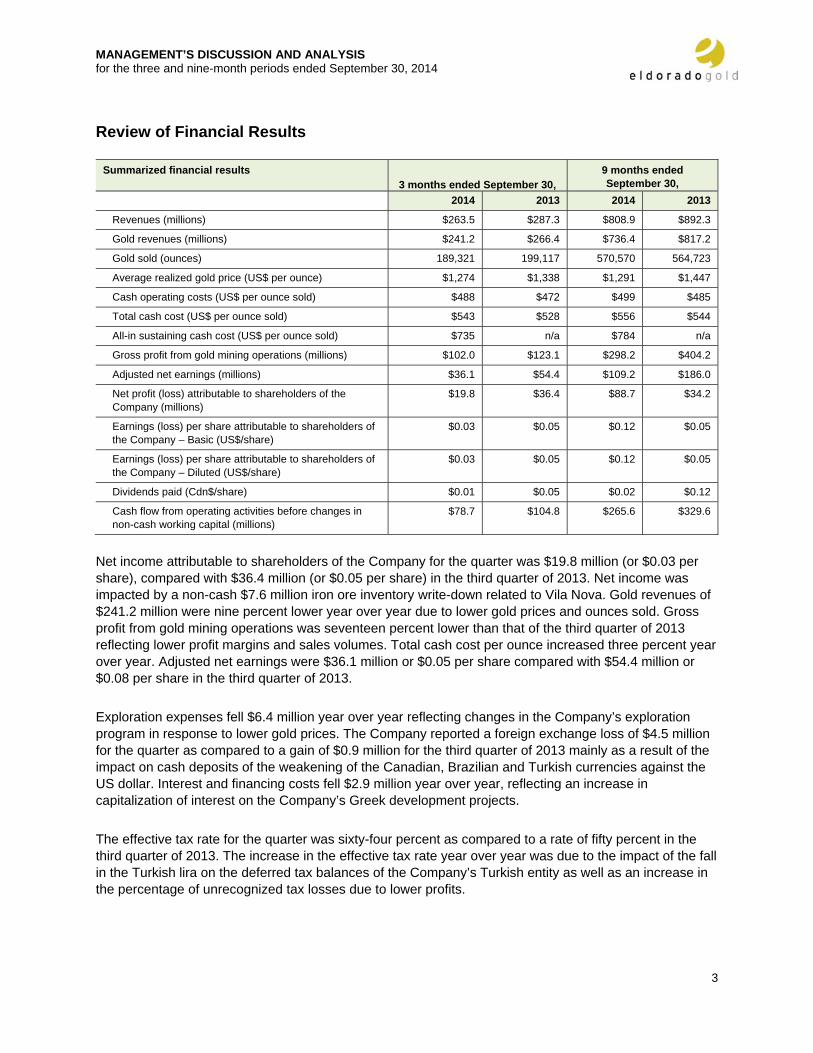
Net income attributable to shareholders of the Company for the quarter was $19.8 million (or $0.03 per share), compared with $36.4 million (or $0.05 per share) in the third quarter of 2013. Net income was impacted by a non-cash $7.6 million iron ore inventory write-down related to Vila Nova. Gold revenues of $241.2 million were nine percent lower year over year due to lower gold prices and ounces sold. Gross profit from gold mining operations was seventeen percent lower than that of the third quarter of 2013 reflecting lower profit margins and sales volumes. Total cash cost per ounce increased three percent year over year. Adjusted net earnings were $36.1 million or $0.05 per share compared with $54.4 million or $0.08 per share in the third quarter of 2013. Exploration expenses fell $6.4 million year over year reflecting changes in the Company’s exploration program in response to lower gold prices. The Company reported a foreign exchange loss of $4.5 million for the quarter as compared to a gain of $0.9 million for the third quarter of 2013 mainly as a result of the impact on cash deposits of the weakening of the Canadian, Brazilian and Turkish currencies against the US dollar. Interest and financing costs fell $2.9 million year over year, reflecting an increase in capitalization of interest on the Company’s Greek development projects. The effective tax rate for the quarter was sixty-four percent as compared to a rate of fifty percent in the third quarter of 2013. The increase in the effective tax rate year over year was due to the impact of the fall in the Turkish lira on the deferred tax balances of the Company’s Turkish entity as well as an increase in the percentage of unrecognized tax losses due to lower profits.
MANAGEMENT’S DISCUSSION AND ANALYSIS for the three and nine-month periods ended September 30, 2014
4
Operations update Summarized Operating Results 3 months ended
September 30, 9 months ended September 30,
2014 2013 2014 2013 Gross profit – gold mining operations (millions) $102.0 $123.1 $298.2 $404.2
Ounces produced – including Olympias production from tailings retreatment
192,578 204,620 589,652 552,359
Cash operating costs ($ per ounce sold) $488 $472 $499 $485
Total cash cost ($ per ounce sold) $543 $528 $556 $544
Kisladag
Gross profit – gold mining operations (millions) $62.9 $79.5 $163.1 $242.1
Ounces produced 78,030 84,762 222,085 231,718
Cash operating costs ($ per ounce sold) $411 $324 $435 $328
Total cash cost ($ per ounce sold) $427 $343 $454 $349
Efemcukuru
Gross profit – gold mining operations (millions) $10.3 $13.9 $36.6 $64.9
Ounces produced 26,838 23,438 78,841 69,583
Cash operating costs ($ per ounce sold) $547 $551 $541 $558
Total cash cost ($ per ounce sold) $564 $568 $562 $586
Tanjianshan
Gross profit – gold mining operations (millions) $12.7 $15.3 $39.7 $49.6
Ounces produced 25,387 28,179 79,556 82,324
Cash operating costs ($ per ounce sold) $381 $377 $399 $405
Total cash cost ($ per ounce sold) $563 $557 $575 $589
Jinfeng
Gross profit – gold mining operations (millions) $12.4 $9.9 $41.7 $26.9
Ounces produced 39,421 40,212 126,284 90,843
Cash operating costs ($ per ounce sold) $609 $684 $590 $743
Total cash cost ($ per ounce sold) $693 $767 $673 $831
White Mountain
Gross profit – gold mining operations (millions) $3.7 $4.5 $17.0 $20.7
Ounces produced 18,130 19,287 65,603 57,664
Cash operating costs ($ per ounce sold) $648 $713 $611 $693
Total cash cost ($ per ounce sold) $691 $751 $651 $734
Olympias
Ounces produced from tailings retreatment 4,772 8,742 17,283 20,227
MANAGEMENT’S DISCUSSION AND ANALYSIS for the three and nine-month periods ended September 30, 2014
5
Kisladag
Operating Data 3 months ended September 30,
9 months ended September 30,
2014 2013 2014 2013 Tonnes placed on pad 3,829,444 3,336,465 10,814,170 9,553,306 Average treated head grade - grams per tonne (g/t) 1.28 1.28 1.04 1.28 Gold (ounces) - Produced 78,030 84,762 222,085 231,718 - Sold 82,374 85,029 222,041 231,959
Cash operating costs (per ounce sold) $411 $324 $435 $328 Total cash costs (per ounce sold) $427 $343 $454 $349
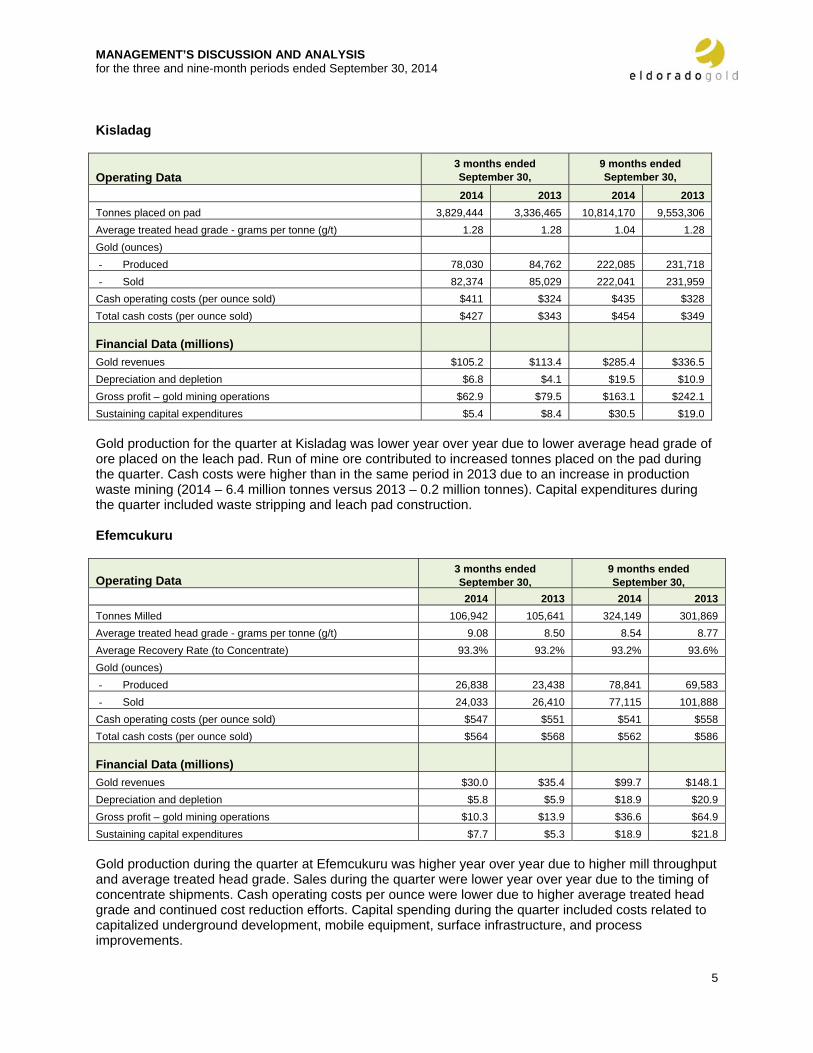
Financial Data (millions) Gold revenues $105.2 $113.4 $285.4 $336.5 Depreciation and depletion $6.8 $4.1 $19.5 $10.9 Gross profit – gold mining operations $62.9 $79.5 $163.1 $242.1 Sustaining capital expenditures $5.4 $8.4 $30.5 $19.0 Gold production for the quarter at Kisladag was lower year over year due to lower average head grade of ore placed on the leach pad. Run of mine ore contributed to increased tonnes placed on the pad during the quarter. Cash costs were higher than in the same period in 2013 due to an increase in production waste mining (2014 – 6.4 million tonnes versus 2013 – 0.2 million tonnes). Capital expenditures during the quarter included waste stripping and leach pad construction. Efemcukuru
Operating Data 3 months ended September 30,
9 months ended September 30,
2014 2013 2014 2013 Tonnes Milled 106,942 105,641 324,149 301,869 Average treated head grade - grams per tonne (g/t) 9.08 8.50 8.54 8.77 Average Recovery Rate (to Concentrate) 93.3% 93.2% 93.2% 93.6% Gold (ounces) - Produced 26,838 23,438 78,841 69,583 - Sold 24,033 26,410 77,115 101,888
Cash operating costs (per ounce sold) $547 $551 $541 $558 Total cash costs (per ounce sold) $564 $568 $562 $586
Financial Data (millions) Gold revenues $30.0 $35.4 $99.7 $148.1 Depreciation and depletion $5.8 $5.9 $18.9 $20.9 Gross profit – gold mining operations $10.3 $13.9 $36.6 $64.9 Sustaining capital expenditures $7.7 $5.3 $18.9 $21.8 Gold production during the quarter at Efemcukuru was higher year over year due to higher mill throughput and average treated head grade. Sales during the quarter were lower year over year due to the timing of concentrate shipments. Cash operating costs per ounce were lower due to higher average treated head grade and continued cost reduction efforts. Capital spending during the quarter included costs related to capitalized underground development, mobile equipment, surface infrastructure, and process improvements.
MANAGEMENT’S DISCUSSION AND ANALYSIS for the three and nine-month periods ended September 30, 2014
6
Tanjianshan
Operating Data 3 months ended September 30,
9 months ended September 30,
2014 2013 2014 2013 Tonnes Milled 281,862 285,406 823,698 805,532 Average treated head grade - grams per tonne (g/t) 3.50 3.40 3.41 3.54 Average Recovery Rate 81.4% 82.9% 81.5% 82.5% Gold (ounces) - Produced 25,387 28,179 79,556 82,324 - Sold 25,387 28,179 79,556 82,324
Cash operating costs (per ounce sold) $381 $377 $399 $405
Total cash costs (per ounce sold) $563 $557 $575 $589
Financial Data (millions) Gold revenues $32.1 $38.1 $102.7 $119.0
Depreciation and depletion $4.9 $6.7 $16.7 $20.0
Gross profit – gold mining operations $12.7 $15.3 $39.7 $49.6
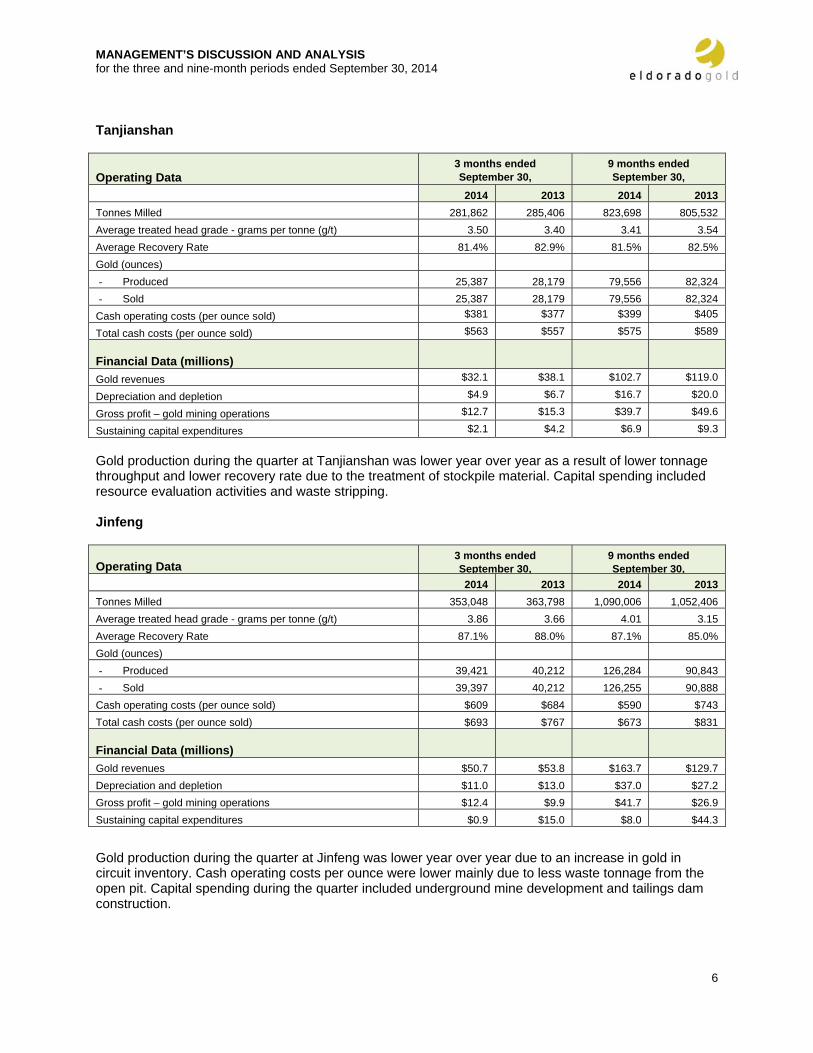
Sustaining capital expenditures $2.1 $4.2 $6.9 $9.3 Gold production during the quarter at Tanjianshan was lower year over year as a result of lower tonnage throughput and lower recovery rate due to the treatment of stockpile material. Capital spending included resource evaluation activities and waste stripping. Jinfeng
Operating Data 3 months ended September 30,
9 months ended September 30,
2014 2013 2014 2013 Tonnes Milled 353,048 363,798 1,090,006 1,052,406 Average treated head grade - grams per tonne (g/t) 3.86 3.66 4.01 3.15 Average Recovery Rate 87.1% 88.0% 87.1% 85.0% Gold (ounces) - Produced 39,421 40,212 126,284 90,843 - Sold 39,397 40,212 126,255 90,888
Cash operating costs (per ounce sold) $609 $684 $590 $743 Total cash costs (per ounce sold) $693 $767 $673 $831
Financial Data (millions) Gold revenues $50.7 $53.8 $163.7 $129.7 Depreciation and depletion $11.0 $13.0 $37.0 $27.2 Gross profit – gold mining operations $12.4 $9.9 $41.7 $26.9 Sustaining capital expenditures $0.9 $15.0 $8.0 $44.3
Gold production during the quarter at Jinfeng was lower year over year due to an increase in gold in circuit inventory. Cash operating costs per ounce were lower mainly due to less waste tonnage from the open pit. Capital spending during the quarter included underground mine development and tailings dam construction.
MANAGEMENT’S DISCUSSION AND ANALYSIS for the three and nine-month periods ended September 30, 2014
7
White Mountain
Operating Data 3 months ended September 30,
9 months ended September 30,
2014 2013 2014 2013 Tonnes Milled 218,500 209,581 632,923 611,548 Average treated head grade - grams per tonne (g/t) 2.79 3.28 3.48 3.44 Average Recovery Rate 89.4% 84.0% 88.1% 85.5% Gold (ounces) - Produced 18,130 19,287 65,603 57,664 - Sold 18,130 19,287 65,603 57,664
Cash operating costs (per ounce sold) $648 $713 $611 $693 Total cash costs (per ounce sold) $691 $751 $651 $734
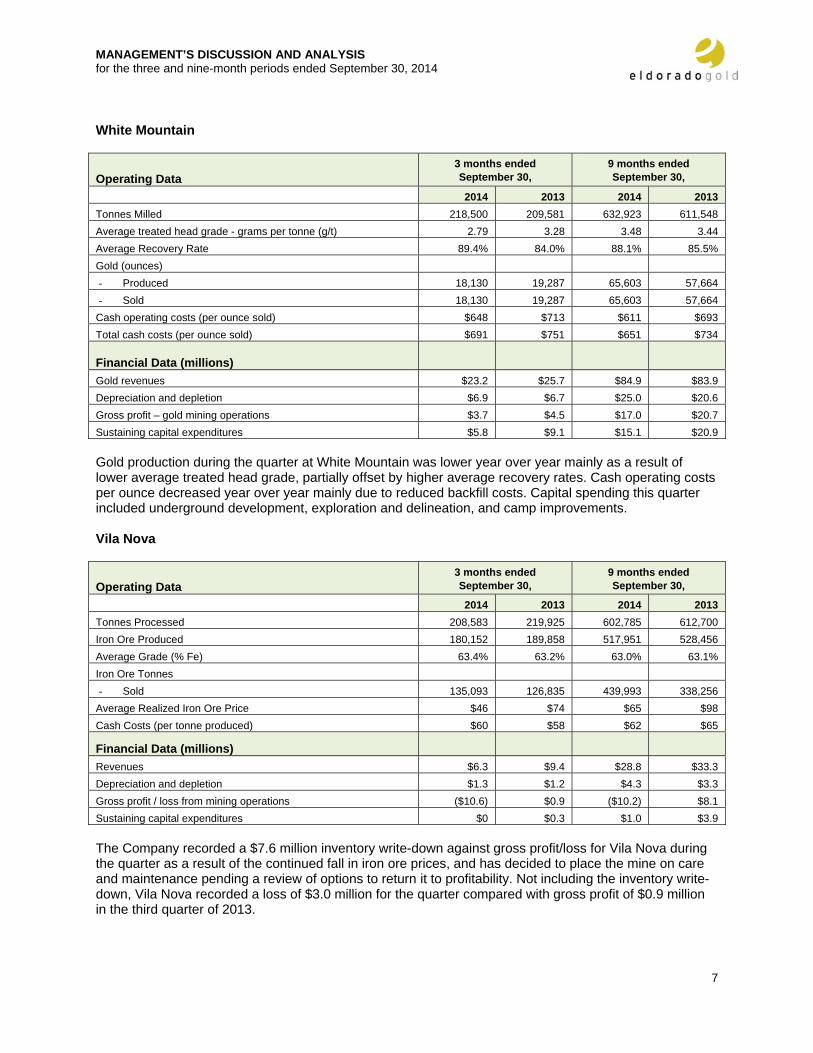
Financial Data (millions) Gold revenues $23.2 $25.7 $84.9 $83.9 Depreciation and depletion $6.9 $6.7 $25.0 $20.6 Gross profit – gold mining operations $3.7 $4.5 $17.0 $20.7 Sustaining capital expenditures $5.8 $9.1 $15.1 $20.9 Gold production during the quarter at White Mountain was lower year over year mainly as a result of lower average treated head grade, partially offset by higher average recovery rates. Cash operating costs per ounce decreased year over year mainly due to reduced backfill costs. Capital spending this quarter included underground development, exploration and delineation, and camp improvements. Vila Nova
Operating Data 3 months ended September 30,
9 months ended September 30,
2014 2013 2014 2013 Tonnes Processed 208,583 219,925 602,785 612,700 Iron Ore Produced 180,152 189,858 517,951 528,456 Average Grade (% Fe) 63.4% 63.2% 63.0% 63.1% Iron Ore Tonnes - Sold 135,093 126,835 439,993 338,256
Average Realized Iron Ore Price $46 $74 $65 $98 Cash Costs (per tonne produced) $60 $58 $62 $65
Financial Data (millions) Revenues $6.3 $9.4 $28.8 $33.3 Depreciation and depletion $1.3 $1.2 $4.3 $3.3 Gross profit / loss from mining operations ($10.6) $0.9 ($10.2) $8.1 Sustaining capital expenditures $0 $0.3 $1.0 $3.9 The Company recorded a $7.6 million inventory write-down against gross profit/loss for Vila Nova during the quarter as a result of the continued fall in iron ore prices, and has decided to place the mine on care and maintenance pending a review of options to return it to profitability. Not including the inventory write-down, Vila Nova recorded a loss of $3.0 million for the quarter compared with gross profit of $0.9 million in the third quarter of 2013.
MANAGEMENT’S DISCUSSION AND ANALYSIS for the three and nine-month periods ended September 30, 2014
8
Stratoni
Operating Data 3 months ended September 30,
9 months ended September 30,
2014 2013 2014 2013 Tonnes ore mined (wet) 60,006 60,011 174,523 174,245 Tonnes ore processed (dry) 58,230 56,463 169,227 167,315 Pb grade (%) 5.63% 6.33% 5.96% 6.39% Zn grade (%) 9.66% 9.37% 10.75% 9.49% Ag grade (g/t) 146 161 153 166 Tonnes of concentrate produced 14,363 14,586 46,013 42,918 Tonnes of concentrate sold 15,884 12,096 45,590 42,847 Average realized concentrate price (per tonne) $960 $820 $885 $840 Cash Costs (per tonne of concentrate sold) $737 $547 $716 $749
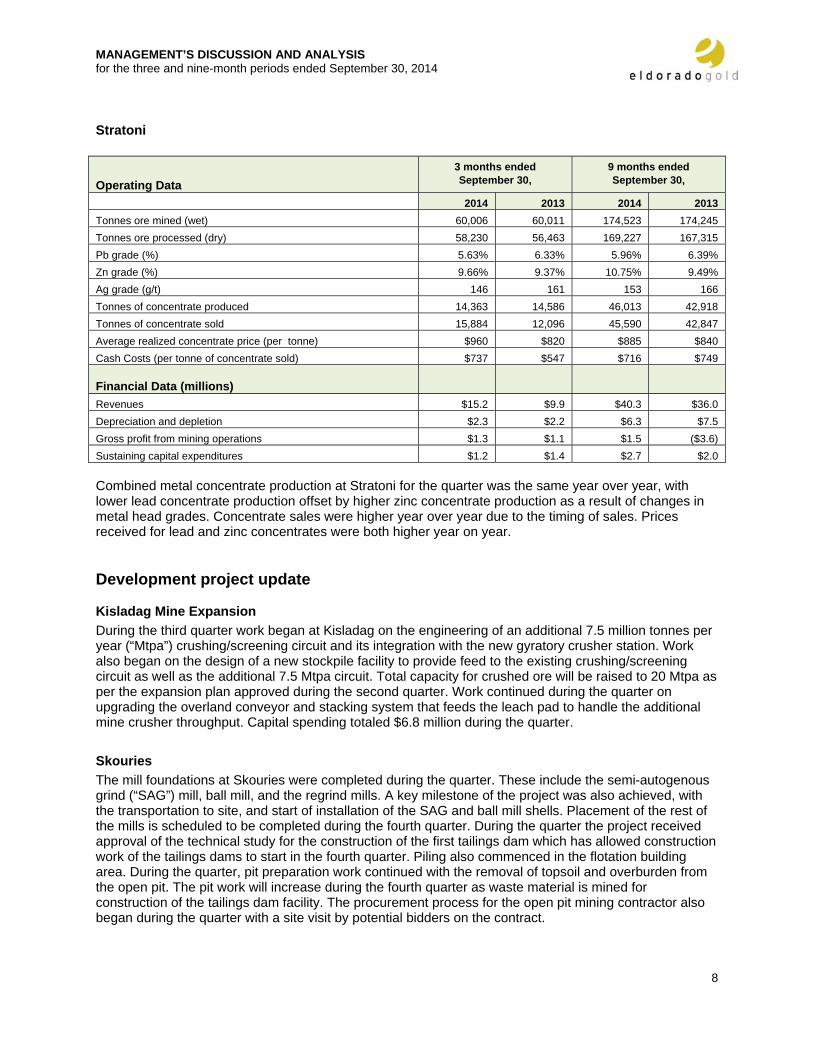
Financial Data (millions) Revenues $15.2 $9.9 $40.3 $36.0 Depreciation and depletion $2.3 $2.2 $6.3 $7.5 Gross profit from mining operations $1.3 $1.1 $1.5 ($3.6) Sustaining capital expenditures $1.2 $1.4 $2.7 $2.0 Combined metal concentrate production at Stratoni for the quarter was the same year over year, with lower lead concentrate production offset by higher zinc concentrate production as a result of changes in metal head grades. Concentrate sales were higher year over year due to the timing of sales. Prices received for lead and zinc concentrates were both higher year on year. Development project update Kisladag Mine Expansion During the third quarter work began at Kisladag on the engineering of an additional 7.5 million tonnes per year (“Mtpa”) crushing/screening circuit and its integration with the new gyratory crusher station. Work also began on the design of a new stockpile facility to provide feed to the existing crushing/screening circuit as well as the additional 7.5 Mtpa circuit. Total capacity for crushed ore will be raised to 20 Mtpa as per the expansion plan approved during the second quarter. Work continued during the quarter on upgrading the overland conveyor and stacking system that feeds the leach pad to handle the additional mine crusher throughput. Capital spending totaled $6.8 million during the quarter. Skouries The mill foundations at Skouries were completed during the quarter. These include the semi-autogenous grind (“SAG”) mill, ball mill, and the regrind mills. A key milestone of the project was also achieved, with the transportation to site, and start of installation of the SAG and ball mill shells. Placement of the rest of the mills is scheduled to be completed during the fourth quarter. During the quarter the project received approval of the technical study for the construction of the first tailings dam which has allowed construction work of the tailings dams to start in the fourth quarter. Piling also commenced in the flotation building area. During the quarter, pit preparation work continued with the removal of topsoil and overburden from the open pit. The pit work will increase during the fourth quarter as waste material is mined for construction of the tailings dam facility. The procurement process for the open pit mining contractor also began during the quarter with a site visit by potential bidders on the contract.
MANAGEMENT’S DISCUSSION AND ANALYSIS for the three and nine-month periods ended September 30, 2014
9
Progress continued on the underground decline with the advance rate improving. Capital spending totaled $35.4 million during the quarter. Olympias A total of 137,566 tonnes of tailings were reprocessed during the quarter at a grade of 2.69 grams per tonne. A total of 4,772 payable ounces of gold in concentrate were produced. Cash proceeds from the sale of concentrate generated $6.5 million during the quarter on 5,393 ounces of gold in concentrate. Capital spending totalled $27.9 million during the quarter including $8.4 million related to tailings reprocessing, production royalties and transportation and selling costs, $2.2 million related to capitalized interest, and the remainder on mine development as well as Phase II engineering. Plans for transitioning the plant operation from Phase l tailings retreatment to Phase II processing of underground ore continued to be studied during the quarter. The plans are based on upgrading the existing plant facilities to handle a throughput of up to 650,000 tonnes per year of ore to produce gold, lead/silver and zinc concentrates. Perama Hill Preliminary engineering was completed with the final front end engineering design report received during the quarter. The Company continues to work with Greek government authorities to facilitate approval of the Environmental Impact Assessment (“EIA”). Capital spending totaled $1.6 million during the quarter. Certej During the quarter the feasibility study commenced in order to optimize the expanded resource and improve the metallurgical design. Construction permits were obtained for the 2014 site works program allowing mobilization of the site earthworks contractor to begin rough grading of the south plant site and construction of the pilot water treatment plant. Capital spending totaled $3.6 million during the quarter. Tocantinzinho During the quarter work continued on optimization of the Tocantinzinho feasibility study. Following a review of the geological model, which updated the overall tonnes and grade in the deposit, a rework of the mine design and plant throughput has been incorporated into the ongoing optimization analysis. Access to the site was upgraded to improve surface conditions and drainage. Construction on a portion of the recently approved forest road was begun. Capital spending totaled $1.2 million during the quarter. Eastern Dragon The Eastern Dragon site continued under care and maintenance during the quarter with permitting activities ongoing. The Company was informed that approval of the project EIA is to be conducted by the Heilionjiang Provincial Environment Protection Bureau. Site personnel continued to provide support to the permitting team, particularly at the local and provincial level. Exploration update During the third quarter, a total of 19,000 metres of exploration drilling were completed at the Company’s mine sites, development projects, and exploration projects. Greece In the Halkidiki District, a 6,000 metre drilling program continued during the quarter at the Piavitsa deposit, which is located 2 kilometres west of the Stratoni project. This program consists largely of infill drillholes, designed to confirm the continuity of mineralization delineated in widely-spaced drillholes drilled during 2012 and 2013. Results to date showed grades and thicknesses in general agreement with the resource model.
MANAGEMENT’S DISCUSSION AND ANALYSIS for the three and nine-month periods ended September 30, 2014
10
At the Stratoni mine, step-out drilling targeted the western and down-dip extensions of the orebody. The best results were obtained from just below the current production levels where thick massive sulfide intercepts indicate down-dip continuity of the orebody. In the Perama / Sapes district, exploration activities during the quarter focused on updating the geological model for the Sapes deposit for the purposes of refining the resource model and identifying exploration drilling targets. Romania In the Certej project area, exploration drilling during the quarter tested satellite targets at Magura and Bocsa, both of which were sites of historical underground exploration. No significant results were obtained from the first three drillholes on these targets. These prospects will be further tested during the fourth quarter, upon receipt of required drilling permits. At Muncel, located 15 kilometres southwest of Certej, the final three drillholes of the first phase of exploration drilling were completed. One of these was abandoned after intersecting underground workings, while the other two cut weak to moderate zones of sulfide stringer veinlets. The Certej deposit is currently the subject of a detailed geological reinterpretation program, which will be completed in the fourth quarter with updated deposit geology and resource models. Turkey Exploration drilling during the quarter in Turkey was limited to the Efemcukuru project, where 2,900 metres of drilling tested the Dedebag vein system and segments of the Kokarpinar vein. The best results were obtained from the central and northern portions of the Kokarpinar vein, where several metres of sulfide-rich rhodochrosite vein intercepts of several metres width were obtained. Reconnaissance exploration activities included mapping and sampling of volcanic centres in the greater Kisladag region to evaluate potential for buried porphyry systems, and evaluations of regional prospects in the northern part of the country. China At Tanjianshan, drilling programs were completed at the Dushugou prospect and at the Qinlongtan (“QLT”) deposit. At QLT drilling confirmed the continuity of the QLT Northwest zone in the previously untested gap between the 2013 drillholes and the QLT open pit. Exploration drilling at the White Mountain mine (4,700 metres completed) tested step-outs along-strike and down-plunge from the ore body. Mining grades and thicknesses were confirmed in five separate areas, with highest grades encountered in the North and North Deep ore zones. Surface drilling of the North Deep zone also commenced during the quarter. Brazil Exploration drilling during the quarter in Brazil tested two projects in the Tapajos region. At the Ruben Zilio project, located along strike southeast of Tocantinzinho, soil geochemical anomalies were tested in three target areas; none of this drilling identified significant mineralization. At Tocantinzinho, additional sampling extended the Cu-Mo-Au mineralization over a 6 km trend. Four drillholes tested different areas of this anomaly, and all encountered intervals of quartz and sulfide vein mineralization.
MANAGEMENT’S DISCUSSION AND ANALYSIS for the three and nine-month periods ended September 30, 2014
11
Quarterly results millions (except per share amounts)
2014 2014 2014 2013 2013 2013 2013 2012
Third quarter
Second quarter
First quarter
Fourth quarter
Third quarter
Second quarter
First quarter
Fourth quarter
Total revenues $263.5 $265.5 $279.9 $231.7 $287.3 $266.9 $338.1 $350.0
Profit (loss) $19.8 $37.6 $31.3 ($687.5) $36.4 $43.3 ($45.4) $115.0
Earnings (loss) per share
- basic $0.03 $0.05 $0.04 ($0.96) $0.05 $0.06 ($0.06) $0.16
- diluted $0.03 $0.05 $0.04 ($0.96) $0.05 $0.06 ($0.06) $0.16
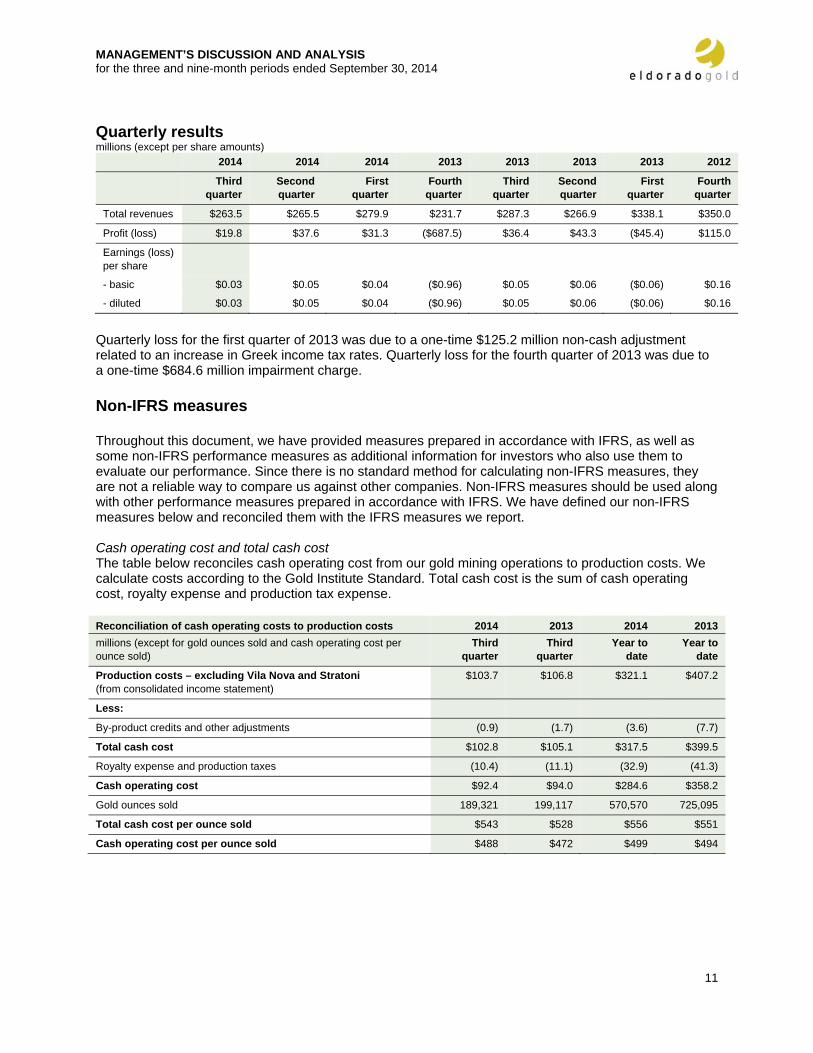
Quarterly loss for the first quarter of 2013 was due to a one-time $125.2 million non-cash adjustment related to an increase in Greek income tax rates. Quarterly loss for the fourth quarter of 2013 was due to a one-time $684.6 million impairment charge. Non-IFRS measures Throughout this document, we have provided measures prepared in accordance with IFRS, as well as some non-IFRS performance measures as additional information for investors who also use them to evaluate our performance. Since there is no standard method for calculating non-IFRS measures, they are not a reliable way to compare us against other companies. Non-IFRS measures should be used along with other performance measures prepared in accordance with IFRS. We have defined our non-IFRS measures below and reconciled them with the IFRS measures we report. Cash operating cost and total cash cost The table below reconciles cash operating cost from our gold mining operations to production costs. We calculate costs according to the Gold Institute Standard. Total cash cost is the sum of cash operating cost, royalty expense and production tax expense.
Reconciliation of cash operating costs to production costs 2014 2013 2014 2013 millions (except for gold ounces sold and cash operating cost per ounce sold)
Third quarter
Third quarter
Year to date
Year to date
Production costs – excluding Vila Nova and Stratoni (from consolidated income statement)
$103.7 $106.8 $321.1 $407.2
Less:
By-product credits and other adjustments (0.9) (1.7) (3.6) (7.7)
Total cash cost $102.8 $105.1 $317.5 $399.5
Royalty expense and production taxes (10.4) (11.1) (32.9) (41.3)
Cash operating cost $92.4 $94.0 $284.6 $358.2
Gold ounces sold 189,321 199,117 570,570 725,095
Total cash cost per ounce sold $543 $528 $556 $551
Cash operating cost per ounce sold $488 $472 $499 $494
MANAGEMENT’S DISCUSSION AND ANALYSIS for the three and nine-month periods ended September 30, 2014
12
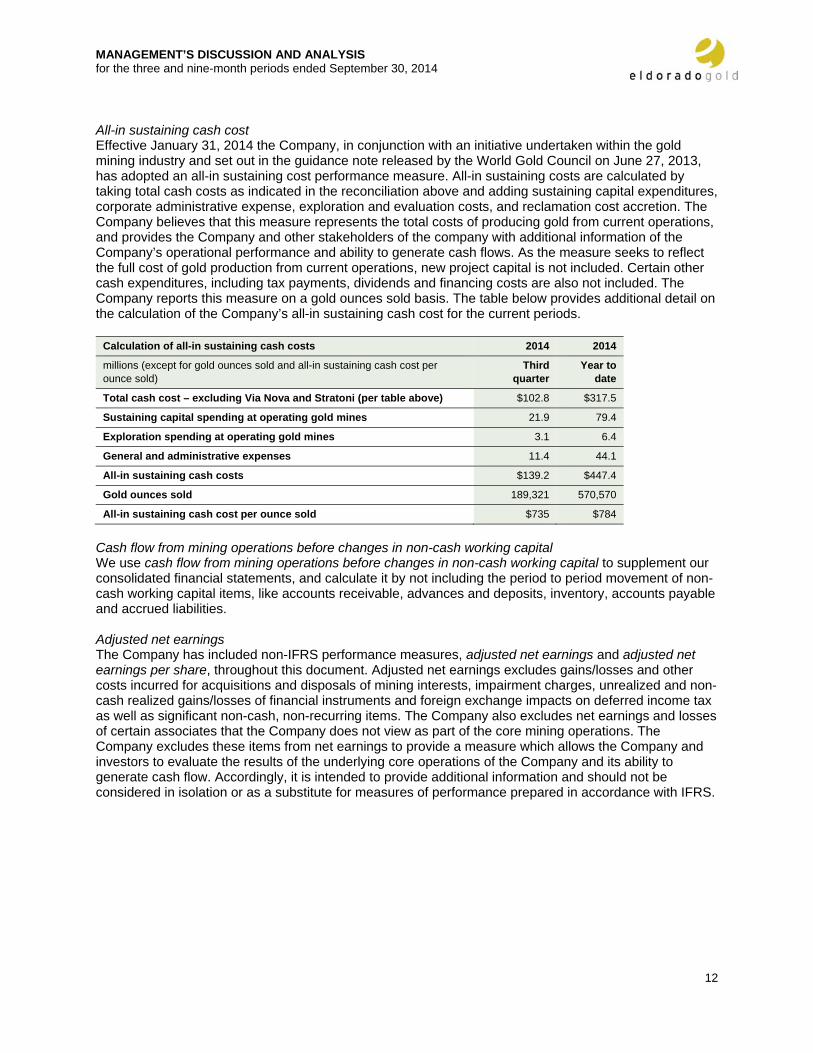
All-in sustaining cash cost Effective January 31, 2014 the Company, in conjunction with an initiative undertaken within the gold mining industry and set out in the guidance note released by the World Gold Council on June 27, 2013, has adopted an all-in sustaining cost performance measure. All-in sustaining costs are calculated by taking total cash costs as indicated in the reconciliation above and adding sustaining capital expenditures, corporate administrative expense, exploration and evaluation costs, and reclamation cost accretion. The Company believes that this measure represents the total costs of producing gold from current operations, and provides the Company and other stakeholders of the company with additional information of the Company’s operational performance and ability to generate cash flows. As the measure seeks to reflect the full cost of gold production from current operations, new project capital is not included. Certain other cash expenditures, including tax payments, dividends and financing costs are also not included. The Company reports this measure on a gold ounces sold basis. The table below provides additional detail on the calculation of the Company’s all-in sustaining cash cost for the current periods.
Calculation of all-in sustaining cash costs 2014 2014
millions (except for gold ounces sold and all-in sustaining cash cost per ounce sold)
Third quarter
Year to date
Total cash cost – excluding Via Nova and Stratoni (per table above) $102.8 $317.5
Sustaining capital spending at operating gold mines 21.9 79.4
Exploration spending at operating gold mines 3.1 6.4
General and administrative expenses 11.4 44.1
All-in sustaining cash costs $139.2 $447.4
Gold ounces sold 189,321 570,570
All-in sustaining cash cost per ounce sold $735 $784
Cash flow from mining operations before changes in non-cash working capital We use cash flow from mining operations before changes in non-cash working capital to supplement our consolidated financial statements, and calculate it by not including the period to period movement of non-cash working capital items, like accounts receivable, advances and deposits, inventory, accounts payable and accrued liabilities. Adjusted net earnings The Company has included non-IFRS performance measures, adjusted net earnings and adjusted net earnings per share, throughout this document. Adjusted net earnings excludes gains/losses and other costs incurred for acquisitions and disposals of mining interests, impairment charges, unrealized and non-cash realized gains/losses of financial instruments and foreign exchange impacts on deferred income tax as well as significant non-cash, non-recurring items. The Company also excludes net earnings and losses of certain associates that the Company does not view as part of the core mining operations. The Company excludes these items from net earnings to provide a measure which allows the Company and investors to evaluate the results of the underlying core operations of the Company and its ability to generate cash flow. Accordingly, it is intended to provide additional information and should not be considered in isolation or as a substitute for measures of performance prepared in accordance with IFRS.
MANAGEMENT’S DISCUSSION AND ANALYSIS for the three and nine-month periods ended September 30, 2014
13
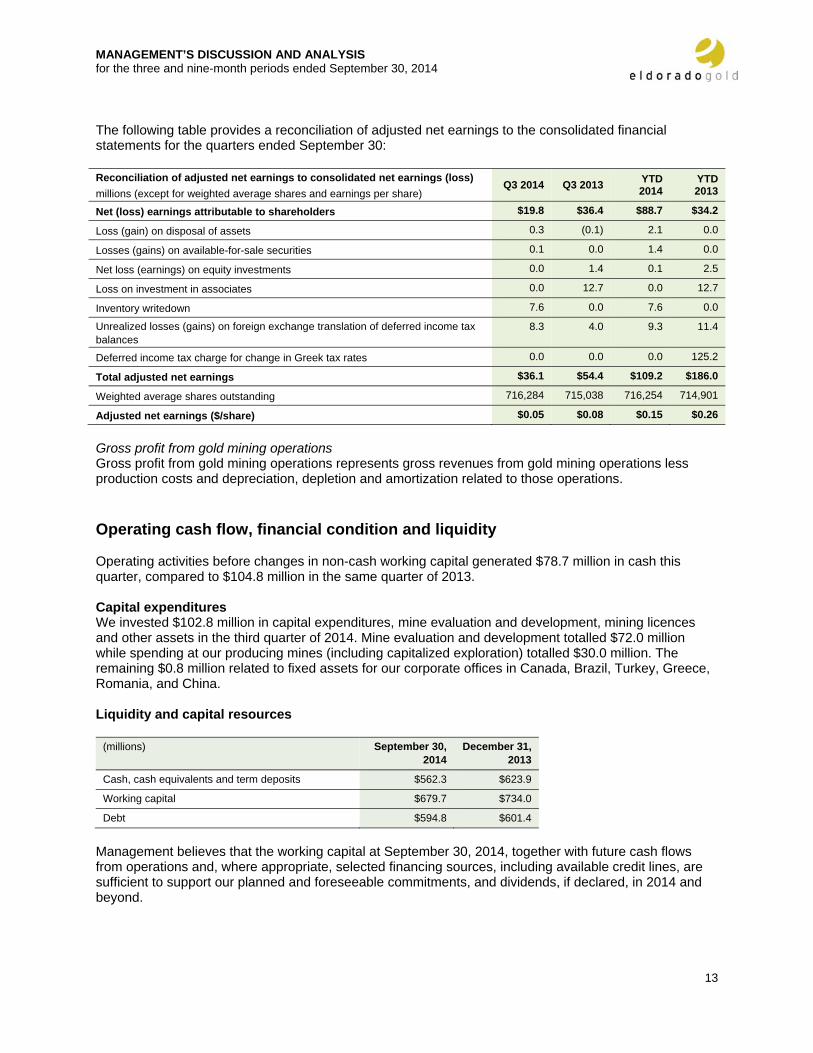
The following table provides a reconciliation of adjusted net earnings to the consolidated financial statements for the quarters ended September 30: Reconciliation of adjusted net earnings to consolidated net earnings (loss) millions (except for weighted average shares and earnings per share)
Q3 2014 Q3 2013 YTD 2014
YTD 2013
Net (loss) earnings attributable to shareholders $19.8 $36.4 $88.7 $34.2
Loss (gain) on disposal of assets 0.3 (0.1) 2.1 0.0
Losses (gains) on available-for-sale securities 0.1 0.0 1.4 0.0
Net loss (earnings) on equity investments 0.0 1.4 0.1 2.5
Loss on investment in associates 0.0 12.7 0.0 12.7
Inventory writedown 7.6 0.0 7.6 0.0
Unrealized losses (gains) on foreign exchange translation of deferred income tax balances
8.3 4.0 9.3 11.4
Deferred income tax charge for change in Greek tax rates 0.0 0.0 0.0 125.2
Total adjusted net earnings $36.1 $54.4 $109.2 $186.0
Weighted average shares outstanding 716,284 715,038 716,254 714,901
Adjusted net earnings ($/share) $0.05 $0.08 $0.15 $0.26
Gross profit from gold mining operations Gross profit from gold mining operations represents gross revenues from gold mining operations less production costs and depreciation, depletion and amortization related to those operations. Operating cash flow, financial condition and liquidity Operating activities before changes in non-cash working capital generated $78.7 million in cash this quarter, compared to $104.8 million in the same quarter of 2013. Capital expenditures We invested $102.8 million in capital expenditures, mine evaluation and development, mining licences and other assets in the third quarter of 2014. Mine evaluation and development totalled $72.0 million while spending at our producing mines (including capitalized exploration) totalled $30.0 million. The remaining $0.8 million related to fixed assets for our corporate offices in Canada, Brazil, Turkey, Greece, Romania, and China. Liquidity and capital resources
(millions) September 30, 2014
December 31, 2013
Cash, cash equivalents and term deposits $562.3 $623.9
Working capital $679.7 $734.0
Debt $594.8 $601.4
Management believes that the working capital at September 30, 2014, together with future cash flows from operations and, where appropriate, selected financing sources, including available credit lines, are sufficient to support our planned and foreseeable commitments, and dividends, if declared, in 2014 and beyond.
MANAGEMENT’S DISCUSSION AND ANALYSIS for the three and nine-month periods ended September 30, 2014
14
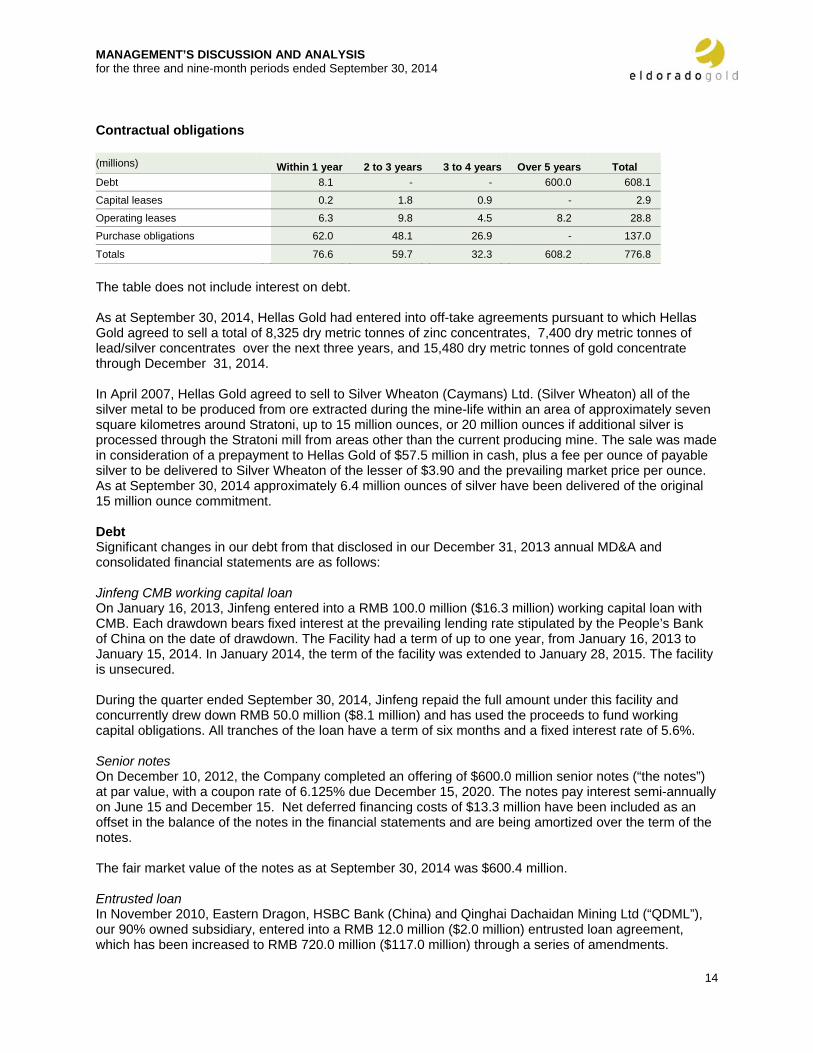
Contractual obligations (millions) Within 1 year 2 to 3 years 3 to 4 years Over 5 years Total Debt 8.1 - - 600.0 608.1
Capital leases 0.2 1.8 0.9 - 2.9
Operating leases 6.3 9.8 4.5 8.2 28.8
Purchase obligations 62.0 48.1 26.9 - 137.0
Totals 76.6 59.7 32.3 608.2 776.8
The table does not include interest on debt. As at September 30, 2014, Hellas Gold had entered into off-take agreements pursuant to which Hellas Gold agreed to sell a total of 8,325 dry metric tonnes of zinc concentrates, 7,400 dry metric tonnes of lead/silver concentrates over the next three years, and 15,480 dry metric tonnes of gold concentrate through December 31, 2014. In April 2007, Hellas Gold agreed to sell to Silver Wheaton (Caymans) Ltd. (Silver Wheaton) all of the silver metal to be produced from ore extracted during the mine-life within an area of approximately seven square kilometres around Stratoni, up to 15 million ounces, or 20 million ounces if additional silver is processed through the Stratoni mill from areas other than the current producing mine. The sale was made in consideration of a prepayment to Hellas Gold of $57.5 million in cash, plus a fee per ounce of payable silver to be delivered to Silver Wheaton of the lesser of $3.90 and the prevailing market price per ounce. As at September 30, 2014 approximately 6.4 million ounces of silver have been delivered of the original 15 million ounce commitment. Debt Significant changes in our debt from that disclosed in our December 31, 2013 annual MD&A and consolidated financial statements are as follows: Jinfeng CMB working capital loan On January 16, 2013, Jinfeng entered into a RMB 100.0 million ($16.3 million) working capital loan with CMB. Each drawdown bears fixed interest at the prevailing lending rate stipulated by the People’s Bank of China on the date of drawdown. The Facility had a term of up to one year, from January 16, 2013 to January 15, 2014. In January 2014, the term of the facility was extended to January 28, 2015. The facility is unsecured. During the quarter ended September 30, 2014, Jinfeng repaid the full amount under this facility and concurrently drew down RMB 50.0 million ($8.1 million) and has used the proceeds to fund working capital obligations. All tranches of the loan have a term of six months and a fixed interest rate of 5.6%. Senior notes On December 10, 2012, the Company completed an offering of $600.0 million senior notes (“the notes”) at par value, with a coupon rate of 6.125% due December 15, 2020. The notes pay interest semi-annually on June 15 and December 15. Net deferred financing costs of $13.3 million have been included as an offset in the balance of the notes in the financial statements and are being amortized over the term of the notes. The fair market value of the notes as at September 30, 2014 was $600.4 million. Entrusted loan In November 2010, Eastern Dragon, HSBC Bank (China) and Qinghai Dachaidan Mining Ltd (“QDML”), our 90% owned subsidiary, entered into a RMB 12.0 million ($2.0 million) entrusted loan agreement, which has been increased to RMB 720.0 million ($117.0 million) through a series of amendments.
MANAGEMENT’S DISCUSSION AND ANALYSIS for the three and nine-month periods ended September 30, 2014
15
Under the terms of the entrusted loan, QDML with its own funds entrusts HSBC Bank (China) to provide a loan facility in the name of QDML to Eastern Dragon. The loan can be drawn down in tranches. Each drawdown bears interest fixed at the prevailing lending rate stipulated by the People’s Bank of China on the date of drawdown. Each draw down has a term of three months and can be rolled forward at the discretion of QDML. The interest rate on this loan as at September 30, 2014 was 4.59%. As at September 30, 2014, RMB 647.1 million ($105.2 million) had been drawn under the entrusted loan. Subsequent to September 30, 2014, RMB 0.7 million ($0.1 million) was drawn under this loan. The entrusted loan has been recorded on a net settlement basis. Dividends On August 26, 2014 Eldorado paid $6.5 million in dividends to shareholders of record. Future dividend payments will be dependent on the Company having an aggregate of contributed surplus, accumulated other comprehensive income and retained earnings balance exceeding the dividend amount to be paid. Equity This quarter we received net proceeds of $0.4 million for issuing 60,914 common shares related to stock options and warrants being exercised.
Common shares outstanding - as of September 30, 2014 - as of October 30, 2014
716,309,524 716,309,524
Share purchase options
- as of October 30, 2014 (Weighted average exercise price per share: $11.70 Cdn)
21,212,461
Other information New accounting developments
The following interpretation of a standard has been adopted by the company commencing January 1, 2014:
• IFRIC 21 ‘Levies’ – This interpretation of IAS 37, ‘Provisions, Contingent Liabilities and Contingent Assets’, applies to the accounting for levies imposed by governments. IAS 37 sets out criteria for the recognition of a liability, one of which is the requirement for the entity to have a present obligation as a result of a past event (“obligating event”). IFRIC 21 clarifies that the obligating event that gives rise to a liability to pay a levy is the activity described in the relevant legislation that triggers the payment of the levy. There was no impact on these unaudited condensed consolidated interim financial statements as a result of the adoption of this standard.
The following standards have been published and are mandatory for Eldorado’s annual accounting periods no earlier than January 1, 2017:
• IFRS 9 ‘Financial Instruments’ – This standard was published in July 2014 and replaces the existing guidance in IAS 39, ‘Financial Instruments: Recognition and Measurement’. IFRS 9 includes revised guidance on the classification and measurement of financial instruments, including a new expected credit loss model for calculating impairment on financial assets, and the new general hedge accounting requirements. It also carries forward the guidance on recognition and derecognition of financial instruments from IAS 39. IFRS 9 is effective for annual reporting periods beginning on or after January 1, 2018, with early adoption permitted. The Company is currently evaluating the extent of the impact of the adoption of this standard.
MANAGEMENT’S DISCUSSION AND ANALYSIS for the three and nine-month periods ended September 30, 2014
16
• IFRS 15 ‘Revenue from Contracts with Customers’ – This standard contains a single model that applies to contracts with customers and two approaches to recognising revenue: at a point in time or over time. The model features a contract-based five-step analysis of transactions to determine whether, how much and when revenue is recognized. New estimates and judgmental thresholds have been introduced, which may affect the amount and/or timing of revenue recognized. This standard is effective for fiscal years ending on or after December 31, 2017. The Company does not expect this standard to have a material impact on its financial statements.
Internal controls over financial reporting Eldorado’s management is responsible for establishing and maintaining adequate internal control over financial reporting. Any system of internal control over financial reporting, no matter how well designed, has inherent limitations. As a result, even those systems determined to be effective can only provide reasonable assurance regarding the preparation and presentation of our financial statements. There have been no changes in our internal control over financial reporting in the third quarter of 2014 that have materially affected, or are reasonably likely to materially affect, internal control over financial reporting.
Qualified Person Except as otherwise noted, Norman Pitcher, P. Geo., our President, is the Qualified Person under NI 43-101 responsible for supervising the preparation of the scientific or technical information contained in this MD&A and verifying the technical data disclosed in this document relating to our operating mines and development projects. Forward-looking information and risks This MD&A includes statements and information about what we expect to happen in the future. When we discuss our strategy, plans and future financial and operating performance, or other things that have not yet happened in this review, we are making statements considered to be forward-looking information or forward-looking statements under Canadian and United States securities laws. We refer to them in this document as forward-looking information.
Key things to understand about the forward-looking information in this document:
• It typically includes words and phrases about the future, such as: plan, expect, forecast, intend, anticipate, believe, estimate, budget, scheduled, may, could, would, might, will, as well as the negative of these words and phrases.
• Although it represents our current views, which we consider to be reasonable, we can give no assurance that the forward-looking information will prove to be accurate.
• It is based on a number of assumptions, including things like the future price of gold, anticipated costs and spending, and our ability to achieve our goals.
• It is also subject to the risks associated with our business, including • the changing price of gold and currencies, • actual and estimated production and mineral reserves and resources, • the speculative nature of gold exploration, • risks associated with mining operations and development, • regulatory and permitting risks, • acquisition risks, and • other risks that are set out in our Annual Information Form.
• If our assumptions prove to be incorrect or the risks materialize, our actual results and events may vary materially from what we currently expect.
We recommend that you review our annual information form, which includes a more detailed discussion of material risks that could cause actual results to differ significantly from our current expectations.
Forward-looking information is designed to help you understand management’s current views of our near and longer term prospects, and it may not be appropriate for other purposes. We will not necessarily update this information unless we are required to by securities laws.